
SCATTER WORKSHOP, Brussels, June 8th PAAVO MOILANEN / STRAFICA LTD SCATTER Helsinki Model sprawl...
34
SCATTER WORKSHOP, Brussels, June 8th D G R e se a rc h PAAVO MOILANEN / STRAFICA LTD SCATTER Helsinki Model sprawl analysis Paavo Moilanen
-
Upload
ruth-johnson -
Category
Documents
-
view
222 -
download
3
Transcript of SCATTER WORKSHOP, Brussels, June 8th PAAVO MOILANEN / STRAFICA LTD SCATTER Helsinki Model sprawl...

SCATTER WORKSHOP, Brussels, June 8th D G R esearc hPAAVO MOILANEN / STRAFICA LTD
SCATTER Helsinki Model sprawl analysis
Paavo Moilanen

SCATTER WORKSHOP, Brussels, June 8th D G R esearc hPAAVO MOILANEN / STRAFICA LTD
Summary
• Methodology• Trends – both population and employment are
sprawling• Public transport policies make population to
deconcentrate and employment to concentrate• Road pricing measures invert this• Land use policies (pricing/regul.) can contribute • Packaging can thus be efficient

SCATTER WORKSHOP, Brussels, June 8th D G R esearc hPAAVO MOILANEN / STRAFICA LTD
Superzones in the analysis
• Rural• Urban outside the HMA
Helsinki Metropolitan area (HMA)• HMA suburbs• Outer Helsinki Metropolitan
Area• Inner Helsinki Metropolitan
Area• Helsinki centre

SCATTER WORKSHOP, Brussels, June 8th D G R esearc hPAAVO MOILANEN / STRAFICA LTD
Population and densities in the base forecast
Polpulation and employment:
0
50000
100000
150000
200000
250000
HelCentre
InnerHMA
OuterHMA
HMASuburbs
Oth Urban Rural
Hou
seho
lds
1990
1995
2000
2005
2010
2015
2020
0
50000
100000
150000
200000
250000
HelCentre
InnerHMA
OuterHMA
HMASuburbs
Oth Urban Rural
Em
ploy
ees
1990
1995
2000
2005
2010
2015
2020
-20%-10%
0%10%20%30%40%50%60%70%80%90%
100%
Hel Centre Inner HMA OuterHMA
HMASuburbs
Oth Urban Rural
Rel
. ch
ange
in H
ouse
hold
s/sq
-km
1990
1995
2000
2005
2010
2015
2020
-30%-20%-10%
0%10%20%30%40%50%60%70%80%90%
Hel Centre Inner HMA OuterHMA
HMASuburbs
Oth Urban Rural
Rel
. ch
ange
in E
mpl
oyee
s/sq
-km
1990
1995
2000
2005
2010
2015
2020
Relative densities vs 1990:
SCATTER WORKSHOP, Brussels, June 8th D G R esearc hPAAVO MOILANEN / STRAFICA LTD
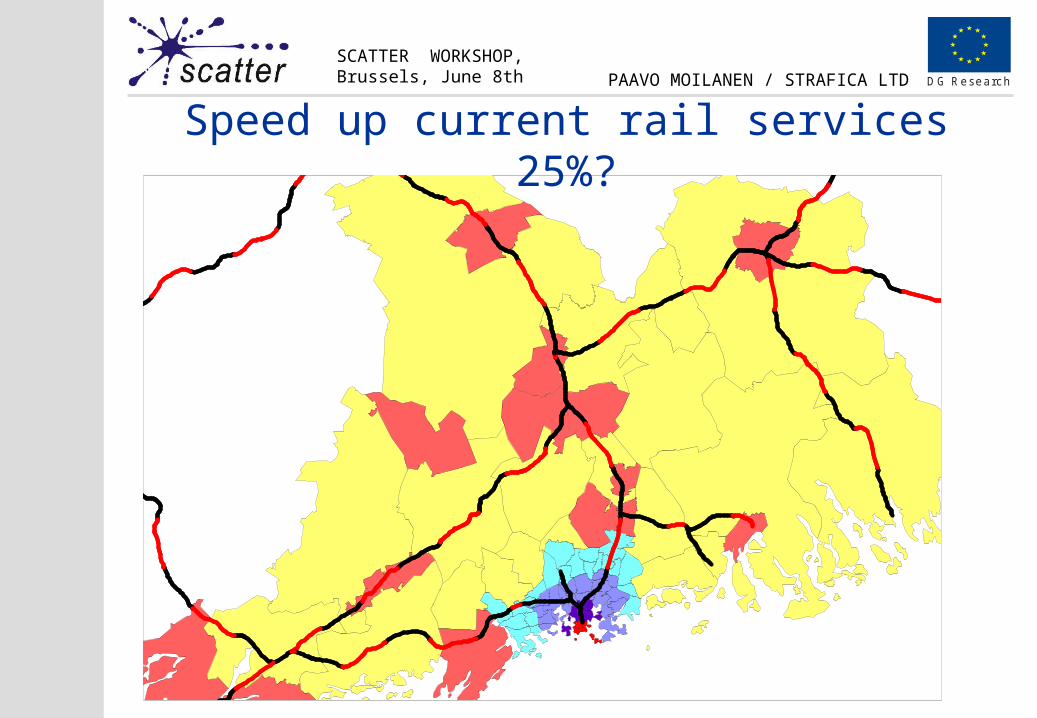
Speed up current rail services 25%?

SCATTER WORKSHOP, Brussels, June 8th D G R esearc hPAAVO MOILANEN / STRAFICA LTD
In general (big/radial) rail enhancement contribute to sprawl!
113 H – Decrease current rail travel times 30%
-5000
0
5000
10000
Hou
seho
lds
Diff2005
Diff2010
Diff2015
Diff2020
-10000
-5000
0
5000
Em
ploy
ees
Diff2005
Diff2010
Diff2015
Diff2020
-5.0%
0.0%
5.0%
Hou
seho
lds
% 2005
% 2010
% 2015
% 2020
-5.0%
0.0%
5.0%
Em
ploy
ees
% 2005
% 2010
% 2015
% 2020
SCATTER WORKSHOP, Brussels, June 8th D G R esearc hPAAVO MOILANEN / STRAFICA LTD
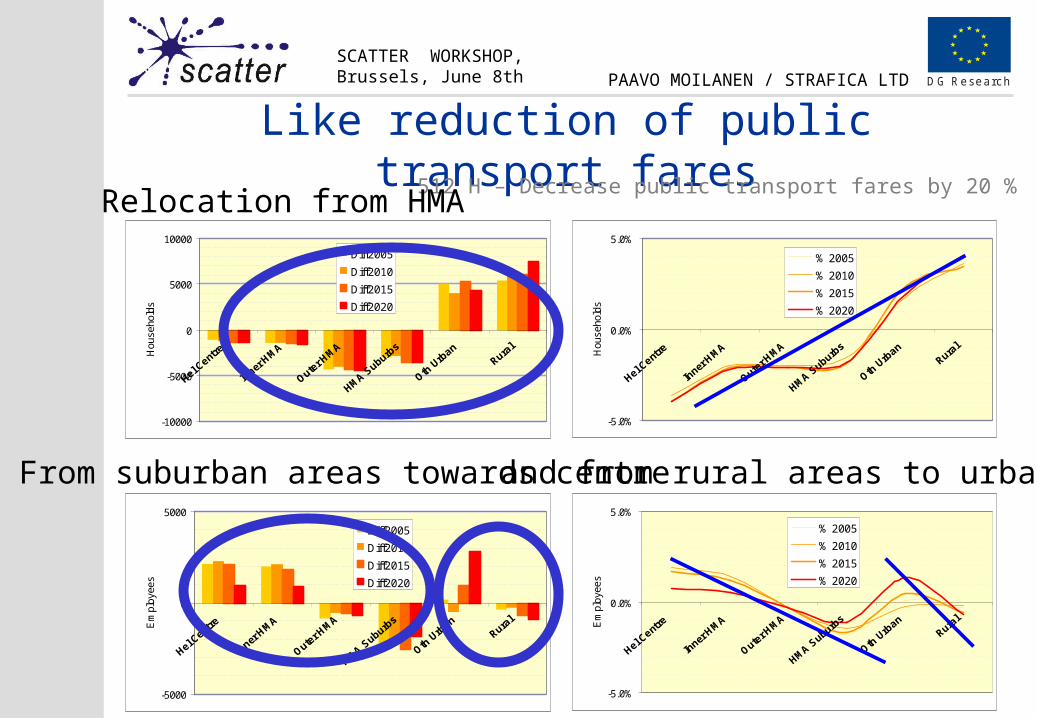
Like reduction of public transport fares512 H – Decrease public transport fares by 20 %
-10000
-5000
0
5000
10000
Hel Cent
re
Inner
HMA
Outer H
MA
HMA Suburb
s
Oth U
rban
Rural
Hou
seho
lds
Diff2005
Diff2010
Diff2015
Diff2020
-5000
0
5000
Hel Cent
re
Inner
HMA
Outer H
MA
HMA Suburb
s
Oth U
rban
Rural
Em
ploy
ees
Diff2005
Diff2010
Diff2015
Diff2020
-5.0%
0.0%
5.0%
Hel Cent
re
Inner
HMA
Outer H
MA
HMA Suburb
s
Oth U
rban
Rural
Hou
seho
lds
% 2005
% 2010
% 2015
% 2020
-5.0%
0.0%
5.0%
Hel Cent
re
Inner
HMA
Outer H
MA
HMA S
uburbs
Oth U
rban
Rural
Em
ploy
ees
% 2005
% 2010
% 2015
% 2020
Relocation from HMA
From suburban areas towards centre and from rural areas to urban

SCATTER WORKSHOP, Brussels, June 8th D G R esearc hPAAVO MOILANEN / STRAFICA LTD
Planned Metropolitan Area Rail Investments…

SCATTER WORKSHOP, Brussels, June 8th D G R esearc hPAAVO MOILANEN / STRAFICA LTD
do not however seem to contribute to sprawl
-5000
0
5000
Hel Cent
re
Inner
HM
A
Outer H
MA
HMA S
uburbs
Oth U
rban
Rural
Hou
seho
lds
Diff2005
Diff2010
Diff2015
Diff2020
-5000
0
5000
Hel Cent
re
Inner
HM
A
Outer H
MA
HMA S
uburbs
Oth U
rban
Rural
Em
ploy
ees
Diff2005
Diff2010
Diff2015
Diff2020
-5.0%
0.0%
5.0%
Hel Cent
re
Inner
HM
A
Outer H
MA
HMA S
uburbs
Oth U
rban
Rural
Hou
seho
lds
% 2005
% 2010
% 2015
% 2020
-5.0%
0.0%
5.0%
Hel Cent
re
Inner
HM
A
Outer H
MA
HMA S
uburbs
Oth U
rban
Rural
Em
ploy
ees
% 2005
% 2010
% 2015
% 2020
112 H – HMA plan-public transport rail investments, compare with do-nothing :

SCATTER WORKSHOP, Brussels, June 8th D G R esearc hPAAVO MOILANEN / STRAFICA LTD
Road pricing is efficient reducing (population) sprawl
411 H – Car operating costs +50%
-10000
-5000
0
5000
Hel Cent
re
Inner
HMA
Outer H
MA
HMA Suburb
s
Oth U
rban
Rural
Hou
seho
lds
Diff2005
Diff2010
Diff2015
Diff2020
-5000
0
5000
Hel Cent
re
Inner
HMA
Outer H
MA
HMA Suburb
s
Oth U
rban
Rural
Em
ploy
ees
Diff2005
Diff2010
Diff2015
Diff2020
-5.0%
0.0%
5.0%
Hel Cent
re
Inner
HMA
Outer H
MA
HMA Suburb
s
Oth U
rban
Rural
Hou
seho
lds
% 2005
% 2010
% 2015
% 2020
-5.0%
0.0%
5.0%
Hel Cent
re
Inner
HMA
Outer H
MA
HMA S
uburbs
Oth U
rban
Rural
Em
ploy
ees
% 2005
% 2010
% 2015
% 2020
Relocation to HMA

SCATTER WORKSHOP, Brussels, June 8th D G R esearc hPAAVO MOILANEN / STRAFICA LTD
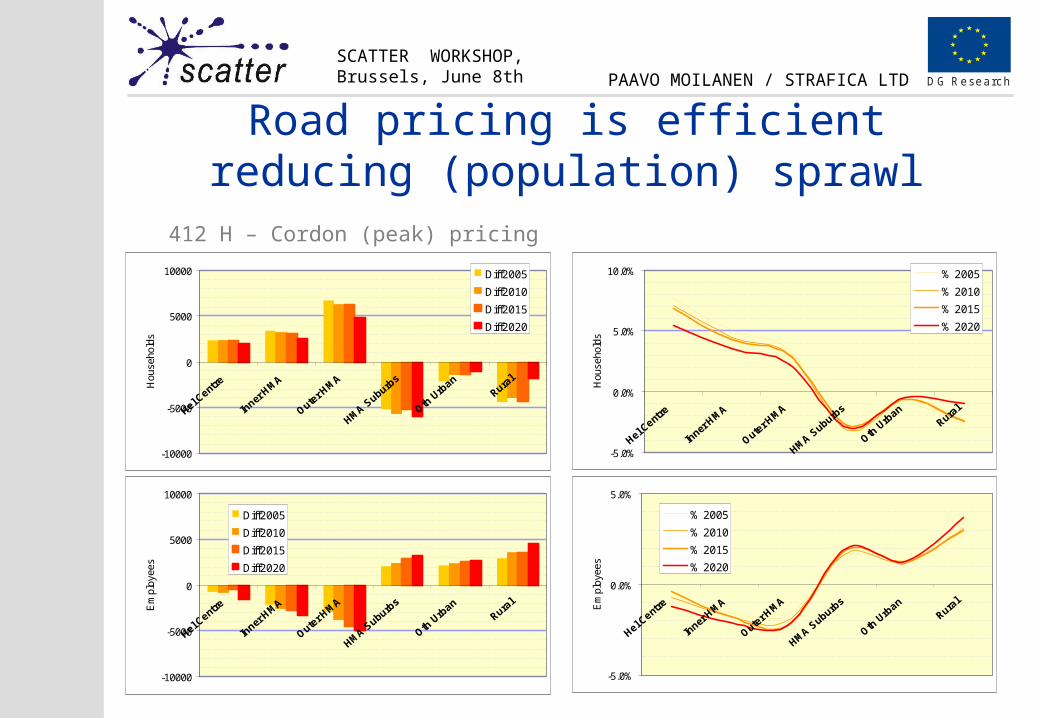
Marginal cost-based pricing412 H – Cordon (peak) pricing
Radial Cordons 1.25 €/passage
Orbital Cordons 2.5 €/passage
SCATTER WORKSHOP, Brussels, June 8th D G R esearc hPAAVO MOILANEN / STRAFICA LTD
Road pricing is efficient reducing (population) sprawl
412 H – Cordon (peak) pricing
-10000
-5000
0
5000
10000
Hel Cent
re
Inner
HMA
Outer H
MA
HMA Suburb
s
Oth U
rban
Rural
Hou
seho
lds
Diff2005
Diff2010
Diff2015
Diff2020
-10000
-5000
0
5000
10000
Hel Cent
re
Inner
HMA
Outer H
MA
HMA Suburb
s
Oth U
rban
Rural
Em
ploy
ees
Diff2005
Diff2010
Diff2015
Diff2020
-5.0%
0.0%
5.0%
10.0%
Hel Cent
re
Inner
HMA
Outer H
MA
HMA Suburb
s
Oth U
rban
Rural
Hou
seho
lds
% 2005
% 2010
% 2015
% 2020
-5.0%
0.0%
5.0%
Hel Cent
re
Inner
HMA
Outer H
MA
HMA S
uburbs
Oth U
rban
Rural
Em
ploy
ees
% 2005
% 2010
% 2015
% 2020

SCATTER WORKSHOP, Brussels, June 8th D G R esearc hPAAVO MOILANEN / STRAFICA LTD
Land use measures
A-type land-use zones

SCATTER WORKSHOP, Brussels, June 8th D G R esearc hPAAVO MOILANEN / STRAFICA LTD
Pricing land-use seems (also) very efficient
311 H – Annual tax (development impact fee) in non urban zones + fiscal incentive (tax reduction) in urban zones
-10000
-5000
0
5000
Hel Cent
re
Inner
HM
A
Outer H
MA
HMA S
uburbs
Oth U
rban
Rural
Hou
seho
lds
Diff2005
Diff2010
Diff2015
Diff2020
-5000
0
5000
Hel Cent
re
Inner
HM
A
Outer H
MA
HMA S
uburbs
Oth U
rban
Rural
Em
ploy
ees
Diff2005
Diff2010
Diff2015
Diff2020
-5.0%
0.0%
5.0%
Hel Cent
re
Inner
HM
A
Outer H
MA
HMA S
uburbs
Oth U
rban
Rural
Hou
seho
lds
% 2005
% 2010
% 2015
% 2020
-5.0%
0.0%
5.0%
Hel Cent
re
Inner
HM
A
Outer H
MA
HMA S
uburbs
Oth U
rban
Rural
Em
ploy
ees
% 2005
% 2010
% 2015
% 2020

SCATTER WORKSHOP, Brussels, June 8th D G R esearc hPAAVO MOILANEN / STRAFICA LTD
But not always? 331 H – ABC-type land use pricing policy applied to private services
-5000
0
5000
Hou
seho
lds
Diff2005
Diff2010
Diff2015
Diff2020
-5000
0
5000
Em
ploy
ees
Diff2005
Diff2010
Diff2015
Diff2020
-5.0%
0.0%
5.0%
Hou
seho
lds
% 2005
% 2010
% 2015
% 2020
-5.0%
0.0%
5.0%
Em
ploy
ees
% 2005
% 2010
% 2015
% 2020

SCATTER WORKSHOP, Brussels, June 8th D G R esearc hPAAVO MOILANEN / STRAFICA LTD
Policy package 3 – we can get both households and employment contained
813 H = 411 (VOC+50%) + 512 (fares –20%) + 311 (dev.fee) + 331 (LU pricing)
-10000
-5000
0
5000
10000
Hou
seho
lds
Diff2005
Diff2010
Diff2015
Diff2020
-10000
-5000
0
5000
10000
Em
ploy
ees
Diff2005
Diff2010
Diff2015
Diff2020
-5.0%
0.0%
5.0%
Hou
seho
lds
% 2005
% 2010
% 2015
% 2020
-5.0%
0.0%
5.0%
Em
ploy
ees
% 2005
% 2010
% 2015
% 2020

SCATTER WORKSHOP, Brussels, June 8th D G R esearc hPAAVO MOILANEN / STRAFICA LTD
The effect of package 3 is still small compared to the base trend
813 H = Policy Package 3 vs. base
-5.0%
0.0%
5.0%
Hou
seho
lds
% 2005
% 2010
% 2015
% 2020
-5.0%
0.0%
5.0%
Em
ploy
ees
% 2005
% 2010
% 2015
% 2020
0.0%
5.0%
10.0%
15.0%
20.0%
25.0%
30.0%
35.0%
40.0%
Hel Centre Inner HMA OuterHMA
HMASuburbs
Oth Urban Rural
Em
ploy
ees
% 2005
% 2010
% 2015
% 2020
0.0%
5.0%
10.0%
15.0%
20.0%
25.0%
30.0%
Hel Centre Inner HMA OuterHMA
HMASuburbs
Oth Urban Rural
Hou
seho
lds
% 2005
% 2010
% 2015
% 2020
Sprawl from 2000 in the base
SCATTER WORKSHOP, Brussels, June 8th D G R esearc hPAAVO MOILANEN / STRAFICA LTD
Conclusions
• There are measures that increase sprawl and can reduce it – these are just examples
• Packaging is needed to increase the good effects and even out side-effects of single policies
• The effects of policies are usually small in the end as there are big background ”basetrends” in operation

SCATTER WORKSHOP, Brussels, June 8th D G R esearc hPAAVO MOILANEN / STRAFICA LTD
Removal of basetrend 1: Transport prices
0
20
40
60
80
100
120
140
160
180
200
1985 1990 1995 2000 2005 2010 2015 2020 2025
Person cars
Freight
Public transport
-10.0%
-5.0%
0.0%
5.0%
10.0%
Hou
seho
lds
% 2005
% 2010
% 2015
% 2020
-10.0%
-5.0%
0.0%
5.0%
10.0%
Em
ploy
ees
% 2005
% 2010
% 2015
% 2020

SCATTER WORKSHOP, Brussels, June 8th D G R esearc hPAAVO MOILANEN / STRAFICA LTD
Removal of basetrend 2: Land use plans
0%
50%
100%
Em
p flo
orsp
ace
utilis
atio
n %
HCU%2005
HCU%2010
HCU%2015
HCU%2020
0%
50%
100%
Hou
sing
pla
n ut
ilisat
ion
%
HCU%2005
HCU%2010
HCU%2015
HCU%2020
-5.0%
0.0%
5.0%
Hou
seho
lds
% 2005
% 2010
% 2015
% 2020
-5.0%
0.0%
5.0%
10.0%
Em
ploy
ees
% 2005
% 2010
% 2015
% 2020
SCATTER WORKSHOP, Brussels, June 8th D G R esearc hPAAVO MOILANEN / STRAFICA LTD
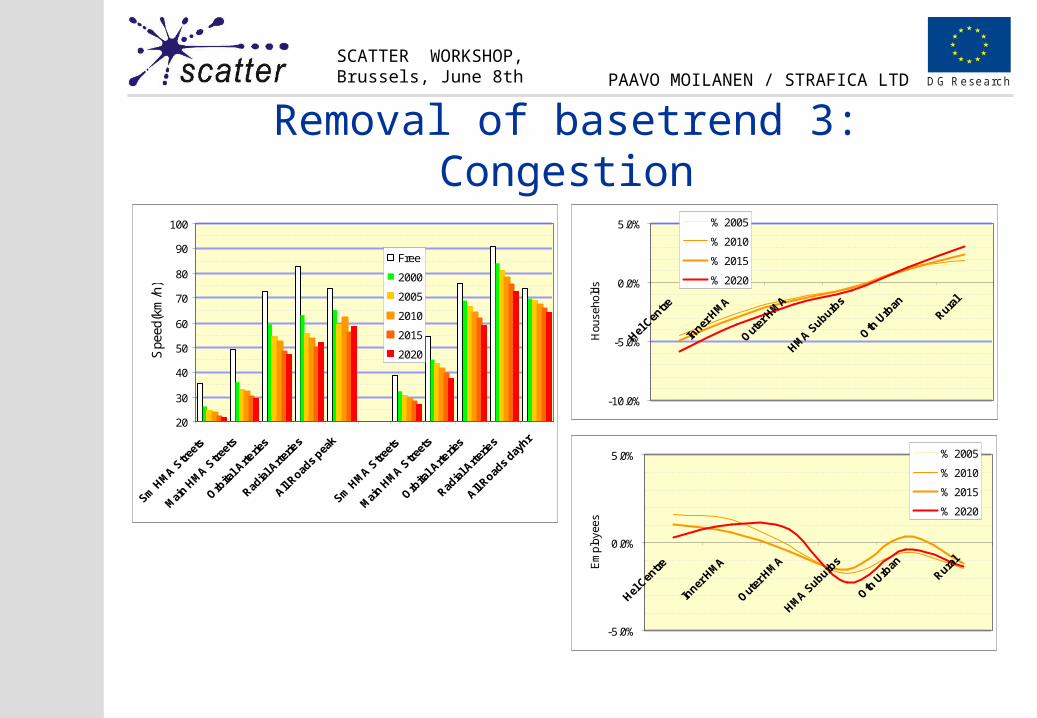
Removal of basetrend 3: Congestion
20
30
40
50
60
70
80
90
100
Spe
ed(k
m/h
)
Free
2000
2005
2010
2015
2020
-10.0%
-5.0%
0.0%
5.0%
Hou
seho
lds
% 2005
% 2010
% 2015
% 2020
-5.0%
0.0%
5.0%
Em
ploy
ees
% 2005
% 2010
% 2015
% 2020

SCATTER WORKSHOP, Brussels, June 8th D G R esearc hPAAVO MOILANEN / STRAFICA LTD
Combined effect of removing all base trends
-20000
-15000
-10000
-5000
0
5000
10000
15000
Em
ploy
ees
Diff2005
Diff2010
Diff2015
Diff2020
-10.0%
-5.0%
0.0%
5.0%
10.0%
Em
ploy
ees
% 2005
% 2010
% 2015
% 2020
-15.0%
-10.0%
-5.0%
0.0%
5.0%
10.0%
15.0%
Hel C
entre
Inner
HM
A
Out
er H
MA
HMA S
uburbs
Oth
Urb
anRura
l
Hou
seho
lds
% 2005
% 2010
% 2015
% 2020
-15000
-10000
-5000
0
5000
10000
15000
20000
Hel C
entre
Inner
HM
A
Out
er H
MA
HMA S
uburbs
Oth
Urb
anRura
lHou
seho
lds
Diff2005
Diff2010
Diff2015
Diff2020
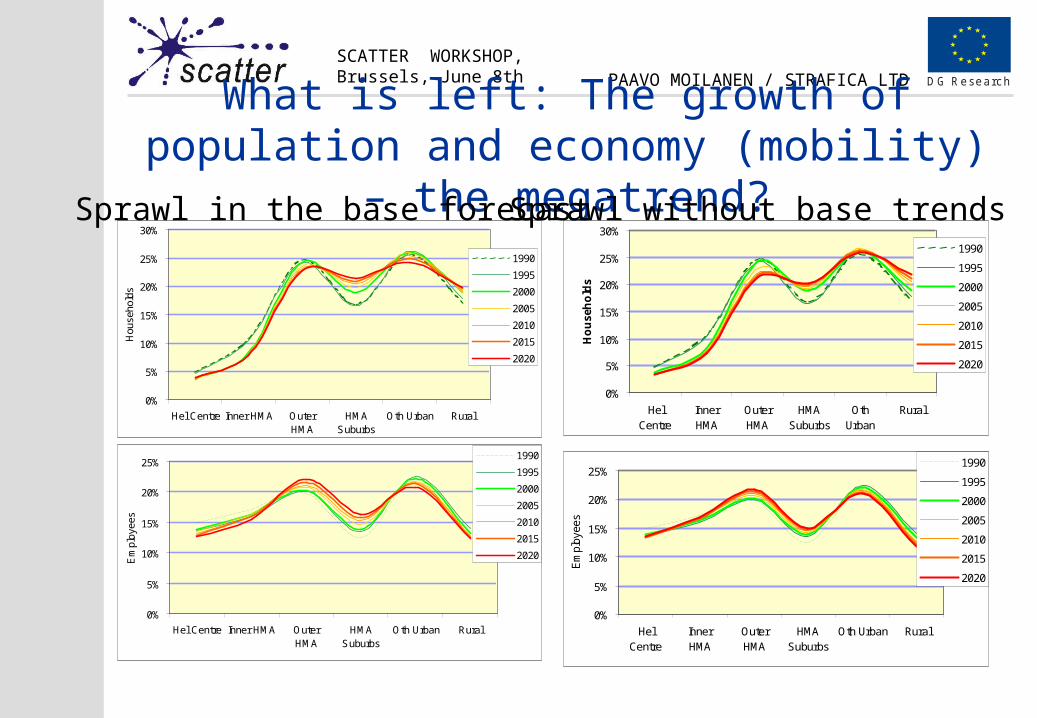
SCATTER WORKSHOP, Brussels, June 8th D G R esearc hPAAVO MOILANEN / STRAFICA LTDWhat is left: The growth of population
and economy (mobility) – the megatrend?
0%
5%
10%
15%
20%
25%
HelCentre
InnerHMA
OuterHMA
HMASuburbs
Oth Urban Rural
Em
ploy
ees
1990
1995
2000
2005
2010
2015
2020
0%
5%
10%
15%
20%
25%
30%
HelCentre
InnerHMA
OuterHMA
HMASuburbs
OthUrban
Rural
Ho
use
ho
lds
1990
1995
2000
2005
2010
2015
2020
0%
5%
10%
15%
20%
25%
30%
Hel Centre Inner HMA OuterHMA
HMASuburbs
Oth Urban Rural
Hou
seho
lds
1990
1995
2000
2005
2010
2015
2020
0%
5%
10%
15%
20%
25%
Hel Centre Inner HMA OuterHMA
HMASuburbs
Oth Urban Rural
Em
ploy
ees
1990
1995
2000
2005
2010
2015
2020
Sprawl in the base forecast Sprawl without base trends

SCATTER WORKSHOP, Brussels, June 8th D G R esearc hPAAVO MOILANEN / STRAFICA LTD
Conclusions II
• The combined effects of various base trends create a ”straightjacket” to policies
• What matters in the end is the growth in population and economy (leading to increased mobility and standard of living) that requires ever more space
SCATTER WORKSHOP, Brussels, June 8th D G R esearc hPAAVO MOILANEN / STRAFICA LTD
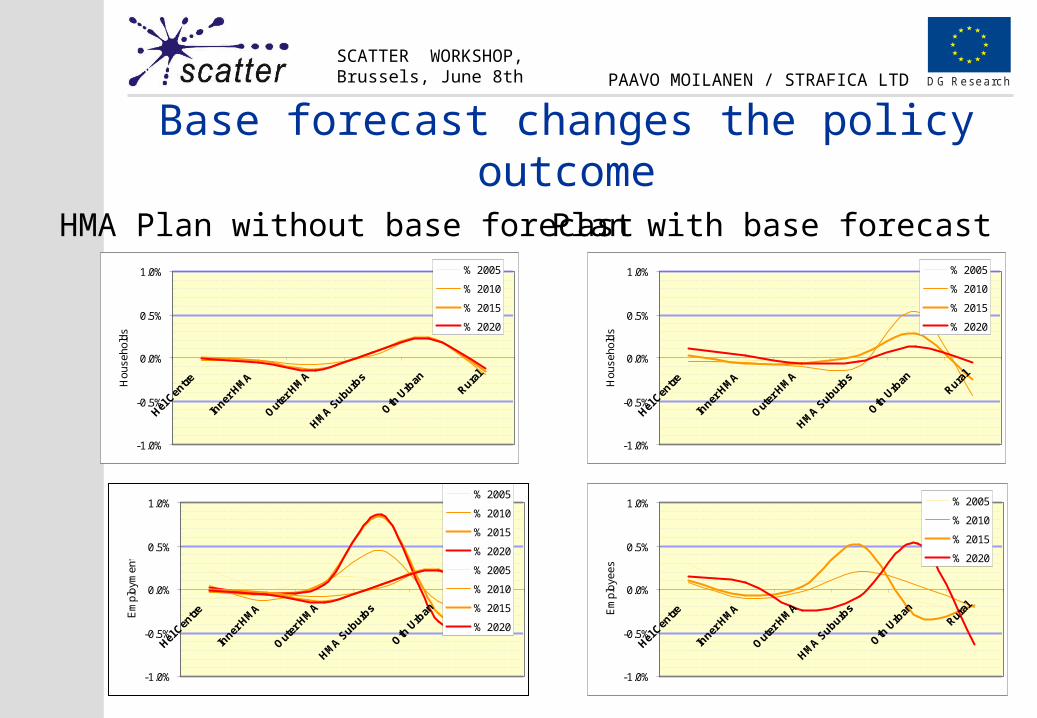
Base forecast changes the policy outcome
-1.0%
-0.5%
0.0%
0.5%
1.0%
Hel C
entre
Inner
HM
A
Out
er H
MA
HMA S
uburbs
Oth
Urb
anRura
lE
mpl
oyee
s
% 2005
% 2010
% 2015
% 2020
-1.0%
-0.5%
0.0%
0.5%
1.0%
Hel C
entre
Inner
HM
A
Out
er H
MA
HMA S
uburbs
Oth
Urb
anRura
l
Hou
seho
lds
% 2005
% 2010
% 2015
% 2020
-1.0%
-0.5%
0.0%
0.5%
1.0%
Hel C
entre
Inner
HM
A
Out
er H
MA
HMA S
uburbs
Oth
Urb
anRura
l
Hou
seho
lds
% 2005
% 2010
% 2015
% 2020
-1.0%
-0.5%
0.0%
0.5%
1.0%
Hel C
entre
Inner
HM
A
Out
er H
MA
HMA S
uburbs
Oth
Urb
anRura
l
Em
ploy
men
t
% 2005
% 2010
% 2015
% 2020
% 2005
% 2010
% 2015
% 2020
HMA Plan without base forecast Plan with base forecast

SCATTER WORKSHOP, Brussels, June 8th D G R esearc hPAAVO MOILANEN / STRAFICA LTD
Other tests

SCATTER WORKSHOP, Brussels, June 8th D G R esearc hPAAVO MOILANEN / STRAFICA LTD
Population and densities in the base forecast
0
500
1000
1500
2000
2500
3000
3500
4000
Hel Centre Inner HMA OuterHMA
HMASuburbs
Oth Urban Rural
Hou
seho
lds
/ sq
-km
1990
1995
2000
2005
2010
2015
2020
0
5000
10000
15000
HelCentre
InnerHMA
OuterHMA
HMASuburbs
Oth Urban Rural
Em
ploy
ees/
sq-k
m
1990
1995
2000
2005
2010
2015
2020
Polpulation and employment: Densities:
0
50000
100000
150000
200000
250000
HelCentre
InnerHMA
OuterHMA
HMASuburbs
Oth Urban Rural
Hou
seho
lds
1990
1995
2000
2005
2010
2015
2020
0
50000
100000
150000
200000
250000
HelCentre
InnerHMA
OuterHMA
HMASuburbs
Oth Urban Rural
Em
ploy
ees
1990
1995
2000
2005
2010
2015
2020
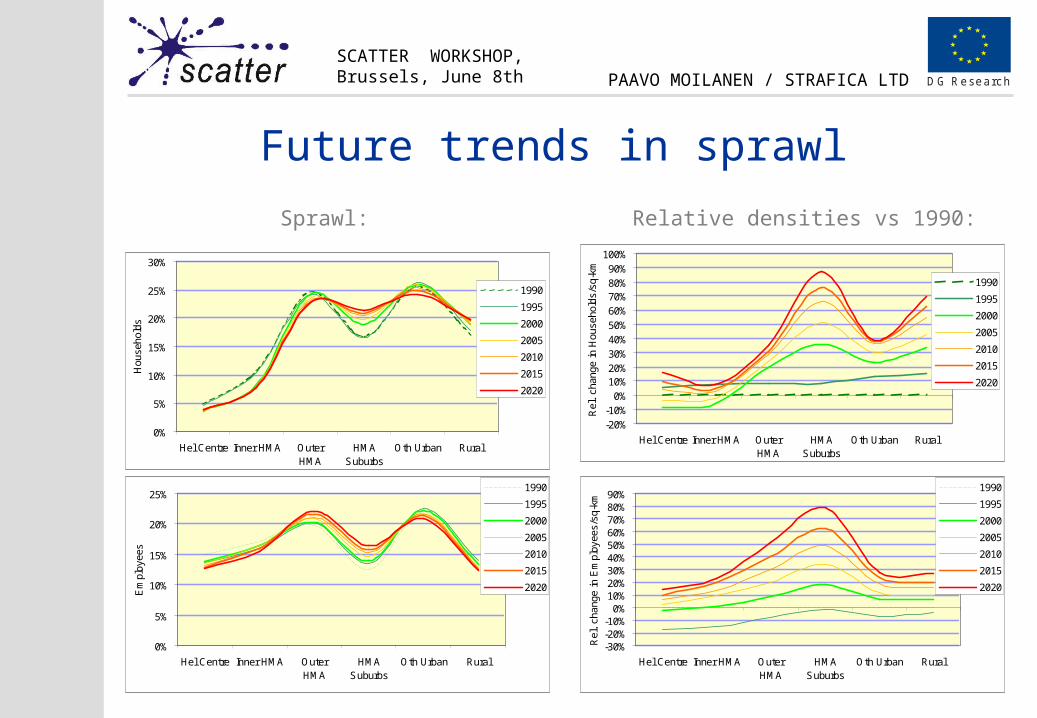
SCATTER WORKSHOP, Brussels, June 8th D G R esearc hPAAVO MOILANEN / STRAFICA LTD
Future trends in sprawl
0%
5%
10%
15%
20%
25%
30%
Hel Centre Inner HMA OuterHMA
HMASuburbs
Oth Urban Rural
Hou
seho
lds
1990
1995
2000
2005
2010
2015
2020
0%
5%
10%
15%
20%
25%
Hel Centre Inner HMA OuterHMA
HMASuburbs
Oth Urban Rural
Em
ploy
ees
1990
1995
2000
2005
2010
2015
2020
Sprawl:
-20%-10%
0%10%20%30%40%50%60%70%80%90%
100%
Hel Centre Inner HMA OuterHMA
HMASuburbs
Oth Urban Rural
Rel
. ch
ange
in H
ouse
hold
s/sq
-km
1990
1995
2000
2005
2010
2015
2020
-30%-20%-10%
0%10%20%30%40%50%60%70%80%90%
Hel Centre Inner HMA OuterHMA
HMASuburbs
Oth Urban Rural
Rel
. ch
ange
in E
mpl
oyee
s/sq
-km
1990
1995
2000
2005
2010
2015
2020
Relative densities vs 1990:

SCATTER WORKSHOP, Brussels, June 8th D G R esearc hPAAVO MOILANEN / STRAFICA LTD
Other investment tests
• Effect of Road inv. plan in HMA was small
• Effect of PLJ plan overall in HMA was small
• Effect of orbital investments in HMA was small

SCATTER WORKSHOP, Brussels, June 8th D G R esearc hPAAVO MOILANEN / STRAFICA LTD
Regulation OK (but how done in practise?)
321 H – ABC-type land use regulation policy applied to private services
-5000
0
5000
Hel Cent
re
Inner
HMA
Outer H
MA
HMA Suburb
s
Oth U
rban
Rural
Hou
seho
lds
Diff2005
Diff2010
Diff2015
Diff2020
-10000
-5000
0
5000
10000
Hel Cent
re
Inner
HMA
Outer H
MA
HMA Suburb
s
Oth U
rban
Rural
Em
ploy
ees
Diff2005
Diff2010
Diff2015
Diff2020
-5.0%
0.0%
5.0%
Hel Cent
re
Inner
HMA
Outer H
MA
HMA Suburb
s
Oth U
rban
Rural
Hou
seho
lds
% 2005
% 2010
% 2015
% 2020
-5.0%
0.0%
5.0%
10.0%
Hel Cent
re
Inner
HMA
Outer H
MA
HMA S
uburbs
Oth U
rban
Rural
Em
ploy
ees
% 2005
% 2010
% 2015
% 2020

SCATTER WORKSHOP, Brussels, June 8th D G R esearc hPAAVO MOILANEN / STRAFICA LTD
A new employment centre?

SCATTER WORKSHOP, Brussels, June 8th D G R esearc hPAAVO MOILANEN / STRAFICA LTD
A new employment centre in the HMA?
211 H – New Centre in East (Vuosaari)
-5000
0
5000
Hel Cent
re
Inner
HM
A
Outer H
MA
HMA S
uburbs
Oth U
rban
Rural
Hou
seho
lds
Diff2005
Diff2010
Diff2015
Diff2020
-15000
-10000
-5000
0
5000
10000
15000
20000
25000
30000
Hel Cent
re
Inner
HM
A
Outer H
MA
HMA S
uburbs
Oth U
rban
Rural
Em
ploy
ees
Diff2005
Diff2010
Diff2015
Diff2020
-5.0%
0.0%
5.0%
Hel Cent
re
Inner
HM
A
Outer H
MA
HMA S
uburbs
Oth U
rban
Rural
Hou
seho
lds
% 2005
% 2010
% 2015
% 2020
-10.0%
-5.0%
0.0%
5.0%
10.0%
15.0%
20.0%
Hel Cent
re
Inner
HM
A
Outer H
MA
HMA S
uburbs
Oth U
rban
Rural
Em
ploy
ees
% 2005
% 2010
% 2015
% 2020

SCATTER WORKSHOP, Brussels, June 8th D G R esearc hPAAVO MOILANEN / STRAFICA LTD
Policy package 1
811 H = 411 (VOC+50%) + 512 (fares –20%) + 311 (dev.fee)
-10000
-5000
0
5000
10000
Hou
seho
lds
Diff2005
Diff2010
Diff2015
Diff2020
-5000
0
5000
Em
ploy
ees
Diff2005
Diff2010
Diff2015
Diff2020
-5.0%
0.0%
5.0%
Hou
seho
lds
% 2005
% 2010
% 2015
% 2020
-5.0%
0.0%
5.0%
Em
ploy
ees
% 2005
% 2010
% 2015
% 2020

SCATTER WORKSHOP, Brussels, June 8th D G R esearc hPAAVO MOILANEN / STRAFICA LTD
Policy package 2
812 H = 411 (VOC+50%) + 512 (fares –20%) + 331 (LU pricing)
-5000
0
5000
10000
Hou
seho
lds
Diff2005
Diff2010
Diff2015
Diff2020
-5000
0
5000
Em
ploy
ees
Diff2005
Diff2010
Diff2015
Diff2020
-5.0%
0.0%
5.0%
Hou
seho
lds
% 2005
% 2010
% 2015
% 2020
-5.0%
0.0%
5.0%
Em
ploy
ees
% 2005
% 2010
% 2015
% 2020