SCALE UP OF PANEL PHOTOBIOREACTORS FOR HYDROGEN … · A THESIS SUBMITTED TO . THE GRADUATE SCHOOL...
244
SCALE UP OF PANEL PHOTOBIOREACTORS FOR HYDROGEN PRODUCTION BY PNS BACTERIA A THESIS SUBMITTED TO THE GRADUATE SCHOOL OF NATURAL AND APPLIED SCIENCES OF MIDDLE EAST TECHNICAL UNIVERSITY BY SEVLER GÖKÇE AVCIOĞLU IN PARTIAL FULFILLMENT OF THE REQUIREMENTS FOR THE DEGREE OF MASTER OF SCIENCE IN CHEMICAL ENGINEERING SEPTEMBER 2010
Transcript of SCALE UP OF PANEL PHOTOBIOREACTORS FOR HYDROGEN … · A THESIS SUBMITTED TO . THE GRADUATE SCHOOL...
SCALE UP OF PANEL PHOTOBIOREACTORS FOR HYDROGEN
PRODUCTION BY PNS BACTERIA
A THESIS SUBMITTED TO
THE GRADUATE SCHOOL OF NATURAL AND APPLIED SCIENCES
OF
MIDDLE EAST TECHNICAL UNIVERSITY
BY
SEVLER GÖKÇE AVCIOĞLU
IN PARTIAL FULFILLMENT OF THE REQUIREMENTS
FOR
THE DEGREE OF MASTER OF SCIENCE
IN
CHEMICAL ENGINEERING
SEPTEMBER 2010

Approval of the thesis:
SCALE UP OF PANEL PHOTOBIOREACTORS FOR HYDROGEN
PRODUCTION BY PNS BACTERIA
submitted by S. GÖKÇE AVCIOĞLU in partial fulfillment of the requirements for
the degree of Master of Science in Chemical Engineering Department, Middle
East Technical University by,
Prof. Dr. Canan Özgen __________________
Dean, Graduate School of Natural and Applied Sciences
Prof. Dr. Gürkan Karakaş __________________
Head of Department, Chemical Engineering
Prof. Dr. İnci Eroğlu __________________
Supervisor, Chemical Engineering Department, METU
Dr. Ebru Özgür __________________
Co-supervisor, Hydrogen Research Laboratory, METU
Examining Committee Members:
Prof. Dr. Göknur Bayram __________________
Chemical Engineering Department, METU
Prof. Dr. İnci Eroğlu __________________
Chemical Engineering Department, METU
Doç. Dr. Bülent Akay __________________
Chemical Engineering Department, AU
Dr. Ebru Özgür __________________
Hydrogen Research Laboratory, METU
Dr. Başar Uyar __________________
Chemical Engineering Department, KU
Date: 07.09.2010

iii
I hereby declare that all information in this document has been obtained
and presented in accordance with academic rules and ethical conduct. I also
declare that, as required by these rules and conduct, I have fully cited and
referenced all material and results that are not original to this wok.
Name, Last name: S. Gökçe Avcıoğlu
Signature: _________________
iv
ABSTRACT
SCALE UP OF PANEL PHOTOBIOREACTORS FOR HYDROGEN
PRODUCTION BY PNS BACTERIA
Avcıoğlu, S. Gökçe
M. Sc., Department of Chemical Engineering
Supervisor: Prof. Dr. İnci Eroğlu
Co-Supervisor: Dr. Ebru Özgür
September 2010, 209 pages
Production of hydrogen from biomass through the use of dark and
photofermentative bacteria will be applicable in the future and a promising route.
The aim of this study is to develop and to scale-up solar panel photobioreactors for
the biological hydrogen production by photosynthetic purple non sulfur (PNS)
bacteria on artificial substrates and on real dark fermentation effluent of molasses.
The parameters studied are light intensity, temperature, feed stock, feed rate, pH, cell
density, light and dark cycle and carbon to nitrogen ratio on hydrogen production.
Continuous hydrogen production has been achieved on artificial medium and dark
fermentor effluent of molasses containing acetate and lactate by Rhodobacter
capsulatus wild type and (hup-) mutant strains in panel photobioreactors in indoor
and outdoor conditions by fed batch operation. Laboratory (from 4 to 8 liters) and
large scale (20 L) panel photobioreactors by using various designs and construction
materials were developed. In this photobioreactors continuous hydrogen production
was achieved by feeding. Na2CO3 can be used as buffer to keep the pH stable during

v
long term operation on molasses dark fermentor effluent. The adjustment of the
feedstock by dilution and buffer addition were found to be essential for the long term
stability of pH, biomass and H2 production for both in indoor and outdoor
applications.
Keywords: Biohydrogen, photofermentation, panel photobioreactors,
Rhodobacter capsulatus, molasses
vi
ÖZ
PNS BAKTERİ İLE HİDROJEN ÜRETİMİ İÇİN PANEL REAKTÖRÜNÜN
GELİŞTİRİLMESİ
Avcıoğlu, S. Gökçe
Yüksek Lisans., Kimya Mühendisliği Bölümü
Tez Yöneticisi: Prof. Dr. İnci Eroğlu
Ortak Tez Yöneticisi: Dr. Ebru Özgür
Eylül 2010, 209 sayfa
Fermentatif ve fotosentetik mikroorganizmaların kullanılması sayesinde
biyokütleden hidrojen üretimi, gelecekte uygulanabilecek ve umut vadeden bir
yöntemdir. Bu çalışmanın amacı, fotosentetik, mor, sülfürsüz bakteri ile tanımlı
besiyerinden ve fermantasyon atığı olan melastan biyolojik hidrojen üretimi için
panel tipi güneş biyoreaktörlerini geliştirmek ve boyut büyütmektir. Işık şiddeti,
sıcaklık, besiyeri kompozisyonu, besleme hızı, pH, hücre yoğunluğu, aydınlık ve
karanlık devre, karbonun azota oranının hidrojen üretimine etkisi çalışılmıştır. Asetat
ve laktat içeren tanımlı besiyeri ve melasın termofilik fermantasyon atığında
Rhodobacter capsulatus bakterisinin doğal ve mutant türü ile panel tipi
biyoreaktörlerde aydınlatılarak ve güneş ışığında sürekli hidrojen üretimi
gerçekleştirilmiştir. Laboratuar (4 L’den 8 L’ye kadar) ve pilot (20 L) ölçekte panel
biyoreaktörleri, çeşitli tasarım ve yapı malzemeleri kullanılarak geliştirilmiştir. Bu
reaktörlerde sürekli hidrojen üretimi besleme yapılarak gerçekleştirilmiştir. Na2CO3,
termofilik fermantasyon atığı olan melasta yapılan uzun süreli uygulamalarda pH’ın
sabit tutulması için tampon çözelti olarak kullanılabilir. Besiyeri kompozisyonunun

vii
seyreltme ve tampon çözelti eklenerek ayarlanmasının, pH, biyokütle ve hidrojen
üretiminde uzun süreli kararlılığın hem aydınlatılarak hem de güneş ışığında
gerçekleştirilen uygulamalar için önemli olduğu saptanmıştır.
Anahtar Kelimeler: Biyohidrojen, fotofermantasyon, panel biyoreaktörleri,
Rhodobacter capsulatus, melas

viii
In memories of
Soner Balta, Öner Balta and Güneş Korkmaz
ix
ACKNOWLEDGEMENTS
I would like to express my sincere gratitude’s to my supervisor Prof. Dr. İnci
Eroğlu for her faith in me from the first time we have met, endless supports, advices,
kindness, friendship, positive intent, giving countless chance for continuing my
studies, motivation during my thesis. I would like to thank to my co-supervisor Dr.
Ebru Özgür for guiding me in studying with biological systems and giving me
invaluable advices about improvement of laboratory techniques and my instructors
Prof. Dr. Ufuk Gündüz and Prof. Dr. Meral Yücel for their valuable contributions
and suggestions on the biological systems.
I also thank Dr. Başar Uyar, Elif Genç for their suggestions on reactor design,
and considerable contributions to my study, friendship and recommendations.
I also would like to thank to my co-working laboratory mates in hydrogen
Research Laboratory; Nilüfer Afşar, Dominic Deo Androga, Muazzez Gürgan,
Emrah Sağır, Gülşah Pekgöz, Burcu Özsoy, Kamal Elkahlout, Begüm Peksel and Efe
Boran for endless support and friendship. I also gratefully thank especially Endam
Özkan and Pelin Sevinç for invaluable collaboration and friendship. I also would like
to thank to Şerife Topçu for collaboration in providing hygiene in the laboratory.
I gratefully thank the technical assistance of Gülten Orakçı and Dr. Mustafa
Esen Martı for guidance in HPLC analysis, and Kerime Güney for elemental
analysis.
I am thankful for Dr. Truus de Vrije from Wageningen UR, Food and
Biobased Research group, The Netherlands for supplying the molasses dark
fermentor effluent.
This study has been supported by HYVOLUTION the EU 6th
Framework
Integrated Project 019825: Non-thermal production of pure hydrogen from biomass.
I also thank to my mother, my father, my brother and Turgay letting me be as
I am, and being with me for better for worse, supporting me by giving invaluable
advices in all my Master of Science study.

x
I would like to thank to Aydan Bulut, Osman Karslıoğlu, Başar Çağlar, Arzu
Kanca, İsmet Kızılrmak, Nilgün Ercan, Bülent Bozali, İhsan Karababa, and Ramazan
Gök for endless camaraderie, friendship and invaluable brain storming on profession
in my Chemical Engineering studies and in engineering politics. I am also very
grateful to Yelda, Mina, Aycan, Oya, Nisan, Gülen, Selen, Ceren and Setenay for
sharing invaluable life experiences, friendship with me and guiding and encouraging
me in all my thesis steps.
At last I would like to thank to Soner Balta, Öner Balta and Güneş Korkmaz,
Nergis Balta, Durmuş Balta, Gülfer Akkaya and Tuncay Yılmaz. I am indebted to
you for your concrete and intangible contributions to my life and personality.
xi
TABLE OF CONTENTS
ABSTRACT ................................................................................................................ iv
ÖZ ............................................................................................................................... vi
ACKNOWLEDGEMENTS ........................................................................................ ix
TABLE OF CONTENTS ............................................................................................ xi
LIST OF TABLES .................................................................................................. xviii
LIST OF FIGURES ................................................................................................ xxiii
LIST OF SYMBOLS AND ABBREVIATIONS ................................................. xxxiii
CHAPTERS
1. INTRODUCTION ................................................................................................. 1
2. LITERATURE SURVEY ...................................................................................... 6
2.1. Hydrogen as the Future Energy Carrier .......................................................... 6
2.2. Hydrogen Production Technologies ............................................................... 8
2.3. Biological Hydrogen Production .................................................................... 9
2.3.1. Dark Fermentation ............................................................................... 9
2.3.2. Photofermentation .............................................................................. 10
2.3.3. Integrated Systems ............................................................................. 15
2.4. Flat Panel Photobioreactors .......................................................................... 16
2.4.1. Temperature Distribution ................................................................... 17
2.4.2. Light intensity Distribution ................................................................ 18
2.4.3. Feeding, Cooling and Mixing ............................................................ 18
2.4.4. Applications of Flat Panel Photobioreactors ...................................... 19
2.4.5. Scale up of the Panel Photobioreactors .............................................. 25
2.5. Objective of the Study .................................................................................. 25
3. MATERIALS AND METHODS ......................................................................... 28
3.1. The Microorganisms ..................................................................................... 28
3.2. Culture Media ............................................................................................... 28
3.2.1. Growth Medium ................................................................................. 29
xii
3.2.1.1. Pre-cultivation ........................................................................ 29
3.2.1.2. Storage.................................................................................... 30
3.2.2. Hydrogen Production Media .............................................................. 30
3.2.2.1. Artificial Media ...................................................................... 30
3.2.2.2. Real Dark Fermentor Effluent of Molasses ........................... 31
3.3. Experimental Set-up...................................................................................... 31
3.3.1. Small Scale Experiments.................................................................... 32
3.3.1.1. Photobioreactors ..................................................................... 32
3.3.1.2. Sterilization of Photobioreactors and Media .......................... 32
3.3.1.3. Start-up ................................................................................... 33
3.3.1.4. Temperature Indication and Control ...................................... 33
3.3.1.5. Light Intensity Measurement ................................................. 33
3.3.1.6. Sampling and Feeding ............................................................ 33
3.3.1.7. Shutdown ............................................................................... 33
3.3.2. Experiments with Panel Photobioreactors ......................................... 34
3.3.2.1. Experimental Set-up ............................................................... 34
3.3.2.2. Sterilization of Photobioreactors and Media .......................... 39
3.3.2.3. Start-up ................................................................................... 39
3.3.2.4. Temperature Indication and Control ...................................... 40
3.3.2.5. Light Intensity Measurements ................................................ 40
3.3.2.6. Sampling and Feeding ............................................................ 41
3.3.2.7. Shutdown ............................................................................... 41
3.4. Analyses ........................................................................................................ 41
3.4.1. pH Measurement ................................................................................ 41
3.4.2. Spectrophotometric Analysis ............................................................. 41
3.4.2.1. Cell Concentration ................................................................. 41
3.4.2.2. Bacteriochlorophyll a Measurement ...................................... 42
3.4.2.3. TOC Analysis ......................................................................... 42
3.4.2.4. TN Analysis ........................................................................... 43
3.4.2.5. Ammonia Analysis ................................................................. 43
3.4.2.6. COD Analysis ........................................................................ 44
3.4.3. Gas Chromatography Analysis .......................................................... 44
xiii
3.4.3.1. Gas Analysis .......................................................................... 44
3.4.4. HPLC Analyses .................................................................................. 45
3.4.4.1. Organic Acid Analysis ........................................................... 45
3.4.5. Elemental Analysis............................................................................. 45
4. RESULTS AND DISCUSSIONS ........................................................................ 46
4.1. Selection of Construction Materials for Panel Photobioreactors .................. 46
4.1.1. Hydrogen Permeability ...................................................................... 46
4.1.2. Selection of Cooling Coil Material .................................................... 53
4.1.3. Panel Photobioreactor Design ............................................................ 55
4.2. Continuous Hydrogen Production on Defined Medium by R. capsulatus
Wild Type and Mutant Strains ...................................................................... 56
4.2.1. Indoor Lab-Scale Panel Photobioreactor ........................................... 56
4.2.1.1. Temperature and Light Intensity Distribution........................ 57
4.2.1.2. Effect of Feed Composition on Long Term Operation ..............
....................................................................................................... 59
4.2.1.3. Effect of Increased Glutamate Amount in the Feed on
Hydrogen Production .................................................................... 63
4.2.1.4. Effect of Removing Lactate from the Feeding Media on
Hydrogen Production .................................................................... 64
4.2.1.5. Effect of Increasing Acetate Amount in the Feeding Media on
Hydrogen Production .................................................................... 65
4.2.1.6. Effect of C/N Ratio on Hydrogen Production ........................ 66
4.2.2. Outdoor Lab-Scale Panel Photobioreactors ....................................... 67
4.2.2.1. Variation in Photobioreactor Temperature............................. 68
4.2.2.2. Effect of Feed Composition on Long Term Operation ..............
....................................................................................................... 71
4.2.3. Outdoor Pilot-Scale Panel Photobioreactor ....................................... 79
4.2.4. Parameters Affecting Prolonged Hydrogen Production ..................... 83
4.2.4.1. Effect of Percentage of Activated Bacteria at Start-up ..............
....................................................................................................... 83
4.2.4.2. Determining the Feeding Strategy for Continuous Operation ...
....................................................................................................... 84

xiv
4.3. Hydrogen Production on Dark Fermentor Effluent of Molasses .................. 85
4.3.1. Effect of Buffers ................................................................................. 86
4.3.2. Continuous Biohydrogen Production with R. capsulatus wild type ......
............................................................................................................... 90
4.3.2.1. Indoor Experiments ................................................................ 91
4.3.2.2. Continuous Hydrogen Production in Outdoor Experiment ........
....................................................................................................... 99
4.3.2.3. Long Term Stability of Continuous Hydrogen Production in
Outdoor Experiment .................................................................... 104
4.3.3. Long Term Stability of Continuous Biohydrogen Production with R.
capsulatus hup- in Outdoor Experiments ............................................ 115
4.4. Logistic Growth Model ............................................................................... 123
4.5. Comparison of Photofermentation Efficiency of Define Medium with the
Molasses DFE ............................................................................................. 134
5. CONCLUSIONS ................................................................................................ 136
REFERENCES ......................................................................................................... 138
APPENDICES ......................................................................................................... 153
A. COMPOSITION OF THE MEDIA AND SOLUTIONS ................ 153
A.1. Composition of the Minimal Medium ................................. 153
A.2. Composition of the Growth Medium ................................... 154
A.3. Composition of the Hydrogen Production Medium ............. 154
A.4. Composition of the Trace Elements Solution ...................... 155
A.5. Composition of the Vitamin Solutions ................................. 155
A.6. Composition of the Fe-Citrate Solution ............................... 155
B. PROPERTIES of CONSTRUCTION MATERIAL ........................ 156
B.1. Properties of Plexiglas.......................................................... 156
B.2. Properties of PVC Rigid Sheet ............................................. 156
B.3. Properties of Aluminum 6061-T6 Tubing............................ 157
B.4. Properties of Ball Valves ..................................................... 157
B.5. Properties of Adaptors.......................................................... 158
C. LIGHT ABSORBTION SPECTRA of Rhodobacter capsulatus ..........
...................................................................................................................... 159
xv
D. CALIBRATION CURVE OF DRY CELL WEIGHT VERSUS
OPTİCAL DENSITY AT 660nm ................................................................ 160
D.1. Calibration Curve of Dry Cell Weight versus Optical Density
of Rhodobacter capsulatus wild type ............................................... 160
D.2. Calibration Curve of Dry cell Weight versus Optical Density
of Rhodobacter capsulatus hup-mutant ........................................... 161
E. SAMPLE CHROMATOGRAM FOR GAS ANALYSIS ............... 162
E.1. Sample Chromatogram for Gas Analysis ............................. 162
F. SAMPLE HPLC CHROMATOGRAM OF ORGANIC ACID
ANALYSIS AND CALIBRATION CURVE OF ACETIC ACID ............. 163
F.1. Sample Chromatogram of Organic Acid Analysis............... 163
F.2. Sample HPLC calibration Curve for Lactic Acid ................ 164
F.3. Sample HPLC calibration Curve for Formic Acid ............... 164
F.4. Sample HPLC calibration Curve for Acetic Acid ................ 165
F.5. Sample HPLC calibration Curve Propionic Acid ................ 165
F.6. Sample HPLC calibration Curve for Butyric Acid .............. 166
G. PERMEABILITY of HYDROGEN THROUGH SOLIDS ............. 167
H. SOLUBILITY of HYDROGEN in WATER ................................... 169
I. MEASURING HYDROGEN PERMEABILITY THROUGH
REACTOR MATERIAL ............................................................................. 170
J. DEFINITION of GLOBAL SOLAR RADIATION ........................ 171
K. SAMPLE CALCULATIONS FOR EVALUATION OF THE
ANALYSIS .................................................................................................. 172
K.1. Sample Calculation for Dry Cell Weight ............................. 172
K.2. Sample Calculation for Bacteriochlorophyll a Content ....... 172
K.3. Sample Calculation for Acetic Acid Concentration ............. 173
L. SAMPLE CALCULATIONS FOR EVALUATION OF THE
EXPERIMENTAL DATA ........................................................................... 174
L.1. Sample Calculation for Permeability Correction ................. 174
L.2. Sample Calculation for Solubility Correction ...................... 175
L.2.1 Sample Calculation for Solubility Correction in Batch
Operation .............................................................................. 175
xvi
L.2.1 Sample Calculation for Solubility Correction in
Continuous Operation .......................................................... 175
L.3. Sample Calculation for Molar Productivity ......................... 176
L.4. .Sample Calculation for Molar Percentage Yield ................ 177
L.5. Sample Calculation for Acetate Conversion Efficiency ...... 177
L.6. Sample Calculation for Light Conversion Efficiency .......... 178
L.6.1 Light Conversion Efficiency for Indoor Experiments ...
.............................................................................................. 178
L.6.2 Light Conversion Efficiency for Outdoor Experiments .
.............................................................................................. 178
L.7. Sample Calculation for COD Removal Efficiency .............. 179
M. EXPERIMENTAL DATA ............................................................... 180
M.1. Experimental Data of Selection of Material of Construction for
Cooling Coil ..................................................................................... 180
M.2. Experimental Data of Indoor Continuous Photobioreactor (8
L) on Defined Medium (24.08.07) .................................................. 181
M.3. Experimental Data of Outdoor Continuous Photobioreactors (8
L) on Defined Medium (26.09.07) .................................................. 187
M.4. Experimental Data of Outdoor Continuous Photobioreactors (8
L) on Defined Medium (31.08.07) .................................................. 190
M.5. Experimental Data of Outdoor Continuous Pilot-Scale
Photobioreactor (20 L) on Defined Medium .................................... 193
M.6. Experimental Data on the Effect of Buffer on the Molasses
DFE .................................................................................................. 194
M.7. Experimental Data of Indoor Continuous Photobioreactor (500
ml) on the Molasses DFE ................................................................. 196
M.8. Experimental Data of Indoor Continuous Photobioreactor (4
L) on the Molasses DFE ................................................................... 197
M.9. .Experimental Data of Outdoor Continuous Photobioreactor (4
L) with Cooling by Rb. capsulatus wild type on the Molasses DFE
(27.07.09) ........................................................................................ 198

xvii
M.10. .Experimental Data of Outdoor Continuous Photobioreactor (4
L) with Cooling by Rb. capsulatus wild type on the Molasses DFE
(17.08.09) ........................................................................................ 199
M.11. Experimental Data of Outdoor Continuous Photobioreactor (4
L) with Cooling by Rb. capsulatus hup- on the Molasses DFE
(30.07.09) ........................................................................................ 204
xviii
LIST OF TABLES
TABLES
Table 2.1 Biological hydrogen production processes ............................................. 9
Table 2.2 Hydrogen productivities, operational conditions and operating modes
of the panel photobioreactors studied in indoor and outdoor conditions
on malate, acetate, lactate and olive mill wastewater by PNS bacteria in
the literature .......................................................................................... 24
Table 3.1 C/N ratios according to the concentrations of the substrates in the
hydrogen production media used in the experiments ........................... 32
Table 4.1 Hydrogen permeability of PMMA, Glass, Polyurethane (PU), Polyvinyl
Chloride (PVC), Low Density Polyethylene (LDPE) ......................... 50
Table 4.2 Hydrogen, oxygen and nitrogen permeability of PMMA, Glass,
Polyurethane (PU), Polyvinyl Chloride (PVC), Low Density
Polyethylene (LDPE) .......................................................................... 52
Table 4.3 Hydrogen permeability of Aluminum (Al), Copper (Cu), Stainless Steel
316 (SS 316), Stainless Steel 304 (SS 304) ......................................... 53
Table 4.4 Productivity, and molar yield values obtained during the fed batch
operation of the indoor 8 L photobioreactor runs with Rb. capsulatus
wild type on defined medium containing acetate (40-80 mM), lactate
(7.5 mM) and glutamate (2-10 mM) ................................................... 64
Table 4.5 Feed content, average biomass concentration, productivity, and molar
yield values obtained in the indoor 8 L photobioreactor runs with Rb.
capsulatus wild type on defined medium containing acetate (40-80
mM), lactate (7.5 mM) and glutamate (2-10 mM) in the Phase II and III
.............................................................................................................. 65
Table 4.6 Feed content, average biomass concentration, productivity, and molar
yield values obtained in the indoor 8 L photobioreactor runs with Rb.
xix
capsulatus wild type on defined medium containing acetate (40-80
mM), lactate (7.5 mM) and glutamate (2-10 mM) in the Phase III and
IV .......................................................................................................... 66
Table 4.7 Feed content, average biomass concentration, productivity and molar
yield values obtained in the indoor 8 L photobioreactor runs with Rb.
capsulatus wild type on defined medium containing acetate (40-80
mM), lactate (7.5 mM) and glutamate (2-10 mM) in the Phase IV and V
.............................................................................................................. 67
Table 4.8 C/N ratio, productivity and molar yield values obtained in the indoor 8
L photobioreactor runs with Rb. capsulatus wild type on defined
medium containing acetate (40-80 mM), lactate (7.5 mM) and
glutamate (2-10 mM) in the Phase II, III, IV and V ............................. 68
Table 4.9 The productivity and molar yield of all phases obtained in the outdoor 8
L photobioreactor runs with Rb. capsulatus wild type on defined
medium containing acetate (40-80 mM), lactate (7.5 mM) and
glutamate (2-10 mM) ........................................................................... 76
Table 4.10 The productivity and molar yield of all phases obtained in the outdoor 8
L photobioreactor (Run310807) runs with Rb. capsulatus wild type on
defined medium containing acetate (40-80 mM), lactate (7.5 mM) and
glutamate (2-10 mM) ........................................................................... 80
Table 4.11 Feed content, percentage of activated bacteria, duration of batch period,
biomass concentration at the end of batch period and hydrogen
productivity at start-up in three photobioreactors run with Rb.
capsulatus wild type on defined medium containing acetate (40-80
mM), lactate (7.5 mM) and glutamate (2-10 mM) at start-up, batch
period .................................................................................................... 84
Table 4.12 Operational mode, feed content, average biomass concentration,
hydrogen productivity, and yield of three photobioreactors run with Rb.
capsulatus wild type on defined medium containing acetate (40-80
mM), lactate (7.5 mM) and glutamate (2-10 mM) at Phase II .................
.............................................................................................................. 85
Table 4.13 Composition of the molasses dark fermentor effluent ......................... 87

xx
Table 4.14 The average biomass concentration, and average pH, total hydrogen
production in the photobioreactors ....................................................... 90
Table 4.15 Productivity, yield, light conversion efficiency and the composition of
evolved gas in indoor photobioreactors run on the molasses DFE
supplemented with different concentrations of phosphate and carbonate
buffer, using Rb. capsulatus wild type ................................................. 91
Table 4.16 Comparison of the hydrogen productivity values obtained in this study
with similar studies in the literature .................................................... 100
Table 4.17 Growth modeling of the Rb. capsulatus DSM 1710 and Rb. capsulatus
hup- on defined medium in panel photobioreactors ........................... 130
Table 4.18 Growth modeling of the Rb. capsulatus DSM 1710 and Rb. capsulatus
hup- on the molasses dark fermentor effluent .................................... 134
Table 4.19 Comparison of yields and productivities of continuous hydrogen
production on defined medium and the molasses DFE experiments in
panel photobioreactors ....................................................................... 135
Table A.1 Composition of the minimal medium ................................................. 153
Table A.2 Composition of the growth medium ................................................... 154
Table A.3 Composition of the hydrogen production medium (40 mM Acetate/2
mM Glutamate) ................................................................................. 154
Table A.4 The composition of trace element solution ........................................ 155
Table A.5 The composition of vitamin solution .................................................. 155
Table B.1 Physical properties of Plexiglas ......................................................... 156
Table B.2 Properties of PVC Rigid Sheet ........................................................... 157
Table B.3 Properties of Aluminum 6061-T6 Tubing .......................................... 157

xxi
Table M.1 pH, OD and cumulative H2 production values of selection of cooling
coil research ........................................................................................ 180
Table M.2 Temperature variation on the surfaces of indoor continuous
photobioreactor (8 L) on defined medium ......................................... 181
Table M.3 Light Intensity variation on the surfaces of indoor continuous
photobioreactor (8 L) on defined medium ......................................... 182
Table M.4 Cumulative H2 production, pH, OD, and organic acid values of indoor
continuous photobioreactor (8 L) on defined medium ....................... 182
Table M.5 Cumulative H2 production, pH, OD, and organic acid values of outdoor
continuous photobioreactor (8 L) on defined medium ....................... 187
Table M.6 Cumulative H2 production, pH, OD, and organic acid values of outdoor
continuous photobioreactor (8 L) on defined medium ....................... 190
Table M.7 Cumulative H2 production, pH, OD, and organic acid values of outdoor
continuous pilot scale photobioreactor (20 L) on defined medium .... 193
Table M.8 pH, OD, and cumulative gas production values obtained at different
concentrations of Na2CO3 and KH2PO4 ............................................. 194
Table M.9 Cumulative H2 production pH, OD values of indoor photobioreactor
(500 ml) on the molasses DFE ........................................................... 196
Table M.10 Cumulative H2 production pH, OD an organic acid values of indoor
continuous photobioreactor (4 L) on the molasses DFE .................... 197
Table M.11 Cumulative H2 production pH, OD an organic acid values of outdoor
continuous photobioreactor (4 L) with cooling by Rb. capsulatus wild
type on the molasses DFE (27.07.09) ................................................. 198
Table M.12 Cumulative H2 production pH, OD an organic acid values of outdoor
continuous photobioreactor (4 L) with cooling by Rb. capsulatus wild
type on the molasses DFE (18.07.09) ................................................. 199

xxii
Table M.13 Cumulative H2 production pH, OD an organic acid values of outdoor
continuous photobioreactor (4 L) with cooling by Rb. capsulatus hup-
on the molasses DFE (30.07.09) ....................................................... 204
xxiii
LIST OF FIGURES
FIGURES
Figure 2.1 Energy demand according to the energy carriers over the last 200 years.
Orange, renewables; red, nuclear fission; blue, hydro power; grey,
natural gas; dark grey, crude oil; black, coal; green, biomass ................ 7
Figure 2.2 Development of the oil price without correction for inflation .................
................................................................................................................ 7
Figure 2.3 Hydrogen production by purple non-sulfur bacteria. UQ: Ubiquinone,
PS: photosystem, OR: oxidoreductase, Fd: ferrodoxin ........................ 13
Figure 2.4 Schematic of metabolic pathways of H2 evolution/uptake and
competing reactions. A: Nitrogenase complex, catalyzing H2 evolution,
B: Membrane-bound uptake hydrogenase, responsible for H2uptake
(recycling), C: PHB synthase, involved in biosynthesis of poly-3-
hydroxybutyrate granules ..................................................................... 14
Figure 2.5 Three-component integrated biological system for H2 production ..........
.............................................................................................................. 16
Figure 3.1 Anaerobic medium preparation bottle .................................................. 29
Figure 3.2 Pre-cultivation bottle and anaerobic media preparation ....................... 30
Figure 3.3 Experimental set up of small-scale experiments .................................. 32
Figure 3.4 Experimental set up of 8 L laboratory scale experiments .................... 35
Figure 3.5 Picture of indoor 8 L laboratory scale experiment ............................... 36
Figure 3.6 Picture of outdoor 8 L photobioreactor started at 31.08.07 (PBR 1) ......
.............................................................................................................. 36
xxiv
Figure 3.7 Picture of outdoor 8 L photobioreactors started at 31.08.07 (PBR 1) and
26.09.07 (PBR 2) as they were in the greenhouse ................................ 37
Figure 3.8 Experimental set up of the laboratory (4 L) and pilot scale (20 L)
photobioreactors with internal cooling coil .......................................... 37
Figure 3.9 Picture of outdoor continuous photobioreactors (4 L) with internal
cooling coil run by Rb. capsulatus hup-(PBR 1) and Rb. capsulatus
wild type (PBR 2) on the molasses DFE started at 30.07.08 and
17.08.07, respectively ........................................................................... 38
Figure 3.10 Pictures of PBR1 and PBR2 in the greenhouse .................................... 38
Figure 3.11 Picture of outdoor pilot scale photobioreactor (20 L) with internal
cooling coil runs by Rb. capsulatus hup- on defined medium containing
30 mM acetate and 2 mM glutamate at the start-up period .................. 39
Figure 4.1 Comparison of permeability coefficients of hydrogen and oxygen of
PC, fluorocarbon polymers, and PET materials, Acrylics (Blake, 2005)
.............................................................................................................. 47
Figure 4.2 Comparison of permeability coefficients of hydrogen that was found
out experimentally and already in the literature. Chosen materials are
Plexiglas (PMMA), Glass, Polyurethane (PU), Polyvinyl Chloride
(PVC) and Low Density Polyethylene (LDPE) which have 3.5, 2.5, 1.5,
1.5 and 0.3 mm wall thicknesses, respectively ..................................... 49
Figure 4.3 Hydrogen, oxygen, and nitrogen permeability coefficients of Plexiglas
(PMMA), Glass, Polyurethane (PU), Polyvinyl Chloride (PVC) and
Low Density Polyethylene (LDPE) in the literature, respectively ....... 50
Figure 4.4 Hydrogen permeability coefficients of Aluminum (Al), Copper (Cu),
Stainless Steel 316 (SS 316), Stainless Steel 304 (SS 304) that was in
the literature .......................................................................................... 52
Figure 4.5 The pH, growth, and cumulative H2 production in the photobioreactor
which didn’t have any cooling coil material and the photobioreactors
(50 ml) containing Polyurethane (PU), Aluminum (Al), Polyvinyl
Chloride (PVC), Copper (Cu), Stainless Steel 316 (SS 316), Stainless
Steel 304 (SS 304) ............................................................................... 54

xxv
Figure 4.6 Temperature distributions of the surfaces of the indoor photobioreactor
runs with Rb. capsulatus wild type on defined medium containing
acetate (40-80 mM), lactate (7.5 mM) and glutamate (2-10 mM).
Starting date of the experiment was 24.08.07 ...................................... 57
Figure 4.7 Light intensity distribution on the surfaces of the indoor
photobioreactor runs with Rb. capsulatus wild type on defined medium
containing acetate (40-80 mM), lactate (7.5 mM) and glutamate (2-10
mM). Starting date of the experiment was 24.08.07 ............................ 58
Figure 4.8 The pH variation in the indoor photobioreactor runs with Rb.
capsulatus wild type on defined medium containing acetate (40-80
mM), lactate (7.5 mM) and glutamate (2-10 mM). Starting date of the
experiment was 24.08.07. Feeding was started on 8th
day of the
experiment ............................................................................................ 59
Figure 4.9 Cumulative hydrogen production and biomass in the indoor
photobioreactor runs with Rb. capsulatus wild type on defined medium
containing acetate (40-80 mM), lactate (7.5 mM) and glutamate (2-10
mM). Starting date of the experiment was 24.08.07. Feeding was
started on 8th
day of the experiment ..................................................... 60
Figure 4.10 Organic acids concentration in the indoor photobioreactor runs with Rb.
capsulatus wild type on defined medium containing acetate (40-80
mM), lactate (7.5 mM) and glutamate (2-10 mM). Starting date of the
experiment was 24.08.07. Feeding was started on 8th
day of the
experiment ............................................................................................ 61
Figure 4.11 Variations in temperature in the outdoor photobioreactor runs with Rb.
capsulatus wild type on defined medium containing acetate (40-80
mM), lactate (7.5 mM) and glutamate (2-10 mM). Starting date of the
experiment was 26.09.07. Feeding was started on 15th
day of the
experiment ............................................................................................ 69
Figure 4.12 Variations in temperature in the outdoor photobioreactor runs with Rb.
capsulatus wild type on defined medium containing acetate (40-80
mM), lactate (7.5 mM) and glutamate (2-10 mM) Starting date of the
experiment was 31.08.07. Feeding was started on 6th
day of the
experiment ............................................................................................ 70
Figure 4.13 Daily global solar radiation energy during outdoor period of the
photobioreactors (Run260907 and Run310807) run with Rb. capsulatus

xxvi
wild type on defined medium containing acetate (40-80 mM), lactate
(7.5 mM) and glutamate (2-10 mM). Starting date of the data is
31.08.07 ................................................................................................ 71
Figure 4.14 pH variation in the outdoor photobioreactor runs with Rb. capsulatus
wild type on defined medium containing acetate (40-80 mM), lactate
(7.5 mM) and glutamate (2-10 mM) Starting date of the experiment
was 26.09.07. Feeding was started on 15th
day of the experiment ...........
.............................................................................................................. 72
Figure 4.15 Growth and cumulative hydrogen production in the outdoor
photobioreactor runs with Rb. capsulatus wild type on defined medium
containing acetate (40-80 mM), lactate (7.5 mM) and glutamate (2-10
mM). Starting date of the experiment was 260907. Feeding was started
on 15th
day of the experiment ............................................................... 73
Figure 4.16 Organic acid consumption in the outdoor photobioreactor runs with Rb.
capsulatus wild type on defined medium containing acetate (40-80
mM), lactate (7.5 mM) and glutamate (2-10 mM). Starting date of the
experiment was 26.09.07. Feeding was started on 15th
day of the
experiment ............................................................................................ 74
Figure 4.17 pH variation in the outdoor photobioreactor runs with Rb. capsulatus
wild type on defined medium containing acetate (40-80 mM), lactate
(7.5 mM) and glutamate (2-10 mM). Starting date of the experiment
was 31.08.07. Feeding was started on 6th
day of the experiment ......... 76
Figure 4.18 Growth and hydrogen production in the outdoor photobioreactor runs
with Rb. capsulatus wild type on defined medium containing acetate
(40-80 mM), lactate (7.5 mM) and glutamate (2-10 mM). Starting date
of the experiment was 31.08.07. Feeding was started on 6th
day of the
experiment ............................................................................................ 77
Figure 4.19 Organic acid consumption in the outdoor photobioreactor runs with Rb.
capsulatus wild type on defined medium containing acetate (40-80
mM), lactate (7.5 mM) and glutamate (2-10 mM). Starting date of the
experiment was 31.08.07. Feeding was started on 6th
day of the
experiment ............................................................................................ 78
Figure 4.20 The pH variation in outdoor pilot-scale photobioreactor runs with Rb.
capsulatus hup- on defined medium containing 30 mM acetate and 2

xxvii
mM glutamate at the start-up period. Starting date of the experiment
was 02.12.08. Feeding was started on 4th
day of the experiment ......... 80
Figure 4.21 Growth and hydrogen production in outdoor pilot-scale photobioreactor
runs with Rb. capsulatus hup- on defined medium containing 30 mM
acetate and 2 mM glutamate at the start-up period. Starting date of the
experiment was 02.12.08. Feeding was started on 4th
day of the
experiment ............................................................................................ 81
Figure 4.22 Organic acid consumption in outdoor pilot scale photobioreactor runs
with Rb. capsulatus hup- on defined medium containing 30 mM acetate
and 2 mM glutamate at the startup period. Starting date of the
experiment was 02.12.08. Feeding was started on 4th
day of the
experiment ............................................................................................ 82
Figure 4.23 pH, biomass, and cumulative hydrogen production in the
photobioreactors run by Rb. capsulatus wild type on media containing
the molasses DFE supplemented with 5, 10 and 15 mM of Na2CO3 and
KH2PO4 buffer ...................................................................................... 88
Figure 4.24 pH variation in the 500 ml indoor continuous photobioreactor runs on
the molasses DFE using Rb. capsulatus wild type. Feeding was started
at 4th
day ............................................................................................... 92
Figure 4.25 Growth and daily hydrogen production in the 500 ml indoor continuous
photobioreactor runs on the molasses DFE using Rb. capsulatus wild
type. Feeding was started at 4th
day ...................................................... 93
Figure 4.26 Organic acid consumption in the 500 ml indoor continuous
photobioreactor runs on the molasses DFE using Rb. capsulatus wild
type. Feeding was started at 4th
day ...................................................... 94
Figure 4.27 pH variations in indoor continuous photobioreactor runs by Rb.
capsulatus wild type on the molasses DFE. Feeding was started at the
3rd
day ................................................................................................... 96
Figure 4.28 Biomass and daily hydrogen production in indoor continuous
photobioreactor runs by Rb. capsulatus wild type on the molasses DFE.
Feeding was started at the 3rd
day ........................................................ 97
xxviii
Figure 4.29 Organic acid consumption in indoor continuous photobioreactor runs
by Rb. capsulatus wild type on the molasses DFE. Feeding started at
the 3rd
day ............................................................................................. 98
Figure 4.30 Variation in pH in outdoor continuous photobioreactor during hydrogen
production runs by Rb. capsulatus wild type on the molasses DFE.
Starting date of the experiment was 27.07.09. Feeding was started at 3rd
day ...................................................................................................... 100
Figure 4.31 Variation in growth and hydrogen production in outdoor continuous
photobioreactor runs by Rb. capsulatus wild type on the molasses DFE.
Starting date of the experiment was 27.07.09. Feeding was started at 3rd
day ...................................................................................................... 101
Figure 4.32 The maximum and minimum temperatures attained in outdoor
continuous photobioreactor runs by Rb. capsulatus wild type on the
molasses DFE. Starting date of the experiment was 27.07.09. Feeding
was started at 3rd
day .......................................................................... 102
Figure 4.33 Daily global solar radiation energy versus daily hydrogen production in
outdoor continuous photobioreactor runs by Rb. capsulatus wild type
on the molasses DFE. Starting date of the experiment was 27.07.09.
Feeding was started at 3rd
day ............................................................ 103
Figure 4.34 Organic acid consumption in outdoor continuous photobioreactor
during hydrogen production runs by Rb. capsulatus wild type on the
molasses DFE. Starting date of the experiment was 27.07.09. Feeding
was started at 3rd
day .......................................................................... 104
Figure 4.35 Long term stability of pH in outdoor continuous photobioreactor during
hydrogen production runs by Rb. capsulatus wild type on the molasses
DFE. Starting date of the experiment was 17.08.09. Feeding was started
at 6th
day ............................................................................................. 106
Figure 4.36 Growth and daily hydrogen production in outdoor continuous
photobioreactor runs by Rb. capsulatus wild type on the molasses DFE.
Starting date of the experiment was 17.08.09. Feeding was started at 6th
day ...................................................................................................... 107
xxix
Figure 4.37 Variation in temperature in outdoor continuous photobioreactor runs by
Rb. capsulatus wild type on the molasses DFE. Starting date of the
experiment was 17.08.09. Feeding was started at 6th
day .................. 109
Figure 4.38 Daily global solar radiation energy versus daily hydrogen production in
outdoor continuous photobioreactor runs by Rb. capsulatus wild type
on the molasses DFE. Starting date of the experiment was 17.08.09.
Feeding was started at 6th
day............................................................. 110
Figure 4.39 Organic acid consumption in outdoor continuous photobioreactor runs
by Rb. capsulatus wild type on the molasses DFE. Starting date of the
experiment was 17.08.09. Feeding was started at 6th
day .................. 111
Figure 4.40 Variation in COD, TOC, TN and NH4+ in outdoor continuous
photobioreactor runs by Rb. capsulatus wild type on the molasses DFE.
Starting date of the experiment was 17.08.09. Feeding was started at 6th
day ...................................................................................................... 113
Figure 4.41 Variation in concentrations of Mg, Zn, Co, Mn, Fe, Ni, Cu, Ca, and Na
in outdoor continuous photobioreactor runs by Rb. capsulatus wild type
on the molasses DFE. Starting date of the experiment was 17.08.09.
Feeding was started at 6th
day............................................................. 114
Figure 4.42 The hourly hydrogen production, temperature and the solar radiation in
outdoor continuous photobioreactor runs by Rb. capsulatus wild type
on the molasses DFE .......................................................................... 115
Figure 4.43 Long term stability of pH in outdoor continuous photobioreactor runs
by Rb. capsulatus hup- on the molasses DFE. Starting date of the
experiment was 30.07.09. Feeding was started at 11th
day ................ 116
Figure 4.44 Growth and hydrogen production in outdoor continuous
photobioreactor runs by Rb. capsulatus hup- on the molasses DFE.
Starting date of the experiment was 30.07.09. Feeding was started at
11th
day...……………………… ....................................................... 117
Figure 4.45 Variation in temperature in outdoor continuous photobioreactor runs by
Rb. capsulatus hup- on the molasses DFE. Starting date of the
experiment was 30.07.09. Feeding was started at 11th
day ................ 118

xxx
Figure 4.46 Daily global solar radiation energy versus daily hydrogen production in
outdoor continuous photobioreactor runs by Rb. capsulatus hup- on the
molasses DFE. Starting date of the experiment was 30.07.09. Feeding
was started at 11th
day ........................................................................ 119
Figure 4.47 Organic acid consumption in outdoor continuous photobioreactor runs
by Rb. capsulatus hup- on the molasses DFE. Starting date of the
experiment was 30.07.09. Feeding was started at 11th
day ................ 120
Figure 4.48 The COD, TOC, TN and NH4+ concentrations in outdoor continuous
photobioreactor runs by Rb. capsulatus hup- on the molasses DFE.
Starting date of the experiment was 30.07.09. Feeding was started at
11th
day ............................................................................................... 121
Figure 4.49 Variation in concentrations of Mg, Zn, Co, Mn, Fe, Ni, Cu, Ca, and Na
in outdoor continuous photobioreactor runs by Rb. capsulatus wild type
on the molasses DFE. Starting date of the experiment was 30.07.09.
Feeding was started at 11th
day........................................................... 122
Figure 4.50 The hourly hydrogen production, temperature in outdoor continuous
photobioreactor runs by Rb. capsulatus hup- on the molasses DFE.
Starting date of the experiment was 30.07.09. Feeding was started at
11th
day ............................................................................................... 123
Figure 4.51 The logistic model for the growth of Rhodobacter capsulatus (DSM
1710) studied in indoor continuous photobioreactor (8 L) on defined
medium (24.08.07-28.01.08) ............................................................. 125
Figure 4.52 The logistic model for the growth of Rhodobacter capsulatus (DSM
1710) studied in outdoor continuous photobioreactor (8 L) on defined
medium (26.09.07-23.01.08) ............................................................. 126
Figure 4.53 The logistic model for the growth of Rhodobacter capsulatus (DSM
1710) studied in outdoor continuous photobioreactors (8 L) on defined
medium (31.08.07) ............................................................................ 127
Figure 4.54 The logistic model for the growth of Rhodobacter capsulatus hup-
studied in outdoor continuous pilot-scale photobioreactor (20 L) on
defined medium .................................................................................. 128
xxxi
Figure 4.55 The logistic model for the growth of Rhodobacter capsulatus DSM
1710 studied in indoor continuous photobioreactor (500 ml) on the
molasses DFE ..................................................................................... 130
Figure 4.56 The logistic model for the growth of Rhodobacter capsulatus DSM
1710 studied in indoor continuous photobioreactor (4 L) on the
molasses DFE (24.04.09-03.05.09) ................................................... 131
Figure 4.57 The logistic model for the growth of Rhodobacter capsulatus
(DSM1710) studied in outdoor continuous photobioreactor (4 L) with
cooling on the molasses DFE (27.07.09) .......................................... 132
Figure 4.58 The logistic model for the growth of Rhodobacter capsulatus
(DSM1710) studied in outdoor continuous photobioreactor (4 L) on the
molasses DFE (17.08.09-11.10.09) ................................................... 132
Figure 4.59 The logistic model for the growth of Rhodobacter capsulatus hup-
studied in outdoor continuous photobioreactor (4 L) on the molasses
DFE (30.07.09-11.10.09) .................................................................. 133
Figure C The light absorption spectrum of Rhodobacter capsulatus ................ 159
Figure D.1 Calibration curve of dry weight versus OD660 and the regression trend
line for Rhodobacter capsulatus (DSM 1710) (Uyar, 2008). An optical
density of 1.0 at 660nm corresponds to a cell density of 0.54 gram dry
cell weight/liter of culture of Rhodobacter capsulatus (DSM 1710) ......
............................................................................................................ 160
Figure D.2 Calibration curve of dry weight versus OD660 and the regression trend
line for Rhodobacter capsulatus mutant (Ozturk, 2005). An optical
density of 1.0 at 660nm corresponds to a cell density of 0.47 gram dry
cell weight/liter of culture of Rhodobacter capsulatus hup- mutant .. 161
Figure E.1 Sample chromatogram for gas analysis .............................................. 162
Figure F.1 Sample chromatogram of organic acid analysis. Retention times of
lactic, formic, acetic, propionic and butyric acid are 20.4, 21.7, 23.6,
27.6, 33.4, respectively ....................................................................... 163
Figure F.2 Sample HPLC calibration curve for lactic acid .................................. 164
xxxii
Figure F.3 Sample HPLC calibration curve for formic acid ................................ 164
Figure F.4 Standard HPLC calibration curve of acetic acid ................................ 165
Figure F.5 Standard HPLC calibration curve of propionic acid .......................... 165
Figure F.6 Standard HPLC calibration curve of butyric acid .............................. 166
Figure J.1 Diffuse, direct and reflected radiation ................................................ 171

xxxiii
LIST OF SYMBOLS
A: Irradiated area (m2)
Acetyl-CoA: Acetyl Coenzyme A
ADP: Adenosine di-Phosphate
ATP: Adenosine tri-Phosphate
bchla: Bacterirochlorophyll a
C: Concentration (mM)
Cbchl a:Bacteriochlorophyll a concentration of the culture (mg bchl a/Lc)
D: Sum of days elapsed from January 1
DSM: Deutsche Sammlung von Mikroorganismen und Zellkulturen
E: Energy of sun (J)
I: Light intensity (W/m2)
kc: Specific growth rate constant obtained by logistic model, (h-1
)
L: Length (m)
m: Slope of the calibration curve (mg/Lc)
MW: Molecular weight (g mole-1
)
N: Number of moles (mole)
OD: Optical density
P: Pressure (Pa)
PBR: Photobioreactor
PHB: Polyhydroxybutyrate
PMMA: Poly(methyl methacrylate)
PNS: Purple Non-Sulfur
QH2: Molar productivity of hydrogen (mmolesH2/Lc.h)
r: Correlation coefficient (dimensionless)
R: Ideal gas constant (dm3.Pa.mmole
-1.K
-1)
S: Standard error (dimensionless)
t: time (h)
xxxiv
T: Temperature (0C)
V: Volume (L)
x: Mole fraction (dimensionless)
X: Bacterial concentration (g dcw/Lc)
Y: Yield (%)
Greek Letters:
ε: Extinction coefficient
μmax: Specific growth rate constant obtained by exponential model, (h-1
)
η: Efficiency (%)
∆Hc: Combustion enthalpy of hydrogen (j/mole)
σD: Solar constant (W/m2)
θ: Solar declination
Subscripts:
c: Culture
i: initial
f: final
in: Feed
LC:Light Conversion
o: Overall
out: Effluent
max: Maximum
e: Experimental
m: Model
ACT: Actual
THEO: Theoretical

xxxv
LIST OF ABBREVIATIONS
AA: Acetic acid
BA: Butyric acid
C/N: Carbon to Nitrogen Ratio
COD: Concentration of chemical oxygen demand (mg/L)
DFE: Dark Fermentor Effluent
FA: Formic acid
FID: Flame Ionization Detector
FM: Fresh media
GC: Gas Chromatography
hup-: Uptake hydrogenase deficient (mutant)
HPLC: High Performance Liquid Chromatography
LA: Lactic acid
LC: Light Conversion
LDPE: Low density polyethylene
NA: Not available
PA: Propionic acid
SRWW: Sugar refinery waste water
SS: Stainless Steel
TN: Total nitrogen (mg/L),
TOC: Total organic carbon (mg/L),

1
CHAPTER 1
INTRODUCTION
Provision of the energy demand, depletion of the common energy resources and
the global climate change emerged with increasing fossil-based CO2 emission
constitutes the main challenges of the mankind in this century. In this point of view
hydrogen will become more and more important throughout the next decades.
Because hydrogen is the most abundant element in the universe and water was the
main product in combustion (Das and Veziroglu, 2001). This makes it invaluable as a
clean, renewable, harmless energy carrier of the future. Furthermore it has high
energy content considering its molecular weight. Higher heating value of hydrogen is
142 MJ/kg and greater than the higher heating value of natural gas which is 28.1
MJ/kg (Hawkins and Joffe, 2005).
There are several methods to produce hydrogen from both renewable and non-
renewable resources. From non-renewable resources steam methane reforming,
partial oxidation of hydrocarbons, coal gasification, and biomass gasification are
regarded as the most common methods (Pilavachi et al., 2009). Steam methane
reforming supply for more than a half of world hydrogen production that’s why it is
the principal industrial process for the production of hydrogen. Gasification of coal is
also a commercial technology for production of hydrogen in the processes of
ammonia and methanol synthesis. However, coal gasification process has been
successfully implemented in regions that do not have access to natural gas (Mueller-
Langer et al., 2007). Hydrogen production technologies basing on fossil fuels also
increase the CO2 emission and faces with the exhaustion of the resources. Obviously,
hydrogen can be an ideal energy carrier if it is produced from renewables. The
electrolysis combined with photovoltaics, wind power, hydropower, geothermal
power and biological hydrogen production from biomass are also alternative

2
developing methods to the non-renewable ones as clean hydrogen production
techniques.
Using hydrogen as an energy carrier brings with it both technological and
infrastructural development. So long as it is possible to burn hydrogen directly as a
fuel, it is also possible to use fuel cells as a direct electrical energy conversion
device. There are four main areas of fuel cell applications: auxiliary power units
which provide additional on board power for vehicles, portable fuel cells which may
be used to replace batteries in portable electronic devices such as computers and
mobile phones, generators, stationary power for essential services, and fuel cell
vehicles (Ekins and Hughes, 2009).
Biological hydrogen is produced via direct photolysis, photofermentation, and
dark fermentation processes (Nath and Das, 2004) employing microalgae and
cyanobacteria, photosynthetic purple bacteria, or dark fermentative bacteria.
However the integration of dark and photofermentation driven by thermophile and
photosynthetic bacteria is the most promising biological process.
Two-step biohydrogen production with dark fermentation in the first step and
photofermentation in the second step offers a highly efficient biohydrogen
production process, as the maximum conversion of substrates to H2 becomes
possible. In dark fermentation, biomass is converted to hydrogen, CO2 and organic
acids by thermophilic or mesophilic dark fermentative bacteria and in
photofermentation organic acids derived from dark fermentation are converted to
more hydrogen by purple non-sulfur (PNS) bacteria. Such an approach has been
employed by the EU 6th
Framework Integrated Project HYVOLUTION, which aims
to develop a 2-stage bioprocess for the cost effective production of pure hydrogen
from biomass, ranging from energy crops to bioresidues from agro-industries
(Claassen and de Vrije, 2006).
Biomass sources used in this integrated process can be basically defined as
organic matter includes wood and wood wastes and residues, crops, trees, plants,
grasses, aquatic plants and algae, agricultural and forestry wastes, sludge, animal
wastes and residues, organic waste materials and municipal solid waste, etc.
(Muradov and Veziroglu, 2008).

3
Sugar beet molasses is a by-product of the sugar industry that is obtained as thick
syrup during the crystallization of sucrose. It contains a high amount of sucrose (ca.
50%), and is rich inorganic nitrogen, vitamins and salt that may support bacterial
growth. It has been described as a suitable feedstock for dark fermentation under
mesophilic conditions (Li et al., 2009, Guo et al., 2008, Ren et al., 2006, Ren et al.,
2007). It has been reported that sequential operation of thermophilic dark
fermentation effluent (DFE) of the molasses can be used as a substrate for the
photofermentative hydrogen production using different PNS bacterial strains, in
batch mode. The highest yield and productivity was obtained with the uptake
hydrogenase deficient (hup-) mutant strain of Rhodobacter capsulatus (Ozgur et al,
2010).
The microorganism, Rhodobacter capsulatus is a non-sulfur purple bacterium
which is rod-shaped, odorless, has very faint peach-like taste in addition to that it can
develop in a media over a pH range at least from 6 to 8.5, in the optimum
temperature value of 30 0C and grow on propionate, glucose, fructose, alanine,
glutamic acid and most fatty acids and grow without mannose, leucine, thiosulfate,
ethanol, glycerol, mannitol, sorbitol, tartarate, citrate and gluconate (Van Niel et al.,
1944).
There are two key enzymatic systems on the focus of photoproduction of
hydrogen in photosynthetic bacteria; the nitrogen fixation system and the hydrogen
metabolism. In nitrogen fixation system molecular nitrogen is reduced to ammonia
and hydrogen is produced with the consumption of ferrodoxin and ATP by the
leadership of nitrogenase enzyme (Meyer et al., 1978). In case where there is no
molecular nitrogen or in nitrogen limiting conditions four times more hydrogen is
produced consuming the same amount of ATP by nitrogenase enzyme. In hydrogen
metabolism hydrogenase enzymes catalyze the activation or reversible oxidation of
molecular hydrogen (Vignais et al., 1985). To prevent recycling of produced
hydrogen uptake hydrogenase operon was inactivated and thus the hydrogen
productivity yield is increased with the mutant Rhodobacter capsulatus hup– strain
(Ozturk et al., 2006).
Photobioreactors is termed as the technical systems for the production of the
phototrophic microorganisms (Pulz, 2001). They are classified according to the

4
differences in their geometry such as: flat panel and tubular according to their
position; horizontal, inclined, vertical or spiral and manifold connection and
serpentine, and with respect to operational modes such as: air or pump mixed, two-
phase reactors or multiphase reactors (Tredici, 2004). Air-lift reactors, bubble
columns and flat panels due to its simple construction and operation show clear
advantages as: the mass transfer is high in these systems and short liquid circulation
times can be obtained however, limited shear action and power input are necessary in
these photobioreactors for mixing, heat elimination and mass and light transfer
(Barbosa, 2003).
The photobioreactors are run in batch, continuous or fed-batch mode. Several
important control parameters are taken into account while running a photobioreactor
as: light intensity, temperature, pH, and biomass concentration, feed and feed rate.
Most of these parameters are related to each other and they affect the stability of the
continuous system. They need to be measured on-line, if possible.
In this research, the aim is to develop and to scale-up of solar panel
photobioreactors for the biological hydrogen production by photosynthetic purple
non sulfur (PNS) bacteria on artificial substrates and on real dark fermentation
effluent of molasses. The parameters studied are light intensity, temperature, feed
stock, feed rate, pH, cell concentration, light and dark cycle and carbon to nitrogen
ratio on hydrogen production. Continuous hydrogen production has been achieved on
artificial medium containing acetate and lactate by Rhodobacter capsulatus wild type
and an uptake hydrogenase deleted (hup-) mutant strain up to five months in panel
photobioreactors in indoor and outdoor conditions. In this photobioreactors
continuous hydrogen production was achieved by feeding. For scale up purposes, the
performance of 4 - 8 L panel photobioreactors has been compared with 20 L panel
photobioreactor. Various construction materials and designs for panel
photobioreactors were studied. Real dark fermentation effluent of molasses has been
used as feedstock as well as the defined medium. It can be utilized for growth and
hydrogen production by Rhodobacter capsulatus wild type and hup- mutant strains.
Besides it contains vitamins and minerals which is vital for biological activity of
microorganisms consequently there is no need to add additional nutrients. The
adjustment of the feedstock by dilution and buffer addition were found to be essential
5
for the long term stability of pH, biomass and H2 production for both in indoor and
outdoor applications. Na2CO3 can be used as buffer to keep the pH stable during long
term operation on the molasses dark fermentor effluent. Photofermentative hydrogen
production on dark fermentation effluent of the molasses has been achieved up to
five months in continuous outdoor panel photobioreactors by fed batch operation.
The seasonal changes in the climatic conditions such as light intensity and
temperature had a great effect on hydrogen productivity and yield. It has been
concluded that the carbon to nitrogen (C/N) ratio of the feedstock should be kept
within an optimal range for long term applications. Photobioreactor temperature was
controlled around 35 0C with chilled water passing through an internal cooling coil in
outdoor experiments. In outdoor conditions temperature control get the most
important parameter and it brings along with a cooling or a heating requirement.

6
CHAPTER 2
LITERATURE SURVEY
2.1. Hydrogen as the Future Energy Carrier
Since the beginning of the twenty-first century the limitations of the fossil
age with regard to the continuing growth of energy demand, the peaking mining rate
of oil, the growing impact of CO2 emissions on the environment and the dependency
of the economy in the industrialized world on the availability of fossil fuels became
very obvious. So, a major change in the energy economy from fossil energy carriers
to renewable energy fluxes is necessary (Züttel et al., 2010). The energy demand
according to the energy carriers over the last 200 years is shown in Figure 2.1. The
energy demand increased from 5 to 120 x 1012
kWhyr-1
in the last 200 years. Since
the steam engine was found in 1800ies the population of human beings increased by
a factor of 6, but the energy consumption increased by a factor of 80 and the
worldwide average continuous power consumption today is 2 kW per capita (Züttel
et al., 2010). Nevertheless the energy demand is supplied mostly (over 80%) by
fossil fuels (coal, oil, gas) and fuels make up approximately 67% of the global
energy market but in contrast global electricity demand occurs for only 33% (Hoffert
et al., 1998). The demand for fossil fuels has a strong impact on social, political and
economic interactions between the various countries. For example, two-thirds of the
crude oil reserves are located in the Middle East region, but most of it is consumed in
USA, Europe and Japan (Züttel et al., 2010). The development of oil price without
correction for inflation is shown in Figure 2.2. Since the World War 2, oil price
increase started with US oil peak then it continued with the Iran revolution, Iraq war
and the last economic crises.

7
Figure 2.1 Energy demand according to the energy carriers over the last 200 years.
Orange, renewables; red, nuclear fission; blue, hydro power; grey, natural gas; dark
grey, crude oil; black, coal; green, biomass (Züttel et al., 2010).
Figure 2.2 Development of the oil price without correction for inflation (Züttel et al.,
2010).

8
Because of the reasons mentioned above there is a great deal of effort made to
develop future hydrogen economy. Hydrogen has been identified as one of the most
promising fuels for the future (Abraham, 2002) because it is an excellent energy
carrier being the lightest, simplest and most abundant element in the universe. The
amount of energy produced during hydrogen combustion process (with a low heating
value on mass basis) is 2.4, 2.8 and 4 times higher than that of methane, gasoline and
coal, respectively (Marban et al., 2007). On combustion, it produces water as the
main product, thus considered a clean non-polluting fuel. The developing H2
economy is almost entirely dependent upon the use of carbon-based non-renewable
resources steam reformation of natural gas (approximately 48%), petroleum refining
(approximately 30%), coal gasification (18%) and nuclear powered water electrolysis
(4%) (Gregoire-Padro, 2005). This means that 90% of the H2 we use is currently
derived from fossil fuels (Hankamer et al., 2007). Hydrogen is a renewable fuel only
if it is produced directly from solar light or indirectly via electricity from a renewable
source, wind power, hydro power or biomass.
2.2. Hydrogen Production Technologies
There are several methods for producing hydrogen from both renewable and
non-renewable sources. Hydrogen production processes from non-renewable
resources such as natural gas, oil and coal is the most common way used up to now.
Among all the processes, steam reforming of natural gas and gasification of coal are
the most common methods used worldwide. However, considering the continuous
increase in oil consumption and having trouble on finding new oil reserves, it is
predicted that new energy sources other than fossil fuels have to be found as soon as
possible.
Hydrogen production processes from renewable sources is developing
abruptly in the last few decades. Biomass and water are used as substrates; wind and
hydro power, solar energy are used as energy sources in these new technologies.
There are several methods for converting biomass to hydrogen but biological
hydrogen production via dark and/or photo fermentation is the renewable developing
technology among the others. In fermentative hydrogen production processes

9
biomass or organic wastes are converted to H2 and CO2 under dark or illuminated or
radiated conditions. Water is used as substrate in electrolysis to be converted to H2
and O2 in addition to electrical current. Wind power, hydro power or solar energy
can be served as an energy source for electrolysis of water then the hydrogen
production via electrolysis became renewable.
2.3. Biological Hydrogen Production
Biological methods of hydrogen production (direct photolysis,
photofermentation, and dark fermentation processes) by microorganisms as
microalgae and cyanobacteria, photosynthetic purple bacteria or dark fermentative
bacteria are preferable to chemical methods because of the possibility to use sunlight,
CO2 and organic wastes as substrates for environmentally benign conversions, under
moderate conditions (Redwood et al., 2009). Table 2.1 shows the different biological
hydrogen production processes (Nath and Das, 2004).
Table 2.1 Biological Hydrogen Production Processes
Process Reactions Microorganism
Direct
Biophotolysis
2H2O H2 + O2 Microalgae
Cyanobacteria
Dark
fermentation C6H12O6+6H2O 12H2+2CH3COOH+2CO2
Fermentative
Bacteria
Photo
fermentation 2CH3COOH + 2H2O 4H2 + 2CO2
Photosynthetic
bacteria
2.3.1. Dark Fermentation
In dark fermentation process, biomass is converted to hydrogen, CO2 and
organic acids by thermophile dark fermentative bacteria. Fermentation reactions can
be operated at mesophilic (25 –40 0C), thermophilic (40–65
0C), extremely
thermophilic (65–80 0C), or hyperthermophilic (>80
0C) temperatures (Levin et al.,
2004). Production of hydrogen can be carried out by a wide variety of
hv
hv
10
microorganisms such as strict anaerobes (clostridia, ruminococci, and archaea),
facultative anaerobes (Escherichia coli and Enterobacteraerogenes) and aerobes
(e.g. Alcaligeneseutrophus and Bacillus licheniformis) when kept under anoxic
conditions (Nandi and Sengupta, 1998). Many types of organic compounds, ranging
from polymers to monomeric carbohydrates, fats and amino acids are known to be
sources for hydrogen (Claassen et al., 1999). With respect to the whole process of
thermophilic heterotrophic fermentation, the partial hydrogen pressure in the gas
phase should be kept low (<2 kPa), otherwise the growth rate may decline (Kelly
1988) and, depending on the strain, the product formation may shift from acetate to
lactate (Janssen and Morgan 1992) or to alanine (Kergen and Stams 1994), thus
decreasing the final yield of hydrogen per mole of glucose. At concentrations higher
than 2 kPa, hydrogen may even inhibit growth (Schröder et al., 1994; Schafer and
Schönheit, 1991). In addition to volatile fatty acids (VFAs), anaerobic fermentation
also leads to the formation of alcohols such as ethanol, butanol and lactate (Levin et
al., 2004).
The greatest challenge for fermentative biohydrogen is that the hydrogen
yield (%17) is low (Lee et al., 2010). To increase the H2 yield, combination of dark
fermentation and microbial electrolysis cells (MECs) can be applied by which the H2
yield can be improved up to 81% (9.6 moleH2/mole glucose) if the MEC can capture
80% of its donor–substrate electrons as H2 (Lee et al., 2010).
Dark fermentation systems are described with 2-4 orders of magnitude higher
hydrogen production rates than photofermentation and biophotolysis systems but at
very low substrate conversion efficiency and low H2 enrichment of biogas.
Photofermentation systems have the next highest production rates and outperform
dark fermentation in substrate conversion efficiency and purity of biogas. A dual
system of dark and photofermentation is promising and the production rates for dual
systems could theoretically be at least as productive as the most productive dark
fermentation system.

11
2.3.2. Photofermentation
In photofermentation process photosynthetic bacteria use organic acids as the
primary carbon source for photosynthetic growth and hydrogen production by
harvesting sunlight under anaerobic conditions. Photosynthetic bacteria are found to
be the most promising as compared to other microbial system mainly due to the
following reasons (Das and Basak, 2007):
(i) High substrate to product conversion yield
(ii) Lack of oxygen-evolving activity, which is desirable for
biohydrogen production
(iii) Ability to use a wide wavelength of light (400-950 nm)
(iv) Capability to use organic substrates (derived from wastes) for
hydrogen generation that also helps in the bioremediation process.
Photosynthetic bacteria are divided into two groups as purple sulfur and
purple non-sulfur bacteria. The purple sulfur bacteria are obligate anaerobic
autotrophs, which utilize H2, H2S, and elemental sulfur, whereas non sulfur
Rhodospirillum and Rhodopseudomonas could not use sulfur and are capable of
growing aerobically on organic substrate in absence of light (Nandi and Sengupta,
1998).
Rhodobacter capsulatus can grow in media over a pH range of 6.0-8.5 and
temperature range from 25 to 39.5 0C. Lactate was found to be readily utilizable and
acetate (+ CO2) is used by only after an “adaptation” period of 2 days (van Niel,
1944; Weaver et al., 1975). Furthermore photoheterotrophic growth of Rhodobacter
capsulatus supported by a number of organic substrates which include sugars,
pyruvate, fatty acids, and dicarboxylic acids of the citric acid cycle, however, it is not
supported with ethanol (+ CO2), glycerol (+ CO2), citrate, gluconate, mannose, or
tartrate (Weaver et al., 1975).
The formation of molecular hydrogen results from the reduction of protons
from an electron donor by hydrogenase and nitrogenase enzyme complex (Vignais et
al., 1985). The hydrogenase enzymes catalyze the following reversible reaction
which shows the reversible oxidation of molecular hydrogen.

12
2H+ + 2e
- H2 (2.1)
In the presence of H2 and an electron acceptor, hydrogenase will act as a H2
uptake enzyme; in the presence of an electron donor of low potential, it may use the
protons from water as electron acceptors and release H2 (Vignais et al., 2007).
Three different classes of hydrogenases have been identified so far: [Fe]-
hydrogenase, [NiFe]-hydrogenase, and [NiFeSe]-hydrogenase. In major cases, it is
evident that [NiFe]-hydrogenase is responsible for hydrogen uptake while [Fe]-
hydrogenase catalyzes the hydrogen production processes (Cammack, 1999). [Fe]-
hydrogenase is highly sensitive towards oxygen and possesses 100-fold more activity
than [NiFe]-hydrogenase (Adams 1990). However, nitrogenase enzyme is
responsible for producing hydrogen from protons and simultaneously fixing nitrogen
in the PNS bacteria. Nitrogenase produces H2 as a byproduct. Three different types
of nitrogenase have been identified so far, and their mode of hydrogen-producing
activity using ATP is given below (McKinlay and Harwood, 2010):
Mo-nitrogenase:
N2 + 8H+ + 8e
- + 16ATP 2NH3 + H2 + 16ADP + 16Pi (2.2)
Absence of N2:
8H+ + 8e
- + 16ATP 4H2 + 16ADP + 16Pi (2.3)
V-nitrogenase:
N2 + 12H+ + 12e
- + 24ATP 2NH3 + 3H2 + 24ADP + 24Pi (2.4)
Fe-nitrogenase:
N2 + 24H+ + 24e
- + 48ATP 2NH3 + 9H2 + 48ADP + 48Pi (2.5)
The resulting stoichiometry between N2 fixation and biohydrogen production
depends on the type of nitrogenase, varying from 1 mole H2 generated per mole N2
fixed by the common Mo-containing nitrogenase to 9 mole H2 per mole N2 in the
case of the highly O2-sensitive Fe-type nitrogenase (Lee et al., 2010).

13
In Rhodobacter capsulatus, Fe-nitrogenase is repressed by Mo, and its
expression relies on many of the same regulatory proteins that are used for Mo-
nitrogenase (Masepohl et al., 2002). Nitrogenase is rapidly repressed by nitrogen
compounds, such as NH3 because N2 fixing needs ATP to happen (Dixon and Kahn,
2004). For many purple non-sulfur bacteria, this repression can be bypassed by using
glutamate as the nitrogen source (Harwood, 2008).
Hydrogen production by purple non-sulfur bacteria is shown in Figure 2.3
(McKinlay and Harwood, 2010).
Figure 2.3 Hydrogen production by purple non-sulfur bacteria. UQ: Ubiquinone, PS:
photosystem, OR: oxidoreductase, Fd: ferrodoxin.
Electrons are transferred via ubiquinone (UQ) to the photosystem (PS) where
they are energized by light. Electrons are repeatedly energized and cycled through
the photosynthetic electron transport chain to produce a proton gradient. Energy from
the proton gradient is used to transfer electrons from the photosynthetic electron
transport chain to Ferrodoxin via oxidoreductases (OR). The proton gradient is also
used to generate ATP. Ferrodoxin and ATP are then used to generate H2 via
nitrogenase (N2ase).
Hydrogen evolution in this process is competitive with synthesis of
polyhydroxyalkanates and hydrogen recycling by uptake hydrogenase (hup)
(Tsygankov 2006). The PNS bacteria, Rhodobacter capsulatus, were recently
improved for hydrogen production by eliminating polyhydroxyalkanoate (PHA)
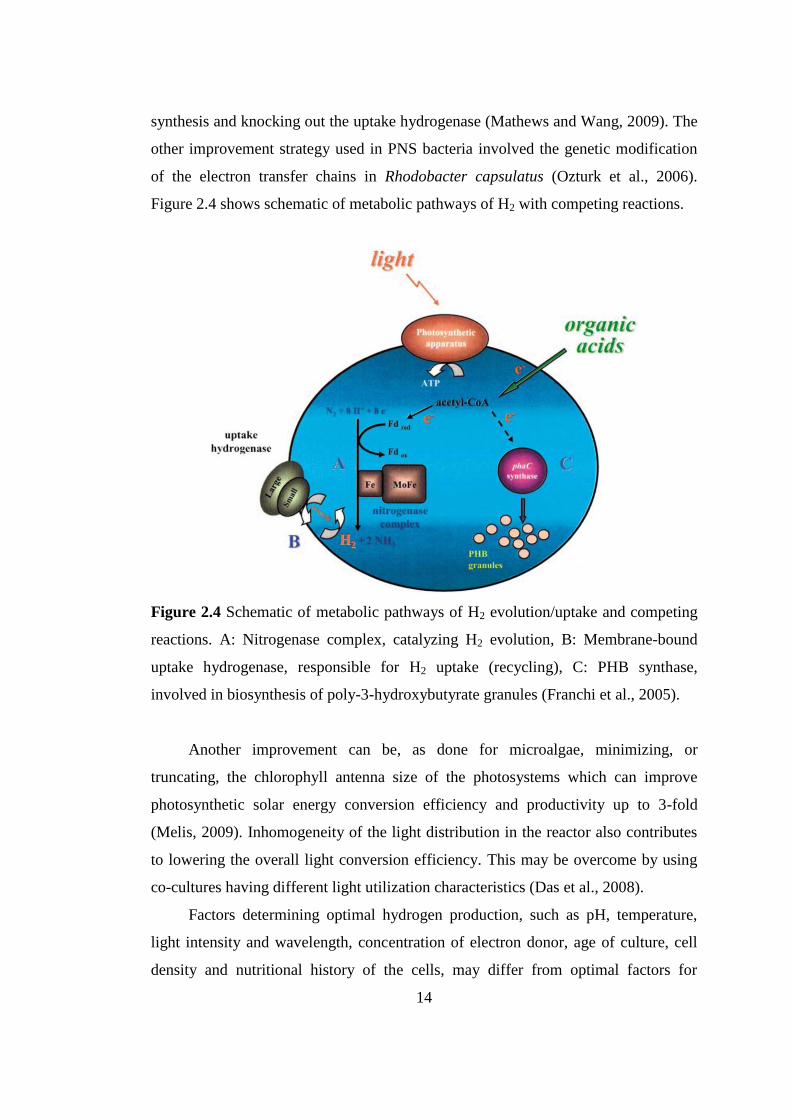
14
synthesis and knocking out the uptake hydrogenase (Mathews and Wang, 2009). The
other improvement strategy used in PNS bacteria involved the genetic modification
of the electron transfer chains in Rhodobacter capsulatus (Ozturk et al., 2006).
Figure 2.4 shows schematic of metabolic pathways of H2 with competing reactions.
Figure 2.4 Schematic of metabolic pathways of H2 evolution/uptake and competing
reactions. A: Nitrogenase complex, catalyzing H2 evolution, B: Membrane-bound
uptake hydrogenase, responsible for H2 uptake (recycling), C: PHB synthase,
involved in biosynthesis of poly-3-hydroxybutyrate granules (Franchi et al., 2005).
Another improvement can be, as done for microalgae, minimizing, or
truncating, the chlorophyll antenna size of the photosystems which can improve
photosynthetic solar energy conversion efficiency and productivity up to 3-fold
(Melis, 2009). Inhomogeneity of the light distribution in the reactor also contributes
to lowering the overall light conversion efficiency. This may be overcome by using
co-cultures having different light utilization characteristics (Das et al., 2008).
Factors determining optimal hydrogen production, such as pH, temperature,
light intensity and wavelength, concentration of electron donor, age of culture, cell
density and nutritional history of the cells, may differ from optimal factors for

15
growth. Therefore, separation of microbial growth and product formation has often
improved hydrogen production yields (Hillmer and Gest, 1977; Sasikala et al., 1993).
The biofilm technique has been proved to be an effective cell immobilization
method in the field of photobiological H2 production. For this purpose a groove-type
photobioreactor was developed and it was shown that a groove structure with large
specific surface area was beneficial to cell immobilization and biofilm formation of
the photosynthetic bacteria on photobioreactor surface as well as light penetration
(Zhang et al., 2010).
2.3.3. Integrated Systems
Integrated systems are better than any of the biological hydrogen production
systems as they combine advantages of each other and help overcome disadvantages.
This may lead to increased hydrogen yields. Producing hydrogen from complex
organic substrates present in municipal, agricultural, and industrial wastewaters can
be accomplished by a high yield through combination of dark and photofermentation.
Organic acids, principally acetate, produced during a first stage dark
fermentation of sugars (glucose, sucrose) to hydrogen, are converted to more
hydrogen at the second stage increasing the overall hydrogen yield.
In the first stage of the integration of dark and photofermentation that
molasses used as biomass the yield per mole of hexose has been found to be
maximally 4 mole of hydrogen as given in the following fermentation (Claassen et
al., 1999):
C6H12O6(l)+12H2O(l) 4H2(g)+2CO2(g)+2CH3COOH(l) (2.6)
The ∆G'o of this reaction is -206 kJ/mole, which is sufficient to allow
microbial growth (Claassen et al., 1999).
In the photofermentation stage the yield per mole of hexose has been found to
be maximally 8 mole of hydrogen as given in the following fermentation:
2CH3COOH(l) + 4H2O(l) 8H2(g) + 4CO2(g) (2.7)
hv

16
The ∆G'o of this reaction is +104.6 kJ/mole. This thermodynamic barrier is
overcome by light energy.
Another three component proposal is shown in Figure 2.5 that includes dark
fermentation, oxygenic and anoxygenic fermentation (Melis and Melnicki, 2006).
Figure 2.5 Three-component integrated biological system for H2 production.
As shown in Figure 2.6, the role of the photobioreactors is to produce H2,
using both oxygenic and non-oxygenic photosynthesis, and to accumulate cell
biomass. The biomass is then used as substrate for dark fermentation by microbes
that are able to convert it into H2 and CO2, while waste organic acids from the latter
are fed back into the photobioreactors to stimulate biomass accumulation (Ghirardi et
al., 2008).
Immobilized-cell systems have also an alternative to suspended-cell systems
in continuous operations for enhanced biohydrogen production because they are
capable of maintaining higher biomass concentrations and could operate at higher
dilution rates without biomass washout (Show et al., 2008). Biomass immobilization
can be achieved through forming granules, biofilm, or gel-entrapped bioparticles,
which have been employed in different reactor systems (Zhang et al., 2008).
2.4. Flat Panel Photobioreactors
A flat panel photobioreactor (PBR) consists of a frame covered by a
transparent plate on both sides (Gebicki et al., 2009). Flat plate photobioreactors
17
were first described in the 1980s (Samson and Leduy, 1985) and thereafter
researched and developed by Tredici et al. (1991) and Tredici and Materassi (1992).
Vertical flat type PBRs has important advantages for mass production of
photoautotrophic microorganisms because lamination of the culture in correct
orientation to the light source is the best mode by which to expose a culture to
illumination (Richmond and Cheng-Wu, 2001). Flat plates can be easily cleaned
from both outside and inside (Cheng-Wu et al., 2001) so the operational costs
decreases and the life of the photobioreactor extends.
The efficiency of a PBR is determined by the integration of: light capturing,
light transportation, light distribution, and light usage (Zijffers et al., 2008). In
addition to efficient use of light, controlled temperature, well defined feeding rate,
cooling procedure and mixing potential of the photobioreactors are also the critical
parameters for a high performance and long term study.
2.4.1 Temperature Distribution
Temperature distribution on the surface of the PBR is highly related with the
light intensity and orientation of the PBR according to the light sources. If the PBR is
illuminated by an artificial light source (a lamp) the light intensity distribution on the
surface of the PBR may not be uniform. This results in insufficiently illuminated
areas on the surface, especially at the edges of the photobioreactor. When PBRs are
illuminated from both sides, more uniform light intensity distribution can be
achieved however, temperature distribution may not be uniform. The temperature
especially at the center of the PBR may be higher than that at the edges.
In outdoor experiments light source is the sun and PBRs are illuminated more
effectively because the exposed light to the surface of the PBR is more uniform so
the temperature distribution on the surfaces are closely related to the angle of the
impinging light on the reactor surface. Parallel plates placed in an east-west-facing
orientation that the distance between the plates is not narrow are an effective method
for a homogeneous temperature distribution on the surfaces (Zhang et al., 2001).

18
2.4.2 Light Intensity Distribution
The light energy that is absorbed by the microorganism has several
destinations. In case of purple non-sulfur bacteria producing hydrogen
photoheterotrophically, these are:
(1) Biomass growth,
(2) Biomass maintenance,
(3) Hydrogen generation, and
(4) Photosynthetic heat dissipation (Hoekama et al., 2006).
At high densities, self-shading causes the light to be progressively dissipated
as it passes through the culture until, at bottom, there is complete darkness; this
partially compensates for the limitation imposed by the light saturation effect
(Tredici et al., 1998). That spatial light dilution causing more light to be available to
the single cell is demonstrated by the higher productivity and lower pigment content
that characterize cultures illuminated from both sides (Tredici and Zitelli, 1998). The
effect of doubling illumination from either one to both sides, decreases, as expected,
light conversion efficiency, but is made up by increasing productivity (Zitelli et al.,
2000). Flat panel photobioreactors run in three or four parallel plates side by side, the
distance between the plates should not be narrow because shading always influences
irradiance levels on the surface of flat panel reactors that are close together (Pulz et
al., 1995). To prevent exponential decrease in the energy of light passing through an
absorbing medium the light path of the photobioreactor should be short (Tsygankov,
2000). Generating turbulence in photobioreactors provides moving the culture cells
in and out of the light (Weissman et al., 1987) so it enforced the homogeneous light
distribution in the reactor and with it the light utilization (Meiser et al., 2004).
2.4.3 Feeding, Cooling and Mixing
Stabilizing the cell concentration, obtaining constant substrate, nutrient and
buffer concentrations in the photobioreactor are the purposes of feeding. Biomass
concentration in the photobioreactor increases at low dilution rates, and vice versa
(Samson and Leduy, 1985). Moreover, feeding provides new substrate, nutrients for
19
the microorganism so continuous product formation can be obtained. By continuous
feeding the pH in the photobioreactor can be stabilized with buffer addition. High
dilution rates also prevent biofilm formation on the surface of the photobioreactor
but it can also lead to washout. Recycling of culture suspension increases
productivity of the photobioreactor (Samson and Leduy, 1985).
In mesophilic systems culture temperature is an important parameter to be
controlled in outdoor conditions. Water-spray systems are often used to avoid
overheating. However, the cooling capacity of spray systems is limited and its
application is only possible under certain environmental conditions. So another
cooling apparatus is necessary to control the temperature in the photobioreactor.
Sierra et al. (2008) stated that the heat transfer coefficient of the internal heat
exchanger is much higher than the coefficient of the external surface of the reactor.
So the internal heat exchangers are useful to control the temperature of the culture in
flat panel photobioreactors. A cooling coil inserted into the photobioreactor is the
most efficient method in outdoor conditions to control the temperature.
Vigorous mixing of the culture suspension increases the flashing-light effect,
facilitates movement of produced gas through the photobioreactor, and prevents the
possibility of concentration gradient in the photobioreactor that’s why the
productivity increases (Zhang et al., 2002). A modicum of turbulence can prevent
stratification which could expose for long periods (presumably tens to hundreds of
seconds) to high irradiance (Weismann et al., 1987). However, mixing leads to
higher running costs. Besides, higher mixing rates may cause cell damage. The flat
panel photobioreactors are not suitable for mechanical mixing from inside because
their light path is too narrow for an agitator. On the other hand mixing with
compressed gasses is very effective in panel photobioreactors.
2.4.4 Application of Flat Panel Photobioreactors
First flat panel photobioreactor were described by Samson and Leduy(1985)
and by Ramos de Ortega (1986) and much researched by Tredici et al. (1991), who
introduced the idea to make reactors from commercially available panels of

20
transparent sheets partitioned to form alveoli-narrow internal channels (Hu et al.,
1996).
Kim et al. (1982a) studied on batch hydrogen production by Rhodobacter
sphaeroides in two panel photobioreactors of 33 L for 25 days in outdoor conditions.
One of these photobioreactors (Culture A) was placed vertically to the ground and
the other (Culture B) was inclined at 30 0C to receive more sunlight. At the end of 25
days of hydrogen production rate was 0.021 LH2/Lc.h in culture A and 0.023
LH2/Lc.h in culture B.
Kim et al. (1987a) studied semi-continuous hydrogen production in a flat
panel photobioreactor of 6 L for 47 days in outdoor conditions. Hydrogen production
rate of 47 days of the experiment was 0.049 LH2/Lc.h.
Kitajima et al. (1998) examined the effect of reactor depth with agitation on
the course of hydrogen production by Rhodobacter sphaeroides RV on lactate for 15
days in batch indoor experiments under simulated condition of solar energy by 12
hours light 12 hours dark cycle using five cylindrical plane type PBR with different
depths (1, 3, 5, 10, 20cm). Light receiving area in this photobioreactors was 490 cm2.
Hydrogen productivity in the photobioreactors according to the depths were 0.019,
0.042, 0.022, 0.0054, 0.00046 LH2/Lc.h, respectively.
Modigell and Holle (1998) studied on the reactor development to determine
the influence of light, irradiation, substrate source and concentration, and operational
mode on hydrogen production by Rhodospirillum rubrum with a modular outdoor
bioreactor in the form of hollow channel plates made of acrylic glass that are
connected at the top and at the bottom to form a loop and erected vertically and
placed at east-west position. Constant hydrogen production was observed with
exchange of the half of the medium every fifth day for almost two months. In this
study maximum hydrogen production was reached to 2 LH2/m2.h.
Arai et al. (1998) investigated hydrogen production by Rhodobacter
sphaeroides RV using lactate and propionate as carbon sources. They used outdoor
flat bioreactors. The experiments were held in winter season in Japan, from October
1994 to March 1995. The bioreactors were made of acrylic resin and had the
irradiated area of 20 x 44 cm2, with inner thickness of 5 cm and capacity of 4.4 L.
Under an average outer temperature of 13.4 0C during 30 days from November to

21
December 1994, hydrogen production rate was 0.0125 LH2/Lc.h. In the middle of
winter of 1995, the average temperature was 5.2 0C and hydrogen production rate
achieved was 0.15 LH2/Lc.h.
Miyake et al (1999a) studied simulation of a daily sunlight illumination
pattern for photobiological hydrogen production by Rhodobacter sphaeroides RV on
lactate in indoor and outdoor panel photobioreactors with an irradiation area of 159
cm2, a working volume of 0.7 L and a 4.5 cm light path. The experiments, 3 batch
cultures, were carried out over a 3 day period in August 14 to 17 in 1996, Tsukuba,
Japan. From sunrise to sunset, the orientation of the photobioreactor was adjusted
every 30 min in a southward-facing direction at an angle of 300 from the horizontal
plane. The light intensity was increased then decreased in 12 hours in 1, 3 and 6 steps
in order to simulate daylight. Maximum hydrogen production rates for outdoor and
indoor (in 1 step) experiments were 0.042, 0.049 LH2/Lc.h.
Hoekama et al (2002) studied anaerobic photoheterotrophic cultivation of
Rhodopseudomonas sphaeroides HCC 2037 on acetate in a 2.4 L pneumatically
agitated flat panel photobioreactor with gas re-circulation in indoor conditions. In
this study it was cleared that pneumatic agitation with nitrogen or argon inhibits
bacterial growth at any flow rate between 0.33 and 6.66 LL-1
.min-1
.
Hoekama et al (2006) studied photosynthetic efficiency of photoheterotrophic
formation of hydrogen from acetate by Rhodobacter capsulatus NCIMB 11773 in a
panel type PBR with a working volume of 2.4 L in indoor conditions. They
developed a model for unsteady state behavior of the system from D-stat
experiments. They predicted from their model that hydrogen production rate could
possibly be increased up to 2.2 mmolesH2/Lc.h if biomass concentration is 4.4
gdcw/Lc.
Eroglu et al (2008) studied performance of an 8 L flat panel solar bioreactor
on hydrogen production by Rhodobacter sphaeroides O.U.001 using malate, acetate,
lactate and olive mill wastewater as carbon sources in a cooled solar bioreactor
which has a working volume of 6.5 L. Maximum hydrogen production obtained in
outdoor conditions according to the substrates were 0.010, 0.008, 0.002, 0.003
LH2/Lc.h.

22
Uyar et al (2008) also studied on performance of scaling up of panel
photobioreactor made of acrylic sheets and PVC frame on hydrogen production by
Rhodobacter capsulatus DSM 155 in indoor conditions. The photobioreactors were
illuminated by 500 W halogen lamps at a distance of 90 cm. Acetate and lactate were
used as carbon sources in these batch experiments. Average hydrogen productivity
obtained in the 5 L and 25 L photobioreactor was 0.0061, 0.0065 LH2/Lc.h,
respectively.
Androga et al (2009) studied on continuous hydrogen production by wild
type, mutant and heat adapted strains of Rhodobacter capsulatus DSM 1710 in 8 L
panel photobioreactor which were carried out in semi-continuous mode in indoor and
outdoor conditions in winter 2008, Ankara, Turkey. In all experiments
photobioreactors were placed perpendicular to the horizontal plane. In indoor
experiments photobioreactors were illuminated with tungsten lamps. In outdoor
conditions maximum hydrogen productivity (0.009 LH2/Lc.h) was obtained by
Rhodobacter capsulatus hup- on acetate for 25 days. In indoor conditions the
maximum hydrogen productivity (0.018 LH2/Lc.h) was obtained by Rhodobacter
capsulatus hup- on 40 mM acetate and 4 mM glutamate for 12 days.
Gebicki et al (2010) investigated the flat panel and tubular reactors in outdoor
conditions in Germany in the summertime for their applicability for H2 production by
means of purple non-sulfur bacteria Rhodobacter capsulatus. Four parallel
photobioreactors (25 L) were installed on a construction vertically so the total
volume of the photobioreactors reached to 100 L. All the experiments were
performed as fed-batch. The mean hydrogen productivity for panel photobioreactor
was 0.025 LH2/Lc.h while 8 m2 of the illuminated reactor surface of the panel reactor
could be installed on 1 m2 of ground space.
The hydrogen productivity, operational conditions and operating modes of the
panel photobioreactors studied in indoor and outdoor conditions on different
substrates by PNS bacteria in the literature is summarized in Table 2.2.

23
Tab
le 2
.2 H
ydro
gen
pro
duct
ivit
ies,
oper
atio
nal
condit
ions
and o
per
atin
g m
odes
of
the
pan
el p
hoto
bio
reac
tors
stu
die
d i
n i
ndoor
and o
utd
oor
condit
ions
on m
alat
e, a
ceta
te, la
ctat
e an
d o
live
mil
l w
aste
wat
er b
y P
NS
bac
teri
a in
the
lite
ratu
re
Ref
. B
act
eria
S
ub
stra
te
PB
R
Volu
me
(L)
Op
erati
on
al
Con
dit
ion
s
Op
erati
ng
Mod
e
Du
rati
on
(days)
Pro
du
ctiv
ity
(LH
2/(
Lc.h
)
Pro
du
ctiv
ity
(mm
ole
sH2/(
Lc.h
)
Kim
et
al.
1982
Rb. sp
haer
oid
es
B5/A
L
acta
te
Pan
el
33
Outd
oor
Bat
ch
25
0.0
21
0.9
3
Kim
et
al.
1982
Rb. sp
haer
oid
es
B5/B
L
acta
te
Pan
el
33
Outd
oor
Bat
ch
25
0.0
24
1.0
6
Kim
et
al.
1987
Rb. sp
haer
oid
es
B6
L
acta
te
Pan
el
6
Outd
oor
Sem
i-
Conti
nuous
47
0.0
49
2.1
9
Kit
ajim
a et
al.
1998
Rb. sp
haer
oid
es
RV
L
acta
te
Pan
el
0.5
In
doo
r B
atch
9
0.0
19
0.8
9
Kit
ajim
a et
al.
1998
Rb. sp
haer
oid
es
RV
L
acta
te
Pan
el
1.5
In
doo
r B
atch
9
0.0
42
1.8
8
Kit
ajim
a et
al.
1998
Rb. sp
haer
oid
es
RV
L
acta
te
Pan
el
2.5
In
doo
r B
atch
15
0.0
22
0.9
7
Kit
ajim
a et
al.
1998
Rb. sp
haer
oid
es
RV
L
acta
te
Pan
el
5
Indoo
r B
atch
15
0.0
054
0.2
4
Kit
ajim
a et
al.
1998
Rb. sp
haer
oid
es
RV
L
acta
te
Pan
el
10
Indoo
r B
atch
15
0.0
0046
0.0
21
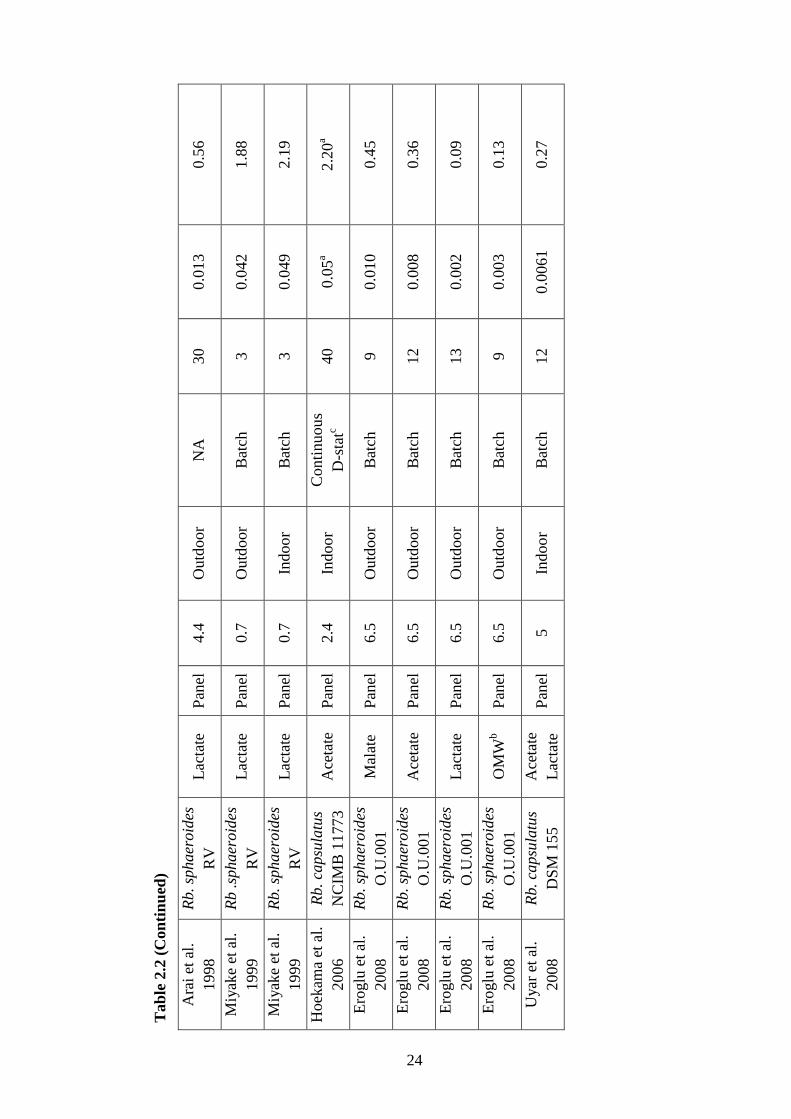
24
Tab
le 2
.2 (
Con
tin
ued
)
Ara
i et
al.
1998
Rb. sp
haer
oid
es
RV
L
acta
te
Pan
el
4.4
O
utd
oor
NA
30
0.0
13
0.5
6
Miy
ake
et a
l.
1999
Rb .sp
haer
oid
es
RV
L
acta
te
Pan
el
0.7
O
utd
oor
Bat
ch
3
0.0
42
1.8
8
Miy
ake
et a
l.
1999
Rb. sp
haer
oid
es
RV
L
acta
te
Pan
el
0.7
In
doo
r B
atch
3
0.0
49
2.1
9
Hoek
ama
et a
l.
2006
Rb. ca
psu
latu
s
NC
IMB
11773
A
ceta
te
Pan
el
2.4
In
doo
r C
onti
nuous
D-s
tatc
40
0.0
5a
2.2
0a
Ero
glu
et
al.
2008
Rb. sp
haer
oid
es
O.U
.001
Mal
ate
Pan
el
6.5
O
utd
oor
Bat
ch
9
0.0
10
0.4
5
Ero
glu
et
al.
2008
Rb. sp
haer
oid
es
O.U
.001
Ace
tate
P
anel
6.5
O
utd
oor
Bat
ch
12
0.0
08
0.3
6
Ero
glu
et
al.
2008
Rb. sp
haer
oid
es
O.U
.001
Lac
tate
P
anel
6.5
O
utd
oor
Bat
ch
13
0.0
02
0.0
9
Ero
glu
et
al.
2008
Rb. sp
haer
oid
es
O.U
.001
OM
Wb
Pan
el
6.5
O
utd
oor
Bat
ch
9
0.0
03
0.1
3
Uyar
et
al.
2008
Rb. ca
psu
latu
s
DS
M 1
55
Ace
tate
Lac
tate
P
anel
5
Indoo
r B
atch
12
0.0
061
0.2
7
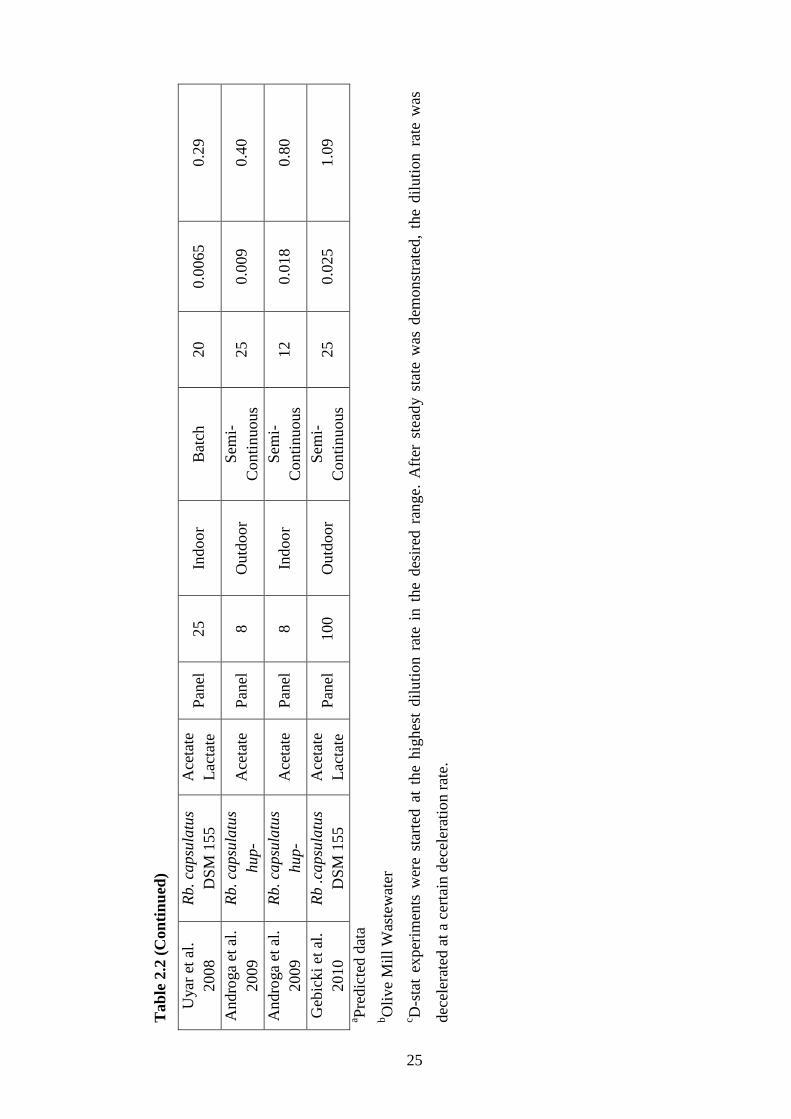
25
Tab
le 2
.2 (
Con
tin
ued
)
Uyar
et
al.
2008
Rb. ca
psu
latu
s
DS
M 1
55
Ace
tate
Lac
tate
P
anel
25
Indoo
r B
atch
20
0.0
065
0.2
9
Andro
ga
et a
l.
2009
Rb. ca
psu
latu
s
hup-
Ace
tate
P
anel
8
Outd
oor
Sem
i-
Conti
nuous
25
0.0
09
0.4
0
Andro
ga
et a
l.
2009
Rb. ca
psu
latu
s
hup-
Ace
tate
P
anel
8
Indoo
r S
emi-
Conti
nuous
12
0.0
18
0.8
0
Geb
icki
et a
l.
2010
Rb .ca
psu
latu
s
DS
M 1
55
Ace
tate
Lac
tate
P
anel
100
Outd
oor
Sem
i-
Conti
nuous
25
0.0
25
1.0
9
a Pre
dic
ted d
ata
bO
live
Mil
l W
aste
wat
er
c D-s
tat
exper
imen
ts w
ere
star
ted a
t th
e hig
hes
t dil
uti
on r
ate
in t
he
des
ired
ran
ge.
Aft
er s
tead
y s
tate
was
dem
onst
rate
d,
the
dil
uti
on
rat
e w
as
dec
eler
ated
at
a ce
rtai
n d
ecel
erat
ion r
ate.
26
2.4.5 Scale-up of the Panel Photobioreactors
For the successful scale-up of the photobioreactors, the efficiency at which
(solar) light energy is directed to biomass growth and hydrogen production is the
most important optimization parameter (Hoekama et al., 2002). It is also necessary to
consider the plant design, material cost, strength of the reactor to achieve a high-
performance pilot scale device (Zhang et al., 2002).
In an application, the flat panel photobioreactors were scaled up to 1 m in
both height and width (Janssen et al., 2002) in order to reduce deflection of the plates
and to guarantee the gas-tightness of the enclosed volume (Gebicki et al., 2009).
Large-scale photobioreactors that can be operated under fixed and optimal
conditions with strong possibilities for sterilization, and with contamination risks that
are as low as possible remain to be developed in the future (Janssen et al., 2002).
Uyar et al (2008) studied with the largest (25 L) flat panel photobioreactor
made of PMMA and PVC frame for photobiological hydrogen production by
Rhodobacter capsulatus in batch experiments. The mean hydrogen productivity was
0.0065 LH2/Lc.h in the scale-up of photofermentation process up to 25 L on
acetate/lactate/glutamate (40/7.5/2 mM) medium.
Gebicki et al (2010) was also studied with 25 L panel photobioreactors in fed
batch mode in outdoor conditions in Germany for H2 production by Rhodobacter
capsulatus DSM 155. In this study four parallel photobioreactors (25 L) were
installed on a construction vertically so the total volume of the photobioreactors
reached up to 100L. The mean hydrogen productivity obtained in this experiment
was 0.025 LH2/Lc.h.
2.5 Objective of the Study
In this research, the aim is to develop and to scale-up solar panel
photobioreactors for the biological hydrogen production by photosynthetic purple
non sulfur (PNS) bacteria on artificial substrates and on real dark fermentation
effluents of molasses. The parameters studied are light intensity, temperature, feed
stock, feed rate, pH, cell density, light and dark cycle and C/N ratio on hydrogen
production. Continuous hydrogen production has been achieved on artificial medium

27
containing acetate and lactate by Rhodobacter capsulatus wild type and an uptake
hydrogenase deleted (hup-) mutant strain in panel photobioreactors in indoor and
outdoor conditions by fed batch operation. For scale up purposes, the performance of
4 - 8 L panel photobioreactors has been compared with 20 L panel photobioreactor.
Real dark fermentation effluent of molasses has been used as feedstock as well as the
defined medium. The adjustment of the feedstock by dilution and buffer addition
were found to be essential for the long term stability of pH, biomass and H2
production for both in indoor and outdoor applications. Photofermentative hydrogen
production on dark fermentation effluent of molasses has been achieved up to five
months in continuous outdoor panel photobioreactors. The seasonal changes in the
climatic conditions such as light intensity and temperature had a great effect on
hydrogen productivity and yield. It has been concluded that the carbon to nitrogen
(C/N) ratio of the feedstock should be kept within an optimal range for long term
applications. Na2CO3 can be used as buffer to keep the pH stable during long term
operation on the molasses dark fermentor effluent. Sugar and the other nutrients in
the dark fermentor effluent of molasses were also utilized for biomass growth by Rb.
capsulatus hup- strain.

28
CHAPTER 3
MATERIALS and METHODS
3.1 The Microorganism
Rhodobacter capsulatus wild type (DSM 1710) strain which is obtained from
DSMZ (Deutsche Sammlung von Mikroorganismen und Zellkulturen GmbH –
German Collection of Microorganisms and Cell Cultures, Germany). Rhodobacter
capsulatus hup- which is a mutant strain lack of uptake hydrogenase enzyme that
was genetically modified by Dr. Yavuz Ozturk (GMBE, TUB_TAK-MAM, Gebze)
from Rhodobacter capsulatus MT1131 (Ozturk et al., 2006).
3.2 Culture Media
The culture media are classified as growth and hydrogen production media.
3.2.1 Growth Media
For growth of Rhodobacter capsulatus the modified form of the minimal
medium of the Biebl and Pfennig (1981) which contained vitamins, trace elements
and iron citrate in addition to acetic acid (20 mM) and sodium glutamate (10 mM)
without ammonium chloride and yeast extract was used. The complete components
of the minimal medium of the Biebl and Pfennig (1981) and the growth medium are
given in Appendix A.1 and A.2, respectively. The recipe of the trace elements,
vitamin and Fe-citrate solutions are given in Appendix A.4, A.5, A.6, respectively.
To prepare the medium firstly the ingredients were dissolved in distilled
water in a 1 liter glass bottle with plastic crown cap resistant to high temperatures,
secondly the pH of the medium was set to 6.3 and 6.4 by adding 5 mM NaOH. The
bottle is shown in Figure 3.1. Then the glass bottle containing the media was put in
the autoclave (Prior Clave) with leaving the cap a little bit open. Later the medium
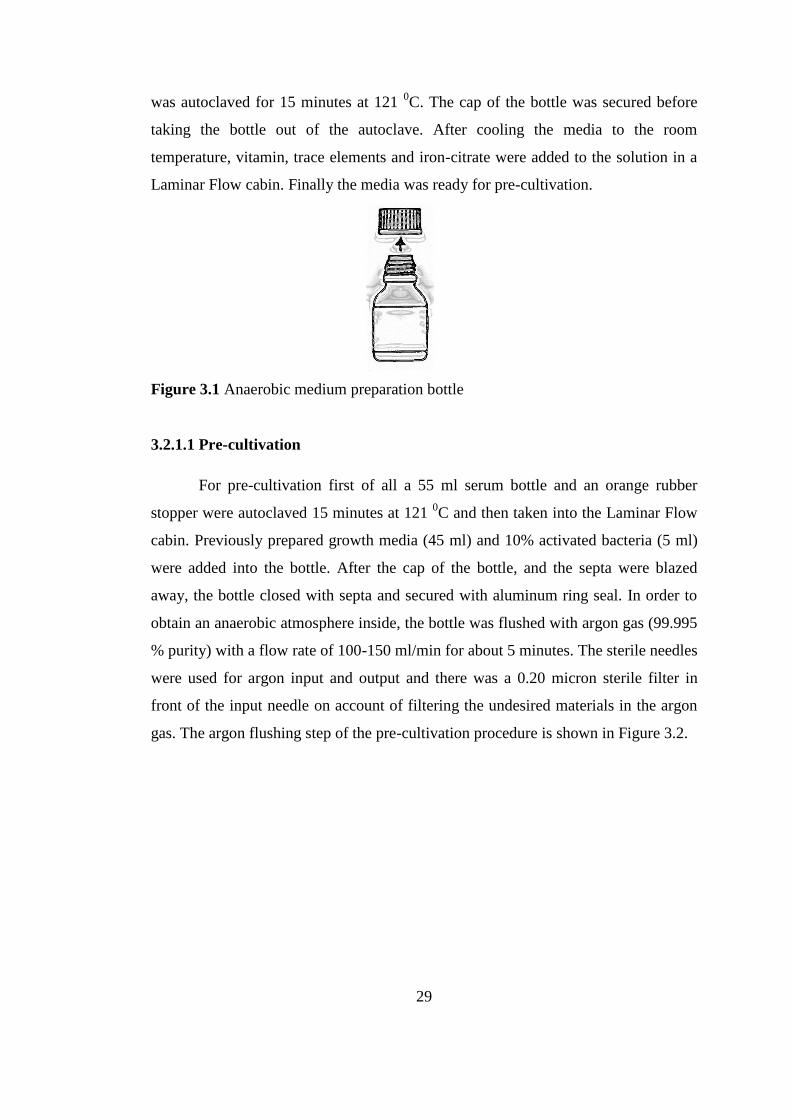
29
was autoclaved for 15 minutes at 121 0C. The cap of the bottle was secured before
taking the bottle out of the autoclave. After cooling the media to the room
temperature, vitamin, trace elements and iron-citrate were added to the solution in a
Laminar Flow cabin. Finally the media was ready for pre-cultivation.
Figure 3.1 Anaerobic medium preparation bottle
3.2.1.1 Pre-cultivation
For pre-cultivation first of all a 55 ml serum bottle and an orange rubber
stopper were autoclaved 15 minutes at 121 0C and then taken into the Laminar Flow
cabin. Previously prepared growth media (45 ml) and 10% activated bacteria (5 ml)
were added into the bottle. After the cap of the bottle, and the septa were blazed
away, the bottle closed with septa and secured with aluminum ring seal. In order to
obtain an anaerobic atmosphere inside, the bottle was flushed with argon gas (99.995
% purity) with a flow rate of 100-150 ml/min for about 5 minutes. The sterile needles
were used for argon input and output and there was a 0.20 micron sterile filter in
front of the input needle on account of filtering the undesired materials in the argon
gas. The argon flushing step of the pre-cultivation procedure is shown in Figure 3.2.
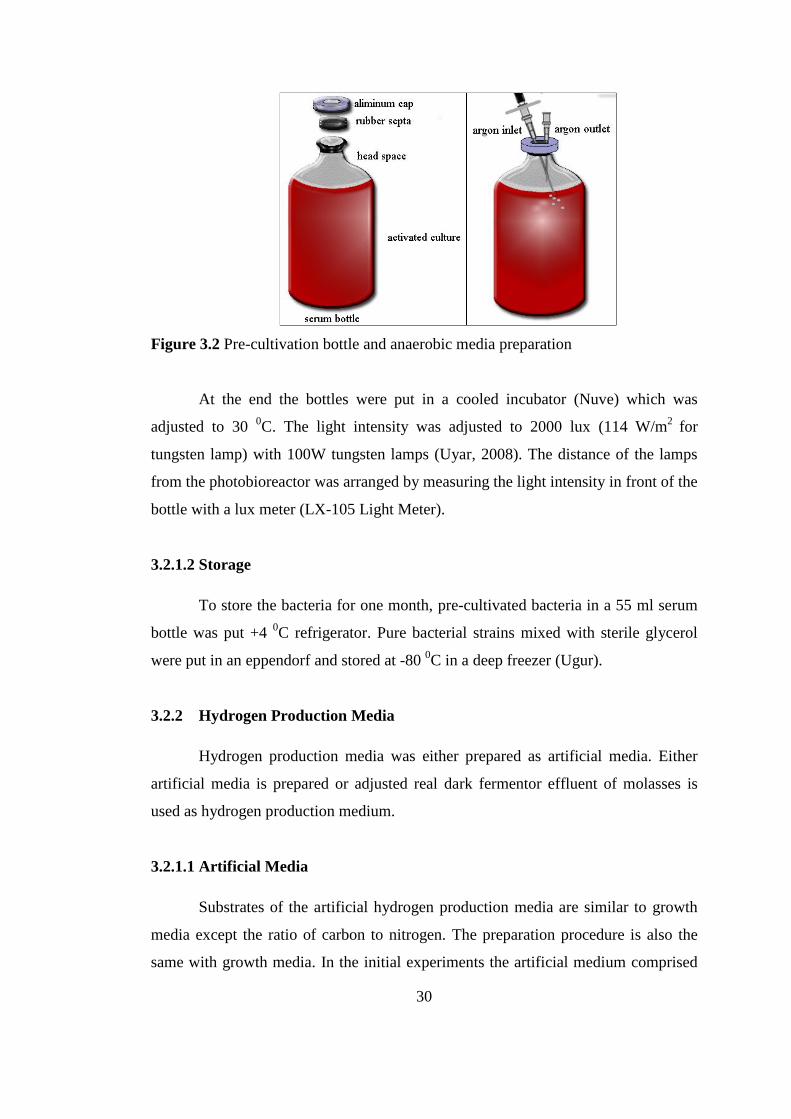
30
Figure 3.2 Pre-cultivation bottle and anaerobic media preparation
At the end the bottles were put in a cooled incubator (Nuve) which was
adjusted to 30 0C. The light intensity was adjusted to 2000 lux (114 W/m
2 for
tungsten lamp) with 100W tungsten lamps (Uyar, 2008). The distance of the lamps
from the photobioreactor was arranged by measuring the light intensity in front of the
bottle with a lux meter (LX-105 Light Meter).
3.2.1.2 Storage
To store the bacteria for one month, pre-cultivated bacteria in a 55 ml serum
bottle was put +4 0C refrigerator. Pure bacterial strains mixed with sterile glycerol
were put in an eppendorf and stored at -80 0C in a deep freezer (Ugur).
3.2.2 Hydrogen Production Media
Hydrogen production media was either prepared as artificial media. Either
artificial media is prepared or adjusted real dark fermentor effluent of molasses is
used as hydrogen production medium.
3.2.1.1 Artificial Media
Substrates of the artificial hydrogen production media are similar to growth
media except the ratio of carbon to nitrogen. The preparation procedure is also the
same with growth media. In the initial experiments the artificial medium comprised
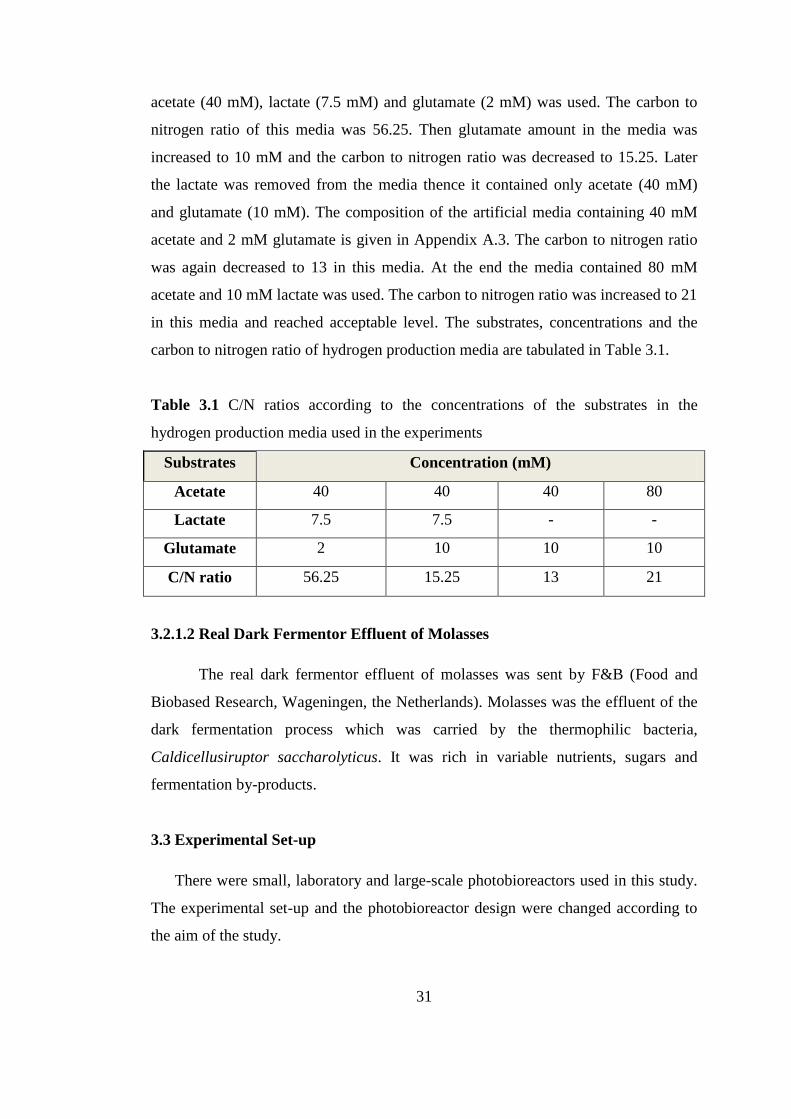
31
acetate (40 mM), lactate (7.5 mM) and glutamate (2 mM) was used. The carbon to
nitrogen ratio of this media was 56.25. Then glutamate amount in the media was
increased to 10 mM and the carbon to nitrogen ratio was decreased to 15.25. Later
the lactate was removed from the media thence it contained only acetate (40 mM)
and glutamate (10 mM). The composition of the artificial media containing 40 mM
acetate and 2 mM glutamate is given in Appendix A.3. The carbon to nitrogen ratio
was again decreased to 13 in this media. At the end the media contained 80 mM
acetate and 10 mM lactate was used. The carbon to nitrogen ratio was increased to 21
in this media and reached acceptable level. The substrates, concentrations and the
carbon to nitrogen ratio of hydrogen production media are tabulated in Table 3.1.
Table 3.1 C/N ratios according to the concentrations of the substrates in the
hydrogen production media used in the experiments
Substrates Concentration (mM)
Acetate 40 40 40 80
Lactate 7.5 7.5 - -
Glutamate 2 10 10 10
C/N ratio 56.25 15.25 13 21
3.2.1.2 Real Dark Fermentor Effluent of Molasses
The real dark fermentor effluent of molasses was sent by F&B (Food and
Biobased Research, Wageningen, the Netherlands). Molasses was the effluent of the
dark fermentation process which was carried by the thermophilic bacteria,
Caldicellusiruptor saccharolyticus. It was rich in variable nutrients, sugars and
fermentation by-products.
3.3 Experimental Set-up
There were small, laboratory and large-scale photobioreactors used in this study.
The experimental set-up and the photobioreactor design were changed according to
the aim of the study.

32
3.3.1 Small-Scale Experiments
3.3.1.1 Photobioreactors
Small-scale experiments were studied in indoor conditions and operated in
batch or continuous modes. Glass bottles were used as photobioreactors and the
volumes of the photobioreactors were varied from 55 ml to 500 ml. In these small-
scale experiments the evolved gas was collected by water displacement method in a
glass tube which was 40 ml. The connection between the photobioreactors and the
gas collection tubes were provided with capillary tubing. The experimental set up of
the small-scale experiments is shown in Figure 3.3.
Figure 3.3 Experimental set-up of small-scale experiments
3.3.1.2 Sterilization of the Photobioreactors and Media
The photobioreactors and the hydrogen production media were autoclaved for
15 minutes at 121 0C for sterilization.

33
3.3.1.3 Start-up
The photobioreactors were started up in a Laminar Flow cabin. First of all
40% of the bottle filled with hydrogen production media then 10% activated bacteria
were added. The bottle was closed and then shook vigorously for assure mixing.
Then the cap was opened in order to take start-up sample (5 ml). Then again the
bottle was closed very tightly. After flushing the bottle with argon gas it was put into
the incubator.
3.3.1.4 Temperature Indication and Control
The photobioreactors were put in a heating-cooling incubator in this way the
temperature of the photobioreactors could be kept constant at 30 0C. Even so a
portable temperature probe was also put in the incubator in order to check the
temperature.
3.3.1.5 Light Intensity Measurements
The light intensity of the photobioreactors was adjusted to 2000 lux (114
W/m2) with two 100 W tungsten lamps.
3.3.1.6 Sampling and Feeding
Every day 5 ml samples were taken from the photobioreactor for analysis.
The cap of the photobioreactor was not open during the sampling operation and
sterile syringes were used. Primarily 5 ml sample were taken from the
photobioreactor. Then the equivalent amount media -in batch operations distilled
water and in continuous operations the hydrogen production medium- were given
into the photobioreactor.
3.3.1.7 Shut down
At the end of the experiments after taking the last sample from the
photobioreactor 3% hydrogen peroxide was added to the photobioreactor. After
ensuring that the biological activity in the photobioreactor was exhausted the waste

34
in the photobioreactor was poured out to the drainage. Then the empty
photobioreactor was sterilized with 3% hydrogen peroxide again.
3.3.2 Experiments with Panel Photobioreactors
3.3.2.1 Experimental Set-up
The flat panel photobioreactors were manufactured by Yazgan Pleksi
Company, Ankara, Turkey. The photobioreactors were made of Plexiglas sheets. The
properties of the Plexiglas are given in Appendix B1.
The photobioreactors were constructed in two scales; laboratory (4 to 8 liters)
and large scale (20 liters) photobioreactors. The laboratory scale photobioreactors
were operated both in indoor and outdoor conditions and pilot scale photobioreactor
was operated only in outdoor conditions. The photobioreactors were constructed in
two different designs; photobioreactors (8 L) with non-cooling apparatus and
photobioreactors (4 L and 20 L) with internal cooling coil.
The dimensions of the laboratory (8 L) photobioreactors are 50 cm x 40 cm x
4 cm and they were constructed by combining the Plexiglas sheets (thickness of 6
mm) like a rectangular box then sealing the corners by liquefied acrylic.
The dimensions of the laboratory (4 L) and pilot scale photobioreactor (20 L)
with cooling coil are 45 cm x 45 cm x 2 cm and 100 cm x100 cm x 2 cm,
respectively. PVC rigid sheet (thickness of 2 cm) were used as frame (dimensions of
45 cmx45 cm and 100 cm x 100 cm) that connected the two Plexiglas sheets
(thickness of 10 mm) together with stainless steel socket cap bolts and nuts with
plastic insert. Teflon gaskets and stainless steel washers were used for sealing the
bolt holes. Sponge rubber cord was used as a sealing material between the Plexiglas
sheets and PVC frame. The properties of PVC unplasticized frame are given in
Appendix B.2. For internal cooling PVC tubing was used as cooling coil in
laboratory scale (4 L) and Aluminum T6 was used in pilot scale (20 L)
photobioreactors. The properties of Aluminum T6 are given in appendix B.3. Output
connections of the PVC cooling coil were made by push-in adaptors inserted in the
PVC frame and it was stacked to the Plexiglas sheets with suction pads.

35
Miniature ball valves were inserted on the top and one sidelong of the
photobioreactors in order to provide input and output functionality. The properties of
the valves are given in Appendix B.4. The evolved gas was collected in a cylindrical
gas column (volume of 8 L) made of Plexiglas. The level of the liquid in gas
collector in indoor experiments was monitored with a camera connected to a PC. The
Polyurethane tubing connections were made with the push-in fitting adaptors that
were screwed on the ball valves. The technical properties of the adaptors are given in
Appendix B.5. Photobioreactors were either placed on a bench in indoor or steel
frame in outdoor conditions.
Experimental set up of 8 L laboratory scale experiments is shown in Figure
3.4 and the picture of indoor and outdoor 8 L laboratory scale photobioreactor run
with Rb. capsulatus wild type on defined medium containing acetate (40-80 mM),
lactate (7.5 mM) and glutamate (2-10 mM) is given in Figures 3.5, 3.6 and 3.7.
Figure 3.4 Experimental set up of 8 L laboratory scale experiments
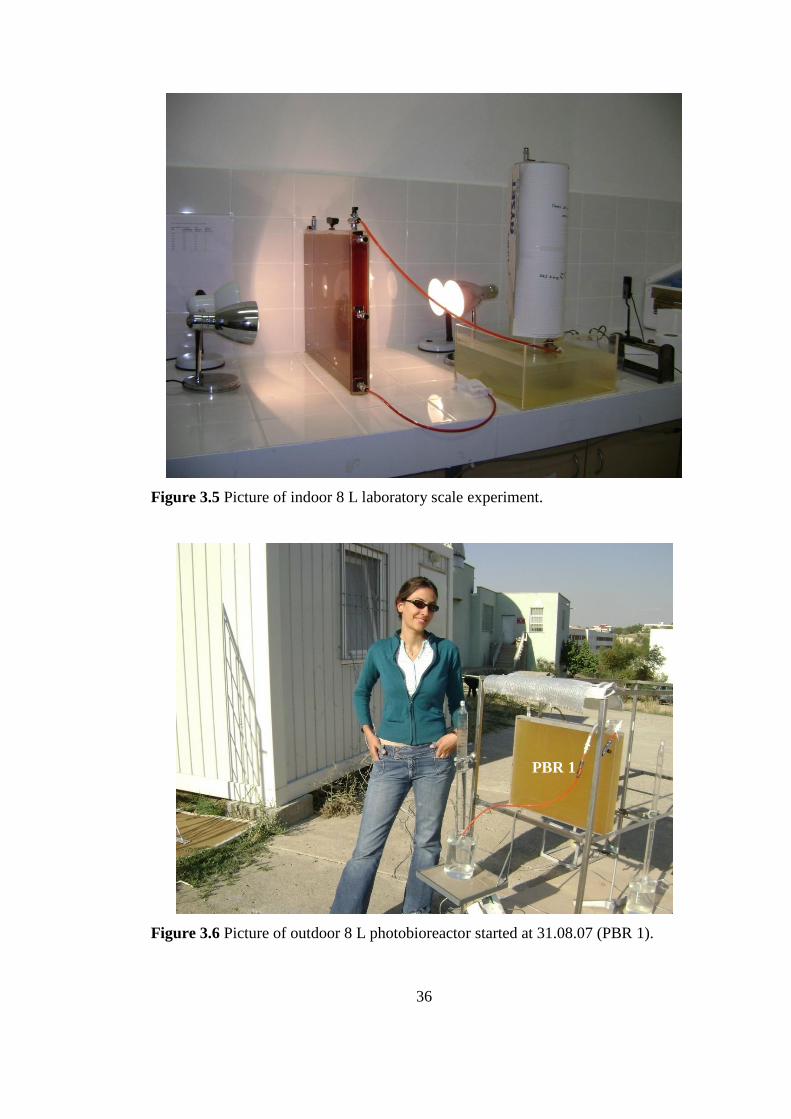
36
Figure 3.5 Picture of indoor 8 L laboratory scale experiment.
Figure 3.6 Picture of outdoor 8 L photobioreactor started at 31.08.07 (PBR 1).
PBR 1
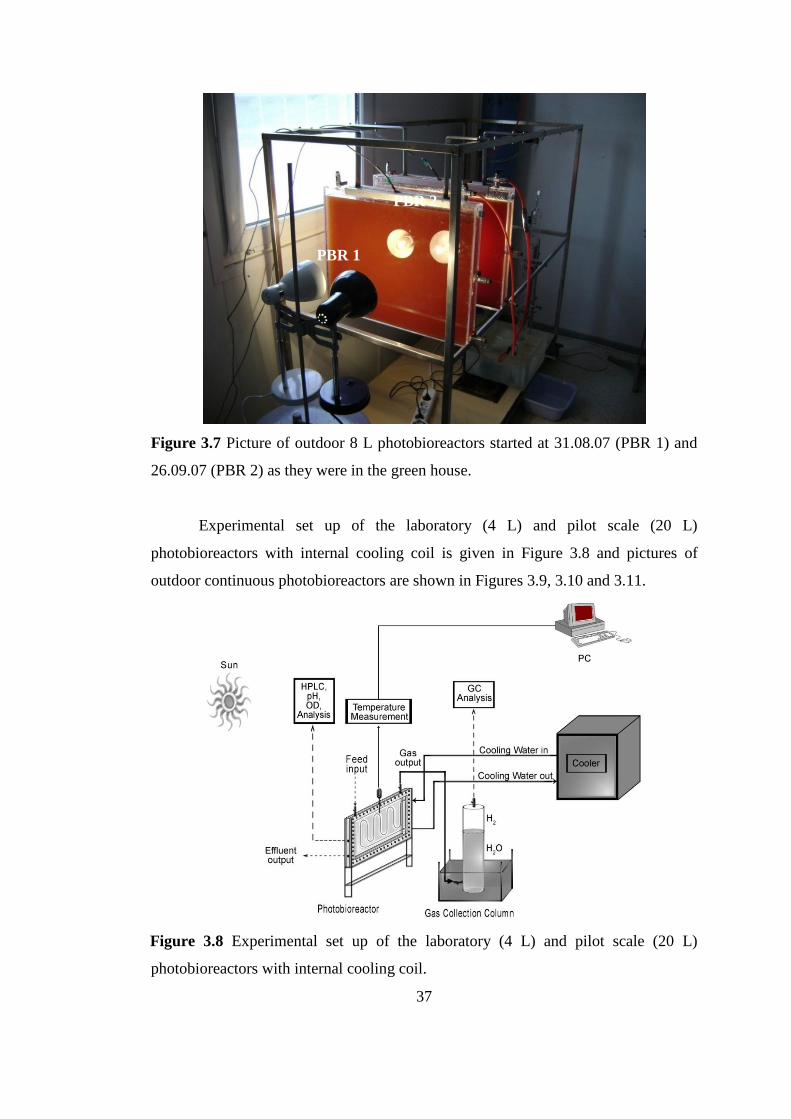
37
Figure 3.7 Picture of outdoor 8 L photobioreactors started at 31.08.07 (PBR 1) and
26.09.07 (PBR 2) as they were in the green house.
Experimental set up of the laboratory (4 L) and pilot scale (20 L)
photobioreactors with internal cooling coil is given in Figure 3.8 and pictures of
outdoor continuous photobioreactors are shown in Figures 3.9, 3.10 and 3.11.
Figure 3.8 Experimental set up of the laboratory (4 L) and pilot scale (20 L)
photobioreactors with internal cooling coil.
PBR 1
PBR 2
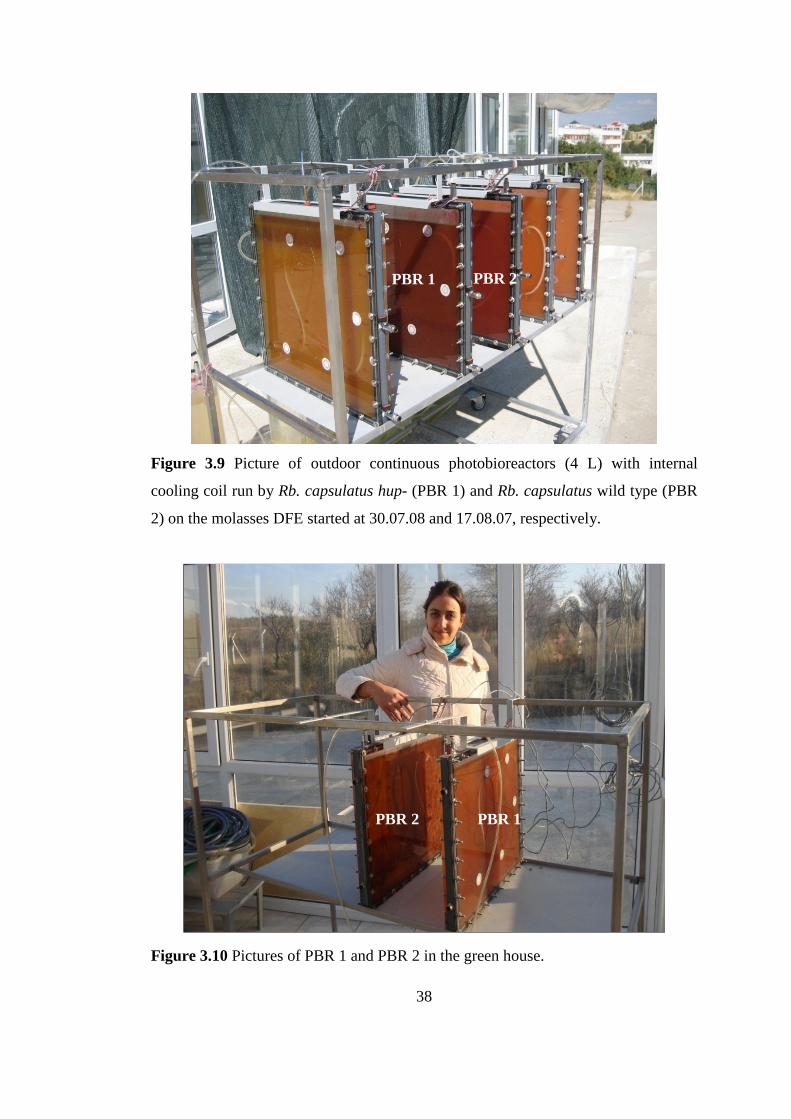
38
Figure 3.9 Picture of outdoor continuous photobioreactors (4 L) with internal
cooling coil run by Rb. capsulatus hup- (PBR 1) and Rb. capsulatus wild type (PBR
2) on the molasses DFE started at 30.07.08 and 17.08.07, respectively.
Figure 3.10 Pictures of PBR 1 and PBR 2 in the green house.
PBR 1 PBR 2
PBR 1 PBR 2

39
Figure 3.11 Picture of outdoor pilot scale photobioreactor (20 L) with internal
cooling coil runs by Rb. capsulatus hup- on defined medium containing 30 mM
acetate and 2 mM glutamate at the start-up period.
3.3.2.2 Sterilization of the Photobioreactors and Media
The photobioreactors were sterilized with hydrogen peroxide. In the first step
the photobioreactor was filled with distilled water contained 3% hydrogen peroxide
(Degen et al., 2001). After waiting 24 h the photobioreactor was washed with
distilled water three times in order to ensure that there were no hydrogen peroxide in
it. The hydrogen production media was sterilized via autoclaving as described before.
3.3.2.3 Start-up
The laboratory and large-scale photobioreactors were started up in
unsterilized conditions. The sterilized hydrogen production medium and the 25%
activated bacteria were added to the photobioreactor with a funnel from the hole on

40
the top of the photobioreactor. After the filling operation the hole was closed with a
sterile septum. There was 1% empty space remained on the top of the
photobioreactor. Then the argon gas was flushed from the valve on the top of the
photobioreactor. After 10 minutes valves on the top of the photobioreactor were
closed. Then the photobioreactor was placed in the stainless steel frame.
3.3.2.4 Temperature Indication and Control
A portable temperature probe (Maxi-T) was inserted into the hole closed with
a septum which was on the top of the photobioreactor so the temperature variations
in the photobioreactor were monitored. Beside the surface temperature of the
photobioreactors was measured by using an infrared thermometer (Testo 830-T1).
The photobioreactor was placed in a room which the temperature was adjusted with
an air conditioner. The temperature of the air conditioner was set up to 20 0C-25
0C
so the photobioreactor temperature was controlled between 30 and 35 0C.
In outdoor experiments the temperature of the photobioreactor was measured
with a temperature probe (Elimko E680 Univesal Data Loggers/Scanners, Turkey)
plunged into the photobioreactor. A cooler (Pnöso, PSS Series Process Water Cooler,
Turkey) was used to cool the distilled water circulating through PVC tube inserted
into the photobioreactor connected to a computer.
3.3.2.5 Light Intensity Measurements
The illumination of the photobioreactor was provided with four 100 W
tungsten lamps placed two sides of the photobioreactor. The light intensity on the
photobioreactor was adjusted to 2000 lux to prevent uncontrolled temperature
increase. The light intensity measurements were done with a lux meter (Lutron).
In outdoor experiments the light intensity was measured instantly by the lux
meter. The total global solar radiation data were also taken from the National
Meteorology Institute of Turkey.

41
3.3.2.6 Sampling and Feeding
First the sample (5 ml) was taken from the valve which was inserted in the
middle of the sidelong of the photobioreactor. Then 10% effluent was taken from the
bottom valve of the photobioreactor. This step made an apparent vacuum in the
photobioreactor. Then 10% hydrogen production medium or dark fermentor effluent
of molasses was given to the photobioreactor from the middle valve on the side of
the photobioreactor. At the end the pressure in the photobioreactor came to its initial
value.
3.3.2.7 Shutdown
As the experiment was finished the last sample were taken. Then 3%
hydrogen peroxide was added to the photobioreactor to stop the biological activity in
the photobioreactor. Then the waste was poured out to the drainage and the
photobioreactor was sterilized again.
3.4 Analyses
3.4.1 pH Measurement
The pH of the culture sample was measured with a pH meter (Mettler Toledo
3311). 2 ml culture was adequate for the measurement. Before the measurements the
pH electrode was calibrated with the calibration solutions which were set to 7, 4 and
9, respectively. If the calibration gave 80% - 120% accuracy the measurement would
be reliable.
3.4.2 Spectrophotometric Analysis
3.4.2.1 Cell Concentration
The cell concentration was obtained by measuring the optical density of the
culture sample using a visible spectrophotometer (Shimadzu UV-1201). For this
purpose the absorbance of the culture at 660 nm was read. The light absorption
spectrum was given in Appendix C. Hydrogen production medium and dark

42
fermentor effluent of molasses was used as a blank solution according to the study.
Then the absorbance values were converted to dry cell weights by the help of the
calibration curve of dry cell weight (gdcw) versus OD660 both Rhodobacter
capsulatus wild type and mutant strains shown in Appendix D.1 and D.2,
respectively. The calibration factor that was found from the calibration curves for Rb.
capsulatus was 0.56 gdcw/Lc. A sample calculation for dry cell weight calculation is
given in Appendix J.1.
3.4.2.2 Bacteriochlorophyll a Measurement
For determination of bacteriochlorophyll a concentration, 1 ml culture sample
was centrifuged at 13400 rpm for 10 minutes in 1.5 ml vial. Then the supernatant
was discarded and 1 ml acetone-methanol mixture (7:2 v/v) was added for the
extraction of the bacteriochlorophyll a (Cohen-Bazire 1957). Later the mixture was
vortex 1 minute for homogenization and the homogenate was centrifuged again at
13400 rpm for 10 minutes to remove almost 92% of the proteins under ambient
conditions (Biel A.J, 1986). Bacteriochlorophyll a concentration was calculated from
the absorbance of the supernatant at 770nm.The extinction coefficient is 75 mM-1
cm-
1 (Clayton R.K., 1963) and molecular weight of bacteriochlorophyll a. The molecular
formula of bacteriochlorophyll a is C55H74N4O6Mg (Senge and Smith, 1995).
Acetone-methanol mixture was used as blank solution. A sample calculation was
given in Appendix J.2.
3.4.2.3 TOC Analysis
The total organic carbon of the sample is analyzed with a COD reactor
(WTW 3200) and a spectrophotometer (Hach-Lange). Direct method of low range
total organic carbon and reagent set were used. It is essential that the total organic
carbon level of the sample is within the range of the method. For this purpose 1 ml
sample of photofermentation effluent of molasses taken into a clean tube and it was
diluted 100 times in order to fit in the appropriate range. Then the proceedings of the
method 10129 are implemented. At sample is sparged under slightly acidic
conditions to remove the inorganic carbon. In the outside vial, organic carbon in the

43
sample was digested by persulfate and acid to form carbon dioxide. During digestion,
the carbon dioxide diffused into a pH indicator reagent in the inner ampule. The
adsorption of carbon dioxide into the indicator forms carbonic acid. Carbonic acid
changed the pH of the indicator solution which, in turn, changed the color. The
amount of color change was related to the original amount of carbon present in the
sample. Test results were measured at 430 nm as soon as possible. The reagent blank
was not preserved.
3.4.2.4 TN Analysis
The total nitrogen analyses were operated with a COD reactor (WTW 3200)
and a spectrophotometer (Hach-Lange). Persulfate digestion method of low range
total nitrogen and total nitrogen reagent set were used. Before starting the procedure
1ml photofermentation effluent of molasses were diluted 10 times in order to provide
appropriate range. Sodium metabisulfite was added after the digestion to eliminate
halogen oxide interferences. Nitrate then reacted with chromotropic acid under
strongly acidic conditions to form a yellow complex. Absorbance was measured
immediately at 410 nm. The reagent blank was used up to seven days for
measurements using the same lots of reagents. It was stored in the dark at room
temperature (18–25 0C). If a small amount of white flocculation appeared (usually at
the end of one week), the reagent blank was discarded and a new one was prepared.
3.4.2.5 Ammonia Analysis
The ammonia content of the sample is determined by using the
spectrophotometer (Hach-Lange) and the appropriate reagent set. The salicylate
method (10031) of high range ammonia nitrogen is performed without dilution of the
sample. For this purpose first ammonia compounds are combined with chlorine to
form monochloramine. Then monochloramine reacts with salicylate to form 5-
aminosalicylate. The 5-aminosalicylate is oxidized in the presence of a sodium
nitroprusside catalyst to form a blue colored compound. However, the blue color was
masked by the yellow color from the excess reagent present to give a green-colored
solution. Absorbance is measured immediately at 655 nm. To preserve the samples,
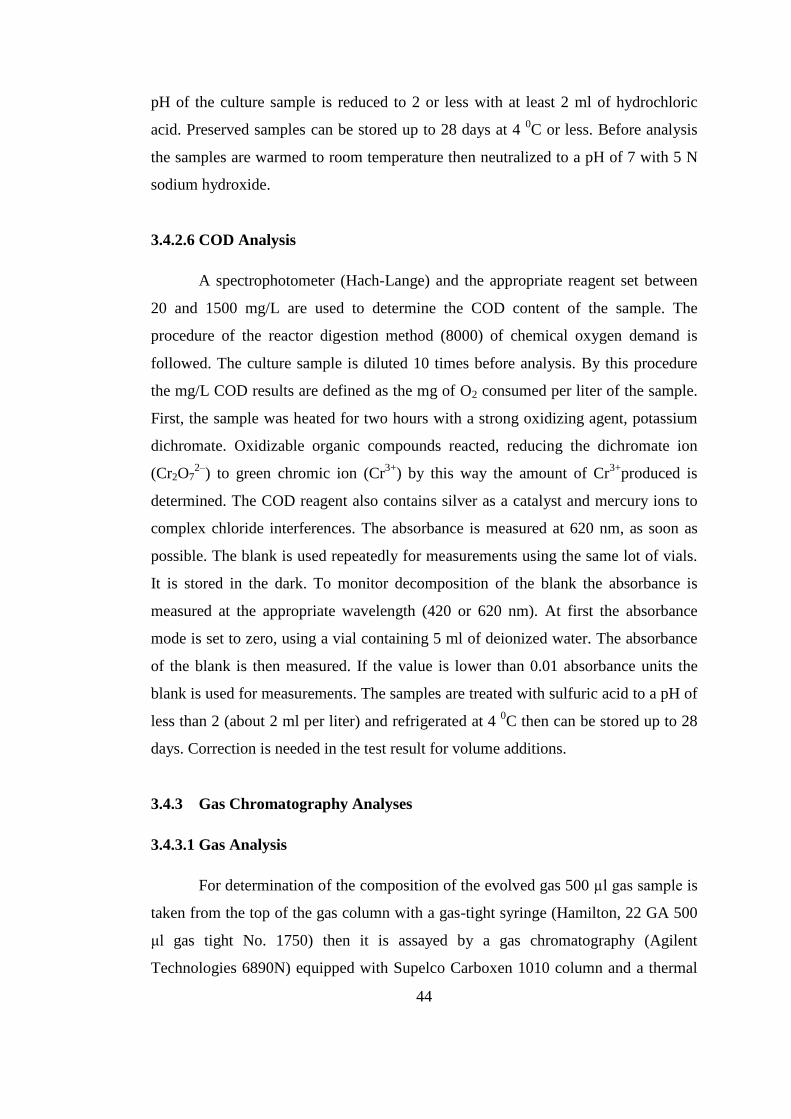
44
pH of the culture sample is reduced to 2 or less with at least 2 ml of hydrochloric
acid. Preserved samples can be stored up to 28 days at 4 0C or less. Before analysis
the samples are warmed to room temperature then neutralized to a pH of 7 with 5 N
sodium hydroxide.
3.4.2.6 COD Analysis
A spectrophotometer (Hach-Lange) and the appropriate reagent set between
20 and 1500 mg/L are used to determine the COD content of the sample. The
procedure of the reactor digestion method (8000) of chemical oxygen demand is
followed. The culture sample is diluted 10 times before analysis. By this procedure
the mg/L COD results are defined as the mg of O2 consumed per liter of the sample.
First, the sample was heated for two hours with a strong oxidizing agent, potassium
dichromate. Oxidizable organic compounds reacted, reducing the dichromate ion
(Cr2O72–
) to green chromic ion (Cr3+
) by this way the amount of Cr3+
produced is
determined. The COD reagent also contains silver as a catalyst and mercury ions to
complex chloride interferences. The absorbance is measured at 620 nm, as soon as
possible. The blank is used repeatedly for measurements using the same lot of vials.
It is stored in the dark. To monitor decomposition of the blank the absorbance is
measured at the appropriate wavelength (420 or 620 nm). At first the absorbance
mode is set to zero, using a vial containing 5 ml of deionized water. The absorbance
of the blank is then measured. If the value is lower than 0.01 absorbance units the
blank is used for measurements. The samples are treated with sulfuric acid to a pH of
less than 2 (about 2 ml per liter) and refrigerated at 4 0C then can be stored up to 28
days. Correction is needed in the test result for volume additions.
3.4.3 Gas Chromatography Analyses
3.4.3.1 Gas Analysis
For determination of the composition of the evolved gas 500 µl gas sample is
taken from the top of the gas column with a gas-tight syringe (Hamilton, 22 GA 500
μl gas tight No. 1750) then it is assayed by a gas chromatography (Agilent
Technologies 6890N) equipped with Supelco Carboxen 1010 column and a thermal

45
conductivity detector. Argon was used as a carrier gas at a flow rate of 26 ml/min.
The oven, injector and detector temperatures were 140 0C, 160
0C and 170
0C,
respectively. A typical gas analysis chromatogram is given in Appendix E.1.
3.4.4 HPLC Analyses
3.4.4.1 Organic Acid Analysis
Organic acid analysis is carried out using a HPLC (Shimadzu 10A series).
Liquid samples are filtered using a 45 μm nylon filters (Millipore, 13 mm) to get rid
of impurities. The filtered samples are analyzed by an Alltech IOA-1000 (300 mm x
7.8 mm) HPLC column. In the analysis, 0.085 M H2SO4 is used as the mobile phase
and the oven temperature is kept constant at 66 0C. A low gradient pump (Shimadzu
LC-10AT) with a degasser (Shimadzu DGU-14A) is used to maintain the mobile
phase flow rate at 0.4 ml/min. An auto sampler (Shimadzu SIL-10AD) injected 10 μl
sample into the system and a UV detector (Shimadzu FCV-10AT) with absorbance
set at 210 nm is used to determine the component separation. Peak values for the
samples are automatically recorded and concentrations are determined manually by
constructing calibration curves for different concentrations of pure organic acid
standards. The organic acids measured are lactic acid, formic acid, acetic acid,
propionic acid and butyric acid. Shown in Appendix F.1, F.2, F.3, F.4, F.5, and F.6
are sample HPLC chromatogram and calibration curves for lactic acid, formic acid,
acetic acid, propionic acid and butyric acid, respectively. Sample calculation of
acetic acid concentration is shown in Appendix J.3.
3.4.5 Elemental Analyses
The detailed elemental composition of the samples was done with atomic
absorption spectroscopy (Philips, PU9200X) in Department of Chemical Engineering
of Middle East Technical University, Ankara, Turkey.
46
CHAPTER 4
RESULTS AND DISCUSSION
4.1 Selection of Construction Materials for Panel Photobioreactors
In photobiological processes cost, the ability to transmit light and, gas permeation
rates of the reactor materials are apparently important for materials of construction.
Because hydrogen, oxygen and nitrogen permeation rates, transmission of the
specific wavelengths of light required by the light conversion system, factors related
to strength and impact resistance are very important for process intensification. It is
essential to prevent leakage of produced hydrogen from inside to the outside of the
photobioreactor as well as prevent oxygen and nitrogen leakage into the system in
order to keep continuity of microbiological activity towards the hydrogen production.
Optical elements are the most important part of the reactor materials because they
are the most susceptible to weathering effects. The other reactor materials consist of
seals and gaskets, adhesives, piping, and valves are all have to meet rigorous cost and
performance standards. So, in this section, first hydrogen and oxygen permeability of
optical elements in the literature were reviewed then hydrogen permeability’s of
selected reactor materials in the literature and found out experimentally were
compared. At the end effect of type of cooling coil material on hydrogen production,
cell growth, and, pH, and effect of photobioreactor design on the process
intensification was researched.
4.1.1 Hydrogen Permeability
The rate of hydrogen loss and potentially nitrogen and oxygen entry into
reactors due to the permeability of the materials of construction is considered to be a
key performance and safety parameter (Blake, 2005). Figure 4.1 gives values for
hydrogen and oxygen permeability coefficients for polymers of interest for the

47
optical elements in photobiological systems. The figure also contains hydrogen and
oxygen values from the literature. Data for five materials shown on the right side of
the figure (indicated by PDL) are from the Polymer Data Library compilation
(Massey, 2003).
Figure 4.1 Comparison of permeability coefficients of hydrogen and oxygen of PC,
fluorocarbon polymers, and PET materials, Acrylics (Blake, 2005).
Blake (2005) concluded after researching hydrogen and oxygen permeability
of some optical elements that PCs are tough but “yellow” and crack outdoors over
time, PET formulations have not yet proven to be durable outdoors but have
favorable gas permeation properties, Kynar, a fluoropolymer (PVDF), has very good
outdoor durability and favorable gas permeation properties. But Kynar is not widely
used in the industry so it costs higher than plastics. Consequently the most proper
reactor materials for photobiological systems in outdoor conditions in terms of cost,
48
availability, and convenience to system requirements are the most widely used
acrylics, glass, and plastics.
The best candidates which are Plexiglas (PMMA), Low Density Polyethylene
(LDPE), Polyvinylchloride (PVC), and Polyurethane (PU) among acrylics and
plastics were chosen beside Glass as a possible reactor material in this study.
Because all chosen materials are cheap and most widely used in various
manufacturing fields all around the word.
PMMA is a transparent thermoplastic and a kind of synthetic polymer of
methyl methacrylate. It is a versatile material that has been used in a wide range of
fields and applications. It is alternative to polycarbonate and it has moderate
properties as easy handling and processing, and low cost. Low Density Polyethylene
(LDPE) is also a thermoplastic made of petroleum. Its most common use is in plastic
bags. It is also used for various molded laboratory equipments and tubing. PVC is the
third most widely produced plastic, after polyethylene and polypropylene (ACC
Resin Statistics Summary, 2009) and it is widely used in construction because it is
cheap, durable, and easy to assemble. Polyurethane is widely used high performance
adhesives and sealants, seals, gasket, and hard plastic parts. Glass is also essential in
science and industry. So hydrogen permeability of Plexiglas (PMMA), Glass,
Polyurethane (PU), Polyvinyl Chloride (PVC) and Low Density Polyethylene
(LDPE) was examined in order to choose the best photobioreactor material in
photobiological systems. Method for measuring hydrogen permeability through
chosen reactor materials is given in Appendix I. Figure 4.2 shows comparison of
permeability coefficients of hydrogen related to chosen materials that were found out
experimentally and the data already in the literature. The wall thicknesses of
Plexiglas (PMMA), Glass, Polyurethane (PU), Polyvinyl Chloride (PVC) and Low
Density Polyethylene (LDPE) used in the experiments were 3.5, 2.5, 1.5, 1.5 and
0.3mm, respectively. Definition of permeability and experimental method of
measuring hydrogen permeability through materials are given in Appendices G and I,
respectively.
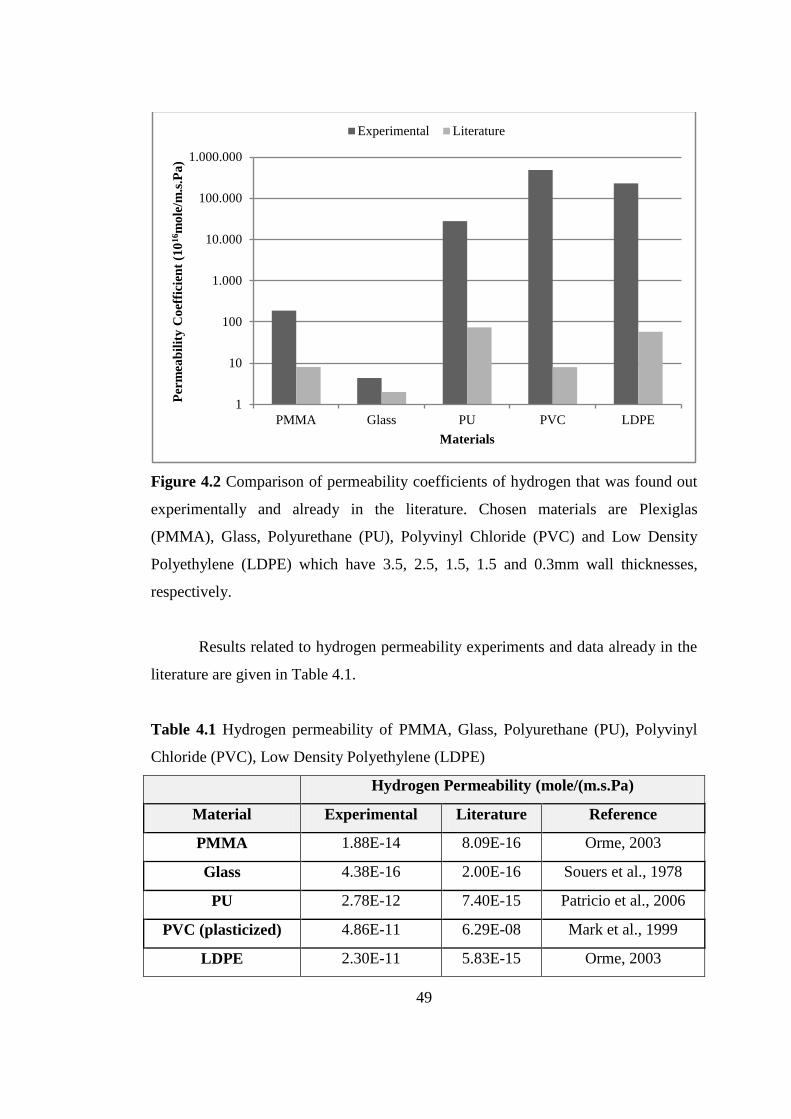
49
Figure 4.2 Comparison of permeability coefficients of hydrogen that was found out
experimentally and already in the literature. Chosen materials are Plexiglas
(PMMA), Glass, Polyurethane (PU), Polyvinyl Chloride (PVC) and Low Density
Polyethylene (LDPE) which have 3.5, 2.5, 1.5, 1.5 and 0.3mm wall thicknesses,
respectively.
Results related to hydrogen permeability experiments and data already in the
literature are given in Table 4.1.
Table 4.1 Hydrogen permeability of PMMA, Glass, Polyurethane (PU), Polyvinyl
Chloride (PVC), Low Density Polyethylene (LDPE)
Hydrogen Permeability (mole/(m.s.Pa)
Material Experimental Literature Reference
PMMA 1.88E-14 8.09E-16 Orme, 2003
Glass 4.38E-16 2.00E-16 Souers et al., 1978
PU 2.78E-12 7.40E-15 Patricio et al., 2006
PVC (plasticized) 4.86E-11 6.29E-08 Mark et al., 1999
LDPE 2.30E-11 5.83E-15 Orme, 2003
1
10
100
1.000
10.000
100.000
1.000.000
PMMA Glass PU PVC LDPE
Per
mea
bil
ity
Co
effi
cien
t (1
016m
ole
/m.s
.Pa
)
Materials
Experimental Literature
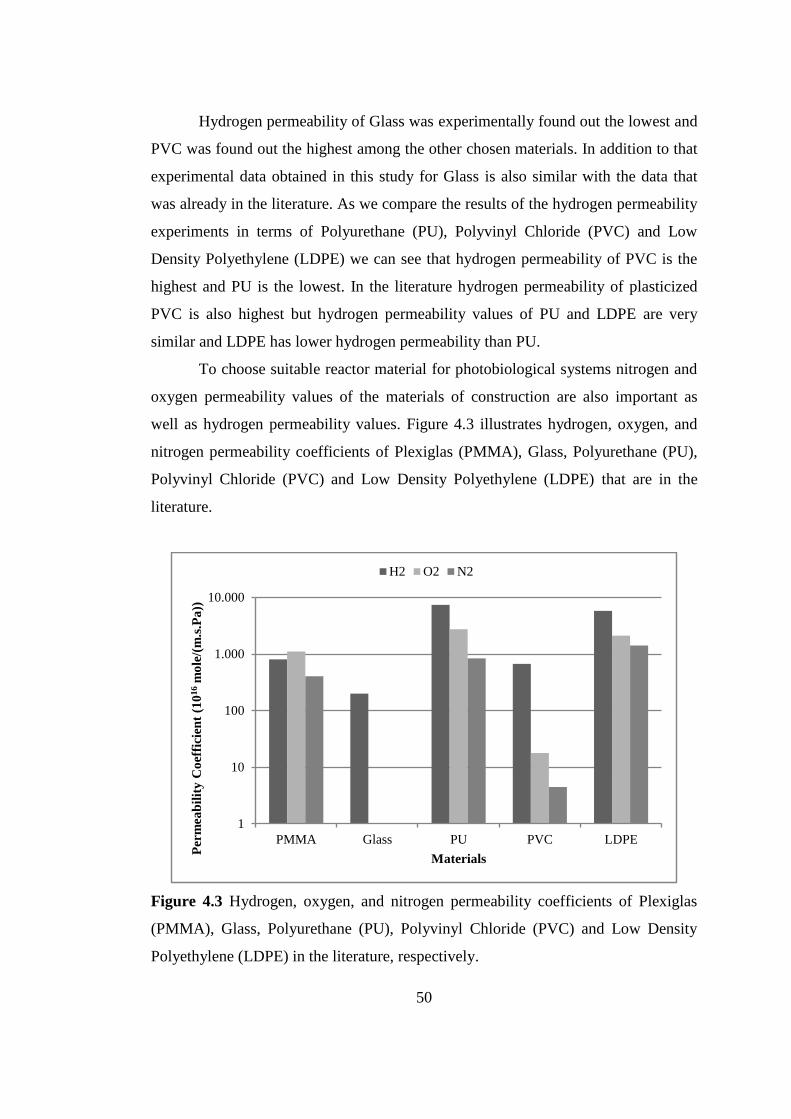
50
Hydrogen permeability of Glass was experimentally found out the lowest and
PVC was found out the highest among the other chosen materials. In addition to that
experimental data obtained in this study for Glass is also similar with the data that
was already in the literature. As we compare the results of the hydrogen permeability
experiments in terms of Polyurethane (PU), Polyvinyl Chloride (PVC) and Low
Density Polyethylene (LDPE) we can see that hydrogen permeability of PVC is the
highest and PU is the lowest. In the literature hydrogen permeability of plasticized
PVC is also highest but hydrogen permeability values of PU and LDPE are very
similar and LDPE has lower hydrogen permeability than PU.
To choose suitable reactor material for photobiological systems nitrogen and
oxygen permeability values of the materials of construction are also important as
well as hydrogen permeability values. Figure 4.3 illustrates hydrogen, oxygen, and
nitrogen permeability coefficients of Plexiglas (PMMA), Glass, Polyurethane (PU),
Polyvinyl Chloride (PVC) and Low Density Polyethylene (LDPE) that are in the
literature.
Figure 4.3 Hydrogen, oxygen, and nitrogen permeability coefficients of Plexiglas
(PMMA), Glass, Polyurethane (PU), Polyvinyl Chloride (PVC) and Low Density
Polyethylene (LDPE) in the literature, respectively.
1
10
100
1.000
10.000
PMMA Glass PU PVC LDPE
Per
mea
bil
ity
Co
effi
cien
t (1
016 m
ole
/(m
.s.P
a))
Materials
H2 O2 N2
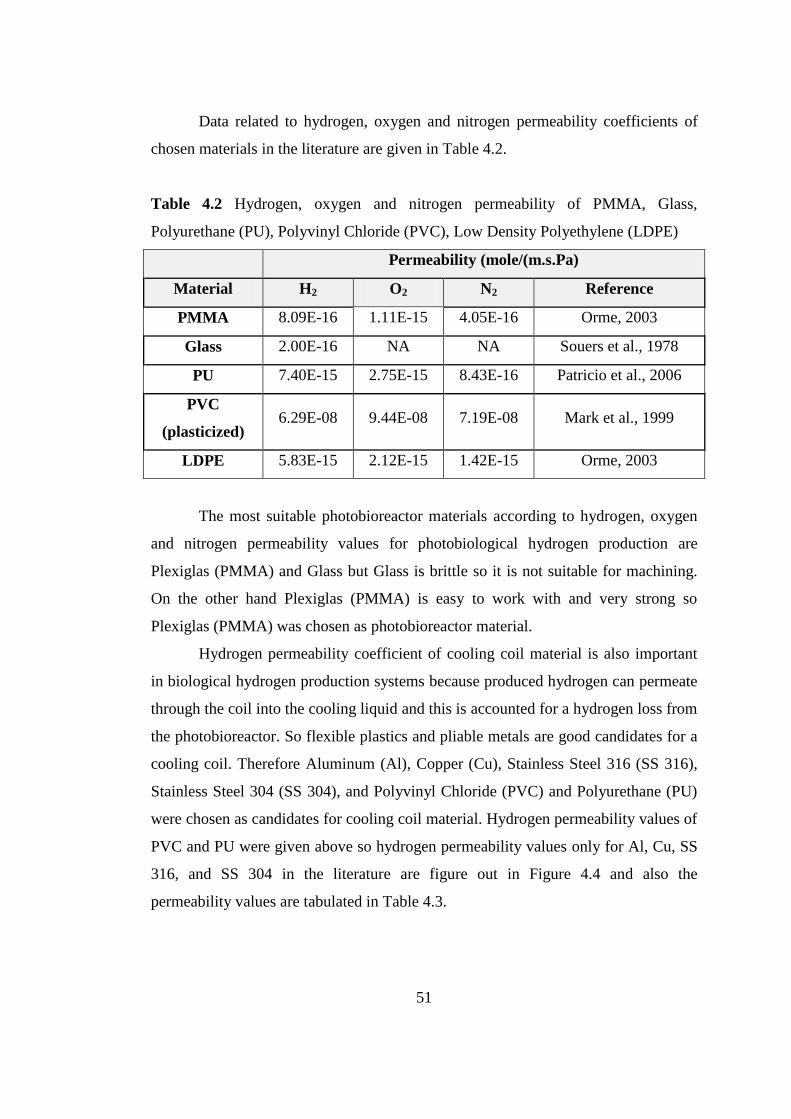
51
Data related to hydrogen, oxygen and nitrogen permeability coefficients of
chosen materials in the literature are given in Table 4.2.
Table 4.2 Hydrogen, oxygen and nitrogen permeability of PMMA, Glass,
Polyurethane (PU), Polyvinyl Chloride (PVC), Low Density Polyethylene (LDPE)
Permeability (mole/(m.s.Pa)
Material H2 O2 N2 Reference
PMMA 8.09E-16 1.11E-15 4.05E-16 Orme, 2003
Glass 2.00E-16 NA NA Souers et al., 1978
PU 7.40E-15 2.75E-15 8.43E-16 Patricio et al., 2006
PVC
(plasticized) 6.29E-08 9.44E-08 7.19E-08 Mark et al., 1999
LDPE 5.83E-15 2.12E-15 1.42E-15 Orme, 2003
The most suitable photobioreactor materials according to hydrogen, oxygen
and nitrogen permeability values for photobiological hydrogen production are
Plexiglas (PMMA) and Glass but Glass is brittle so it is not suitable for machining.
On the other hand Plexiglas (PMMA) is easy to work with and very strong so
Plexiglas (PMMA) was chosen as photobioreactor material.
Hydrogen permeability coefficient of cooling coil material is also important
in biological hydrogen production systems because produced hydrogen can permeate
through the coil into the cooling liquid and this is accounted for a hydrogen loss from
the photobioreactor. So flexible plastics and pliable metals are good candidates for a
cooling coil. Therefore Aluminum (Al), Copper (Cu), Stainless Steel 316 (SS 316),
Stainless Steel 304 (SS 304), and Polyvinyl Chloride (PVC) and Polyurethane (PU)
were chosen as candidates for cooling coil material. Hydrogen permeability values of
PVC and PU were given above so hydrogen permeability values only for Al, Cu, SS
316, and SS 304 in the literature are figure out in Figure 4.4 and also the
permeability values are tabulated in Table 4.3.
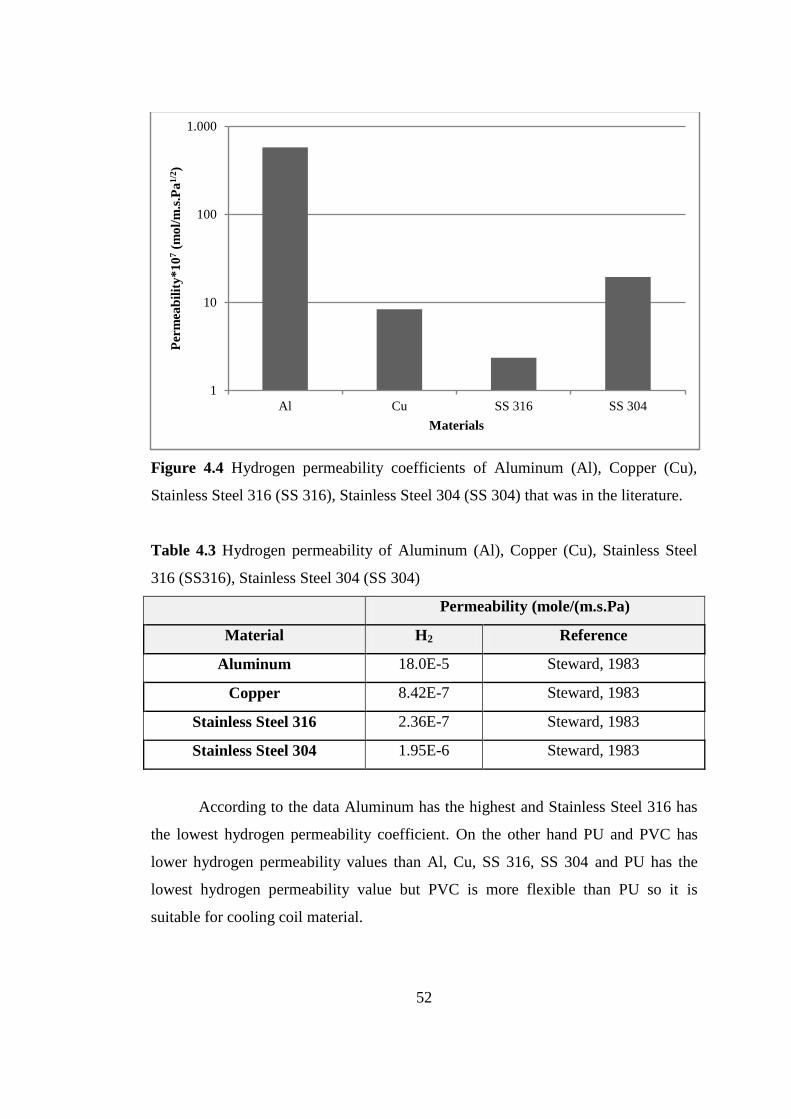
52
Figure 4.4 Hydrogen permeability coefficients of Aluminum (Al), Copper (Cu),
Stainless Steel 316 (SS 316), Stainless Steel 304 (SS 304) that was in the literature.
Table 4.3 Hydrogen permeability of Aluminum (Al), Copper (Cu), Stainless Steel
316 (SS316), Stainless Steel 304 (SS 304)
Permeability (mole/(m.s.Pa)
Material H2 Reference
Aluminum 18.0E-5 Steward, 1983
Copper 8.42E-7 Steward, 1983
Stainless Steel 316 2.36E-7 Steward, 1983
Stainless Steel 304 1.95E-6 Steward, 1983
According to the data Aluminum has the highest and Stainless Steel 316 has
the lowest hydrogen permeability coefficient. On the other hand PU and PVC has
lower hydrogen permeability values than Al, Cu, SS 316, SS 304 and PU has the
lowest hydrogen permeability value but PVC is more flexible than PU so it is
suitable for cooling coil material.
1
10
100
1.000
Al Cu SS 316 SS 304
Per
mea
bil
ity
*1
07 (
mo
l/m
.s.P
a1/2
)
Materials
53
4.1.2 Selection of Cooling Coil Material
When there is a big difference between day and night temperatures, cooling
or heating become inevitable in order to keep the temperature of the reactor in the
desired range. For this purpose a coil was designed to be inserted into the
photobioreactor. The effect of cooling coil material on pH, the biological growth and
its hydrogen production of R. capsulatus has been determined to select a suitable
construction material for the coil. Polyurethane (PU), Aluminum (Al), Polyvinyl
Chloride (PVC), Copper (Cu), Stainless Steel 316 (SS 316), and Stainless Steel
304(SS 304) were some of the materials that has been researched. The pH, growth
and cumulative hydrogen production by Rb. capsulatus was tested in small bottle
experiments containing a piece of coil material and compared with control
experiment which did not contain these materials. Figure 4.5 illustrates the pH, cell
concentration and cumulative hydrogen production in the photobioreactor which
didn’t have any cooling coil material and the photobioreactors (50 ml) containing
Polyurethane (PU), Aluminum (Al), Polyvinyl Chloride (PVC), Copper (Cu),
Stainless Steel 316 (SS 316), and Stainless Steel 304 (SS 304).The experimental data
are given in Appendix M.1. The materials tested had no significant effect on pH and
it was around 7.0 during the experiment.
The microorganism in the photobioreactor in which Polyurethane (PU) tubing
was inserted grew more than the others at fourth day but the trend of the cell
concentration in all photobioreactors was similar during the experiment. The growth
in all photobioreactors stabilized around 0.5 gdcw/Lc after a rapid increase in the first
4 days. Microbial growth was not affected adversely with any of the selected
materials. The maximum hydrogen production was observed in the photobioreactor
in which stainless steel 304 alloys (SS 304) was inserted. The hydrogen
productivities in the photobioreactors that PVC, Aluminum (Al) and the Stainless
Steel 316 alloy (SS 316) were inserted produced the same amount of hydrogen.
Hydrogen production in the Polyurethane (PU) inserted photobioreactor was lower
than the PVC inserted one. The lowest hydrogen production was observed in the
photobioreactor that was no cooling coil material in it which was named as control
and the photobioreactor containing Copper (Cu) in it.

54
Figure 4.5 The pH, growth, and cumulative H2 production in the photobioreactor
which didn’t have any cooling coil material and the photobioreactors (50 ml)
containing Polyurethane (PU), Aluminum (Al), Polyvinyl Chloride (PVC), Copper
(Cu), Stainless Steel 316 (SS 316), Stainless Steel 304 (SS 304).
5,0
5,5
6,0
6,5
7,0
7,5
8,0
8,5
9,0
9,5
10,0
0 1 2 3 4 5 6 7 8 9 10 11 12
pH
Control PU Al PVC
Cu SS 316 SS 304
0,0
0,1
0,2
0,3
0,4
0,5
0,6
0,7
0,8
0,9
1,0
0 1 2 3 4 5 6 7 8 9 10 11 12
Cel
l C
on
cen
tra
tio
n (
gd
cw/L
c)
0
20
40
60
80
100
120
140
160
180
0 1 2 3 4 5 6 7 8 9 10 11 12
Cu
mu
lati
ve
H2 P
rod
uct
ion
(m
l)
Time (days)
55
As a conclusion after investigating the effect of cooling coil material on pH,
cell concentration and hydrogen productivity, PVC was chosen as cooling coil
material for the outdoor photobioreactors.
4.1.3 Panel Photobioreactor Design
The economics of photobiological hydrogen production process is primarily
based on reactor material. Durability and cost have to be considered while choosing
the construction materials. Glass, Plexiglas and Low Density Polyethylene are most
common photobioreactor materials used in laboratory or prototype scales. Glass and
PMMA have a long life span (20 years), while LDPE has 3 years maximum life span
(Burgess et al., 2006). Although it has long life span glass is not workable and is
more fragile but Plexiglas is suitable for machining. So Plexiglas was chosen as a
photobioreactor material.
When designing the photobioreactor, a maximal ratio of illuminated surface
area to land space was aimed. Since the ratio of illuminated surface area per ground
space is higher in vertical reactors than in horizontal ones, vertical panel
photobioreactor has been selected. The maximum height of the panel is limited to 1
m and the thickness of the plates is limited to 10 mm in order to reduce the deflection
of the transparent plates and to guarantee the gas-tightness of the enclosed volume,
respectively.
The performance of a photobioreactor is strongly dependent on the light
availability for each single cell of the dense suspension of the microorganism within
the panels. Self-shading due to light absorption by the pigments causes an
exponential decay in light intensity with culture depth. To provide high light
intensity absorption, the depth of the photobioreactors was adjusted to 4 cm, but it is
then decreased to 2 cm (Nakada et al., 1998). Because, hydrogen production rate per
area decreases as the reactor depth becomes greater than 3 cm (Kitajima et al., 1999).
Double-sided illumination was applied in order to provide more homogeneous light
distribution in the photobioreactor. Besides light distribution investigations, mixing
effects have led to a panel depth of 2 cm. Evolving hydrogen bubbles produced by
the cells induce a slow convective flow in the narrow vertical volumes of the panels
56
and thereby the suspension is autogenously mixed by an air-lift effect. This effect has
already been reported by Kim et al. (1982), who observed an enhanced productivity
in an inclined flat panel photobioreactor.
4.2 Continuous Hydrogen Production on Defined Medium by Rb. capsulatus
Wild Type and Mutant Strains
Studies with defined medium primarily aimed at the determination of optimum
substrate concentrations providing maximum hydrogen production continuously both
in indoor and outdoor conditions. In the second step, establishing the optimum
feeding rate, minimizing the negative effect of temperature fluctuations on hydrogen
production and providing adequate light intensity were aimed. For this purpose 3
photobioreactors (8 liters each) without cooling; one in indoor and two in outdoor
were run in parallel periods.
4.2.1 Indoor Lab-Scale Panel Photobioreactor
An 8 L in indoor lab-scale panel photobioreactor (Run240807) was operated
on defined medium containing acetate and lactate as carbon source and glutamate as
nitrogen source. The experiment lasted for 167 days. The temperature and light
intensity distributions of both sides of the photobioreactor, pH, cell concentration,
and cumulative hydrogen production were recorded continuously. All gas
measurements were corrected by calculating permeability of hydrogen through
reactor surface and solubility of hydrogen in water and carryover amounts in
inoculum. Methods for calculating hydrogen permeability through solids and
solubility in water and are given in Appendix G and H, respectively. Organic acid
composition and gas composition were also analyzed throughout the experiment. In
order to find the optimum feed composition, it was changed from time to time.
Experimental data are given in Appendix M.2. The total global solar radiation data
was taken from the National Meteorology Institute in Ankara. The definition of total
global solar radiation is given in Appendix J.
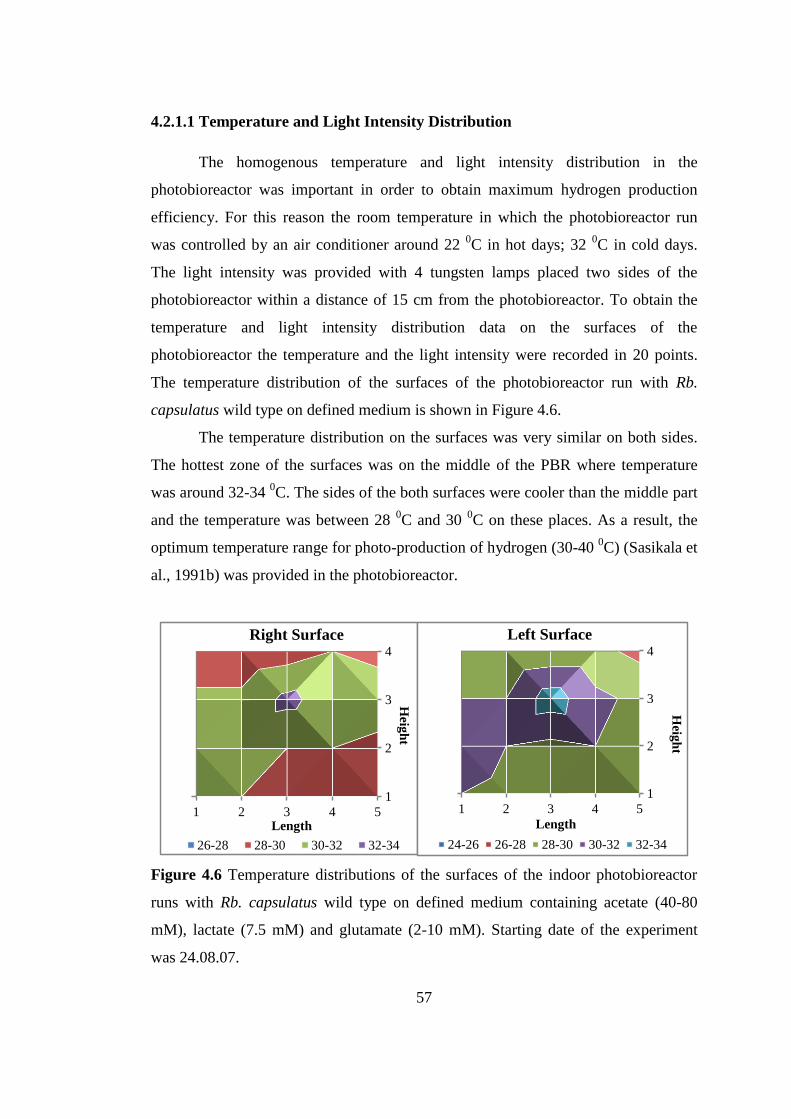
57
4.2.1.1 Temperature and Light Intensity Distribution
The homogenous temperature and light intensity distribution in the
photobioreactor was important in order to obtain maximum hydrogen production
efficiency. For this reason the room temperature in which the photobioreactor run
was controlled by an air conditioner around 22 0C in hot days; 32
0C in cold days.
The light intensity was provided with 4 tungsten lamps placed two sides of the
photobioreactor within a distance of 15 cm from the photobioreactor. To obtain the
temperature and light intensity distribution data on the surfaces of the
photobioreactor the temperature and the light intensity were recorded in 20 points.
The temperature distribution of the surfaces of the photobioreactor run with Rb.
capsulatus wild type on defined medium is shown in Figure 4.6.
The temperature distribution on the surfaces was very similar on both sides.
The hottest zone of the surfaces was on the middle of the PBR where temperature
was around 32-34 0C. The sides of the both surfaces were cooler than the middle part
and the temperature was between 28 0C and 30
0C on these places. As a result, the
optimum temperature range for photo-production of hydrogen (30-40 0C) (Sasikala et
al., 1991b) was provided in the photobioreactor.
Figure 4.6 Temperature distributions of the surfaces of the indoor photobioreactor
runs with Rb. capsulatus wild type on defined medium containing acetate (40-80
mM), lactate (7.5 mM) and glutamate (2-10 mM). Starting date of the experiment
was 24.08.07.
1
2
3
4
1 2 3 4 5
Heig
ht
Length
Right Surface
26-28 28-30 30-32 32-34
1
2
3
4
1 2 3 4 5
Heig
ht
Length
Left Surface
24-26 26-28 28-30 30-32 32-34
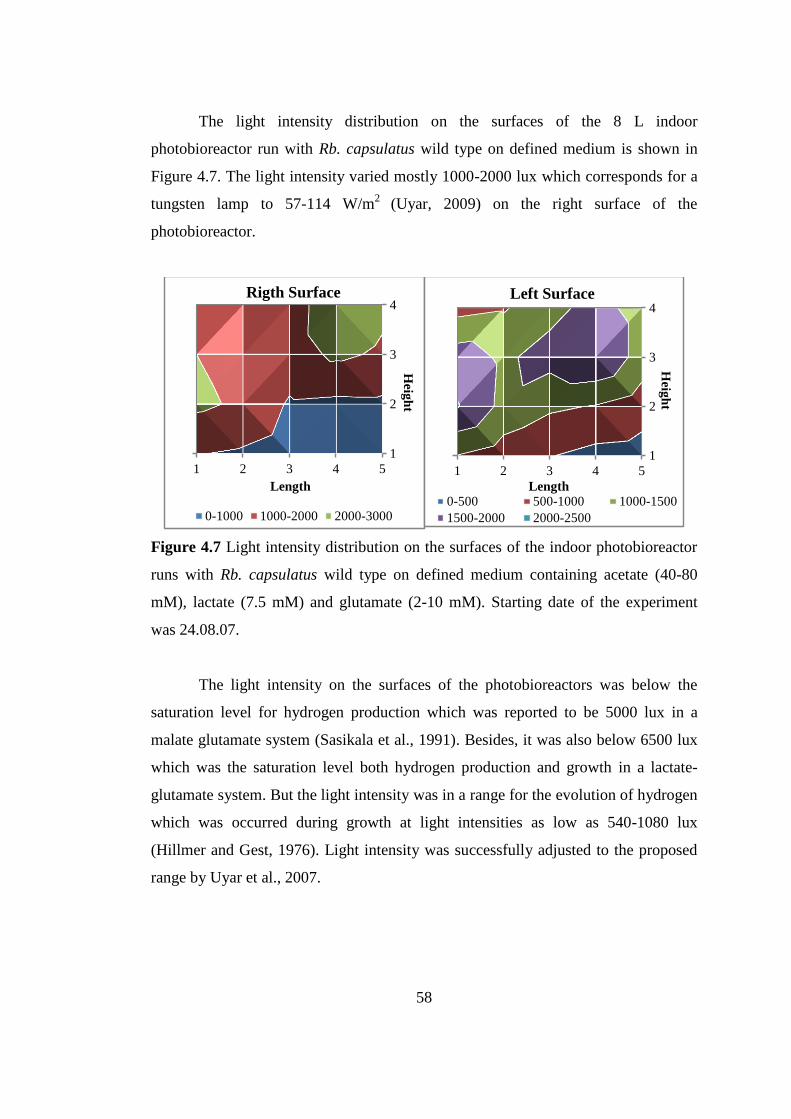
58
The light intensity distribution on the surfaces of the 8 L indoor
photobioreactor run with Rb. capsulatus wild type on defined medium is shown in
Figure 4.7. The light intensity varied mostly 1000-2000 lux which corresponds for a
tungsten lamp to 57-114 W/m2
(Uyar, 2009) on the right surface of the
photobioreactor.
Figure 4.7 Light intensity distribution on the surfaces of the indoor photobioreactor
runs with Rb. capsulatus wild type on defined medium containing acetate (40-80
mM), lactate (7.5 mM) and glutamate (2-10 mM). Starting date of the experiment
was 24.08.07.
The light intensity on the surfaces of the photobioreactors was below the
saturation level for hydrogen production which was reported to be 5000 lux in a
malate glutamate system (Sasikala et al., 1991). Besides, it was also below 6500 lux
which was the saturation level both hydrogen production and growth in a lactate-
glutamate system. But the light intensity was in a range for the evolution of hydrogen
which was occurred during growth at light intensities as low as 540-1080 lux
(Hillmer and Gest, 1976). Light intensity was successfully adjusted to the proposed
range by Uyar et al., 2007.
1
2
3
4
1 2 3 4 5
Heig
ht
Length
Rigth Surface
0-1000 1000-2000 2000-3000
1
2
3
4
1 2 3 4 5
Heig
ht
Length
Left Surface
0-500 500-1000 1000-1500
1500-2000 2000-2500
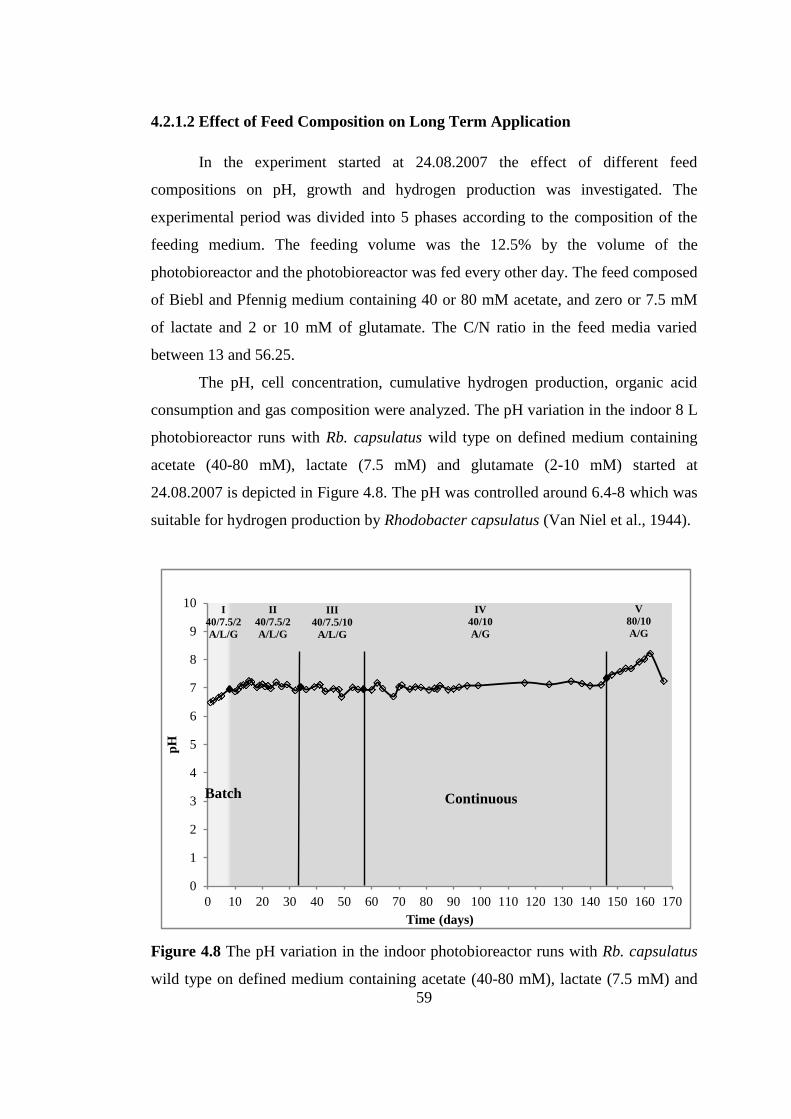
59
4.2.1.2 Effect of Feed Composition on Long Term Application
In the experiment started at 24.08.2007 the effect of different feed
compositions on pH, growth and hydrogen production was investigated. The
experimental period was divided into 5 phases according to the composition of the
feeding medium. The feeding volume was the 12.5% by the volume of the
photobioreactor and the photobioreactor was fed every other day. The feed composed
of Biebl and Pfennig medium containing 40 or 80 mM acetate, and zero or 7.5 mM
of lactate and 2 or 10 mM of glutamate. The C/N ratio in the feed media varied
between 13 and 56.25.
The pH, cell concentration, cumulative hydrogen production, organic acid
consumption and gas composition were analyzed. The pH variation in the indoor 8 L
photobioreactor runs with Rb. capsulatus wild type on defined medium containing
acetate (40-80 mM), lactate (7.5 mM) and glutamate (2-10 mM) started at
24.08.2007 is depicted in Figure 4.8. The pH was controlled around 6.4-8 which was
suitable for hydrogen production by Rhodobacter capsulatus (Van Niel et al., 1944).
Figure 4.8 The pH variation in the indoor photobioreactor runs with Rb. capsulatus
wild type on defined medium containing acetate (40-80 mM), lactate (7.5 mM) and
0
1
2
3
4
5
6
7
8
9
10
0 10 20 30 40 50 60 70 80 90 100 110 120 130 140 150 160 170
pH
Time (days)
I
40/7.5/2
A/L/G
II
40/7.5/2
A/L/G
III
40/7.5/10
A/L/G
IV
40/10
A/G
V
80/10
A/G
Batch Continuous

60
glutamate (2-10 mM). Starting date of the experiment was 24.08.07. Feeding was
started on 8th
day of the experiment.
The cumulative hydrogen production and biomass in Run240807 are shown
in Figure 4.9. Phase I is the start-up period and it was run in batch mode. The
photobioreactor was started with 2 liters of activated grown culture (corresponding to
25% of the reactor volume) and 6 liters of 40 mM acetate, 7.5 mM lactate and 2 mM
glutamate containing BP medium (C/N ratio was 56.25). The cell concentration was
lower than the critical cell concentration (0.3 gdcw/Lc) required for hydrogen
production (Eroglu et al., 2008). Hence the lowest molar hydrogen yield (5%), and
productivity (0.06 mmolesH2/Lc.h) were observed in this phase and light conversion
efficiency (0.09%) was also same with the light conversion efficiency obtained in
last phase. Also, no feeding was done in this phase.
Figure 4.9 Cumulative hydrogen production and biomass in the indoor
photobioreactor runs with Rb. capsulatus wild type on defined medium containing
acetate (40-80 mM), lactate (7.5 mM) and glutamate (2-10 mM). Starting date of the
experiment was 24.08.07. Feeding was started on 8th
day of the experiment.
0
10
20
30
40
50
60
70
80
90
0,0
0,2
0,4
0,6
0,8
1,0
1,2
0 10 20 30 40 50 60 70 80 90 100 110 120 130 140 150 160 170
Cu
mu
lativ
e H2 P
rod
uctio
n (L
) Cel
l C
on
cen
rati
on
(g
dcw
/Lc)
Time (days)
Biomass Hydrogen Production (L)
I
40/7.5/2
A/L/G
II
40/7.5/2
A/L/G
III
40/7.5/10
A/L/G
IV
40/10
A/G
V
80/10
A/G
Batch
Continuous

61
In the phase II, continuous feeding of hydrogen production medium was
introduced to the photobioreactor. The feed contained acetate (40 mM) and lactate
(7.5 mM) and glutamate (2 mM) (C/N ratio was 56.25). The cell concentration was
between 0.2 gdcw/Lc – 0.4 gdcw/Lc in this phase and the hydrogen productivity,
molar hydrogen yield and light conversion efficiency were 0.11 mmolesH2/Lc.h,
17%, and 0.15%, respectively. The organic acid concentration in Run240807 is
shown in Figure 4.10. In this phase acetate concentration in the photobioreactor was
stabilized around 2 mM and lactate was utilized completely. The by-products of
photofermentation as propionic acid and butyric acid remained below 1 mM in this
phase.
Figure 4.10 Organic acids concentration in the indoor photobioreactor runs with Rb.
capsulatus wild type on defined medium containing acetate (40-80 mM), lactate (7.5
mM) and glutamate (2-10 mM). Starting date of the experiment was 24.08.07.
Feeding was started on 8th
day of the experiment.
In the phase III, acetate and lactate concentration were kept same in the feed
but the glutamate concentration was increased from 2 mM to 10 mM (C/N ratio was
0
5
10
15
20
25
30
35
40
0 10 20 30 40 50 60 70 80 90 100 110 120 130 140 150 160 170
Co
nce
ntr
ati
on
(m
M)
Time (days)
LA(mM) AA(mM) PA(mM) BA(mM)
II
40/7.5/2
A/L/G
III
40/7.5/10
A/L/G
IV
40/10
A/G
V
80/10
A/G
Continuous
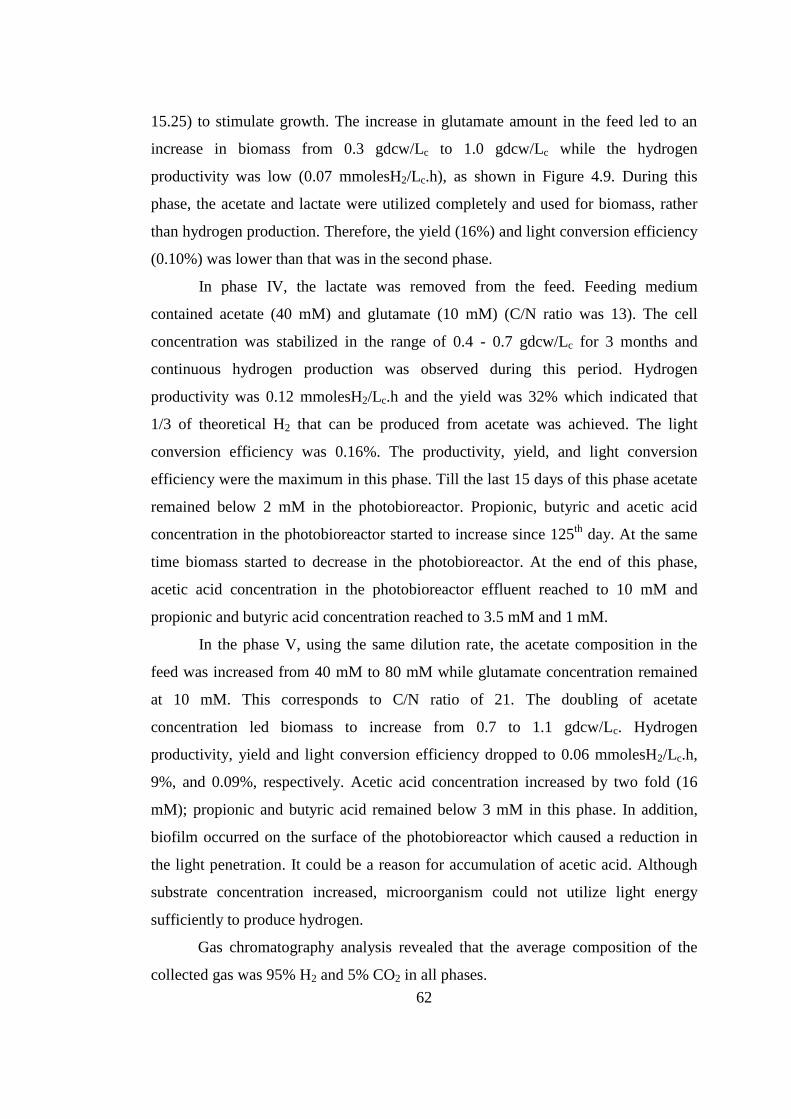
62
15.25) to stimulate growth. The increase in glutamate amount in the feed led to an
increase in biomass from 0.3 gdcw/Lc to 1.0 gdcw/Lc while the hydrogen
productivity was low (0.07 mmolesH2/Lc.h), as shown in Figure 4.9. During this
phase, the acetate and lactate were utilized completely and used for biomass, rather
than hydrogen production. Therefore, the yield (16%) and light conversion efficiency
(0.10%) was lower than that was in the second phase.
In phase IV, the lactate was removed from the feed. Feeding medium
contained acetate (40 mM) and glutamate (10 mM) (C/N ratio was 13). The cell
concentration was stabilized in the range of 0.4 - 0.7 gdcw/Lc for 3 months and
continuous hydrogen production was observed during this period. Hydrogen
productivity was 0.12 mmolesH2/Lc.h and the yield was 32% which indicated that
1/3 of theoretical H2 that can be produced from acetate was achieved. The light
conversion efficiency was 0.16%. The productivity, yield, and light conversion
efficiency were the maximum in this phase. Till the last 15 days of this phase acetate
remained below 2 mM in the photobioreactor. Propionic, butyric and acetic acid
concentration in the photobioreactor started to increase since 125th
day. At the same
time biomass started to decrease in the photobioreactor. At the end of this phase,
acetic acid concentration in the photobioreactor effluent reached to 10 mM and
propionic and butyric acid concentration reached to 3.5 mM and 1 mM.
In the phase V, using the same dilution rate, the acetate composition in the
feed was increased from 40 mM to 80 mM while glutamate concentration remained
at 10 mM. This corresponds to C/N ratio of 21. The doubling of acetate
concentration led biomass to increase from 0.7 to 1.1 gdcw/Lc. Hydrogen
productivity, yield and light conversion efficiency dropped to 0.06 mmolesH2/Lc.h,
9%, and 0.09%, respectively. Acetic acid concentration increased by two fold (16
mM); propionic and butyric acid remained below 3 mM in this phase. In addition,
biofilm occurred on the surface of the photobioreactor which caused a reduction in
the light penetration. It could be a reason for accumulation of acetic acid. Although
substrate concentration increased, microorganism could not utilize light energy
sufficiently to produce hydrogen.
Gas chromatography analysis revealed that the average composition of the
collected gas was 95% H2 and 5% CO2 in all phases.
63
The maximum hydrogen production (0.12 mmolesH2/Lc.h) was obtained in
the fourth phase and it was lower than the productivity (0.6 mmolesH2/Lc.h) obtained
in an indoor batch study with Rb. capsulatus where acetate (40 mM) and glutamate
(2 mM) were used (Ozgur et al., 2009). The lower productivity might be attributed to
the scale differences, and the operational mode.
The productivity, molar yield and the light conversion efficiency of all phases
of Run240807 are tabulated in Table 4.4.
Table 4.4 Productivity, and molar yield values obtained during the fed batch
operation of the indoor 8 L photobioreactor runs with Rb. capsulatus wild type on
defined medium containing acetate (40-80 mM), lactate (7.5 mM) and glutamate (2-
10 mM).
Phases Duration
(days)
Productivity
mmolesH2/Lc.h
Molar Yield
(%)
I 7 0.06 5
II 25 0.11 17
III 21 0.07 16
IV 91 0.12 32
V 23 0.06 9
Results indicate that continuous hydrogen production has been achieved with
fed batch operation.
4.2.1.3 Effect of Increased Glutamate Amount in the Feed on Hydrogen
Production
To determine effect of increased glutamate amount average biomass
concentration, productivity, and molar yield of Run240807 at Phase II and III in
which feeding medium containing 40 mM acetate, 7.5 mM lactate ad 2 mM
glutamate and 40 mM acetate, 7.5 mM lactate ad 10 mM glutamate was given to the
PBR, respectively are compared in Table 4.5.

64
Table 4.5 Feed content, average biomass concentration, productivity, and molar
yield values obtained in the indoor 8 L photobioreactor runs with Rb. capsulatus wild
type on defined medium containing acetate (40-80 mM), lactate (7.5 mM) and
glutamate (2-10 mM)in the Phase II and III.
Phases Feed
Content
Average
Biomass
Concentration
(gdcw/Lc)
Productivity
(mmolesH2/Lc.h)
Molar
Yield
(%)
II 40/7.5/2 0.363 0.11 17
III 40/7.5/10 0.576 0.07 16
In Phase II, productivity was higher than that obtained at the third phase.
Molar yield was similar with the yield in the third phase. This can be attributed to the
increased amount of glutamate in the feeding medium in the third phase because it
led to a decrease in evolution of hydrogen (Gest and Kamen, 1949). Adversely the
biomass concentration in the third phase was 1.58 fold of the average biomass
concentration in the second phase because increased glutamate amount led to an
increase in cell concentration (Meyer et al., 1978). In addition to that Miyake et al
(1982) stated that small amount of nitrogen sources lengthened the period of
hydrogen production in the case of Rhodosprillum rubrum. As a result increased
nitrogen sources in acceptable amounts in the feeding medium reduces hydrogen
production, increases biomass, provides prolonged hydrogen production.
4.2.1.4 Effect of Removing Lactate from the Feeding Media on Hydrogen
Production
For seeing the effect of lactate on hydrogen production and biomass growth,
lactate was removed from the feeding medium in the fourth phase. For comparison
average biomass concentration, productivity, and molar yield values obtained in
Run240807 in the Phase III and IV are tabulated in Table 4.6.
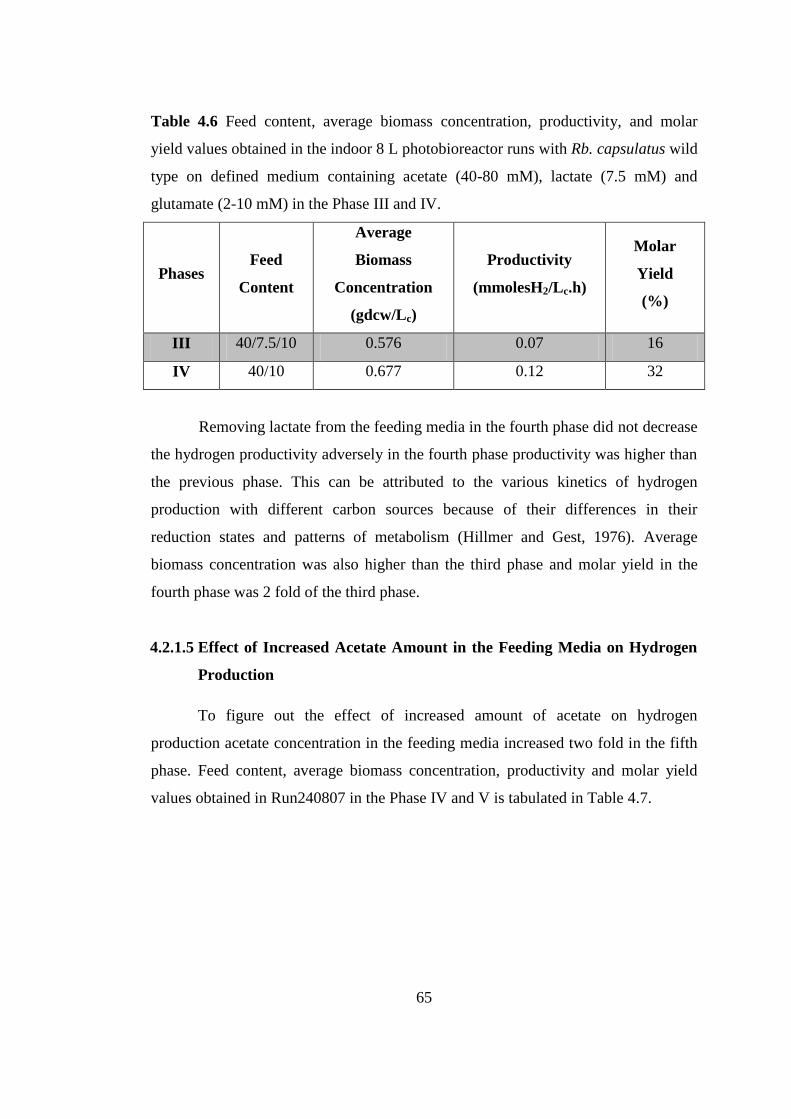
65
Table 4.6 Feed content, average biomass concentration, productivity, and molar
yield values obtained in the indoor 8 L photobioreactor runs with Rb. capsulatus wild
type on defined medium containing acetate (40-80 mM), lactate (7.5 mM) and
glutamate (2-10 mM) in the Phase III and IV.
Phases Feed
Content
Average
Biomass
Concentration
(gdcw/Lc)
Productivity
(mmolesH2/Lc.h)
Molar
Yield
(%)
III 40/7.5/10 0.576 0.07 16
IV 40/10 0.677 0.12 32
Removing lactate from the feeding media in the fourth phase did not decrease
the hydrogen productivity adversely in the fourth phase productivity was higher than
the previous phase. This can be attributed to the various kinetics of hydrogen
production with different carbon sources because of their differences in their
reduction states and patterns of metabolism (Hillmer and Gest, 1976). Average
biomass concentration was also higher than the third phase and molar yield in the
fourth phase was 2 fold of the third phase.
4.2.1.5 Effect of Increased Acetate Amount in the Feeding Media on Hydrogen
Production
To figure out the effect of increased amount of acetate on hydrogen
production acetate concentration in the feeding media increased two fold in the fifth
phase. Feed content, average biomass concentration, productivity and molar yield
values obtained in Run240807 in the Phase IV and V is tabulated in Table 4.7.

66
Table 4.7 Feed content, average biomass concentration, productivity and molar yield
values obtained in the indoor 8 L photobioreactor runs with Rb. capsulatus wild type
on defined medium containing acetate (40-80 mM), lactate (7.5 mM) and glutamate
(2-10 mM) in the Phase IV and V
Phases Feed
Content
Average
Biomass
Concentration
(gdcw/Lc)
Productivity
(mmolesH2/Lc.h)
Molar
Yield
(%)
IV 40/10 0.677 0.12 32
V 80/10 0.842 0.06 9
Increased acetate amount in the feeding media led to increase of 1.24 fold in
average biomass concentration but decrease in hydrogen production to its half in the
fifth phase. This can be attributed to the biofilm formation on the surface of the
photobioreactor in the last phase. Because in the biofilm formed PBRs light cannot
penetrate into the deeper part of the photobioreactors efficiently. So, light conversion
efficiency decreases (Zhang et al., 2010) on account of hydrogen productivity
decrease. Barbosa et al. (2001) also stated that at a certain biomass concentration and
light intensity light can become a limiting factor for hydrogen production due to self-
shading and light absorption by the cells close to the illuminated surface.
Lower molar yield considering increased acetate amount was very low in the
fifth phase. This can be attributed to inhibitory effect of acetate concentration on
hydrogen production. Asada et al. (2008) also studied hydrogen production by gel
immobilized Rb. sphaeroides RV on 21 mM, 42 mM, 84 mM and 168 mM acetate
containing medium and showed that maximum hydrogen production was obtained on
the medium containing 42 mM acetate and emphasized that higher concentrations of
acetate (84 or 168 mM) inhibited hydrogen production.
4.2.1.6 Effect of C/N Ratio on Hydrogen Production
For determining the effect of carbon to nitrogen ratio on hydrogen production
different feed compositions was fed to photobioreactor. For this purpose C/N ratio,

67
productivity and molar yield values obtained in Run240807 are tabulated in Table
4.8.
Table 4.8 C/N ratio, productivity and molar yield values obtained in the indoor 8 L
photobioreactor runs with Rb. capsulatus wild type on defined medium containing
acetate (40-80 mM), lactate (7.5 mM) and glutamate (2-10 mM) in the Phase II, III,
IV and V
Phases C/N Productivity
(mmolesH2/Lc.h)
Molar
Yield
(%)
II 56.25 0.11 17
III 15.25 0.07 16
IV 13 0.12 32
V 21 0.06 9
Maximum hydrogen production and molar yield was obtained in the fourth
phase. In this phase C/N ratio was the lowest and 13. Kuriaki et al (1998) stated that
maximum hydrogen production was observed as the C/N ratio was 22.8 and Androga
et al (2009) was also showed that maximum hydrogen production was obtained in the
experiment that the C/N value was 25.
4.2.2 Outdoor Lab-Scale Panel Photobioreactors
In outdoor experiments two 8 liters flat plate photobioreactors without
cooling were used. Rhodobacter capsulatus wild type was used as microbial strain.
The photobioreactors were placed on a chromium-nickel construction 25 cm apart
vertically in an east-west position for optimum heat input, light intensity utilization
and temperature control (Modigell and Hall 1998). After 12th
of November, air
temperature during days decreased below 10 0C and reactors were moved to indoor.
The experiment continued for 134 days in the photobioreactor started at 26.09.07. All
gas measurements were corrected by calculating permeability of hydrogen through
reactor surface and solubility of hydrogen in water and carryover amounts in inocula.

68
Methods for calculating hydrogen permeability through solids and solubility in water
and are given in Appendix G and H, respectively. Experimental data are given in
Appendix M.3. In experimental period feed composition was changed 2 times in
order to see the effect of feed composition on growth and hydrogen production. The
experiment continued for 160 days in the photobioreactor started at 310807.
Experimental data are given in Appendix M.4. In experimental period feed
composition was changed 3 times in order to see the effect of feed composition on
growth and hydrogen production. The pH, cell concentration, and cumulative
hydrogen production, organic acid consumption and gas composition were analyzed.
The photobioreactor temperature was recorded continuously. The total global solar
radiation data was taken from the National Meteorology Institute in Ankara. The
definition of total global solar radiation is given in Appendix J.
4.2.2.1 Variation in Photobioreactor Temperature
The variation in temperature in the outdoor 8 L photobioreactors runs with
Rb. capsulatus wild type on defined medium containing acetate (40-80 mM), lactate
(7.5 mM) and glutamate (2-10 mM) started at 26.09.07 and 31.08.07 are shown in
Figure4.11 and 4.12, respectively. The photobioreactor temperature decreased and
around 20 0C in daytime in the first week of November so the reactors were moved
in indoor during the December and January. The temperature of the photobioreactors
in indoor was kept higher than 25 0C with a heater placed into the room and they
were illuminated with tungsten lamps.
The photobioreactor temperature in Run260907 increased up to50 0C in
daytimes and decreased below 10 0C at nights in the first 15 days of the experiment
so the temperature difference between day and night reached up to 40 0C in these
days. After the batch period of Run260907 the photobioreactor temperature
decreased below 40 0C during days and 5
0C during nights. The photobioreactor
temperature continued decreasing down to 20 0C in the daytime till the
photobioreactor was carried out to indoor.
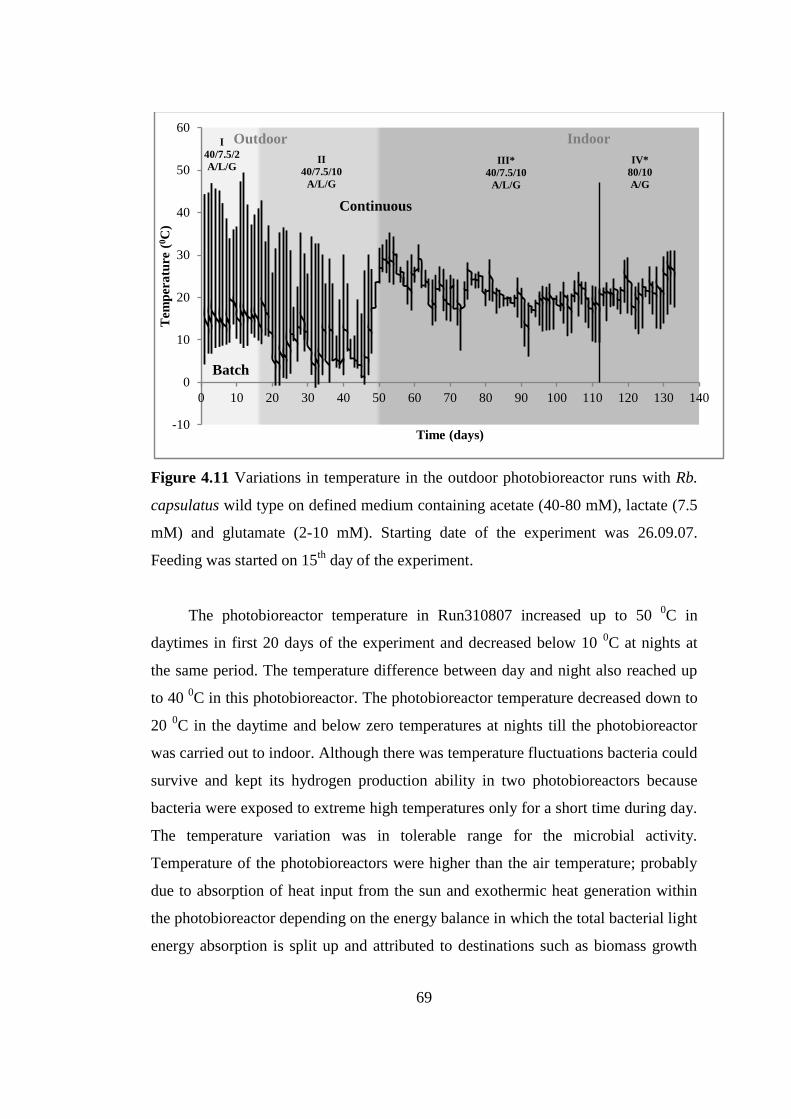
69
Figure 4.11 Variations in temperature in the outdoor photobioreactor runs with Rb.
capsulatus wild type on defined medium containing acetate (40-80 mM), lactate (7.5
mM) and glutamate (2-10 mM). Starting date of the experiment was 26.09.07.
Feeding was started on 15th
day of the experiment.
The photobioreactor temperature in Run310807 increased up to 50 0C in
daytimes in first 20 days of the experiment and decreased below 10 0C at nights at
the same period. The temperature difference between day and night also reached up
to 40 0C in this photobioreactor. The photobioreactor temperature decreased down to
20 0C in the daytime and below zero temperatures at nights till the photobioreactor
was carried out to indoor. Although there was temperature fluctuations bacteria could
survive and kept its hydrogen production ability in two photobioreactors because
bacteria were exposed to extreme high temperatures only for a short time during day.
The temperature variation was in tolerable range for the microbial activity.
Temperature of the photobioreactors were higher than the air temperature; probably
due to absorption of heat input from the sun and exothermic heat generation within
the photobioreactor depending on the energy balance in which the total bacterial light
energy absorption is split up and attributed to destinations such as biomass growth
-10
0
10
20
30
40
50
60
0 10 20 30 40 50 60 70 80 90 100 110 120 130 140
Tem
per
atu
re (
0C
)
Time (days)
II
40/7.5/10
A/L/G
III*
40/7.5/10
A/L/G
IV*
80/10
A/G
I
40/7.5/2
A/L/G
Batch
Continuous
Indoor Outdoor

70
and maintenance, generation of hydrogen and heat dissipation (Hoekama et al.,
2006).
Figure 4.12 Variations in temperature in the outdoor photobioreactor runs with Rb.
capsulatus wild type on defined medium containing acetate (40-80 mM), lactate (7.5
mM) and glutamate (2-10 mM). Starting date of the experiment was 31.08.07.
Feeding was started on 6th
day of the experiment.
Daily global solar radiation energy of the first 74 days of the Run310807 and
first 48 days of the Run260907 is illustrated in Figure 4.13. Global solar radiation
energy during the start-up days of Run310807 and Run260907 was around 5700
Wh/m2
and 4900 Wh/m2, respectively. It decreased to 2600 Wh/m
2 before the
photobioreactors were carried out to the indoor.
-10
0
10
20
30
40
50
60
0 10 20 30 40 50 60 70 80 90 100 110 120 130 140 150 160
Tem
per
atu
re(0
C)
Time (days)
I
40/7.5/2
A/L/G
II
effluent of
indoor reactor III
40/7.5/10
A/L/G
IV*
40/7.5/10
A/L/G
V*
80/10
A/G Batch
Continuous
Indoor Outdoor

71
Figure 4.13 Daily global solar radiation energy during outdoor period of the
photobioreactors (Run260907 and Run310807) run with Rb. capsulatus wild type on
defined medium containing acetate (40-80 mM), lactate (7.5 mM) and glutamate (2-
10 mM). Starting date of the data is 31.08.07.
4.2.2.2 Effect of Feed Composition on Long Term Operation
The effect of feed composition on long term behavior of fed-batch
photobioreactors was investigated in outdoor conditions in two parallel runs. Figure
4.14 is the plot of the pH variation of Run260907. The pH was controlled around 7.0
in the first three phases but in the last phase pH increased to 8.0. Increase in acetate
concentration in the feeding media in the last phase might be a reason for the
increase in pH.
0
1000
2000
3000
4000
5000
6000
7000
0 10 20 30 40 50 60 70 80
Da
ily
Glo
ba
l S
ola
r R
ad
iati
on
(W
h/m
2)
Time (days)
Run310807
Run260907
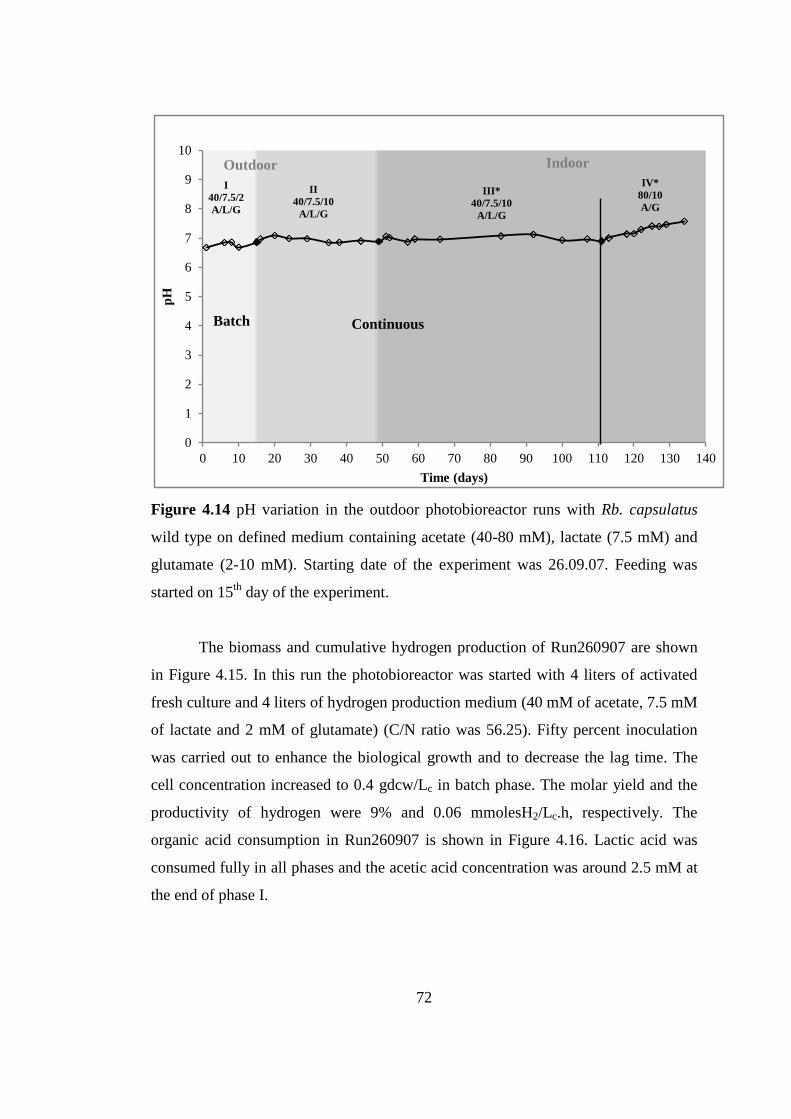
72
Figure 4.14 pH variation in the outdoor photobioreactor runs with Rb. capsulatus
wild type on defined medium containing acetate (40-80 mM), lactate (7.5 mM) and
glutamate (2-10 mM). Starting date of the experiment was 26.09.07. Feeding was
started on 15th
day of the experiment.
The biomass and cumulative hydrogen production of Run260907 are shown
in Figure 4.15. In this run the photobioreactor was started with 4 liters of activated
fresh culture and 4 liters of hydrogen production medium (40 mM of acetate, 7.5 mM
of lactate and 2 mM of glutamate) (C/N ratio was 56.25). Fifty percent inoculation
was carried out to enhance the biological growth and to decrease the lag time. The
cell concentration increased to 0.4 gdcw/Lc in batch phase. The molar yield and the
productivity of hydrogen were 9% and 0.06 mmolesH2/Lc.h, respectively. The
organic acid consumption in Run260907 is shown in Figure 4.16. Lactic acid was
consumed fully in all phases and the acetic acid concentration was around 2.5 mM at
the end of phase I.
0
1
2
3
4
5
6
7
8
9
10
0 10 20 30 40 50 60 70 80 90 100 110 120 130 140
pH
Time (days)
II
40/7.5/10
A/L/G
III*
40/7.5/10
A/L/G
IV*
80/10
A/G
I
40/7.5/2
A/L/G
Batch Continuous
Indoor Outdoor

73
Figure 4.15 Growth and cumulative hydrogen production in the outdoor
photobioreactor runs with Rb. capsulatus wild type on defined medium containing
acetate (40-80 mM), lactate (7.5 mM) and glutamate (2-10 mM). Starting date of the
experiment was 26.09.07. Feeding was started on 15th
day of the experiment.
After 14 days of batch period medium containing 40 mM acetate, 7.5 mM
lactate and 10 mM glutamate (corresponding to C/N ratio of 15.25) was fed to the
photobioreactor. The biomass increased to 0.9 gdcw/Lc due to high glutamate
concentration in the feed. The hydrogen productivity and the molar yield were 0.06
mmolesH2/Lc.h and 13%, respectively. In this phase, acetic acid concentration
remained around 2.5 mM and lactate was depleted, propionic and the butyric acid
concentrations were negligible.
In phase III, due to the onset of winter, temperature (especially at night) of the
photobioreactor decreased and the photobioreactor was carried out to indoor. Feed
rate and composition was kept the same with the previous phase, and continuous
illumination using two tungsten lamps was provided. Biomass stabilized at 0.9
gdcw/Lc and hydrogen productivity was about 0.04 mmolesH2/Lc.h. The molar yield
of hydrogen was 16% Acetate concentration was around 5 mM in the
0
5
10
15
20
25
30
0,0
0,2
0,4
0,6
0,8
1,0
1,2
0 10 20 30 40 50 60 70 80 90 100 110 120 130 140
Cm
ula
tive H
2 Pro
du
ction
(L) C
ell
Co
nce
ntr
ati
on
(g
dcw
/Lc)
Time (days)
Biomass Hydrogen Production (L)
I
40/7.5/2
A/L/G
II
40/7.5/10
A/L/G
III*
40/7.5/10
A/L/G
IV*
80/10
A/G
Outdoor Indoor
Batch Continuous
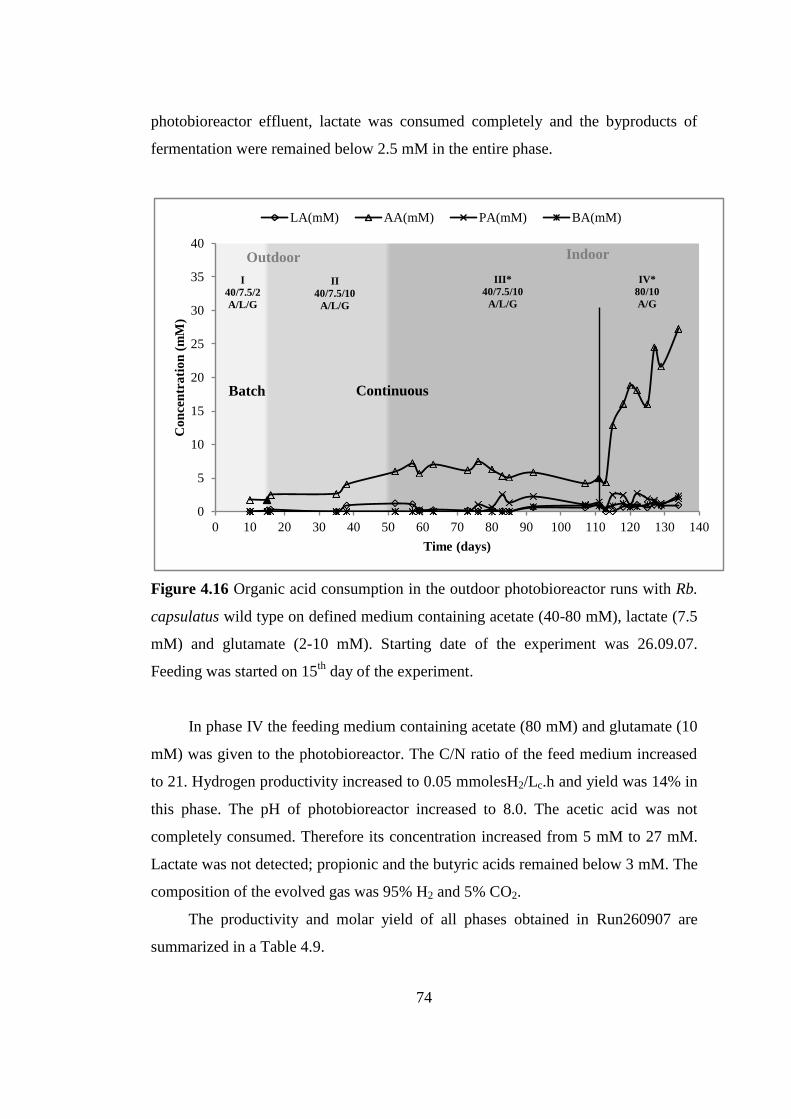
74
photobioreactor effluent, lactate was consumed completely and the byproducts of
fermentation were remained below 2.5 mM in the entire phase.
Figure 4.16 Organic acid consumption in the outdoor photobioreactor runs with Rb.
capsulatus wild type on defined medium containing acetate (40-80 mM), lactate (7.5
mM) and glutamate (2-10 mM). Starting date of the experiment was 26.09.07.
Feeding was started on 15th
day of the experiment.
In phase IV the feeding medium containing acetate (80 mM) and glutamate (10
mM) was given to the photobioreactor. The C/N ratio of the feed medium increased
to 21. Hydrogen productivity increased to 0.05 mmolesH2/Lc.h and yield was 14% in
this phase. The pH of photobioreactor increased to 8.0. The acetic acid was not
completely consumed. Therefore its concentration increased from 5 mM to 27 mM.
Lactate was not detected; propionic and the butyric acids remained below 3 mM. The
composition of the evolved gas was 95% H2 and 5% CO2.
The productivity and molar yield of all phases obtained in Run260907 are
summarized in a Table 4.9.
0
5
10
15
20
25
30
35
40
0 10 20 30 40 50 60 70 80 90 100 110 120 130 140
Co
nce
ntr
ati
on
(m
M)
Time (days)
LA(mM) AA(mM) PA(mM) BA(mM)
I
40/7.5/2
A/L/G
II
40/7.5/10
A/L/G
III*
40/7.5/10
A/L/G
IV*
80/10
A/G
Outdoor Indoor
Batch Continuous

75
Table 4.9 The productivity and molar yield of all phases obtained in the outdoor 8 L
photobioreactor runs with Rb. capsulatus wild type on defined medium containing
acetate (40-80 mM), lactate (7.5 mM) and glutamate (2-10 mM)
Phases Productivity
(mmolesH2/Lc.h)
Yield
(%)
I 0.06 9
II 0.06 13
III 0.04 16
IV 0.05 14
Maximum hydrogen productivity was obtained in the first two phases in which
the photobioreactor was operated in outdoor conditions and the cell concentration
was in the exponential phase. The maximum molar yield was obtained in the third
phase.
In Run310807 the effect of different feed compositions on pH, growth and
hydrogen production in outdoor and indoor conditions was also investigated. Figure
4.17 is the plot of the pH variation in the outdoor 8 L photobioreactor run with Rb.
capsulatus wild type on defined medium containing acetate (40-80 mM), lactate (7.5
mM) and glutamate (2-10 mM) started at 31.08.07. The pH was controlled around
7.0 in the entire processes.

76
Figure 4.17 pH variations in the outdoor photobioreactor runs with Rb. capsulatus
wild type on defined medium containing acetate (40-80 mM), lactate (7.5 mM) and
glutamate (2-10 mM). Starting date of the experiment was 31.08.07. Feeding was
started on 6th
day of the experiment.
The biomass and the cumulative hydrogen production of Run310807 are shown
in Figure 4.18. Photobioreactor was started with 6 liters of hydrogen production
medium containing acetate (40 mM), lactate (7.5 mM) and glutamate (2 mM) (C/N
ratio was 56.25) and 2 liters of activated culture (25% inoculation by the volume of
the reactor). The cell concentration was 0.02 gdcw/Lc in the first 6 days. That’s why
hydrogen production was almost negligible.
In the second phase effluent of indoor photobioreactor containing biomass was
fed to the photobioreactor at every two days in order to increase cell concentration.
Average cell concentration was 0.2 gdcw/Lc in this phase. Feeding the reactor with
the effluent of indoor photobioreactor didn’t work well. It doesn’t contain enough
substrate to support bacterial growth at high temperature. The bacteria started to
produce hydrogen after 13th
day but it continued only a few days and then stopped
0
1
2
3
4
5
6
7
8
9
10
0 10 20 30 40 50 60 70 80 90 100 110 120 130 140 150 160
pH
Time (days)
I
40/7.5/2
A/L/G II
effluent of
indoor reactor
III
40/7.5/10
A/L/G
IV*
40/7.5/10
A/L/G
V*
80/10
A/G
Outdoor Indoor
Batch Continuous
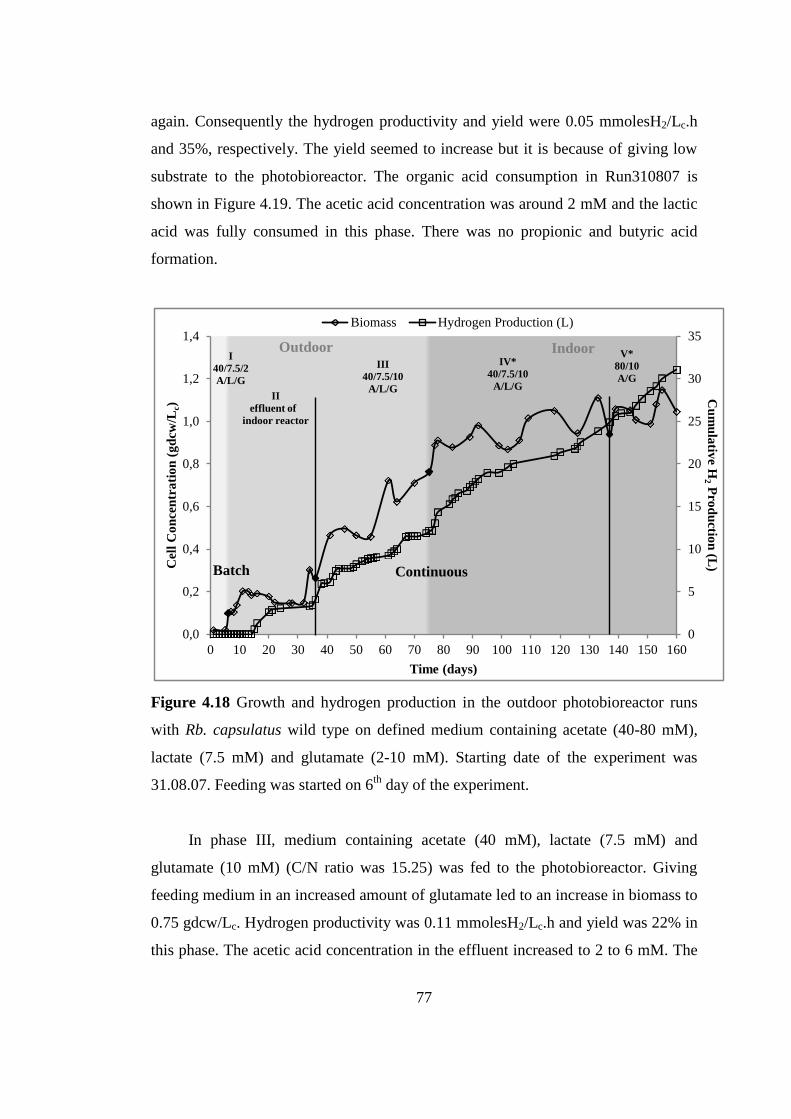
77
again. Consequently the hydrogen productivity and yield were 0.05 mmolesH2/Lc.h
and 35%, respectively. The yield seemed to increase but it is because of giving low
substrate to the photobioreactor. The organic acid consumption in Run310807 is
shown in Figure 4.19. The acetic acid concentration was around 2 mM and the lactic
acid was fully consumed in this phase. There was no propionic and butyric acid
formation.
Figure 4.18 Growth and hydrogen production in the outdoor photobioreactor runs
with Rb. capsulatus wild type on defined medium containing acetate (40-80 mM),
lactate (7.5 mM) and glutamate (2-10 mM). Starting date of the experiment was
31.08.07. Feeding was started on 6th
day of the experiment.
In phase III, medium containing acetate (40 mM), lactate (7.5 mM) and
glutamate (10 mM) (C/N ratio was 15.25) was fed to the photobioreactor. Giving
feeding medium in an increased amount of glutamate led to an increase in biomass to
0.75 gdcw/Lc. Hydrogen productivity was 0.11 mmolesH2/Lc.h and yield was 22% in
this phase. The acetic acid concentration in the effluent increased to 2 to 6 mM. The
0
5
10
15
20
25
30
35
0,0
0,2
0,4
0,6
0,8
1,0
1,2
1,4
0 10 20 30 40 50 60 70 80 90 100 110 120 130 140 150 160
Cu
mu
lativ
e H2 P
rod
uctio
n (L
) Cel
l C
on
cen
tra
tio
n (
gd
cw/L
c)
Time (days)
Biomass Hydrogen Production (L)
I
40/7.5/2
A/L/G
II
effluent of
indoor reactor
IV*
40/7.5/10
A/L/G
V*
80/10
A/G
III
40/7.5/10
A/L/G
Outdoor Indoor
Batch Continuous

negligible.
78
lactic acid concentration was around 1.5 mM. Propionic and butyric acid
concentrations were
Figure 4.19 Organic acid consumption in the outdoor photobioreactor runs with Rb.
capsulatus wild type on defined medium containing acetate (40-80 mM), lactate (7.5
mM) and glutamate (2-10 mM). Starting date of the experiment was 31.08.07.
Feeding was started on 6th
day of the experiment.
In phase IV, the photobioreactor was taken to the indoor. Here continuous
illumination was provided using two tungsten lamps 15 cm away from one side of
the reactor. The same feed composition and dilution rate as in phase II was used. The
biomass stabilized at around 0.9 gdcw/Lc. The hydrogen productivity was 0.07
mmolesH2/Lc.h; molar yield was 23% in this phase. In this phase the acetic acid
concentration was around 6mM as the previous phase. Lactic acid in the system was
consumed almost fully. Propionic and butyric acid concentrations were also
negligible.
In phase V, the acetate concentration in the feed was increased to 80 mM and
glutamate concentration was remained in 10 mM. The C/N ratio of the feeding media
was 21. The same dilution rate was used in this phase. As a result of increase (two
0
5
10
15
20
25
30
35
40
0 10 20 30 40 50 60 70 80 90 100 110 120 130 140 150 160
Co
nce
ntr
ati
on
(m
M)
Time (days)
LA(mM) AA(mM) PA(mM) BA(mM)
II
effluent of
indoor reactor
III
40/7.5/10
A/L/G
IV*
40/7.5/10
A/L/G
V*
80/10
A/G
Outdoor Indoor
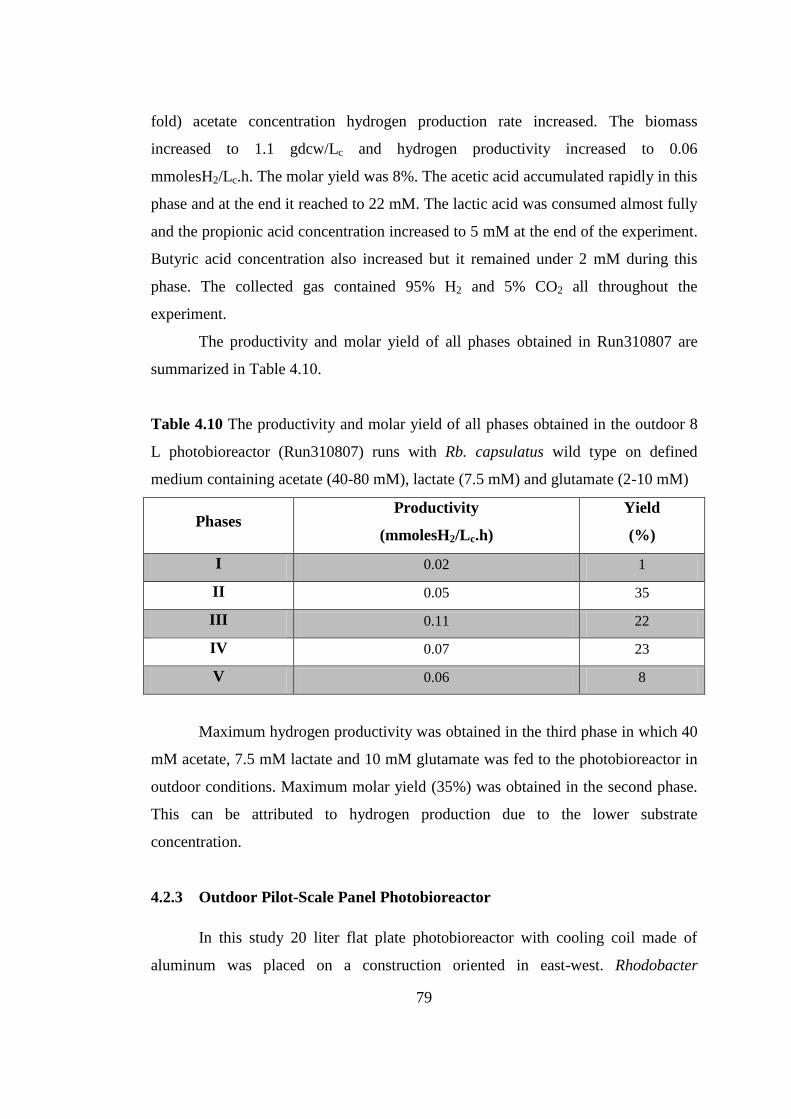
79
fold) acetate concentration hydrogen production rate increased. The biomass
increased to 1.1 gdcw/Lc and hydrogen productivity increased to 0.06
mmolesH2/Lc.h. The molar yield was 8%. The acetic acid accumulated rapidly in this
phase and at the end it reached to 22 mM. The lactic acid was consumed almost fully
and the propionic acid concentration increased to 5 mM at the end of the experiment.
Butyric acid concentration also increased but it remained under 2 mM during this
phase. The collected gas contained 95% H2 and 5% CO2 all throughout the
experiment.
The productivity and molar yield of all phases obtained in Run310807 are
summarized in Table 4.10.
Table 4.10 The productivity and molar yield of all phases obtained in the outdoor 8
L photobioreactor (Run310807) runs with Rb. capsulatus wild type on defined
medium containing acetate (40-80 mM), lactate (7.5 mM) and glutamate (2-10 mM)
Phases Productivity
(mmolesH2/Lc.h)
Yield
(%)
I 0.02 1
II 0.05 35
III 0.11 22
IV 0.07 23
V 0.06 8
Maximum hydrogen productivity was obtained in the third phase in which 40
mM acetate, 7.5 mM lactate and 10 mM glutamate was fed to the photobioreactor in
outdoor conditions. Maximum molar yield (35%) was obtained in the second phase.
This can be attributed to hydrogen production due to the lower substrate
concentration.
4.2.3 Outdoor Pilot-Scale Panel Photobioreactor
In this study 20 liter flat plate photobioreactor with cooling coil made of
aluminum was placed on a construction oriented in east-west. Rhodobacter

80
capsulatus hup- mutant was used as microbial strain. The photobioreactor was
started with 32 liters of hydrogen production medium containing 30 mM of acetate
and 2 mM of glutamate and 8 liters of activated bacteria (20% inoculation) at
02.12.2008. Experimental data are given in Appendix M.5. The Plexiglas bulged and
working volume increased to 45 liters during the experimental period. A systematic
feeding procedure could not be applied because working volume of the
photobioreactor changed day by day. Hydrogen production medium (10% of the
initial volume of the photobioreactor) was given to the photobioreactor for 5 times
during the experiment. The experiment was run in a greenhouse heated with a heater.
By this way the photobioreactor temperature was kept between 20 and 30 0C. All gas
measurements were corrected by calculating permeability of hydrogen through
reactor surface and solubility of hydrogen in water and carryover amounts in
inoculum. Methods for calculating hydrogen permeability through solids and
solubility in water and are given in Appendix G and H, respectively. The pH was
controlled around 7.0 during the process (Figure 4.20).
Figure 4.20 The pH variation in outdoor pilot-scale photobioreactor runs with Rb.
capsulatus hup- on defined medium containing 30 mM acetate and 2 mM glutamate
0
1
2
3
4
5
6
7
8
9
10
0 2 4 6 8 10 12 14 16 18 20 22 24 26 28 30 32 34
pH
Time (days)
Batch Continuous

81
at the start-up period. Starting date of the experiment was 02.12.08. Feeding was
started on 4th
day of the experiment.
The growth and hydrogen production in outdoor pilot-scale photobioreactor
are shown in Figure 4.21. In the first 6 days cell concentration increased to 0.2
gdcw/Lc than remained around this value in the next 9 days. After 15th
day, it
fluctuated between 0.2 – 0.7 gdcw/Lc but it didn’t stabilize. Unstable and low cell
concentration might be due to low temperature and light intensity at that period.
Besides, lack of the uptake hydrogenase enzyme, which utilizes hydrogen when there
is need for energy, might be prevented the microorganism recovering the biomass.
Figure 4.21 Growth and hydrogen production in outdoor pilot-scale photobioreactor
runs with Rb. capsulatus hup- on defined medium containing 30 mM acetate and 2
mM glutamate at the start-up period. Starting date of the experiment was 02.12.08.
Feeding was started on 4th
day of the experiment.
0
5
10
15
20
25
30
0,0
0,1
0,2
0,3
0,4
0,5
0,6
0,7
0,8
0,9
1,0
1,1
1,2
0 2 4 6 8 10 12 14 16 18 20 22 24 26 28 30 32 34
Cu
mu
lativ
e H2 P
rod
uctio
n (L
) Cel
l C
on
cen
tra
tio
n (
gd
cw/L
c)
Time (days)
Biomass Hydrogen Production (L)
Batch Continuous
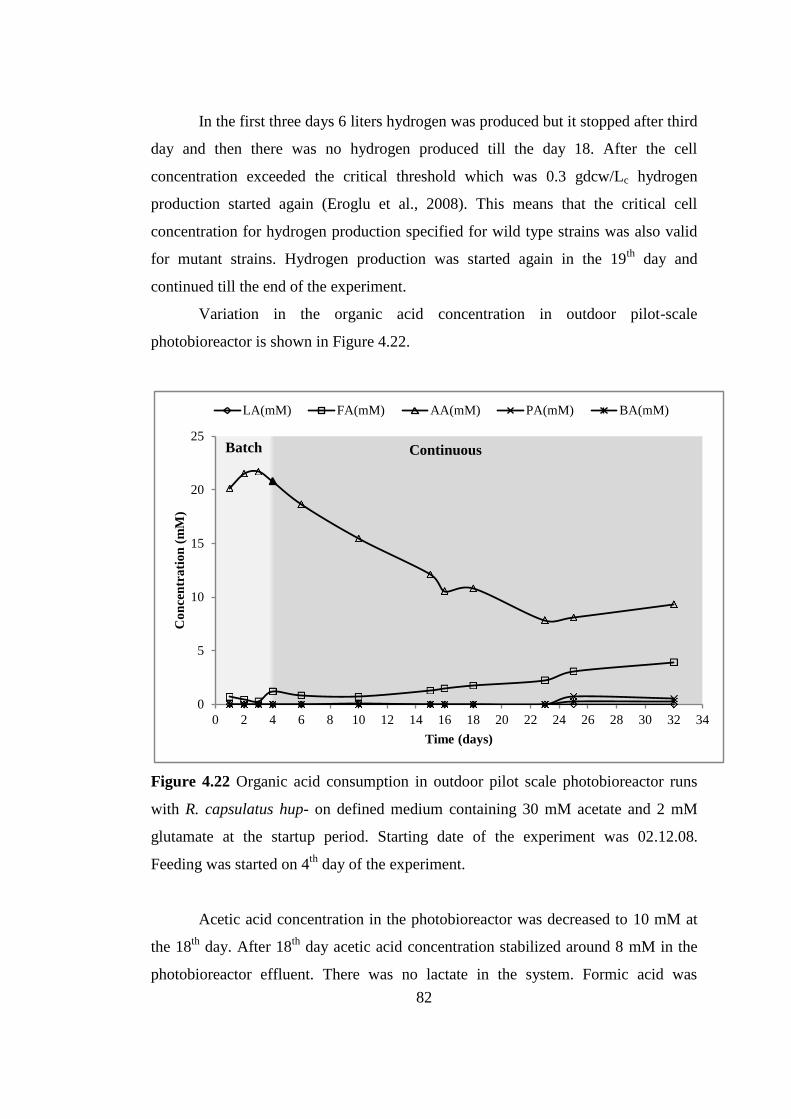
82
In the first three days 6 liters hydrogen was produced but it stopped after third
day and then there was no hydrogen produced till the day 18. After the cell
concentration exceeded the critical threshold which was 0.3 gdcw/Lc hydrogen
production started again (Eroglu et al., 2008). This means that the critical cell
concentration for hydrogen production specified for wild type strains was also valid
for mutant strains. Hydrogen production was started again in the 19th
day and
continued till the end of the experiment.
Variation in the organic acid concentration in outdoor pilot-scale
photobioreactor is shown in Figure 4.22.
Figure 4.22 Organic acid consumption in outdoor pilot scale photobioreactor runs
with R. capsulatus hup- on defined medium containing 30 mM acetate and 2 mM
glutamate at the startup period. Starting date of the experiment was 02.12.08.
Feeding was started on 4th
day of the experiment.
Acetic acid concentration in the photobioreactor was decreased to 10 mM at
the 18th
day. After 18th
day acetic acid concentration stabilized around 8 mM in the
photobioreactor effluent. There was no lactate in the system. Formic acid was
0
5
10
15
20
25
0 2 4 6 8 10 12 14 16 18 20 22 24 26 28 30 32 34
Co
nce
ntr
ati
on
(m
M)
Time (days)
LA(mM) FA(mM) AA(mM) PA(mM) BA(mM)
Batch Continuous

83
produced as a fermentation product but its concentration remained under 4 mM.
Propionic and butyric acid were produced at negligible amounts.
Hydrogen production obtained in this study was 0.08 mmolesH2/Lc.h and
molar yield was 16% at the end of the experiment.
4.2.4 Parameters Affecting Prolonged Hydrogen Production
4.2.4.1 Effect of Inoculum Ratio at the Start-up
The amount of inoculation by freshly grown bacteria at the start-up affected
the duration of batch period, in outdoor experiments. Higher inoculation ratio
resulted in higher biomass concentration at the start-up and bacteria grew more
rapidly due to quorum sensing effect (Waters and Bassler, 2005). Feed content,
percentage of activated bacteria, duration of batch period, biomass concentration at
the end of batch period and hydrogen productivity at start-up in Run240807,
Run260907, Run310807 are given in Table 4.11.
Table 4.11 Feed content, percentage of activated bacteria, duration of batch period,
biomass concentration at the end of batch period and hydrogen productivity at start-
up in three photobioreactors run with Rb. capsulatus wild type on defined medium
containing acetate (40-80 mM), lactate (7.5 mM) and glutamate (2-10 mM) at start-
up, batch period
PBR
(Run
Time)
Feed
Content
Percentage
of
Activated
Bacteria
(v/v)
Duration
of
Batch
Period
(days)
Biomass
Concentration
at the
end of
Batch Period
(gdcw/Lc)
Productivity
(mmolesH2/Lc.h)
240807
(indoor) 40/7.5/2 25% 7 0.167 0.06
260907
(outdoor) 40/7.5/2 50% 14 0.295 0.06
310807
(outdoor) 40/7.5/2 25% 5 0.022 0.02
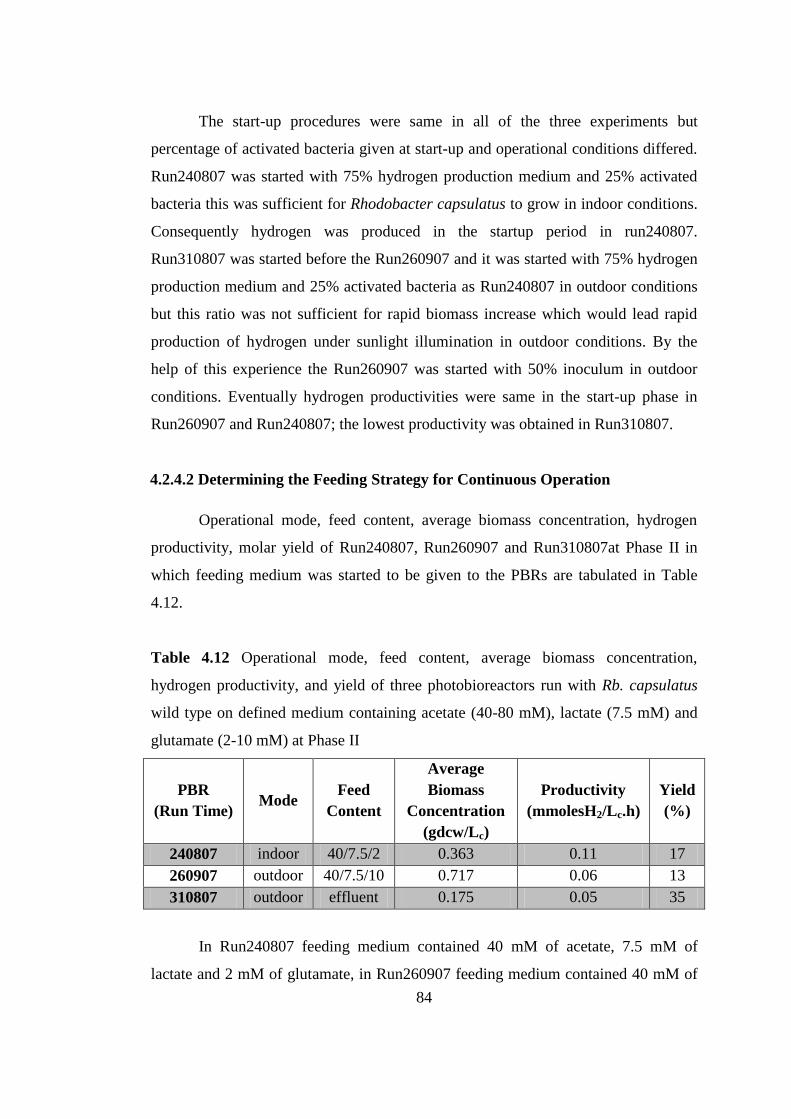
84
The start-up procedures were same in all of the three experiments but
percentage of activated bacteria given at start-up and operational conditions differed.
Run240807 was started with 75% hydrogen production medium and 25% activated
bacteria this was sufficient for Rhodobacter capsulatus to grow in indoor conditions.
Consequently hydrogen was produced in the startup period in run240807.
Run310807 was started before the Run260907 and it was started with 75% hydrogen
production medium and 25% activated bacteria as Run240807 in outdoor conditions
but this ratio was not sufficient for rapid biomass increase which would lead rapid
production of hydrogen under sunlight illumination in outdoor conditions. By the
help of this experience the Run260907 was started with 50% inoculum in outdoor
conditions. Eventually hydrogen productivities were same in the start-up phase in
Run260907 and Run240807; the lowest productivity was obtained in Run310807.
4.2.4.2 Determining the Feeding Strategy for Continuous Operation
Operational mode, feed content, average biomass concentration, hydrogen
productivity, molar yield of Run240807, Run260907 and Run310807at Phase II in
which feeding medium was started to be given to the PBRs are tabulated in Table
4.12.
Table 4.12 Operational mode, feed content, average biomass concentration,
hydrogen productivity, and yield of three photobioreactors run with Rb. capsulatus
wild type on defined medium containing acetate (40-80 mM), lactate (7.5 mM) and
glutamate (2-10 mM) at Phase II
PBR
(Run Time) Mode
Feed
Content
Average
Biomass
Concentration
(gdcw/Lc)
Productivity
(mmolesH2/Lc.h)
Yield
(%)
240807 indoor 40/7.5/2 0.363 0.11 17
260907 outdoor 40/7.5/10 0.717 0.06 13
310807 outdoor effluent 0.175 0.05 35
In Run240807 feeding medium contained 40 mM of acetate, 7.5 mM of
lactate and 2 mM of glutamate, in Run260907 feeding medium contained 40 mM of
85
acetate, 7.5 mM of lactate and 10 mM of glutamate and in Run310807 feeding
medium was the effluent of Run240807. Similar hydrogen productivities were
observed for Run260907 and Run310807, at phase II. Despite introducing poor
substrate into Run310807 photobioreactor, hydrogen productivity was as much as
Run260907. However, yields differed in three photobioreactors and maximum molar
yield was obtained in the Run310807 because hydrogen was evolved due to low
substrate concentration in the feeding medium. Besides, by this feeding strategy that
effluent of Run240807 with biomass was given to Run310807 the cell concentration
could not exceed threshold value (0.3 gdcw/Lc). As a result giving much more
substrate including both carbon and nitrogen source was necessary for continuous
operation and keeping biomass concentration in the critical range for hydrogen
production. There is a maximum threshold value for saturation of hydrogen
production as well as minimum threshold value. The threshold value of saturation of
hydrogen production is 0.7 gdcw/Lc for Rb. sphaeroides B5 (Kim et al., 1987b). On
the other hand feeding media containing 2 and 10 mM glutamate were enough for
biomass increase in indoor and outdoor conditions, respectively. In Run260907
which was a feeding media containing 10 mM glutamate increased biomass
concentration two times than Run240807 fed with 2 mM glutamate amount. In
outdoor conditions, because of fluctuation in temperature, microorganism needed
higher concentration of nitrogen source to support bacterial growth.
Feeding medium (12.5% by the volume of the photobioreactor) was
introduced every other day to the photobioreactor. This corresponds to the hydraulic
retention time of 16 days. This feeding rate caused a fluctuation in biomass,
especially in outdoor conditions. To stabilize the biomass for maximizing the
hydrogen productivity the feed rate increased to 10% daily in the molasses DFE
experiments.
4.3 Hydrogen Production on Dark Fermentor Effluent of Molasses
For the purpose of recovery of waste materials the real dark fermentor effluent
(DFE) of the molasses were used as substrate in the experiments. The composition of
the molasses DFE was given in Table 4.13. In order to obtain environmentally
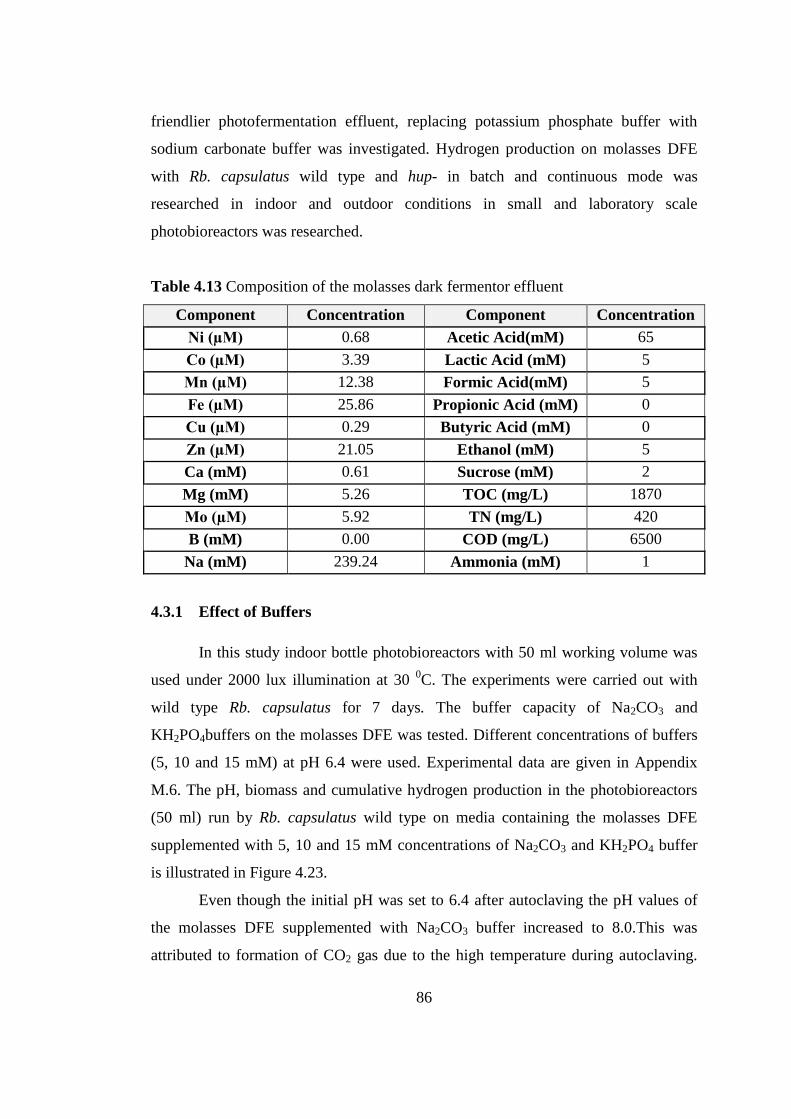
86
friendlier photofermentation effluent, replacing potassium phosphate buffer with
sodium carbonate buffer was investigated. Hydrogen production on molasses DFE
with Rb. capsulatus wild type and hup- in batch and continuous mode was
researched in indoor and outdoor conditions in small and laboratory scale
photobioreactors was researched.
Table 4.13 Composition of the molasses dark fermentor effluent
Component Concentration Component Concentration
Ni (µM) 0.68 Acetic Acid(mM) 65
Co (µM) 3.39 Lactic Acid (mM) 5
Mn (µM) 12.38 Formic Acid(mM) 5
Fe (µM) 25.86 Propionic Acid (mM) 0
Cu (µM) 0.29 Butyric Acid (mM) 0
Zn (µM) 21.05 Ethanol (mM) 5
Ca (mM) 0.61 Sucrose (mM) 2
Mg (mM) 5.26 TOC (mg/L) 1870
Mo (µM) 5.92 TN (mg/L) 420
B (mM) 0.00 COD (mg/L) 6500
Na (mM) 239.24 Ammonia (mM) 1
4.3.1 Effect of Buffers
In this study indoor bottle photobioreactors with 50 ml working volume was
used under 2000 lux illumination at 30 0C. The experiments were carried out with
wild type Rb. capsulatus for 7 days. The buffer capacity of Na2CO3 and
KH2PO4buffers on the molasses DFE was tested. Different concentrations of buffers
(5, 10 and 15 mM) at pH 6.4 were used. Experimental data are given in Appendix
M.6. The pH, biomass and cumulative hydrogen production in the photobioreactors
(50 ml) run by Rb. capsulatus wild type on media containing the molasses DFE
supplemented with 5, 10 and 15 mM concentrations of Na2CO3 and KH2PO4 buffer
is illustrated in Figure 4.23.
Even though the initial pH was set to 6.4 after autoclaving the pH values of
the molasses DFE supplemented with Na2CO3 buffer increased to 8.0.This was
attributed to formation of CO2 gas due to the high temperature during autoclaving.
87
The highest initial and average pH was obtained in the photobioreactor buffered with
15 mM Na2CO3. In addition to that the minimum initial pH and average pH was
obtained in the photobioreactor supplemented with 15 mM KH2PO4. The pH of the
molasses DFE supplemented with 5, 10, 15 mM Na2CO3stabilized around 8.0 along
the experiment. However, the pH values of the photobioreactors that were
supplemented with 5, 10, 15 mM KH2PO4 increased to 8.0 at the end of the
experiment. As a result considering the pH increase at the start-up in the
photobioreactors supplemented with Na2CO3 buffer was tolerable because the pH
increase was up to 8.0 during the experiment. In a study that C. acetobutylicum
19012 was used for hydrogen production in a 120 ml glass vial; 1 ml 2% Na2CO3
solution was used for pH adjustment and the initial pH in the vial was 7.0-8.0 (Noike
et al., 2002).
The microorganism started to grow from the first day and its concentration
reached its maximum at the fifth day in all photobioreactors. After the fifth day the
microorganism in the photobioreactors stopped to grow and cell concentrations were
stabilized between 0.92 and 1.13 gdcw/Lc. The lowest average cell concentration was
obtained in the photobioreactor in which the concentration of the Na2CO3 buffer was
10 mM. The highest average cell concentration was in the photobioreactors that 5
and 10 mM KH2PO4 buffer was used. The trend in cell concentrations of all
experiments was very similar. There were no inhibition observed in the
photobioreactors that Na2CO3 buffer was used.
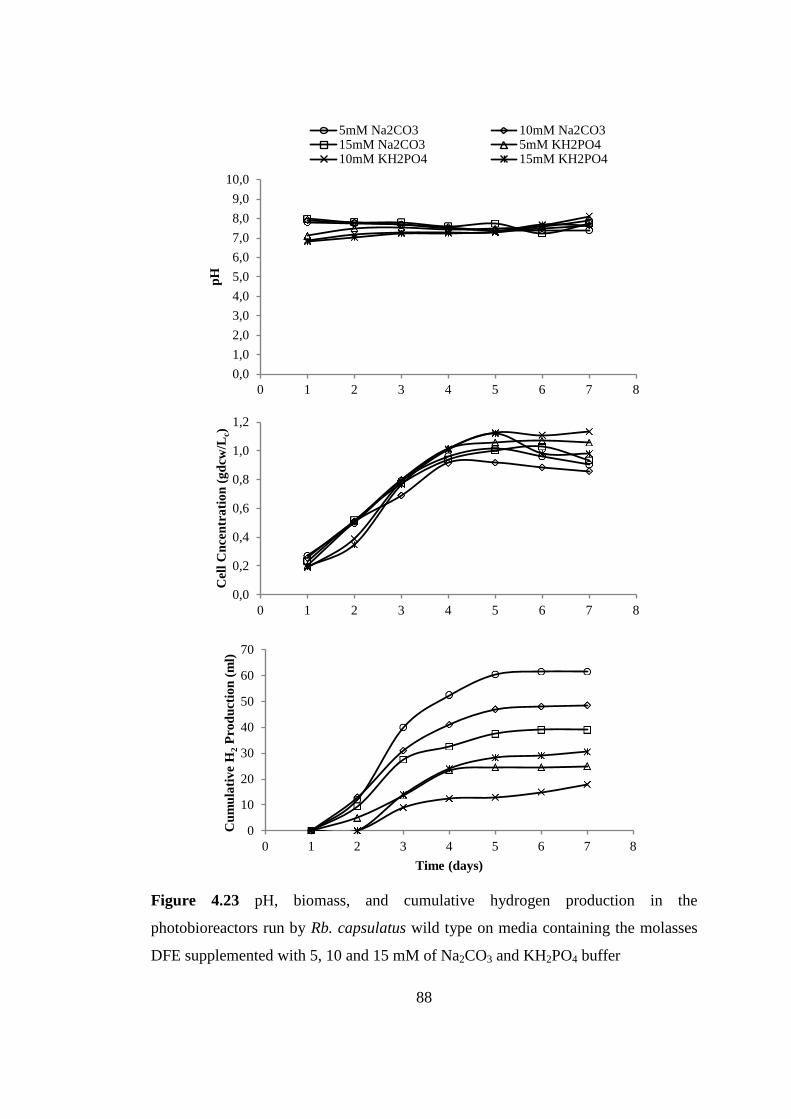
88
Figure 4.23 pH, biomass, and cumulative hydrogen production in the
photobioreactors run by Rb. capsulatus wild type on media containing the molasses
DFE supplemented with 5, 10 and 15 mM of Na2CO3 and KH2PO4 buffer
0,0
1,0
2,0
3,0
4,0
5,0
6,0
7,0
8,0
9,0
10,0
0 1 2 3 4 5 6 7 8
pH
5mM Na2CO3 10mM Na2CO315mM Na2CO3 5mM KH2PO410mM KH2PO4 15mM KH2PO4
0,0
0,2
0,4
0,6
0,8
1,0
1,2
0 1 2 3 4 5 6 7 8
Cel
l C
nce
ntr
ati
on
(g
dcw
/Lc)
0
10
20
30
40
50
60
70
0 1 2 3 4 5 6 7 8
Cu
mu
lati
ve
H2 P
rod
uct
ion
(m
l)
Time (days)
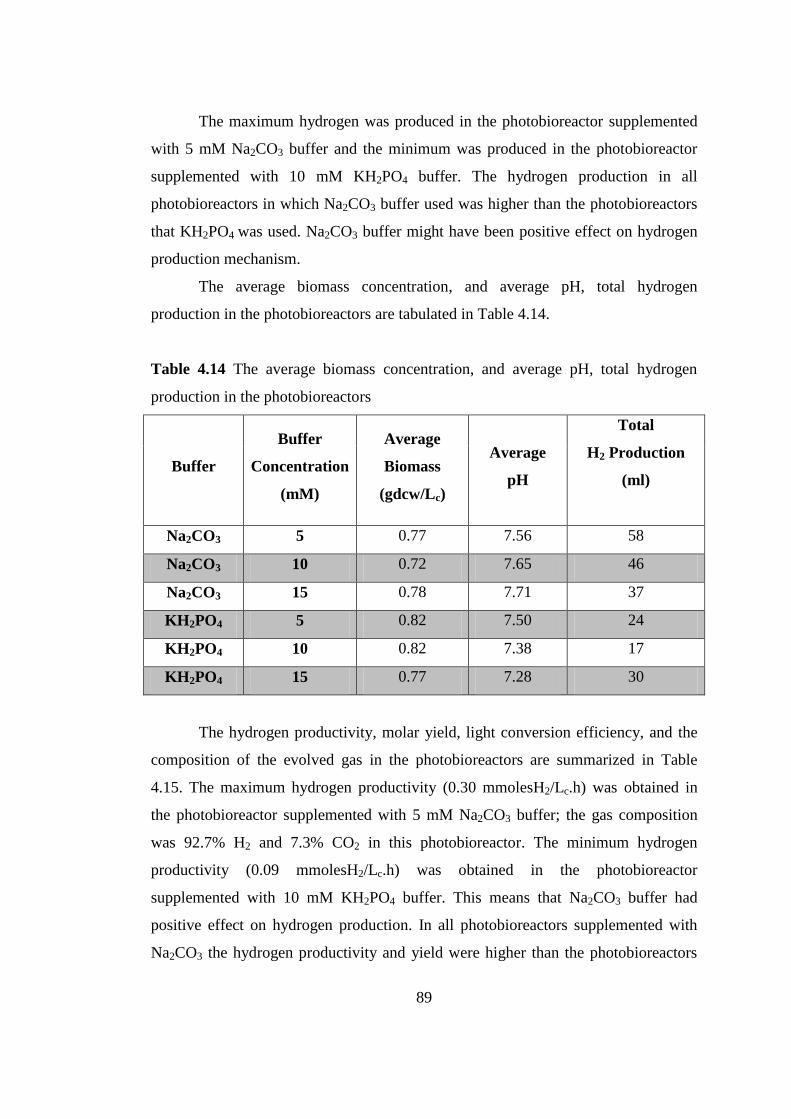
89
The maximum hydrogen was produced in the photobioreactor supplemented
with 5 mM Na2CO3 buffer and the minimum was produced in the photobioreactor
supplemented with 10 mM KH2PO4 buffer. The hydrogen production in all
photobioreactors in which Na2CO3 buffer used was higher than the photobioreactors
that KH2PO4 was used. Na2CO3 buffer might have been positive effect on hydrogen
production mechanism.
The average biomass concentration, and average pH, total hydrogen
production in the photobioreactors are tabulated in Table 4.14.
Table 4.14 The average biomass concentration, and average pH, total hydrogen
production in the photobioreactors
Buffer
Buffer
Concentration
(mM)
Average
Biomass
(gdcw/Lc)
Average
pH
Total
H2 Production
(ml)
Na2CO3 5 0.77 7.56 58
Na2CO3 10 0.72 7.65 46
Na2CO3 15 0.78 7.71 37
KH2PO4 5 0.82 7.50 24
KH2PO4 10 0.82 7.38 17
KH2PO4 15 0.77 7.28 30
The hydrogen productivity, molar yield, light conversion efficiency, and the
composition of the evolved gas in the photobioreactors are summarized in Table
4.15. The maximum hydrogen productivity (0.30 mmolesH2/Lc.h) was obtained in
the photobioreactor supplemented with 5 mM Na2CO3 buffer; the gas composition
was 92.7% H2 and 7.3% CO2 in this photobioreactor. The minimum hydrogen
productivity (0.09 mmolesH2/Lc.h) was obtained in the photobioreactor
supplemented with 10 mM KH2PO4 buffer. This means that Na2CO3 buffer had
positive effect on hydrogen production. In all photobioreactors supplemented with
Na2CO3 the hydrogen productivity and yield were higher than the photobioreactors

90
supplemented with KH2PO4 but CO2 percentage of the gas phase was a little bit
higher when the Na2CO3 buffer used.
Table 4.15 Productivity, yield, light conversion efficiency and the composition of
evolved gas in indoor photobioreactors run on the molasses DFE supplemented with
different concentrations of phosphate and carbonate buffer, using Rb. capsulatus
wild type.
Buffer Concentration
(mM)
Productivity
(mmoles/Lc.h)
Yield
(%)
Light
Conversion
Efficiency
(%)
Gas
Composition
(%)
H2 CO2
Na2CO3 5 0.30 30 1 92.7 7.3
Na2CO3 10 0.24 24 1 92.8 7.2
Na2CO3 15 0.19 19 1 93.1 6.9
KH2PO4 5 0.13 13 0.4 95.6 4.4
KH2PO4 10 0.09 9 0.3 94.4 5.6
KH2PO4 15 0.15 15 1 93.9 6.1
In this study as Na2CO3 concentration in the media increased the productivity
and yield decreased. This indicates that the concentration of the Na2CO3 buffer
increased above 5 mM hydrogen productivity decreased. Most probably the excess
CO3 ions enhance the utilization of hydrogen by photosynthesis reaction. The
composition of the gas didn’t change significantly. Besides the Na2CO3 buffer is
environmentally acceptable and more economical than KH2PO4 buffer. So it can be
used as buffer in the systems that the molasses DFE was used as substrate.
4.3.2 Continuous Biohydrogen Production with Rb. capsulatus Wild Type
The small photobioreactors were operated in indoor conditions. Laboratory-
scale photobioreactors were operated in both indoor and outdoor conditions on the
molasses DFE with Rb. capsulatus wild type.
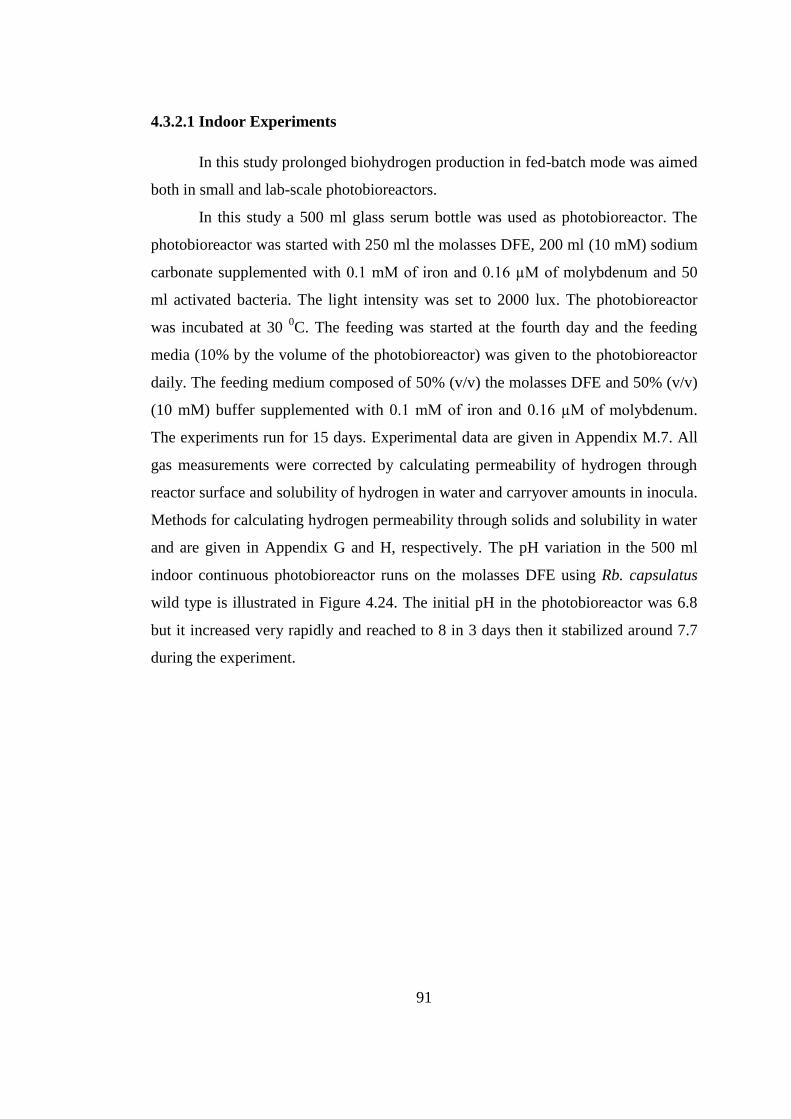
91
4.3.2.1 Indoor Experiments
In this study prolonged biohydrogen production in fed-batch mode was aimed
both in small and lab-scale photobioreactors.
In this study a 500 ml glass serum bottle was used as photobioreactor. The
photobioreactor was started with 250 ml the molasses DFE, 200 ml (10 mM) sodium
carbonate supplemented with 0.1 mM of iron and 0.16 µM of molybdenum and 50
ml activated bacteria. The light intensity was set to 2000 lux. The photobioreactor
was incubated at 30 0C. The feeding was started at the fourth day and the feeding
media (10% by the volume of the photobioreactor) was given to the photobioreactor
daily. The feeding medium composed of 50% (v/v) the molasses DFE and 50% (v/v)
(10 mM) buffer supplemented with 0.1 mM of iron and 0.16 µM of molybdenum.
The experiments run for 15 days. Experimental data are given in Appendix M.7. All
gas measurements were corrected by calculating permeability of hydrogen through
reactor surface and solubility of hydrogen in water and carryover amounts in inocula.
Methods for calculating hydrogen permeability through solids and solubility in water
and are given in Appendix G and H, respectively. The pH variation in the 500 ml
indoor continuous photobioreactor runs on the molasses DFE using Rb. capsulatus
wild type is illustrated in Figure 4.24. The initial pH in the photobioreactor was 6.8
but it increased very rapidly and reached to 8 in 3 days then it stabilized around 7.7
during the experiment.
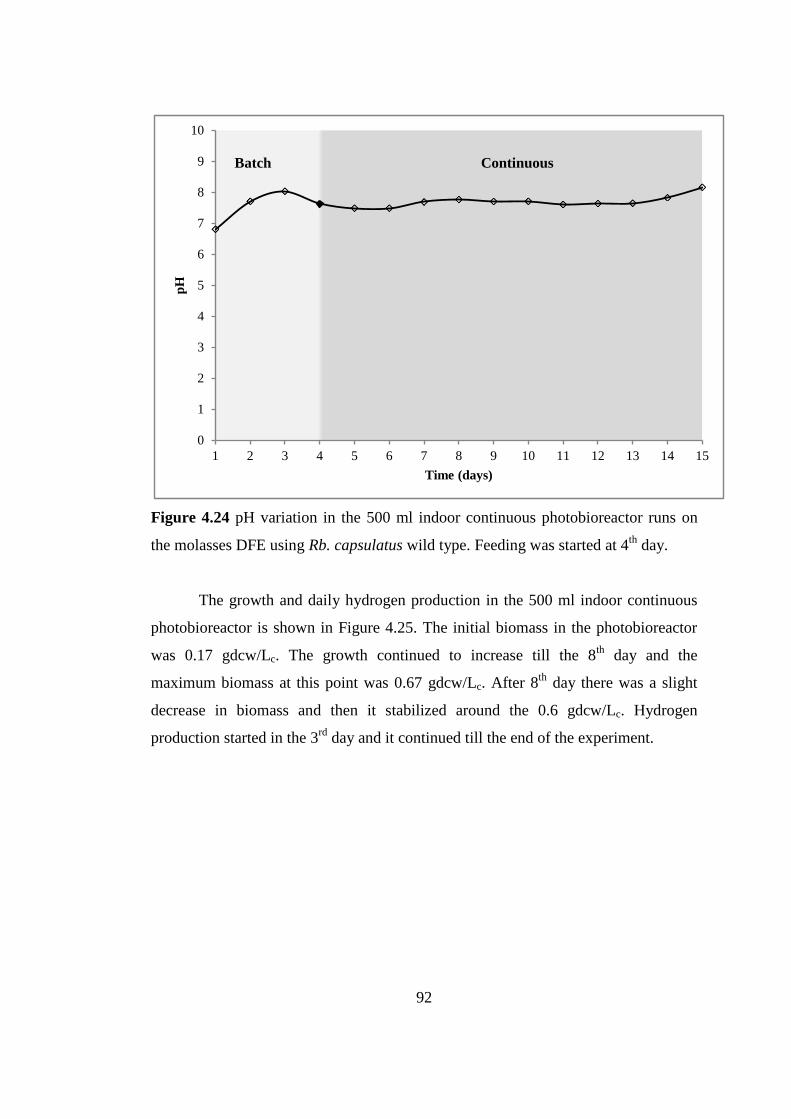
92
Figure 4.24 pH variation in the 500 ml indoor continuous photobioreactor runs on
the molasses DFE using Rb. capsulatus wild type. Feeding was started at 4th
day.
The growth and daily hydrogen production in the 500 ml indoor continuous
photobioreactor is shown in Figure 4.25. The initial biomass in the photobioreactor
was 0.17 gdcw/Lc. The growth continued to increase till the 8th
day and the
maximum biomass at this point was 0.67 gdcw/Lc. After 8th
day there was a slight
decrease in biomass and then it stabilized around the 0.6 gdcw/Lc. Hydrogen
production started in the 3rd
day and it continued till the end of the experiment.
0
1
2
3
4
5
6
7
8
9
10
1 2 3 4 5 6 7 8 9 10 11 12 13 14 15
pH
Time (days)
Batch Continuous
93
Figure 4.25 Growth and daily hydrogen production in the 500 ml indoor continuous
photobioreactor runs on the molasses DFE using Rb. capsulatus wild type. Feeding
was started at 4th
day.
Organic acid consumption in the reactor is illustrated in Figure 4.26. In batch
period acetic acid introduced at the start up consumed down to 5 mM. After feeding
started its concentration increased to 10 mM. Between the 6th
and 9th
days acetate
was consumed completely in the photobioreactor. Then it accumulates in the system
up to 5 mM at the 10th
and 13th
days of the experiment. Lactate concentration in the
reactor at the startup was 2.6 mM. Then it consumed fully in the reactor till the end
of the experiment. Formic acid concentration in the reactor was below 1 mM till the
last day of the experiment. There was no propionic and butyric acid production in the
reactor during the experiment.
0,0
0,1
0,2
0,3
0,4
0,5
0,6
0,7
0,8
0
10
20
30
40
50
60
70
1 2 3 4 5 6 7 8 9 10 11 12 13 14 15
Cell C
on
centra
tion
(gd
cw/L
c )
Da
ily
H2 P
rod
uct
ion
(m
l)
Time (days)
Hydrogen Production (ml) Biomass
Batch Continuous

94
Figure 4.26 Organic acid consumption in the 500 ml indoor continuous
photobioreactor runs on the molasses DFE using Rb. capsulatus wild type. Feeding
was started at 4th
day.
In this study the productivity, molar yield, light conversion efficiency and
overall acetate conversion efficiency was 0.14 mmolesH2/Lc.h, 8%, 0.97% and 69%,
respectively. The hydrogen productivity (0.14 mmolesH2/Lc.h) and yield (8%)
obtained in this study is lower than the hydrogen productivity (0.30 mmolesH2/Lc.h)
and yield (30%) obtained in the 50 ml photobioreactor runs in indoor condition with
the molasses DFE supplemented with 5 mM Na2CO3 in batch mode. This can be
attributed to the difference in biomass concentration in the photobioreactors. The
average biomass concentration in the 500 ml photobioreactor was 0.52 gdcw/Lc but
in the 50 ml photobioreactor average biomass concentration was 0.77 gdcw/Lc. Cell
concentration in the photobioreactors can be one of the reasons of the low hydrogen
productivity obtained in this study. The other reason can be the variation in the pH in
the photobioreactors. In 50 ml photobioreactor average pH was 7.56 and it had a
decreasing trend during the experiment and at the end of the experiment it decreased
down to 7.4. But in the 500 ml photobioreactor average pH was 7.66 and it increased
0
2
4
6
8
10
12
14
1 2 3 4 5 6 7 8 9 10 11 12 13 14 15
Co
nce
ntr
ati
on
(m
M)
Time (days)
LA(mM) FA(mM) AA(mM) PA(mM) BA(mM)
Batch Continuous

95
up to 8.17 at the end of the experiment. Scale differences between the
photobioreactors can also be another reason of lower hydrogen productivity obtained
in 500 ml indoor photobioreactor.
In this study an indoor continuous photobioreactor with 4 liter working volume
was used. The light intensity on the surface of the photobioreactor was set to 2000
lux. The photobioreactor temperature was kept around 32 0C by an air conditioner in
the room that the experiment took place. The photobioreactor was started with 45%
the molasses DFE, 45% (22 mM) KH2PO4 buffer (pH=6.4) and 10% activated Rb.
capsulatus wild type. After 4th
day, the photobioreactor was fed daily with the feeding
media with the volume of 10% of the photobioreactor. The hydraulic retention time
was 10 days. The composition of the feeding media was 50% (22 mM) KH2PO4
buffer and 50% the molasses DFE. The experiment continued 23 days and feed
composition was changed once during the experiment. Experimental data are given
in Appendix M.8.
The pH variation in indoor continuous photobioreactor (4 L) run by Rb.
capsulatus wild type on the molasses DFE is illustrated in Figure 4.27. The initial pH
was 6.57 in the photobioreactor. The pH remained around 6.6 till the end of the
experiment. This means that KH2PO4 had enough buffering capacity to arrange the
pH of the molasses DFE.
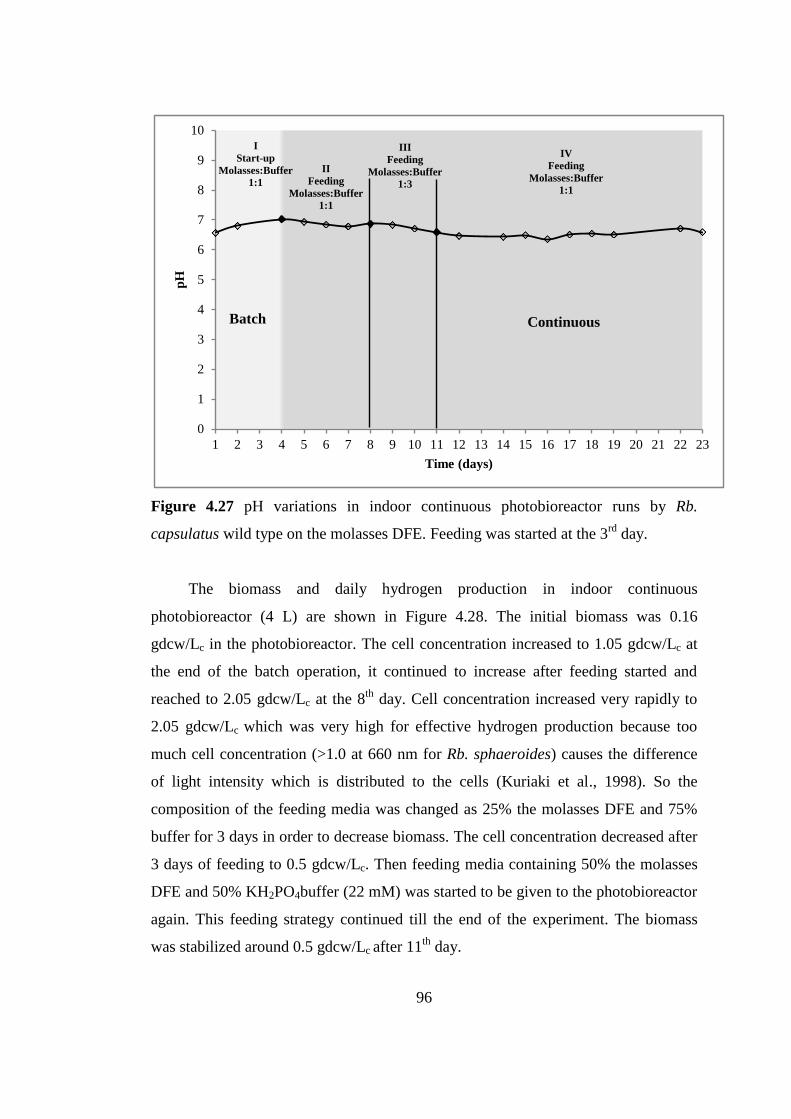
96
Figure 4.27 pH variations in indoor continuous photobioreactor runs by Rb.
capsulatus wild type on the molasses DFE. Feeding was started at the 3rd
day.
The biomass and daily hydrogen production in indoor continuous
photobioreactor (4 L) are shown in Figure 4.28. The initial biomass was 0.16
gdcw/Lc in the photobioreactor. The cell concentration increased to 1.05 gdcw/Lc at
the end of the batch operation, it continued to increase after feeding started and
reached to 2.05 gdcw/Lc at the 8th
day. Cell concentration increased very rapidly to
2.05 gdcw/Lc which was very high for effective hydrogen production because too
much cell concentration (>1.0 at 660 nm for Rb. sphaeroides) causes the difference
of light intensity which is distributed to the cells (Kuriaki et al., 1998). So the
composition of the feeding media was changed as 25% the molasses DFE and 75%
buffer for 3 days in order to decrease biomass. The cell concentration decreased after
3 days of feeding to 0.5 gdcw/Lc. Then feeding media containing 50% the molasses
DFE and 50% KH2PO4buffer (22 mM) was started to be given to the photobioreactor
again. This feeding strategy continued till the end of the experiment. The biomass
was stabilized around 0.5 gdcw/Lc after 11th
day.
0
1
2
3
4
5
6
7
8
9
10
1 2 3 4 5 6 7 8 9 10 11 12 13 14 15 16 17 18 19 20 21 22 23
pH
Time (days)
I
Start-up
Molasses:Buffer
1:1
II
Feeding
Molasses:Buffer
1:1
III
Feeding
Molasses:Buffer
1:3
IV
Feeding
Molasses:Buffer
1:1
Batch Continuous

97
Figure 4.28 Biomass and daily hydrogen production in indoor continuous
photobioreactor runs by Rb. capsulatus wild type on the molasses DFE. Feeding was
started at the 3rd
day.
The hydrogen production started in the second day and maximum hydrogen
production was obtained in the first 7 days. The maximum daily hydrogen production
reached to 1.2 L/day and daily average hydrogen production was 0.69 L/day in these
days. After 7th
day the evolved daily average hydrogen decreased to 0.39 L/day.
In Figure 4.29 organic acid concentration in the reactor is figured out. During
batch operation in the first 4 days 96% of acetate was consumed. Although feeding
started acetate concentration in the reactor remained below 1 mM till 9th day. Then it
started to accumulate and its concentration reached to 12 mM at the 17th
day in the
photobioreactor. After 17th
day its concentration started to decreased and at the end it
was 5 mM in the photobioreactor. Overall acetate conversion efficiency obtained in
this study was 83%. Formic acid production started in the 3rd
day of the experiment and
its concentration was 11.5 mM at that day. At the 6th
day its concentration reached its
maxima and it was16 mM. After 7th
day its concentration decreased and stabilized
around 12 mM till 18th
day of the experiment. At the end of the experiment formic acid
0,0
0,5
1,0
1,5
2,0
2,5
0,0
0,2
0,4
0,6
0,8
1,0
1,2
1,4
1 2 3 4 5 6 7 8 9 10 11 12 13 14 15 16 17 18 19 20 21 22 23
Cell C
on
centra
tion
(gd
cw/L
c )
Da
ily
H2 P
rod
uct
ion
(L
)
Time (days)
Hydrogen Production (L) Biomass
I
Start-up
Molasses:Buffer
1:1
II
Feeding
Molasses:Buffer
1:1
III
Feeding
Molasses:Buffer
1:3
IV
Feeding
Molasses:Buffer
1:1
Batch Continuous

98
concentration in the reactor was decreased to 5 mM. Lactic acid was completely
consumed throughout the experiment. Propionic and butyric acid concentration was
negligible during the experiment.
Figure 4.29 Organic acid consumption in indoor continuous photobioreactor runs by
Rb. capsulatus wild type on the molasses DFE. Feeding started at the 3rd
day.
The overall hydrogen productivity obtained at the end of the experiment was
0.17 mmolesH2/Lc.h, the molar yield was 29%, and the light conversion efficiency
was 0.12%. In the study that operated in batch mode in 55 ml glass bottles incubated
at 300C and illuminated under 150-200 W/m
2onthe molasses DFE the maximum
hydrogen productivity was 0.75 mmolesH2/Lc.h and the molar yield was 20% (Ozgur
et al., 2010). The productivity obtained in Ozgur et al. (2010) is higher than the
productivity of this study. This was attributed to the scale differences and the sudden
biomass increase in this study. In another study the overall hydrogen productivity
(0.13 mmolesH2/Lc.h) that 20% dilution of sugar refinery waste water with L-malic
acid was used as substrate for hydrogen production by Rb. sphaeroides O. U.001 in a
0.4 L column photobioreactor for 100 days in indoor conditions (Yetis et al., 2000) is
0
5
10
15
20
25
30
35
1 2 3 4 5 6 7 8 9 10 11 12 13 14 15 16 17 18 19 20 21 22 23
Co
nce
ntr
ati
on
(m
M)
Time (days)
LA(mM) FA(mM) AA(mM) PA(mM) BA(mM)
I
Start-up
Molasses:Buffer
1:1 II
Feeding
Molasses:Buffer
1:1
III
Feeding
Molasses:Buffer
1:3
IV
Feeding
Molasses:Buffer
1:1
Batch Continuous

99
lower than the productivity obtained in this study. Molasses DFE is more suitable
substrate than sugar refinery waste water for photobiological hydrogen production. The
results obtained in this study and the similar studies are compared in Table 4.16.
Table 4.16 Comparison of the hydrogen productivity values obtained in this study
with similar studies in the literature
Ref. Bacteria Substrate PBR Volume
(L) Mode
Productivity
(mmolesH2/Lc.h)
Yeti
et al.
2000
Rb.
Sphaeroides
O.U.001
20%
SRWW
L-Malic
Acid
Column 0.4 Semi
continuous 0.13
Ozgur
et al.
2010
Rb.
Capsulatus
DSM 1710
Molasses
DFE Bottle 0.055 Batch 0.75
This
Study
Rb.
capsulatus
DSM 1710
Molasses
DFE Panel 4
Semi
continuous 0.17
4.3.2.2.Continuous Hydrogen Production in Outdoor Experiment
In outdoor experiments continuous biohydrogen production was researched
both in short and long term applications with Rb. capsulatus wild type and mutant
strains.
In Run270709, continuous hydrogen production on the molasses DFE in panel
photobioreactor in outdoor conditions was aimed. The lab-scale photobioreactor with
4 liter working volume were used. The photobioreactor was started at 27th
of July in
2009 with 50% the molasses DFE, 25% (20 mM) Na2CO3 buffer (pH=6.4)
supplemented with 0.1 mM of iron and 0.16 µM of molybdenum and 25% activated
bacteria. The temperature of the photobioreactor was controlled with chilled water
circulating through a cooling coil inserted into the photobioreactor. The
photobioreactor was started to be fed daily at 3rd
day with the feeding media had a
volume of 10% of the photobioreactor. Hydraulic retention time was 10 days. The
composition of the feeding media was 50% (10 mM) Na2CO3 buffer supplemented
with 0.1 mM of iron and 0.16 µM of molybdenum and 50% the molasses DFE. The

100
experiment was run for16 days in outdoor conditions. The pH, cell concentration,
cumulative hydrogen production, and organic acid consumption were analyzed daily.
The gas composition was analyzed ones a week. The photobioreactor temperature
was recorded continuously. All gas measurements were corrected by calculating
permeability of hydrogen through reactor surface and solubility of hydrogen in water
and carryover amounts in inoculum. Methods for calculating hydrogen permeability
through solids and solubility in water and are given in Appendix G and H,
respectively. The total global solar radiation data were taken from the National
Institute of Meteorology in Turkey. Experimental data are given in Appendix M.9.
The definition of total global solar radiation is given in Appendix J.
The pH variation in outdoor continuous photobioreactor (4 L) with cooling coil
run by Rb. capsulatus wild type on the molasses DFE started at 27.07.09 is illustrated
in Figure 4.30. The pH stabilized around 7.5 along the process.
Figure 4.30 Variation in pH in outdoor continuous photobioreactor during hydrogen
production runs by Rb. capsulatus wild type on the molasses DFE. Starting date of
the experiment was 27.07.09. Feeding was started at 3rd
day.
0,0
1,0
2,0
3,0
4,0
5,0
6,0
7,0
8,0
9,0
10,0
1 2 3 4 5 6 7 8 9 10 11 12 13 14 15 16
pH
Time (days)
Batch Continuous
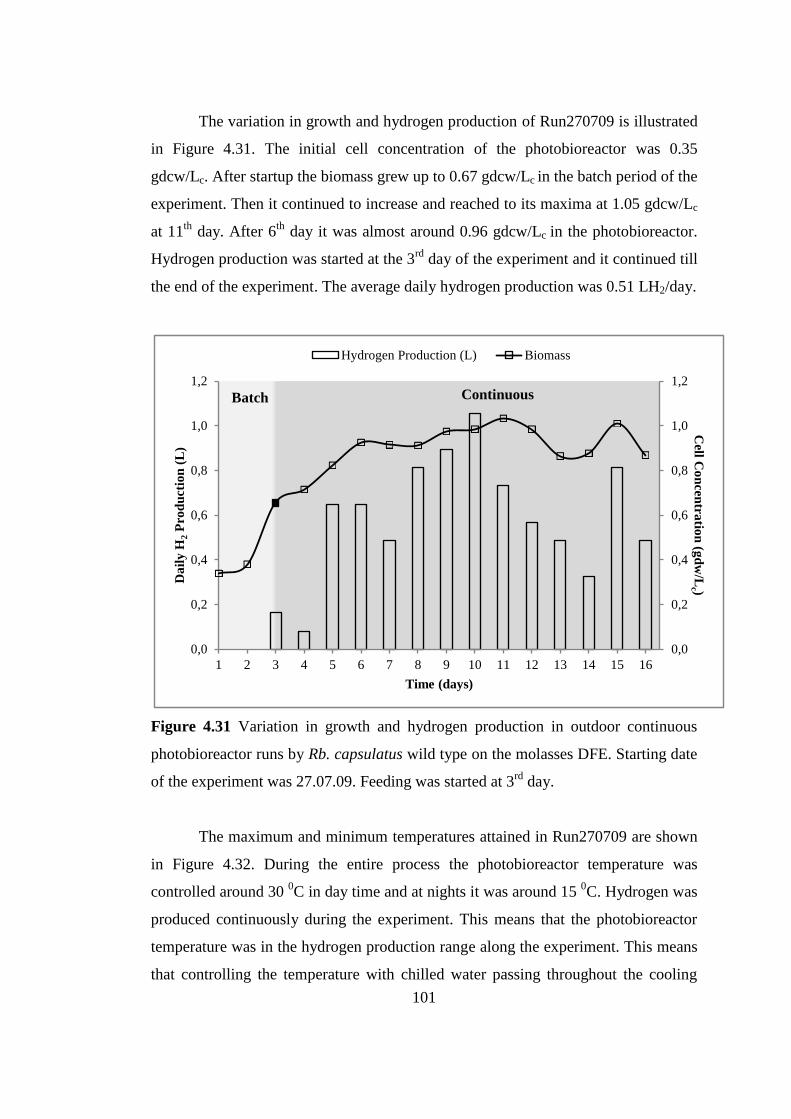
101
The variation in growth and hydrogen production of Run270709 is illustrated
in Figure 4.31. The initial cell concentration of the photobioreactor was 0.35
gdcw/Lc. After startup the biomass grew up to 0.67 gdcw/Lc in the batch period of the
experiment. Then it continued to increase and reached to its maxima at 1.05 gdcw/Lc
at 11th
day. After 6th
day it was almost around 0.96 gdcw/Lc in the photobioreactor.
Hydrogen production was started at the 3rd
day of the experiment and it continued till
the end of the experiment. The average daily hydrogen production was 0.51 LH2/day.
Figure 4.31 Variation in growth and hydrogen production in outdoor continuous
photobioreactor runs by Rb. capsulatus wild type on the molasses DFE. Starting date
of the experiment was 27.07.09. Feeding was started at 3rd
day.
The maximum and minimum temperatures attained in Run270709 are shown
in Figure 4.32. During the entire process the photobioreactor temperature was
controlled around 30 0C in day time and at nights it was around 15
0C. Hydrogen was
produced continuously during the experiment. This means that the photobioreactor
temperature was in the hydrogen production range along the experiment. This means
that controlling the temperature with chilled water passing throughout the cooling
0,0
0,2
0,4
0,6
0,8
1,0
1,2
0,0
0,2
0,4
0,6
0,8
1,0
1,2
1 2 3 4 5 6 7 8 9 10 11 12 13 14 15 16
Cell C
on
centra
tion
(gd
w/L
c )
Da
ily
H2 P
rod
uct
ion
(L
)
Time (days)
Hydrogen Production (L) Biomass
Batch Continuous

102
coil inserted into the photobioreactor was successful. This conclusion would be the
leading purpose for long term operation.
Figure 4.32 The maximum and minimum temperatures attained in outdoor
continuous photobioreactor runs by Rb. capsulatus wild type on the molasses DFE.
Starting date of the experiment was 27.07.09. Feeding was started at 3rd
day.
Figure 4.33 illustrates the variation in daily global solar radiation and daily hydrogen
production. The total global solar radiation varies between 7301 Wh/m2 and 5060
Wh/m2 during the experiment. A direct relation between daily hydrogen productivity
and daily global solar radiation energy was observed.
0
5
10
15
20
25
30
35
40
1 2 3 4 5 6 7 8 9 10 11 12 13 14 15 16
Tem
per
atu
re (
0C
)
Time (days)
Tmax Tmin
Batch Continuous

103
Figure 4.33 Daily global solar radiation energy versus daily hydrogen production in
outdoor continuous photobioreactor runs by Rb. capsulatus wild type on the
molasses DFE. Starting date of the experiment was 27.07.09. Feeding was started at
3rd
day.
In Figure 4.34 organic acid concentration in Run270709 is plotted. The initial
concentration of acetic acid was 30.7 mM. Acetate concentration gradually decreased
to 11.3mM whereas formate concentration gradually increased from 3.67 mM to 11
mM. The lactic acid concentration was initially 4.6 mM and it consumed almost
completely. After 7th
day its concentration decreased below 1 mM and remained
around this value till the end of the experiment. The propionic and butyric acid
concentrations were negligible during the entire process.
0
1000
2000
3000
4000
5000
6000
7000
8000
0,0
0,2
0,4
0,6
0,8
1,0
1,2
1 2 3 4 5 6 7 8 9 10 11 12 13 14 15 16
Da
ily G
lob
al S
ola
r Ra
dia
tion
(Wh
/m2)
Da
ily
H2 P
od
uct
ion
(L
)
Time (days)
Hydrogen Production (L) Solar Radiation
Batch
Continuous
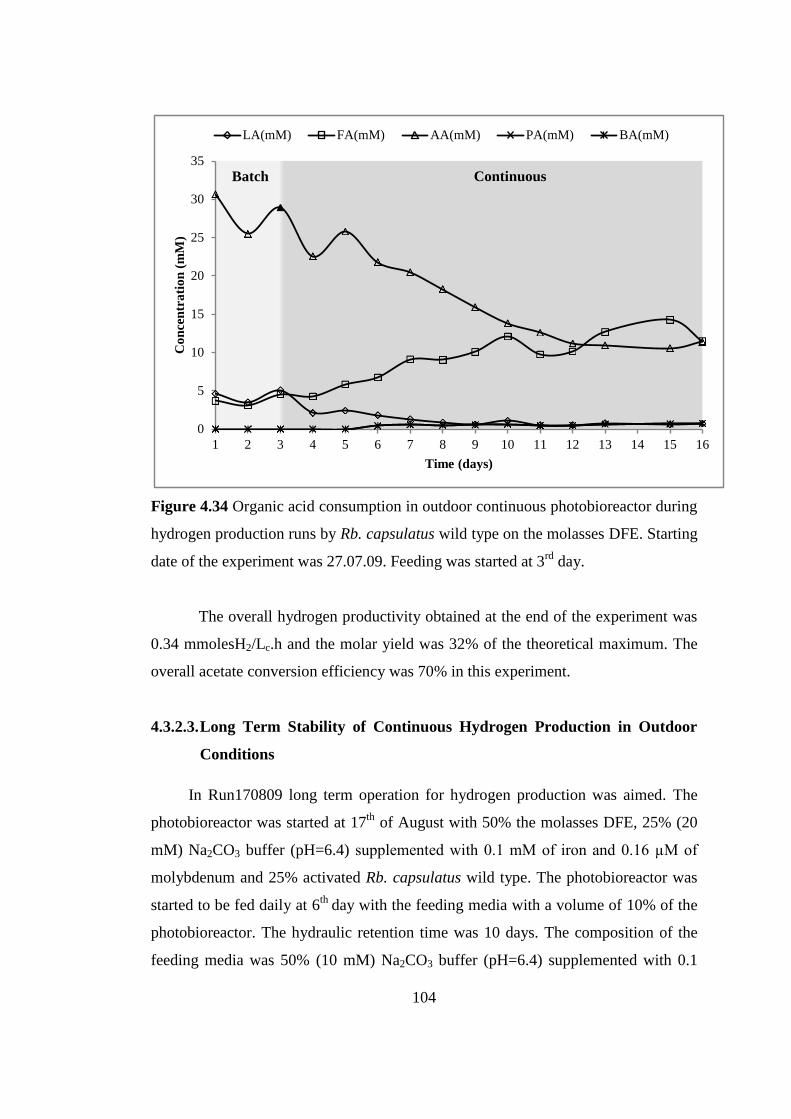
104
Figure 4.34 Organic acid consumption in outdoor continuous photobioreactor during
hydrogen production runs by Rb. capsulatus wild type on the molasses DFE. Starting
date of the experiment was 27.07.09. Feeding was started at 3rd
day.
The overall hydrogen productivity obtained at the end of the experiment was
0.34 mmolesH2/Lc.h and the molar yield was 32% of the theoretical maximum. The
overall acetate conversion efficiency was 70% in this experiment.
4.3.2.3. Long Term Stability of Continuous Hydrogen Production in Outdoor
Conditions
In Run170809 long term operation for hydrogen production was aimed. The
photobioreactor was started at 17th
of August with 50% the molasses DFE, 25% (20
mM) Na2CO3 buffer (pH=6.4) supplemented with 0.1 mM of iron and 0.16 µM of
molybdenum and 25% activated Rb. capsulatus wild type. The photobioreactor was
started to be fed daily at 6th
day with the feeding media with a volume of 10% of the
photobioreactor. The hydraulic retention time was 10 days. The composition of the
feeding media was 50% (10 mM) Na2CO3 buffer (pH=6.4) supplemented with 0.1
0
5
10
15
20
25
30
35
1 2 3 4 5 6 7 8 9 10 11 12 13 14 15 16
Co
nce
ntr
ati
on
(m
M)
Time (days)
LA(mM) FA(mM) AA(mM) PA(mM) BA(mM)
Batch Continuous
105
mM of iron and 0.16 µM of molybdenum and 50% the molasses DFE. The
experiment continued 131 days. The photobioreactor temperature, pH, cell
concentration, cumulative hydrogen production, organic acid consumption and gas
composition were measured daily. The, chemical oxygen demand, total organic
carbon and nitrogen and ammonia, and elemental analyzes were done once a week.
Daily global solar radiation energy data were taken from National Institute of
Meteorology. The definition of total global solar radiation is given in Appendix J.
The photobioreactor was carried into the green house at 79th
day. All gas
measurements were corrected by calculating permeability of hydrogen through
reactor surface and solubility of hydrogen in water and carryover amounts in
inoculum. Methods for calculating hydrogen permeability through solids and
solubility in water and are given in Appendix G and H, respectively. Experimental
data are given in Appendix M.10.
The pH variation in outdoor continuous photobioreactor (4 L) with cooling coil
run by Rb. capsulatus wild type on the molasses DFE started at 17.08.09 is shown in
Figure 4.35. The pH was controlled around 7.0 till 55th
day. After that day the buffer
concentration in the feed was decreased which has led to increasing pH up to 8.7. Re-
adjustment of the buffer concentration was not sufficient to stabilize the pH at 7.0. A
sharp decrease in the pH value down to 6.0 has been observed at 105th
day. Then it
remained around that value. The pH is one of the most important factors affecting the
hydrogen productivity. Sufficient amount of buffer addition is absolutely necessary
for long term stable operation.

106
Figure 4.35 Long term stability of pH in outdoor continuous photobioreactor during
hydrogen production runs by Rb. capsulatus wild type on the molasses DFE. Starting
date of the experiment was 17.08.09. Feeding was started at 6th
day.
Growth and daily hydrogen production in Run170809 are illustrated in Figure
4.36. After the inoculation the biomass concentration was 0.28 gdcw/Lc. The
continuous feeding has been started on the 6th
day where the biomass concentration
reached 0.74 gdcw/Lc. The cell concentration in the photobioreactor increased till
16th
day. Then the biomass decreased to 0.7 gdcw/Lc and recovered itself to 0.86
gdcw/Lc at the 57th
day. This shows the stabilization of the biomass at the long term.
By changing the molasses DFE concentration in the feed the biomass
concentration further increased up to 1.15 gdcw/Lc. After that day the molasses DFE
concentration was decreased back to the first feeding conditions which caused a
decrease in biomass concentration. Addition of fresh bacteria (freshly grown culture
of Rb. capsulatus at an OD660 of 1.0) improved the growth and an increase in
biomass concentration was observed. After 99th
day biomass concentration
continuously decreased. Even fresh bacteria addition did not improve the biomass
concentration.
0
1
2
3
4
5
6
7
8
9
10
0 10 20 30 40 50 60 70 80 90 100 110 120 130
pH
Time (days)
0.5L
Bacteria
0.4L
Bacteria
0.1L
Bacteria
0.1L
Bacteria
III
Feeding
Molasses:Buffer
3:1
II
Feeding
Molasses:Buffer
1:1
I
Start-up
IV
Feeding
Molasses:Buffer
1:1
Green House
Batch Continuous

107
The hydrogen production started on the 4th
day. Daily hydrogen production
varied between 1.0- 1.5 L/day for first 10 days then it decreased to 0.2-0.8 L/day and
continued around this value for 30 days then it continued between 0.2-0.6 L/day till
79th
day. After the photobioreactor was taken into the green house daily hydrogen
production varied between 0-0.2 L/day. The maximum hydrogen productivity (0.54
mmolesH2/Lc.h) was obtained in the first ten days and in this period the molar yield
was 34%. After 10th
day hydrogen productivity decreased and between 11th
and 41th
days hydrogen productivity was 0.43 mmolesH2/Lc.h. In this period molar yield
increased to 43% of theoretical maximum. Between 42nd
and 56th
day hydrogen
productivity and molar yield were 0.28 mmolesH2/Lc.h and 36% of the theoretical
maximum, respectively. Overall acetate conversion efficiency in the hydrogen
producing period which comprise the first 56 days was 77%.
Figure 4.36 Growth and daily hydrogen production in outdoor continuous
photobioreactor runs by Rb. capsulatus wild type on the molasses DFE. Starting date
of the experiment was 17.08.09. Feeding was started at 6th
day.
0,0
0,2
0,4
0,6
0,8
1,0
1,2
1,4
1,6
1,8
0,0
0,2
0,4
0,6
0,8
1,0
1,2
1,4
0 10 20 30 40 50 60 70 80 90 100 110 120 130
Da
ily H
2 Pro
du
ction
(L)
Cel
l C
on
cen
tra
tio
n (
gd
cw/L
c)
Time (days)
Hydrogen Production (L) Biomass
0.5L
Bacteria
0.4L
Bacteria 0.1L
Bacteria
0.1L
Bacteria
III
Feeding
Molasses:Buffer
3:1
II
Feeding
Molasses:Buffer
1:1
I
Start-up IV
Feeding
Molasses:Buffer
1:1
Green House
Batch
Continuous
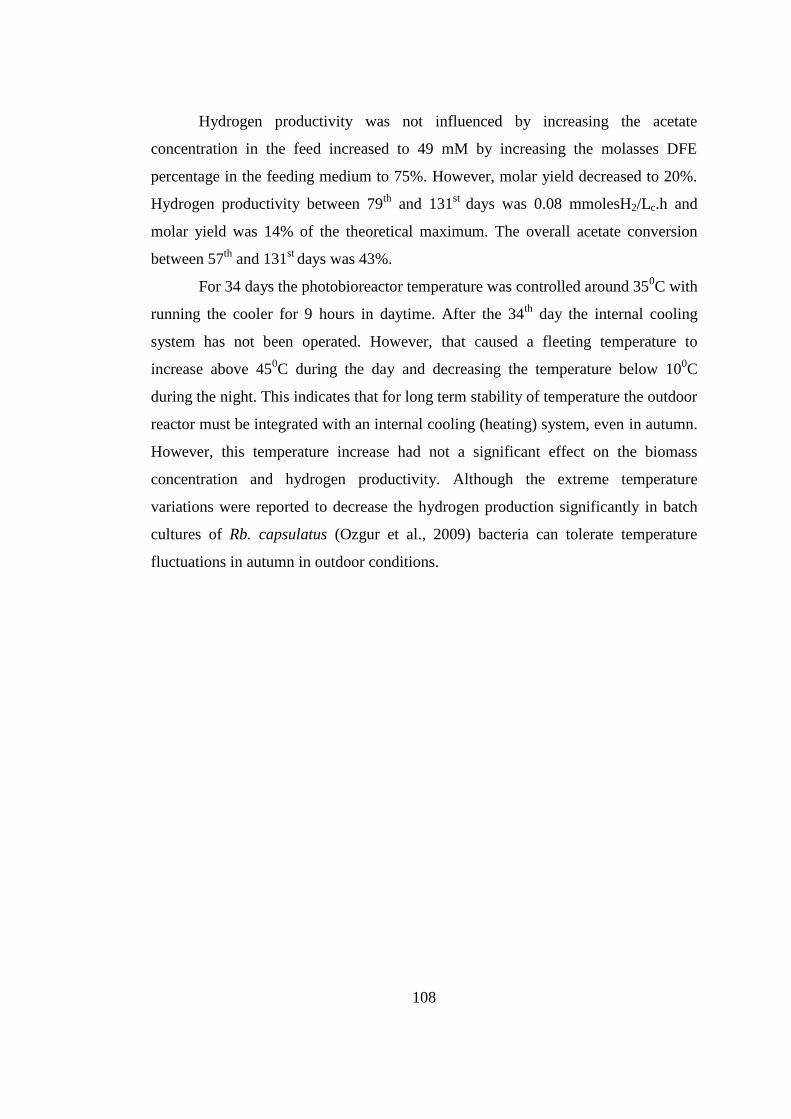
108
Hydrogen productivity was not influenced by increasing the acetate
concentration in the feed increased to 49 mM by increasing the molasses DFE
percentage in the feeding medium to 75%. However, molar yield decreased to 20%.
Hydrogen productivity between 79th
and 131st
days was 0.08 mmolesH2/Lc.h and
molar yield was 14% of the theoretical maximum. The overall acetate conversion
between 57th
and 131st
days was 43%.
For 34 days the photobioreactor temperature was controlled around 350C with
running the cooler for 9 hours in daytime. After the 34th
day the internal cooling
system has not been operated. However, that caused a fleeting temperature to
increase above 450C during the day and decreasing the temperature below 10
0C
during the night. This indicates that for long term stability of temperature the outdoor
reactor must be integrated with an internal cooling (heating) system, even in autumn.
However, this temperature increase had not a significant effect on the biomass
concentration and hydrogen productivity. Although the extreme temperature
variations were reported to decrease the hydrogen production significantly in batch
cultures of Rb. capsulatus (Ozgur et al., 2009) bacteria can tolerate temperature
fluctuations in autumn in outdoor conditions.

109
Figure 4.37 Variation in temperature in outdoor continuous photobioreactor runs by
Rb. capsulatus wild type on the molasses DFE. Starting date of the experiment was
17.08.09. Feeding was started at 6th
day.
At the day 79, day and night temperature decreased to 14.70C and -0.3
0C,
respectively. So biomass decreased by 30% in the 79th
day. Therefore, freezing of the
bacteria must be avoided. Therefore, after the 80th
day, the photobioreactor was
moved into the green house.
There is a direct relation between the global total solar radiation energy per day
and hydrogen production per day (Figure 4.38). The daily global total solar radiation
energy decreases gradually from 6600 Wh/m2
(17 August 2009) to 680 Wh/m2 (21
December 2009). Total daily global solar radiation energy varies depending on the
daily illumination time and weather conditions. On cloudy days this energy drops even
half of its value.
-10
0
10
20
30
40
50
60
0 10 20 30 40 50 60 70 80 90 100 110 120 130
Tem
per
atu
re (
0C
)
Time (days)
III
Feeding
Molasses:Buffer
3:1
II
Feeding
Molasses:Buffer
1:1
I
Start-up IV
Feeding
Molasses:Buffer
1:1 Batch Continuous
Green House
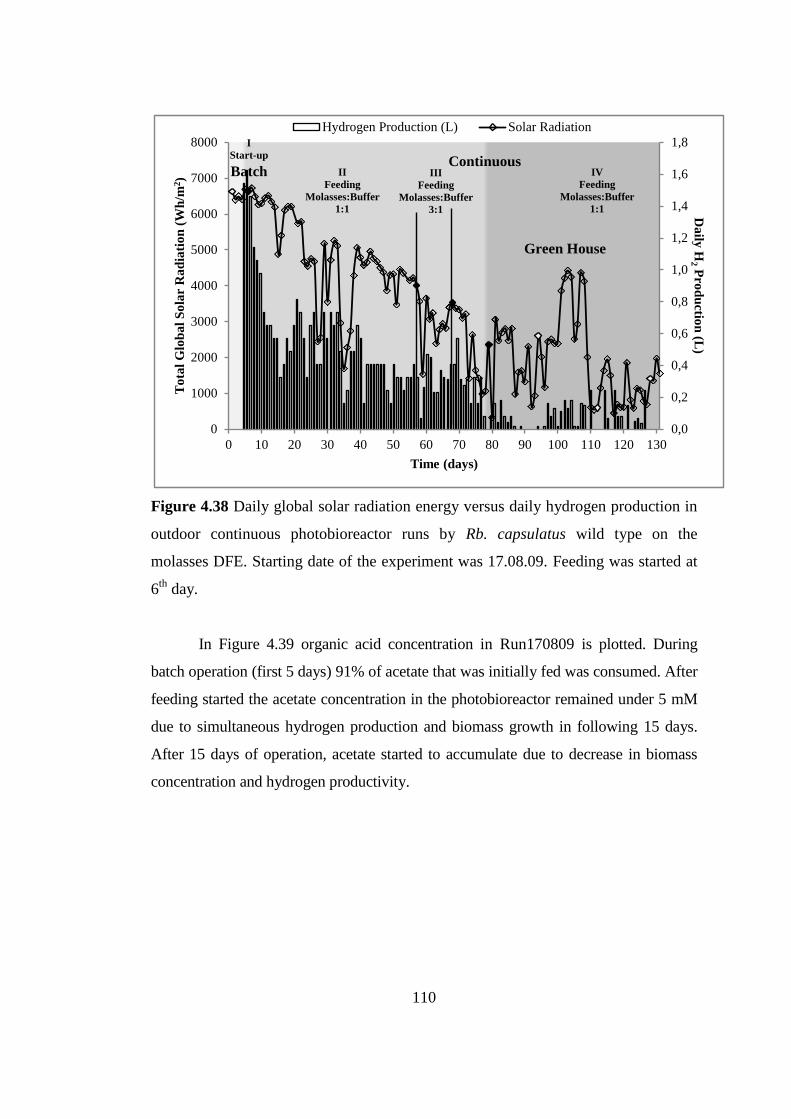
110
Figure 4.38 Daily global solar radiation energy versus daily hydrogen production in
outdoor continuous photobioreactor runs by Rb. capsulatus wild type on the
molasses DFE. Starting date of the experiment was 17.08.09. Feeding was started at
6th
day.
In Figure 4.39 organic acid concentration in Run170809 is plotted. During
batch operation (first 5 days) 91% of acetate that was initially fed was consumed. After
feeding started the acetate concentration in the photobioreactor remained under 5 mM
due to simultaneous hydrogen production and biomass growth in following 15 days.
After 15 days of operation, acetate started to accumulate due to decrease in biomass
concentration and hydrogen productivity.
0,0
0,2
0,4
0,6
0,8
1,0
1,2
1,4
1,6
1,8
0
1000
2000
3000
4000
5000
6000
7000
8000
0 10 20 30 40 50 60 70 80 90 100 110 120 130
Da
ily H
2 Pro
du
ction
(L)
To
tal
Glo
ba
l S
ola
r R
ad
iati
on
(W
h/m
2)
Time (days)
Hydrogen Production (L) Solar Radiation
III
Feeding
Molasses:Buffer
3:1
II
Feeding
Molasses:Buffer
1:1
I
Start-up
IV
Feeding
Molasses:Buffer
1:1
Continuous
Green House
Batch
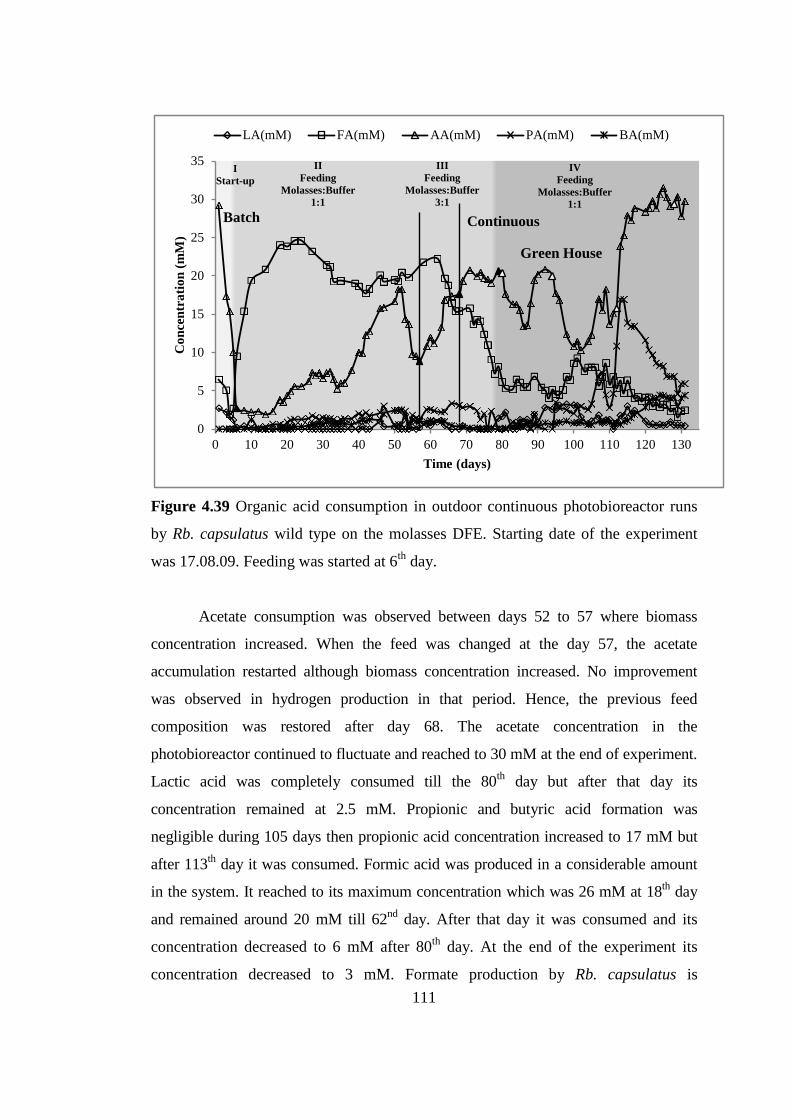
111
Figure 4.39 Organic acid consumption in outdoor continuous photobioreactor runs
by Rb. capsulatus wild type on the molasses DFE. Starting date of the experiment
was 17.08.09. Feeding was started at 6th
day.
Acetate consumption was observed between days 52 to 57 where biomass
concentration increased. When the feed was changed at the day 57, the acetate
accumulation restarted although biomass concentration increased. No improvement
was observed in hydrogen production in that period. Hence, the previous feed
composition was restored after day 68. The acetate concentration in the
photobioreactor continued to fluctuate and reached to 30 mM at the end of experiment.
Lactic acid was completely consumed till the 80th
day but after that day its
concentration remained at 2.5 mM. Propionic and butyric acid formation was
negligible during 105 days then propionic acid concentration increased to 17 mM but
after 113th
day it was consumed. Formic acid was produced in a considerable amount
in the system. It reached to its maximum concentration which was 26 mM at 18th
day
and remained around 20 mM till 62nd
day. After that day it was consumed and its
concentration decreased to 6 mM after 80th
day. At the end of the experiment its
concentration decreased to 3 mM. Formate production by Rb. capsulatus is
0
5
10
15
20
25
30
35
0 10 20 30 40 50 60 70 80 90 100 110 120 130
Co
nce
ntr
ati
on
(m
M)
Time (days)
LA(mM) FA(mM) AA(mM) PA(mM) BA(mM)
III
Feeding
Molasses:Buffer
3:1
II
Feeding
Molasses:Buffer
1:1
I
Start-up
IV
Feeding
Molasses:Buffer
1:1
Batch Continuous
Green House

112
associated with NAD-dependent formate dehydrogenase which reversibly catalyses
the formate synthesis from CO2 and NADH, H. The use of carbonate buffer may
stimulate the formate production by increasing soluble CO2 concentration in the
reactor. In addition, formate synthesis at high hydrogen production periods where
CO2 also evolves may explain its high production rate. So formate synthesis may be
attributed to the bacterial photosynthetic activity whereby it fixes CO2 into formate
through NAD-dependent formate dehydrogenase. If formate is not produced it
depletes proportional to the hydraulic retention time. After the second feeding period,
where carbonate buffer concentration was decreased a gradual decrease in formate
concentration was observed.
Figure 4.40 illustrates the chemical oxygen demand (COD), total organic
carbon (TOC), total nitrogen (TN), NH4+concentration detected in the PBR effluent
before the feeding and Carbon to Nitrogen (C/N) ratio. The tests were carried out
once a week for practical purposes. The COD of the molasses DFE is 6500 mg/L.
After dilution with buffer it decreased to 3250 mg/L. the COD value decreased to
1930 mg/L with photofermentation, the minimum was obtained at the 8th
day
(feeding started at the 6th
day). During continuous feeding COD value increased up
to 4600 mg/L after 107th
day. The total organic carbon didn’t change significantly
during the entire process and it was around 1500-2000 mg/L.
Total nitrogen value was 40 mg/L at the 8th
day of the experiment. Its
concentration varied between 20-150 mg/L. After 107th
day, where most of the
biomass has died COD, TN and NH4+ concentration increased to the feed
concentration.
The C/N ratio of the molasses DFE was 15.5. After the experiment started
C/N ratio of the photofermentation effluent increased to 26.5 at 8th
day. Then it
remained around 20 till 50th
day. After 50th
day average C/N ratio was around 45 till
the end of the experiment.

113
Figure 4.40 Variation in COD, TOC, TN and NH4+
in outdoor continuous
photobioreactor runs by Rb. capsulatus wild type on the molasses DFE. Starting date
of the experiment was 17.08.09. Feeding was started at 6th
day.
Figure 4.41 illustrates the variation in concentrations of Magnesium (Mg),
Zinc (Zn), Cobalt (Co), Manganese (Mn), Iron (Fe), Nickel (Ni), Copper (Cu),
Calcium (Ca), and Sodium (Na) ions during long term operation in Run170809.
Sodium (Na) concentration was 239 mM in the molasses DFE but in the
photofermentation effluent it was 86 mM at the 8th
day and its concentration changed
between 34 and 160 mM during the experiment. Magnesium (Mg) concentration was
5.26 mM in the molasses DFE and after dilution with buffer its concentration
decreased to 2.63 mM and its average concentration in the photofermentation
effluent was 0.73 mM. Iron (Fe) concentration in the molasses DFE was 0.025 mM.
To increase Iron (Fe) concentration in the media to 0.1 mM it was added to the
Na2CO3 buffer. Although Iron (Fe) addition average Iron (Fe) concentration was
around 0.025 mM in the photofermentation effluent during the experiment so more
Iron (Fe) can be added to the buffer. Concentrations of Zinc (Zn), Cobalt (Co),
0
1000
2000
3000
4000
5000
6000
7000
8000
9000
10000
0
10
20
30
40
50
60
70
80
90
100
110
120
130
140
150
160
0 10 20 30 40 50 60 70 80 90 100 110 120 130
CO
D, T
OC
(mg
/L) N
H4+, T
N (
mg
/L)
C/N
Ra
tio
Time (days)
COD TOC NH4+ TN C/N
III
Feeding
Molasses:Buffer
3:1
II
Feeding
Molasses:Buffer
1:1
I
Start-up IV
Feeding
Molasses:Buffer
1:1
Green House
Batch
Continuous

114
Manganese (Mn), Nickel (Ni), Copper (Cu), and Calcium (Ca) were also below 0.1
mM during the experiment.
Figure 4.41 Variation in concentrations of Mg, Zn, Co, Mn, Fe, Ni, Cu, Ca, and Na
in outdoor continuous photobioreactor runs by Rb. capsulatus wild type on the
molasses DFE. Starting date of the experiment was 17.08.09. Feeding was started at
6th
day.
Figure 4.42 illustrates the hourly changes of hydrogen production, solar
radiation and temperature variation at 19-21.10.2009. It can be clearly seen from the
figure that significant hydrogen production occurred between 9:00 and 17:00 in
autumn, for 10 hours a day.
0
20
40
60
80
100
120
140
160
180
0,0
0,1
0,2
0,3
0,4
0,5
0,6
0,7
0,8
0,9
1,0
1,1
1,2
0 10 20 30 40 50 60 70 80 90 100 110 120 130
Co
ncen
tratio
n (m
M)
(Na
)
Co
nce
ntr
ati
on
(m
M)
(Mg
, Z
n,C
o,
Mn
, F
e, N
i, C
u,
Ca
)
Time (days)
Mg(mM) Zn(mM) Co(mM) Mn(mM) Fe(mM)
Ni(mM) Cu(mM) Ca(mM) Na(mM)
III
Feeding
Molasses:Buffer
3:1
II
Feeding
Molasses:Buffer
1:1
I
Start-up
IV
Feeding
Molasses:Buffer
1:1
Green House
Batch
Continuous
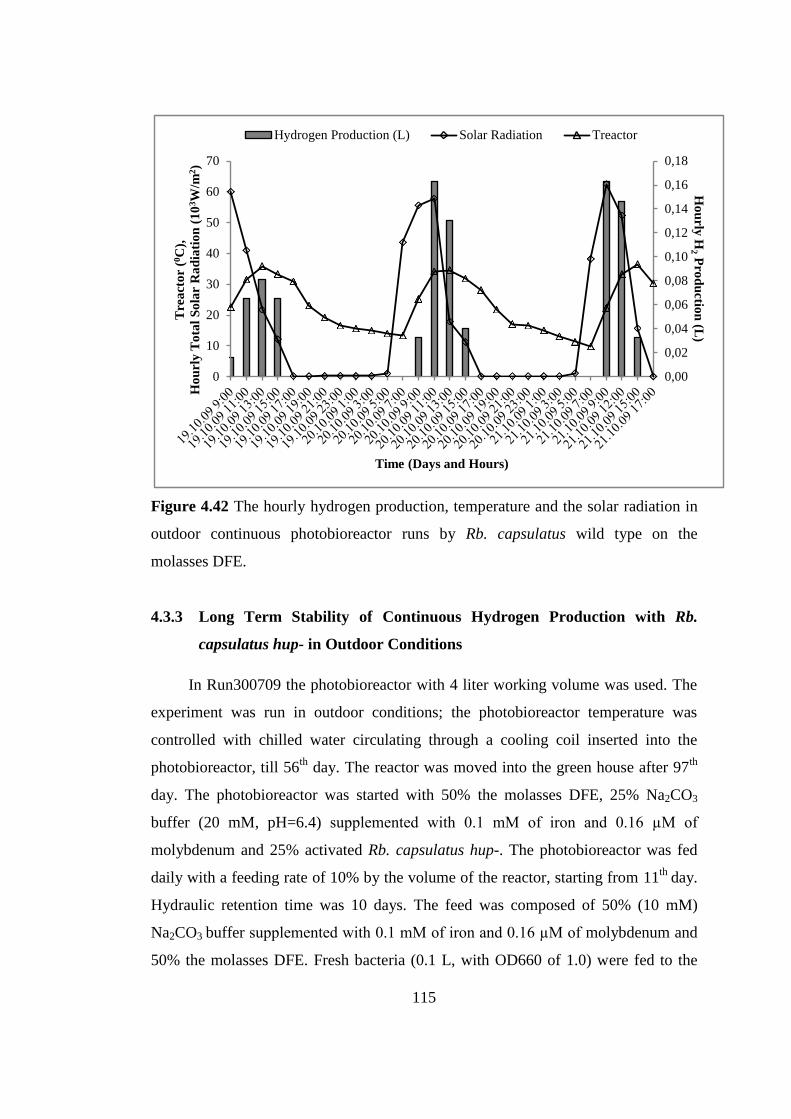
115
Figure 4.42 The hourly hydrogen production, temperature and the solar radiation in
outdoor continuous photobioreactor runs by Rb. capsulatus wild type on the
molasses DFE.
4.3.3 Long Term Stability of Continuous Hydrogen Production with Rb.
capsulatus hup- in Outdoor Conditions
In Run300709 the photobioreactor with 4 liter working volume was used. The
experiment was run in outdoor conditions; the photobioreactor temperature was
controlled with chilled water circulating through a cooling coil inserted into the
photobioreactor, till 56th
day. The reactor was moved into the green house after 97th
day. The photobioreactor was started with 50% the molasses DFE, 25% Na2CO3
buffer (20 mM, pH=6.4) supplemented with 0.1 mM of iron and 0.16 µM of
molybdenum and 25% activated Rb. capsulatus hup-. The photobioreactor was fed
daily with a feeding rate of 10% by the volume of the reactor, starting from 11th
day.
Hydraulic retention time was 10 days. The feed was composed of 50% (10 mM)
Na2CO3 buffer supplemented with 0.1 mM of iron and 0.16 µM of molybdenum and
50% the molasses DFE. Fresh bacteria (0.1 L, with OD660 of 1.0) were fed to the
0,00
0,02
0,04
0,06
0,08
0,10
0,12
0,14
0,16
0,18
0
10
20
30
40
50
60
70
Ho
urly
H2 P
rod
uctio
n (L
)
Tre
act
or
(0C
),
Ho
url
y T
ota
l S
ola
r R
ad
iati
on
(1
03W
/m2)
Time (Days and Hours)
Hydrogen Production (L) Solar Radiation Treactor

116
reactor at 127th
and 142nd
days. The experiment continued 149 days. The
photobioreactor temperature, pH, cell concentration, cumulative hydrogen
production, organic acid consumption and gas composition were measured daily.
The, chemical oxygen demand, total organic carbon and nitrogen and ammonia, and
elemental analyzes were done once a week. Daily global solar radiation energy data
were taken from National Institute of Meteorology in Turkey. The definition of total
global solar radiation is given in Appendix J. All gas measurements were corrected
by calculating permeability of hydrogen through reactor surface and solubility of
hydrogen in water and carryover amounts in inocula. Methods for calculating
hydrogen permeability through solids and solubility in water and are given in
Appendix G and H, respectively. Experimental data are given in Appendix M.9.
Experimental data are given in Appendix M.11.
Figure 4.43 illustrates the pH variation. The pH stabilized around 7.0 till the
108th
day then it decreased to 6.2.
Figure 4.43 Long term stability of pH in outdoor continuous photobioreactor runs by
Rb. capsulatus hup- on the molasses DFE. Starting date of the experiment was
30.07.09. Feeding was started at 11th
day.
0
1
2
3
4
5
6
7
8
9
10
0 10 20 30 40 50 60 70 80 90 100 110 120 130 140 150
pH
Time (days)
0.1L
Bacteria 0.1L
Bacteria
III
Feeding
Molasses:Buffer
3:1
II
Feeding
Molasses:Buffer
1:1
I
Start-up
IV
Feeding
Molasses:Buffer
1:1
Green House
Batch Continuous
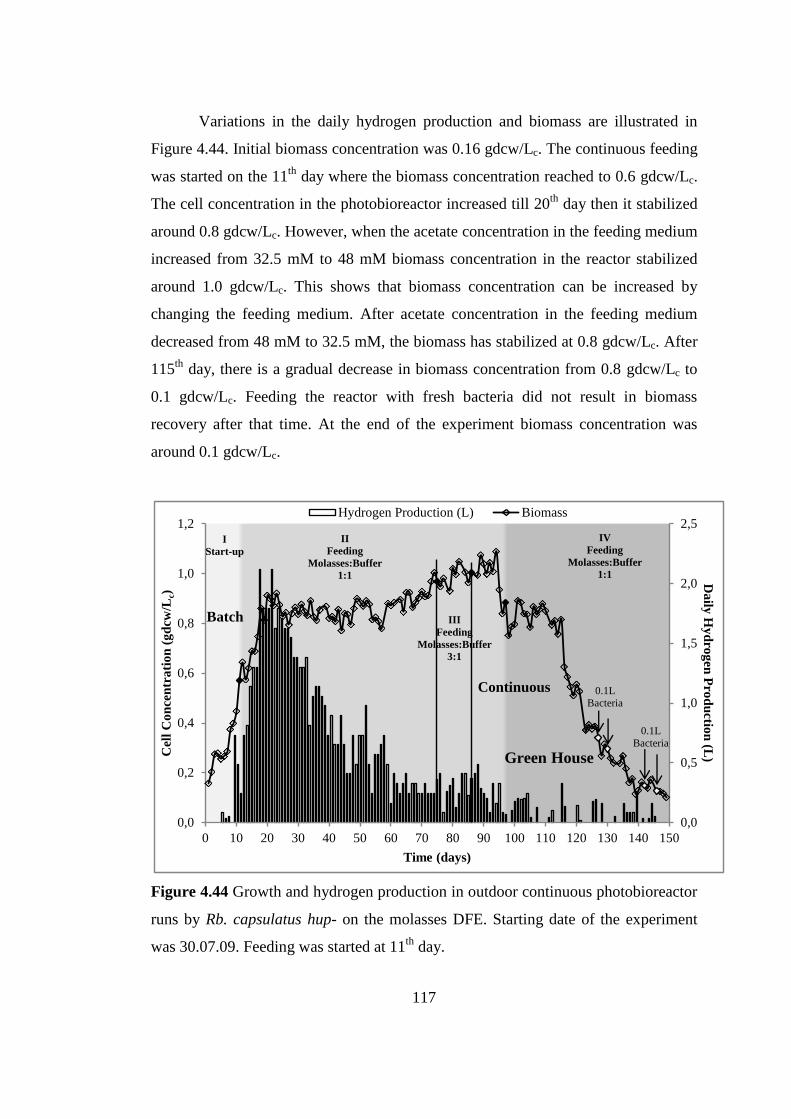
117
Variations in the daily hydrogen production and biomass are illustrated in
Figure 4.44. Initial biomass concentration was 0.16 gdcw/Lc. The continuous feeding
was started on the 11th
day where the biomass concentration reached to 0.6 gdcw/Lc.
The cell concentration in the photobioreactor increased till 20th
day then it stabilized
around 0.8 gdcw/Lc. However, when the acetate concentration in the feeding medium
increased from 32.5 mM to 48 mM biomass concentration in the reactor stabilized
around 1.0 gdcw/Lc. This shows that biomass concentration can be increased by
changing the feeding medium. After acetate concentration in the feeding medium
decreased from 48 mM to 32.5 mM, the biomass has stabilized at 0.8 gdcw/Lc. After
115th
day, there is a gradual decrease in biomass concentration from 0.8 gdcw/Lc to
0.1 gdcw/Lc. Feeding the reactor with fresh bacteria did not result in biomass
recovery after that time. At the end of the experiment biomass concentration was
around 0.1 gdcw/Lc.
Figure 4.44 Growth and hydrogen production in outdoor continuous photobioreactor
runs by Rb. capsulatus hup- on the molasses DFE. Starting date of the experiment
was 30.07.09. Feeding was started at 11th
day.
0,0
0,5
1,0
1,5
2,0
2,5
0,0
0,2
0,4
0,6
0,8
1,0
1,2
0 10 20 30 40 50 60 70 80 90 100 110 120 130 140 150
Da
ily H
yd
rog
en P
rod
uctio
n (L
) Cel
l C
on
cen
tra
tio
n (
gd
cw/L
c)
Time (days)
Hydrogen Production (L) Biomass
0.1L
Bacteria
0.1L
Bacteria
III
Feeding
Molasses:Buffer
3:1
II
Feeding
Molasses:Buffer
1:1
I
Start-up
IV
Feeding
Molasses:Buffer
1:1
Green House
Batch
Continuous

118
Hydrogen production started at the 10th
day. Daily hydrogen production
varied between 0.7- 2.1 L/day for 10 – 40th
days and between 0.4-0.8 L/day for 41–
74th
days. The maximum productivity (0.69 mmolesH2/Lc.h) and molar yield (76%)
were obtained in the first 41 days. Hydrogen productivity decreased to 0.38
mmolesH2/Lc.h and molar yield was 42% of the theoretical maximum between 41th
and 74th
days. The overall acetate conversion efficiency for the first 74 days was
77%. When the acetate concentration in the feeding media increased from 32.5 mM
to 49 mM both hydrogen productivity (0.25 mmolesH2/Lc.h) and molar yield (18% of
theoretical maximum) decreased. The molar yield was increased to 45% by
decreasing the acetate concentration in the feed from 49 to 32.5 mM while
productivity remained almost the same.
Variation in photobioreactor temperature is illustrated in Figure 4.45.
Figure 4.45 Variation in temperature in outdoor continuous photobioreactor runs by
Rb. capsulatus hup- on the molasses DFE. Starting date of the experiment was
30.07.09. Feeding was started at 11th
day.
-10
0
10
20
30
40
50
60
0 10 20 30 40 50 60 70 80 90 100 110 120 130 140 150
Tem
per
atu
re (
oC
)
Time (days)
III Feeding
Molasses:Buffer 3:1
II Feeding
Molasses:Buffer 1:1
I
Start-up
IV Feeding
Molasses:Buffer 1:1
Batch Continuous
Green House
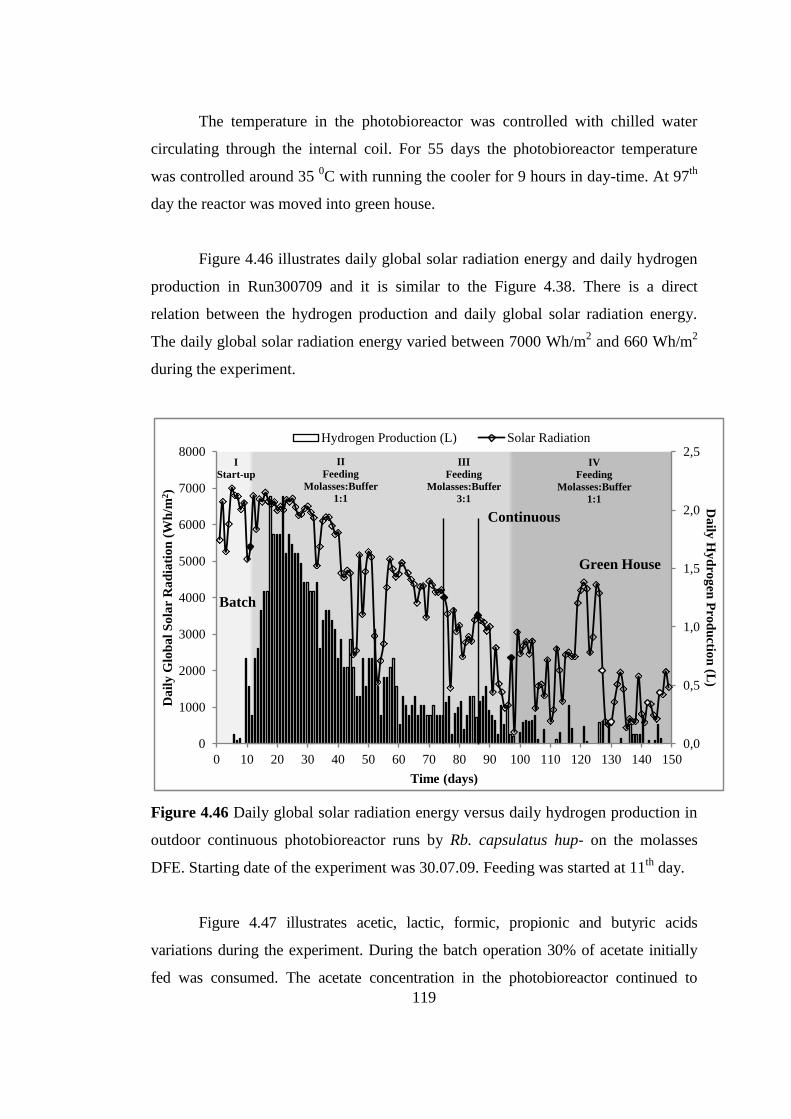
119
The temperature in the photobioreactor was controlled with chilled water
circulating through the internal coil. For 55 days the photobioreactor temperature
was controlled around 35 0C with running the cooler for 9 hours in day-time. At 97
th
day the reactor was moved into green house.
Figure 4.46 illustrates daily global solar radiation energy and daily hydrogen
production in Run300709 and it is similar to the Figure 4.38. There is a direct
relation between the hydrogen production and daily global solar radiation energy.
The daily global solar radiation energy varied between 7000 Wh/m2 and 660 Wh/m
2
during the experiment.
Figure 4.46 Daily global solar radiation energy versus daily hydrogen production in
outdoor continuous photobioreactor runs by Rb. capsulatus hup- on the molasses
DFE. Starting date of the experiment was 30.07.09. Feeding was started at 11th
day.
Figure 4.47 illustrates acetic, lactic, formic, propionic and butyric acids
variations during the experiment. During the batch operation 30% of acetate initially
fed was consumed. The acetate concentration in the photobioreactor continued to
0,0
0,5
1,0
1,5
2,0
2,5
0
1000
2000
3000
4000
5000
6000
7000
8000
0 10 20 30 40 50 60 70 80 90 100 110 120 130 140 150
Da
ily H
yd
rog
en P
rod
uctio
n (L
)
Da
ily
Glo
ba
l S
ola
r R
ad
iati
on
(W
h/m
2)
Time (days)
Hydrogen Production (L) Solar Radiation
III
Feeding
Molasses:Buffer
3:1
II
Feeding
Molasses:Buffer
1:1
I
Start-up
IV
Feeding
Molasses:Buffer
1:1
Green House
Batch
Continuous

120
decrease even after the feeding started. It dropped to 4 mM at 40th
day. After 40th
day,
acetate started to accumulated and its concentration reached to the feed concentration
after 123rd
day. Lactic acid was completely consumed till 113rd
day. After that day it
accumulated slightly and its concentration reached to 5 mM between 113rd
and 133rd
day. Then it was consumed again and depleted at the end of the experiment. Propionic
acid formation was negligible till 96th
day. At 99th
day propionic acid concentration
increased to 10 mM. After that day its concentration remained below 5 mM till the end
of the experiment. In addition butyric acid concentration in the system was nearly zero
till 116th
day but after that day its concentration increased and reached to 12 mM. After
142nd
day its concentration gradually decreased at the end it was 7 mM. Formic acid
was produced in a considerable amount in the photobioreactor. It reached to its
maximum value which was 28 mM at 28th
day and decreased to 2.5 mM at the end of
the experiment, similar to the trend observed in Run170809.
Figure 4.47 Organic acid consumption in outdoor continuous photobioreactor runs
by Rb. capsulatus hup- on the molasses DFE. Starting date of the experiment was
30.07.09. Feeding was started at 11th
day.
0
5
10
15
20
25
30
35
40
0 10 20 30 40 50 60 70 80 90 100 110 120 130 140 150
Co
nce
ntr
ati
on
(m
M)
Time (days)
LA(mM) FA(mM) AA(mM) PA(mM) BA(mM)
III
Feeding
Molasses:Buffer
3:1
II
Feeding
Molasses:Buffer
1:1
I
Start-up
IV
Feeding
Molasses:Buffer
1:1 Batch
Continuous
Green House

121
Figure 4.48 illustrates the chemical oxygen demand (COD), total organic
carbon (TOC), total nitrogen (TN), NH4+ concentration detected in the PBR effluent
before the feeding and carbon to nitrogen (C/N) ratio. During continuous feeding
average COD value was around 3400 mg/L till 125th
day. After that day COD value
reached up to 9400mg/L. The total organic carbon didn’t change significantly during
the entire process and it was around 1500-2000 mg/L.
Total nitrogen value was 126 mg/L at the 8th
day of the experiment. Its
concentration varied between 30-140 mg/L. After 110th
day, where most of the
biomass has died COD, TN and NH4+ concentration increased to the feed
concentration.
The average C/N ratio of the photofermentation effluent was almost 25
during the experiment.
Figure 4.48 The COD, TOC, TN, and NH4+ concentrations in outdoor continuous
photobioreactor runs by Rb. capsulatus hup- on the molasses DFE. Starting date of
the experiment was 30.07.09. Feeding was started at 11th
day.
Figure 4.49 illustrates the variation in concentrations of Magnesium (Mg),
Zinc (Zn), Cobalt (Co), Manganese (Mn), Iron (Fe), Nickel (Ni), Copper (Cu),
0
1000
2000
3000
4000
5000
6000
7000
8000
9000
10000
0
10
20
30
40
50
60
70
80
90
100
110
120
130
140
150
160
0 10 20 30 40 50 60 70 80 90 100 110 120 130 140 150
CO
D, T
OC
(mg
/L) N
H4+, T
N (
mg
/L),
C/N
Ra
tio
Time (days)
COD TOC NH4+ TN C/N
III
Feeding
Molasses:Buffer
3:1
II
Feeding
Molasses:Buffer
1:1
I
Start-up
IV
Feeding
Molasses:Buffer
1:1
Green House
Batch
Continuous

122
Calcium (Ca), and Sodium (Na) ions during long term operation in Run300709. In
the photofermentation effluent sodium (Na) concentration was 70 mM at the 28th
day
and its concentration changed between 35 and 104 mM during the experiment.
Magnesium (Mg) concentration was 5.26 mM in the molasses DFE and in the
photofermentation effluent its concentration decreased to 0.78 mM at the 28th
day
and its average concentration in the photofermentation effluent was almost same with
its initial concentration in the effluent. Although Iron (Fe) addition average Iron (Fe)
concentration was around 0.03 mM in the photofermentation effluent during the
experiment. Concentrations of Zinc (Zn), Cobalt (Co), Manganese (Mn), Nickel (Ni),
Copper (Cu), and Calcium (Ca) were also below 0.1 mM and similar within the
Run170809.
Figure 4.49 Variation in concentrations of Mg, Zn, Co, Mn, Fe, Ni, Cu, Ca, and Na
in outdoor continuous photobioreactor runs by Rb. capsulatus wild type on the
molasses DFE. Starting date of the experiment was 30.07.09. Feeding was started at
11th
day.
0
20
40
60
80
100
120
140
160
180
0,0
0,1
0,2
0,3
0,4
0,5
0,6
0,7
0,8
0,9
1,0
1,1
1,2
0 10 20 30 40 50 60 70 80 90 100 110 120 130 140 150
Co
ncen
tratio
n (m
M)
Na
Co
nce
ntr
ati
on
(m
M)
Mg
, Z
n,
Co
, M
n, F
e, N
i, C
u,
Ca
Time (days)
Mg(mM) Zn(mM) Co(mM) Mn(mM) Fe(mM)
Ni(mM) Cu(mM) Ca(mM) Na(mM)
III
Feeding
Molasses:Buffer
3:1
II
Feeding
Molasses:Buffer
1:1 I
Start-up
IV
Feeding
Molasses:Buffer
1:1
Green House
Batch Continuous

123
The hourly hydrogen production, temperature in Run300709 and the solar
radiation are plotted in Figure 4.50. Significant hydrogen was produced between 9:00
and 17:00 during a day in autumn.
Figure 4.50 The hourly hydrogen production, temperature in outdoor continuous
photobioreactor runs by Rb. capsulatus hup- on the molasses DFE. Starting date of
the experiment was 30.07.09. Feeding was started at 11th
day.
4.4 Logistic Growth Model
The logistic function model is increasingly being used to describe microbial
growth (Classen et al., 2000). The logistic function model describes the growth of
microbial populations as a function of initial population density, time, growth rate,
and final population density (Wachenheim et al., 2003).
By using logistic model it is possible to model bacterial growth at exponential
phase together with stationary phase. The predictive power of logistic model may be
limited since it does not involve a substrate term; however, for the purposes of batch
hydrogen production experiments, where the initial substrate concentrations and the
0,00
0,05
0,10
0,15
0,20
0,25
0
10
20
30
40
50
60
70
Ho
urly
Hy
dro
gen
Pro
du
ction
(L)
Tre
act
or
(0C
),
Ho
url
y T
ota
l S
ola
r R
ad
iati
on
(1
03 W
/m2)
Time (Days and Hours)
Hydrogen Production (L) Solar Radiation Treactor

124
inoculation volume are kept constant, the logistic model is a fair approximation of
the growth curve (Koku et al, 2003). Uyar et al (2008) showed that Logistic model
can be used for modeling growth of Rb. sphaeroides O.U.001 for malate, acetate,
propionate, lactate, and butyrate.
The cell growth can be explained in three phases; lag phase, exponential phase
and stationary phase. Lag phase is the adaptation period of the microorganism to a
new media so in this phase there is small growth observed. The Exponential phase is
the reproduction period of the microorganism so in this phase there is an abruptly
biomass increase. In the stationary phase microorganism has already accommodated
the new media and already utilized all of the substrate for growing so biomass is
stabilized in this phase.
The cell growth can be theoretically represented by exponential model:
d
dt µ (4.1)
Where X is the cell dry weight concentration (gdcw/Lc) and μ is the specific
growth rate (h−1
).
After the equation 4.1 was integrated the equation below was obtained
f iexp (μt) (4.2)
The growth rate for the logistic model is expressed as:
d
dt kc (
1-
max) (4.3)
Where kc is the apparent specific growth rate (h-1
), X is the dry cell weight
(gdcw/Lc), and Xmax is the maximum dry cell weight (gdcw/Lc).
Integrating, the equation becomes:
max
(1 ( max
i-1) exp(-k
c.t))
(4.4)

125
Where Xi is the initial bacterial concentration at the lag time (gdcw/Lc) and t
is the actual time minus lag time (h).
The experimental data collected for defining growth kinetics in this study
were fitted into the logistic model using a program for fitting curves, Curve Expert
1.4.
Figure 4.51 shows the logistic model for the growth of Rhodobacter
capsulatus (DSM 1710) studied in indoor continuous photobioreactor (8 L) on
defined medium started at 24.08.07. Experimental data used for modeling are
between 24.08.07 and 28.01.08. Correlation coefficient and standard error of the
system are 0.90 and 0.092, respectively. Although composition of the feeding media
was changed five times during the experiment the correlation coefficient of logistic
model is very high.
Figure 4.51 The logistic model for the growth of Rb. capsulatus (DSM 1710) studied
in indoor continuous photobioreactor (8 L) on defined medium (24.08.07-28.01.08)
Figure 4.52 shows the logistic model for the growth of Rhodobacter
capsulatus (DSM 1710) studied in outdoor continuous photobioreactors (8 L) on
S = 0.09235978
r = 0.90055359
Time (days)
Ce
ll C
on
cen
tra
tio
n (
gd
cw
/Lc
)
0 10 20 30 40 50 60 70 80 90 100 110 120 130 140 150 160
0.0
0.2
0.3
0.4
0.6
0.7
0.9
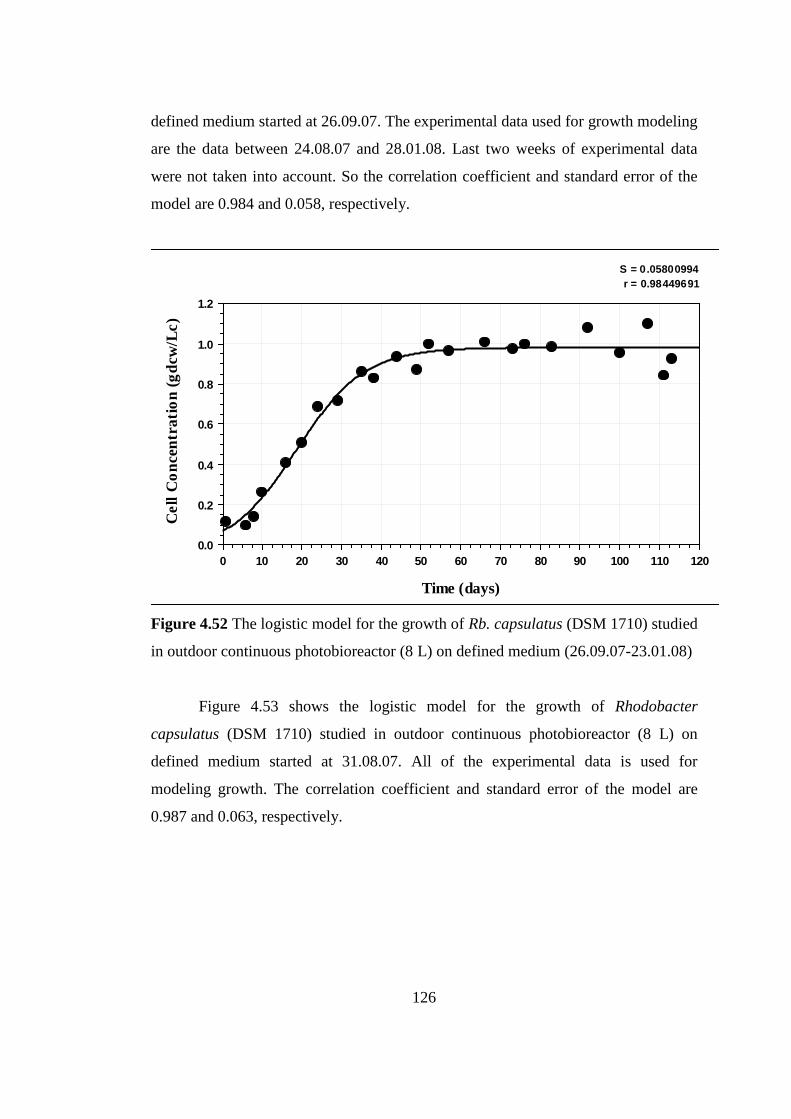
126
defined medium started at 26.09.07. The experimental data used for growth modeling
are the data between 24.08.07 and 28.01.08. Last two weeks of experimental data
were not taken into account. So the correlation coefficient and standard error of the
model are 0.984 and 0.058, respectively.
Figure 4.52 The logistic model for the growth of Rb. capsulatus (DSM 1710) studied
in outdoor continuous photobioreactor (8 L) on defined medium (26.09.07-23.01.08)
Figure 4.53 shows the logistic model for the growth of Rhodobacter
capsulatus (DSM 1710) studied in outdoor continuous photobioreactor (8 L) on
defined medium started at 31.08.07. All of the experimental data is used for
modeling growth. The correlation coefficient and standard error of the model are
0.987 and 0.063, respectively.
S = 0.05800994
r = 0.98449691
Time (days)
Ce
ll C
on
cen
tra
tio
n (
gd
cw
/Lc
)
0 10 20 30 40 50 60 70 80 90 100 110 120
0.0
0.2
0.4
0.6
0.8
1.0
1.2

127
Figure 4.53 The logistic model for the growth of Rb. capsulatus (DSM 1710) studied
in outdoor continuous photobioreactors (8 L) on defined medium (31.08.07)
Figure 4.54 gives the logistic model for the growth of Rhodobacter
capsulatus hup- studied in outdoor continuous pilot-scale photobioreactor on defined
medium. All of the experimental data is used for modeling of growth of the bacteria.
The correlation coefficient and standard error of the model are 0.914 and 0.072,
respectively.
S = 0.06329833
r = 0.98737573
Time (days)
Ce
ll C
on
cen
tra
tio
n (
gd
cw
/Lc
)
0 10 20 30 40 50 60 70 80 90 100 110 120 130 140 150 160
0.0
0.2
0.4
0.6
0.8
1.1
1.3
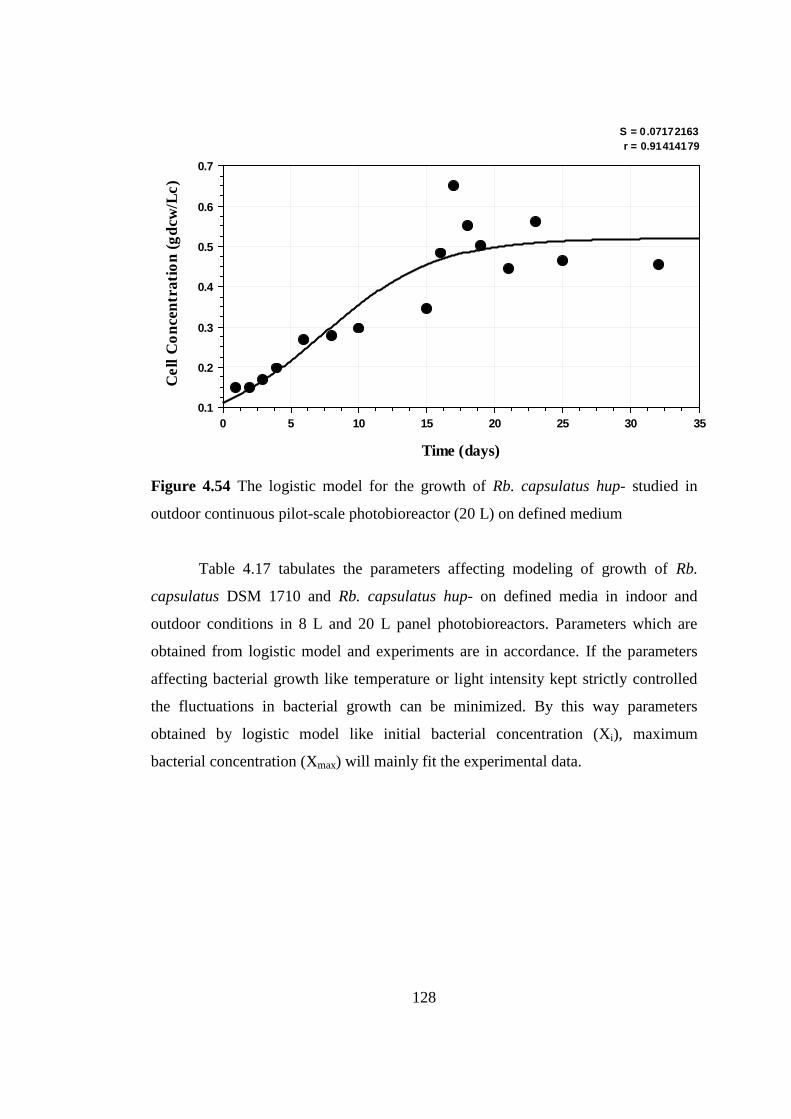
128
Figure 4.54 The logistic model for the growth of Rb. capsulatus hup- studied in
outdoor continuous pilot-scale photobioreactor (20 L) on defined medium
Table 4.17 tabulates the parameters affecting modeling of growth of Rb.
capsulatus DSM 1710 and Rb. capsulatus hup- on defined media in indoor and
outdoor conditions in 8 L and 20 L panel photobioreactors. Parameters which are
obtained from logistic model and experiments are in accordance. If the parameters
affecting bacterial growth like temperature or light intensity kept strictly controlled
the fluctuations in bacterial growth can be minimized. By this way parameters
obtained by logistic model like initial bacterial concentration (Xi), maximum
bacterial concentration (Xmax) will mainly fit the experimental data.
S = 0.07172163
r = 0.91414179
Time (days)
Ce
ll C
on
cen
tra
tio
n (
gd
cw
/Lc
)
0 5 10 15 20 25 30 35
0.1
0.2
0.3
0.4
0.5
0.6
0.7

129
Table 4.17 Growth modeling of the Rb. capsulatus DSM 1710 and Rb. capsulatus
hup- on defined medium in panel photobioreactors
Indoor
Continuous
PBR (8 L) on by
Rb. capsulatus
wild type
Defined
Medium
(24.08.07)
Outdoor
Continuous
PBR (8 L) by
Rb. capsulatus
wild type on
Defined
Medium
(26.09.07)
Outdoor
Continuous
PBR (8 L) by
Rb. capsulatus
wild type on
Defined
Medium
(31.08.07)
Outdoor
Continuous
Pilot-Scale PBR
(20 L) by Rb.
capsulatus hup-
on Defined
Medium
(02.12.08)
Xi,e 0.09 0.15 0.02 0.11
Xi,m 0.17 0.11 0.07 0.09
Xmax,e 0.82 1.10 1.15 0.62
Xmax,m 0.71 0.98 1.04 0.49
µmax 0.05 0.07 0.05 0.18
kc 0.05 0.12 0.04 0.23
Figure 4.55 gives the logistic model for the growth of Rhodobacter
capsulatus DSM 1710 studied in indoor continuous photobioreactor (500 ml) on the
molasses DFE. Correlation coefficient and standard error of the model are 0.974 and
0.044, respectively.

130
Figure 4.55 The logistic model for the growth of Rb. capsulatus DSM 1710 studied
in indoor continuous photobioreactor (500 ml) on the molasses DFE.
Figure 4.56 shows the logistic model for the growth of Rhodobacter
capsulatus DSM 1710 studied in indoor continuous photobioreactor (4 L) on the
molasses DFE. The experimental data used for growth modeling are the data between
24.04.09 and 03.05.09. Correlation coefficient and standard error of the model are
0.930 and 0.28, respectively.
S = 0.03909117
r = 0.96246964
Time (days)
Ce
ll C
on
cen
tra
tio
n (
gd
cw
/Lc
)
0 1 2 3 4 5 6 7 8 9 10 11 12 13 14 15
0.1
0.2
0.3
0.4
0.5
0.6
0.7
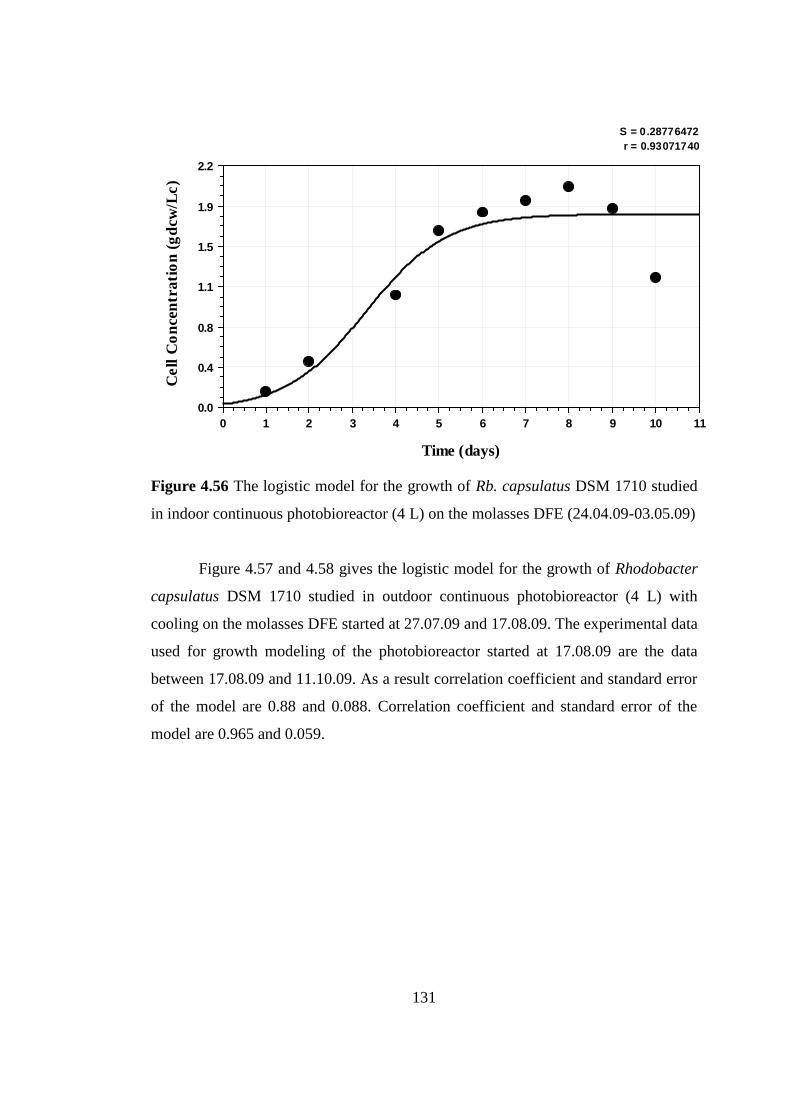
131
Figure 4.56 The logistic model for the growth of Rb. capsulatus DSM 1710 studied
in indoor continuous photobioreactor (4 L) on the molasses DFE (24.04.09-03.05.09)
Figure 4.57 and 4.58 gives the logistic model for the growth of Rhodobacter
capsulatus DSM 1710 studied in outdoor continuous photobioreactor (4 L) with
cooling on the molasses DFE started at 27.07.09 and 17.08.09. The experimental data
used for growth modeling of the photobioreactor started at 17.08.09 are the data
between 17.08.09 and 11.10.09. As a result correlation coefficient and standard error
of the model are 0.88 and 0.088. Correlation coefficient and standard error of the
model are 0.965 and 0.059.
S = 0.28776472
r = 0.93071740
Time (days)
Ce
ll C
on
cen
tra
tio
n (
gd
cw
/Lc
)
0 1 2 3 4 5 6 7 8 9 10 11
0.0
0.4
0.8
1.1
1.5
1.9
2.2
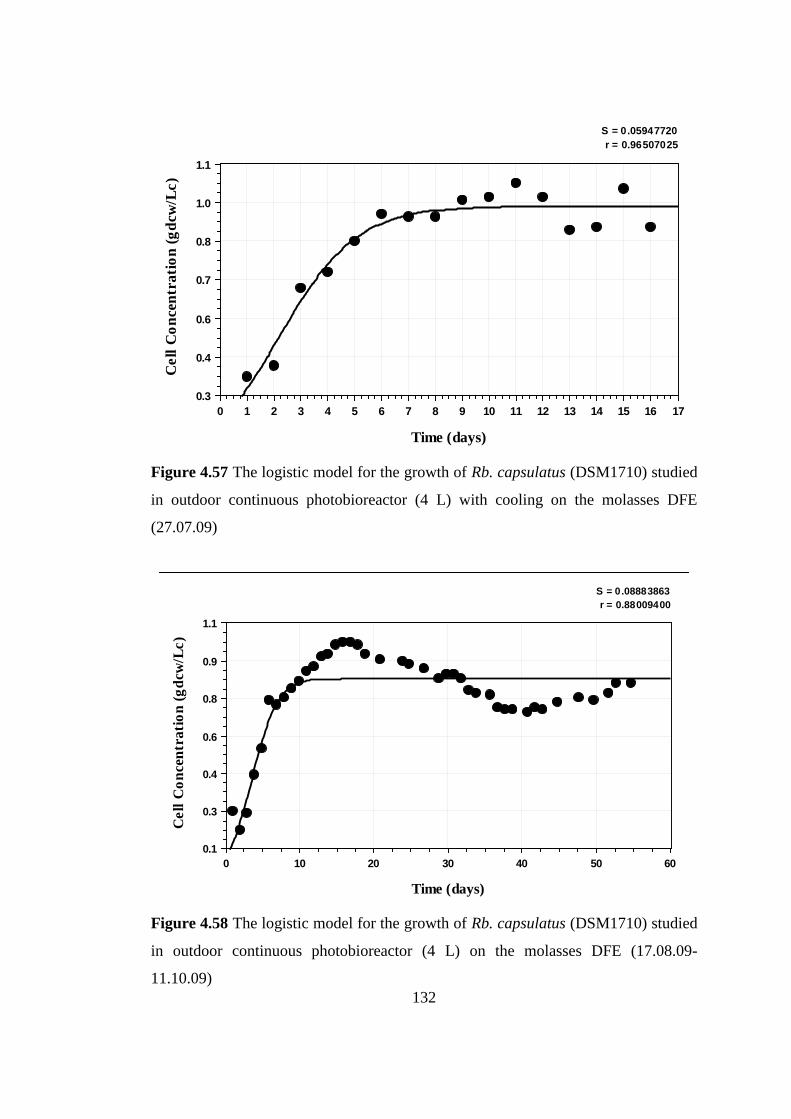
132
Figure 4.57 The logistic model for the growth of Rb. capsulatus (DSM1710) studied
in outdoor continuous photobioreactor (4 L) with cooling on the molasses DFE
(27.07.09)
Figure 4.58 The logistic model for the growth of Rb. capsulatus (DSM1710) studied
in outdoor continuous photobioreactor (4 L) on the molasses DFE (17.08.09-
11.10.09)
S = 0.05947720
r = 0.96507025
Time (days)
Ce
ll C
on
cen
tra
tio
n (
gd
cw
/Lc
)
0 1 2 3 4 5 6 7 8 9 10 11 12 13 14 15 16 17
0.3
0.4
0.6
0.7
0.8
1.0
1.1
S = 0.08883863
r = 0.88009400
Time (days)
Ce
ll C
on
cen
tra
tio
n (
gd
cw
/Lc
)
0 10 20 30 40 50 60
0.1
0.3
0.4
0.6
0.8
0.9
1.1

133
Figure 4.59 shows the logistic model for the growth of Rhodobacter
capsulatus (DSM 1710) studied in outdoor continuous photobioreactor on the
molasses DFE started at 30.07.09. The experimental data used for growth modeling
are the data between 30.07.09 and 11.10.09. Correlation coefficient and standard
error of the model are 0.051 and 0.0974, respectively.
Figure 4.59 The logistic model for the growth of Rb. capsulatus hup- studied in
outdoor continuous photobioreactor (4 L) on the molasses DFE (30.07.09-11.10.09)
Table 4.18 tabulates the characteristics of growth modeling of Rb. capsulatus
DSM 1710 and Rb. capsulatus hup- on molasses dark fermentor effluent in indoor
and outdoor conditions in 4 L panel photobioreactors with cooling coil.
S = 0.05117345
r = 0.97469507
Time (days)
Ce
ll C
on
cen
tra
tio
n (
gd
cw
/Lc
)
0 10 20 30 40 50 60 70 80 90
0.0
0.2
0.4
0.6
0.7
0.9
1.1
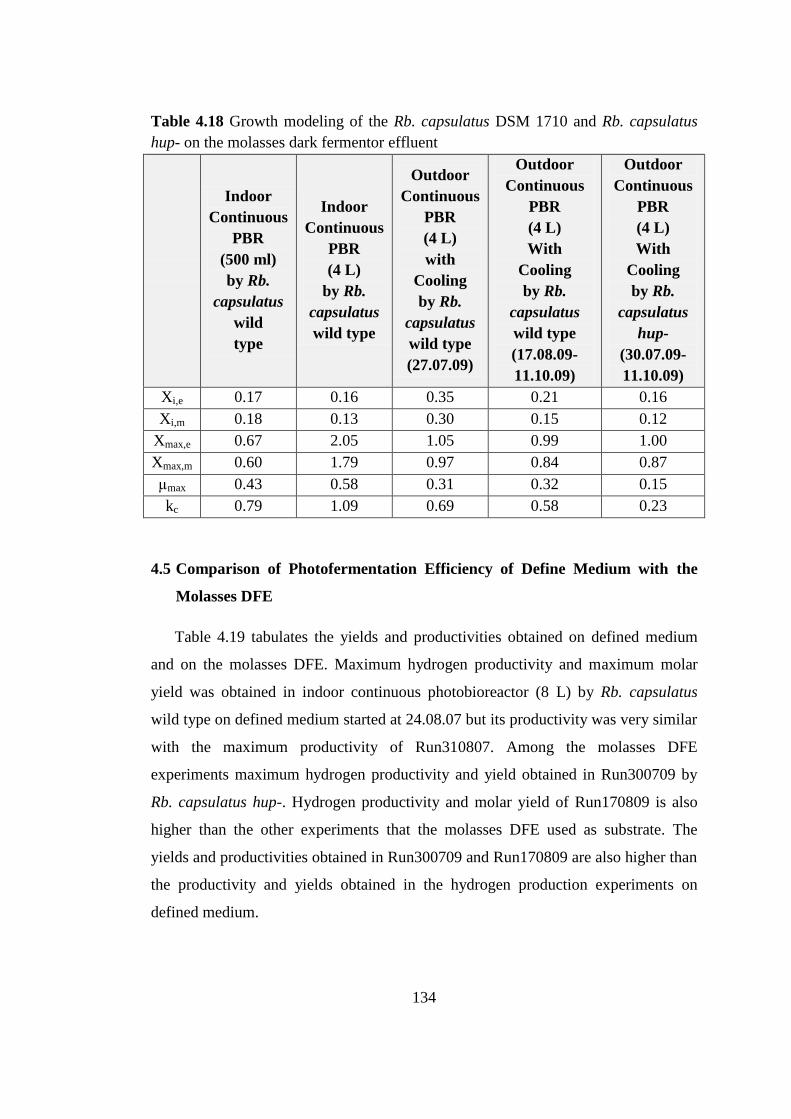
134
Table 4.18 Growth modeling of the Rb. capsulatus DSM 1710 and Rb. capsulatus
hup- on the molasses dark fermentor effluent
Indoor
Continuous
PBR
(500 ml)
by Rb.
capsulatus
wild
type
Indoor
Continuous
PBR
(4 L)
by Rb.
capsulatus
wild type
Outdoor
Continuous
PBR
(4 L)
with
Cooling
by Rb.
capsulatus
wild type
(27.07.09)
Outdoor
Continuous
PBR
(4 L)
With
Cooling
by Rb.
capsulatus
wild type
(17.08.09-
11.10.09)
Outdoor
Continuous
PBR
(4 L)
With
Cooling
by Rb.
capsulatus
hup-
(30.07.09-
11.10.09)
Xi,e 0.17 0.16 0.35 0.21 0.16
Xi,m 0.18 0.13 0.30 0.15 0.12
Xmax,e 0.67 2.05 1.05 0.99 1.00
Xmax,m 0.60 1.79 0.97 0.84 0.87
µmax 0.43 0.58 0.31 0.32 0.15
kc 0.79 1.09 0.69 0.58 0.23
4.5 Comparison of Photofermentation Efficiency of Define Medium with the
Molasses DFE
Table 4.19 tabulates the yields and productivities obtained on defined medium
and on the molasses DFE. Maximum hydrogen productivity and maximum molar
yield was obtained in indoor continuous photobioreactor (8 L) by Rb. capsulatus
wild type on defined medium started at 24.08.07 but its productivity was very similar
with the maximum productivity of Run310807. Among the molasses DFE
experiments maximum hydrogen productivity and yield obtained in Run300709 by
Rb. capsulatus hup-. Hydrogen productivity and molar yield of Run170809 is also
higher than the other experiments that the molasses DFE used as substrate. The
yields and productivities obtained in Run300709 and Run170809 are also higher than
the productivity and yields obtained in the hydrogen production experiments on
defined medium.
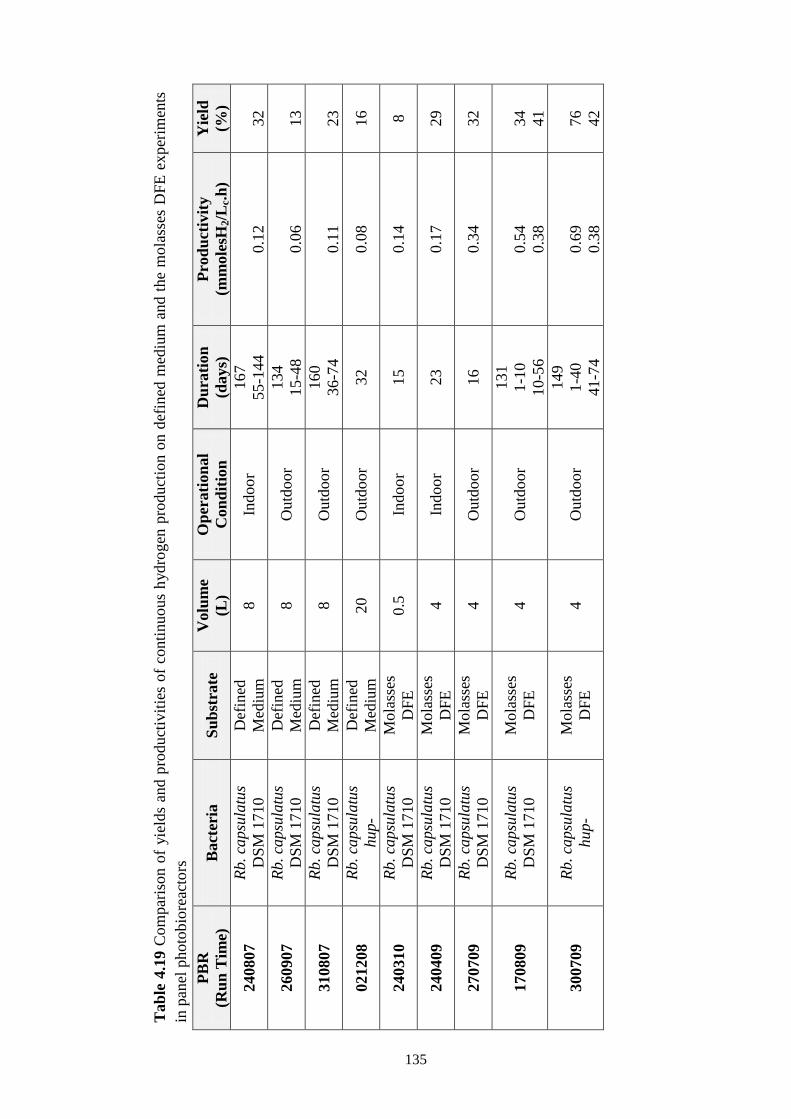
135
Tab
le 4
.19 C
om
par
ison o
f yie
lds
and p
roduct
ivit
ies
of
conti
nuous
hydro
gen
pro
duct
ion o
n d
efin
ed m
ediu
m a
nd t
he
mola
sses
DF
E e
xper
imen
ts
in p
anel
photo
bio
reac
tors
PB
R
(Ru
n T
ime)
B
act
eria
S
ub
stra
te
Volu
me
(L)
Op
erati
on
al
Con
dit
ion
Du
rati
on
(days)
Pro
du
ctiv
ity
(mm
ole
sH2/L
c.h
)
Yie
ld
(%)
240807
Rb. ca
psu
latu
s
DS
M 1
710
Def
ined
Med
ium
8
Indoo
r 167
55-1
44
0.1
2
32
260907
Rb. ca
psu
latu
s
DS
M 1
710
Def
ined
Med
ium
8
Outd
oor
134
15-4
8
0.0
6
13
310807
Rb. ca
psu
latu
s
DS
M 1
710
Def
ined
Med
ium
8
Outd
oor
160
36-7
4
0.1
1
23
021208
Rb. ca
psu
latu
s
hup-
Def
ined
Med
ium
20
Outd
oor
32
0.0
8
16
240310
Rb. ca
psu
latu
s
DS
M 1
710
Mola
sses
DF
E
0.5
In
doo
r 15
0.1
4
8
240409
Rb. ca
psu
latu
s
DS
M 1
710
Mola
sses
DF
E
4
Indoo
r 23
0.1
7
29
270709
Rb. ca
psu
latu
s
DS
M 1
710
Mola
sses
DF
E
4
Outd
oor
16
0.3
4
32
170809
Rb. ca
psu
latu
s
DS
M 1
710
Mola
sses
DF
E
4
Outd
oor
131
1-1
0
10-5
6
0.5
4
0.3
8
34
41
300709
Rb. ca
psu
latu
s
hup-
Mola
sses
DF
E
4
Outd
oor
149
1-4
0
41-7
4
0.6
9
0.3
8
76
42

136
CHAPTER 5
CONCLUSIONS
In this study, a stable operation of a continuous panel photobioreactor by
Rhodobacter capsulatus on acetate-lactate-glutamate containing feeding media has
been achieved for long term.
There exists a critical cell concentration (0.3 gdcw/Lc) for hydrogen production to
commence. Below this threshold value, hydrogen production is negligible.
Increase in glutamate concentration increases biomass concentration in the
photobioreactor.
The removal of lactate from feeding media did not influence hydrogen
productivity significantly. But acetate and glutamate are prior for hydrogen production
and bacterial growth. And if we increase acetate concentration the hydrogen
production increase but there is a limiting acetate level for hydrogen production.
C/N ratio is an important parameter for long term operation.
There are prior parameters for a stable and long term operation. These can be
simply designated for an indoor operation as light intensity, feed composition and
feeding rate.
Temperature can easily be controlled in indoor conditions but in outdoor
conditions temperature control get the most important parameter and it brings along
with a cooling or a heating requirement.
Feedings should be done daily to prevent fluctuations in bacterial growth.
In a long term operation bacterium can produce a thin film on the surface. The film
layer production is also a design and construction problem so the reason of production
of the film layer should be studied.
Dark fermentor effluent of molasses is a suitable feedstock for photofermentative
hydrogen production. It can be utilized for growth and hydrogen production by
Rhodobacter capsulatus. Besides it contains vitamins and minerals which is vital for

137
biological activity of microorganisms consequently there is no need to add additional
nutrients.
Sodium carbonate is a convenient buffer for controlling the pH in biological
systems. It is also cheap and environmentally friendly than potassium phosphate
buffer.
A continuous operation up to 131 days has been achieved on molasses the dark
fermentor effluent by Rhodobacter capsulatus DSM 1710 in a cooled panel
photobioreactor in outdoor conditions.
A continuous operation up to 149 days has been achieved on the molasses the dark
fermentor effluent by Rhodobacter capsulatus hup- in a cooled panel photobioreactor
in outdoor conditions.
During summer the maximum temperature should not be greater than 38 0C. The
temperature is effectively controlled by placing internal cooling coils into the panel
reactor. A cooling apparatus helped keeping the temperature around 35 0C so
continuous hydrogen production was obtained.
For stable operation controlling the maximum temperature during the day and the
minimum temperature during the night is strongly recommended. The minimum
temperature level for hydrogen production is 10 0C because the hydrogen productivity
decreased as the reactor temperature decreased under this value.
There is a close relation with global solar radiation energy and hydrogen
production. As daily global solar radiation energy decreases daily hydrogen production
decreases.
The long term experiments show that pH is an important parameter for long term
stability.
Addition of fresh bacteria is a promising method for increasing cell concentration
in the photobioreactor.

138
REFERENCES
Abraham, S., 2002, “Towards a more secure and cleaner energy future for america:
National hydrogen energy roadmap; Production, delivery, storage, conversion,
applications” Public Education and Outreach, U.S. Department of Energy,
Washington, DC
Adams, M.W.W., 1990, “The structure and mechanism of [Fe]-hydrogenase”,
Biochimica Biophysica Acta, 1020:115–145
Androga, D. D., 2009, “Biological hydrogen production on acetate in continuous
panel photobioreactors using Rhodobacter capsulatus”, M. Sc. Thesis in Chemical
Engineering, Middle East Technical University, Ankara, Turkey
Akkerman I., Janssen M., Rocha J., Wijfels R.H., 2002, “Photobiological hydrogen
production: Photochemical efficiency and bioreactor design”, International Journal
Hydrogen Energy, 27:1195-1208
Akkose S., Gunduz U., Yucel M., Eroglu I., 2009, “Effects of ammonium ion,
acetate and aerobic conditions on hydrogen production and expression levels of
nitrogenase genes in Rhodobacter sphaeroides O.U.001”, International Journal
Hydrogen Energy, 34:8818-8827
Arai, T., Wakayama T., Okana S., Kitamura H., 1998, “Open air hydrogen
production by photosynthetic bacteria used solar energy during winter seasons in
central Japan”, presented in International Conference on Biological Hydrogen
Production, Hawaii, USA
Asada, Y., Ohsawa M., Nagai Y., Ishimi K., Fukatsu M., Hideno A., Wakayama T.,
Miyake J., 2008, “Re-evaluation of hydrogen productivity from acetate by some
photosynthetic bacteria”, International Journal of Hydrogen Energy, 33:5147-5150
Barbir, F., 2005, “PEM fuel cells: Theory and practice”, Elsevier Academic Press:
USA

139
Barbosa, M.J., Rocha J.M.S., Tramper J., Wijfels R.H., 2003, “Acetate as a carbon
source for hydrogen production by photosynthetic bacteria”, Journal of
Biotechnology, 85:25-33
Barbosa, M.J.G.V., 2003, “Microalgal photobioreactors: Scale-up and optimization”,
Ph. D. Thesis, Wageningen University, The Netherlands
Basak, N., Das D., 2007, “The prospect of purple non-sulfur (PNS) photosynthetic
bacteria for hydrogen production: the present state of the art”, World Journal of
Microbiology and Biotechnology, 23:31-42
Biebl, H., Pfennig N., 1981, “Isolation of members of the family Rhodosprillaceae",
In: Starr M.P., Stolp H., Trüper H.G., Balows A., Schlegel H.G. (Eds.), The
Prokaryotes, Springer-Verlag, New York, Vol. 1, pp. 267-273
Biel, A.J., 1986, “Control of bacteriochlorophyll accumulation by light in
Rhodobacter capsulatus”, Journal of Bacteriology, 168: 655-659
Boran, E., Ozgur E., Burg J., Yucel M., Gunduz U., Eroglu I, 2010, “Biological
hydrogen production by Rhodobacter capsulatus in solar tubular photobioreactor”,
Journal of Cleaner Production, doi: 10.1016/j.jclepro.2010.03.018
Blake, D.M., 2005, “Hydrogen reactor development and design for
photofermentation and photolytic processes”, DOE Hydrogen Program, FY 2005
Progress Report
Brentner, L.B., Peccia J., Zimmerman J.B., 2010, “Challenges in developing
biohydrogen as a sustainable energy source: Implications for a research agenda”,
Environmental Science and Technology, 44:2243–2254
Burgess, G., Fernandez-Velasco J.G., Lovegrove K., 2006, “Materials, geometry,
and net energy ratio of tubular photobioreactors for microalgal hydrogen
production”, Proceeding of the World Hydrogen Energy Conference, Lyon, France
Cammack, R., 1999, “Hydrogenase sophistication”, Nature, 397:214–215
Cheng-Wu, Z., Zmora O., Kopel R., Richmond A., 2001, “An industrial-size flat
plate glass reactor for mass production of Nannochloropsis sp.”, Aquaculture,
195:35-49
140
Claassen, P.A.M., van Lier J.B., Contreras A.M.L., van Niel L.S., Stams A.J.M., de
Vries S.S., Weusthuis R.A., 1999, “Utilization of biomass for the supply of energy
carriers”, Applied Microbiology and Biotechnology, 52:741-755
Claassen, P.A.M., Vrije T., 2006, “Non-thermal production of pure hydrogen from
biomass: Hyvolution”, International Journal of Hydrogen Energy, 31:1416-1423
Classen, J.J., Engler C.R., Kenerley C.M., Whittaker A.D., 2000, “A logistic model
of subsurface fungal growth with application to biomediation”, Journal of
Environmental Science and Health, Part A, 35:465-488
Clayton, R.K., 1963, “Two light reactions of bacteriochlorophyll in vivo”,
Proceedings of the National Academy of Sciences, Charles F. Kettering Research
Laboratory, Yellow Springs, Ohio
Cohen-Bazire, G., Sistrom W.R., Stanley, R.Y., 1957, „„Kinetic studies of pigment
synthesis by non-purple pulfur bacteria‟‟, Journal of Cellular and Comparative
Physiology, 49:25-68
Das, D. Veziroglu T.N., 2001, “Hydrogen production by biological processes: a
survey of literature”, International Journal of Hydrogen Energy, 26:13-28.
Das, D., Basak N., 2007, “The prospect of purple non-sulfur (PNS) photosynthetic
bacteria for hydrogen production: The present state of art”, World Journal of
Microbiology and Biotechnology, 23:31-42
Das, D., Khanna N., Veziroglu T.N., 2008, “Recent developments in biological
hydrogen production processes” Chemical Industry & Chemical Engineering
Quarterly, 14:57-67
Das, D., 2009, “Advances in biohydrogen production processes: An approach
towards commercialization”, International Journal of Hydrogen Energy, 34:7349-
7357
Degen, J., Uebele A., Retze A., Schmid-Staiger U., Trösch W., 2001, “A novel airlift
photobioreactor with baffles for improved light utilization through the flashing light
effect”, Journal of Biotechnology, 92:89-94
Dixon, R. Kahn D., 2004, “Genetic regulation of biological nitrogen fixation”,
Nature Reviews Microbiology, 2:621-631

141
Ekins, P. Hughes N., 2009, “The prospects for a hydrogen economy (1): hydrogen
futures”, Technology Analysis & Strategic Management, 21:783-803
Eroglu, E., Eroglu I., Gunduz U., Turker L., Yucel M., 2006, “Biological hydrogen
production from olive mill wastewater with two-stage processes”, International
Journal of Hydrogen Energy, 31:1527-1535
Eroglu, I., Tabanoglu A., Gunduz U., Eroglu E., Yucel M., 2008, “Hydrogen
production by Rhodobacter sphaeroides O.U.001 in a flat-plate solar bioreactor”,
International Journal of Hydrogen Energy, 33:531-541
Fang, H.H.P., Liu H., Zhang T., 2005, “Phototrophic hydrogen production from
acetate and butyrate in wastewater”, International Journal of Hydrogen Energy,
30:785-793
Franchi, E., Tosi C., Scolla G., Penna G. D., Rodriguez F., Pedroni P.M., 2005,
“Metabolically engineered Rhodobacter sphaeroides RV strains for improved
biohydrogen photoproduction combined with disposal of food wastes”, Marine
Biotechnology, 6:552–65
Gebicki, J., Modigell M., Schumacher M., Van der Burg J., Roebroeck E., 2009,
“Development of photobioreactors for anoxygenic production of hydrogen by purple
bacteria”, PRES'09: 12th
International Conference on Process Integration, Modeling
and Optimization for Energy Saving and Pollution Reduction, PTS 1 and 2.
Chemical Engineering Transactions, 18: 363-366.
Gebicki, J., Modigell M., Schumacher M., Van der Burg J., Roebroeck E., 2010,
“Comparison of two reactor concepts for anoxygenic H2 production by Rhodobacter
capsulatus” Journal of Cleaner Production, doi: 10.1016/j.jclepro.2010.05.023.
Gest, H., Kamen M.D., 1949, “Evidence for a nitrogenase system in the
photosynthetic bacterium Rhodosprillum rubrum”, Science, 109:560
Ghirardi, M.L., Dubini A., Yu J., Maness P., 2008, “Photobiological hydrogen-
producing systems”, Chemical Society Reviews, 38:52-61
Gregoire-Padro, C.E., 2005, “Hydrogen basics”, First Annual International Hydrogen
Energy Implementation Conference, The New Mexico Hydrogen Business Council,
Santa Fe, NM
142
Guo, W.Q., Ren N.Q., Wang X.J., Xiang W.S., Meng Z.H., Ding J., 2008,
“Biohydrogen production from ethanol-type fermentation of molasses in an
expanded granular sludge bed (EGSB) reactor”, International Journal of Hydrogen
Energy, 33:4981–4988
Hankamer, B., Lehr F., Rupprecht J., Mussgnug J.H., Posten C., Kruse O.,
“Photosynthetic biomass and H2 production by green algae: from bioengineering to
bioreactor scale-up”, Plant Physiology, 2007, 131:10-21
Harwood, C. S., 2008, “Nitrogenase-catalyzed hydrogen production by purple non-
sulfur photosynthetic bacteria”, In Bioenergy, edited by Wall J, Harwood CS,
Demain A. ASM Press
Hawkins, S.. Joffe D., 2005, “Technological characterization of hydrogen production
technologies”, UKSHEC Social Science Working Paper No 25. Policy Studies
Institute, London. http://www.psi.org.uk/ukshec/publications.htm (accessed 20
August 2009).
Hillmer, P., Gest H., 1976, “H2 metabolism in the photosynthetic bacterium
Rhodopseudomonas capsulata: H2 production by growing cultures”, American
Society for Microbiology, 129:724-731
Hillmer, P., Gest H., 1977, “H2 metabolism in the photosynthetic bacterium
Rhodopseudomonas capsulata: production and utilization of H2 by resting cells”,
Journal of Bacteriology, 129:732-739
Hoekama, S., Bijmans M., Janssen M., Tramper J., Wijffels R.H., 2002, “A
pneumatically agitated flat-panel photobioreactor with gas re-circulation: anaerobic
photoheterotrophic cultivation of a purple non-sulfur bacterium”, International
Journal of Hydrogen Energy, 27:1331–1338
Hoekema, S., Douma R.D, Janssen M, Tramper J, Wijffels RH., 2006, “Controlling
light-use by Rhodobacter capsulatus continuous cultures in a flat-panel
photobioreactor”, Biotechnology and Bioengineering, 95:613-626
Hoffert, M.I., Caldeira K., Jain A.K., Haites E.F., Harvey L.D.D., Potter S.D.,
Schlesinger M.E., Schneider S.H., Watts R.G., Wigley T.M.L., Wuebbles D.J., 1998,
“Energy implications of future stabilization of atmospheric CO2 content”, Nature,
395:881–884
http://webhelp.esri.com/www.arcgisdesktop/9.3/index.cfm?TopicName=Calculating
solar radiation (accessed 1 September 2010)
143
http://www.eppyleylab.com/Radiation/.htm (accessed 1 September 2010)
http://www.unido-ichet.org (accessed 1 September 2010)
http://www.americanchemistry.com/s_acc/sec_policyissues.asp?CID=996&DID=68
72 (accessed 1 September 2010)
Hu, Q., Guterman H., Richmond A. 1996, “A flat inclined modular photobioreactor
for outdoor mass cultivation for photoautotrophs”, Biotechnology and
Bioengineering, 51:51-60
Janssen, P.H., Morgan H. W., 1992, “Heterotrophic sulfur reduction by Thermotoga
sp. strain FjSS3 B1”, FEMS Microbiology Letters, 96:213-218
Janssen, M., Tramper J., Mur L.R., Wijffels R.H., 2002, “Enclosed outdoor
Photobioreactors: Light regime, photosynthetic efficiency, scale-up, and future
prospects”, Biotechnology and Bioengineering, 81:193-210.
Kelly, R.M., 1988, “Growth and gas production by the hyperthermophilic
archaebactrium, Pyrococcusfuriosus”, Biotechnology and Bioengineering, 32:438-
444
Kengen, S.W.M., Stams A.J.M., 1994, “Formation of L-alanine as a reduced end
product in carbohydrate fermentation by the hyperthermophilic archaeon
Pyrococcusfuriosus”, Archieves of Microbiology, 161:168-175
Kim, J.S., Ito K., Takahashi H., 1982, “Production of molecular hydrogen in outdoor
batch culture of Rhodopsedomonas sphaeroides”, Agricultural Biology and
Chemistry, 46:937-941
Kim, J. S., Ito K., Izaki K., Takahashi H., 1987a, “Production of molecular hydrogen
by a semi-continuous outdoor culture of Rhodopseudomonas sphaeroides”,
Agricultural Biology and Chemistry, 51:1173-1174
Kitajima, Y., El-Shishtawy R.M.A., Ueno Y., Otsuka S., Miyake J, Morimoto M.,
1999, “Analysis of compensation point of light using plane-type photosynthetic
bioreactor”, BioHydrogen VII,359-367
144
Klemme, J.H., 1993, “Photoproduction of hydrogen by purple bacteria: a critical
evaluation of the rate limiting enzymatic steps”, Zeitschrift für Naturforsch, 48: 482-
487
Koku, H., Eroglu, I., Gunduz, U., Yucel, M., Turker, L., 2003, “Kinetics of biological
hydrogen production by the photosynthetic bacterium Rhodobacter sphaeroides
O.U.001”, International Journal of Hydrogen Energy, 28:381-388
Kuriaki, H., Nishishiro T., Kimura M., Sano K., Minami M., Toriyama A. 1998,
“Continuous culture techniques for hydrogen production by Rhodobacter
sphaeroides strain RV”, Advanced Technology Laboratory. KUBOTA Corporation
Lee, H., Vermaas W.F.J., Rittmann B., 2010, “Biological hydrogen production:
prospects and challenges”, Trends in Biotechnology, 28:262-271
Levin, D.B., Pitt L., Love M., 2004, “Biohydrogen production: Prospects and
limitations to practical application”, International Journal of Hydrogen Energy,
29:173-185
Li, J.Z., Zheng G.C., He J.G, Chang S., Qin Z., 2009, “Hydrogen-producing
capability of anaerobic activated sludge in three types of fermentations in a
continuous stirred-tank reactor”, Biotechnology Advances, 27:573–577
Li, R.Y., Fang H.H.P., 2009, “Heterotrophic photo fermentative hydrogen
production”, Critical Reviews in Environmental Science and Technology, 39:1081-
1108
Marban, G., Solis, T.V., 2007, “Towards the hydrogen economy?”, International
Journal of Hydrogen Energy, 32:1625-1637
Mark, J.E., 1999, “Polymer Data Handbook”, Oxford University Press, 198 Madison
Avenue, New York, New York 10016
Marchi, C.S., 2008, “Technical reference on hydrogen compatibility of materials”,
Sandia National Laboratories, Livermore CA
Mathews, J., Wang G., 2009, “Metabolic pathway engineering for enhanced
biohydrogen production”, International Journal of Hydrogen Energy, 34:7404-7416
145
Masepohl, B., Drepper T., Paschen A., Groß S., Pawlowski A., Raabe K., Riedel K.
U., Klipp W., 2002, “Regulation of nitrogen fixation in the phototrophic purple
bacterium Rhodobacter capsulatus”, Journal of Molecular Microbiology and
Biotechnology, 4:243-248
Massey, L.K., 2003, “Permeability properties ofplastics and elastomers”, PDL
Handbook Series, Plastic Design Library/William Andrew Publishing, Norwich, NY
McKinlay, J.B., Harwood C.S., 2010, “Photobiological production of hydrogen gas
as a biofuel”, Current Opinion in Biotechnology, 21:244-251
Meiser, A., SchmidStaiger U., Trösch W., 2004, “Optimization of eicosapentaenoic
acid production by Phaeodactylum tricornutum in the flat panel airlift (FPA)
reactor”, Journal of Applied Pychology, 16:215-225
Melis, A., 2009, “Solar energy conversion efficiencies in photosynthesis: Minimizing
the chlorophyll antennae to maximize efficiency”, Plant Science, 177:272–280
Melis, A., Melnicki M.R., 2006, “Integrated biological hydrogen production”,
International Journal of Hydrogen Energy, 31:1563–1573
Meyer, J., Kelley B.C., Vignais P.M., 1978, “Nitrogen fixation and hydrogen
metabolism in photosynthetic bacteria”, Biochimie, 60:245-260
Miyake, J., Tomizuka N., Kamibayashi A., 1982, “Prolonged photo-hydrogen
production by Rhodospirillum rubrum”, Journal of Fermentation Technology,
60:199-203
Miyake, J., Wakayama T., Schnackenberg J., Takasaki A., Asada Y., 1999a,
“Simulation of the daily sunlight illumination pattern for bacterial photo-hydrogen
production”, Journal of Bioscience and Bioengineering, 88:659-663
Miyake, J., Miyake M., Asada Y., 1999b, “Biotechnological hydrogen production:
research for efficient light energy conversion”, Journal of Biotechnology, 70:89-101
Miyamoto, K., Hallenbeck P.C., Benemann J.R., 1979, “Solar energy conversion by
nitrogen-limited cultures of Anabaena cylindrica”, Journal of Fermentation
Technology, 57:287-293

146
Modigell, M., Holle N., 1998, “Reactor development for a biosolar hydrogen
production process”, Renewable Energy, 14:421-426
Mueller-Langer, F., Tzimas E., Kaltschmitt M., and Peteves S., 2007, “Techno-
economic assessment of hydrogen production processes for the hydrogen economy
for the short and medium term”, International Journal of Hydrogen Energy, 32:3797-
3910
Muradov, N.Z., Veziroglu T.N., 2008, “Green” path from fossil-based to hydrogen
economy: An overview of carbon-neutral technologies”, International Journal of
Hydrogen Energy, 33:6804-6839
Nakada, E., Nishikata S., Asada Y., Miyake J., 1998, “Light penetration and
wavelength effect on photosynthetic bacteria culture for hydrogen production”,
BioHydrogen, Plenum Press, New York
Nandi, R., Sengupta S., 1998, “Microbial production of hydrogen: an overview”,
Critical Reviews in Microbiology, 24:61-84
Nath, K. Das D., 2004, “Biohydrogen production as a potential energy resource-
present state of art”, Journal of Scientific & Industrial Research, 63:729-738
Nath, K., Das D., 2009, “Effect of light intensity and initial pH during hydrogen
production by an integrated dark and photofermentation process”, International
Journal of Hydrogen Energy, 34:7497-7501
Noike, T., Takabatake H., Mizuno O., Ohba M., 2002, “Inhibition of hydrogen
fermentation of organic wastes by lactic acid bacteria” International Journal of
Hydrogen Energy, 27:1367-1371
Ozgur, E., Afsar N., Vrije T., Yucel M., Gunduz U., Claassen P.A.M., Eroğlu I.,
2010, “Potential use of thermophile dark fermentation effluents in photofermentative
hydrogen production by Rhodobacter capsulatus”, Journal of Cleaner Production,
doi: 10.1016/j.jclepro.2010.02.020.
Orme, C.J., Stone M.L., Benson M.T., Peterson E.S., 2003, “Testing of polymer
membranes for the selective permeability of hydrogen”, Separation Science and
Technology, 38:3225-3238
Ozgur, E., Mars A.E., Peksel B., Louwerse A., Yucel M., Gunduz U., Claassen
P.A.M., Eroglu I., 2010, “Biohydrogen production from beet molasses by sequential
147
dark and photofermentation”, International Journal of Hydrogen Energy, doi:
10.1016/j.ijhydene.2009.10.094
Ozturk, Y., Yucel M., Daldal F., Mandacı S., Gunduz U., Turker L., Eroglu I., 2006,
“Hydrogen production by using Rhodobacter capsulatus mutants with genetically
modified electron transfer chains”, International Journal of Hydrogen Energy,
31:1545-1552
Ozturk, Y., 2005 “Characterization of the genetically modified cytochrome systems
and their application to biohydrogen production in Rhodobacter capsulatus”, Ph. D.
Thesis in Biotechnology, Middle East Technical University, Ankara
Patricio, P.S.O., Sales de J.A., Silva G.G., Windmöller D., Machado J.C., 2006,
“Effect of blend composition on microstructure, morphology, and gas permeability in
PU/PMMA blends”, Journal of Membrane Sciences, 271:177-185
Pauly, S., 1999, “Permeability and diffusion data” in: Brandrup J., Immergut E.H.,
Grulke E.A., Polymer Handbook, fourth edition. New York: John Wiley and Sons.
Pilavachi, P.A., Chatzipanagi A.I., Spyropoulou A.I., 2009, “Evaluation of hydrogen
production methods using the analytic hierarchy process”, International Journal of
Hydrogen Energy, 34:5294-5303
Pulz, O., Gerbsch N., Buchholz R., 1995, “Light energy supply in plate type and
light diffusing optical-fiber bioreactors”, Journal of Applied Pychology, 7:145-149
Pulz, O., 2001, “Photobioreactors: production systems for phototrophic
microorganisms”, Applied Microbial Biotechnology, 57:287-293
Ramos de Ortega, Roux J.C., 1986, “Production of Chlorella biomass in different
types of flat bioreactors in temperature zones”, Biomass, 10:141-156
Redwood, M.D. Macaskie L.E., 2006, “A two-stage, two-organism process for
biohydrogen from glucose”, International Journal of Hydrogen Energy, 31:1514 –
1521
Redwood, M.D., Beedle M.P., Macaskie L.E., 2009, “Integrating dark and light bio-
hydrogen production strategies: towards the hydrogen economy”, Reviews in
Environmental Science and Biotechnology, 8:149-185

148
Ren, N., Li J., Li B., Wang Y., Liu S., 2006, “Biohydrogen production from
molasses by anaerobic fermentation with a pilot-scale bioreactor system”
International Journal of Hydrogen Energy, 31:2147–2157
Ren, N.Q., Xing D.F., Rittmann B.E., Zhao L.H., Xie T.H., Zhao X., 2007,
“Microbial community structure of ethanol type fermentation in bio-hydrogen
production”, Environmental Microbiology, 9:1112–1125
Richmond, A. and Cheng-Wu Z., 2001, “Optimization of a flat plate glass reactor for
mass production of Nannochloropsis sp. outdoors”, Journal of Biotechnology,
85:259-269
Ruscic, B., Pinzon R.E., Moton M.L., Laszevski G., Bittner S.J., Nijsure S.G., Amin
A., Minkoff M., Wagner A.F., 2004, “Introduction to active thermo chemical tables:
Seveal key enthalpies of formation revisited”, The Journal of Physical Chemistry,
108:9979-9997
Samson, R. Leduy A., 1985, “Multistage continuous cultivation of blue-green alga
Spirulina maxima in the flat tank photobioreactors with recycle”, The Canadian
Journal of Chemical Engineering, 63
Schafer, T., Schonheit P., 1991, “Pyruvate metabolism of the hyperthermophilic
archaebacterium Pyrococcus furiosus. Acetate formation from acetyl-CoA and ATP
synthesis are catalyzed by an acetyl-CoA synthetase (ADP-forming)”, Archieves in
Microbiology, 155:366-377
Sasikala, K., Ramana C.V., Rao P.R., 1991, “Environmental regulation for optimal
biomass yield and photoproduction of hydrogen by Rhodobacter sphaeroides
O.U.001”, International Journal of Hydrogen Energy, 16:597-601
Sasikala, K., Ramana C.V., Rao P.R., Kovacs K.L., 1993, “Anoxygenic phototrophic
bacteria: physiology and advances in hydrogen technology”, Advances in Applied
Microbiology, 38:211-295
Schroder, C., Selig M., Schonheit P., 1994, “Glucose fermentation to acetate, CO2
and H2 in the anaerobic hyperthermophilic eubacterium Thermotoga maritima:
involvement of the Embden-Meyerhof Pathway”, Archives in Microbiology,
161:460-470
Segers, L., Verstraete W., 1983, “Conversion of organic acids to H2 by
Rhodospirillaceae grown with glutamate or dinitrogen as nitrogen source”
Biotechnology and Bioengineering, 25:2843-2853

149
Senge, M.O., Smith K.M., 1995, “Biosynthesis and structures of the
bacteriochlorophylls”, in: Blankenship R.E., Madigan M.T., Bauer C.E., Anoxygenic
Photosynthetic Bacteria, Kluwer Academic Publishers, Netherlands
Shi, X.Y., Yu, H.Q., 2006, “Conversion of individual and mixed volatile fatty acids
to hydrogen by Rhodopseudomonas capsulata”, International Biodeterioration and
Biodegradation, 58:82-88
Shrikanth, S., Mohan S.V., Devi M.P., Peri D., Sarma P.N., 2009, “Acetate and
butyrate as substrates for hydrogen production through photo-fermentation: Process
optimization and combined performance evaluation”, International Journal of
Hydrogen Energy, 34:7513-7522
Show, K.Y., Zhang Z.P., Lee D.J., 2008, “Design of bioreactors for biohydrogen
production”, Journal of Scientific & Industrial Research, 67:941-949
Sierra, E., Acien F.G., Fernandez J.M., Garcia J.L., Gonzalez C., Molina E., 2008,
“Characterization of a flat plate photobioreactor for the production of microalgae”,
Chemical Engineering Journal, 138:136-147
Souers, P.C., Moen I., Lindahl R.O., Tsugawa R.T., 1978, “Permeation eccentricities
of He, Ne, D-T from soda-lime glass microbubbles”i Journal of American Ceramic
Society, 62:42-46
Steward, S.A., 1983, “Review of hydrogen isotope permeability through materials”,
Lawrence Livermore National Laboratory, University of California Livermore,
California 94550
Tabanaoglu, A., 2002, “Hydrogen production by Rhodobacter sphaeroides in a solar
bioreactor”, M. Sc. Thesis in Chemical Engineering, Middle East Technical
University, Ankara, Turkey
Tredici, M.R., Carlozzi P., Zitelli G.C., 1991, “A vertical alveolar panel (VAMP) for
outdoor mass cultivation of microalgae and cyanobacteria”, Bioresource Technology,
38:153-159
Tredici, M.R., Materassi R., 1992, “From open ponds to vertical alveolar panels: the
Italian experience in the development of reactor for the mass cultivation of the
photoautotrophic microorganisms”, Journal of Applied Pychology, 4:21-231

150
Tredici, M.R., Zitelli C. G., 1998, “Efficiency of sunlight utilization: tubular versus
flat photobioreactors”, Biotechnology and Bioengineering, 57:187-197
Tredici, M.R., 2004, “Mass production of microalgae: photobioreactors”, Handbook
of Microalgal Culture: Biotechnology and Applied Phycology, Blackwell Publishing
Ltd
Tsygankov, A.A., Fedorov A.S., Laurinavichene T.V., Gogotov I.N., Rao K.K., Hall
D.O., 1998, “Actual and potential rates of hydrogen photoproduction by continuous
culture of the purple non-sulfur bacterium Rhodobacter capsulatus”, Applied
Microbiology and Biotechnology, 49:102-107
Tsygankov, A.A., 2006, “Biological generation of hydrogen”, Russian Journal of
General Chemistry, 77:685-693
Uyar, B., Eroglu I., Yucel M., Gunduz U., Turker L., 2007, “Effect of light intensity,
wavelength and illumination protocol on hydrogen production in photobioreactors”
International Journal of Hydrogen Energy, 32:4670-4677
Uyar, B., 2008, “Hydrogen production by microorganisms on solar bioreactors”, Ph.
D. Thesis in Biotechnology, Middle East Technical University, Ankara, Turkey
Van Niel, C.B., 1944, “The culture, general physiology, morphology, and
classification of the non-sulfur purple and brown bacteria”, Microbiology and
Molecular Biology Reviews, 8:1-118
Vignais, P.M., Colbeau A., Willison J.C., and Jouanneau Y., 1985, “Hydrogenase,
nitrogenase, and hydrogen metabolism in the photosynthetic bacteria”, Advances in
Microbial Physiology, 26:155-234
Vignais, P.M., Billoud B., 2007, “Occurrence, classification, and biological function
of hydrogenases: an overview”, Chemical Reviews, 107:4206-4272
Wachenheim, D.E., Patterson J.A., Ladish M.R., 2003, “Analysis of the logistic
function model: derivation and applications specific to batch cultured
microorganisms” Bioresource Technology, 86:157-164
Wakayama, T., Miyake J., 2002, “Light shade bands for the improvement of solar
hydrogen production efficiency by Rhodobacter sphaeroides RV”, International
Journal of Hydrogen Energy, 27:1495-1500
151
Waters, C.M., Bassler B.L., 2005, “Quorum sensing cell-to-cell communication in
bacteria”, Annual Review of Cell and Developmental Biology, 21:319-46
Weissman, J.C., Goebel R.P., Benemann J.R., 1987, “Photobioreactor design:
mixing, carbon utilization, and oxygen accumulation”, Biotechnology and
Bioengineering, 31:336-344
Weaver, P.F., Wall J.D., Gest H., 1975, “Characterization of Rhodobacter capsulata”
Archives of Microbiology, 105:207-216
Willison, J.C., Madern D., Vignais P.M., 1984, “Increased photoproduction of
hydrogen by non-autotrophic mutants of Rhodopseudomonas capsulata”,
Biochemical Journal, 219:593-600
Yetis, M., Gunduz U., Eroglu I., Yucel M., Turker L., 2000, “Photoproduction of
hydrogen from sugar refinery wastewater by Rhodobacter sphaeroides O.U.001”
International Journal of Hydrogen Energy, 25:1035-1041
Zhang, C., Zhu X., Liao Q., Wang Y., Li J., Ding Y., Wang H., 2010, “Performance
of a groove-type photobioreactor for hydrogen production by immobilized
photosynthetic bacteria”, International Journal of Hydrogen Energy, 35:5284-5292
Zhang, K., Kurano N., Miyachi S., 2002, “Optimized aeration by carbon dioxide gas
for microalgal production and mass transfer characterization in a vertical flat-plate
photobioreactor”, Bioprocess and Biosystem Engineering, 25:97-101
Zhang, K., Miyachi S., Kurano N., 2001, “Evaluation of a vertical flat-plate
photobioreactor for outdoor biomass production and carbon dioxide bio-fixation:
effects of reactor dimensions, irradiation and cell concentration on the biomass
productivity and irradiation utilization efficiency”, Applied Microbiology and
Biotechnology, 55:428-433
Zhang, Z., Show K., Tay J., Liang D. T., Lee D., 2008, “Enhanced continuous
biohydrogen production by immobilized anaerobic microflora”, Energy & Fuels
2008, 22:87–92
Zijffers, J.F., Janssen M., Tramper J., Wijffels R.H., 2008, “Design process of an
area-efficient photobioreactor” Marine Biotechnology, 10:404-415

152
Zitelli, G.C., Pastorelli R., Tredici M.R., 2000, “A modular flat panel
photobioreactor (MFPP) for indoor mass cultivation of Nannochloropsis sp. under
artificial illumination”, Journal of Applied Phycology, 12:521-526
Züttel, A., Remhof A., Borgschulte A., Friedrichs O., 2010, “Hydrogen: the future
energy carrier”, Philosophical Transactions of the Royal A Society, 368:3329-3342
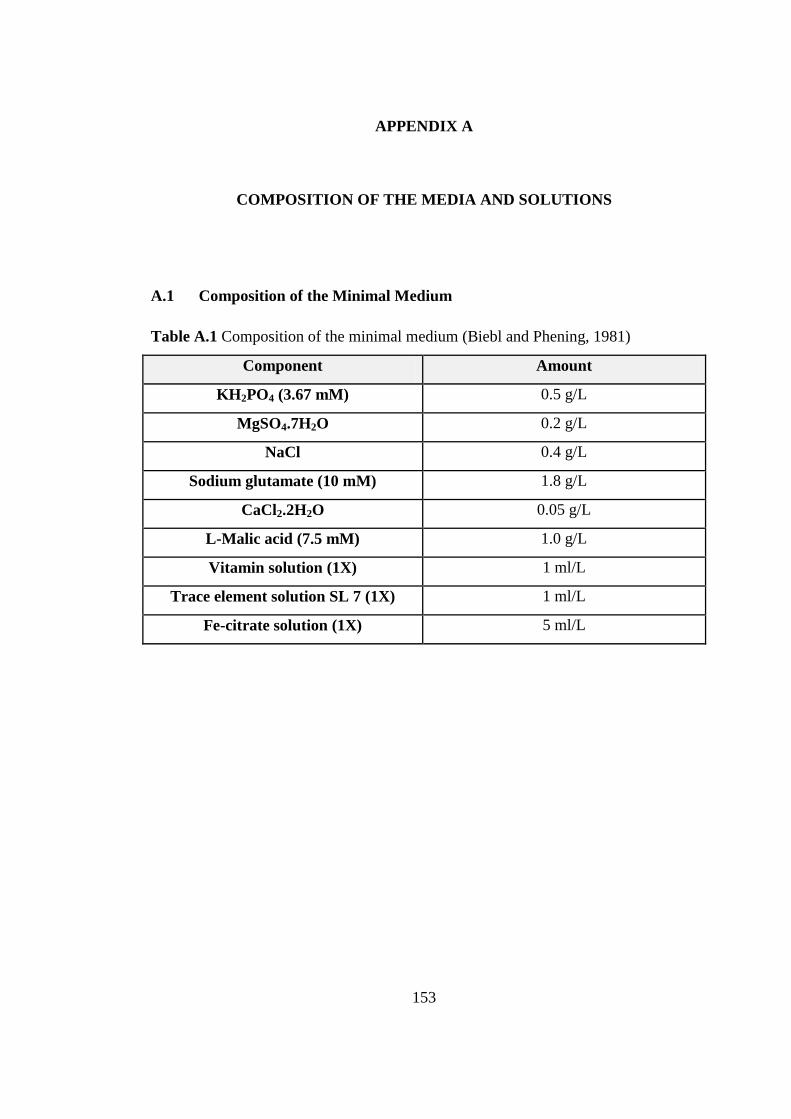
153
APPENDIX A
COMPOSITION OF THE MEDIA AND SOLUTIONS
A.1 Composition of the Minimal Medium
Table A.1 Composition of the minimal medium (Biebl and Phening, 1981)
Component Amount
KH2PO4 (3.67 mM) 0.5 g/L
MgSO4.7H2O 0.2 g/L
NaCl 0.4 g/L
Sodium glutamate (10 mM) 1.8 g/L
CaCl2.2H2O 0.05 g/L
L-Malic acid (7.5 mM) 1.0 g/L
Vitamin solution (1X) 1 ml/L
Trace element solution SL 7 (1X) 1 ml/L
Fe-citrate solution (1X) 5 ml/L
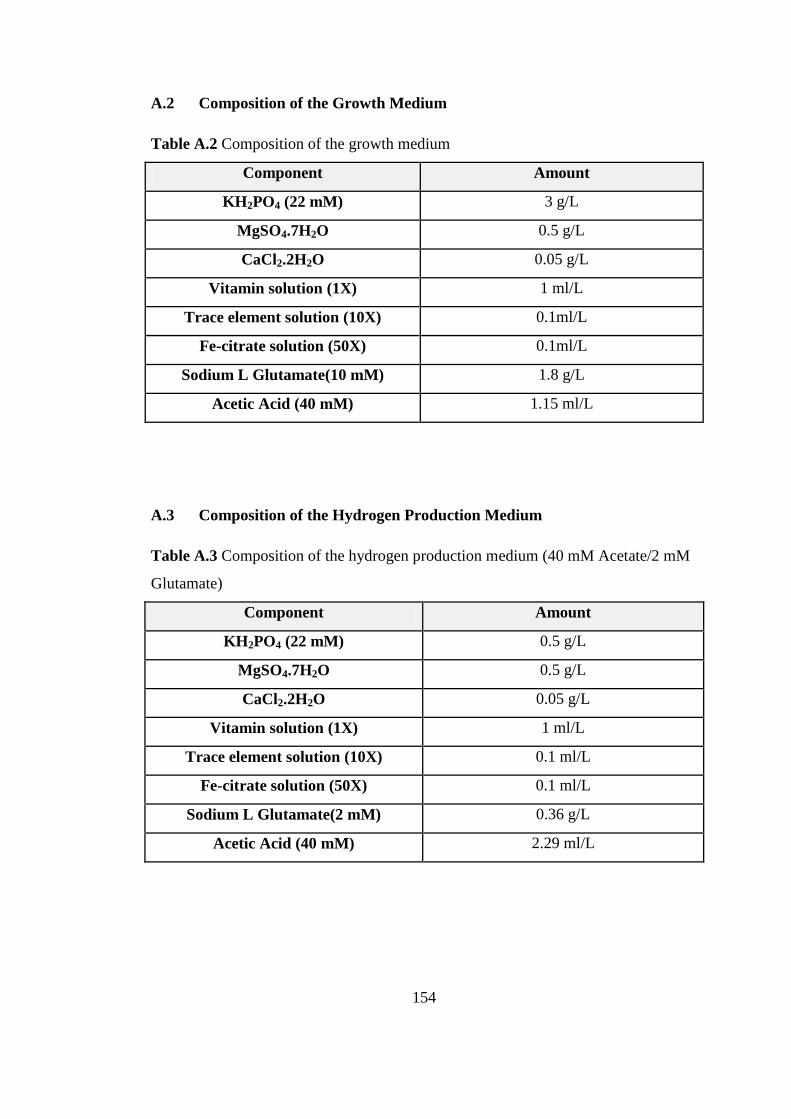
154
A.2 Composition of the Growth Medium
Table A.2 Composition of the growth medium
Component Amount
KH2PO4 (22 mM) 3 g/L
MgSO4.7H2O 0.5 g/L
CaCl2.2H2O 0.05 g/L
Vitamin solution (1X) 1 ml/L
Trace element solution (10X) 0.1ml/L
Fe-citrate solution (50X) 0.1ml/L
Sodium L Glutamate(10 mM) 1.8 g/L
Acetic Acid (40 mM) 1.15 ml/L
A.3 Composition of the Hydrogen Production Medium
Table A.3 Composition of the hydrogen production medium (40 mM Acetate/2 mM
Glutamate)
Component Amount
KH2PO4 (22 mM) 0.5 g/L
MgSO4.7H2O 0.5 g/L
CaCl2.2H2O 0.05 g/L
Vitamin solution (1X) 1 ml/L
Trace element solution (10X) 0.1 ml/L
Fe-citrate solution (50X) 0.1 ml/L
Sodium L Glutamate(2 mM) 0.36 g/L
Acetic Acid (40 mM) 2.29 ml/L

155
A.4 Composition of the Trace Elements Solution (1X)
Table A.4 The composition of trace element solution
Component Amount
HCl (25% v/v) 1 ml/L
ZnCl2 70 mg/L
MnCl2.4H2O 100 mg/L
H3BO3 60 mg/L
CoCl2.6H2O 200 mg/L
CuCl2.2H2O 20 mg/L
NiCl2.6H2O 20 mg/L
NaMoO4.2H2O 40 mg/L
H2O Complete to 1 Liter
A.5 Composition of the Vitamin Solution (1X)
Table A.5 The composition of vitamin solution
Component Amount
Thiamine 0.05 g
Niacin (Nicotinate) 0.05 g
Biotin 0.015 g
H2O Complete to 0.1 Liter
A.6 Composition of the Fe-Citrate Solution (50X)
5 g Fe-citrate was dissolved in 100 ml distilled water and sterilized by autoclaving.

156
APPENDIX B
TECHNICAL PROPERTIES of CONSTRUCTION MATERIALS
B.1 Properties of Plexiglas
The Plexiglas has no color change as exposed to UV light, hot water and also
has a resistance to hot water and chemicals.
Table B.1 Physical properties of Plexiglas
Characteristic Value
Density (g/cm3) 1.185±0.01
Rupture Strength (N/mm2) 70-80
Stiffness (N/mm2) 70-80
Impact Resistance (kJ/m2) 18-20
Modulus of Elasticity (N/mm2) 3000-3600
Thermal Conductivity (W/m.0C) 0.18-0.19
Surface Hardness (Rockwell M Scale) 90-100
Softening Temperature (0C) 126
B.2 Properties of PVC Rigid Sheet
PVC rigid sheet comprises of PVC resin, stabilizers, lubricants, plasticizers,
fillers, impact modifiers, pigments and other additives. Hydrogen permeability of
unplasticised PVC is 1.3E+3 cm3.mm/m
2.day.atm (Pauly et al., 1999).
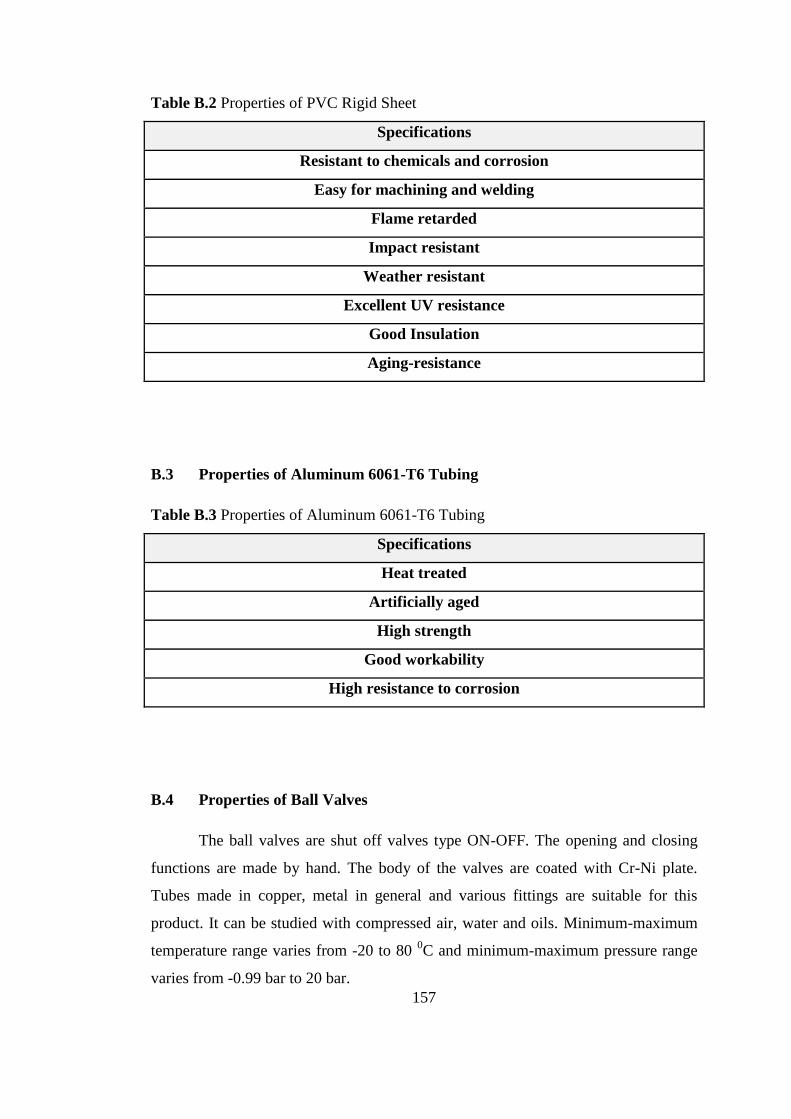
157
Table B.2 Properties of PVC Rigid Sheet
Specifications
Resistant to chemicals and corrosion
Easy for machining and welding
Flame retarded
Impact resistant
Weather resistant
Excellent UV resistance
Good Insulation
Aging-resistance
B.3 Properties of Aluminum 6061-T6 Tubing
Table B.3 Properties of Aluminum 6061-T6 Tubing
Specifications
Heat treated
Artificially aged
High strength
Good workability
High resistance to corrosion
B.4 Properties of Ball Valves
The ball valves are shut off valves type ON-OFF. The opening and closing
functions are made by hand. The body of the valves are coated with Cr-Ni plate.
Tubes made in copper, metal in general and various fittings are suitable for this
product. It can be studied with compressed air, water and oils. Minimum-maximum
temperature range varies from -20 to 80 0C and minimum-maximum pressure range
varies from -0.99 bar to 20 bar.
158
B.5 Properties of Adaptors
The adaptors work in push-in principle. The body of the fittings are coated
with Cr-Ni plate. Polyurethane, polyethylene tubing etc. are suitable for these
fittings. It can be studied with compressed air, and vacuum. Minimum-maximum
temperature range varies from -20 to 80 0C and minimum-maximum pressure range
varies from -0.99 bar to 15 bar.
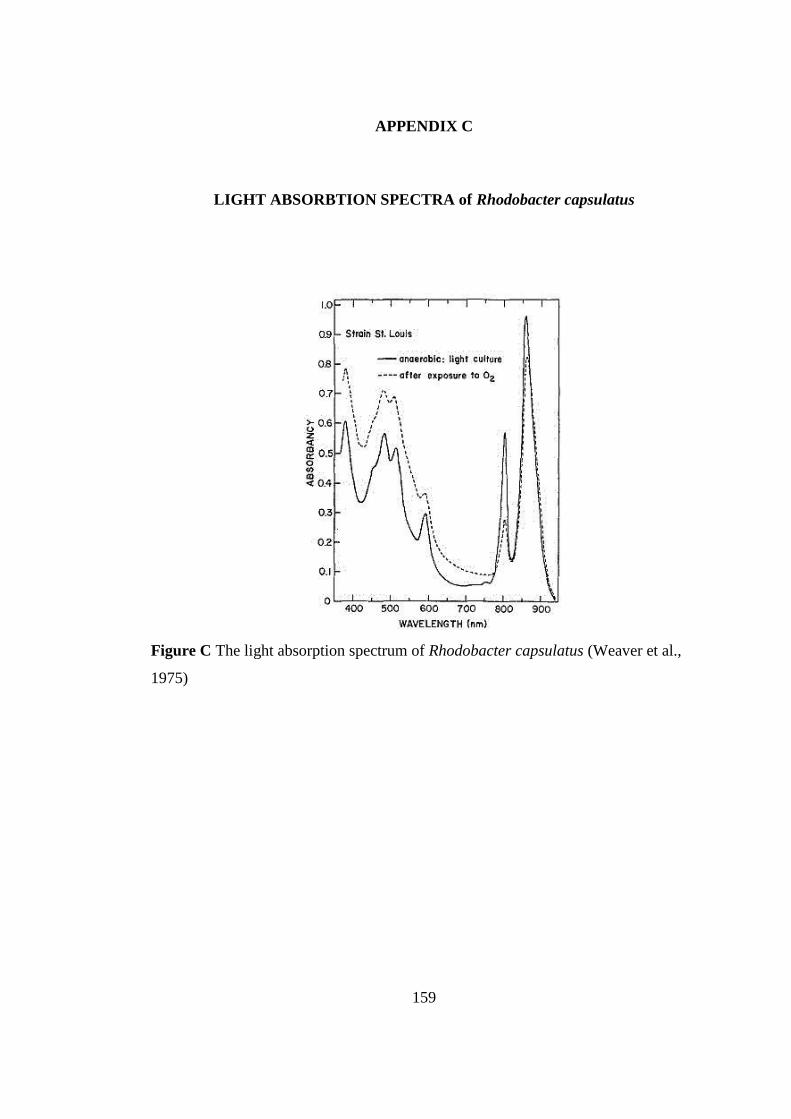
159
APPENDIX C
LIGHT ABSORBTION SPECTRA of Rhodobacter capsulatus
Figure C The light absorption spectrum of Rhodobacter capsulatus (Weaver et al.,
1975)

160
APPENDIX D
CALIBRATION CURVE OF DRY CELL WEIGHT VERSUS OPTICAL
DENSITY AT 660nm
D.1 Calibration Curve of Dry Cell Weight versus Optical Density of
Rhodobacter capsulatus wild type
Figure D.1 Calibration curve of dry weight versus OD660 and the regression trend
line for Rhodobacter capsulatus (DSM 1710) (Uyar, 2008). An optical density of 1.0
at 660nm corresponds to a cell density of 0.54 gram dry cell weight/liter of culture of
Rhodobacter capsulatus (DSM 1710).

161
D.2 Calibration Curve of Dry Cell Weight versus Optical Density of
Rhodobacter capsulatus mutant
Figure D.2 Calibration curve of dry weight versus OD660 and the regression trend
line for Rhodobacter capsulatus mutant (Ozturk, 2005). An optical density of 1.0 at
660nm corresponds to a cell density of 0.47 gram dry cell weight/liter of culture of
Rhodobacter capsulatus hup- mutant.

162
APPENDIX E
SAMPLE CHROMATOGRAM FOR GAS ANALYSIS
E.1 A Sample Chromatogram for Gas Analysis
Figure E.1 Sample chromatogram for gas analysis (Androga, 2009)
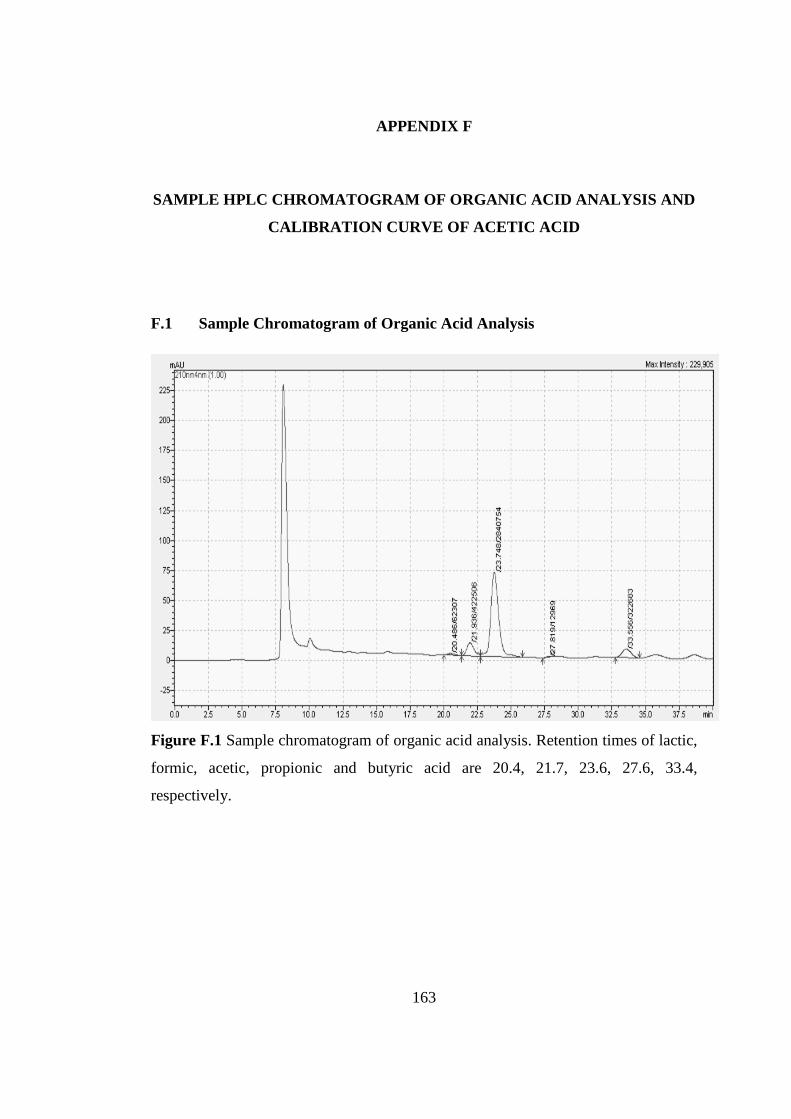
163
APPENDIX F
SAMPLE HPLC CHROMATOGRAM OF ORGANIC ACID ANALYSIS AND
CALIBRATION CURVE OF ACETIC ACID
F.1 Sample Chromatogram of Organic Acid Analysis
Figure F.1 Sample chromatogram of organic acid analysis. Retention times of lactic,
formic, acetic, propionic and butyric acid are 20.4, 21.7, 23.6, 27.6, 33.4,
respectively.
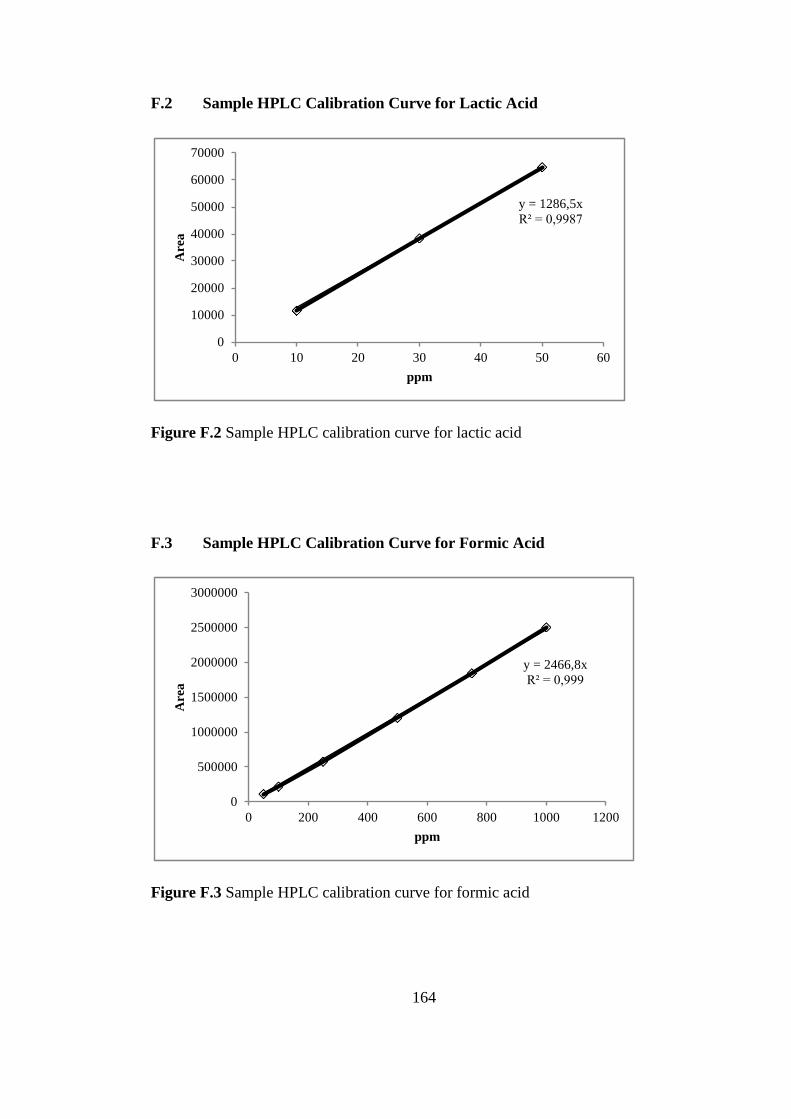
164
F.2 Sample HPLC Calibration Curve for Lactic Acid
Figure F.2 Sample HPLC calibration curve for lactic acid
F.3 Sample HPLC Calibration Curve for Formic Acid
Figure F.3 Sample HPLC calibration curve for formic acid
y = 1286,5x
R² = 0,9987
0
10000
20000
30000
40000
50000
60000
70000
0 10 20 30 40 50 60
Are
a
ppm
y = 2466,8x
R² = 0,999
0
500000
1000000
1500000
2000000
2500000
3000000
0 200 400 600 800 1000 1200
Are
a
ppm

165
F.4 Sample HPLC Calibration Curve for Acetic Acid
Figure F.4 Standard HPLC calibration curve of acetic acid
F.5 Sample HPLC Calibration Curve for Propionic Acid
Figure F.5 Standard HPLC calibration curve of propionic acid
y = 1756,2x
R² = 0,9998
0
200000
400000
600000
800000
1000000
1200000
1400000
1600000
1800000
2000000
0 200 400 600 800 1000 1200
Are
a
ppm
y = 801,88x
R² = 0,999
0
10000
20000
30000
40000
50000
60000
70000
80000
90000
0 20 40 60 80 100 120
Are
a
ppm
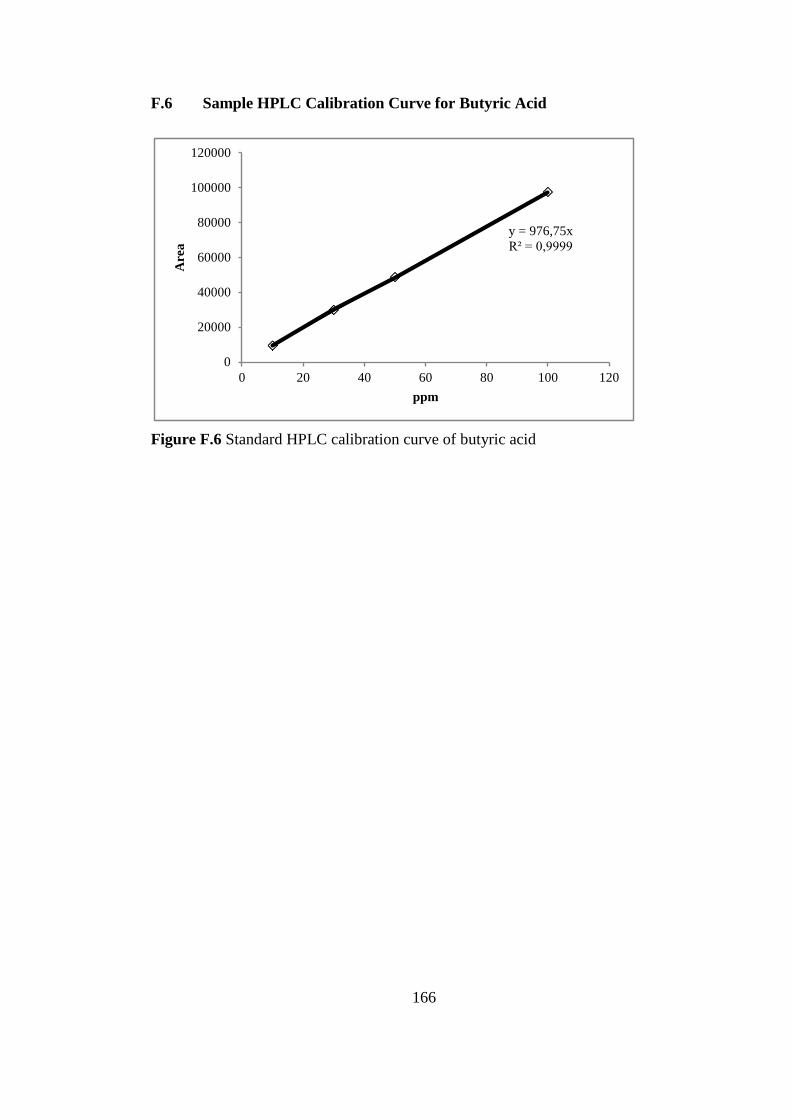
166
F.6 Sample HPLC Calibration Curve for Butyric Acid
Figure F.6 Standard HPLC calibration curve of butyric acid
y = 976,75x
R² = 0,9999
0
20000
40000
60000
80000
100000
120000
0 20 40 60 80 100 120
Are
a
ppm
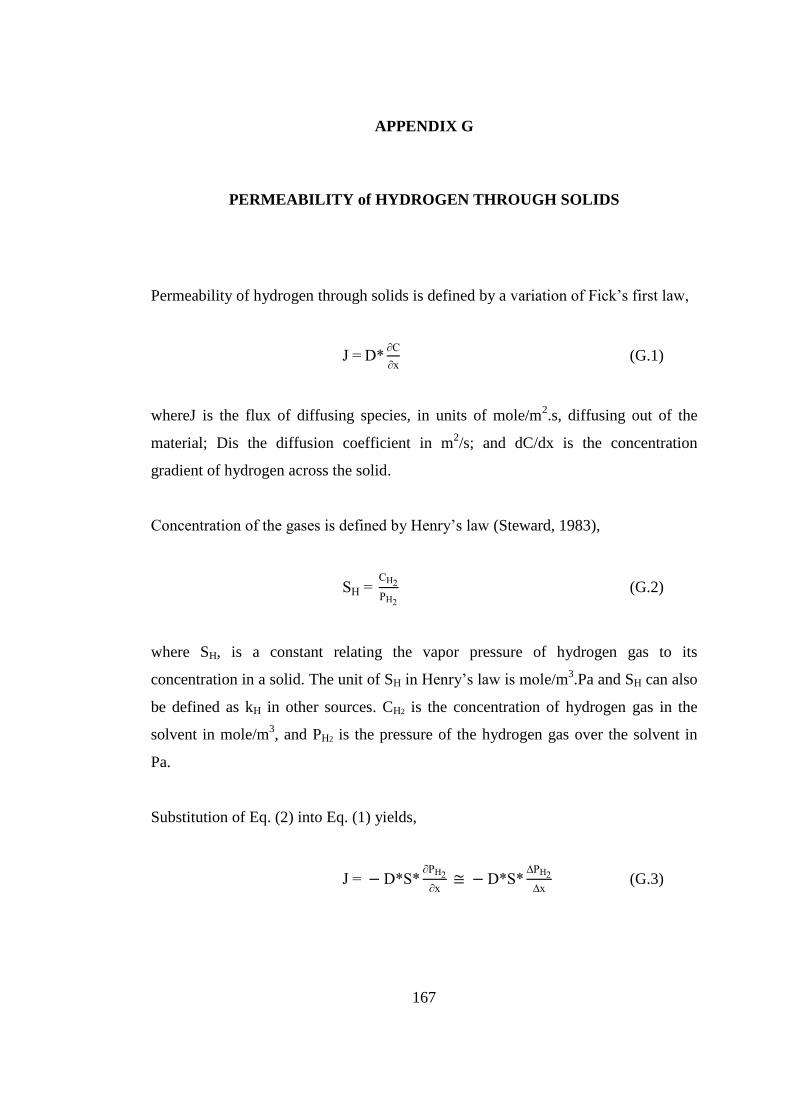
167
APPENDIX G
PERMEABILITY of HYDROGEN THROUGH SOLIDS
Permeability of hydrogen through solids is defined by a variation of Fick’s first law,
=
x (G.1)
whereJ is the flux of diffusing species, in units of mole/m2.s, diffusing out of the
material; Dis the diffusion coefficient in m2/s; and dC/dx is the concentration
gradient of hydrogen across the solid.
oncentration of the gases is defined by Henry’s law (Steward, 1983),
H = H2
H2
(G.2)
where SH, is a constant relating the vapor pressure of hydrogen gas to its
concentration in a solid. The unit of SH in Henry’s law is mole/m3.Pa and SH can also
be defined as kH in other sources. CH2 is the concentration of hydrogen gas in the
solvent in mole/m3, and PH2 is the pressure of the hydrogen gas over the solvent in
Pa.
Substitution of Eq. (2) into Eq. (1) yields,
= H2
x
H2
x (G.3)
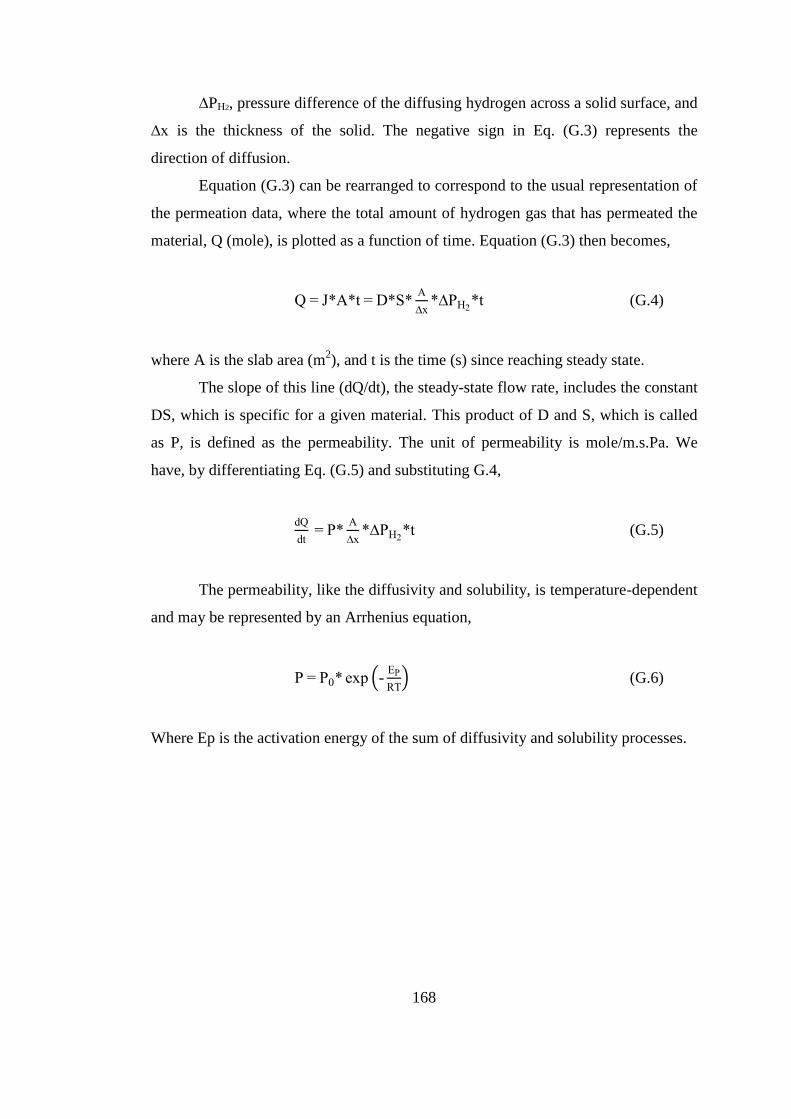
168
PH2, pressure difference of the diffusing hydrogen across a solid surface, and
x is the thickness of the solid. The negative sign in Eq. (G.3) represents the
direction of diffusion.
Equation (G.3) can be rearranged to correspond to the usual representation of
the permeation data, where the total amount of hydrogen gas that has permeated the
material, Q (mole), is plotted as a function of time. Equation (G.3) then becomes,
= t =
x H2
t (G.4)
where A is the slab area (m2), and t is the time (s) since reaching steady state.
The slope of this line (dQ/dt), the steady-state flow rate, includes the constant
DS, which is specific for a given material. This product of D and S, which is called
as P, is defined as the permeability. The unit of permeability is mole/m.s.Pa. We
have, by differentiating Eq. (G.5) and substituting G.4,
d
dt =
x H2
t (G.5)
The permeability, like the diffusivity and solubility, is temperature-dependent
and may be represented by an Arrhenius equation,
= 0 exp (-
R ) (G.6)
Where Ep is the activation energy of the sum of diffusivity and solubility processes.

169
APPENDIX H
SOLUBILITY of HYDROGEN in WATER
Solubility of a hydrogen gas in water can be described by Henry’s law constant; kH is
defined as:
kH = H2
H2
(H.1)
Here, CH2 is the concentration of hydrogen gas in the aqueous phase and PH2 is the
partial pressure of hydrogen in the gas phase.
If kH refers to standard conditions (T0 = 298.15 K) it will be denoted as kH
0.
Temperature dependence of Henry’s law can be described as:
kH = kH0 exp(
- Hsoln
R(1
-
1
0)) (H.2)
where - Hsoln = enthalpy of solution. kH0 = 7.8*10
-4 mole/(L.atm).

170
APPENDIX I
MEASURING HYDROGEN PERMEABILITY THROUGH REACTOR
MATERIAL
Hydrogen permeability through reactor material was measured by water
displacement method. The cylindrical column made of the chosen reactor material
full of water submerged into a vessel full of water. Then the hydrogen gas was given
to the column in a rate that water can easily leave the column. After the pressure of
the hydrogen gas inside the column reached to desired value the gas entry was
stopped. The water level inside the column was recorded at that time. Every 1 h
increase in water level was recorded till the water level stabilized. Then the volume
of hydrogen gas permeated through reactor material was calculated by the water
level increase. By multiplying volume of the hydrogen by density of hydrogen and
dividing the result by molecular weight of hydrogen, mole of hydrogen was
calculated. Permeability coefficient was calculated by the equation G.2. In this
equation which is also given below, A is the effective material area that hydrogen
was filled initially; x is the thickness of reactor material; H2 is the pressure
difference of hydrogen inside the column and in the ambient; t is the duration of the
experiment till water level stabilized.
d
dt =
x H2
t (I.1)
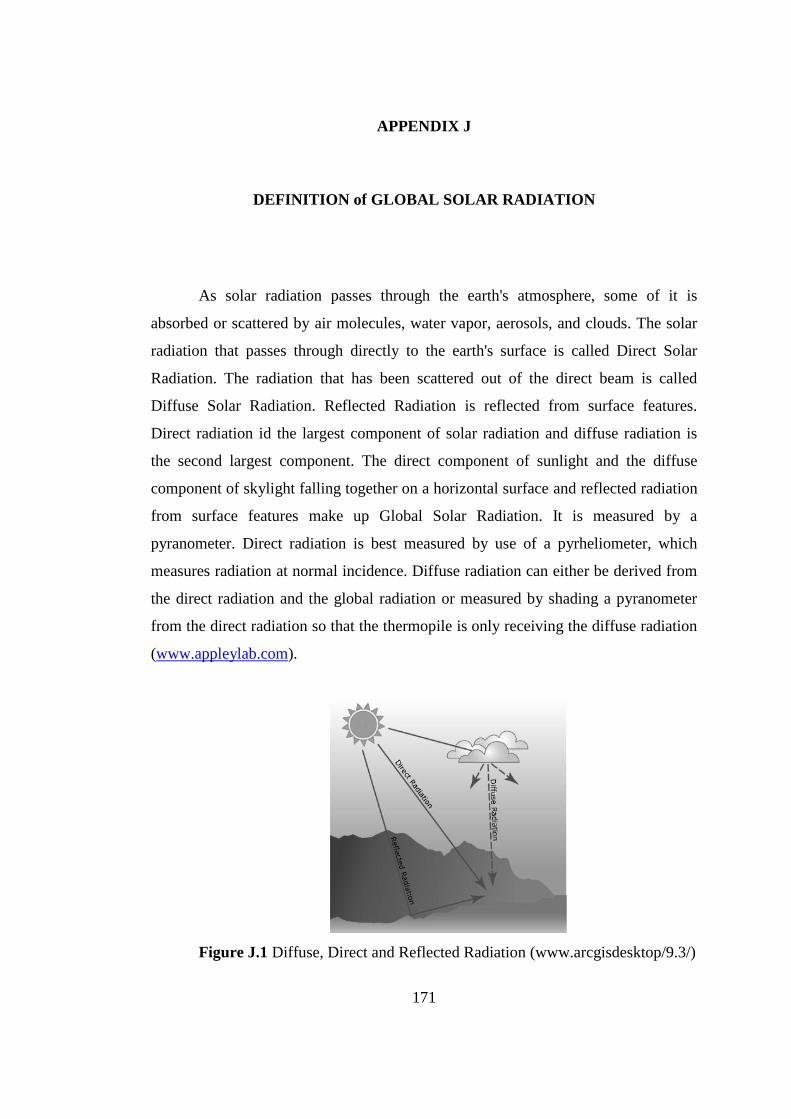
171
APPENDIX J
DEFINITION of GLOBAL SOLAR RADIATION
As solar radiation passes through the earth's atmosphere, some of it is
absorbed or scattered by air molecules, water vapor, aerosols, and clouds. The solar
radiation that passes through directly to the earth's surface is called Direct Solar
Radiation. The radiation that has been scattered out of the direct beam is called
Diffuse Solar Radiation. Reflected Radiation is reflected from surface features.
Direct radiation id the largest component of solar radiation and diffuse radiation is
the second largest component. The direct component of sunlight and the diffuse
component of skylight falling together on a horizontal surface and reflected radiation
from surface features make up Global Solar Radiation. It is measured by a
pyranometer. Direct radiation is best measured by use of a pyrheliometer, which
measures radiation at normal incidence. Diffuse radiation can either be derived from
the direct radiation and the global radiation or measured by shading a pyranometer
from the direct radiation so that the thermopile is only receiving the diffuse radiation
(www.appleylab.com).
Figure J.1 Diffuse, Direct and Reflected Radiation (www.arcgisdesktop/9.3/)

172
APPENDIX K
SAMPLE CALCULATIONS FOR EVALUATION OF THE ANALYSIS
K.1 Sample Calculation for Dry Cell Weight
Bacterial cell concentration (Cdcw) is calculated from multiplying the cell
number (OD660) with the slope of the standard calibration curve (m=0.54) for DSM
1710. The formula is given below;
dcw = 660 m (K.1)
0.54gdcw
c = 1 0.54
gdcw
c (K.2)
K.2 Sample Calculation for Bacteriochlorophyll a Content
Bacteriochlorophyll a concentration of the culture (Cbchl a) is calculated by
dividing absorbance (OD770) at 770 nm with extinction coefficient (ε=75)and the
length of the liquid in the cuvette (L=1)than multiplying the result with molecular
weight of bacteriochlorophyll a (MWbchl a=911.5). The formula is given below;
bchl a = 770
ε bchl a (K.3)
1.21mgbchl a
c =
0.1
(75m -1cm-1) 1cm x 911.5
mg
mmole (K.4)

173
K.3 Sample Calculation for Acetic Acid Concentration
Acetic acid concentration in the photobioreactor (CAA) is calculated by
dividing the area (A) obtained from organic acid analyses in HPLC with the slope of
the acetic acid calibration curve (m) and molecular weight of acetic acid (MWAA).
The formula is given below;
=
m (K.5)
28.65mmole
=
3022265m2
1756.2m2
ppm 60.05
mg
mmole
(K.6)
174
APPENDIX L
SAMPLE CALCULATIONS FOR EVALUATION OF THE
EXPERIMENTAL DATA
L.1 Sample Calculation for Permeability Correction
For determining the exact value of produced hydrogen permeability
correction of hydrogen through the PBR surface should be included in the
calculations. For this purpose permeability coefficient of hydrogen (PH2) through
Plexiglas (1.24E-15 mole/(m.s.Pa)) in the literature is used in the calculations. The
unit of the permeability coefficient without abbreviation is mole.m/(m2.s.Pa). So,
molar hydrogen (NH2) permeated through solid surface is calculated by multiplication
of permeability coefficient of hydrogen (PH2) by surface area of the reactor (A),
duration of hydrogen production (t) and pressure difference of hydrogen in and out of
the PBR ( H2) and by dividing the result by the wall thickness of PBR material (є).
At the end molar hydrogen permeated through the reactor surface is calculated. We
can assume the pressure difference of hydrogen in and out of the photobioreactor
constant and 1atm (101325Pa).The equation and its unitary explanation are given
below:
H2=
H2 t H2
(L.1)
0.004mole = 8.09 10
-16mole.m
m2.s. a 0.472m2 604800s 101325 a
0.006m (L.2)
175
L.2 Sample Calculation for Solubility Correction
L.2.1 Sample Calculation for Solubility Correction in Batch Operation
For calculating the correct value of produced hydrogen moles of solute
hydrogen in the bacterial culture (NH2) should be included into the total hydrogen
amount. To calculate solute hydrogen in bacterial culture (NH2) solubility coefficient
of hydrogen in water at standard temperature (kH0) which is 7.8E-4 mole/L.atm is
multiplied by culture volume (Vc) and partial pressure of hydrogen (PH2) in the
headspace of the photobioreactor.
H2 = kH0 c H2
(L.3)
0.01mole = 7.8 10-4 mole
.atm 8 0.95atm (L.4)
Before calculating mole of solute hydrogen (NH2) partial pressure of hydrogen
(PH2) should be calculated. For this purpose alton’s aw is used because alton’s
Law defines the relation between total gas pressure (P) and partial pressure of
hydrogen (PH2) in the headspace. The equation is given below:
H2= xH2
(L.5)
0.95atm = 1atm 0.95 (L.6)
Where mole fraction of hydrogen (xH2) in the gas phase is 0.95 and total gas pressure
is 1atm partial pressure of hydrogen is found easily.
L.2.2 Sample Calculation for Solubility Correction in Continuous Operation
For continuous operation to calculate moles of solute hydrogen in the
bacterial culture feeding rate should be taken into account so equation J.3 is valid for
only batch period of the experiment. In the fed-batch operations mole of solute
hydrogen in the bacterial culture (NH2) is calculated for the total volume of fresh
media (VFM) given to the photobioreactor daily because as the photobioreactor fed by
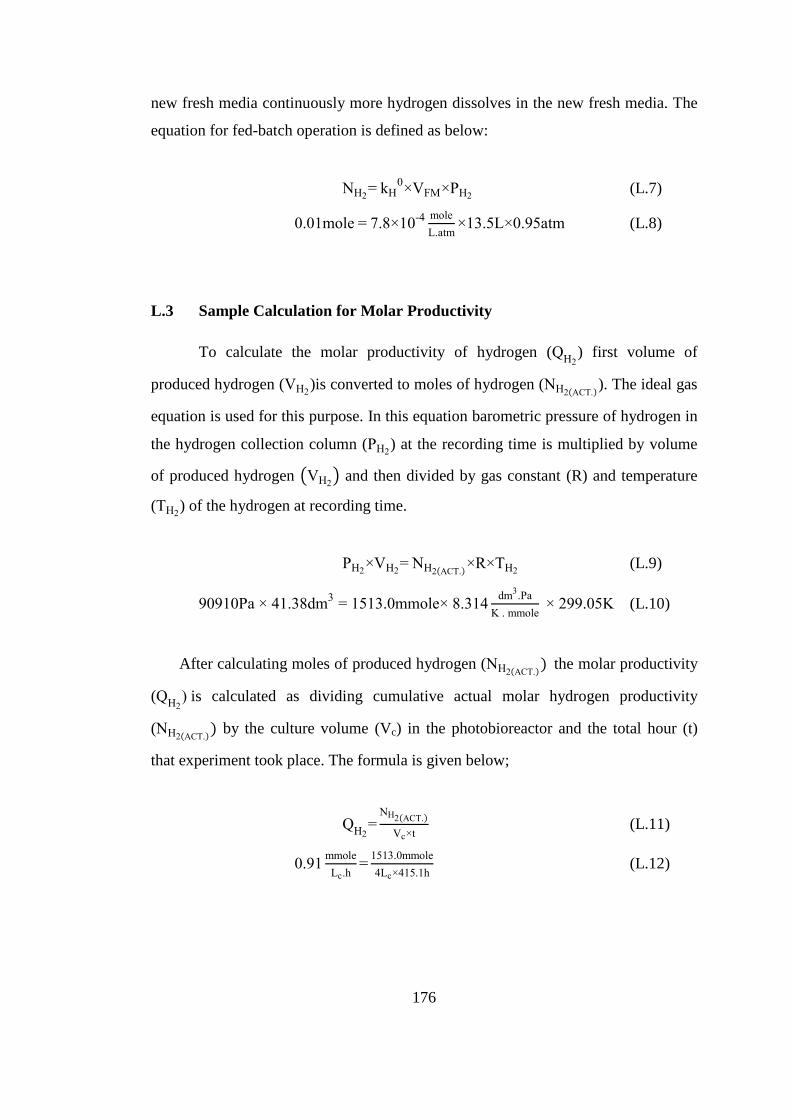
176
new fresh media continuously more hydrogen dissolves in the new fresh media. The
equation for fed-batch operation is defined as below:
H2= kH
0 F H2
(L.7)
0.01mole = 7.8 10-4 mole
.atm 13.5 0.95atm (L.8)
L.3 Sample Calculation for Molar Productivity
To calculate the molar productivity of hydrogen ( H2
) first volume of
produced hydrogen ( H2)is converted to moles of hydrogen ( H2( .)
). The ideal gas
equation is used for this purpose. In this equation barometric pressure of hydrogen in
the hydrogen collection column ( H2) at the recording time is multiplied by volume
of produced hydrogen ( H2) and then divided by gas constant (R) and temperature
( H2) of the hydrogen at recording time.
H2 H2
= H2( .) R H2
(L.9)
90910 a 41.38dm3 = 1513.0mmole 8.314
dm3. a
. mmole 299.05 (L.10)
After calculating moles of produced hydrogen ( H2( .)) the molar productivity
( H2
is calculated as dividing cumulative actual molar hydrogen productivity
( H2( .)) by the culture volume (Vc) in the photobioreactor and the total hour (t)
that experiment took place. The formula is given below;
H2
= H2( .)
c t (L.11)
0.91mmole
c.h=
1513.0mmole
4 c 415.1h (L.12)

177
L.4 Sample Calculation for Molar Percentage Yield
The molar percentage yield ( ) of the process is calculated by
multiplying the division of moles of hydrogen ( H2( .)) that was actually produced
to the moles of theoretical hydrogen ( H2( H .)) that can be produced from utilized
organic acids (acetate and lactate) with 100. The formula is given below;
= H2( .)
H2( H .)
100 (L.13)
76 = 1513.0mmole
1978.9mmole 100 (L.14)
The stoichiometric equations for hydrogen production from acetate and lactate are
given below;
Acetate: C2H4O2 + 2H2O 4H2 + 2CO2 (L.15)
Lactate: C3H6O3 + 3H2O 6H2 + 3CO2 (L.16)
L.5 Sample Calculation for Acetate Conversion Efficiency
Acetate conversion efficiency (
) of the process is calculated from
dividing the difference between input ( in( )) and output ( out( )
) concentrations of
acetate with the concentration of the input acetate ( in( )) for the continuous period of
the system. The conversion equation is given below;
= in( )
- out( )
in( )
100 (L.17)
92 =32.5m -2.53m
32.5m 100 (L.18)
For long term continuous operations the overall acetate conversion efficiency
(
) is calculated. In this calculation input concentration of acetate ( in( )) is the
sum of the acetate concentration in the photobioreactor before feeding started and the
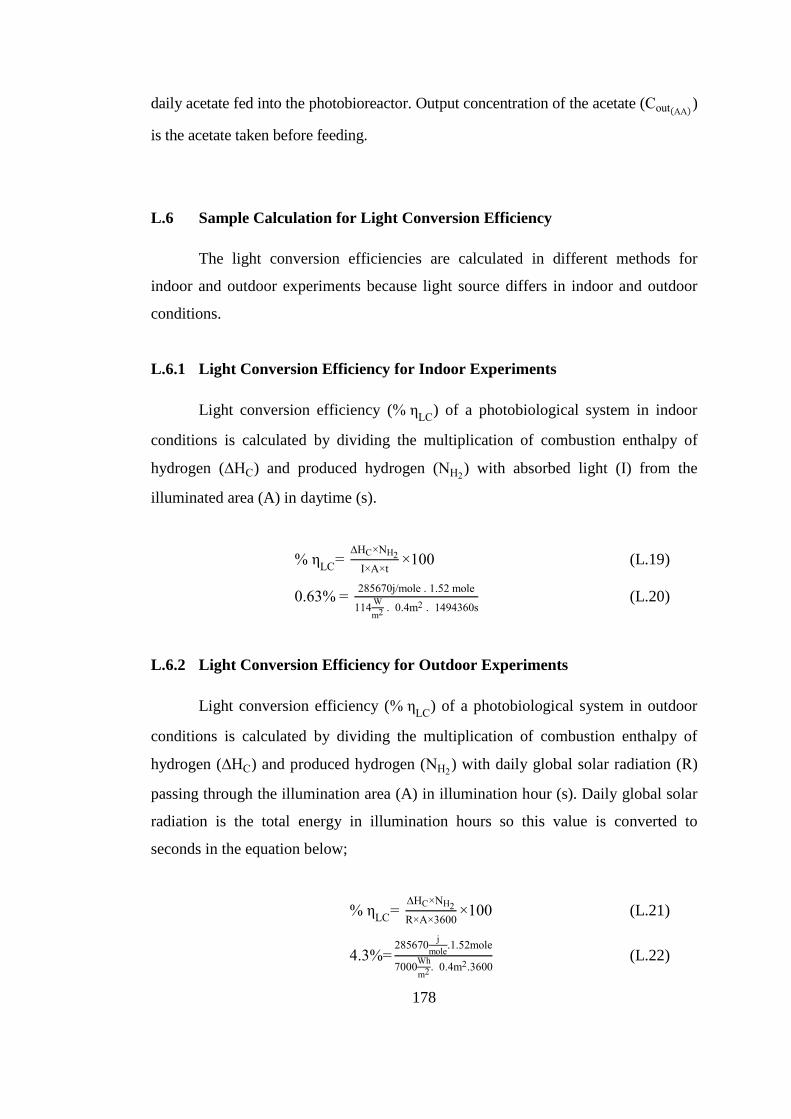
178
daily acetate fed into the photobioreactor. Output concentration of the acetate ( out( ))
is the acetate taken before feeding.
L.6 Sample Calculation for Light Conversion Efficiency
The light conversion efficiencies are calculated in different methods for
indoor and outdoor experiments because light source differs in indoor and outdoor
conditions.
L.6.1 Light Conversion Efficiency for Indoor Experiments
Light conversion efficiency (
) of a photobiological system in indoor
conditions is calculated by dividing the multiplication of combustion enthalpy of
hydrogen ( H ) and produced hydrogen ( H2) with absorbed light ( ) from the
illuminated area (A) in daytime (s).
= H H2
t 100 (L.19)
0.63 = 285670j mole . 1.52 mole
114
m2 . 0.4m2 . 1494360s
(L.20)
L.6.2 Light Conversion Efficiency for Outdoor Experiments
Light conversion efficiency (
) of a photobiological system in outdoor
conditions is calculated by dividing the multiplication of combustion enthalpy of
hydrogen ( H ) and produced hydrogen ( H2) with daily global solar radiation (R)
passing through the illumination area (A) in illumination hour (s). Daily global solar
radiation is the total energy in illumination hours so this value is converted to
seconds in the equation below;
= H H2
R 3600 100 (L.21)
4.3 =285670
j
mole.1.52mole
7000 h
m2 . 0.4m2.3600
(L.22)
179
L.7. Sample Calculation for COD Removal Efficiency
The COD removal efficiency (
( ) of a system is calculated by dividing
the difference between initial and final COD concentration to initial concentration as
the formula (Srikanth et al., 2009) giving below;
( ) = i- f
i 100 (L.23)
63.6 = 5500mg -2000mg
5500mg 100 (L.24)

180
APPENDIX M
EXPERIMENTAL DATA
M.1Experimental Data of Selection of Material Construction of Cooling Coil
Table M.1 pH, OD and cumulative H2 production values of selection of cooling coil
research
pH
Day Control PU Al PVC Cu SS 316 SS 304
1 6,502 6,568 6,538 6,542 6,534 6,582 6,521
2 6,763 6,913 6,824 6,801 6,683 6,923 6,812
4 7,196 7,388 7,287 7,279 7,187 7,141 7,151
5 7,162 7,316 7,262 7,303 7,208 7,197 7,136
6 7,079 7,298 7,220 7,234 7,243 7,130 7,127
7 6,989 7,146 7,059 7,141 7,066 7,049 6,965
8 6,969 7,025 7,095 7,061 7,047 6,969 7,026
11 7,079 6,993 7,024 6,963 7,005 6,943 6,995
OD
Day Control PU Al PVC Cu SS 316 SS 304
1 0,131 0,230 0,155 0,145 0,163 0,220 0,151
2 0,450 0,628 0,516 0,492 0,376 0,664 0,512
4 1,284 1,724 1,260 1,260 1,236 1,120 1,288
5 1,324 1,452 1,360 1,436 1,118 1,200 1,180
6 1,100 1,388 1,216 1,352 1,096 1,108 1,116
7 1,104 1,212 1,052 0,960 1,076 1,044 1,076
8 1,000 1,040 0,924 1,104 0,976 0,952 1,040
11 0,820 0,888 1,012 0,988 0,884 0,820 0,924

181
Table M.1 (Continued)
Cumulative H2 Production (ml)
Day Control PU Al PVC Cu SS 316 SS 304
1 0 0 0 0 0 0 0
2 0,5 1,5 0,4 2 2,8 5,2 3
4 28 37 40 39 38 46 46
5 49 45 57,5 57 58 69 70
6 54 68 77 79 59 93 93
7 61 84,5 95 99 59 118 113
8 70 102 116 117 64 133 134
11 84 121 156 157 76 156 163
M.2 Experimental Data of Indoor Continuous Photobioreactor (8 L) on Defined
Medium (24.08.07)
Table M.2 Temperature variation on the surfaces of indoor continuous
photobioreactor (8 L) on defined medium
Temperature (
0C)
Right Surface Left Surface
Height/Width 1 2 3 4 5 1 2 3 4 5
1 30 30 29,5 29 29 30 29,5 29 28,5 28,5
2 31 30,5 30 30 29,5 31 30 29,5 30 29
3 30,5 30,5 32,5 31 31 30 30 33 30,5 29,5
4 28,5 28,5 29 30 29,5 28 28 28,5 28,5 27,5
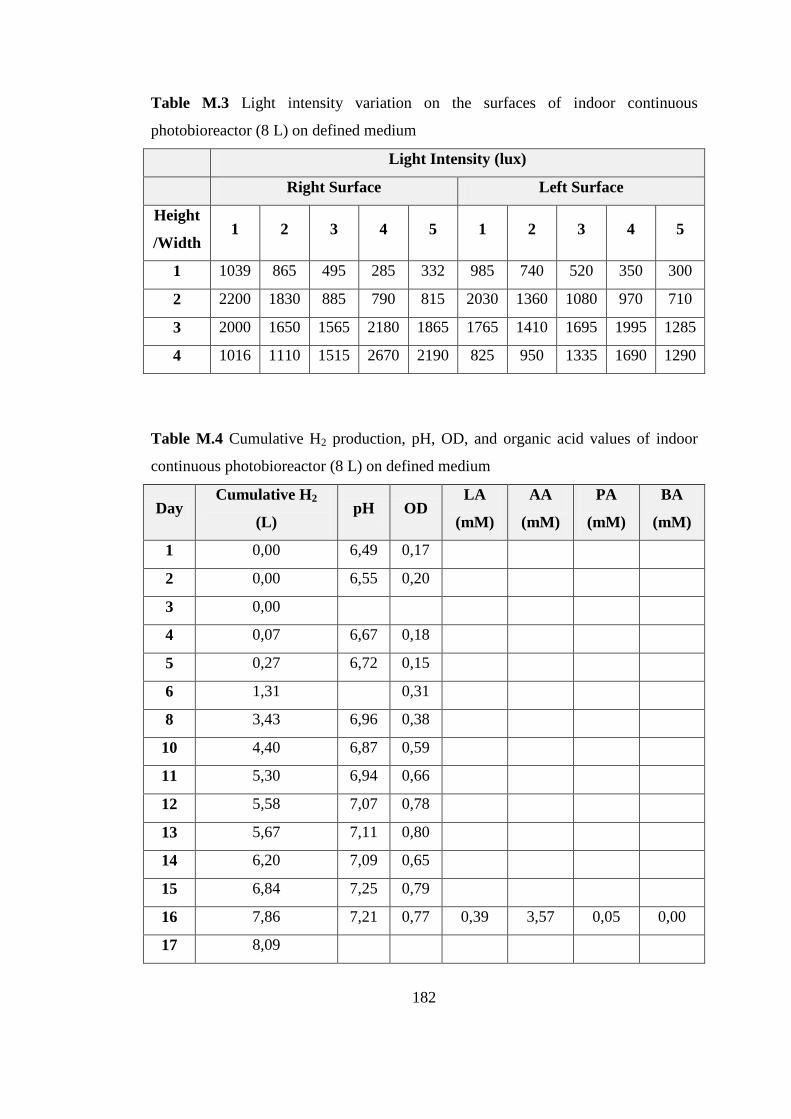
182
Table M.3 Light intensity variation on the surfaces of indoor continuous
photobioreactor (8 L) on defined medium
Light Intensity (lux)
Right Surface Left Surface
Height
/Width 1 2 3 4 5 1 2 3 4 5
1 1039 865 495 285 332 985 740 520 350 300
2 2200 1830 885 790 815 2030 1360 1080 970 710
3 2000 1650 1565 2180 1865 1765 1410 1695 1995 1285
4 1016 1110 1515 2670 2190 825 950 1335 1690 1290
Table M.4 Cumulative H2 production, pH, OD, and organic acid values of indoor
continuous photobioreactor (8 L) on defined medium
Day Cumulative H2
(L) pH OD
LA
(mM)
AA
(mM)
PA
(mM)
BA
(mM)
1 0,00 6,49 0,17
2 0,00 6,55 0,20
3 0,00
4 0,07 6,67 0,18
5 0,27 6,72 0,15
6 1,31
0,31
8 3,43 6,96 0,38
10 4,40 6,87 0,59
11 5,30 6,94 0,66
12 5,58 7,07 0,78
13 5,67 7,11 0,80
14 6,20 7,09 0,65
15 6,84 7,25 0,79
16 7,86 7,21 0,77 0,39 3,57 0,05 0,00
17 8,09
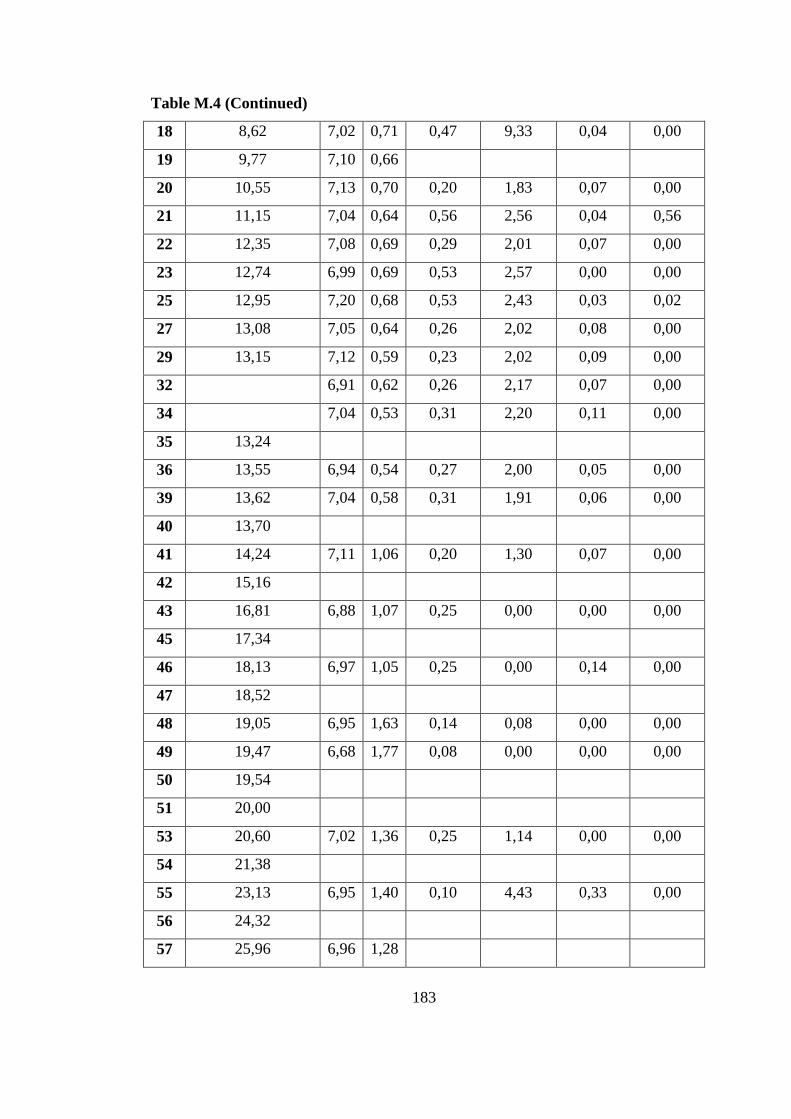
183
Table M.4 (Continued)
18 8,62 7,02 0,71 0,47 9,33 0,04 0,00
19 9,77 7,10 0,66
20 10,55 7,13 0,70 0,20 1,83 0,07 0,00
21 11,15 7,04 0,64 0,56 2,56 0,04 0,56
22 12,35 7,08 0,69 0,29 2,01 0,07 0,00
23 12,74 6,99 0,69 0,53 2,57 0,00 0,00
25 12,95 7,20 0,68 0,53 2,43 0,03 0,02
27 13,08 7,05 0,64 0,26 2,02 0,08 0,00
29 13,15 7,12 0,59 0,23 2,02 0,09 0,00
32
6,91 0,62 0,26 2,17 0,07 0,00
34
7,04 0,53 0,31 2,20 0,11 0,00
35 13,24
36 13,55 6,94 0,54 0,27 2,00 0,05 0,00
39 13,62 7,04 0,58 0,31 1,91 0,06 0,00
40 13,70
41 14,24 7,11 1,06 0,20 1,30 0,07 0,00
42 15,16
43 16,81 6,88 1,07 0,25 0,00 0,00 0,00
45 17,34
46 18,13 6,97 1,05 0,25 0,00 0,14 0,00
47 18,52
48 19,05 6,95 1,63 0,14 0,08 0,00 0,00
49 19,47 6,68 1,77 0,08 0,00 0,00 0,00
50 19,54
51 20,00
53 20,60 7,02 1,36 0,25 1,14 0,00 0,00
54 21,38
55 23,13 6,95 1,40 0,10 4,43 0,33 0,00
56 24,32
57 25,96 6,96 1,28

184
Table M.4 (Continued)
58 25,96
59 25,96
60 27,02 6,93
0,23 3,78 0,00 0,00
61 27,55
62 29,16 7,18 1,20 0,30 3,34 0,00 0,00
63 30,13
64 31,30 6,98 1,34 0,31 3,50 0,00 0,00
65 32,07
66 33,13
67 33,84
68 34,46 6,70 1,24 0,04 3,12 0,00 0,00
69 34,97
70 36,05 7,04 1,28
71 37,48 7,10 1,40
72 38,84
73 40,40
74 41,35 6,96 1,34 0,12 1,92 0,00 0,00
75 42,18
76 43,37 7,04 1,40 0,24 1,52 0,00 0,00
77 44,80
78 45,91 7,02 1,36 0,11 1,20 0,00 0,00
79 46,48
80 47,52
81 48,28 6,93 1,52 0,04 5,87 0,00 0,00
82 48,72
83 49,66 6,99 1,25 0,25 5,49 0,00 0,00
84 50,28 6,96 1,28
85 50,84 7,08 1,29 0,06 2,13 0,00 0,00
86 51,88
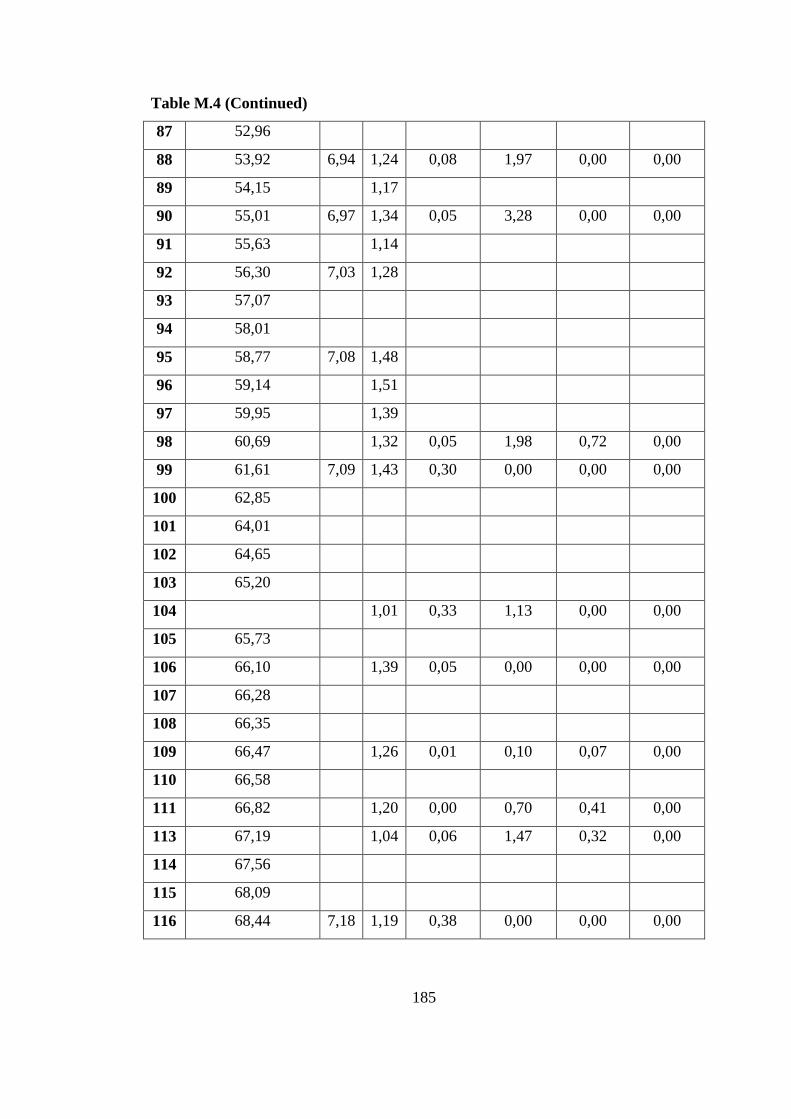
185
Table M.4 (Continued)
87 52,96
88 53,92 6,94 1,24 0,08 1,97 0,00 0,00
89 54,15
1,17
90 55,01 6,97 1,34 0,05 3,28 0,00 0,00
91 55,63
1,14
92 56,30 7,03 1,28
93 57,07
94 58,01
95 58,77 7,08 1,48
96 59,14
1,51
97 59,95
1,39
98 60,69
1,32 0,05 1,98 0,72 0,00
99 61,61 7,09 1,43 0,30 0,00 0,00 0,00
100 62,85
101 64,01
102 64,65
103 65,20
104
1,01 0,33 1,13 0,00 0,00
105 65,73
106 66,10
1,39 0,05 0,00 0,00 0,00
107 66,28
108 66,35
109 66,47
1,26 0,01 0,10 0,07 0,00
110 66,58
111 66,82
1,20 0,00 0,70 0,41 0,00
113 67,19
1,04 0,06 1,47 0,32 0,00
114 67,56
115 68,09
116 68,44 7,18 1,19 0,38 0,00 0,00 0,00

186
Table M.4 (Continued)
117 68,71
118 69,10
1,07 0,46 8,69 1,27 0,70
125 69,52 7,12 1,09 0,47 0,00 0,15 0,00
126 69,87
127 70,07
1,03 0,00 0,75 0,54 0,00
128 70,23
129 70,39
130 70,54
131 70,67
132 70,81
133 71,15 7,24 1,47 0,47 7,99 3,06 0,00
134 71,23
135 71,32
136 71,53
137 71,78 7,15 0,82 0,07 4,49 2,62 0,00
138 71,85
139 71,85
140 71,96 7,08 0,79 0,12 9,85 3,40 0,74
141 72,01
142 72,01
143 72,01
144 72,01 7,11 1,18 0,09 4,27 3,71 0,81
146 72,52 7,35 2,44 0,05 9,82 3,60 1,51
148 73,50 7,47 1,48
151 74,54 7,58 1,48 0,22 8,73 2,52 2,00
152 74,94
153 75,35 7,70 1,38
154 75,58
155 75,83 7,68 0,81 0,23 16,30 2,99 2,59

187
Table M.4 (Continued)
158 77,12 7,92 1,43
159 77,63
160 77,83 8,02 1,86 0,00 16,85 2,21 1,89
161 77,83
162
8,21 1,94
166 78,60
167 78,60 7,24 2,11
M.3 Experimental Data of Outdoor Continuous Photobioreactor (8 L) on
Defined Medium (26.09.07)
Table M.5 Cumulative H2 production, pH, OD, and organic acid values of outdoor
continuous photobioreactor (8 L) on defined medium
Day Cumulative H2
(L) pH OD
LA
(mM)
AA
(mM)
PA
(mM)
BA
(mM)
1 0,00 6,68 0,27 0,57 2,50 0,00 0,00
4 0,50
5 1,10
6
6,85 0,24 0,51 2,46 0,00 0,00
7 1,10
8 1,15 6,87 0,31 0,46 21,71 0,00 0,00
9 1,30
10 1,36 6,69 0,55 0,02 1,73 0,00 0,00
12 1,72
13 1,72
14 1,72
15 1,72 6,86
0,20 1,73 0,00 0,00
16 1,73 6,97 0,79 0,30 2,48 0,00 0,00
17 1,87

188
Table M.5 (Continued)
18 1,99
20 2,00 7,09 0,98
21 2,16
22 2,52
23 2,92
24 3,36 6,99 1,29
26 3,59
27 3,64
28 3,96
29 4,20 6,98 1,35 0,99 10,49 0,00 0,00
30 4,37
31 4,49
35 4,69 6,85 1,60 0,00 2,65 0,00 0,00
36 4,85
37 4,89
38 5,00 6,86 1,55 0,94 4,05 0,00 0,00
41 5,09
42 5,17
43 5,17
44 5,17 6,91 1,73
45 5,27
48 5,94
49 6,44 6,88 1,63
50 6,49
51 6,76 7,07 1,46
52 7,40 7,02 1,85 1,27 5,99 0,00 0,00
56 8,73
57 9,31 6,87 1,80 1,11 7,23 0,00 0,00
58 9,45
1,31

189
Table M.5 (Continued)
59 9,92 6,97 1,57 0,18 5,66 0,26 0,00
62 10,44
63 10,83
1,48 0,24 7,02 0,00 0,00
64 10,92
65 11,07
1,57 0,00 3,21 0,00 0,00
66 11,23 6,96 1,88 0,07 5,47 0,06 0,00
69 12,06
73 13,16
1,81 0,18 6,19 0,05 0,00
76 13,94
1,86 0,06 7,50 1,05 0,00
78 14,53
1,56
80
1,57 0,36 6,28 0,62 0,00
83
7,08 1,84 0,06 5,32 2,51 0,00
85
1,58 0,00 5,08 1,31 0,00
92 15,81 7,12 2,00 0,64 5,87 2,26 0,72
94 16,29
1,65
99 17,11
100 17,40 6,93 1,78 2,94 10,51 2,35 0,57
101 17,53
107 18,51 6,97 2,04 0,58 4,26 1,05 0,88
111 19,11 6,90 1,57 1,03 4,96 1,42 0,89
113 19,35 7,01 1,72 0,00 4,36 0,47 0,38
115 19,86
0,03 12,88 2,47 0,85
118 20,46 7,14 1,32 0,68 16,11 2,45 1,20
120 21,72 7,15 1,14 0,79 18,80 1,08 0,67
122 22,26 7,30 1,00 1,03 18,11 2,74 0,72
125 23,12 7,42 1,20 0,59 16,02 1,90 1,02
127 23,83 7,41 1,33 1,01 24,52 1,69 1,42
129 24,45 7,47 1,07 0,87 21,64 1,26 0,99
134 25,453 7,58 1,12 0,95 27,26 1,93 2,33
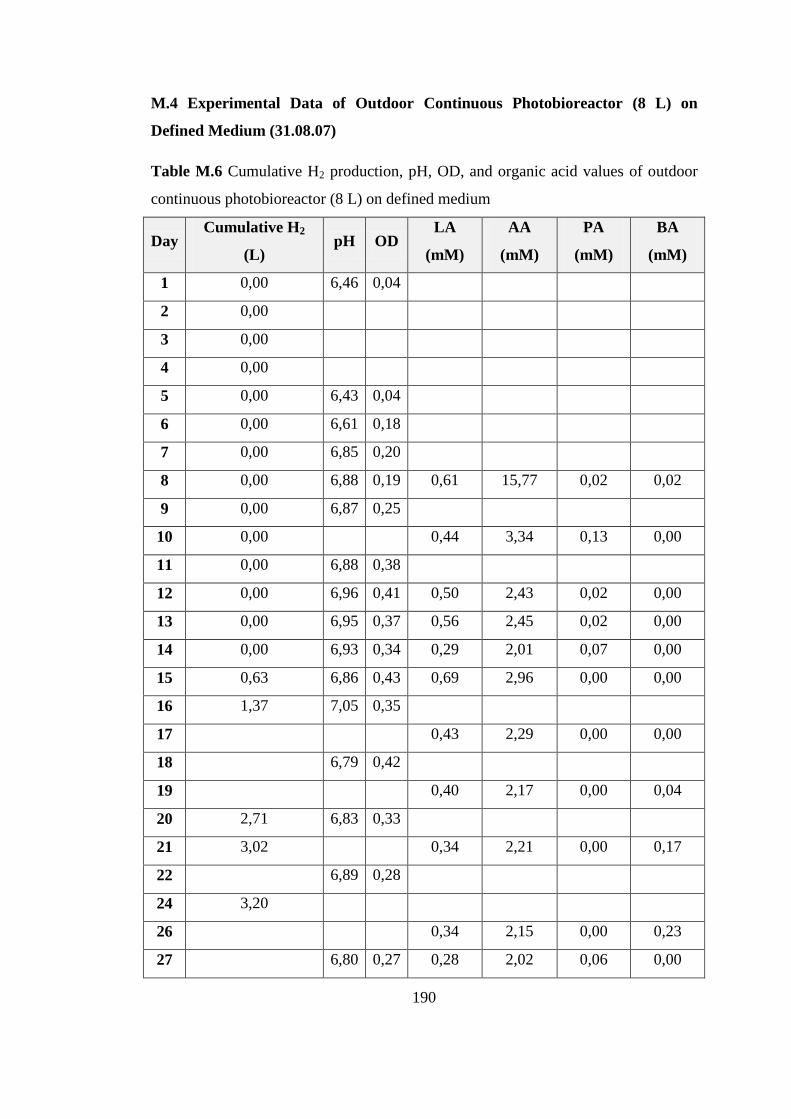
190
M.4 Experimental Data of Outdoor Continuous Photobioreactor (8 L) on
Defined Medium (31.08.07)
Table M.6 Cumulative H2 production, pH, OD, and organic acid values of outdoor
continuous photobioreactor (8 L) on defined medium
Day Cumulative H2
(L) pH OD
LA
(mM)
AA
(mM)
PA
(mM)
BA
(mM)
1 0,00 6,46 0,04
2 0,00
3 0,00
4 0,00
5 0,00 6,43 0,04
6 0,00 6,61 0,18
7 0,00 6,85 0,20
8 0,00 6,88 0,19 0,61 15,77 0,02 0,02
9 0,00 6,87 0,25
10 0,00
0,44 3,34 0,13 0,00
11 0,00 6,88 0,38
12 0,00 6,96 0,41 0,50 2,43 0,02 0,00
13 0,00 6,95 0,37 0,56 2,45 0,02 0,00
14 0,00 6,93 0,34 0,29 2,01 0,07 0,00
15 0,63 6,86 0,43 0,69 2,96 0,00 0,00
16 1,37 7,05 0,35
17
0,43 2,29 0,00 0,00
18
6,79 0,42
19
0,40 2,17 0,00 0,04
20 2,71 6,83 0,33
21 3,02
0,34 2,21 0,00 0,17
22
6,89 0,28
24 3,20
26
0,34 2,15 0,00 0,23
27
6,80 0,27 0,28 2,02 0,06 0,00
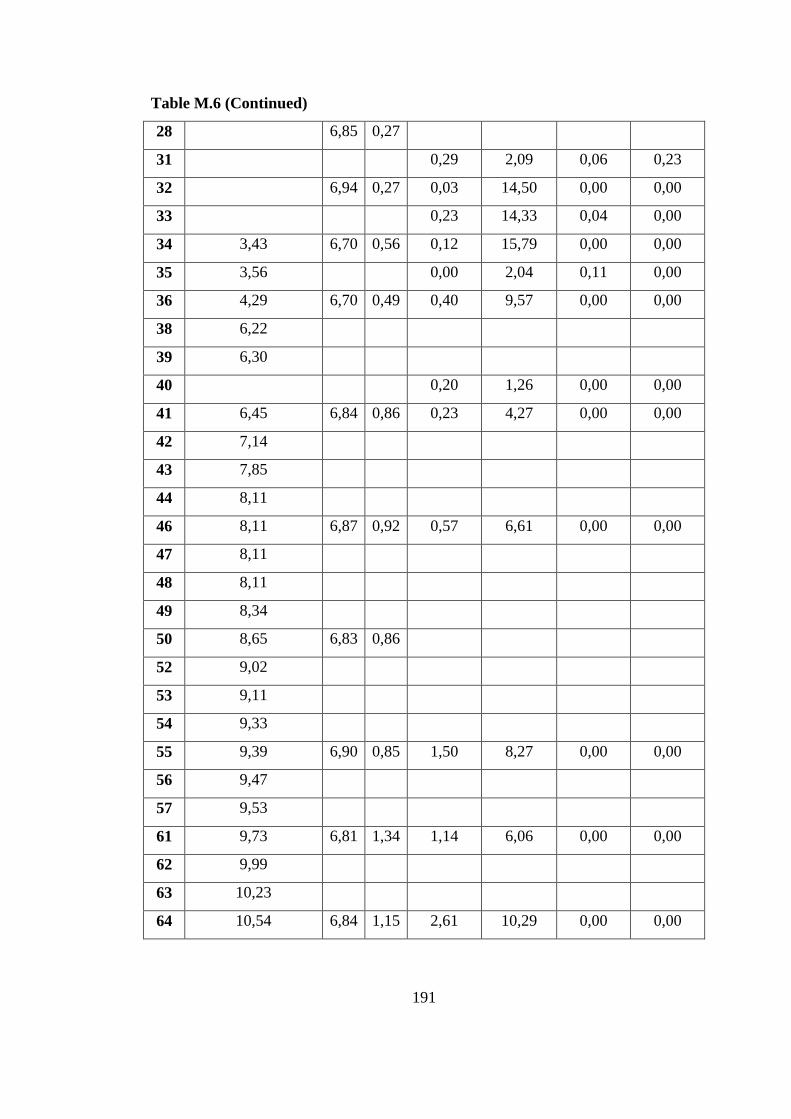
191
Table M.6 (Continued)
28
6,85 0,27
31
0,29 2,09 0,06 0,23
32
6,94 0,27 0,03 14,50 0,00 0,00
33
0,23 14,33 0,04 0,00
34 3,43 6,70 0,56 0,12 15,79 0,00 0,00
35 3,56
0,00 2,04 0,11 0,00
36 4,29 6,70 0,49 0,40 9,57 0,00 0,00
38 6,22
39 6,30
40
0,20 1,26 0,00 0,00
41 6,45 6,84 0,86 0,23 4,27 0,00 0,00
42 7,14
43 7,85
44 8,11
46 8,11 6,87 0,92 0,57 6,61 0,00 0,00
47 8,11
48 8,11
49 8,34
50 8,65 6,83 0,86
52 9,02
53 9,11
54 9,33
55 9,39 6,90 0,85 1,50 8,27 0,00 0,00
56 9,47
57 9,53
61 9,73 6,81 1,34 1,14 6,06 0,00 0,00
62 9,99
63 10,23
64 10,54 6,84 1,15 2,61 10,29 0,00 0,00

192
Table M.6 (Continued)
65 11,53
67 12,04
68 12,13
69 12,13
70 12,13 6,91 1,32 1,02 6,31 0,00 0,00
71 12,13
74 12,50
75 12,80 6,86 1,41 0,98 5,27 0,00 0,00
76 12,80
77 13,72 6,94 1,64
78 15,06 7,01 1,69
82 16,04
83 16,69 6,87 1,63 0,00 0,46 0,32 0,00
84 16,91
1,09
85 17,41 7,07 1,20 0,09 0,57 0,46 0,00
88 17,73
89 18,22
1,72
90 18,51
1,61 0,37 4,45 2,53 0,00
91 18,88
92 19,20 7,04 1,82 0,19 5,79 0,84 0,00
95 19,97
99 19,97
1,64 0,06 4,89 2,20 0,39
102 20,66
1,61 0,13 0,90 1,26 0,23
104 21,06
1,46 0,06 6,00 1,38 0,13
106
1,69 0,52 6,26 0,97 0,31
109
6,95 1,88 1,67 12,46 0,13 0,11
111
1,41 0,00 7,96 0,00 0,00
118 22,04 7,13 1,95 5,02 15,38 1,68 0,48
120 22,49
1,44 2,25 5,62 1,65 0,70

193
Table M.6 (Continued)
125 22,93
126 23,19 7,05 1,75 3,39 10,51 1,29 0,87
127 23,75
133 25,09 6,99 2,06 0,00 4,71 1,63 0,85
137 26,19 6,96 1,74 0,00 5,16 1,04 0,65
139 26,98 7,02 1,96 0,14 11,55 1,20 1,14
141 27,31
144 27,41 7,20 1,95 1,19 14,45 2,45 1,49
146 28,25 7,23 1,87 1,13 19,02 2,49 1,33
148 29,11 7,34 1,52 0,46 11,92 1,22 0,83
151 30,07 7,42 1,83 0,00 17,02 2,01 1,36
153 30,66 7,23 2,00 0,97 26,00 2,76 1,50
155 31,61 7,29 2,13 0,98 26,86 3,27 1,79
160 32,68 7,19 1,94 0,69 22,06 5,05 1,86
M.5 Experimental Data of Outdoor Continuous Pilot-Scale Photobioreactor (20
L) on Defined Medium
Table M.7 Cumulative H2 production, pH, OD, and organic acid values of outdoor
continuous pilot scale photobioreactor (20 L) on defined medium
Day Cumulative H2
(L) pH OD
LA
(mM)
FA
(mM)
AA
(mM)
PA
(mM)
BA
(mM)
1 0,00 6,62 0,23 0,02 0,69 20,15 0,00 0,00
2 4,68 6,61 0,23 0,00 0,44 21,52 0,00 0,00
3 6,19 6,63 0,29 0,00 0,29 21,68 0,00 0,00
4 6,34 6,68 0,35 0,00 1,19 20,80 0,00 0,00
6 6,66 6,86 0,50 0,00 0,83 18,67 0,00 0,00
8 6,98 6,91 0,53

194
Table M.7 (Continued)
10 7,30 7,03 0,56 0,06 0,70 15,46 0,00 0,00
15 7,39 7,03 0,68 0,00 1,27 12,11 0,00 0,00
16 7,53 7,04 0,98 0,00 1,48 10,57 0,00 0,00
17 7,68 7,00 1,35
18 7,83 7,07 1,12 0,00 1,74 10,82 0,00 0,00
19 12,95 7,06 1,02
21 16,84 7,20 0,88
23 18,78 7,03 1,16 0,00 2,25 7,86 0,00 0,00
25 20,11 6,87 0,92 0,00 3,08 8,10 0,74 0,25
29 24,35 7,00 1,63
32 25,32 6,97 0,91 0,00 3,94 9,33 0,51 0,29
M.6 Experimental Data on the Effect of Buffer on the Molasses DFE
Table M.8 pH, OD, and cumulative gas production values obtained at different
concentrations of Na2CO3 and KH2PO4.
pH
5mM 10mM 15mM 5mM 10mM 15mM
Day Na2CO3 Na2CO3 Na2CO3 KH2PO4 KH2PO4 KH2PO4
1 7,82 7,93 7,98 7,11 6,89 6,81
2 7,75 7,79 7,82 7,49 7,18 7,03
3 7,67 7,70 7,80 7,52 7,28 7,23
4 7,48 7,56 7,60 7,42 7,30 7,25
5 7,38 7,41 7,73 7,47 7,27 7,33
6 7,40 7,49 7,25 7,57 7,65 7,67
7 7,40 7,66 7,77 7,92 8,13 7,64

195
Table M.8 (Continued)
OD
5mM 10mM 15mM 5mM 10mM 15mM
Na2CO3 Na2CO3 Na2CO3 KH2PO4 KH2PO4 KH2PO4
1 0,50 0,47 0,43 0,38 0,35 0,37
2 0,93 0,95 0,96 0,94 0,72 0,64
3 1,47 1,28 1,43 1,48 1,46 1,42
4 1,78 1,70 1,74 1,88 1,88 1,87
5 1,88 1,70 1,86 1,96 2,09 2,08
6 1,78 1,64 1,91 1,98 2,06 1,82
7 1,68 1,59 1,73 1,96 2,10 1,82
Cumulative Gas Production
5mM 10mM 15mM 5mM 10mM 15mM
Na2CO3 Na2CO3 Na2CO3 KH2PO4 KH2PO4 KH2PO4
1 0,00 0,00 0,00 0,00 0,00 0,00
2 12,00 13,00 9,50 5,00 0,00 0,00
3 40,00 31,00 27,50 13,50 9,00 14,00
4 52,50 41,00 32,50 23,50 12,50 24,00
5 60,50 47,00 37,50 24,50 13,00 28,20
6 61,50 48,00 39,00 24,50 15,00 29,00
7 61,50 48,50 39,00 25,00 18,00 30,50
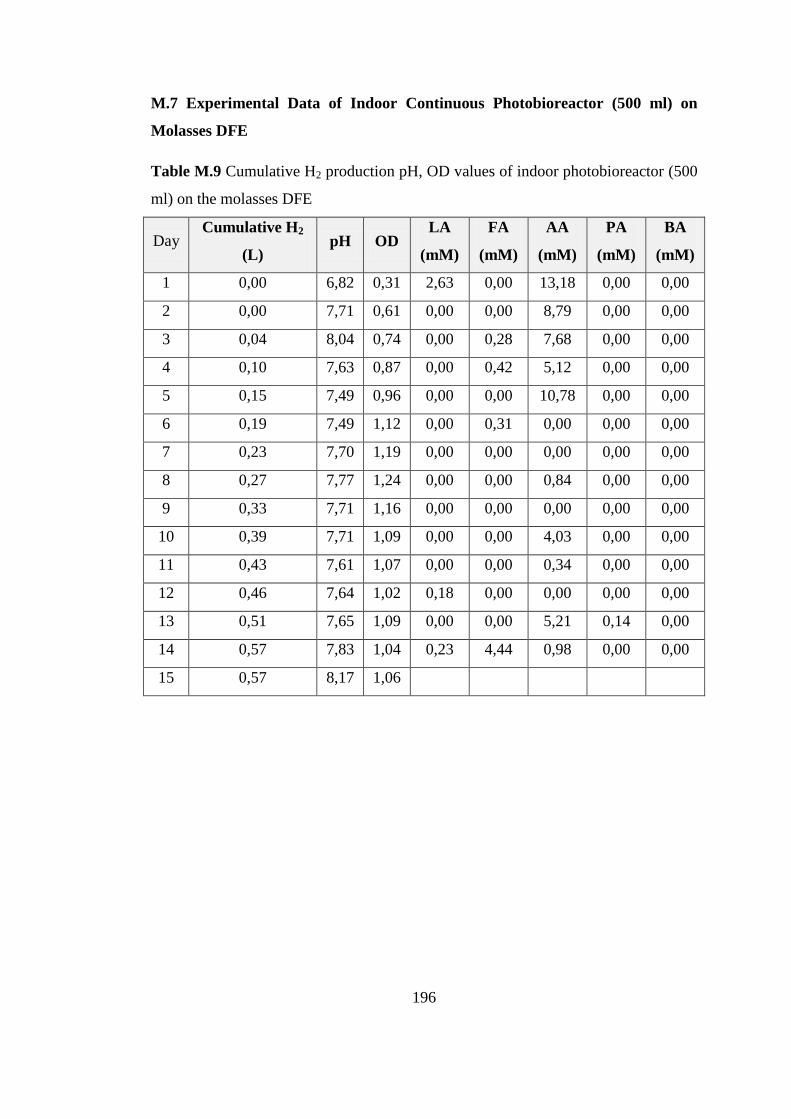
196
M.7 Experimental Data of Indoor Continuous Photobioreactor (500 ml) on
Molasses DFE
Table M.9 Cumulative H2 production pH, OD values of indoor photobioreactor (500
ml) on the molasses DFE
Day Cumulative H2
(L) pH OD
LA
(mM)
FA
(mM)
AA
(mM)
PA
(mM)
BA
(mM)
1 0,00 6,82 0,31 2,63 0,00 13,18 0,00 0,00
2 0,00 7,71 0,61 0,00 0,00 8,79 0,00 0,00
3 0,04 8,04 0,74 0,00 0,28 7,68 0,00 0,00
4 0,10 7,63 0,87 0,00 0,42 5,12 0,00 0,00
5 0,15 7,49 0,96 0,00 0,00 10,78 0,00 0,00
6 0,19 7,49 1,12 0,00 0,31 0,00 0,00 0,00
7 0,23 7,70 1,19 0,00 0,00 0,00 0,00 0,00
8 0,27 7,77 1,24 0,00 0,00 0,84 0,00 0,00
9 0,33 7,71 1,16 0,00 0,00 0,00 0,00 0,00
10 0,39 7,71 1,09 0,00 0,00 4,03 0,00 0,00
11 0,43 7,61 1,07 0,00 0,00 0,34 0,00 0,00
12 0,46 7,64 1,02 0,18 0,00 0,00 0,00 0,00
13 0,51 7,65 1,09 0,00 0,00 5,21 0,14 0,00
14 0,57 7,83 1,04 0,23 4,44 0,98 0,00 0,00
15 0,57 8,17 1,06
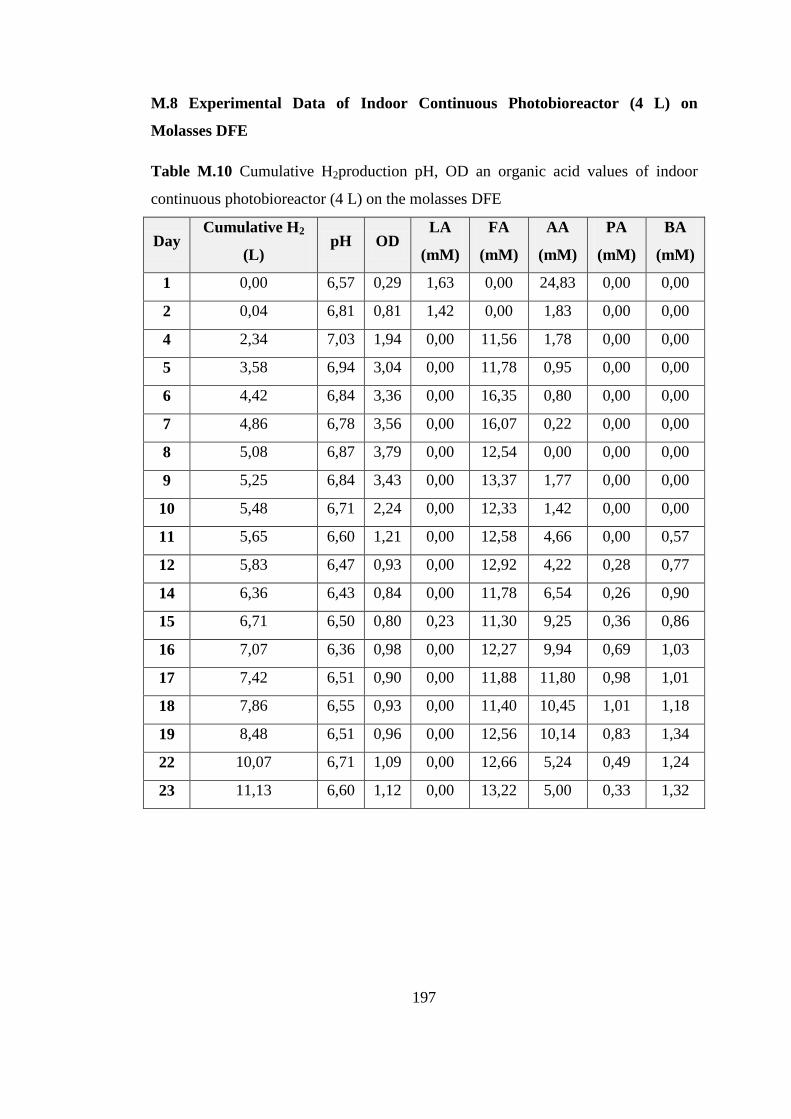
197
M.8 Experimental Data of Indoor Continuous Photobioreactor (4 L) on
Molasses DFE
Table M.10 Cumulative H2production pH, OD an organic acid values of indoor
continuous photobioreactor (4 L) on the molasses DFE
Day Cumulative H2
(L) pH OD
LA
(mM)
FA
(mM)
AA
(mM)
PA
(mM)
BA
(mM)
1 0,00 6,57 0,29 1,63 0,00 24,83 0,00 0,00
2 0,04 6,81 0,81 1,42 0,00 1,83 0,00 0,00
4 2,34 7,03 1,94 0,00 11,56 1,78 0,00 0,00
5 3,58 6,94 3,04 0,00 11,78 0,95 0,00 0,00
6 4,42 6,84 3,36 0,00 16,35 0,80 0,00 0,00
7 4,86 6,78 3,56 0,00 16,07 0,22 0,00 0,00
8 5,08 6,87 3,79 0,00 12,54 0,00 0,00 0,00
9 5,25 6,84 3,43 0,00 13,37 1,77 0,00 0,00
10 5,48 6,71 2,24 0,00 12,33 1,42 0,00 0,00
11 5,65 6,60 1,21 0,00 12,58 4,66 0,00 0,57
12 5,83 6,47 0,93 0,00 12,92 4,22 0,28 0,77
14 6,36 6,43 0,84 0,00 11,78 6,54 0,26 0,90
15 6,71 6,50 0,80 0,23 11,30 9,25 0,36 0,86
16 7,07 6,36 0,98 0,00 12,27 9,94 0,69 1,03
17 7,42 6,51 0,90 0,00 11,88 11,80 0,98 1,01
18 7,86 6,55 0,93 0,00 11,40 10,45 1,01 1,18
19 8,48 6,51 0,96 0,00 12,56 10,14 0,83 1,34
22 10,07 6,71 1,09 0,00 12,66 5,24 0,49 1,24
23 11,13 6,60 1,12 0,00 13,22 5,00 0,33 1,32

198
M.9 Experimental Data of Outdoor Continuous Photobioreactor (4 L) with
Cooling by Rb. capsulatus wild type on Molasses DFE (27.07.09)
Table M.11 Cumulative H2 production pH, OD an organic acid values of outdoor
continuous photobioreactor (4 L) with cooling by Rb. capsulatus wild type on the
molasses DFE (27.07.09)
Day Cumulative
H2(L) pH OD
LA
(mM)
FA
(mM)
AA
(mM)
PA
(mM)
BA
(mM)
1 0,00 7,31 0,63 4,61 12,48 30,66 0,00 0,00
2 0,00 6,60 0,71 3,50 3,11 25,48 0,00 0,00
3 0,15 7,57 1,22 5,09 4,55 28,91 0,00 0,00
4 0,22 7,54 1,33 2,10 4,25 22,56 0,00 0,00
5 0,80 7,21 1,53 2,40 5,84 25,78 0,00 0,00
6 1,39 7,22 1,72 1,81 6,73 21,80 0,42 0,42
7 1,83 7,23 1,70 1,28 9,11 20,49 0,56 0,56
8 2,56 7,40 1,69 0,85 9,03 18,27 0,51 0,51
9 3,36 7,60 1,81 0,59 10,07 15,91 0,55 0,55
10 4,31 7,30 1,83 1,08 12,07 13,82 0,66 0,66
11 4,97 7,36 1,92 0,53 9,73 12,56 0,46 0,46
12 5,48 7,29 1,83 0,52 10,14 11,16 0,47 0,47
13 5,92 7,40 1,60 0,77 12,67 10,94 0,64 0,64
14 6,22 7,35 1,63
15 6,95 7,33 1,87 0,58 14,26 10,56 0,68 0,68
16 7,39 7,06 1,61 0,70 11,48 11,38 0,75 0,75

199
M.10 Experimental Data of Outdoor Continuous Photobioreactor (4 L) with
Cooling by Rb. capsulatus wild type on Molasses DFE (17.08.09)
Table M.12 Cumulative H2 production pH, OD an organic acid values of outdoor
continuous photobioreactor (4 L) with Cooling by Rb. capsulatus wild type on the
molasses DFE (17.08.09)
Day Cumulative
H2 (L) pH OD
LA
(mM)
FA
(mM)
AA
(mM)
PA
(mM)
BA
(mM)
1 0,00 7,32 0,53 2,73 6,44 29,20 0,00 0,00
2 0,00 7,35 0,38 1,42 1,86 14,80 0,00 0,00
3 0,00 6,98 0,51 2,20 5,07 17,34 0,00 0,00
4 0,00 7,48 0,81 1,68 1,90 15,34 0,00 0,00
5 1,54 7,36 1,00 1,18 2,67 10,05 0,00 0,00
6 3,17 6,76 1,37 0,21 9,50 2,67 0,00 0,00
7 4,63 7,05 1,33
8 5,77 6,93 1,38 0,39 15,39 2,42 0,00 0,00
9 6,83 6,96 1,46
10 7,80 6,90 1,51 0,00 19,37 2,21 0,22 1,22
11 8,54 7,02 1,59
12 9,19 6,98 1,62 0,00 18,29 2,27 0,18 0,00
13 9,84 7,37 1,69
14 10,40 6,98 1,70 0,00 20,85 1,88 0,33 0,00
15 10,97 7,02 1,78
16 11,30 7,35 1,81 0,00 17,76 2,26 0,65 0,00
17 11,71 7,12 1,81
18 12,27 6,90 1,78 0,00 24,02 3,81 0,62 0,13
19 12,76 7,22 1,71 0,00 25,89 3,54 0,46 0,15
20 13,41 6,97 1,96 0,00 23,87 4,38 0,91 0,20
21 14,06 6,95 1,68 0,00 21,83 4,88 1,17 0,25
22 14,88 6,90 1,60 0,00 24,58 5,56 1,29 0,36
23 15,61 6,94 1,55 0,00 19,75 4,21 0,69 0,27

200
Table M.12 (Continued)
24 16,18 7,19 1,65 0,00 24,58 5,56 1,29 0,36
25 16,50 7,02 1,63 0,00 25,47 4,38 1,22 0,26
26 17,15 7,19 1,48 0,00 20,08 6,18 1,39 0,43
27 17,88 7,06 1,61 0,00 23,20 7,35 1,73 0,60
28 18,29 7,10 1,44 0,00 19,78 6,95 1,51 0,57
29 18,70 7,02 1,53 0,00 19,68 7,34 1,25 0,68
30 19,43 7,19 1,57 0,00 18,91 6,61 1,48 0,65
31 20,00 6,80 1,56 0,00 21,42 7,32 1,42 0,85
32 20,73 6,93 1,52 0,00 21,18 7,48 1,35 0,78
33 21,38 7,34 1,45 0,00 19,24 6,51 1,28 0,68
34 22,11 7,27 1,42 0,00 17,92 5,26 0,93 0,62
35 22,60 7,24 1,51 0,00 19,35 5,97 1,27 0,72
36 22,76 7,31 1,40 0,00 16,45 6,01 1,33 0,70
37 23,00 6,98 1,30 0,00 15,97 12,49 2,24 0,99
38 23,49 7,16 1,30 0,00 14,10 7,65 1,33 0,60
39 23,98 7,12 1,29 0,00 19,00 10,92 2,25 0,80
40 24,63 7,03 1,49 0,00 18,62 9,98 1,97 0,96
41 25,20 7,55 1,27 0,32 15,99 9,87 1,74 1,17
42 25,36 6,97 1,31 0,00 17,68 12,27 2,12 1,01
43 25,77 7,14 1,30 0,00 18,29 12,71 1,77 1,22
44 26,17 7,45 1,86 0,47 13,18 8,92 1,31 0,68
45 26,58 7,04 1,35 0,71 15,83 11,79 2,09 1,06
46 26,99 7,28 1,25 1,02 20,09 15,75 2,16 1,30
47 27,39 7,27 1,31 0,31 19,22 15,83 2,99 1,98
48 27,80 7,30 1,38 0,13 13,27 9,98 1,02 0,97
49 28,04 7,33 1,21 0,20 15,75 11,96 1,44 1,19
50 28,21 7,02 1,37 0,31 19,47 16,66 0,52 2,39
51 28,61 7,20 1,28 0,00 19,25 18,19 0,60 2,41
52 28,94 7,28 1,42 0,00 20,42 18,22 0,59 2,49

201
Table M.12 (Continued)
53 29,26 7,23 1,49 0,00 16,67 14,37 2,34 1,47
54 29,59 7,39 1,89 0,00 19,75 13,70 0,69 0,27
55 29,83 7,45 1,49 0,25 14,20 9,78 1,82 1,18
56 30,16 7,39 1,67 0,00 14,23 9,52 1,42 1,02
57 30,48 7,63 1,57 0,17 13,98 8,84 1,19 0,96
58 30,89 7,58 1,67 1,24 21,78 14,71 4,95 2,18
59 31,21 7,50 1,76 0,67 17,54 10,81 2,52 0,93
60 31,28 7,48 1,60 0,47 16,60 11,96 2,56 1,13
61 31,54 8,04 1,68 1,02 16,10 11,15 2,40 0,89
62 32,01 7,52 1,96 1,93 22,21 15,30 2,46 1,28
63 32,46 7,98 1,98 1,13 16,68 13,23 2,21 0,96
64 32,69 7,97 2,03 0,48 19,65 16,86 2,28 1,00
65 32,91 8,48 1,89 0,00 18,73 19,64 3,23 0,51
66 33,28 7,91 2,16 0,00 16,39 17,36 3,34 0,48
67 33,60 8,17 2,07 0,00 15,40 15,13 1,88 0,49
68 33,91 7,90 2,20 0,00 15,39 17,66 3,07 0,37
69 34,32 8,94 2,09 0,43 16,15 19,33 2,83 0,30
70 34,73 8,12 1,93 0,00 18,53 24,52 3,96 0,19
71 35,30 8,63 2,02 0,00 15,77 20,73 2,97 0,13
72 35,60 8,31 1,90 0,00 13,67 17,83 1,15 0,26
73 35,88 7,79 1,79 0,00 14,28 19,91 2,37 0,15
74 36,19 8,19 2,01 0,00 14,06 20,45 1,25 0,00
75 36,35 7,92 1,78 0,00 12,34 19,69 1,98 0,00
76 36,68 7,43 1,97 0,00 10,97 19,54 0,00 0,00
77 36,84 8,12 1,70 0,00 9,05 19,07 2,32 0,13
78 37,17 8,46 1,52 0,97 7,19 17,06 0,00 0,00
79 37,25 8,59 1,82 1,42 8,13 20,64 0,00 0,00
80 37,25 7,37 1,32 1,61 6,15 20,34 0,00 0,00
81 37,33 7,49 1,37 2,18 5,27 17,63 0,00 0,12

202
Table M.12 (Continued)
82 37,49 7,72 1,50 0,00 3,51 14,54 1,78 0,25
83 37,53 8,30 1,75 0,00 5,15 16,31 0,91 0,27
84 37,71 8,82 2,08 0,00 6,46 16,23 0,70 0,30
85 37,79 8,92 2,09 1,23 6,09 15,55 0,70 0,36
86 37,83 8,97 2,01 1,02 5,48 13,40 0,63 0,28
87 37,91 9,09 1,73 1,27 5,50 13,56 0,80 0,60
88 37,93 8,76 1,86 0,67 2,86 16,43 0,00 0,18
89 37,93 8,46 1,92 1,89 6,85 19,45 1,92 0,65
90 37,95 8,52 1,87 0,91 3,72 20,14 0,52 0,37
91 37,95 8,89 2,10 1,82 5,42 18,24 0,00 0,59
92 37,95 8,00 1,74 2,80 5,05 20,82 0,00 0,78
93 37,95 7,74 1,63 1,96 4,03 16,47 0,00 0,53
94 37,95 8,75 1,40 2,56 5,10 20,02 0,00 0,62
95 37,96 7,21 1,79 2,54 4,54 17,68 3,49 0,75
96 37,96 7,28 1,85 3,10 4,45 16,81 2,78 0,89
97 37,98 7,57 2,12 2,54 5,10 10,26 2,19 0,89
98 38,14 8,99 1,91 3,25 6,81 12,35 2,49 1,04
99 38,22 8,18 2,06 2,22 6,41 8,40 0,00 0,67
100 38,35 8,12 1,77 3,13 8,57 10,77 2,07 0,78
101 38,37 7,86 1,58 3,05 9,25 11,41 2,76 0,83
102 38,48 8,25 2,09 1,59 5,87 10,32 2,96 0,87
103 38,66 8,59 1,64 0,53 7,54 8,64 2,71 0,62
104 38,79 8,90 1,48 0,71 8,02 11,47 2,56 0,59
105 38,97 8,85 1,26 1,05 8,06 12,30 3,30 0,61
106 38,99 7,88 1,44 1,17 8,04 19,69 6,26 0,78
107 39,00 5,91 0,80 1,82 5,63 16,97 6,81 1,01
108 39,16 6,04 0,82 0,79 6,82 15,46 7,32 0,91
109 39,31 6,16 0,73 1,18 8,62 18,20 4,46 1,05
110 39,31 6,13 0,57 1,26 5,83 13,72 2,79 0,88

203
Table M.12 (Continued)
111 39,56 6,17 0,67 0,00 6,84 15,05 4,62 0,68
112 39,56 5,86 0,63 0,79 5,32 15,72 10,84 0,81
113 39,56 5,83 0,55 1,80 6,32 23,90 16,89 0,61
114 39,56 5,81 0,51 1,73 4,65 25,29 16,92 0,99
115 39,80 5,80 0,57 3,00 6,38 27,85 13,86 1,14
116 39,86 5,80 0,51 1,92 4,71 27,21 13,39 1,46
117 39,86 5,78 0,57 2,44 3,99 28,80 13,44 1,91
118 40,11 5,80 0,46 1,06 4,20 24,82 12,71 2,11
119 40,19 5,88 0,34 0,93 3,59 24,62 12,36 2,82
120 40,27 6,22 0,38 1,03 4,11 28,37 11,58 2,83
121 40,27 6,05 0,25 0,56 4,15 28,85 10,33 3,60
122 40,42 6,06 0,28 0,66 2,99 29,78 9,67 4,03
123 40,42 5,99 0,35 0,44 3,49 28,75 8,60 3,99
124 40,47 6,06 0,32 0,63 2,83 30,59 8,31 4,44
125 40,53 6,26 0,30 0,51 3,20 31,46 8,22 4,34
126 40,56 6,30 0,37 0,61 3,12 30,21 6,89 4,08
127 40,81 6,42 0,29 0,93 2,26 29,13 6,84 4,03
128 40,81 6,32 0,27 0,52 2,64 29,42 6,87 4,08
129 40,81 6,30 0,27 0,53 1,52 30,31 4,61 2,99
130 40,81 6,64 0,25 0,50 2,31 27,74 5,91 4,05
131 40,81 6,64 0,22 0,42 2,45 29,71 5,91 4,39

204
M.11 Experimental Data of Outdoor Continuous Photobioreactor (4 L) with
Cooling by Rb. capsulatus hup- on Molasses DFE (30.07.09)
Table M.13 Cumulative H2 production pH, OD an organic acid values of outdoor
continuous photobioreactor (4 L) with cooling by Rb. capsulatus hup- on the
molasses DFE (30.07.09)
Day Cumulative
H2(L) pH OD
LA
(mM)
FA
(mM)
AA
(mM)
PA
(mM)
BA
(mM)
1 0,00 7,24 0,34 0,00 1,78 28,47 1,33 0,56
2 0,00 7,02 0,43 3,01 2,55 28,66 0,00 0,29
3 0,00 6,83 0,58 2,73 5,66 22,79 0,00 0,66
4 0,00 6,86 0,59 1,05 2,57 26,23 0,00 1,99
5 0,00 6,88 0,54 0,85 2,46 23,36 0,00 2,38
6 0,08 6,99 0,56 0,75 2,69 21,75 0,00 2,28
7 0,12 6,88 0,61 0,85 2,76 19,75 1,59 3,45
8 0,17 7,06 0,80 0,52 2,18 21,07 0,43 3,03
9 0,17 7,30 0,85 0,54 3,72 17,45 0,73 3,94
10 0,92 7,35 0,95 0,47 4,09 20,47 1,88 2,82
11 1,43 7,33 1,22 0,85 5,76 20,79 0,09 4,26
12 1,68 7,41 1,37 0,74 6,42 17,99 0,64 3,46
13 2,43 7,14 1,22 0,90 7,07 19,11 0,87 3,25
14 3,27 7,04 1,32 0,00 5,19 20,17 0,48 1,62
15 4,45 7,16 1,47 0,00 8,67 15,76 1,08 1,88
16 5,79 7,11 1,47 0,00 10,45 17,87 1,87 2,32
17 7,13 7,28 1,59 0,00 12,40 14,00 1,79 1,72
18 9,32 7,18 1,83 0,00 13,36 9,64 1,03 1,45
19 11,16 7,16 1,73 0,00 16,97 10,40 1,09 1,30
20 13,01 7,07 1,94 0,00 19,12 8,94 0,91 1,39
21 14,86 7,14 1,91 0,00 21,61 9,82 1,06 1,27
22 17,04 7,26 1,86 0,00 21,41 7,38 0,91 1,13
23 18,72 7,73 1,96 0,00 28,04 7,84 0,62 1,43

205
Table M.13 (Continued)
24 20,57 7,13 1,86 0,00 25,20 4,04 0,42 0,96
25 22,33 7,07 1,76 0,00 28,10 2,69 0,26 0,60
26 24,01 6,91 1,80 0,00 23,41 3,43 0,10 0,74
27 25,69 6,96 1,69 0,00 27,22 3,71 0,51 0,65
28 27,28 6,93 1,79 0,00 29,25 3,62 0,48 0,85
29 28,71 7,07 1,84 0,00 27,22 3,32 0,44 0,51
30 30,13 7,03 1,78 0,00 24,74 2,88 0,00 0,47
31 31,48 7,58 1,87 0,00 22,52 2,59 0,36 0,45
32 32,82 7,05 1,81 0,00 21,95 2,65 0,31 0,34
33 34,25 7,10 1,77 0,00 22,75 2,53 0,36 0,49
34 35,09 7,41 1,90 0,00 23,20 3,65 0,39 0,30
35 36,18 7,01 1,76 0,00 20,42 3,44 0,47 0,26
36 37,35 6,67 1,73 0,00 25,29 4,57 0,55 0,44
37 38,53 7,19 1,82 0,00 22,06 3,46 0,37 0,33
38 39,62 6,99 2,07 0,00 22,85 3,28 0,57 0,00
39 40,63 6,93 1,85 0,00 24,18 4,29 0,31 0,37
40 41,38 6,88 1,75 0,00 21,45 4,10 0,60 0,32
41 42,31 7,00 1,76 0,00 22,56 5,23 0,71 0,48
42 42,98 7,20 1,72 0,00 21,96 4,65 0,59 0,45
43 43,65 7,03 1,82 0,00 22,19 3,03 0,54 0,36
44 44,57 7,33 1,64 0,00 21,27 5,53 0,74 0,42
45 45,24 7,07 1,79 0,00 17,93 4,90 0,80 0,37
46 45,66 7,25 1,78 0,00 21,75 7,03 1,23 0,80
47 46,08 7,07 1,69 0,00 20,86 6,92 1,55 0,55
48 46,84 7,32 1,83 0,00 19,62 5,90 1,24 0,81
49 47,34 7,06 1,92 0,00 20,15 7,03 0,86 0,67
50 48,10 7,05 1,88 0,00 22,34 8,48 1,17 0,67
51 48,85 7,46 1,85 0,00 20,16 5,75 1,14 0,77
52 49,86 7,48 1,90 0,00 23,55 6,92 2,41 0,69

206
Table M.13 (Continued)
53 50,36 7,39 1,87 0,00 19,55 4,14 1,30 0,79
54 50,62 7,38 1,74 0,00 20,79 8,01 1,74 0,67
55 51,20 6,96 1,76 0,00 19,54 7,56 1,87 0,64
56 51,79 7,37 1,72 0,00 16,32 5,60 1,21 0,64
57 52,46 7,35 1,66 0,00 17,68 8,33 2,31 0,54
58 53,22 7,34 2,05 0,00 19,18 6,37 1,96 0,81
59 53,72 7,70 1,87 0,00 18,54 7,58 1,08 0,65
60 53,89 7,25 1,86 0,07 17,28 8,35 2,01 0,70
61 54,31 7,33 1,88 0,00 18,51 8,24 1,24 0,81
62 54,73 7,63 1,36 0,00 17,97 8,69 1,92 0,75
63 55,06 7,26 1,91 0,00 17,82 9,92 1,91 0,83
64 55,32 7,40 1,80 0,00 17,84 9,50 1,33 0,56
65 55,65 7,45 1,97 0,00 18,75 10,32 1,91 0,81
66 56,07 7,47 1,97 0,29 16,00 9,72 1,50 0,77
67 56,32 7,66 1,84 0,00 16,05 9,83 1,72 0,69
68 56,66 7,49 1,88 0,00 15,01 10,07 2,28 0,79
69 56,99 7,44 1,92 0,00 17,03 12,97 2,20 0,61
70 57,25 7,54 1,98 0,00 14,59 11,85 2,99 1,09
71 57,50 7,56 1,93 0,73 18,96 16,58 4,36 0,87
72 57,83 7,72 1,94 0,00 18,14 15,96 3,84 0,89
73 58,09 7,30 2,06 0,00 15,85 10,94 2,24 0,94
74 58,34 7,87 2,14 0,00 16,14 11,84 1,50 1,13
75 58,59 7,86 2,06 0,00 16,21 10,77 1,94 0,79
76 58,96 7,68 2,02 0,00 14,94 12,18 2,33 0,80
77 59,38 7,80 2,09 0,00 15,44 12,66 2,21 0,75
78 59,46 7,47 1,89 0,00 15,62 3,23 1,85 0,78
79 59,73 7,94 1,98 0,00 13,91 9,36 1,86 0,71
80 60,05 7,45 2,17 0,00 16,45 13,32 2,23 0,64
81 60,43 7,90 2,12 0,00 16,24 13,32 2,32 0,80

207
Table M.13 (Continued)
82 60,55 7,81 2,23 0,00 16,94 14,29 2,85 0,80
83 60,81 8,24 1,93 0,00 16,58 13,02 2,05 0,63
84 61,23 7,77 2,14 0,00 12,17 10,32 3,07 0,69
85 61,65 7,87 2,05 0,00 15,85 14,63 3,18 0,70
86 61,88 7,99 2,14 0,00 15,01 11,68 2,71 0,80
87 62,26 8,91 1,94 0,00 17,19 13,92 3,17 0,72
88 62,68 7,80 2,12 0,00 14,90 16,87 3,97 1,03
89 63,18 8,52 2,29 0,00 16,93 16,19 3,49 0,76
90 63,47 8,29 2,21 0,00 14,93 14,20 2,87 0,61
91 63,73 7,70 2,13 0,00 14,20 12,18 2,96 0,68
92 63,94 7,58 2,22 0,00 17,79 19,48 4,98 0,83
93 64,02 7,44 2,15 0,00 18,08 19,01 3,19 0,62
94 64,36 8,04 2,32 0,00 1,55 15,85 2,94 0,81
95 64,52 7,64 1,99 0,00 16,71 15,99 3,16 0,73
96 64,86 7,91 1,79 0,67 13,13 13,33 3,87 0,69
97 64,94 7,84 1,88 0,00 15,76 18,91 3,77 0,66
98 65,01 7,70 1,60 0,00 17,60 18,10 1,84 1,05
99 65,01 7,62 1,68 0,00 18,97 17,68 3,38 0,96
100 65,11 7,54 1,70 0,00 16,21 20,88 6,55 0,72
101 65,30 7,96 1,90 0,00 14,11 14,01 2,30 0,72
102 65,51 7,87 1,88 0,00 16,76 18,17 2,20 0,69
103 65,71 7,87 1,79 0,00 16,44 15,90 2,89 0,53
104 65,92 7,81 1,78 0,84 11,53 13,06 3,07 0,64
105 66,17 8,13 1,67 0,00 16,06 19,40 3,63 0,73
106 66,21 8,06 1,85 0,00 19,42 22,48 3,26 0,91
107 66,21 7,86 1,78 0,00 19,33 24,93 4,03 0,73
108 66,34 7,85 1,82 0,00 16,54 20,98 2,85 0,96
109 66,34 8,03 1,87 0,00 17,65 19,76 3,07 0,85
110 66,34 7,46 1,81 0,00 15,12 18,81 3,61 0,62

208
Table M.13 (Continued)
111 66,34 7,40 1,99 0,00 19,76 21,87 3,62 1,35
112 66,38 8,47 1,69 0,00 20,03 25,85 4,77 0,89
113 66,48 6,81 1,73 0,00 19,32 25,35 4,21 1,00
114 66,48 6,77 1,61 0,00 18,03 19,61 3,92 1,00
115 66,48 6,58 1,74 0,00 18,11 22,61 4,40 0,81
116 66,82 8,40 1,33 1,00 14,83 18,00 3,76 0,74
117 66,95 6,20 1,25 0,00 17,01 22,87 3,85 0,73
118 66,95 6,28 1,16 0,00 16,15 21,55 2,57 0,79
119 66,95 6,24 1,09 0,00 15,13 17,33 2,52 0,79
120 66,95 6,25 1,18 0,00 16,44 22,32 3,29 0,68
121 67,10 6,50 1,12 0,00 15,63 17,12 2,64 0,75
122 67,12 6,29 1,66 0,00 19,92 26,49 5,02 0,86
123 67,12 6,36 0,79 0,00 17,55 24,10 4,06 0,87
124 67,12 6,17 0,84 0,00 17,10 19,08 3,71 0,96
125 67,12 7,34 1,40 0,00 17,15 23,18 4,63 0,76
126 67,30 7,52 1,65 0,00 13,53 14,40 2,73 0,62
127 67,50 7,36 1,97 0,00 18,15 20,49 4,26 0,89
128 67,50 7,32 1,74 0,00 18,04 26,84 4,70 0,75
129 67,67 7,18 1,54 0,00 12,22 13,65 2,08 0,61
130 67,67 6,77 1,57 0,00 11,03 15,13 2,26 0,42
131 67,67 6,60 1,55 0,00 15,78 17,95 3,01 0,70
132 67,67 6,57 1,37 0,74 14,28 22,74 4,46 0,43
133 67,72 6,36 1,71 0,00 14,77 22,70 3,44 0,59
134 67,72 6,35 1,44 0,00 16,33 20,13 4,40 0,71
135 67,72 6,23 1,45 0,00 12,57 19,33 4,63 0,43
136 67,89 6,24 1,35 1,22 15,34 19,02 2,95 1,12
137 67,97 6,33 1,17 0,00 16,54 20,76 5,06 0,37
138 68,06 6,61 1,31 0,00 16,06 19,92 3,99 0,62
139 68,14 6,25 1,19 0,00 16,08 21,72 3,91 0,70
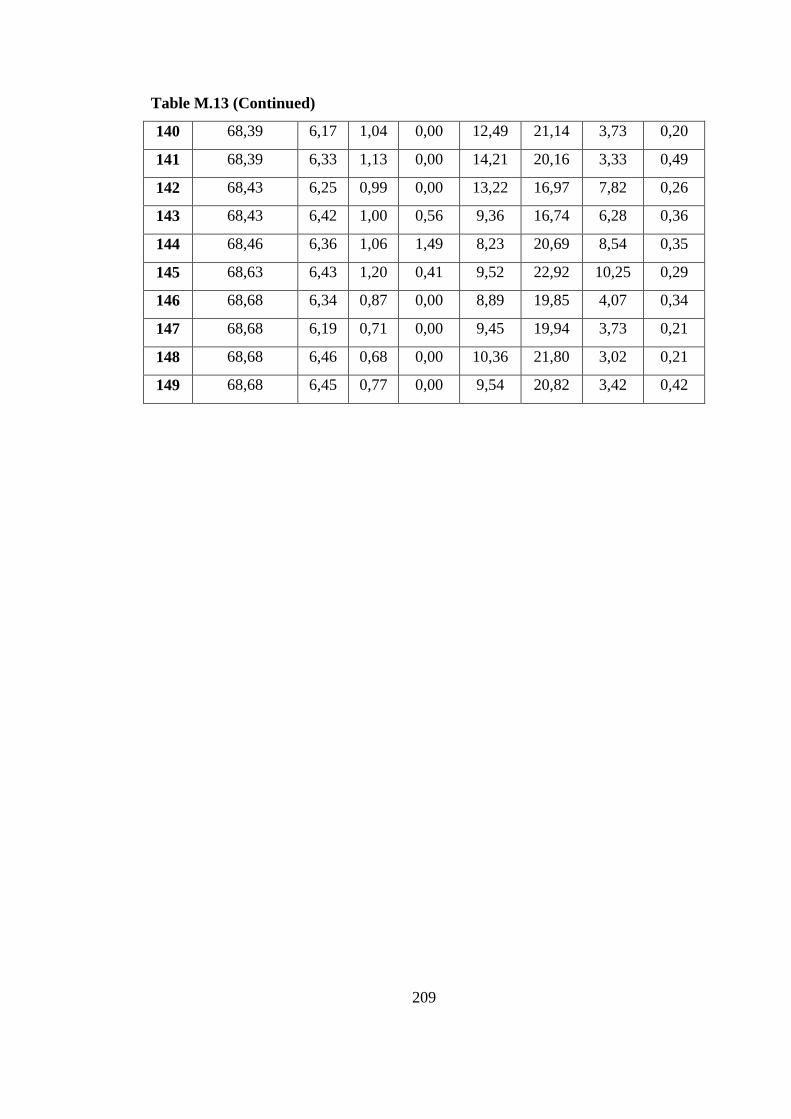
209
Table M.13 (Continued)
140 68,39 6,17 1,04 0,00 12,49 21,14 3,73 0,20
141 68,39 6,33 1,13 0,00 14,21 20,16 3,33 0,49
142 68,43 6,25 0,99 0,00 13,22 16,97 7,82 0,26
143 68,43 6,42 1,00 0,56 9,36 16,74 6,28 0,36
144 68,46 6,36 1,06 1,49 8,23 20,69 8,54 0,35
145 68,63 6,43 1,20 0,41 9,52 22,92 10,25 0,29
146 68,68 6,34 0,87 0,00 8,89 19,85 4,07 0,34
147 68,68 6,19 0,71 0,00 9,45 19,94 3,73 0,21
148 68,68 6,46 0,68 0,00 10,36 21,80 3,02 0,21
149 68,68 6,45 0,77 0,00 9,54 20,82 3,42 0,42