Hydrogen, nitrogen and syngas enriched diesel combustion · Hydrogen, nitrogen and syngas enriched...
178
Hydrogen, nitrogen and syngas enriched diesel combustion Fanos Christodoulou A dissertation submitted for the degree of Doctor of Philosophy School of Engineering and Design Brunel University United Kingdom London, July 2014
Transcript of Hydrogen, nitrogen and syngas enriched diesel combustion · Hydrogen, nitrogen and syngas enriched...

Hydrogen, nitrogen and syngas enriched
diesel combustion
Fanos Christodoulou
A dissertation submitted for the degree of
Doctor of Philosophy
School of Engineering and Design
Brunel University
United Kingdom
London, July 2014
2
Abstract
On-board hydrogen and syngas production is considered as a transition solution from
fossil fuel to hydrogen powered vehicles until problems associated with hydrogen
infrastructure, distribution and storage are resolved. A hydrogen- or syngas-rich stream,
which substitutes part of the main hydrocarbon fuel, can be produced by supplying diesel
fuel in a fuel-reforming reactor, integrated within the exhaust pipe of a diesel engine.
The primary aim of this project was to investigate the effects of intake air enrichment
with product gas on the performance, combustion and emissions of a diesel engine. The
novelty of this study was the utilisation of the dilution effect of the reformate, combined
with replacement of part of the hydrocarbon fuel in the engine cylinder by either hydrogen
or syngas.
The experiments were performed using a fully instrumented, prototype 2.0 litre Ford
HSDI diesel engine. The engine was tested in four different operating conditions,
representative for light- and medium-duty diesel engines. The product gas was simulated
by bottled gases, the composition of which resembled that of typical diesel reformer
product gas. In each operating condition, the percentage of the bottled gases and the start
of diesel injection were varied in order to find the optimum operating points.
The results showed that when the intake air was enriched with hydrogen, smoke and CO
emissions decreased at the expense of NOx. Supply of nitrogen-rich combustion air into
the engine resulted in a reduction in NOx emissions; nevertheless, this technique had a
detrimental effect on smoke and CO emissions. Under low-speed low-load operation,
enrichment of the intake air with a mixture of hydrogen and nitrogen led to simultaneous
reductions in NOx, smoke and CO emissions. Introduction of a mixture of syngas and
nitrogen into the engine resulted in simultaneous reductions in NOx and smoke emissions
over a wide range of the engine operating window. Admission of bottled gases into the
engine had a negative impact on brake thermal efficiency.
Although there are many papers in the literature dealing with the effects of intake air
enrichment with separate hydrogen, syngas and nitrogen, no studies were found examining
how a mixture composed of hydrogen and nitrogen or syngas and nitrogen would affect a
diesel engine. Apart from making a significant contribution to existing knowledge, it is

3
believed that this research work will benefit the development of an engine-reformer system
since the product gas is mainly composed of either a mixture of hydrogen and nitrogen or a
mixture of syngas and nitrogen.
4
Acknowledgements
Firstly, I would like to thank my PhD supervisor Professor Thanos Megaritis for his
invaluable support and guidance throughout this research work. I would also like to
acknowledge the contribution of my second supervisor, Professor Hua Zhao.
The financial support of the UK Engineering and Physical Science Research Council
(grant EP/H050248/1) is gratefully recognised.
Many thanks to the colleagues with whom I have shared the Engine Laboratory, but the
following deserve special mention: Dr. Mohammadreza Anbari Attar, Dr. Stephen
Hemmings, Dr. Yan Zhang, Mohammed Abahussain, Nehemiah Alozie and David Peirce.
Thanks are also due to the technical staff at Brunel University with particular thanks
going to Ken Anstiss, Clive Barrett and Andy Selway for their continual assistance in the
laboratory. The efficient ordering of laboratory equipment by the Chief Technician
Christopher Allan is also recognised.
Many thanks go to Paul Hughes from MKS for the technical support and quick resolve of
the FTIR issues, and Keith Hall of Hall Analytical Laboratories Ltd. for providing timely
on-site repairs of the Gas Chromatograph.
5
Contents
1 INTRODUCTION ....................................................................................................... 19
1.1 Introduction ........................................................................................................... 19
1.2 Aims and objectives .............................................................................................. 21
1.3 Outline of thesis .................................................................................................... 22
2 LITERATURE REVIEW ............................................................................................ 26
2.1 Regulated exhaust emissions from diesel combustion ......................................... 26
2.1.1 Nitrogen oxides ............................................................................................. 26
2.1.2 Particulate matter ........................................................................................... 28
2.1.3 Carbon monoxide .......................................................................................... 31
2.1.4 Total unburned hydrocarbons ........................................................................ 32
2.2 Legislation ............................................................................................................ 33
2.3 Exhaust gas aftertreatment .................................................................................... 35
2.3.1 Diesel oxidation catalyst ................................................................................ 35
2.3.2 Selective catalytic reduction .......................................................................... 35
2.3.3 NOX adsorber ................................................................................................. 36
2.3.4 Diesel particulate filter .................................................................................. 37
2.4 Diesel combustion ................................................................................................. 38
2.5 Alternative diesel combustion modes ................................................................... 40
2.5.1 Low temperature combustion ........................................................................ 41
2.5.2 Homogenous charge compression ignition ................................................... 42
2.5.3 Premixed charge compression ignition.......................................................... 43
2.5.4 Reactivity controlled compression ignition ................................................... 44
2.6 Injection parameters .............................................................................................. 45
2.6.1 Injection timing and pressure ........................................................................ 45
2.6.2 Multiple injection and rate shaping ............................................................... 47
6
2.7 Alternative fuels and dual fuel .............................................................................. 48
2.7.1 Hydrogen ....................................................................................................... 48
2.7.2 Syngas ............................................................................................................ 50
2.7.3 Liquefied petroleum gas ................................................................................ 51
2.7.4 Compressed natural gas ................................................................................. 52
2.7.5 Biodiesel ........................................................................................................ 53
2.8 Exhaust gas assisted fuel reforming ...................................................................... 54
2.9 Dilution of the intake air ....................................................................................... 56
2.9.1 Nitrogen-rich intake air ................................................................................. 56
2.9.2 Exhaust gas recirculation ............................................................................... 57
2.10 Summary ........................................................................................................... 59
3 EXPERIMENTAL FACILITIES, TEST PROCEDURE AND DATA ANALYSIS . 60
3.1 Introduction ........................................................................................................... 60
3.2 Research engine .................................................................................................... 60
3.3 Dynamometer ........................................................................................................ 62
3.4 Intake setup and instrumentation .......................................................................... 63
3.5 Diesel fuel supply and measurement .................................................................... 65
3.6 Exhaust gas analysis ............................................................................................. 66
3.6.1 Non-dispersive infrared ................................................................................. 67
3.6.2 Chemiluminescence ....................................................................................... 67
3.6.3 Flame ionisation detector .............................................................................. 68
3.6.4 Gas chromatography ...................................................................................... 69
3.6.5 Fourier transform infrared spectroscopy ....................................................... 70
3.6.6 Bosch smoke number .................................................................................... 71
3.7 In-cylinder pressure data ....................................................................................... 71
3.8 Fuel properties ...................................................................................................... 73

7
3.9 Data analysis ......................................................................................................... 76
3.9.1 In-cylinder volume ........................................................................................ 76
3.9.2 Apparent and cumulative rate of heat release ................................................ 77
3.9.3 Mass fraction burned ..................................................................................... 78
3.9.4 Coefficient of variation in indicated mean effective pressure ....................... 78
3.9.5 Brake thermal efficiency ............................................................................... 79
3.9.6 Energy supplied by hydrogen ........................................................................ 79
3.9.7 Combustion efficiency of hydrogen .............................................................. 80
3.9.8 Bottled gas flow rate ...................................................................................... 80
3.10 Test procedure ................................................................................................... 80
4 ENRICHMENT OF THE INTAKE AIR WITH HYDROGEN ................................. 83
4.1 Introduction ........................................................................................................... 83
4.2 Methodology ......................................................................................................... 84
4.3 Results and discussion .......................................................................................... 85
4.3.1 Effect of hydrogen-rich intake air on NOx-smoke trade-off .......................... 86
4.3.2 Effect of hydrogen-rich intake air on CO emissions ..................................... 90
4.3.3 Effect of hydrogen-rich intake air on unburned hydrocarbon emissions ...... 92
4.3.4 Hydrogen combustion efficiency .................................................................. 94
4.3.5 Effect of hydrogen-rich intake air on brake thermal efficiency .................... 97
4.4 Summary ............................................................................................................... 98
5 ENRICHMENT OF THE INTAKE AIR WITH NITROGEN ................................. 100
5.1 Introduction ......................................................................................................... 100
5.2 Methodology ....................................................................................................... 100
5.3 Results and discussion ........................................................................................ 102
5.3.1 Effect of nitrogen-rich intake air on NOx-smoke trade-off ......................... 102
5.3.2 Effect of nitrogen-rich intake air on CO emissions ..................................... 104
8
5.3.3 Effect of nitrogen-rich intake air on the maximum in-cylinder pressure .... 106
5.3.4 Effect of nitrogen-rich intake air on ignition delay ..................................... 108
5.3.5 Effect of nitrogen-rich intake air on brake thermal efficiency .................... 110
5.4 Summary ............................................................................................................. 112
6 ENRICHMENT OF THE INTAKE AIR WITH SIMULTANEOUS HYDROGEN
AND NITROGEN ..................................................................................................... 114
6.1 Introduction ......................................................................................................... 114
6.2 Methodology ....................................................................................................... 116
6.3 Hydrogen and nitrogen enrichment .................................................................... 116
6.4 Results and discussion ........................................................................................ 117
6.4.1 Effect of hydrogen- and nitrogen-rich intake air on the NOx-smoke trade-off .
..................................................................................................................... 118
6.4.2 Combustion analysis .................................................................................... 121
6.4.3 Effect of hydrogen- and nitrogen-rich intake air on nitric oxide and nitrogen
dioxide ..................................................................................................................... 125
6.4.4 Effect of hydrogen- and nitrogen-rich intake air on nitrous oxide .............. 126
6.4.5 Effect of hydrogen- and nitrogen-rich intake air on ammonia emissions ... 127
6.4.6 Effect of hydrogen- and nitrogen-rich intake air on CO emissions ............. 128
6.4.7 Effect of hydrogen- and nitrogen-rich intake air on brake thermal efficiency ..
..................................................................................................................... 130
6.5 Summary ............................................................................................................. 131
7 ENRICHMENT OF THE INTAKE AIR WITH A MIXTURE OF SYNGAS AND
NITROGEN ............................................................................................................... 133
7.1 Introduction ......................................................................................................... 133
7.2 Methodology ....................................................................................................... 135
7.3 Results and discussion ........................................................................................ 137

9
7.3.1 Effect of intake air enrichment with a mixture of syngas + N2 on the NOx-
smoke trade-off .......................................................................................................... 138
7.3.2 Effect of intake air enrichment with a mixture of syngas + N2 on the carbon
monoxide, carbon monoxide utilisation and carbon dioxide emissions .................... 143
7.3.3 Combustion analysis .................................................................................... 147
7.3.4 Effect of intake air enrichment with a mixture of syngas + N2 on the brake
thermal efficiency ...................................................................................................... 149
7.4 Summary ............................................................................................................. 150
8 CONCLUSIONS AND RECOMMENDATIONS FOR FUTURE WORK ............. 152
8.1 Conclusions ......................................................................................................... 152
8.1.1 Enrichment of the intake air with hydrogen ................................................ 152
8.1.2 Enrichment of the intake air with nitrogen .................................................. 153
8.1.3 Enrichment of the intake air with simultaneous hydrogen and nitrogen ..... 153
8.1.4 Enrichment of the intake air with a mixture of syngas and nitrogen ........... 155
8.2 Significance of this work .................................................................................... 156
8.3 Recommendations for future work ..................................................................... 157
9 A. EXPERIMENTAL APPARATUS ....................................................................... 158
REFERENCES .................................................................................................................. 161

10
List of figures
Figure 1.1: Enrichment of the intake air with hydrogen. (a) The hydrogen is stored on-
board, (b) the hydrogen is generated on-board using a fuel reforming reactor. ................ 23
Figure 1.2: Increase in nitrogen concentration in the intake air by, (a) employing an air
separation membrane, (b) integrating a fuel reformer within the EGR loop. ................... 24
Figure 1.3: Simultaneous enrichment of the intake air with H2 + N2 through, (a)
combination of an air separation membrane and on-board hydrogen reservoir, and (b)
integration of a fuel reformer into the EGR loop. ............................................................. 24
Figure 1.4: Simultaneous enrichment of the intake air with syngas + N2 using a diesel
reformer integrated within the EGR loop. ......................................................................... 25
Figure 2.1: Schematic representation of diesel particulate matter. ...................................... 28
Figure 2.2: Calculated φ-T map for soot and NO formation for n-hexane. ......................... 30
Figure 2.3: European Union Particulate matter emission standards. ................................... 34
Figure 2.4: European Union NOx emission standards. ........................................................ 34
Figure 2.5: Selective catalytic reduction system. ................................................................ 36
Figure 2.6: Function of the diesel particulate filter. ............................................................ 37
Figure 2.7: Schematic of Dec’s conceptual diesel combustion model during the quasi-
steady period of diesel combustion ................................................................................... 38
Figure 2.8: Defined phases of diesel combustion ................................................................ 39
Figure 2.9: Equivalence ratio-temperature diagram of different combustion concepts. ..... 42
Figure 2.10: Multiple injections and injection rate shaping for future diesel engine .......... 47
Figure 2.11: Schematic representation of the proposed engine-REGR-SCR system. ......... 55
Figure 2.12: Poola’s prototype membrane module ............................................................. 57
Figure 2.13: Schematic representation of EGR system ....................................................... 58
Figure 3.1: Piston bowl design. ........................................................................................... 61
Figure 3.2: Schematic representation of the experimental setup. ........................................ 61
Figure 3.3: Cutaway of the eddy current dynamometer. ..................................................... 62
Figure 3.4: Schematic representation of the NDIR principle. ............................................. 67
Figure 3.5: Schematic representation of a chemiluminescence detector ............................. 68
Figure 3.6: Schematic representation of flame ionisation ................................................... 68
Figure 3.7: Structure of thermal conductivity detector ....................................................... 69

11
Figure 3.8: Gas chromatograph calibration: (a) Chromatograph area at different H2
fractions, (b) Sample of chromatographic results delivered by the detector. .................... 70
Figure 3.9: Exhaust sampling schematic ............................................................................. 71
Figure 3.10: Cylinder head cross section with the pressure transducer and the TDC sensor.
........................................................................................................................................... 72
Figure 3.11: Kistler 2629C1 top dead centre sensor. .......................................................... 72
Figure 3.12: Schematic representation of piston – connecting rod – crankshaft. ................ 76
Figure 4.1: Detailed schematic representation of hydrogen supply into the intake pipe..... 84
Figure 4.2: Diagram of the energy supplied by hydrogen. .................................................. 85
Figure 4.3: Effect of intake air enrichment with hydrogen on the trade-off between NOx
and smoke. Engine speed: 1500 rpm, load: (a) 2.5 bar BMEP, (b) 5 bar BMEP. ........... 87
Figure 4.4: Effect of intake air enrichment with hydrogen on the trade-off between NOx
and smoke. Engine speed: 2500 rpm, load: (a) 2.5 bar BMEP, (b) 5 bar BMEP. ............ 88
Figure 4.5: Effect of intake air enrichment with hydrogen on the pressure and heat release
rate. Engine conditions: speed 1500 rpm, load (a) 2.5 and (b) 5 bar BMEP, hydrogen
concentration 4% vol., SOI 9 CAD BTDC. ...................................................................... 89
Figure 4.6: Effect of intake air enrichment with hydrogen on the CO emissions. Engine
speed: 1500 rpm, load: (a) 2.5 bar BMEP, (b) 5 bar BMEP. ............................................ 90
Figure 4.7: Effect of intake air enrichment with hydrogen on the CO emissions. Engine
speed: 2500 rpm, load: (a) 2.5 bar BMEP, (b) 5 bar BMEP. ............................................ 91
Figure 4.8: Effect of intake air enrichment with hydrogen on the unburned hydrocarbons.
Engine speed: 1500 rpm, load: (a) 2.5 bar BMEP, (b) 5 bar BMEP. ................................ 92
Figure 4.9: Effect of intake air enrichment with hydrogen on the unburned hydrocarbons.
Engine speed: 2500 rpm, load: (a) 2.5 bar BMEP, (b) 5 bar BMEP. ................................ 93
Figure 4.10: Hydrogen combustion efficiency. Engine speed: 1500 rpm, load: (a) 2.5 bar
BMEP, (b) 5 bar BMEP. ................................................................................................... 95
Figure 4.11: Hydrogen combustion efficiency. Engine speed: 2500 rpm, load: (a) 2.5 bar
BMEP, (b) 5 bar BMEP. ................................................................................................... 96
Figure 4.12: Brake thermal efficiency. Engine speed: 1500 rpm, load: (a) 2.5 bar BMEP,
(b) 5 bar BMEP, SOI 9 CAD BTDC. ................................................................................ 97
Figure 4.13: Brake thermal efficiency. Engine speed: 2500 rpm, load: (a) 2.5 bar BMEP,
(b) 5 bar BMEP, SOI 9 CAD BTDC. ................................................................................ 98
12
Figure 5.1: Detailed schematic representation of N2 supply into the intake pipe. ............ 101
Figure 5.2: Effect of nitrogen-rich intake air on the trade-off between NOx and smoke.
Engine speed: 1500 rpm, load: (a) 2.5 bar BMEP, (b) 5 bar BMEP. .............................. 103
Figure 5.3: Effect of nitrogen-rich intake air on the trade-off between NOx and smoke.
Engine speed: 2500 rpm, load: (a) 2.5 bar BMEP, (b) 5 bar BMEP. .............................. 104
Figure 5.4: Effect of nitrogen-rich intake air on the CO emissions. Engine speed: 1500
rpm, load: (a) 2.5 bar BMEP, (b) 5 bar BMEP. .............................................................. 105
Figure 5.5: Effect of nitrogen-rich intake air on the CO emissions. Engine speed: 2500
rpm, load: (a) 2.5 bar BMEP, (b) 5 bar BMEP. .............................................................. 106
Figure 5.6: Effect of nitrogen-rich intake air on the maximum in-cylinder pressure. Engine
speed: 1500 rpm, load: (a) 2.5 bar BMEP, (b) 5 bar BMEP. .......................................... 107
Figure 5.7: Effect of nitrogen-rich intake air on the maximum in-cylinder pressure. Engine
speed: 2500 rpm, load: (a) 2.5 bar BMEP, (b) 5 bar BMEP. .......................................... 107
Figure 5.8: Effect of nitrogen-rich intake air on the ignition delay. Engine speed: 1500
rpm, load: (a) 2.5 bar BMEP, (b) 5 bar BMEP. .............................................................. 109
Figure 5.9: Effect of nitrogen-rich intake air on the ignition delay. Engine speed: 2500
rpm, load: (a) 2.5 bar BMEP, (b) 5 bar BMEP. .............................................................. 110
Figure 5.10: Effect of nitrogen-rich intake air on the brake thermal efficiency. Engine
speed: 1500 rpm, load: (a) 2.5 bar BMEP, (b) 5 bar BMEP. .......................................... 111
Figure 5.11: Effect of nitrogen-rich intake air on the brake thermal efficiency. Engine
speed: 2500 rpm, load: (a) 2.5 bar BMEP, (b) 5 bar BMEP. .......................................... 111
Figure 6.1: Detailed schematic representation of simultaneous hydrogen and nitrogen
supply into the intake pipe. ............................................................................................. 116
Figure 6.2: Effect of simultaneous H2 + N2 enrichment on the NOx-BSN trade off. Engine
speed 1500 rpm, load: (a) 2.5 bar BMEP, (b) 5 bar BMEP. ........................................... 119
Figure 6.3: Effect of simultaneous H2 + N2 enrichment on the NOx-BSN trade off. Engine
speed 2500 rpm, load: (a) 2.5 bar BMEP, (b) 5 bar BMEP. ........................................... 120
Figure 6.4: Effect of simultaneous H2 + N2 enrichment on the in-cylinder pressure and rate
of heat release: (a) 1500 rpm, 2.5 bar BMEP; (b) 1500 rpm, 5 bar BMEP; (c) 2500 rpm, 5
bar BMEP. ....................................................................................................................... 122
Figure 6.5: Comparison of mass fraction burned at different amounts of H2: (a) 1500 rpm,
2.5 bar BMEP; (b) 1500 rpm, 5 bar BMEP; (c) 2500 rpm, 5 bar BMEP. ....................... 123

13
Figure 6.6: Premixed burn fraction as a function of ignition delay. .................................. 124
Figure 6.7: Comparison of the in-cylinder pressure data. Engine speed: 1500 rpm, load: 5
bar BMEP, SOI: 12 and 9 CAD BTDC, H2+N2 vol. fraction 16%. ................................ 124
Figure 6.8: NO-NO2 fraction. Engine speed 1500 rpm, load 2.5 bar BMEP. ................... 126
Figure 6.9: NO-NO2 fraction. Engine speed 2500 rpm, load 5 bar BMEP. ...................... 126
Figure 6.10: N2O emissions. Engine speed 1500 rpm, load 2.5 bar BMEP. ..................... 127
Figure 6.11: Ammonia emissions. Engine speed 1500 rpm, load 2.5 bar BMEP. ............ 127
Figure 6.12: Effect of simultaneous H2 + N2 enrichment on the CO emissions. Engine
speed: 1500 rpm, load: (a) 2.5 bar BMEP, (b) 5 bar BMEP. .......................................... 128
Figure 6.13: Effect of simultaneous H2 + N2 enrichment on the CO emissions. Engine
speed: 2500 rpm, load: (a) 2.5 bar BMEP, (b) 5 bar BMEP. .......................................... 129
Figure 6.14: Effect of simultaneous H2 + N2 enrichment on the brake thermal efficiency.
Engine speed 1500 rpm, load 2.5 and 5 bar BMEP, SOI 6 CAD BTDC. ....................... 130
Figure 6.15: Effect of simultaneous H2 + N2 enrichment on the brake thermal efficiency.
Engine speed 2500 rpm, load 2.5 and 5 bar BMEP, SOI 6 CAD BTDC. ....................... 131
Figure 7.1: Schematic representation of intake charge composition. ................................ 137
Figure 7.2: Detailed schematic representation of the syngas and nitrogen lines. .............. 137
Figure 7.3: Effect of intake air enrichment with a mixture of syngas + N2 on the NOx-BSN
trade-off. Engine speed: 1500 rpm, load: (a) 2.5 bar BMEP, (b) 5 bar BMEP. .............. 139
Figure 7.4: Effect of intake air enrichment with a mixture of syngas + N2 on the NOx-BSN
trade-off. Engine speed: 2500 rpm, load: (a) 2.5 bar BMEP, (b) 5 bar BMEP. .............. 140
Figure 7.5: Effect of intake air enrichment with a mixture of H2 + CO on the NOx-BSN
trade-off. Engine speed 2500 rpm, load 5 bar BMEP. .................................................... 141
Figure 7.6: Effect of lambda coefficient on the BSN, NOx and CO. Engine speed: 1500
rpm, SOI: 3 CAD BTDC, load: (a) 2.5 bar BMEP, (b) 5 bar BMEP. ............................. 142
Figure 7.7: Effect of lambda coefficient on the BSN, NOx and CO. Engine speed: 2500
rpm, SOI: 3 CAD BTDC, load: (a) 2.5 bar BMEP, (b) 5 bar BMEP. ............................. 142
Figure 7.8: Effect of the intake air enrichment with a mixture of syngas + N2 on the CO
emissions. Engine speed: 1500 rpm, load: (a) 2.5 bar BMEP, (b) 5 bar BMEP. Inset is the
estimated CO utilisation. ................................................................................................. 144
14
Figure 7.9: Effect of the intake air enrichment with a mixture of syngas + N2 on the CO
emissions. Engine speed: 2500rpm, load: (a) 2.5 bar BMEP, (b) 5 bar BMEP. Inset is the
estimated CO utilisation. ................................................................................................. 145
Figure 7.10: Effect of syngas + N2 on the carbon dioxide emissions. (a) 1500 rpm 2.5 and
5 bar BMEP, (b) 2500 rpm 2.5 and 5 bar BMEP. SOI 3 CAD BTDC. .......................... 146
Figure 7.11: Mass fraction burned, maximum pressure rise rate and maximum pressure
Engine speed 1500 rpm, load 2.5 bar BMEP, SOI 3 CAD BTDC. ................................ 147
Figure 7.12: Mass fraction burned, maximum pressure rise rate and maximum pressure
Engine speed 2500 rpm, load 5 bar BMEP, SOI 3 CAD BTDC. ................................... 148
Figure 7.13: Effect of intake air enrichment with syngas + N2 on brake thermal efficiency.
Engine speed: 1500 rpm, load: 2.5 and 5 bar BMEP, SOI: 3 CAD BTDC. ................... 149
Figure 7.14: Effect of intake air enrichment with syngas + N2 on the brake thermal
efficiency. Engine speed: 2500 rpm, load: 2.5 and 5 bar BMEP, SOI: 3 CAD BTDC. . 150
Figure A.1: Ford Puma 2.0 litre HSDI diesel engine. ....................................................... 158
Figure A.2: Encoder Technology ET758 heavy-duty shaft encoder. ................................ 158
Figure A.3: Sampling point of the smoke meter, FTIR and Horiba. ................................. 159
Figure A.4: E+H Promass 83 Coriolis flow meter. ........................................................... 159
Figure A.5: Kistler pressure transducer and glow plug adapter ........................................ 159
Figure A.6: Hamilton gastight syringe .............................................................................. 160
Figure A.7: Kistler 2629C1 TDC sensor with adapter. ..................................................... 160
Figure A.8: Dummy glow plug ......................................................................................... 160

15
List of tables
Table 2.1: Symptomatology and CO exposure .................................................................... 32
Table 3.1: Engine specifications. ......................................................................................... 60
Table 3.2: Measuring equipment used along the engine intake. ......................................... 63
Table 3.3: Intake charge composition as a function of the amount of the bottled gases. .... 64
Table 3.4: Measuring equipment used along the diesel line. ............................................... 65
Table 3.5: Exhaust gas measuring equipment employed throughout the experiments. ...... 66
Table 3.6: Measuring equipment that was used to record the in-cylinder pressure data. .... 72
Table 3.7: Hydrogen and syngas properties. ....................................................................... 73
Table 3.8: Diesel fuel properties.......................................................................................... 75
Table 3.9: Test matrix with the parameters varied. ............................................................. 81
Table 4.1: Tabulated energy supplied by hydrogen. ........................................................... 85
Table 5.1: Concentration of oxygen in the intake air as a function of the bottled nitrogen.
......................................................................................................................................... 101
Table 6.1: Intake charge composition................................................................................ 117
Table 7.1: Gaseous fuel concentration, mass flow rate and energy ratio. ......................... 136
Table 7.2: Intake charge composition................................................................................ 136
Table 7.3: Standard deviation of NOx emissions and BSN. Engine speed 1500 rpm, load
2.5 and 5 bar BMEP, syngas + N2 concentration 8%. ..................................................... 138
Table 7.4: Standard deviation of NOx emissions and BSN. Engine speed 2500 rpm, load
2.5 and 5 bar BMEP, syngas + N2 concentration 8%. ..................................................... 139
16
List of abbreviations
AHRR Apparent heat release rate
Al2O3 Aluminium oxide
Ba Barium
BITDC Before injection top dead centre
BOC British oxygen company
BSFC Brake specific fuel consumption
BSN Bosch smoke number
Ca Calcium
CA 10, 50, 90 The crank angle at which 10, 50 and 90 % of fuel mass has been burned
CAD ATDC Crank angle degrees after top dead centre
CAD BTDC Crank angle degrees before top dead centre
CDC
CI
Conventional diesel combustion
Compression ignition
CNG Compressed natural gas
CO Carbon monoxide
CO2 Carbon dioxide
COHb Carboxyhaemoglobin
COV Coefficient of variation
COx Carbon oxide
CR Compression ratio
DEF Diesel exhaust fluid
deg. CA Degrees crank angle
DI Direct injection
DME Dimethyl ether
DOC Diesel oxidation catalyst
DPF Diesel particulate filter
ECU Engine control unit
EGR Exhaust gas recirculation
EOC End of combustion
EPA Environmental protection agency
FID Flame ionisation detector

17
FTIR Fourier transform infrared spectroscopy
GC Gas chromatography
GHG Greenhouse gas
H2 Hydrogen
H2 + N2 Mixture of hydrogen and nitrogen
H2O Water
H2SO4 Sulphuric acid
HC Hydrocarbons
HCCI Homogenous charge compression ignition
He Helium
HO2 Hydroperoxyl
HSDI High speed direct injection
HV Heating value
ICE Internal combustion engine
ID Ignition delay
IMEP Indicated mean effective pressure
K Potassium
LFL Lower flammability limit
LPG Liquefied petroleum gas
LTC Low temperature combustion
MFB Mass fraction burned
N2 Nitrogen
Na Sodium
NA Naturally aspirated
NDIR Non-dispersive infrared
NEDC New European Driving Cycle
NH3 Ammonia
NMHC Non-methane hydrocarbons
NO Nitric oxide
NO2 Nitrogen dioxide
NOx Nitrogen oxide
O2 Oxygen
18
O3 Ozone
OH Hydroxyl
PAH Polycyclic aromatic hydrocarbons
PCCI Premixed charge compression ignition
PGMs Platinum group metals
PM Particulate matter
Pt Platinum
RCCI Reactivity controlled compression ignition
REGR Reformed EGR
ROHR Rate of heat release
RPM Revolutions per minute
SCR Selective catalytic reduction
SOC Start of combustion
SOF Soluble organic fraction
SOI Start of injection
SOL Solid fraction
STDV Standard deviation
Syngas + N2 Mixture of syngas and nitrogen
TCD Thermal conductivity detector
TDC Top dead centre
THC Total hydrocarbons
UFL Upper flammability limit
UHC Unburned hydrocarbon
ULSD Ultra-low sulphur diesel

Chapter 1: Introduction
19
1 CHAPTER 1
INTRODUCTION
1.1 Introduction
The diesel engine was developed in the late nineteenth century by Rudolf Diesel, who
patented the first diesel engine in 1892, while the first successful engine was operated in
1897. Thermal efficiency, although remarkably high at that time, was only 26% compared
to the near 40% attained by modern diesel engines. Due to their large size and weight, the
early diesel engines were produced mainly for industrial and marine applications.
Subsequent improvements allowed diesel engines to be used for powering road vehicles,
and they became very popular especially on trucks and heavy duty vehicles. Nowadays,
cars equipped with diesel engines are gaining popularity and currently approximately 50%
of all new car sales in EU are diesel [1].
In developed countries, the transport sector accounts for 35% of all energy consumption
[2]. Energy conservation and emissions control have long been under the spotlight as fossil
fuel depletion, environmental and human health issues have come to the forefront.
According to Ehsani et al. [3], if current trends of oil discovery and consumption continue,
it is expected that the fossil fuels will last until approximately 2038. It is also expected that
the increase in the world’s population from 6 to 10 billion will induce a parallel growth in
vehicles from 700 million to 2.5 billion [4]. Incremental improvement in fuel consumption
and pollutant emissions has been set as a short-term goal, while the long-term goal
involves innovative methods that will promote the transition to alternative-renewable fuels.
The combination of engine technologies such as exhaust gas recirculation (EGR),
improved fuel systems, optimised design of the combustion chamber and alternative
combustion modes, with exhaust aftertreatment methods, including the diesel oxidation
catalyst (DOC), selective catalytic reduction system (SCR) and diesel particulate filter
(DPF), is considered a potential solution to the emissions issue. The fuel consumption of
diesel engines has been considerably improved by the introduction of the common rail
system, which enables a finer fuel atomization and as a result increased combustion
efficiency.

Chapter 1: Introduction
20
Petroleum-based transportation is well-established offering a wide range of benefits;
however, a transition towards renewable fuels is essential in order to eliminate the
disadvantages of using fossil fuels. Hydrogen (H2) can be used to fuel internal combustion
engines and is considered renewable when it is produced via a renewable process. Progress
towards hydrogen fuelled transportation has been picking up pace since the late 1990s.
Nevertheless, transition solutions such as dual fuelling, fuel blending and on-board
gaseous fuel production are required, prior to the adoption of hydrogen as a transportation
fuel.
Hydrogen has long been seen as a future energy carrier as its chemical compounds
constitute a large part of the Earth’s surface. A variety of primary resources including
fossil fuel, solar, wind, hydro and nuclear power can be used for its production [5]. The
combustion of hydrogen in internal combustion engines (ICEs) produces water (H2O),
nitrogen oxides (NOx) and marginal levels of carbon oxides (COx) and hydrocarbons (HC).
The final two chemical compounds originate from the burning of the lubricating oil [6].
Besides, NOx production can be significantly reduced by operating the engine with a very
lean air-hydrogen mixture. This way the combustion temperature is likely to remain in the
zone of slow NOx formation rate.
In automotive applications, hydrogen can be used as fuel for both Otto and Diesel
engines. In an engine using the former cycle, the air-hydrogen mixture can easily be
ignited by the spark plug since the minimum ignition energy of hydrogen is an order of
magnitude lower than gasoline. When hydrogen is introduced in a diesel engine, the onset
of combustion is achieved by a pilot diesel injection as the autoignition temperature of
hydrogen is not reached in convention diesel engines. After many years of intensive
research, it is now possible to develop engines fuelled by hydrogen; nevertheless,
challenges associated with on-board hydrogen storage still exist.
On-board hydrogen production is deemed as a transition solution until the issues
associated with hydrogen distribution and on-board storage are resolved. Realisation of on-
board hydrogen production is achieved via the integration of a catalytic fuel reforming
reactor into the EGR loop. A hydrogen-rich gas is generated by direct catalytic interaction
of a hydrocarbon fuel with the high temperature exhaust gases expelled from the engine.
Chapter 1: Introduction
21
The reforming products can be used as a supplement to the engine main fuel by sending
them back to the cylinder.
The main flammable gas produced from the fuel reforming process is either hydrogen
or a mixture of hydrogen and carbon monoxide (syngas). The fuel reformer can be tuned
accordingly in order to promote the desirable chemical reactions, which include diesel fuel
steam reforming, water gas-shift, diesel fuel partial oxidation, diesel fuel complete
oxidation, dry reforming reaction, autothermal reforming and hydrocarbon thermal
decomposition. Recirculation of the product gas back into the intake air results in an
increase in nitrogen (N2) to oxygen (O2) ratio, since an amount of oxygen is replaced by
the nitrogen-rich reformed exhaust gases.
1.2 Aims and objectives
The aims of this dissertation were to investigate the effects of intake air enrichment with
hydrogen, nitrogen, simultaneous hydrogen and nitrogen (H2 + N2) and simultaneous
syngas and nitrogen (syngas + N2) on the performance, emissions and combustion of an
HSDI diesel engine. In real world applications, the aforementioned gases can either be
stored or produced on board. In this research effort the gases were stored in bottles, which
were placed close to the engine.
The first series of experiments was performed using separate hydrogen and nitrogen in
order to understand the impact of the two distinct gases on the performance, emissions and
combustion of the engine. In the second series of experiments, a mixture of H2 + N2 was
used, while in the third series of experiments, the hydrogen was replaced by syngas. A
more detailed explanation on the selection of the gases is given in Section 1.3. At this
point, the main objectives of this study are presented:
Demonstrate how the engine operating conditions affect the combustion,
performance and emissions when bottled gases are introduced into the engine. It
should be mentioned that the conditions selected (speed and load) were
representative for light- and medium-duty diesel engines. Variations in injection
timing and gas concentration were included in each operating condition.
Study whether diesel combustion enriched with H2 + N2 can offer simultaneous
reductions in NOx, smoke and CO emissions.
Chapter 1: Introduction
22
Calculate the combustion efficiency of the bottled carbon monoxide and hydrogen
delivered into the engine in the different engine operating conditions and gas
concentrations.
Isolate the distinct gases (i.e. hydrogen, carbon monoxide and nitrogen) contained
in the product gas to identify the effects on the combustion and emissions of the
engine.
Investigate whether the product gas-diesel mixture affects the combustion noise by
comparing the pressure rise rate values.
Investigate whether an increase in nitrogen to oxygen ratio in the intake charge
affects the performance, emissions and combustion of a diesel engine. This was
done by replacing an amount of the intake air with bottled nitrogen.
Demonstrate the capability of the product gas to offer simultaneous reductions in
NOx and smoke emissions over a wide range of the engine operating conditions.
1.3 Outline of thesis
Following this introductory chapter the rest of the thesis is organised as follows:
Chapter 2 - Literature review
This chapter provides a review of emission formation in diesel engines. It also presents the
European Union emission standards and the aftertreatment systems currently being used
for the reduction of exhaust emissions. In addition, it provides an overview of the
alternative diesel combustion modes and the injection parameters. The findings from using
alternative fuels, dual fuel techniques and intake charge dilution methods in diesel engines
are also discussed. Finally, the exhaust gas assisted fuel reforming technique is reviewed.
Chapter 3 - Experimental facilities, test procedure and data analysis
Chapter 3 provides a description of the experimental facilities, the measuring equipment
employed throughout the experiments, the test procedure and the data analysis process.
Moreover, the selection of the operating conditions, along with the parameters varied, is
justified.
Chapter 1: Introduction
23
Chapter 4 - Enrichment of the intake air with hydrogen
The effects of the intake air enrichment with hydrogen on the performance, combustion
and emissions of a diesel engine are presented in Chapter 4. The results obtained include
NOx, Bosch smoke number (BSN), carbon monoxide (CO) and total hydrocarbons (THC)
as well as the brake thermal efficiency, the hydrogen combustion efficiency and a heat
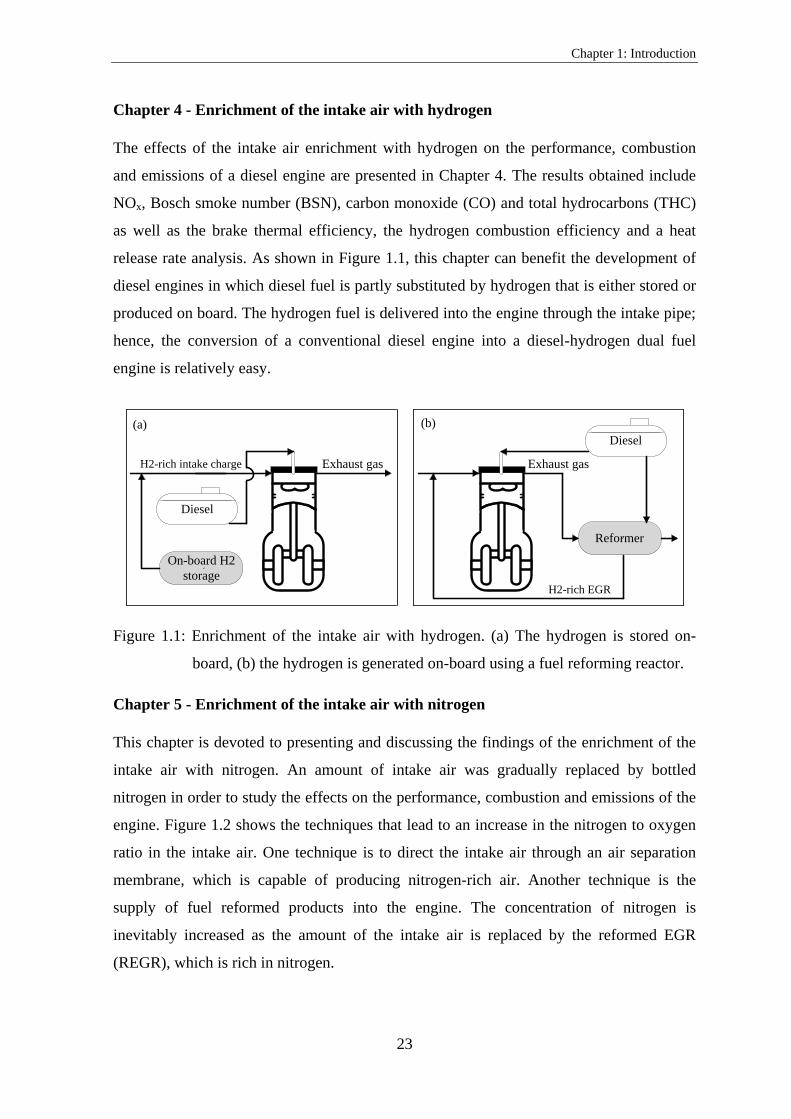
release rate analysis. As shown in Figure 1.1, this chapter can benefit the development of
diesel engines in which diesel fuel is partly substituted by hydrogen that is either stored or
produced on board. The hydrogen fuel is delivered into the engine through the intake pipe;
hence, the conversion of a conventional diesel engine into a diesel-hydrogen dual fuel
engine is relatively easy.
`
Diesel
Exhaust gas
On-board H2
storage
`
Diesel
Exhaust gas
H2-rich EGR
Reformer
H2-rich intake charge
(a) (b)
Figure 1.1: Enrichment of the intake air with hydrogen. (a) The hydrogen is stored on-
board, (b) the hydrogen is generated on-board using a fuel reforming reactor.
Chapter 5 - Enrichment of the intake air with nitrogen
This chapter is devoted to presenting and discussing the findings of the enrichment of the
intake air with nitrogen. An amount of intake air was gradually replaced by bottled
nitrogen in order to study the effects on the performance, combustion and emissions of the
engine. Figure 1.2 shows the techniques that lead to an increase in the nitrogen to oxygen
ratio in the intake air. One technique is to direct the intake air through an air separation
membrane, which is capable of producing nitrogen-rich air. Another technique is the
supply of fuel reformed products into the engine. The concentration of nitrogen is
inevitably increased as the amount of the intake air is replaced by the reformed EGR
(REGR), which is rich in nitrogen.

Chapter 1: Introduction
24
Exhaust gas
`
Feed
air
N2-rich
intake air
Air separation
membrane
O2-rich
air Diesel
`
Diesel
Exhaust gas
Reformer
(b)
Increased
N2/O2 ratio
REGR(a)
Figure 1.2: Increase in nitrogen concentration in the intake air by, (a) employing an air
separation membrane, (b) integrating a fuel reformer within the EGR loop.
Chapter 6 - Enrichment of the intake air with simultaneous hydrogen and nitrogen
The objective of this chapter is to present the effects of the intake air enrichment with a
mixture of H2 + N2 on the performance, emissions and combustion of the engine. Figure
1.3 illustrates the methods that can be employed to produce H2 + N2 rich intake air. Figure
1.3(a) shows a combination of the techniques already presented in Figures 1.1(a) and
1.2(a). The product gas of diesel fuel reforming may consist of H2 + N2, as shown in
Figure 1.3(b). Carbon monoxide, at a relatively high concentration, is typically present in
diesel reforming product gas; nevertheless, it can be reduced to ppm levels through the
water-gas shift reaction, using a good low-temperature catalyst.
Exhaust gas
`
Feed
air
H2+N2-rich
intake air
Air separation
membrane
O2-rich
air Diesel
`
Diesel
Exhaust gas
Reformer
(b)
Increased
N2/O2 ratio
H2-rich EGR(a)
`On-board H2
storage
Figure 1.3: Simultaneous enrichment of the intake air with H2 + N2 through, (a)
combination of an air separation membrane and on-board hydrogen reservoir,
and (b) integration of a fuel reformer into the EGR loop.
Chapter 1: Introduction
25
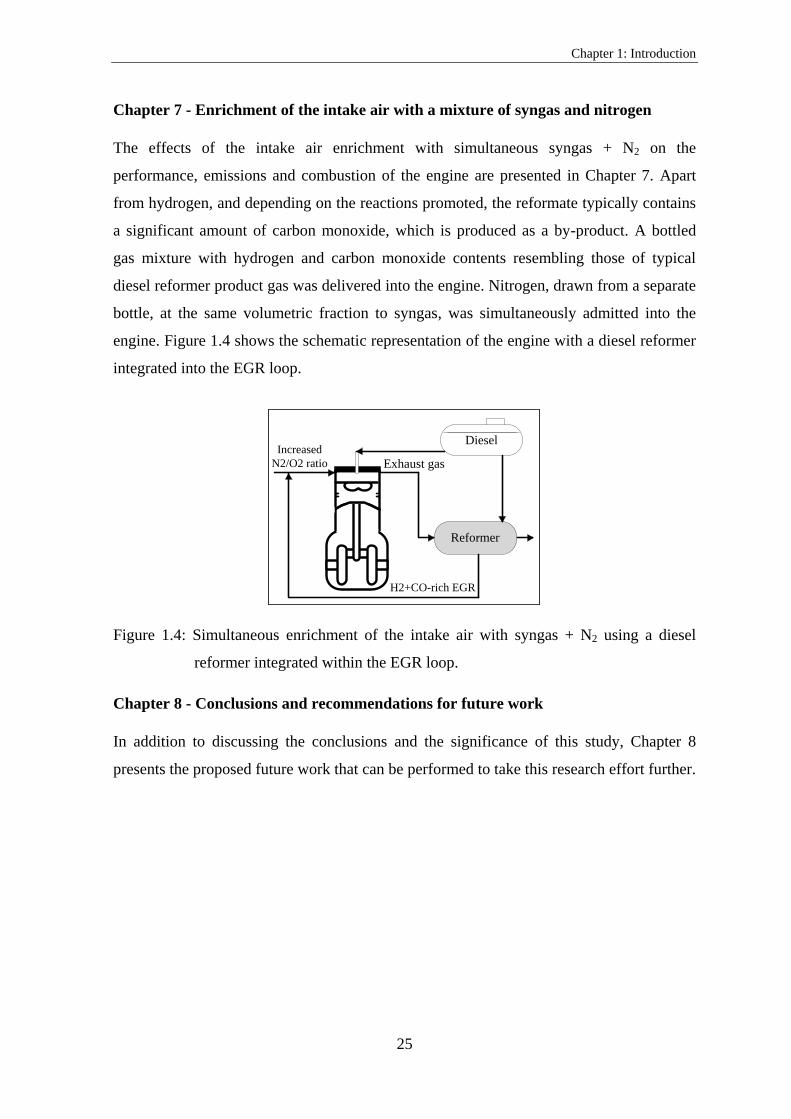
Chapter 7 - Enrichment of the intake air with a mixture of syngas and nitrogen
The effects of the intake air enrichment with simultaneous syngas + N2 on the
performance, emissions and combustion of the engine are presented in Chapter 7. Apart
from hydrogen, and depending on the reactions promoted, the reformate typically contains
a significant amount of carbon monoxide, which is produced as a by-product. A bottled
gas mixture with hydrogen and carbon monoxide contents resembling those of typical
diesel reformer product gas was delivered into the engine. Nitrogen, drawn from a separate
bottle, at the same volumetric fraction to syngas, was simultaneously admitted into the
engine. Figure 1.4 shows the schematic representation of the engine with a diesel reformer
integrated into the EGR loop.
`
Diesel
Exhaust gas
Reformer
Increased
N2/O2 ratio
H2+CO-rich EGR
Figure 1.4: Simultaneous enrichment of the intake air with syngas + N2 using a diesel
reformer integrated within the EGR loop.
Chapter 8 - Conclusions and recommendations for future work
In addition to discussing the conclusions and the significance of this study, Chapter 8
presents the proposed future work that can be performed to take this research effort further.
Chapter 2: Literature Review
26
2 CHAPTER 2
LITERATURE REVIEW
2.1 Regulated exhaust emissions from diesel combustion
Combustion is a chemical process in which the hydrogen and carbon atoms contained in a
hydrocarbon fuel are oxidized releasing energy in the form of heat and light. The products
of complete or ideal combustion of a hydrocarbon with air are water (H2O) and carbon
dioxide (CO2). This type of combustion occurs under stoichiometric air-fuel ratio
conditions. However, the intrinsic complexity of the combustion process, the great
variability in the local equivalence ratio in diesel engines, together with the structure and
function of the different components, lead to the production of additional chemical
compounds such as NOx, unburned hydrocarbons (UHCs), CO and particulate matters
(PM). The adverse effects of these chemical compounds have been well documented in a
number of investigations [7-9]; hence, in an effort to protect human health and the
environment, air pollution limits have been established worldwide. In Sections 2.1.1 -
2.1.4, a discussion on the formation of NOx, PM, CO and THC emissions in internal
combustion engines is provided.[7, 8, 9]
2.1.1 Nitrogen oxides
Nitrogen oxides are principally composed of two pollutants: nitric oxides (NO) and
nitrogen dioxides (NO2). Typically, NO comprises over 90% of the engine-out NOx
emissions. The molecular nitrogen contained in the air is oxidized to form NO when
ambient air is exposed to elevated temperatures. In case nitrogen atoms are present in the
fuel, the oxidation of the nitrogen-containing compounds during the combustion process is
an additional source of NO. In total, there are three NO formation mechanisms in diesel
engines, which are described below [10-13]: [10, 11, 12, 13]
When the combustion temperature is higher than 1527-1727 °C and the air-fuel ratio is
close to stoichiometric the thermal or extended Zeldovich mechanism is the major
contributor to NOx emissions from diesel engines. The chemical reactions governing the
formation of NO from nitrogen (and its destruction) are:
Chapter 2: Literature Review
27
(2.1)
(2.2)
(2.3)
The rate of NO formation is given by the following equation:
[ ]
[ ][ ] [ ][ ]
[ ][ ] [ ][ ]
[ ][ ]
[ ][ ]
(2.4)
where ,
are the rate constants for the extended Zeldovich mechanism
(m3 mol
-1 s
-1).
Due to the high temperature required, thermal NO only appears in significant quantities
after the onset of heat release. It has been reported that the production rate doubles for
every 90 °C temperature increase beyond 1827 °C [14].
The Prompt NO or Fenimore mechanism is relatively insignificant for most diesel
combustion conditions. Formation of NO occurs in the flame reaction zone and is very
rapid. That zone is extremely thin and residence time within the zone is short. Equation
(2.5) is important for the initiation of NO under this mechanism:
(2.5)
In a series of reactions that take place, the presence of O and OH strongly affect the rapid
conversion to NO.
Generally, distillate fuels do not contain significant amounts of organic nitrogen;
therefore, the amount of fuel NO in the exhaust gas of a diesel engine is negligible.
Nevertheless, heavy fuel oils with residual fuel may contain significant quantities of
organic nitrogen, which can contribute to NOx emissions. In such cases, the conversion of
fuel nitrogen to NO strongly depends on the stoichiometry, local temperature and level of
nitrogen in the fuel-air mixture.
A complete understanding of NOx formation mechanisms is essential in order to reduce
the levels being produced and released into the atmosphere, and as a result minimize the
adverse effects on human health and the environment. From the environmental point of

Chapter 2: Literature Review
28
view, NOx emissions react to form smog and acid rain and contribute to global warming.
Concerning their impact on human health, breathing NOx can cause respiratory problems,
may damage the lung tissue and may cause premature death.
2.1.2 Particulate matter
It should be clarified that in the current research work the smoke concentration in the
exhaust gas was determined by the filter paper method. In particular, a photoelectric head
measured the blackening of a clean filter paper, caused by the soot (that is, combustion
generated carbonaceous material) contained in the combustion products. However, for the
sake of completeness a discussion on the production of PM is also provided. In fact, PM
values are obtained using a different measurement method.
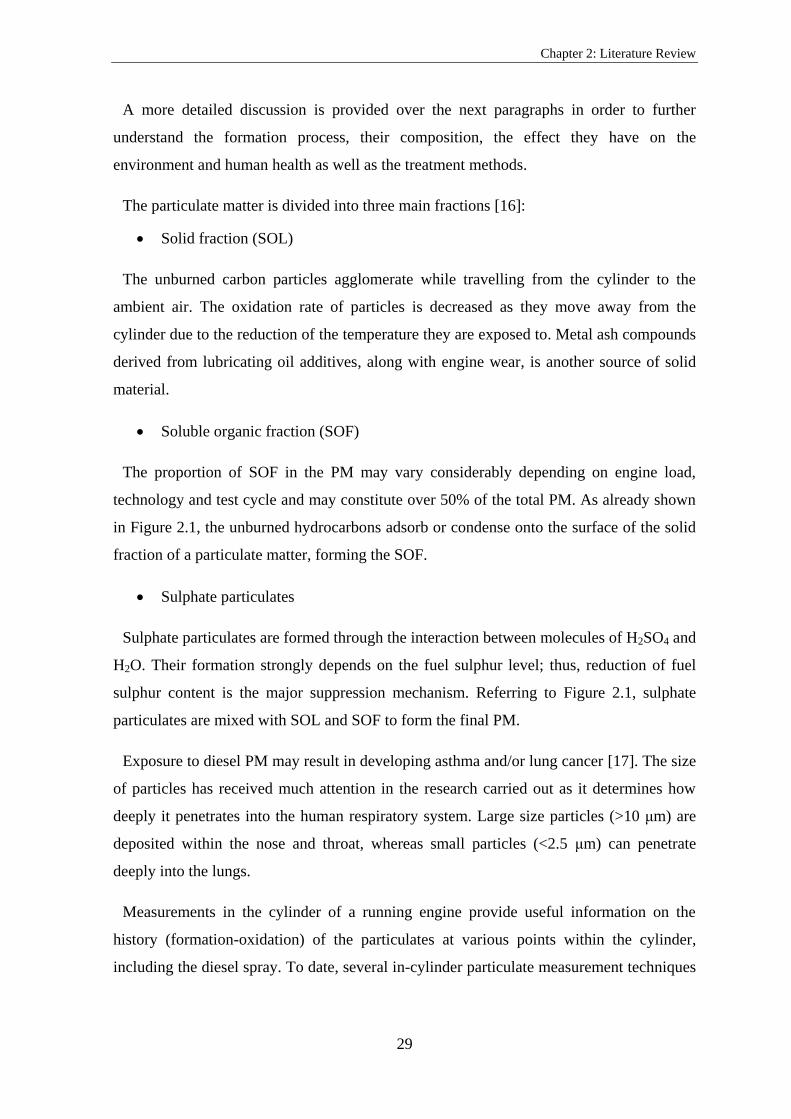
It is very difficult to classify PM due to the chemical and physical complexity involved.
In essence, PM consists of solid carbon particles and other chemical species that
agglomerate to form complicated particles. The agglomerated particles undergo the
following formation sequence: the carbon formed from reactive intermediates in the fuel-
rich zone is not always fully burned when moved to a region with excess oxygen. As a
result, residues of fine carbon cores remain in the combustion products. The reaction rate
of these fine carbon cores is reduced as they cool down. While moving through the exhaust
pipe, the carbon particles agglomerate and mix with condensed heavy hydrocarbons,
sulphur oxides, nitrogen oxides and metallic ash formed during the high temperature
combustion [15]. The resulting particle is schematically shown in Figure 2.1.
Solid Carbon
Particle
Adsorbed
hydrocarbons
Liquid condensed
hydrocarbon particles
Hydrated sulphate
particles
Figure 2.1: Schematic representation of diesel particulate matter.
Chapter 2: Literature Review
29
A more detailed discussion is provided over the next paragraphs in order to further
understand the formation process, their composition, the effect they have on the
environment and human health as well as the treatment methods.
The particulate matter is divided into three main fractions [16]:
Solid fraction (SOL)
The unburned carbon particles agglomerate while travelling from the cylinder to the
ambient air. The oxidation rate of particles is decreased as they move away from the
cylinder due to the reduction of the temperature they are exposed to. Metal ash compounds
derived from lubricating oil additives, along with engine wear, is another source of solid
material.
Soluble organic fraction (SOF)
The proportion of SOF in the PM may vary considerably depending on engine load,
technology and test cycle and may constitute over 50% of the total PM. As already shown
in Figure 2.1, the unburned hydrocarbons adsorb or condense onto the surface of the solid
fraction of a particulate matter, forming the SOF.
Sulphate particulates
Sulphate particulates are formed through the interaction between molecules of H2SO4 and
H2O. Their formation strongly depends on the fuel sulphur level; thus, reduction of fuel
sulphur content is the major suppression mechanism. Referring to Figure 2.1, sulphate
particulates are mixed with SOL and SOF to form the final PM.
Exposure to diesel PM may result in developing asthma and/or lung cancer [17]. The size
of particles has received much attention in the research carried out as it determines how
deeply it penetrates into the human respiratory system. Large size particles (>10 μm) are
deposited within the nose and throat, whereas small particles (<2.5 μm) can penetrate
deeply into the lungs.
Measurements in the cylinder of a running engine provide useful information on the
history (formation-oxidation) of the particulates at various points within the cylinder,
including the diesel spray. To date, several in-cylinder particulate measurement techniques
Chapter 2: Literature Review
30
have been used, including rapid acting valves [18], optical absorption techniques [19] and
cylinder dumping [20]. Techniques that are used to measure PM in the exhaust pipe
include gravimetric analysis and electrical mobility techniques.
The complexity of PM (both chemical and physical) makes the in-cylinder treatment a
very challenging task since there are many mechanisms (often competing) influencing the
formation-oxidation of that pollutant. Soot formation-oxidation is affected by the
temperature, fuel composition, pressure within the combustion chamber, local oxygen
concentration, duration of diffusion combustion and residence time, to name a few factors.
Despite the research findings on PM formation-oxidation, the current emission limits can
only be met by fitting advanced emission aftertreatment technologies, such as diesel
particulate filter, within the exhaust pipe. Further technological advances are required in
order to achieve sufficient in-cylinder reduction of PM.
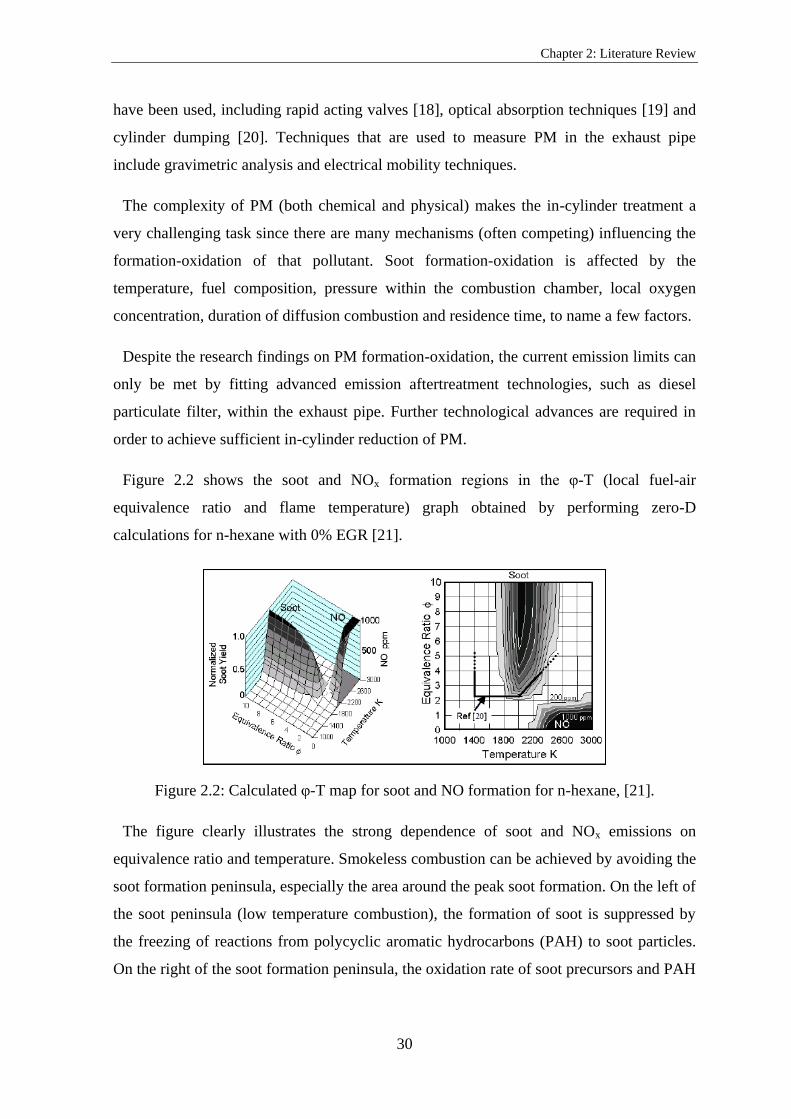
Figure 2.2 shows the soot and NOx formation regions in the φ-T (local fuel-air
equivalence ratio and flame temperature) graph obtained by performing zero-D
calculations for n-hexane with 0% EGR [21].
Figure 2.2: Calculated φ-T map for soot and NO formation for n-hexane, [21].
The figure clearly illustrates the strong dependence of soot and NOx emissions on
equivalence ratio and temperature. Smokeless combustion can be achieved by avoiding the
soot formation peninsula, especially the area around the peak soot formation. On the left of
the soot peninsula (low temperature combustion), the formation of soot is suppressed by
the freezing of reactions from polycyclic aromatic hydrocarbons (PAH) to soot particles.
On the right of the soot formation peninsula, the oxidation rate of soot precursors and PAH
Chapter 2: Literature Review
31
is very high due to the increased temperature; therefore, the particles are consumed before
they advance to the next particulate formation stages (that is, particle inception, surface
growth, particle coagulation and agglomeration). The reduction of NO emissions can be
realised by avoiding the NO formation zone, which is located at the bottom right corner of
the figure.
When hydrogen is admitted into the engine, the peak combustion temperature is
increased, causing an increase in NOx and a reduction in soot formation. The former
occurs mainly because the combustion temperature tends to move towards the centre of the
NOx region, whereas the latter, among other factors, is attributed to the enhanced soot
oxidation as the combustion moves towards the right of the soot peninsula. In a similar
way, introduction of nitrogen-rich intake air into the engine leads to NOx reduction, since
the NOx-producing reactions freeze due to the drop of peak combustion temperature. The
increase in soot is attributed to the increase in the global equivalence ratio. Enrichment of
the intake air with either a mixture of H2 + N2 or a mixture of syngas + N2 can lead to
simultaneous reduction of NOx and soot emissions (under certain operating conditions),
provided that the NOx and soot producing regions are avoided.
2.1.3 Carbon monoxide
In internal combustion engines, CO is produced from the incomplete combustion of the
carbon-containing fuel. Oxygen depletion is the dominant factor leading to incomplete fuel
oxidation. Other factors promoting the formation of CO include flame quenching on
cylinder walls, non-homogenous air-fuel mixing and reduced combustion temperature and
residence time. The adverse health and environmental effects of CO emissions are
summarised over the next paragraphs.
When CO is inhaled it enters the bloodstream through the lungs and binds with
haemoglobin to form carboxyhaemoglobin (COHb), which in turn decreases the oxygen
carrying capacity and leads to tissue hypoxia [22]. The acceptable exposure to CO
emissions is determined by both CO concentration and time. Permitted exposure time
reduces by increasing CO emissions and vice versa. The short-term exposure limit
tolerates 200 ppm for 15 minutes. Reduction of CO concentration to 30 ppm increases the
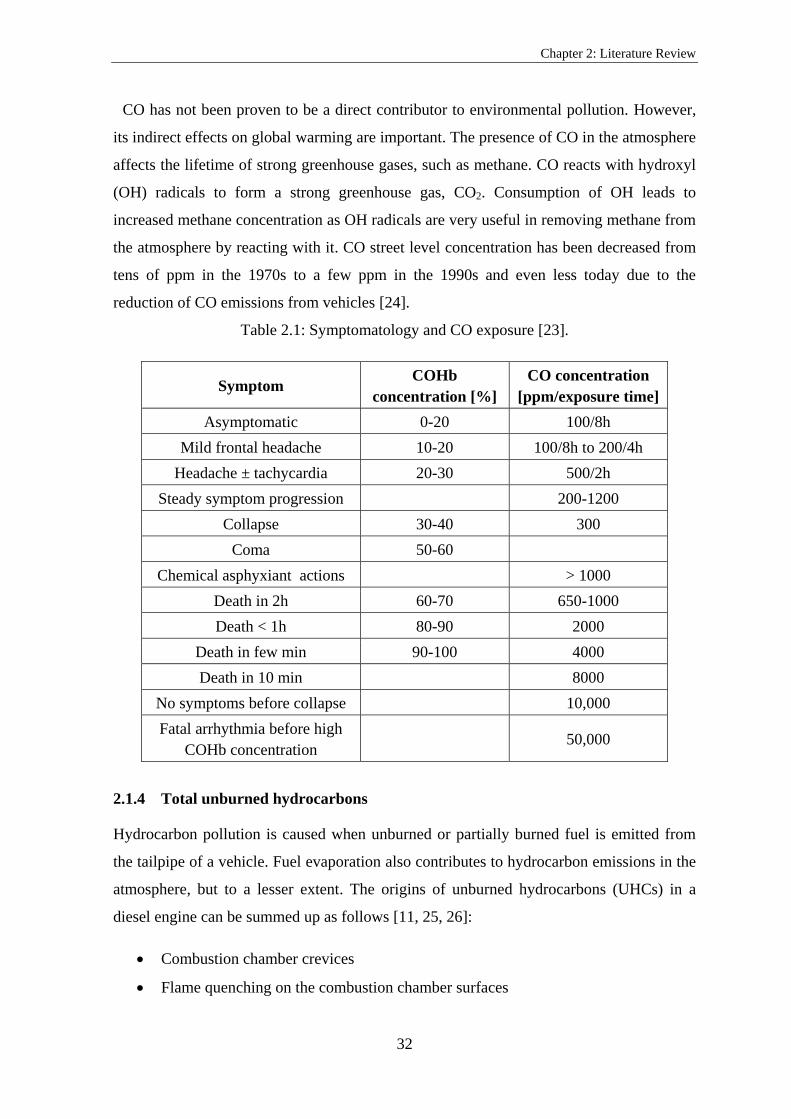
exposure time to 8 hours [23]. Table 2.1 summarizes the symptoms observed after the
exposure to CO emissions at a certain amount of time.
Chapter 2: Literature Review
32
CO has not been proven to be a direct contributor to environmental pollution. However,
its indirect effects on global warming are important. The presence of CO in the atmosphere
affects the lifetime of strong greenhouse gases, such as methane. CO reacts with hydroxyl
(OH) radicals to form a strong greenhouse gas, CO2. Consumption of OH leads to
increased methane concentration as OH radicals are very useful in removing methane from
the atmosphere by reacting with it. CO street level concentration has been decreased from
tens of ppm in the 1970s to a few ppm in the 1990s and even less today due to the
reduction of CO emissions from vehicles [24].
Table 2.1: Symptomatology and CO exposure [23].
Symptom COHb
concentration [%]
CO concentration
[ppm/exposure time]
Asymptomatic 0-20 100/8h
Mild frontal headache 10-20 100/8h to 200/4h
Headache ± tachycardia 20-30 500/2h
Steady symptom progression 200-1200
Collapse 30-40 300
Coma 50-60
Chemical asphyxiant actions > 1000
Death in 2h 60-70 650-1000
Death < 1h 80-90 2000
Death in few min 90-100 4000
Death in 10 min 8000
No symptoms before collapse 10,000
Fatal arrhythmia before high
COHb concentration 50,000
2.1.4 Total unburned hydrocarbons
Hydrocarbon pollution is caused when unburned or partially burned fuel is emitted from
the tailpipe of a vehicle. Fuel evaporation also contributes to hydrocarbon emissions in the
atmosphere, but to a lesser extent. The origins of unburned hydrocarbons (UHCs) in a
diesel engine can be summed up as follows [11, 25, 26]: [25, 26]:
Combustion chamber crevices
Flame quenching on the combustion chamber surfaces
Chapter 2: Literature Review
33
Formation of liquid films on combustion chamber surfaces
Under-mixing of fuel and air, resulting in over-rich zones that cannot burn due to
local lack of oxygen (including fuel dribbling out of the injector sac volume)
Over-mixing of fuel and air beyond lean flammability limits during ignition delay
period
The composition of hydrocarbon emissions, and therefore the effects on humans and the
environment, can be significantly influenced by the fuel used. Some hydrocarbons are
toxic and suspected carcinogens, others are highly reactive in the smoke-producing
chemistry, while others are odorants and irritants.
2.2 Legislation
In the early 1950s a California researcher realised the adverse impact of fossil fuel
powered motor vehicles on air quality. Since then, much effort has been put into setting
standards and developing emission control technologies.
The first emissions standard (set by the California Motor Vehicle Pollution Control
Board) was first developed in 1966 and aimed at reducing the UHCs and CO exhaust
pollutants emitted from the vehicles sold in California [27]. The EGR valve was developed
in 1972, while the first generation catalytic converters were built 3 years later, in 1975. In
1981 sophisticated three-way catalysts, on board computers and oxygen sensors were fitted
in most new cars [28].
A milestone in emission standards was the introduction of ‘Tier’ (United States) and
‘Euro’ (European Union) in 1994 and 1993, respectively. Concerning the Euro standards,
the stages for light-duty diesel engines (passenger cars) are typically referred to as Euro 1
implemented in 1993, followed by Euro 2 in 1996, Euro 3 in 2000, Euro 4 in 2005, Euro 5
in 2009 and Euro 6 in 2014. It should be mentioned that the corresponding standards for
heavy-duty vehicles use Roman, instead of Arabic numerals (that is, Euro I ... VI). Figures
2.3 and 2.4 illustrate the permitted particulate matter and NOx emissions as well as the year
they come into force as defined by the European Union directives [29]. Failure to meet the
European or U.S emission standards results in tax penalties.
The emission levels are tested using the New European Driving Cycle (NEDC), which
simulates the typical speed-time pattern of a car driven in Europe. It is composed of four

Chapter 2: Literature Review
34
consecutive ECE-15 cycles with maximum speed 50 km/h and average speed 19 km/h and
one extra-urban cycle with maximum and average speed 121km/h and 63 km/h,
respectively.
Achievement of the legislated emission limits requires the combination of in-cylinder and
aftertreatment emission reduction systems. The former includes application of various
injection strategies (injection rate shaping, fuel injection pressure), alternative combustion
concepts (HCCI, PCCI, LTC), EGR, alternative fuels and exhaust gas reforming, whereas
the latter involves the installation of catalytic reduction systems within the exhaust pipe.
0
0.1
0.2
1993 1996 2000 2005 2009
EURO 1
EURO 2
EURO 3
EURO 4
2014
EURO 5 EURO 6
0.14
0.08
0.05
0.025
0.005
Part
icu
late
Matt
er
g/K
m
Implementation date
Figure 2.3: European Union Particulate matter emission standards.
0
0.1
0.2
2000 2005 2009
EURO 3
EURO 4
2014
EURO 5
EURO 6
0.5
NO
x g
/Km
Implementation date
0.3
0.4
0.5
0.25
0.18
0.08
Figure 2.4: European Union NOx emission standards.
Chapter 2: Literature Review
35
2.3 Exhaust gas aftertreatment
Although the harmful by-products produced during the combustion process can be reduced
(to a certain extent) by employing in-cylinder emission control techniques, application of
aftertreatment catalysts is deemed necessary in order to reduce pollutants to legislated
levels. When catalysts were first introduced, and based on the legislative emission levels at
that time, an oxidation catalyst was adequate in diesel engines. A modern diesel-powered
vehicle may require the combination of up to three different aftertreatment devices, which
are presented below [30].
2.3.1 Diesel oxidation catalyst
The diesel oxidation catalyst is designated to convert CO, HC and SOF of particulate
matters to CO2 and H2O. The chemical reactions involved are given below:
(2.6)
(2.7)
(2.8)
The exhaust gas that flows through the small channels of the catalyst comes in contact
with the platinum group metals (PGMs) that are coated on the monolith. As diesel engines
spend all the operating time running on lean air-fuel ratios, there is a sufficient amount of
oxygen, which is consumed by the combustion products, as shown in the equations above.
Another important parameter that greatly influences the chemical reactions (2.6-2.8) is
temperature. Conversion efficiency, which is a strong function of exhaust temperature, can
exceed 90% at elevated temperatures.
2.3.2 Selective catalytic reduction
The selective catalytic reduction is a well proven technology for the reduction of NOx
emissions in stationary and marine diesel engines. In mobile diesel applications, EGR is
typically employed to offer the required reductions. However, due to stringent NOx limits,
EGR alone is no longer capable of bringing NOx to such low levels. Hence, incorporation
of SCR systems in the exhaust pipe of diesel-powered vehicles is required in order to
comply with the current NOx limits. Traditionally, ammonia (NH3) that is injected into the
exhaust pipe evaporates and mixes with the exhaust gas and then enters the catalyst where
Chapter 2: Literature Review
36
NOx emissions are broken down. Nevertheless, due to toxicity and handling issues of NH3
it is not feasible to use it in mobile diesel engines. Extensive research found urea to be an
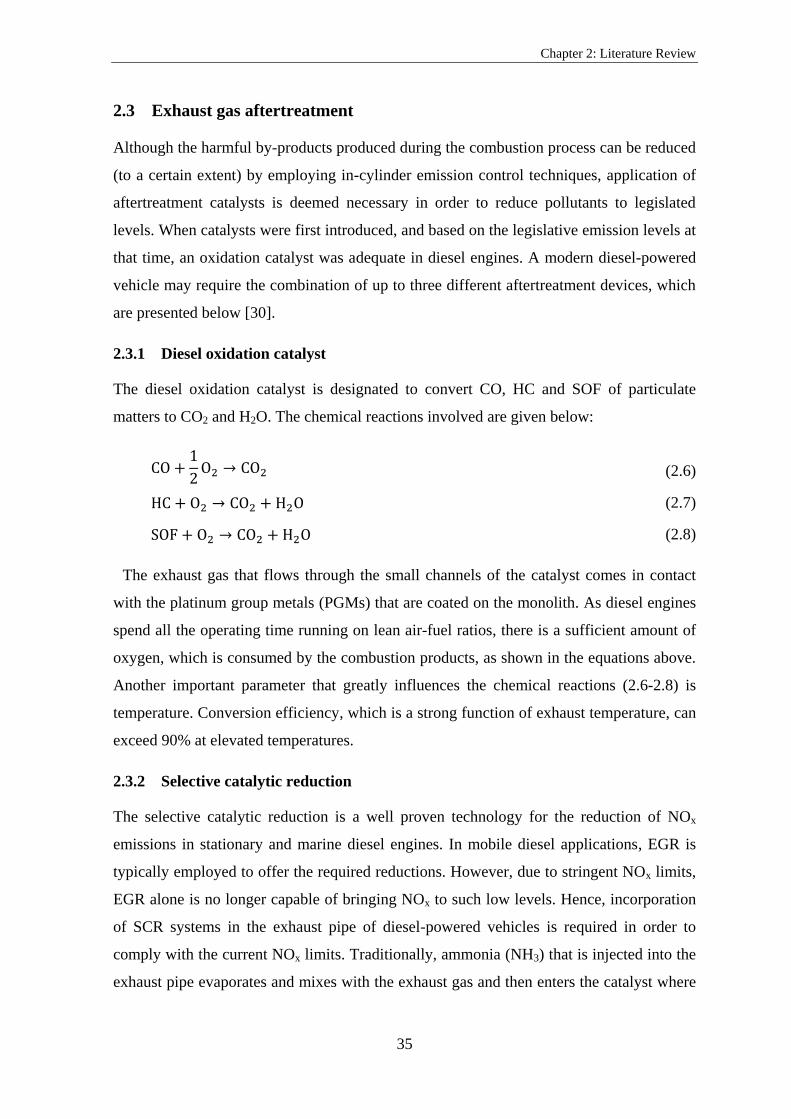
acceptable alternative to NH3, meeting technical and commercial requirements. Figure 2.5
shows a simplified (in terms of both structure and chemical reactions) SCR system in
which diesel exhaust fluid (DEF) is injected upstream of the catalyst into the exhaust pipe.
DEF, also referred to as Ad-Blue, is an aqueous solution composed of 32.5% urea and
67.5% deionised water. When the exhaust gas temperature is over 160 °C, it forms NH3
through a series of reactions in the decomposition reactor.
DEF
N2 H O2
DEF is injected into
the exhaust pipe
DEF is converted into
NH through hydrolysis3
NH3
NH and NO react into the
catalyst to form N and H O
Exhaust gas in
3 x
2 2
Exhaust gas out
Figure 2.5: Selective catalytic reduction system.
The following urea decomposition and NOx conversion reactions can take place:
(2.9)
(2.10)
(2.11)
(2.12)
(2.13)
(2.14)
(2.15)
2.3.3 NOX adsorber
The NOx adsorber is an alternative to SCR that uses a storage component such as barium
(Ba), calcium (Ca), potassium (K) and sodium (Na) to trap the NOx emitted from a lean
burn internal combustion engine. When excess oxygen exists in the combustion products,
NOx is stored via the oxidation of NO to NO2:
Chapter 2: Literature Review
37
(2.16)
and subsequently stored in the trap as nitrate species:
(2.17)
Decomposition of the stored nitrate species takes place when the engine operates either in
fuel-rich conditions or at elevated temperatures:
(2.18)
The reduction of NO over the trap is described by the following chemical equation:
(2.19)
Equation (2.19) requires high temperatures otherwise a NOx spike can occur during the
regeneration [31]. Conversion efficiency of as high as 80-90% has been reported with the
maximum performance typically occurring in the 350-380 °C range [32].
2.3.4 Diesel particulate filter
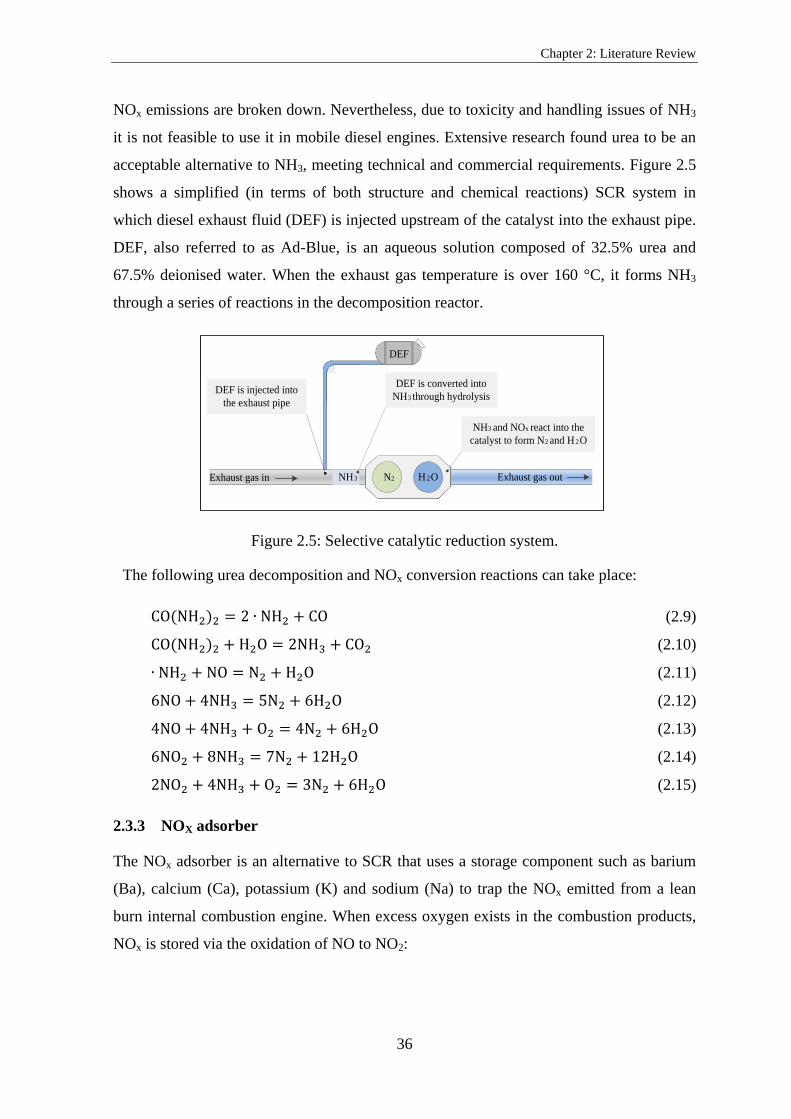
The DPF captures the emitted particulate matters and can demonstrate filtration efficiency
in excess of 90% [33]. The operating principle is based on the separation of gas-borne
particles from the exhaust gas stream by deposition on the filter walls. Figure 2.6
schematically illustrates how the DPF operates.
Pre-treated exhaust emissions
1 2
1.
2
2
2
2. Filtered exhaust emissions
Figure 2.6: Function of the diesel particulate filter.
The structure of the filter consists of a series of dead end channels running parallel in the
axial direction. The exhaust gas is forced to travel through the porous tube walls to an exit,
Chapter 2: Literature Review
38
which results in particles being deposited on the filter walls. Frequent regeneration of the
filter is required to burn off the accumulated particulates, which increase the exhaust back
pressure causing adverse effects on available engine torque and fuel consumption [34].
2.4 Diesel combustion
The description of diesel combustion is essential in order to improve engine efficiency and
gain insight into the emission formation and destruction mechanisms. Based on the
combustion concept, various conceptual models that describe the spray formation,
vaporisation, mixing, ignition and pollutant formation and destruction mechanisms have
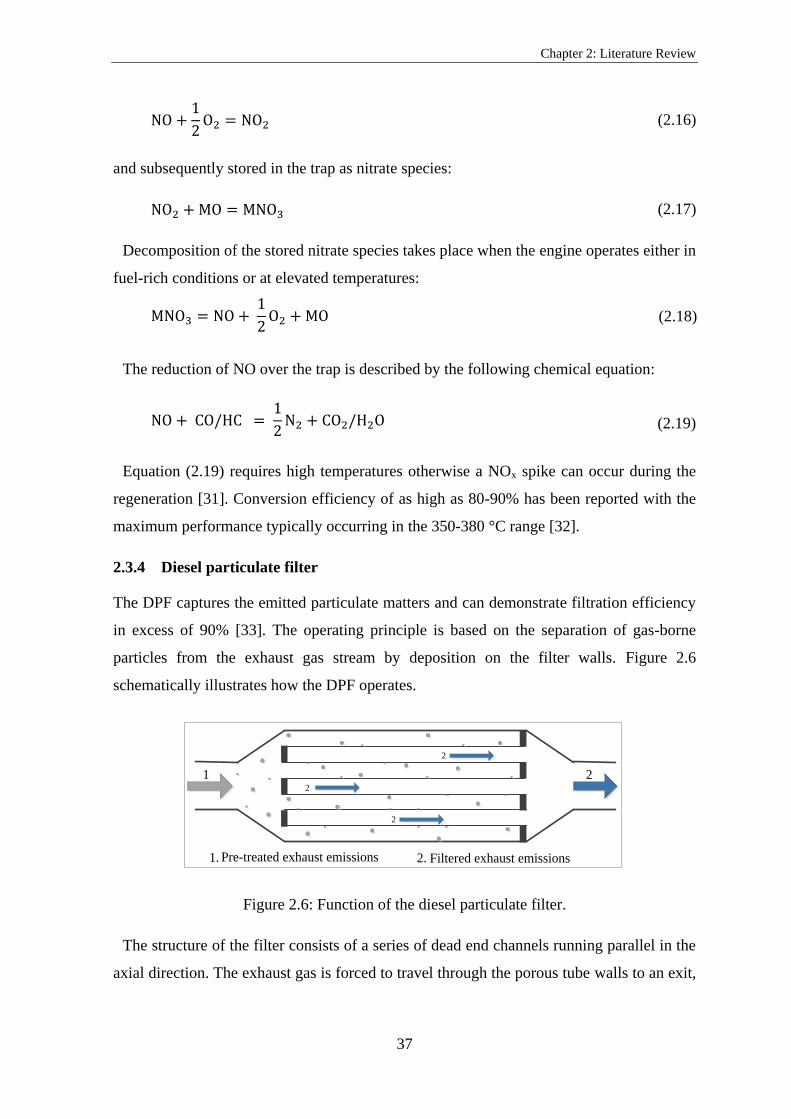
been proposed [35, 36, 37]. The conceptual model for conventional diesel combustion
during the quasi-steady phase, as proposed by Dec [36], is depicted in Figure 2.7. The
liquid fuel vaporises as it travels from the nozzle down the jet since it rapidly entrains in
the hot in-cylinder air. This results in the formation of a sheath-like fuel-vapour/air
mixture layer along the sides of the jet. The initial fuel oxidation occurs as the fuel-
vapour/air flows into the jet, which is being exposed to high temperatures, while the final
oxidation takes place at the border of the jet. The rate of combustion increases as more
fuel-vapour/air and hot combustion products re-entrain into the penetrating jet. This
actually constitutes the main idea of the two-stage fuel oxidation as shown in Figure 2.7
[37].
Figure 2.7: Schematic of Dec’s conceptual diesel combustion model during the quasi-
steady period of diesel combustion [36].
In addition to the discussion provided in the previous paragraph, a more complete picture
of diesel combustion can be obtained by presenting the different stages of the combustion
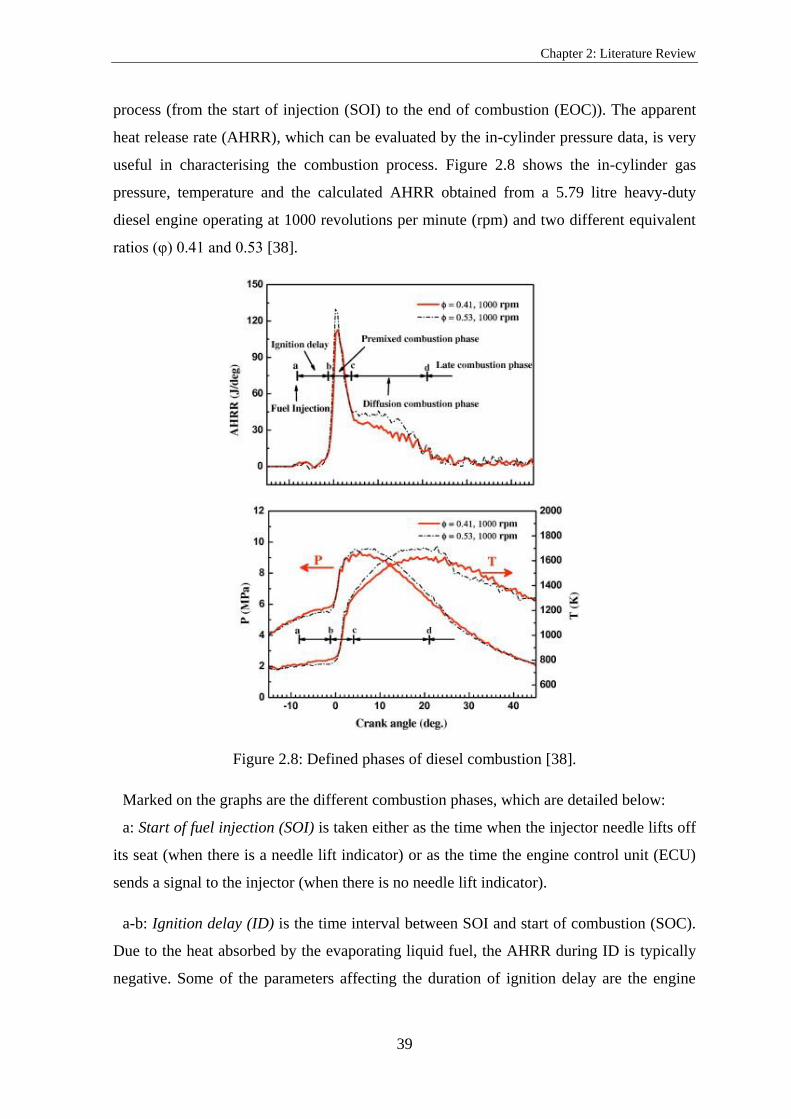
Chapter 2: Literature Review
39
process (from the start of injection (SOI) to the end of combustion (EOC)). The apparent
heat release rate (AHRR), which can be evaluated by the in-cylinder pressure data, is very
useful in characterising the combustion process. Figure 2.8 shows the in-cylinder gas
pressure, temperature and the calculated AHRR obtained from a 5.79 litre heavy-duty
diesel engine operating at 1000 revolutions per minute (rpm) and two different equivalent
ratios (φ) 0.41 and 0.53 [38].
Figure 2.8: Defined phases of diesel combustion [38].
Marked on the graphs are the different combustion phases, which are detailed below:
a: Start of fuel injection (SOI) is taken either as the time when the injector needle lifts off
its seat (when there is a needle lift indicator) or as the time the engine control unit (ECU)
sends a signal to the injector (when there is no needle lift indicator).
a-b: Ignition delay (ID) is the time interval between SOI and start of combustion (SOC).
Due to the heat absorbed by the evaporating liquid fuel, the AHRR during ID is typically
negative. Some of the parameters affecting the duration of ignition delay are the engine
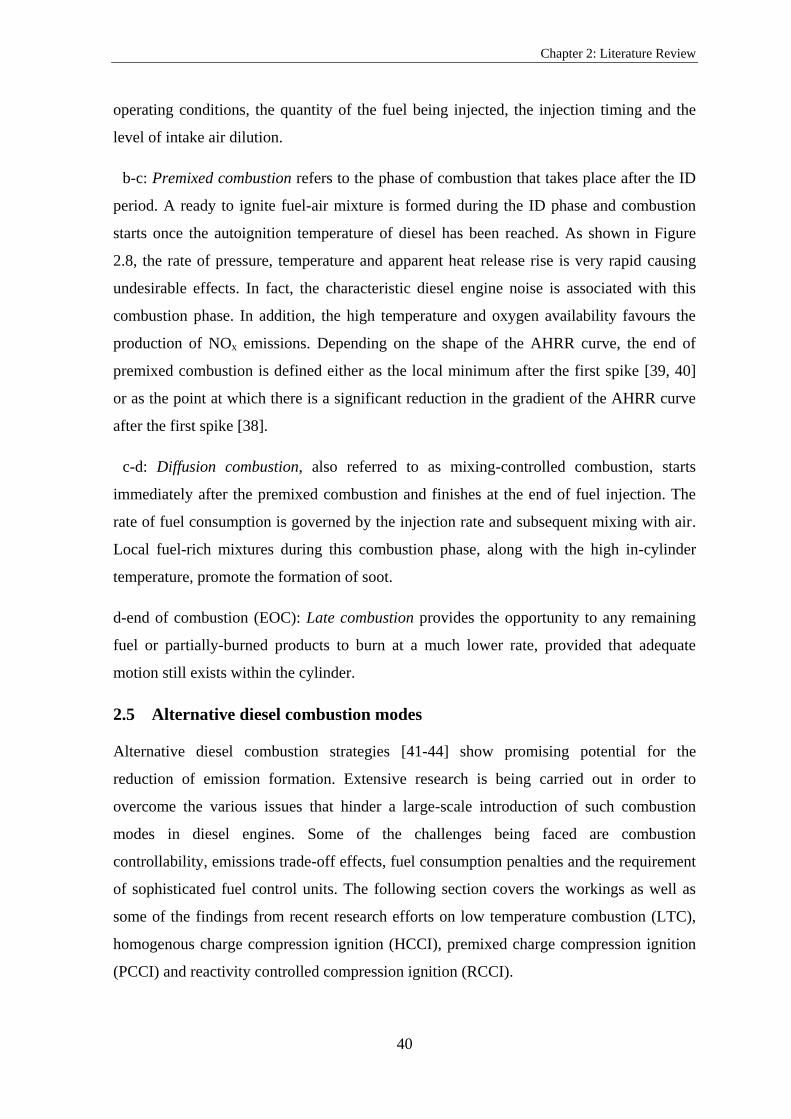
Chapter 2: Literature Review
40
operating conditions, the quantity of the fuel being injected, the injection timing and the
level of intake air dilution.
b-c: Premixed combustion refers to the phase of combustion that takes place after the ID
period. A ready to ignite fuel-air mixture is formed during the ID phase and combustion
starts once the autoignition temperature of diesel has been reached. As shown in Figure
2.8, the rate of pressure, temperature and apparent heat release rise is very rapid causing
undesirable effects. In fact, the characteristic diesel engine noise is associated with this
combustion phase. In addition, the high temperature and oxygen availability favours the
production of NOx emissions. Depending on the shape of the AHRR curve, the end of
premixed combustion is defined either as the local minimum after the first spike [39, 40]
or as the point at which there is a significant reduction in the gradient of the AHRR curve
after the first spike [38].
c-d: Diffusion combustion, also referred to as mixing-controlled combustion, starts
immediately after the premixed combustion and finishes at the end of fuel injection. The
rate of fuel consumption is governed by the injection rate and subsequent mixing with air.
Local fuel-rich mixtures during this combustion phase, along with the high in-cylinder
temperature, promote the formation of soot.
d-end of combustion (EOC): Late combustion provides the opportunity to any remaining
fuel or partially-burned products to burn at a much lower rate, provided that adequate
motion still exists within the cylinder.
2.5 Alternative diesel combustion modes
Alternative diesel combustion strategies [41-44] show promising potential for the
reduction of emission formation. Extensive research is being carried out in order to
overcome the various issues that hinder a large-scale introduction of such combustion
modes in diesel engines. Some of the challenges being faced are combustion
controllability, emissions trade-off effects, fuel consumption penalties and the requirement
of sophisticated fuel control units. The following section covers the workings as well as
some of the findings from recent research efforts on low temperature combustion (LTC),
homogenous charge compression ignition (HCCI), premixed charge compression ignition
(PCCI) and reactivity controlled compression ignition (RCCI). [41, 42, 43, 44]

Chapter 2: Literature Review
41
2.5.1 Low temperature combustion
The main objective of LTC is to alter the combustion chemistry of conventional diesel
engines in order to minimise the formation of pollutants. The reduction of engine-out
emissions, among other advantages, can benefit the aftertreatment devices as less
complexity and cost are involved in achieving the same emission limits.
A major challenge with all LTC concepts is the difficulty in controlling the combustion
process; hence, the operating range of the engine is significantly limited when adopting
such combustion concepts. In addition, application of LTC typically results in trade-off
effects between emission formation and fuel consumption. The above issues clearly
indicate that certain challenges need to be overcome before large-scale adoption of LTC.
Feng et al. [45] studied the effects of EGR on engine combustion and emissions, using
five different diesel blends. The experiments were performed on a modified compression
ignition engine operated in LTC mode. It was found that an addition of EGR leads to
thermal efficiency reduction, extends the ignition delay and increases the HC and CO
emissions. It was also shown that the thermal efficiency decreases, start of combustion
delays and maximum heat release rate increases when the initial boiling point of the fuel is
reduced.
The fuel suitability in a high compression ratio engine operating at high-load conditions
has been investigated by Han et al. [46]. The authors tested the suitability of four fuels
(diesel, gasoline, n-butanol and ethanol) and fuelling strategies for LTC operation by
examining the emission performance and the combustion controllability. When neat diesel
operation was applied, LTC was enabled at 0.8 and 1.0 MPa IMEP with extremely high
EGR rates required in order to combust the fuel in the LTC region. According to the
authors, gasoline/diesel combustion exhibited low NOx and soot emissions at 0.8-1.0 MPa
IMEP load operation, but a further increase in load imposed problems. Operation with n-
butanol revealed that high pressure direct injection of the fuel was more advantageous
compared to port injection. In the latter case, premature auto-ignition of the fuel has a
detrimental effect on the emission performance. Finally, it was found that ethanol/diesel
combustion is suitable for high-load LTC operation as it is beneficial to both combustion
control and emission.
Chapter 2: Literature Review
42
2.5.2 Homogenous charge compression ignition
The HCCI combustion mode is a method of achieving LTC, which can simultaneously
reduce NOx and smoke emissions. Figure 2.9 shows the region, in terms of temperature
and equivalence ratio, of such a combustion mode. It is clear that the NOx and soot
producing zones are largely avoided, altering this way their formation chemistry. The
reduction of soot is accomplished by creating a homogenous air-fuel mixture in the
combustion chamber, thus preventing the formation of local fuel-rich zones in which much
of the soot is produced. The combustion temperature is located to the left of the NOx
formation zone; thus, the formation of NOx is largely suppressed. The drawbacks
associated with this combustion mode are increased CO and HC emissions as well as
limited operating range. Stanglmaier and Roberts [47] found that fuel admission is critical
in reducing fuel-wall wetting in HCCI engines.
Figure 2.9: Equivalence ratio-temperature diagram of different combustion concepts [48].
Various methods have been proposed for the formation of a homogenous mixture,
including port diesel injection and early direct injection. The former technique ensures the
longest interval between SOI and start of ignition. Clearly, this gives the longest possible
time for the mixing of diesel with air. However, this method is practically unfeasible as it
suffers from poor ignition control, high HC and CO emissions and fuel consumption
penalties, to name a few issues. Direct injection strategy, for early or late diesel injection,
offers a good flexibility in switching combustion modes, depending on the operating
conditions.
Chapter 2: Literature Review
43
Guo et al. [49] experimentally investigated the effect of hydrogen enrichment on the
combustion and emission performance of an HCCI diesel engine. Both fuels (hydrogen
and diesel) were introduced into the engine through the intake port, while the intake air
was diluted using EGR. It was reported that introduction of hydrogen resulted in retarded
combustion phasing and reduced combustion duration. Also, it was demonstrated that the
indicated specific CO and HC emissions were decreased when hydrogen was admitted into
the engine. In addition, it was shown that supply of hydrogen at extra lean conditions
without EGR is more effective compared to high EGR and near stoichiometric mixture.
However, it was observed that hydrogen may increase the knocking tendency of the HCCI
engine.
2.5.3 Premixed charge compression ignition
The PCCI is another LTC concept that can offer emissions reduction. In contrast to HCCI,
in this combustion strategy, the air-fuel mixture is not entirely homogenous. In fact, it is
quite difficult to obtain a fully homogenous diesel-air mixture due to the low volatility and
low auto-ignition temperature of diesel. In a PCCI engine, the air-fuel mixture ignites
spontaneously; thus, no flame propagation occurs as happens in a conventional diesel
engine. This results in high pressure rise rates, which can reduce the engine life.
The premixed charge within the cylinder is typically achieved by early fuel injection.
Certain drawbacks associated with this injection strategy, such as wall-wetting, can be
detrimental to HC and CO emissions. Boot et al. [50] investigated whether uncooled EGR
can reduce wall-wetting when early diesel injection is employed. The elevated by 40-60 °C
intake temperature promoted better evaporation of diesel fuel. The authors reported
significant smoke number reduction with simultaneous IMEP improvement. Additionally,
they proposed that more research is required in order to obtain acceptable efficiency.
Based on their study, Beatrice et al. [51] reported that compression ratio (CR) is the most
effective parameter in controlling the ignition delay in a PCCI engine. The CR should be
carefully optimised as neither too low nor high is desirable. The former may increase the
fuel consumption and cause cold engine stability issues, whereas the latter can reduce the
benefits of PCCI as the combustion approaches that of conventional diesel engines. It was
shown that adoption of low CR resulted in significant smoke reduction and negligible
change on fuel consumption at the expense of HC and CO emissions. NOx emissions,
Chapter 2: Literature Review
44
which remained relatively unaffected, were controlled using EGR. The authors concluded
that a CR around 15.5 is the best compromise for the engine under investigation.
Leermakers et al. [52] investigated the effects of fuel composition on PCCI combustion
in a heavy-duty diesel engine. It was found that the mixing time was increased when a
lower cetane number diesel was used. This resulted in less NOx and smoke emissions at the
expense of CO, HC and fuel consumption. It was also reported that in the conditions under
investigation, the use of n-heptane as the diesel surrogate in modelling studies gives
underestimated CO and HC emissions and overestimated NOx emissions.
2.5.4 Reactivity controlled compression ignition
RCCI is typically realised by delivering two distinct fuels with different reactivities into
the combustion chamber. The low reactivity fuel is supplied first, well before the injection
of the high reactivity fuel. This technique ensures that the low reactivity fuel is thoroughly
mixed with air and ignites spontaneously once the combustion of the high reactivity fuel
initiates. By employing that combustion mode, increased fuel efficiency, ultra-low NOx
and PM as well as reduced heat transfer losses can be achieved.
Part of Splitter’s et al. [53] study dealt with an RCCI single-cylinder heavy-duty engine
operated at a fixed load and speed of 6.5 bar IMEP and 1300 rpm, respectively. Port
injected E85 represented the low reactivity fuel, whereas cetane improved gasoline (direct
injected into the cylinder) represented the high reactivity fuel. Under this operating mode,
the authors reported a gross indicated thermal efficiency near 60% as well as near-zero
NOx and PM emissions.
Hanson et al. [54] performed experiments on a heavy-duty 2.44 litre Caterpillar 3401
single-cylinder engine operated in RCCI mode. The engine speed was varied between 800
and 1700 rpm, while the load was set at 2 and 4.5 bar gross IMEP. Throughout their
experiments they employed a dual fuel and a single-fuel strategy. In the former strategy,
port gasoline and direct diesel injection was used. In the latter strategy, gasoline was
employed in both streams, but the cetane number of the direct injection stream was
increased by adding 2-Ethylhexyl Nitrate. The authors concluded that both fuelling
strategies resulted in NOx and PM emissions below the US EPA 2010 HD on-road limits,
Chapter 2: Literature Review
45
without fitting the engine with aftertreatment systems. They also demonstrated that both
fuel strategies increased thermal efficiency.
The efficiency and emissions mapping of an RCCI light-duty diesel engine was carried
out by Curran et al. [55]. The engine, operated over a wide range of speed and load
conditions, was fuelled by gasoline and ultra-low sulphur diesel. Based on the operating
conditions, diesel was delivered into the cylinder either through a single or a split injection
and the results obtained were compared to the conventional diesel operation. According to
the authors, the RCCI engine showed diesel-like thermal efficiency at lower speeds and
loads, while up to 5% efficiency improvement was achieved at higher speeds and loads. In
addition, the RCCI mode was reported to produce lower NOx but higher CO and HC
emissions, compared to the conventional diesel combustion (CDC).
2.6 Injection parameters
The fuel injection system plays a major role in diesel atomisation, mixture formation and
flame evolution, which are very important in obtaining good combustion quality. Accurate
control of the time, pressure and amount of fuel delivered into the cylinder can
significantly improve the performance as well as pollutant and noise emissions of a diesel
engine. Moreover, the success of alternative combustion modes and alternative fuels
greatly depends on the adoption of advanced injection systems.
2.6.1 Injection timing and pressure
Diesel injection timing can easily be adjusted by triggering the injector at the desired time.
The in-cylinder conditions at the time the fuel is delivered into the combustion chamber
significantly affect the combustion process.
When injection timing is advanced, the fuel entering the combustion chamber is exposed
to a lower temperature and pressure. This gives more time for the fuel to mix with the in-
cylinder air since the onset of combustion occurs only when the in-cylinder temperature
reaches the autoignition temperature of diesel. As a result, the premixed burn fraction is
increased leading to high NOx production. Soot formation, which in general is increased
with diffusion burn fraction, tends to decrease as injection timing is advanced. The high
combustion temperature, caused by the rapid premixed combustion, promotes the
oxidation of the soot produced in the rich fuel regions. The early injection timing is

Chapter 2: Literature Review
46
detrimental to THC emissions as the spray tip penetrates deeper (because of the lower
charge density) leading to spray wall impingement. A long ignition delay may result in
over-mixed regions, which are not desirable as the flame cannot propagate to fully burn the
fuel.
Retardation of injection timing leads to a decrease in NOx and THC at the expense of
soot emissions. The fuel is delivered to higher in-cylinder temperature (compared to
advance injection); hence, the premixed burn fraction is reduced due to the shorter ignition
delay. This is actually a dominant main factor leading to the reduction in NOx emissions.
The reduction in THC emissions is attributed to the increased in-cylinder density, which
leads to a decrease in spray wall impingement. The rise in soot emissions is mainly
attributed to the increase in diffusion burn fraction, along with the reduction of the in-
cylinder temperature. Concerning thermal efficiency, the optimum injection timing can
vary depending on the operating point of the engine. In general, when diesel injection is
commenced too early, the increased in-cylinder pressure forces the piston down before it
reaches the TDC and thus negative work is being performed. Delayed injection can also be
problematic as fuel burn during the expansion stroke limits the maximum in-cylinder
pressure.
Development of the high pressure common rail fuel system brought about a revolution in
diesel engines as it allows injection of high pressure fuel, currently up to 2500 bar [56]. A
number of studies have shown that an increase in fuel injection pressure promotes the fuel-
air mixing, which favours the reduction of pollutant emissions and fuel consumption [35,
57]. Understanding of diesel spray characteristics such as spray tip penetration, droplet
size distribution and spray structure is very important in optimising the combustion
process. Generally, a reduction in injector nozzle-hole is a technique that allows generation
of small size fuel droplets. However, this measure can be detrimental to spray tip
penetration as the spray momentum is reduced. The negative impact on spray penetration
can be tackled by employing a common rail system. Combination of high injection
pressures with small nozzle-holes can considerably contribute to the improvement in
combustion efficiency. [35] [57]
In their work, Chen et al. [58] employed a common-rail high-pressure fuel injection
system to study the fuel spray and atomisation characteristics of different fuels. They

Chapter 2: Literature Review
47
concluded that droplet size is decreased as the injection pressure is increased. In particular,
they showed a 50% decrease in droplet size when injection pressure was increased from
300 to 1000 bar. They also proved that at the spray periphery droplets are bigger compared
to those in the centre due to pressure drop. In addition, they showed that under higher
injection pressures the spray penetrates deeper, small droplets distribute in a narrower
region and have less variation in their sizes. An increase in injection pressure enhances
atomisation and shortens the ignition delay as a result of the better fuel-air mixing [59].
2.6.2 Multiple injection and rate shaping
The fuel can be delivered into the cylinder by adopting either a single injection event or
multiple injection events. The latter can be used to reduce the combustion noise as it
allows reduction of the peak heat release. For instance, a double injection strategy can give
two separate heat release peaks with lower maximum values compared to the heat release
value of a single injection event [60]. Moreover, the use of pilot injection has a positive
impact on the formation of NOx emissions as it reduces the ignition delay period. The
corresponding increase in soot emissions can be mitigated using post injection [61]. From
the above it is clear that a pilot-main-after injection strategy may contribute to
simultaneous improvement of NOx, soot and noise emissions.
Injection rate shaping is a technique that allows further optimisation of the combustion
process in direct injection diesel engines. The introduction of fast response solenoid valves
and piezo-electric technology in injectors enables a better control of the fuel delivery into
the cylinder [62]. Simultaneous control of needle lift, injection pressure and injection
timing, as shown in Figure 2.10, can influence the formation of NOx, soot and noise
emissions.
Figure 2.10: Multiple injections and injection rate shaping for future diesel engine [63].

Chapter 2: Literature Review
48
Adoption of a steep injection rate causes a deeper spray penetration and a wider spray
plume, which results in a more thoroughly mixed air with fuel [64]. After the onset of
combustion, a gradual rise in injection rate results in a smaller high temperature zone,
because the combustion process becomes slower. This injection technique may contribute
to the reduction of NOx emissions. The formation of soot can also be reduced [65]. It has
been reported that when injection rate shaping is considered, a sharp end of injection
pattern should be adopted in order to minimise the formation of soot from fuel entering
into the cylinder late in the combustion process [66].
Both injection rate rise and injection pressure affect ignition delay. However, under high
injection pressures the effect of injection rate shaping on ignition delay becomes small.
This is due to the fact that under high injection pressure the injection rate shaping has a
minor effect on the formation of the mixture as the momentum of the fuel is mainly
influenced by the fuel pressure [67].
2.7 Alternative fuels and dual fuel
The objectives of using alternative fuels in the automobile sector include reduction of
harmful emissions and greenhouse gases (GHG), enhancement of engine thermal
efficiency, sustainability and increased independence from fossil fuels (when they come
from renewable energy sources). Nevertheless, there are several factors that hinder the
transition from the traditional automotive fuels (i.e. diesel and gasoline) to the proposed
alternative ones, including refuelling infrastructure, transportation, storage and safety
issues as well as combustion and engine related issues. Much research on alternative fuels,
which aims to address the issues preventing them from a large-scale adoption by the
automobile sector, is underway. The findings show that dual fuel (for instance, diesel-
hydrogen and diesel-syngas) could serve as a transition solution to alternative fuels. This
section provides information on the alternative fuels that are considered as potential future
energy carriers.
2.7.1 Hydrogen
Chemical compounds of hydrogen such as water and hydrocarbons constitute a large part
of the Earth’s surface; thus, a trend towards hydrogen economy is not unexpected, taking
into account its desirable properties. The use of hydrogen gas as a fuel for compression

Chapter 2: Literature Review
49
ignition engines has been investigated by many researchers and some of the findings are
presented below.
Introduction of hydrogen into the combustion chamber of a diesel engine can be realised
either by port injection or direct injection. In the former method, hydrogen is typically
injected into the intake pipe at a pressure slightly above atmospheric, whereas in the latter
method, hydrogen is directly injected into the cylinder during the compression stroke [68].
In both methods, the combustion is typically initiated by diesel since the autoignition
temperature of hydrogen (585 °C) is usually not reached.
Saravanan et al. [69] performed experiments on a single-cylinder direct injection (DI)
diesel engine, modified to allow injection of hydrogen into the intake port during the
suction stroke. Diesel injection was fixed at 23 degrees crank angle (deg. CA) before
injection top dead centre (BITDC), while hydrogen injection timing and duration varied
from 5 crank angle degrees before top dead centre (CAD BTDC) to 5 crank angle degrees
after dead centre (CAD ATDC) and from 30 to 90 CAD, respectively. The authors claimed
a 5.8% brake thermal efficiency increase when fuelled by diesel-hydrogen due to the
enhanced combustion. They also reported simultaneous NOx-smoke emissions reductions
during the dual fuel mode. The reduction of NOx has been attributed to the leaner
equivalence ratios.
According to Shirk et al. [70], the hydrogen-assisted combustion does not affect the
drivability of the vehicle. It was also demonstrated that hydrogen addition slightly reduced
thermal efficiency and NOx emissions. The results were obtained from a car equipped with
a CI engine, running on a chassis dynamometer with 0%, 5% and 10% of the fuel energy
derived from fumigated hydrogen.
A number of studies [71-74] have found that part substitution of diesel with hydrogen has
a detrimental effect on NOx emissions due to the high adiabatic flame temperature of
hydrogen. The use of combined hydrogen and EGR has been proposed in order to mitigate
the adverse effect on NOx emissions. The latter can be employed to bring down the
combustion temperature. [71, 72, 73, 74]
It has been mentioned in Section 2.1.1 that the formation of NOx emissions is primarily
associated with the combustion temperature. Introduction of hydrogen into the engine
Chapter 2: Literature Review
50
typically causes an increase in combustion temperature with a detrimental effect on NOx
emissions. Some studies present a reduction in NOx emissions when the main fuel is partly
substituted by hydrogen [69, 75]. In essence, there are several factors that can influence the
combustion temperature, which under certain conditions may have a significant effect on
the high temperature zone. To name a few, the structure of the engine, the operating point,
the equivalence ratio as well as the small quenching distance and the high heat capacity of
hydrogen can affect the combustion temperature. Concerning the effect of hydrogen
enriched combustion on carbonaceous emissions, a general agreement exists among all
researchers; namely, an increase in the proportion of hydrogen in the fuel results in less
carbonaceous emissions [69, 71, 76]. The reason is that under the same operating
conditions the amount of carbon contained in a diesel-hydrogen mixture is always lower
compared to that contained in diesel. [75] [69], [69, 76] [71]
Hydrogen enriched combustion is capable of enhancing the function of the aftertreatment
devices. Wichterlova et al. [77] demonstrated that hydrogen addition over a SCR catalyst
significantly improved NOx conversion. In their study, Bromberg et al. [78] showed that
introduction of hydrogen into the exhaust stream can assist the regeneration process of the
DPF. The exhaust gas temperature of a diesel engine might not be high enough to burn off
the accumulated particles; hence, the oxidation of hydrogen can raise the temperature to
the required levels.
2.7.2 Syngas
Syngas, or synthesis gas, is a mixture primarily made up of hydrogen and carbon
monoxide at various compositions. In principle, it can be produced from any hydrocarbon
feedstock. In diesel engines, on-board syngas production is achieved by injecting diesel
fuel in a catalytic fuel reformer integrated within the exhaust pipe. The producer gas,
which is mainly a mixture of syngas and EGR, is then sent back to the engine through the
intake pipe [79].
The composition of the producer gas, which has been reported to affect engine
performance and emissions, depends on the reactions promoted during the reforming
process as well as the feedstock being used. Sahoo et al. [80] performed experiments with
three different volumetric compositions of syngas (H2:CO composition, 100:0, 75:25 and
50:50) in a diesel engine under dual fuel operation. It was concluded that the gaseous fuel
Chapter 2: Literature Review
51
with 100% hydrogen content exhibited an improved engine performance at the expense of
NOx emissions, compared to the syngas that contained CO. In addition, it was found that
CO and HC emissions increased as the percentage of CO in the gas mixture was increased.
In their paper, Bika et al. [81] demonstrated that part substitution of diesel fuel with
syngas, in any H2/CO proportion, resulted in a reduction in engine efficiency. It was also
reported that the unburned syngas escaping in the exhaust was the main factor that led to
efficiency reduction. Furthermore, it was shown that NO2/NO ratio roughly doubled when
syngas was admitted into the engine because of the increased HO2 radicals.
Variations in flame speed are expected at different H2/CO ratios. Dong et al. [82] used a
Bunsen burner to measure the laminar flame speed of syngas over a wide range of fuel
compositions and equivalence ratios. They concluded that laminar flame speed increased
with the concentration of hydrogen. They also demonstrated that the laminar flame speed
of an H2/air mixture and a CO/air mixture reached its maximum value at the equivalence
ratio of 1.7 and 1.6, respectively.
Supply of syngas in a compression ignition engine, produced by on-board diesel fuel
reforming, can lead to a reduction in engine-out emissions. In addition, it can be used as a
means of thermal efficiency improvement and combustion stability [83]. Similarly to
hydrogen, syngas is beneficial to the function of exhaust aftertreatment systems when it is
present in the exhaust gas.
2.7.3 Liquefied petroleum gas
Liquefied petroleum gas (LPG) is a mixture of propane and butane derived from fossil fuel
sources and is the third most popular fuel being used in automobiles worldwide [84]. It has
a higher specific energy density (kJ/kg) than liquid fuels (diesel and gasoline); however,
the latter prevail when comparing the energy density by volume (kJ/L). The density of
LPG is greater than air, posing both explosion and suffocation risks in case of leakage, as
it tends to settle in low spots. Its high octane number and auto ignition temperature makes
it more suitable for engines using the Otto cycle [85]. When LPG is used in compression
ignition engines, an amount of diesel is required in order to initiate the combustion. A
number of studies have revealed emission and performance benefits from supplying a
mixture of diesel and LPG in compression ignition engines.

Chapter 2: Literature Review
52
Fuel cost savings up to 2.3 euro/100 km have been estimated by fuelling a Volvo city bus
with an LPG-diesel blend [86]. The gaseous fuel was supplied into the intake manifold of a
7.1 litre diesel engine through a retrofit system. It was also reported that dual fuelling did
not significantly affect NOx and CO2 emissions, but it offered PM reductions, which can
benefit vehicles without DPF.
A study investigating the effects on the combustion parameters from the admission of
hydrogen or LPG into the intake manifold of a dual fuel diesel engine has been published
recently [87]. It was shown that the peak cylinder pressure under diesel-LPG (supply of
50% LPG) operation was higher than that at the baseline operation. At the same LPG
fraction, heat release rate was always lower compared to the neat diesel operation.
Saleh [88] experimentally proved that admission of propane (up to 40% gaseous fuel
mass fraction) into the inlet manifold of a diesel engine increased the fuel conversion
efficiency. This study also compared the fuel conversion efficiency obtained by fuelling
the engine by neat propane and propane-butane blends. It was demonstrated that fuel
conversion efficiency dropped with the increase in butane concentration in the gas mixture.
Nevertheless, the increase in butane proportion has a beneficial effect on NOx emissions.
2.7.4 Compressed natural gas
Compressed natural gas (CNG) can either be found above oil deposits or can be produced
by the breakdown of organic matter in an anaerobic environment. It is considered a
renewable energy source when it is originated from the latter process. Its density is lower
than air and this makes it safe in case of leakage because it disperses and mixes readily
with the ambient air. When used in compression ignition engines, the onset of combustion
is achieved through the injection of diesel or a fuel having diesel-like properties.
A study aimed at evaluating the performance and pollutant emissions of a diesel and a
CNG waste collection truck in the city of Milan has been presented by Fontaras et al. [89].
The authors concluded that CNG fuelled vehicles (running on the Otto cycle) are less NOx
and PM emitting, but the diesel counterparts prevail when it comes to CO, HC and GHG
emissions. According to the authors, taking into account that the engine-out NOx and PM
emissions are expected to be effectively treated in Euro VI compliant engines, the diesel
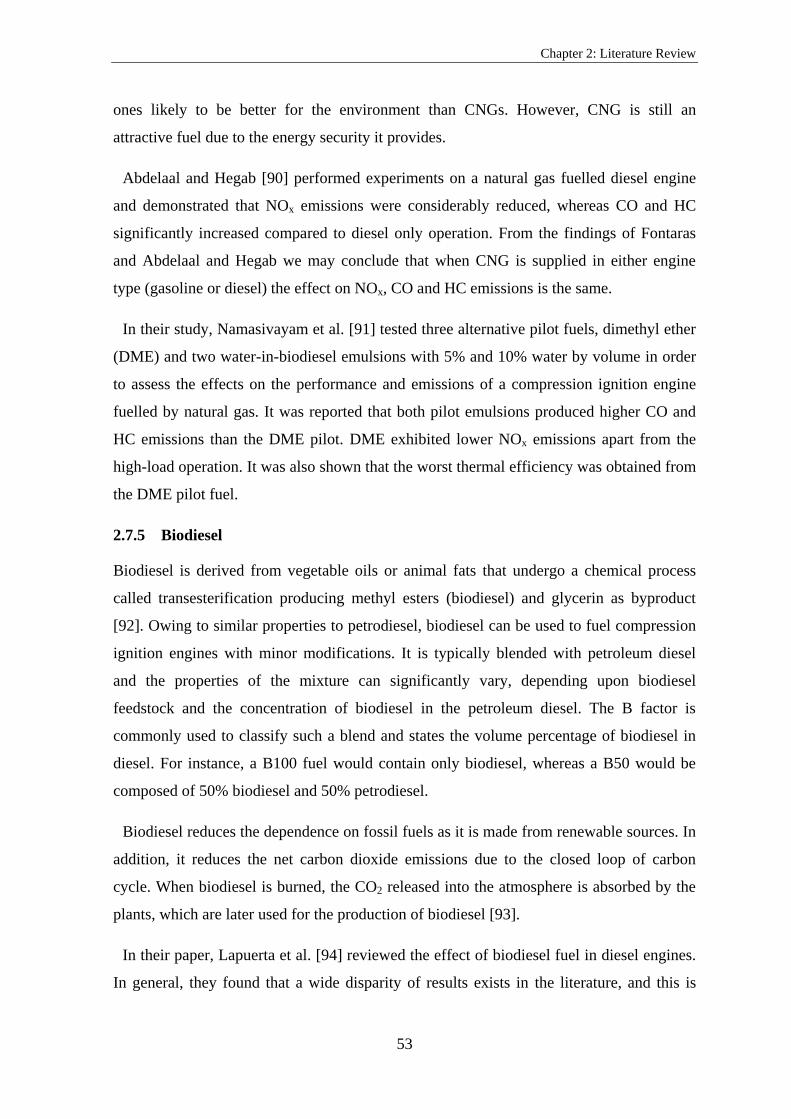
Chapter 2: Literature Review
53
ones likely to be better for the environment than CNGs. However, CNG is still an
attractive fuel due to the energy security it provides.
Abdelaal and Hegab [90] performed experiments on a natural gas fuelled diesel engine
and demonstrated that NOx emissions were considerably reduced, whereas CO and HC
significantly increased compared to diesel only operation. From the findings of Fontaras
and Abdelaal and Hegab we may conclude that when CNG is supplied in either engine
type (gasoline or diesel) the effect on NOx, CO and HC emissions is the same.
In their study, Namasivayam et al. [91] tested three alternative pilot fuels, dimethyl ether
(DME) and two water-in-biodiesel emulsions with 5% and 10% water by volume in order
to assess the effects on the performance and emissions of a compression ignition engine
fuelled by natural gas. It was reported that both pilot emulsions produced higher CO and
HC emissions than the DME pilot. DME exhibited lower NOx emissions apart from the
high-load operation. It was also shown that the worst thermal efficiency was obtained from
the DME pilot fuel.
2.7.5 Biodiesel
Biodiesel is derived from vegetable oils or animal fats that undergo a chemical process
called transesterification producing methyl esters (biodiesel) and glycerin as byproduct
[92]. Owing to similar properties to petrodiesel, biodiesel can be used to fuel compression
ignition engines with minor modifications. It is typically blended with petroleum diesel
and the properties of the mixture can significantly vary, depending upon biodiesel
feedstock and the concentration of biodiesel in the petroleum diesel. The B factor is
commonly used to classify such a blend and states the volume percentage of biodiesel in
diesel. For instance, a B100 fuel would contain only biodiesel, whereas a B50 would be
composed of 50% biodiesel and 50% petrodiesel.
Biodiesel reduces the dependence on fossil fuels as it is made from renewable sources. In
addition, it reduces the net carbon dioxide emissions due to the closed loop of carbon
cycle. When biodiesel is burned, the CO2 released into the atmosphere is absorbed by the
plants, which are later used for the production of biodiesel [93].
In their paper, Lapuerta et al. [94] reviewed the effect of biodiesel fuel in diesel engines.
In general, they found that a wide disparity of results exists in the literature, and this is

Chapter 2: Literature Review
54
attributed to several reasons such as: different engine technologies, operating conditions
and driving cycles used as well as varying biodiesel types and measurement techniques.
Despite this, they concluded that overall the following general trends hold true: Supplying
biodiesel into the engine does not significantly affect thermal efficiency as the increased
bsfc is in proportion to the reduction in heating value. Biodiesel contributes to a minor
increase in NOx emissions as reported in the majority of the papers. Concerning particulate
emissions, many scientists agree that the engine is less PM emitting when fuelled by
biodiesel mixtures; however, that finding might not hold true under cold operation. In
addition, there is a general agreement among the researchers that the higher oxygen
content of biodiesel contributes to a reduction in both CO and THC emissions, compared
to diesel operation.
Atadashi et al. [95] provide a discussion on biodiesel biodegradability, lubricity, stability
and physiochemical properties. Biodiesel can be used in sensitive environments such as
marine engines as it is non-toxic and degrades in soil and water. It also features better
lubricity than petroleum diesel benefiting both fuel injectors and pump, provided that a
good quality biodiesel is supplied, otherwise there is a risk of clogging the injectors. In
order to increase its stability, antioxidant additives might be required in case the fuel will
not be used soon.
2.8 Exhaust gas assisted fuel reforming
On-board production of hydrogen using hydrocarbon fuels is deemed as a transition
solution until issues with hydrogen infrastructure, distribution and on-board storage are
resolved. This technique requires injection of fuel into a catalytic reformer, integrated into
the EGR loop. The hydrogen-rich exhaust gas, capable of improving the combustion and
emissions of the engine, is delivered back to the cylinders. In addition to hydrogen, and
depending on the reactions promoted, a significant amount of CO can be produced during
the reformation process. Unlike fuel cells, combustion of gaseous CO in a diesel engine
does not contaminate any component of the engine.
The reactions involved in producing a hydrogen-rich or a syngas-rich gas stream are
steam reforming, water-gas shift reaction, partial oxidation, endothermic dry reforming
reaction, autothermal reforming and thermal decomposition of the fuel. A combination of
the aforementioned reactions may take place during the fuel reforming process.
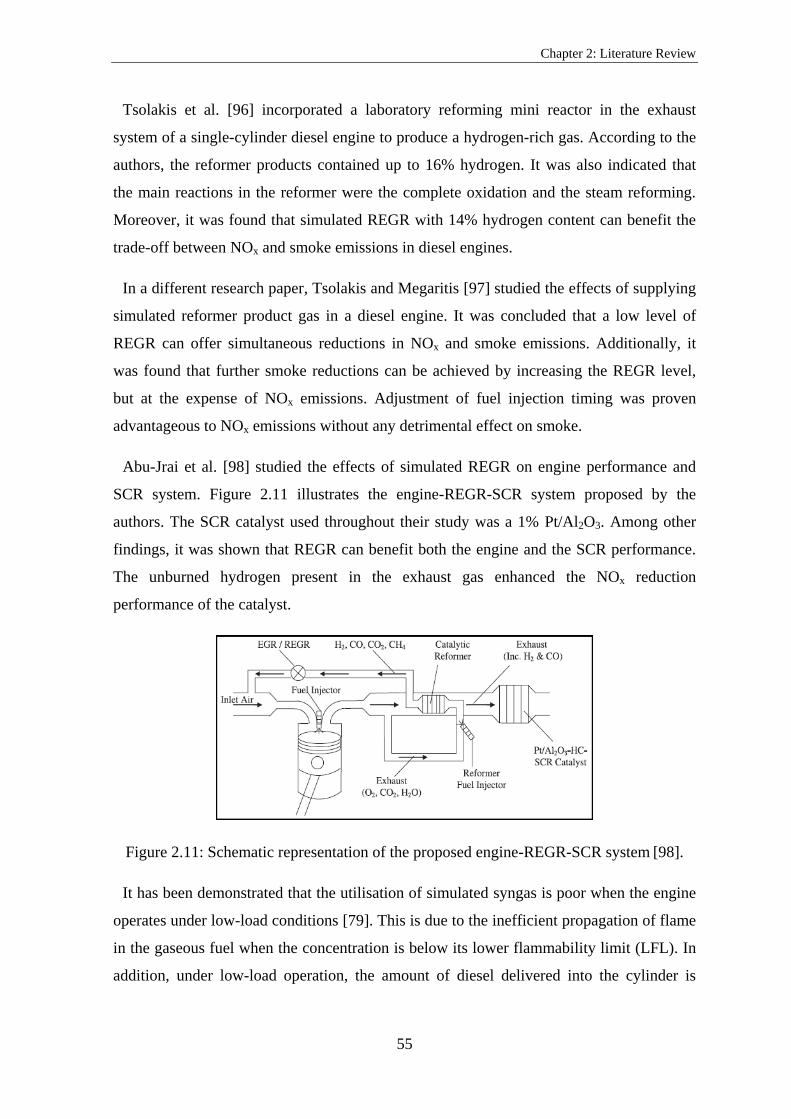
Chapter 2: Literature Review
55
Tsolakis et al. [96] incorporated a laboratory reforming mini reactor in the exhaust
system of a single-cylinder diesel engine to produce a hydrogen-rich gas. According to the
authors, the reformer products contained up to 16% hydrogen. It was also indicated that
the main reactions in the reformer were the complete oxidation and the steam reforming.
Moreover, it was found that simulated REGR with 14% hydrogen content can benefit the
trade-off between NOx and smoke emissions in diesel engines.
In a different research paper, Tsolakis and Megaritis [97] studied the effects of supplying
simulated reformer product gas in a diesel engine. It was concluded that a low level of
REGR can offer simultaneous reductions in NOx and smoke emissions. Additionally, it
was found that further smoke reductions can be achieved by increasing the REGR level,
but at the expense of NOx emissions. Adjustment of fuel injection timing was proven
advantageous to NOx emissions without any detrimental effect on smoke.
Abu-Jrai et al. [98] studied the effects of simulated REGR on engine performance and
SCR system. Figure 2.11 illustrates the engine-REGR-SCR system proposed by the
authors. The SCR catalyst used throughout their study was a 1% Pt/Al2O3. Among other
findings, it was shown that REGR can benefit both the engine and the SCR performance.
The unburned hydrogen present in the exhaust gas enhanced the NOx reduction
performance of the catalyst.
Figure 2.11: Schematic representation of the proposed engine-REGR-SCR system [98].
It has been demonstrated that the utilisation of simulated syngas is poor when the engine
operates under low-load conditions [79]. This is due to the inefficient propagation of flame
in the gaseous fuel when the concentration is below its lower flammability limit (LFL). In
addition, under low-load operation, the amount of diesel delivered into the cylinder is
Chapter 2: Literature Review
56
relatively small; hence, the resulting flame cannot fully burn the gaseous fuel, which burns
by entraining into the liquid fuel. The poor utilisation of the gaseous fuel has a detrimental
effect on thermal efficiency.
2.9 Dilution of the intake air
Dilution of the intake air is a technique that allows a reduction in engine-out NOx
emissions. To date, the most widely used method is the EGR in which an amount of
exhaust gas is recirculated back to the intake pipe, resulting in a reduction in oxygen
concentration in the intake air. EGR can be employed relatively easily to conventional
diesel engines and is a common practice to meet the emission standards. However, there
are certain drawbacks associated with EGR that can be eliminated by introducing
alternative intake air dilution methods.
Enrichment of the intake air with nitrogen is a dilution method that has been proposed
and implemented by various researchers [99, 100, 101]. In both EGR and nitrogen
enrichment techniques, the main factor behind the decrease in NOx emissions is the
reduction in oxygen concentration in the intake air, leading to a drop in peak combustion
temperature. It should be mentioned that the knowledge gained from the nitrogen
enrichment studies can benefit the development of on-board reforming technology since
the producer gas leads to an increase in N2/O2 ratio in the inlet air. The implementation of
dilution techniques has an adverse effect on CO, THC and smoke emissions [102];
however, part substitution of diesel fuel with either hydrogen or syngas can reduce the
levels of these emissions.
2.9.1 Nitrogen-rich intake air
Nitrogen-rich intake air can be employed to reduce the production of NOx emissions,
without causing adverse effects on engine lifespan [103]. Poola et al. [104] developed an
air separation membrane that was installed on a light-duty diesel engine, achieving dilution
levels similar to those of EGR. Figure 2.12 shows a typical prototype membrane module.
Li et al. [105] investigated the effects of dilution gases with various specific heats on the
characteristics of combustion and exhaust emissions. Among others outcomes, it was
found that oxygen reduction is the dominant factor lowering NOx emissions, rather than
gas specific heat.
Chapter 2: Literature Review
57
Figure 2.12: Poola’s prototype membrane module [104].
The dilution gases may affect combustion and emissions in the following ways: reduce
the oxygen available for the combustion, alter the specific heat capacity of the intake
charge, participate in the combustion process, affect volumetric efficiency in case of
temperature variations. Separate examination of the above yields that the dominant factor
affecting the combustion and emissions is the reduction in oxygen concentration. When the
intake air is enriched with nitrogen, the increase in heat capacity is insignificant. However,
in the next few lines the effect on combustion and emissions by changing the heat capacity
of the intake charge is explained. An increase in the heat capacity of the intake charge
leads to a reduction in the peak combustion temperature, causing a rise in ignition delay
period. Thus, the portion of the fuel burned during the premixed phase of combustion is
increased, resulting in an increase in NOx and a reduction in smoke emissions [106].
Finally, both participation of the added nitrogen in the combustion process and volumetric
efficiency effects are rather insignificant.
2.9.2 Exhaust gas recirculation
EGR is a NOx control measure applied to many types of diesel engines, including
automotive light-duty, medium-duty and heavy-duty engines as well as marine low-speed
two stroke engines. EGR can also be utilised in advanced combustion concepts, such as
LTC, which require high EGR rates [107]. Nevertheless, combination of EGR and NOx
reduction catalysts, such as the SCR system, might be necessary in order to meet the
stringent NOx emission standards. A simple schematic representation of the EGR system is
illustrated in Figure 2.13. Exhaust gas from the previous cycle is supplied back to the
intake pipe, through a line equipped with a valve allowing control of the amount of EGR.
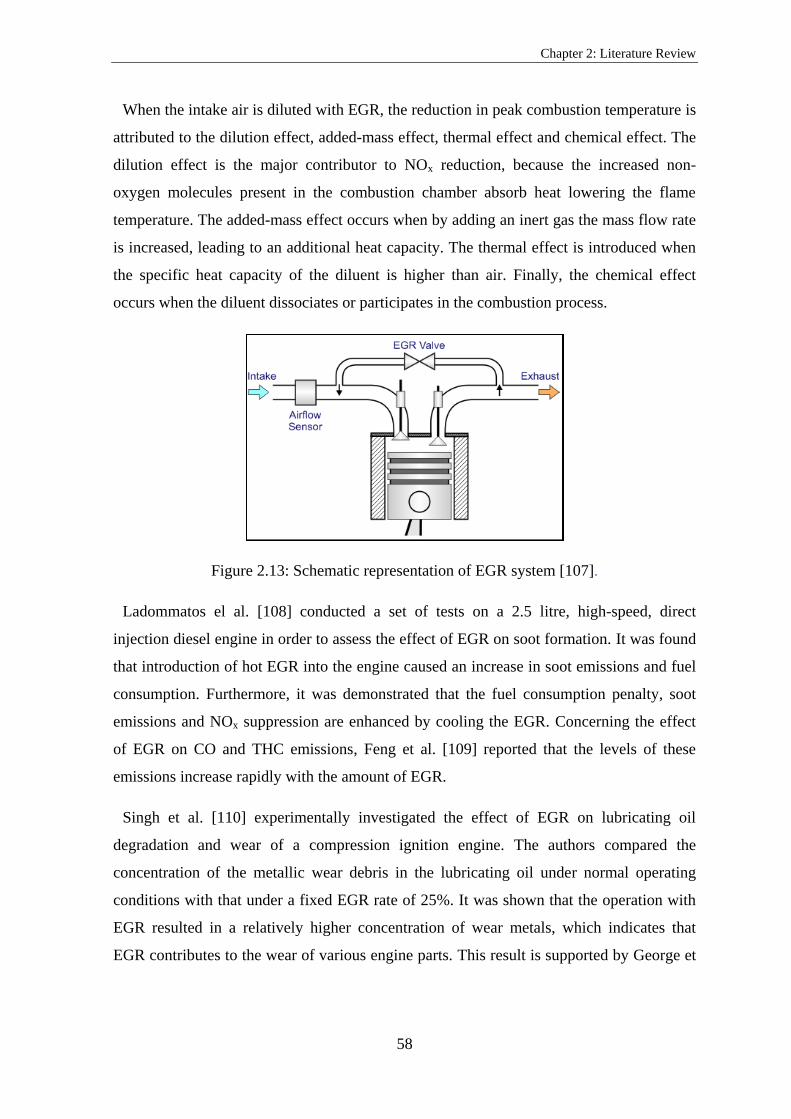
Chapter 2: Literature Review
58
When the intake air is diluted with EGR, the reduction in peak combustion temperature is
attributed to the dilution effect, added-mass effect, thermal effect and chemical effect. The
dilution effect is the major contributor to NOx reduction, because the increased non-
oxygen molecules present in the combustion chamber absorb heat lowering the flame
temperature. The added-mass effect occurs when by adding an inert gas the mass flow rate
is increased, leading to an additional heat capacity. The thermal effect is introduced when
the specific heat capacity of the diluent is higher than air. Finally, the chemical effect
occurs when the diluent dissociates or participates in the combustion process.
Figure 2.13: Schematic representation of EGR system [107].
Ladommatos el al. [108] conducted a set of tests on a 2.5 litre, high-speed, direct
injection diesel engine in order to assess the effect of EGR on soot formation. It was found
that introduction of hot EGR into the engine caused an increase in soot emissions and fuel
consumption. Furthermore, it was demonstrated that the fuel consumption penalty, soot
emissions and NOx suppression are enhanced by cooling the EGR. Concerning the effect
of EGR on CO and THC emissions, Feng et al. [109] reported that the levels of these
emissions increase rapidly with the amount of EGR.
Singh et al. [110] experimentally investigated the effect of EGR on lubricating oil
degradation and wear of a compression ignition engine. The authors compared the
concentration of the metallic wear debris in the lubricating oil under normal operating
conditions with that under a fixed EGR rate of 25%. It was shown that the operation with
EGR resulted in a relatively higher concentration of wear metals, which indicates that
EGR contributes to the wear of various engine parts. This result is supported by George et

Chapter 2: Literature Review
59
al. [111] who revealed that the increased soot emissions of an EGR-operated engine have a
detrimental effect on lubricating oil, leading to wear of engine parts.
From the above, it may be concluded that by equipping an engine with an EGR system
NOx emissions are considerably reduced at the expense of soot, CO, THC, fuel
consumption and engine wear issues. It should be mentioned that an SCR system is
required in order to meet the legislated stringent NOx emission limits.
2.10 Summary
Apart from establishing a theoretical framework and gaining background knowledge on
emission formation, diesel emission legislation, diesel combustion, alternative diesel
combustion modes, injection parameters, alternative fuels and dual fuel, exhaust gas
assisted fuel reforming and dilution techniques of the intake air, the literature review was
very important in identifying gaps in knowledge that need to be filled.
As already mentioned, although there are many papers in the literature dealing with the
effects of the intake air enrichment of a diesel engine with separate hydrogen, syngas and
nitrogen, no papers were found examining the effects of the intake air enrichment with
simultaneous hydrogen and nitrogen or simultaneous syngas and nitrogen.
Due to some discrepancies in the results reported in the literature, the experiments
presented in Chapters 4 and 5 were performed to investigate the effects of introducing
separate hydrogen and nitrogen in the existing engine. Moreover, together with the
baseline operation, the results obtained in these two chapters were used in many instances
as a basis of comparison.

Chapter 3: Experimental facilities, test procedure and data analysis
60
3 CHAPTER 3
EXPERIMENTAL FACILITIES, TEST PROCEDURE AND
DATA ANALYSIS
3.1 Introduction
The engine used for the experiments, the analysers, the measuring and calibration
equipment, the data acquisition as well as the data processing techniques are extensively
described in this chapter. In addition, the operating conditions selected and the parameters
varied in each operating condition are given and explained. Finally, the measures taken in
order to improve the safety of the researchers using the existing setup have been
incorporated in the discussion.
3.2 Research engine
The experiments were performed using a Ford pre-production prototype diesel engine. The
engine block was based on the Ford Duratorq engine, whereas the cylinder head was the
same to the production Ford Zetec, equipped with two camshafts and four valves per
cylinder. The specifications of the engine are summarised in Table 3.1. It should be
mentioned that throughout the experiments the engine was run in naturally aspirated mode,
while the EGR was not employed since the dilution of the intake air was achieved by the
introduction of bottled nitrogen.
Table 3.1: Engine specifications.
Engine model and type
Ford Puma, 2.0 l, 4 cylinder, 16 valve,
HSDI, turbocharged (but runs in NA mode),
EGR, water cooled, fuelled by ULSD
Bore/Stroke [mm] 86/86
Compression Ratio [-] 18.2:1
Swept Volume [cc] 1998.23
Con-Rod Length [mm] 155
The engine used throughout this research effort had different air intake manifold and
pistons compared to the production engines. In contrast to the design of the intake
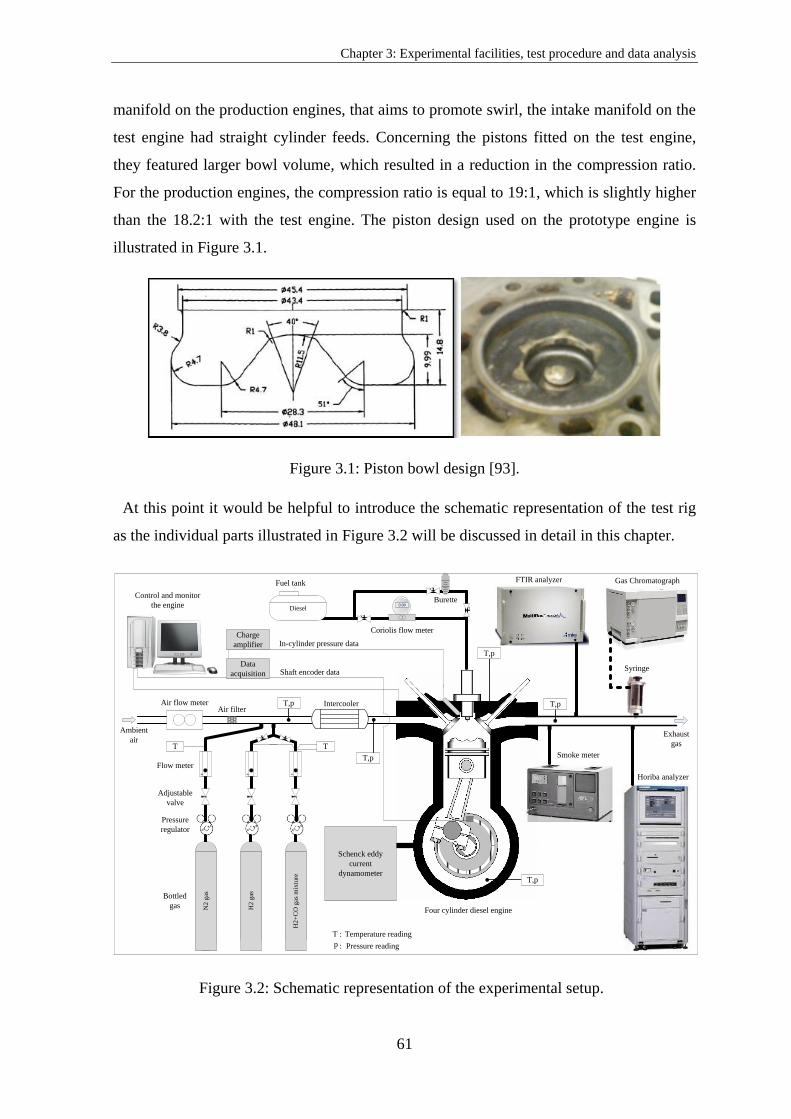
Chapter 3: Experimental facilities, test procedure and data analysis
61
manifold on the production engines, that aims to promote swirl, the intake manifold on the
test engine had straight cylinder feeds. Concerning the pistons fitted on the test engine,
they featured larger bowl volume, which resulted in a reduction in the compression ratio.
For the production engines, the compression ratio is equal to 19:1, which is slightly higher
than the 18.2:1 with the test engine. The piston design used on the prototype engine is
illustrated in Figure 3.1.
Figure 3.1: Piston bowl design [93].
At this point it would be helpful to introduce the schematic representation of the test rig
as the individual parts illustrated in Figure 3.2 will be discussed in detail in this chapter.
Diesel
FFFuel tank
Horiba analyzer
Flow meter
Pressure
regulator
IntercoolerAir flow meter
Shaft encoder data
Smoke meter
v
Ambient
airExhaust
gas
Control and monitor
the engine 0.00
Coriolis flow meter
F
v
Adjustable
valve
Bottled
gas
In-cylinder pressure dataCharge
amplifier
Data
acquisition
Gas Chromatograph
Schenck eddy
current
dynamometer
T,p T,p
T,p
T,p
T,p
Four cylinder diesel engine
Syringe
FTIR analyzer
v
v
Burette
v
`
H2
+C
O g
as m
ixtu
re
`
H
2 g
as
vv
`
N
2 g
as
v TT
T
p
:
:
Temperature reading
Pressure reading
Air filter
Figure 3.2: Schematic representation of the experimental setup.

Chapter 3: Experimental facilities, test procedure and data analysis
62
The fuel injection featured a Delphi common rail system, while each injector had six
holes with nominal diameter equal to 0.154 mm and 154 degree spray hole angle. The
engine was cooled using two distinct circuits. One circuit was used to remove the heat
from the engine by sending water through the passages in the engine block and head,
whereas the other circuit picked up the heat from the lubricating oil. The coolant inlet and
outlet temperatures were monitored and a signal was sent to a thermostat that controlled
the coolant flow, ensuring a temperature range of 77 ± 3 °C. In order to prevent the engine
from overheating, a safety cut off facility that automatically stops the engine in case the
coolant temperature reaches 100 °C was in place.
3.3 Dynamometer
The output shaft of the engine was coupled to a W130 Schenck eddy current dynamometer
that enabled control of the engine load and speed. The cutaway of the dynamometer is
shown in Figure 3.3 and its function is explained below.
Figure 3.3: Cutaway of the eddy current dynamometer (adopted from Schenck user guide).
A magnetic field is generated by the electrical current that passes through the excitation
coil. When the engine is operating, its output shaft spins the rotor of the dynamometer,
causing a constant change in flux density on all stator points. As a result, the eddy currents
induced cause a braking action on the rotor [112]. The torque and shaft power can be
calculated from the current force and the length of the arm. The dynamometer permits the
operator to keep constant either the speed or the torque of the engine. When the torque is
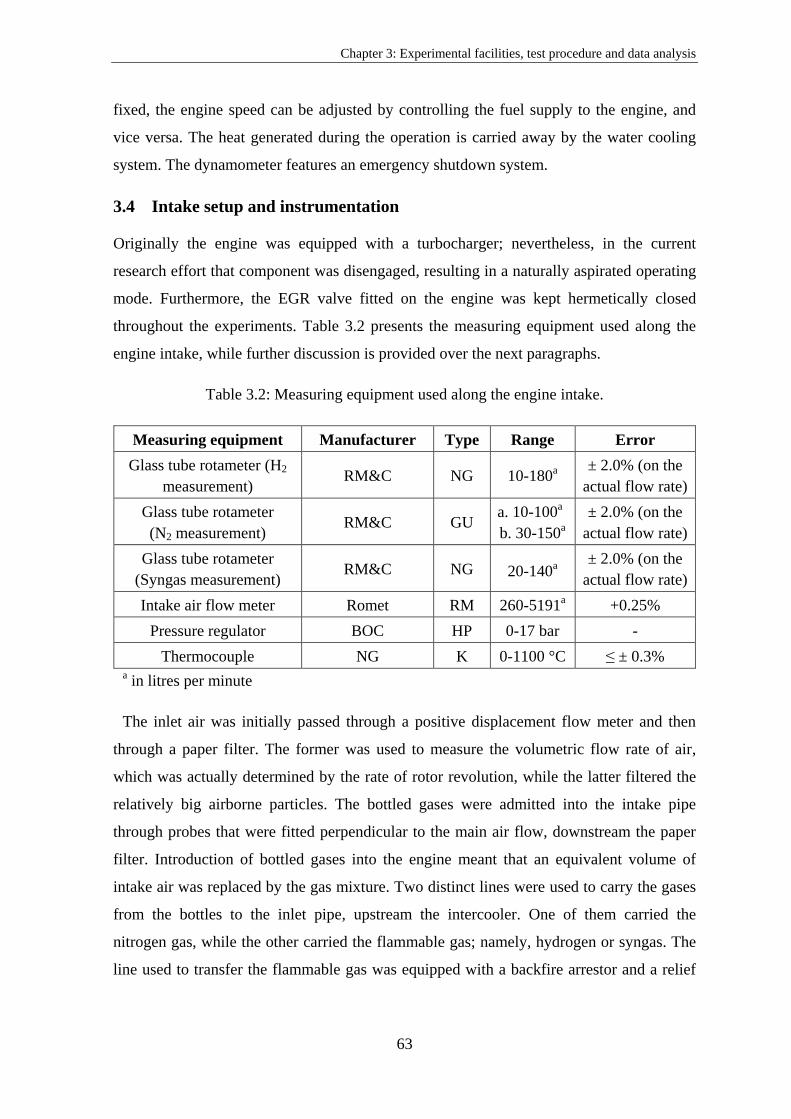
Chapter 3: Experimental facilities, test procedure and data analysis
63
fixed, the engine speed can be adjusted by controlling the fuel supply to the engine, and
vice versa. The heat generated during the operation is carried away by the water cooling
system. The dynamometer features an emergency shutdown system.
3.4 Intake setup and instrumentation
Originally the engine was equipped with a turbocharger; nevertheless, in the current
research effort that component was disengaged, resulting in a naturally aspirated operating
mode. Furthermore, the EGR valve fitted on the engine was kept hermetically closed
throughout the experiments. Table 3.2 presents the measuring equipment used along the
engine intake, while further discussion is provided over the next paragraphs.
Table 3.2: Measuring equipment used along the engine intake.
Measuring equipment Manufacturer Type Range Error
Glass tube rotameter (H2
measurement) RM&C NG 10-180
a
± 2.0% (on the
actual flow rate)
Glass tube rotameter
(N2 measurement) RM&C GU
a. 10-100a
b. 30-150a
± 2.0% (on the
actual flow rate)
Glass tube rotameter
(Syngas measurement) RM&C NG 20-140
a
± 2.0% (on the
actual flow rate)
Intake air flow meter Romet RM 260-5191a +0.25%
Pressure regulator BOC HP 0-17 bar -
Thermocouple NG K 0-1100 °C ≤ ± 0.3% a in litres per minute
The inlet air was initially passed through a positive displacement flow meter and then
through a paper filter. The former was used to measure the volumetric flow rate of air,
which was actually determined by the rate of rotor revolution, while the latter filtered the
relatively big airborne particles. The bottled gases were admitted into the intake pipe
through probes that were fitted perpendicular to the main air flow, downstream the paper
filter. Introduction of bottled gases into the engine meant that an equivalent volume of
intake air was replaced by the gas mixture. Two distinct lines were used to carry the gases
from the bottles to the inlet pipe, upstream the intercooler. One of them carried the
nitrogen gas, while the other carried the flammable gas; namely, hydrogen or syngas. The
line used to transfer the flammable gas was equipped with a backfire arrestor and a relief
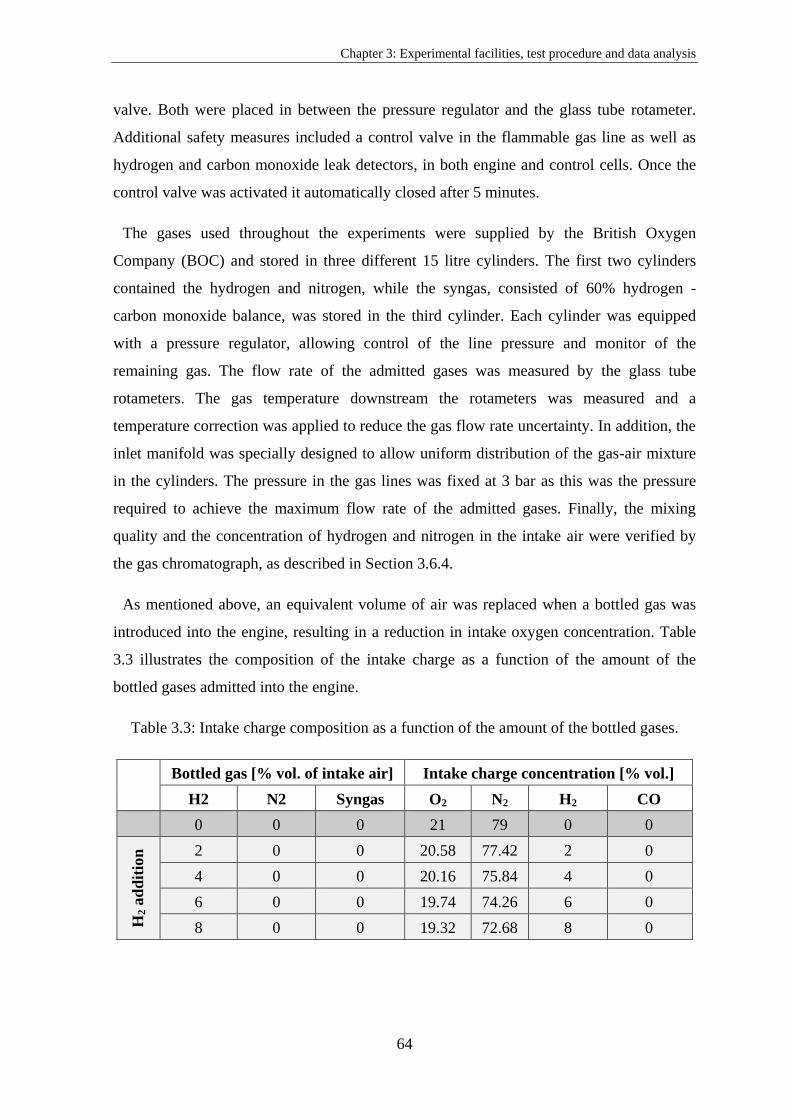
Chapter 3: Experimental facilities, test procedure and data analysis
64
valve. Both were placed in between the pressure regulator and the glass tube rotameter.
Additional safety measures included a control valve in the flammable gas line as well as
hydrogen and carbon monoxide leak detectors, in both engine and control cells. Once the
control valve was activated it automatically closed after 5 minutes.
The gases used throughout the experiments were supplied by the British Oxygen
Company (BOC) and stored in three different 15 litre cylinders. The first two cylinders
contained the hydrogen and nitrogen, while the syngas, consisted of 60% hydrogen -
carbon monoxide balance, was stored in the third cylinder. Each cylinder was equipped
with a pressure regulator, allowing control of the line pressure and monitor of the
remaining gas. The flow rate of the admitted gases was measured by the glass tube
rotameters. The gas temperature downstream the rotameters was measured and a
temperature correction was applied to reduce the gas flow rate uncertainty. In addition, the
inlet manifold was specially designed to allow uniform distribution of the gas-air mixture
in the cylinders. The pressure in the gas lines was fixed at 3 bar as this was the pressure
required to achieve the maximum flow rate of the admitted gases. Finally, the mixing
quality and the concentration of hydrogen and nitrogen in the intake air were verified by
the gas chromatograph, as described in Section 3.6.4.
As mentioned above, an equivalent volume of air was replaced when a bottled gas was
introduced into the engine, resulting in a reduction in intake oxygen concentration. Table
3.3 illustrates the composition of the intake charge as a function of the amount of the
bottled gases admitted into the engine.
Table 3.3: Intake charge composition as a function of the amount of the bottled gases.
Bottled gas [% vol. of intake air] Intake charge concentration [% vol.]
H2 N2 Syngas O2 N2 H2 CO
0 0 0 21 79 0 0
H2 a
dd
itio
n 2 0 0 20.58 77.42 2 0
4 0 0 20.16 75.84 4 0
6 0 0 19.74 74.26 6 0
8 0 0 19.32 72.68 8 0

Chapter 3: Experimental facilities, test procedure and data analysis
65
Bottled gas [% vol. of intake air] Intake charge concentration [% vol.]
H2 N2 Syngas O2 N2 H2 CO
0 0 0 21 79 0 0
N2 a
dd
itio
n 0 2 0 20.58 79.42 0 0
0 4 0 20.16 79.84 0 0
0 6 0 19.74 80.26 0 0
0 8 0 19.32 80.68 0 0
H2-N
2
ad
dit
ion
2 2 0 20.16 77.84 2 0
4 4 0 19.32 76.68 4 0
6 6 0 18.48 75.52 6 0
8 8 0 17.64 74.36 8 0
Syn
gas-
N2
0 2 2 20.16 77.84 1.2 0.8
0 4 4 19.32 76.68 2.4 1.6
0 6 6 18.48 75.52 3.6 2.4
3.5 Diesel fuel supply and measurement
The diesel fuel was stored in a central reservoir. An electric fuel pump was used to send
diesel to the high pressure pump of the engine, which was capable of increasing the
pressure up to 1600 bar. The rate of fuel flow was measured either by a glass burette or a
Coriolis flow meter (interchangeable operation was possible), both fitted upstream the high
pressure pump. The data recorded was then processed to calculate the consumption of
diesel by the engine. The engine was equipped with a common rail system, allowing
multiple injections per cycle. Table 3.4 shows the basic equipment used along the diesel
line.
Table 3.4: Measuring equipment used along the diesel line.
Measuring equipment Manufacturer Type
Glass burette Plint & Partners Ltd 50-100-200
Coriolis flow meter E+H Promass 83
When the glass burette was employed, the time required by the engine to consume a
given volume of fuel was measured by a stopwatch. The mass flow of diesel was
calculated by multiplying the volume flow by the fuel density. This method usually leads
to higher errors, compared to Coriolis, as the measurement is operator dependent.

Chapter 3: Experimental facilities, test procedure and data analysis
66
A Coriolis flow meter is capable of providing more accurate results than the glass
burette. Apart from the flow rate, Cariolis measures the density, the temperature and the
viscosity of the fluid. The operating principle of a Coriolis flow meter is described below.
Coriolis forces occur in an oscillating tube when a liquid or gas flows through it. The
design of the tube is symmetrical and is either straight or curved. The measuring tube is
subject to uniform oscillation mode by a driver. When a fluid moves inside the tube,
additional twisting is imposed on the oscillation. Sensors located at the inlet and outlet
ends pick up the distortion of the tube. This information is analysed by the processor,
which gives the mass flow rate.
3.6 Exhaust gas analysis
Detailed exhaust gas analysis was carried out using a Horiba Mexa 7170DEGR, an MKS
multigas 2030 FTIR gas analyser, an AVL 415S smoke meter and a Chrompack gas
chromatograph (GC) CP 9001 equipped with a thermal conductivity detector (TCD). Table
3.5 shows the exhaust gas measuring equipment employed throughout the experiments.
Table 3.5: Exhaust gas measuring equipment employed throughout the experiments.
Measuring equipment Manufacturer Type
Exhaust gas analyser Horiba Mexa 7170
Exhaust gas analyser MKS 2030
Smoke meter AVL 415S
Gas chromatography Chrompack CP 9001
Horiba is capable of measuring CO and CO2 through a non-dispersive infrared method
(NDIR). The amount of NO emissions in the exhaust gas was determined by the
chemiluminescence of their reaction with ozone, while THC emissions were measured
through a flame ionisation detector (FID). Regulated emissions can also be measured by
the FTIR analyser, the operation of which is based on partial absorption of an infrared
beam by the species present in the exhaust gas. In addition to regulated emissions, FTIR
can provide readings for unregulated emissions. In this study the FTIR was employed to
measure nitrogen exhaust compounds. Besides, simultaneous operation of the two
instruments enabled correlation of the regulated emissions. The Horiba, smoke meter and
FTIR were supplied with exhaust gas directly from the exhaust pipe through the sample

Chapter 3: Experimental facilities, test procedure and data analysis
67
lines. The GC required a small exhaust gas sample that was collected from the exhaust
pipe using a gastight syringe.
3.6.1 Non-dispersive infrared
The principle behind NDIR, which is a type of infrared spectroscopy, is that distinct gas
molecules contained in a sample will absorb infrared light at a specific wavelength. The
concentration of each gas is proportional to the amount of light absorbed, and it is actually
calculated by measuring the amount of light remained at a specific wavelength. A typical
NDIR for CO2 and CO measurements involves a sampling and a reference cell, the latter is
filled with an inert gas such as nitrogen. An infrared beam shines through the sampling and
comparison cells, band pass filters and it finally reaches the detector, as shown in Figure
3.4. Comparison of the two values acquired enables determination of CO2 or CO levels.
In the event of exhaust gas leakage, a CO detector placed in the engine control room
warns the researcher in order to prevent poisoning.
Figure 3.4: Schematic representation of the NDIR principle [113].
3.6.2 Chemiluminescence
The chemiluminescence detection method is based on the chemical reaction between NO
and ozone (O3) as detailed below:
(3.1)
The NO is contained in the exhaust gas, whereas the O3 is produced by the instrument.
When the excited NO2 molecules return to the ground state they emit red light, which is
measured by a photo multiplier after it passes through a filter to eliminate interference
from other gases. Based on this technique, the amount of NOx as well as NO2 emissions
can be determined as follows: firstly, the NO2 is converted to NO, and then the converted
molecules together with the original NO molecules in the exhaust sample react with ozone.
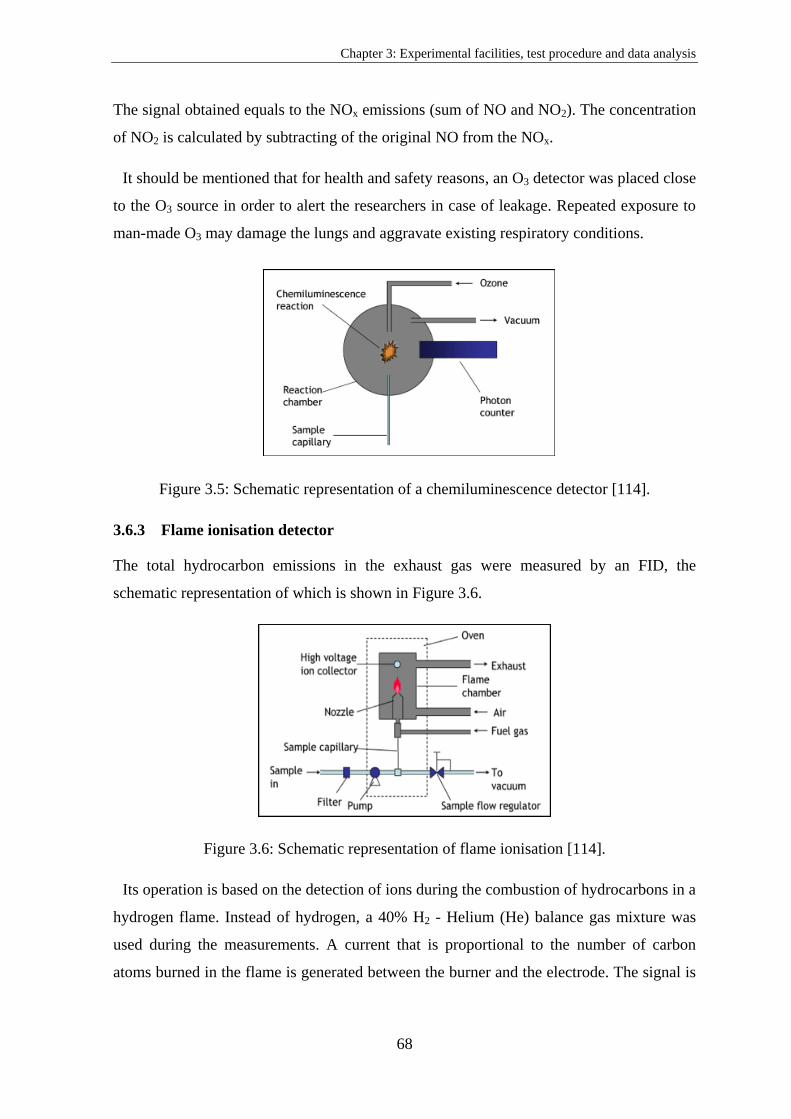
Chapter 3: Experimental facilities, test procedure and data analysis
68
The signal obtained equals to the NOx emissions (sum of NO and NO2). The concentration
of NO2 is calculated by subtracting of the original NO from the NOx.
It should be mentioned that for health and safety reasons, an O3 detector was placed close
to the O3 source in order to alert the researchers in case of leakage. Repeated exposure to
man-made O3 may damage the lungs and aggravate existing respiratory conditions.
Figure 3.5: Schematic representation of a chemiluminescence detector [114].
3.6.3 Flame ionisation detector
The total hydrocarbon emissions in the exhaust gas were measured by an FID, the
schematic representation of which is shown in Figure 3.6.
Figure 3.6: Schematic representation of flame ionisation [114].
Its operation is based on the detection of ions during the combustion of hydrocarbons in a
hydrogen flame. Instead of hydrogen, a 40% H2 - Helium (He) balance gas mixture was
used during the measurements. A current that is proportional to the number of carbon
atoms burned in the flame is generated between the burner and the electrode. The signal is

Chapter 3: Experimental facilities, test procedure and data analysis
69
then processed to give the concentration of THC emissions. It should be clarified that the
value given does not represent the actual volumetric concentration of hydrocarbons in the
exhaust gas, but rather the amount of carbon atoms in the analysed gas.
3.6.4 Gas chromatography
A Chrompack GC equipped with a TCD was used for the measurement of the unburned
hydrogen in the exhaust gas. The TCD compares the thermal conductivity of a carrier gas
and a sample gas. In the current application, the sample gas (that is, the exhaust gas) was
collected from the exhaust pipe using a Hamilton gastight syringe, while high purity
bottled argon was used as the carrier gas. The TCD features a reference and a sample cell.
The carrier gas, which passes through the reference cell, has different thermal conductivity
compared to the sample and the carrier gas that passes through the sample cell. This causes
a variance in the resistance of the electrically heated wires situated within the cells.
Depending on the difference in the resistance, a voltage signal proportional to the
concentration of the sample gas is produced. The structure of the cell is illustrated in
Figure 3.7.
Figure 3.7: Structure of thermal conductivity detector [115].
The analyser was regularly calibrated using certified high purity BOC gases. The
hydrogen concentration in the exhaust gas was always between 0 and 2%; therefore, the
span gases were selected accordingly; namely, 100% N2, 1% H2 - N2 balance and 2% H2 -
N2 balance gas mixtures. The calibration was performed by injecting bottled gas into the
GC in order to get the response of the detector in terms of chromatograph area given by the
integrator.
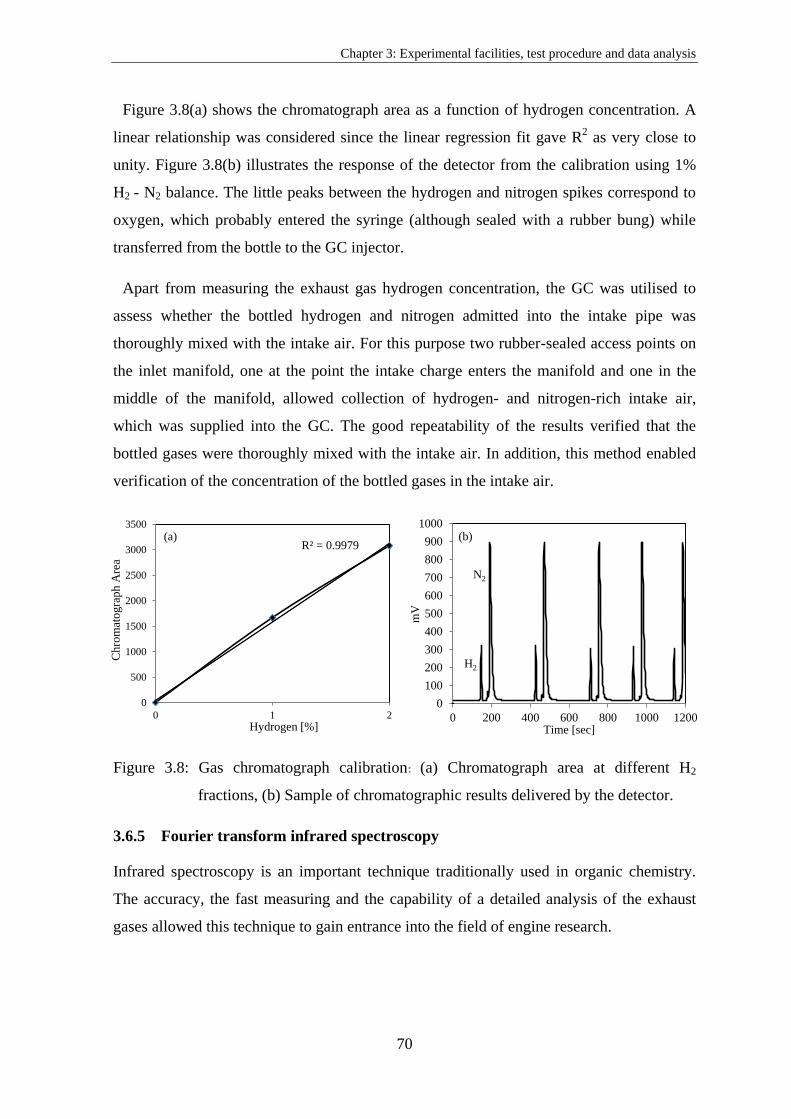
Chapter 3: Experimental facilities, test procedure and data analysis
70
Figure 3.8(a) shows the chromatograph area as a function of hydrogen concentration. A
linear relationship was considered since the linear regression fit gave R2 as very close to
unity. Figure 3.8(b) illustrates the response of the detector from the calibration using 1%
H2 - N2 balance. The little peaks between the hydrogen and nitrogen spikes correspond to
oxygen, which probably entered the syringe (although sealed with a rubber bung) while
transferred from the bottle to the GC injector.
Apart from measuring the exhaust gas hydrogen concentration, the GC was utilised to
assess whether the bottled hydrogen and nitrogen admitted into the intake pipe was
thoroughly mixed with the intake air. For this purpose two rubber-sealed access points on
the inlet manifold, one at the point the intake charge enters the manifold and one in the
middle of the manifold, allowed collection of hydrogen- and nitrogen-rich intake air,
which was supplied into the GC. The good repeatability of the results verified that the
bottled gases were thoroughly mixed with the intake air. In addition, this method enabled
verification of the concentration of the bottled gases in the intake air.
Figure 3.8: Gas chromatograph calibration: (a) Chromatograph area at different H2
fractions, (b) Sample of chromatographic results delivered by the detector.
3.6.5 Fourier transform infrared spectroscopy
Infrared spectroscopy is an important technique traditionally used in organic chemistry.
The accuracy, the fast measuring and the capability of a detailed analysis of the exhaust
gases allowed this technique to gain entrance into the field of engine research.
R² = 0.9979
0
500
1000
1500
2000
2500
3000
3500
0 1 2
Chro
mat
ogra
ph A
rea
Hydrogen [%]
(a)
0
100
200
300
400
500
600
700
800
900
1000
0 200 400 600 800 1000 1200
mV
Time [sec]
(b)
H2
N2

Chapter 3: Experimental facilities, test procedure and data analysis
71
In FTIR spectroscopy an infrared beam that passes through the gas under investigation is
partially absorbed by the gas species that contained in the gas. The level of absorption at a
specific wavelength depends upon the concentration of the specie. Each infrared active gas
has a unique absorption spectrum, which is measured by the FTIR gas analyser and an
analysis algorithm calculates the concentration of each gas using pre-loaded calibrations
[116].
3.6.6 Bosch smoke number
Smoke concentration in the exhaust gas is determined by the filter paper method, Figure
3.9. A probe mounted in the exhaust line draws exhaust gas that passes through a clean
filter paper. The BSN is determined according to the degree to which the filter paper is
blackened. A reflectometer head is used to measure the paper blackening, with zero value
corresponding to white paper and ten to completely black paper [117].
Figure 3.9: Exhaust sampling schematic (adopted from AVL user guide).
3.7 In-cylinder pressure data
The pressure data from the first cylinder was measured by a Kistler 6125A piezoelectric
pressure transducer fitted into the modified glow plug hole. Figure 3.10 shows the cutaway
of the cylinder head with the pressure transducer, fitted into the adapter, and the sensor that
was used to dynamically determine the TDC (mounted into the injector seat).
Changes in the cylinder pressure were converted to an electrical charge (the sensitivity of
the above transducer was 16 pC/bar), which was amplified using a Kistler 5001 charge
amplifier and recorded by a Labview software together with the shaft encoder signal. A

Chapter 3: Experimental facilities, test procedure and data analysis
72
heavy-duty shaft encoder (model ET758) was employed, setting the resolution to 1440
pressure data per crank shaft revolution (that is, 4 samples per crank angle degree). Table
3.6 shows the measuring equipment required to record the in-cylinder pressure data.
Figure 3.10: Cylinder head cross section with the pressure transducer and the TDC sensor.
Table 3.6: Measuring equipment that was used to record the in-cylinder pressure data.
Measuring equipment Manufacturer Type Range Sensitivity
Pressure transducer Kistler 6125A 0-250 bar -16.8pC/bar
Shaft encoder Encoder Technology ET758 0-8000 rpm 0.017°
Figure 3.11 illustrates the TDC sensor adopted for the dynamic determination of the TDC
position. During the calibration process the following steps were performed: The injector
of the first cylinder was removed and the sensor was mounted in the seat. The engine was
run for a few minutes on the motored mode by deactivating the diesel injectors. The output
signal of the sensor, along with the shaft encoder signal, was recorded by the Labview
software and depending on the position of the maximum in-cylinder pressure a correction
factor was applied accordingly.
Figure 3.11: Kistler 2629C1 top dead centre sensor.

Chapter 3: Experimental facilities, test procedure and data analysis
73
The working principle behind the TDC sensor is the generation of a signal when the top
of the piston approaches the sensor tip. The magnitude of the signal is inversely
proportional to the distance between the piston and the sensor. The maximum value
corresponds to the TDC position. The advantage of using such a sensor is that no
correction involving the degree of the thermodynamic loss angle is required.
3.8 Fuel properties
Throughout the experiments the engine was fuelled by ULSD. Admission of hydrogen and
syngas into the engine resulted in dual fuel combustion. Under this operating mode, the
flow rate of ULSD was reduced to keep the speed and load constant. The composition of
the bottled syngas (60% hydrogen - CO balance) resembled that of typical diesel reformer
product gas. The temperature at the end of the compression stroke of the engine was
always lower to the autoignition temperature of hydrogen and syngas; hence, in the dual
fuel mode, the onset of combustion was initiated by diesel injection. Some useful
properties of hydrogen [118] and syngas are illustrated in Table 3.7, while their effects on
the performance and emissions of CI engines are discussed over the next few paragraphs.
Table 3.7: Hydrogen and syngas properties.
Property Unit Value for H2 Value for syngas
Adiabatic flame temperature (φ=1) [K] 2480 ~ 2445
Autoignition temperature in air [K] 858 ~ 867
Density [kg/m3] 0.0824 0.5154
Flame velocity (φ=1) [ms-1
] 1.85 1.2
Flammability limits [% vol. in air] 4 – 75 5.45-75
Lower heating value [MJ/kg] 119.7 20.7
Minimum ignition energy (φ=1) [mJ] 0.02 < 0.3
The heating value of gas mixtures is determined by using the following formula [119]:
∑ (3.2)
where is the heating value of the mixture (mass basis), is the heating value of
the component (mass basis) and is the composition of the gas (mass fraction).
The flammability limits of syngas were predicted by Le Chatelier’s mixing rule [120],
which has been proven accurate at estimating the lower flammability limit (LFL) of gas
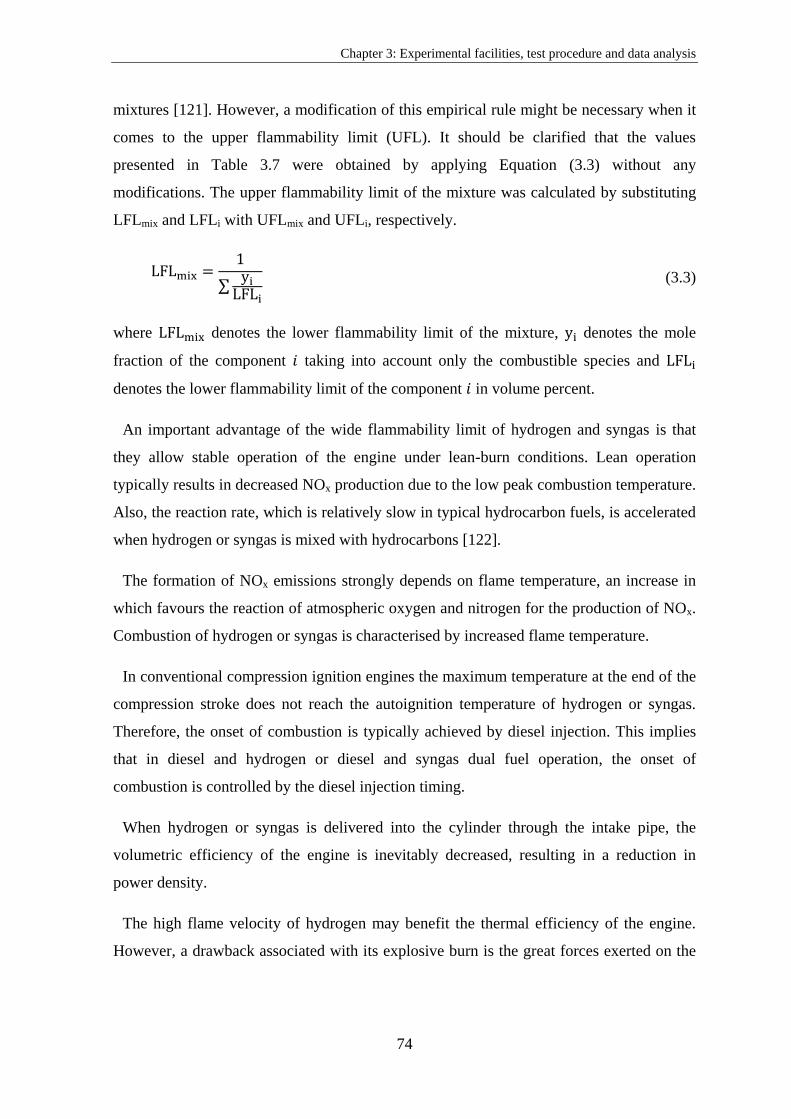
Chapter 3: Experimental facilities, test procedure and data analysis
74
mixtures [121]. However, a modification of this empirical rule might be necessary when it
comes to the upper flammability limit (UFL). It should be clarified that the values
presented in Table 3.7 were obtained by applying Equation (3.3) without any
modifications. The upper flammability limit of the mixture was calculated by substituting
LFLmix and LFLi with UFLmix and UFLi, respectively.
∑
(3.3)
where denotes the lower flammability limit of the mixture, denotes the mole
fraction of the component taking into account only the combustible species and
denotes the lower flammability limit of the component in volume percent.
An important advantage of the wide flammability limit of hydrogen and syngas is that
they allow stable operation of the engine under lean-burn conditions. Lean operation
typically results in decreased NOx production due to the low peak combustion temperature.
Also, the reaction rate, which is relatively slow in typical hydrocarbon fuels, is accelerated
when hydrogen or syngas is mixed with hydrocarbons [122].
The formation of NOx emissions strongly depends on flame temperature, an increase in
which favours the reaction of atmospheric oxygen and nitrogen for the production of NOx.
Combustion of hydrogen or syngas is characterised by increased flame temperature.
In conventional compression ignition engines the maximum temperature at the end of the
compression stroke does not reach the autoignition temperature of hydrogen or syngas.
Therefore, the onset of combustion is typically achieved by diesel injection. This implies
that in diesel and hydrogen or diesel and syngas dual fuel operation, the onset of
combustion is controlled by the diesel injection timing.
When hydrogen or syngas is delivered into the cylinder through the intake pipe, the
volumetric efficiency of the engine is inevitably decreased, resulting in a reduction in
power density.
The high flame velocity of hydrogen may benefit the thermal efficiency of the engine.
However, a drawback associated with its explosive burn is the great forces exerted on the

Chapter 3: Experimental facilities, test procedure and data analysis
75
moving parts of the engine, owing to the high rates of pressure rise. As already presented
in Table 3.7, the flame velocity of syngas is lower compared to hydrogen.
The energy required to ignite hydrogen is only 0.02 mJ, which is one order of magnitude
less than the energy required by gasoline. Although this property can ensure prompt
ignition, it may cause premature ignition issues, with hot spots and hot deposits serving as
potential ignition surfaces [123].
The heating value of hydrogen (per unit mass) is approximately three times that of diesel;
nevertheless, diesel prevails when the comparison is made on volumetric basis. When
hydrogen is not produced on-board, this may pose a challenge since volume occupation is
an important parameter in vehicular applications [124].
The baseline data presented throughout this study was obtained by fuelling the engine
with diesel supplied by Shell. Table 3.8 summarises the properties of diesel fuel.
Table 3.8: Diesel fuel properties.
Parameter Unit Value
Ash content [%] <0.005
Autoignition temp. in air [K] 483
Calorific value [kJ/kg] 44800
Carbon [%] 86.2
Carbon residue [%] 0.2
Cetane number [-] 52.1
Cloud point [K] 263
Density at 288 Kelvin [kg/m3] 853.8
Flash point [K] 341
Hydrogen [%] 13.4
Oxidation stability [g/m3] 14
Oxygen [%] 0
Sulphur content [mg/kg] 10
Total aromatics [%] 10.5
Viscosity at 313 Kelvin [cSt] 2.5
Water content [mg/kg] 61
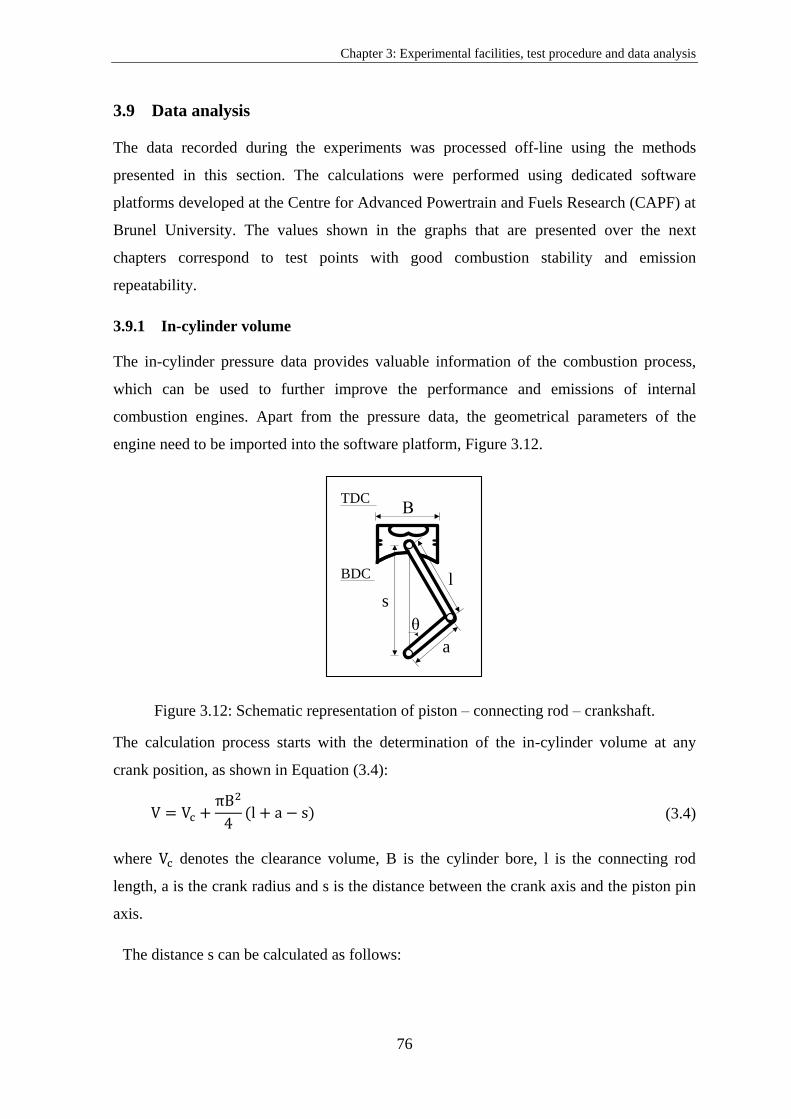
Chapter 3: Experimental facilities, test procedure and data analysis
76
3.9 Data analysis
The data recorded during the experiments was processed off-line using the methods
presented in this section. The calculations were performed using dedicated software
platforms developed at the Centre for Advanced Powertrain and Fuels Research (CAPF) at
Brunel University. The values shown in the graphs that are presented over the next
chapters correspond to test points with good combustion stability and emission
repeatability.
3.9.1 In-cylinder volume
The in-cylinder pressure data provides valuable information of the combustion process,
which can be used to further improve the performance and emissions of internal
combustion engines. Apart from the pressure data, the geometrical parameters of the
engine need to be imported into the software platform, Figure 3.12.
l
a
θ
ΒTDC
BDC
s
Figure 3.12: Schematic representation of piston – connecting rod – crankshaft.
The calculation process starts with the determination of the in-cylinder volume at any
crank position, as shown in Equation (3.4):
(3.4)
where denotes the clearance volume, B is the cylinder bore, l is the connecting rod
length, a is the crank radius and s is the distance between the crank axis and the piston pin
axis.
The distance s can be calculated as follows:

Chapter 3: Experimental facilities, test procedure and data analysis
77
⁄ (3.5)
Equation (3.4) can be rearranged in order to get an equation of in-cylinder volume at any
crank angle θ:
[ ⁄ ] (3.6)
where denotes the compression ratio (defined as the maximum cylinder volume over the
minimum cylinder volume) and R is the ratio of connecting rod length to crank radius ⁄ .
3.9.2 Apparent and cumulative rate of heat release
The gross rate of heat release and the net apparent rate of heat release can be calculated
from experimental measurements by performing heat release rate analysis. The former can
be determined from exhaust gas measurements, whereas the latter from the in-cylinder
pressure data. Homsy and Atreya [125] developed a method for calculating heat transfer to
the walls by taking the difference of the two values; namely, the gross and net apparent
rate of heat release. In this work, the calculation was based on the net apparent heat release
approach, which is derived from the first law of thermodynamics neglecting any blowby,
crevice and enthalpy of the injected fuel effects [93, 126]. The energy balance in the
combustion chamber is given in Equation (3.7): [126] [93]
∑ (3.7)
where is the internal energy, is the convective heat transfer to the cylinder walls,
is the work output, are the losses by the crevices.
Rearrangement of Equation (3.7) is represented in the following form:
(3.8)
The final form of the formula that was used to calculate the net apparent heat release rate
is given in Equation (3.9):
(3.9)

Chapter 3: Experimental facilities, test procedure and data analysis
78
where denotes the net heat release, γ is the ratio of specific heats, P is the pressure and
V is the volume.
Provided that the pressure and volume data was given, the only variable in the equation
above was the ratio of specific heats γ. Many different ways have been proposed to
calculate γ [126]; however, in this study a value of γ = 1.3 [11] was adopted and kept
constant throughout the cycle.
The cumulative heat release rate, the equation of which is detailed below, equals to the
sum of heat release rates at each crank angle:
∑
(3.10)
where IXA denotes the point the heat release curve intersects the x axis, EOC denotes the
end of combustion and k is the resolution of the heat release rate.
3.9.3 Mass fraction burned
The mass fraction burned is another common method that is used to define cumulative
combustion, and it is expressed as the ratio of cumulative heat release to the total heat
release. Equation (3.11) details its calculation:
∫
(3.11)
where is the mass of fuel, is the combustion efficiency and LHV is the lower
heating value of the fuel.
It should be clarified that the start of combustion was taken as the point the heat release
curve intersected the x axis.
3.9.4 Coefficient of variation in indicated mean effective pressure
The effect of blending gaseous with liquid fuels on the cyclic variability of the engine can
be determined by the COVIMEP. For this reason, data from 100 consecutive cycles was
used for the calculation of the COV, which is a measure of combustion stability. The
formula shown below was used to calculate this combustion parameter:
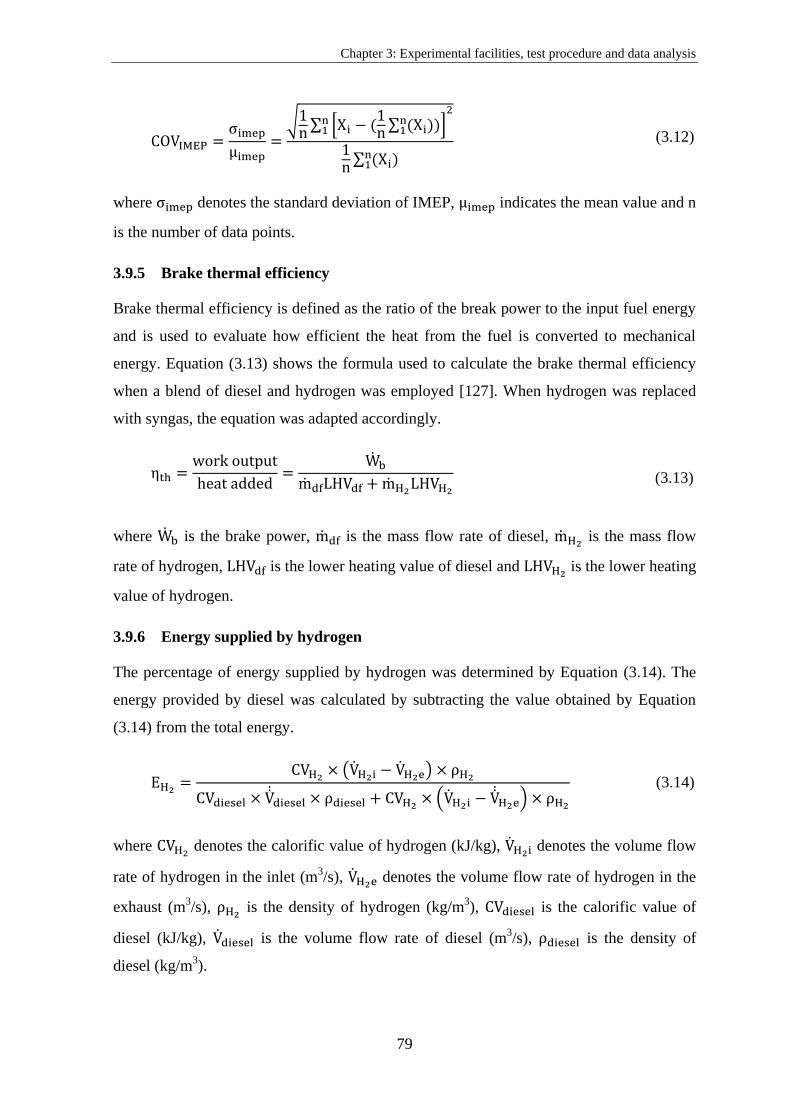
Chapter 3: Experimental facilities, test procedure and data analysis
79
√ ∑ [
∑
]
∑
(3.12)
where denotes the standard deviation of IMEP, indicates the mean value and n
is the number of data points.
3.9.5 Brake thermal efficiency
Brake thermal efficiency is defined as the ratio of the break power to the input fuel energy
and is used to evaluate how efficient the heat from the fuel is converted to mechanical
energy. Equation (3.13) shows the formula used to calculate the brake thermal efficiency
when a blend of diesel and hydrogen was employed [127]. When hydrogen was replaced
with syngas, the equation was adapted accordingly.
(3.13)
where is the brake power, is the mass flow rate of diesel, is the mass flow
rate of hydrogen, is the lower heating value of diesel and is the lower heating
value of hydrogen.
3.9.6 Energy supplied by hydrogen
The percentage of energy supplied by hydrogen was determined by Equation (3.14). The
energy provided by diesel was calculated by subtracting the value obtained by Equation
(3.14) from the total energy.
( )
( )
(3.14)
where denotes the calorific value of hydrogen (kJ/kg), denotes the volume flow
rate of hydrogen in the inlet (m3/s), denotes the volume flow rate of hydrogen in the
exhaust (m3/s),
is the density of hydrogen (kg/m3), is the calorific value of
diesel (kJ/kg), is the volume flow rate of diesel (m3/s), is the density of
diesel (kg/m3).

Chapter 3: Experimental facilities, test procedure and data analysis
80
In order to maintain the speed and load constant at a given operating condition, the
amount of diesel fuel was gradually reduced as the proportion of hydrogen in the intake air
was increased.
3.9.7 Combustion efficiency of hydrogen
The combustion efficiency of hydrogen was calculated using Equation ((3.15) [128]:
(3.15)
where is the combustion efficiency of hydrogen (%), is the volumetric flow
rate of hydrogen in the exhaust (m3/s), is the volumetric flow rate of hydrogen in the
inlet (m3/s).
3.9.8 Bottled gas flow rate
The flow rate of the bottled gases was calculated using Equation (3.16):
(3.16)
where denotes the flow rate of the bottled gas (m3/s), VAF denotes the volumetric
air flow when the engine was operated without the admission of bottled gas (baseline
operation) (m3/s), BGpc denotes the desirable percentage of the bottled gas (% volume).
The volumetric air flow was calculated by the rate of rotor revolution of a positive
displacement flow meter, while introduction of the desirable amount of the bottled gas into
the engine was achieved by using calibrated rotameters with glass tube.
3.10 Test procedure
The experimental investigation includes results from four different operating conditions. In
the first two operating conditions, the speed was kept constant at 1500 rpm, while two
different loads (2.5 and 5 bar BMEP) were applied to the engine. In the next two operating
conditions, same loads were applied but the speed was increased to 2500 rpm. The
conditions selected are representative for low- and medium-duty diesel engines as they
spend most of their running time in between these operating conditions. Therefore, the
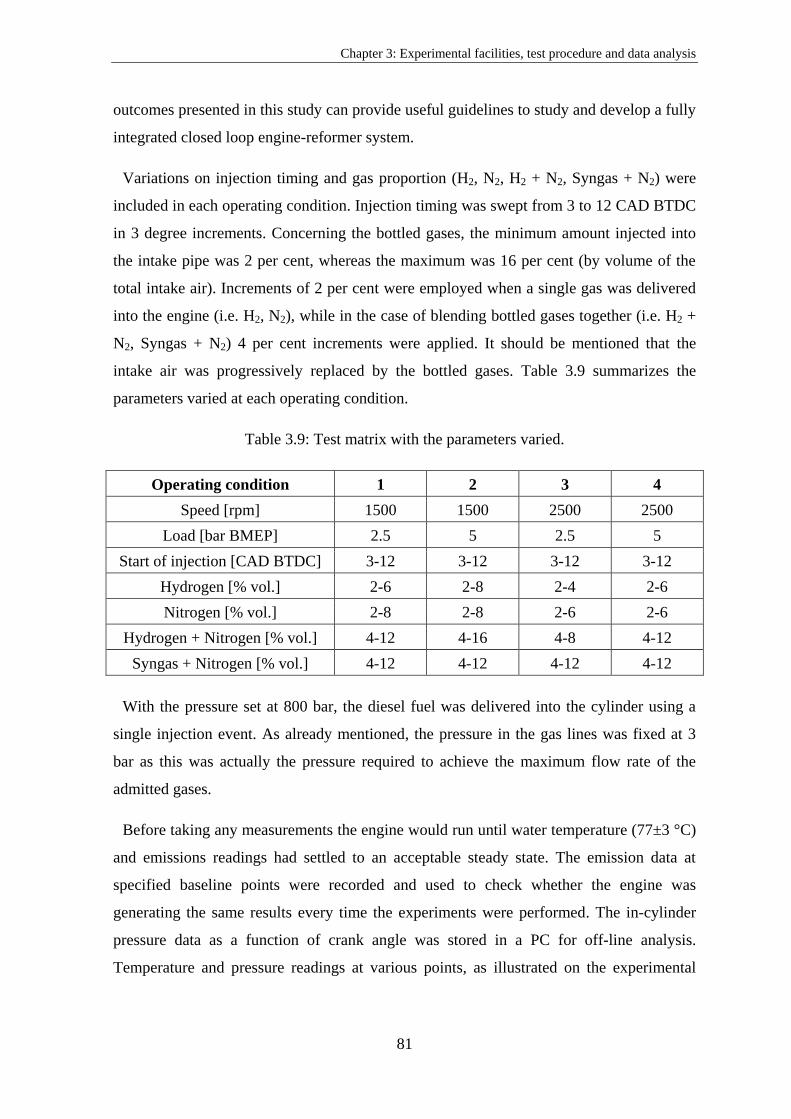
Chapter 3: Experimental facilities, test procedure and data analysis
81
outcomes presented in this study can provide useful guidelines to study and develop a fully
integrated closed loop engine-reformer system.
Variations on injection timing and gas proportion (H2, N2, H2 + N2, Syngas + N2) were
included in each operating condition. Injection timing was swept from 3 to 12 CAD BTDC
in 3 degree increments. Concerning the bottled gases, the minimum amount injected into
the intake pipe was 2 per cent, whereas the maximum was 16 per cent (by volume of the
total intake air). Increments of 2 per cent were employed when a single gas was delivered
into the engine (i.e. H2, N2), while in the case of blending bottled gases together (i.e. H2 +
N2, Syngas + N2) 4 per cent increments were applied. It should be mentioned that the
intake air was progressively replaced by the bottled gases. Table 3.9 summarizes the
parameters varied at each operating condition.
Table 3.9: Test matrix with the parameters varied.
Operating condition 1 2 3 4
Speed [rpm] 1500 1500 2500 2500
Load [bar BMEP] 2.5 5 2.5 5
Start of injection [CAD BTDC] 3-12 3-12 3-12 3-12
Hydrogen [% vol.] 2-6 2-8 2-4 2-6
Nitrogen [% vol.] 2-8 2-8 2-6 2-6
Hydrogen + Nitrogen [% vol.] 4-12 4-16 4-8 4-12
Syngas + Nitrogen [% vol.] 4-12 4-12 4-12 4-12
With the pressure set at 800 bar, the diesel fuel was delivered into the cylinder using a
single injection event. As already mentioned, the pressure in the gas lines was fixed at 3
bar as this was actually the pressure required to achieve the maximum flow rate of the
admitted gases.
Before taking any measurements the engine would run until water temperature (77±3 °C)
and emissions readings had settled to an acceptable steady state. The emission data at
specified baseline points were recorded and used to check whether the engine was
generating the same results every time the experiments were performed. The in-cylinder
pressure data as a function of crank angle was stored in a PC for off-line analysis.
Temperature and pressure readings at various points, as illustrated on the experimental

Chapter 3: Experimental facilities, test procedure and data analysis
82
setup figure, were also provided. Every point shown in the graphs, presented in Chapters 4,
5, 6 and 7, corresponds to a test point with good combustion stability and emission
repeatability. The emission data presented in this study corresponds to raw exhaust gas
measurements.
Chapter 4: Enrichment of the intake air with hydrogen
83
4 CHAPTER 4
ENRICHMENT OF THE INTAKE AIR WITH HYDROGEN
4.1 Introduction
The growing market share of diesel engines coupled with stringent emission regulations
has increased research efforts for the development of cleaner and more efficient
compression ignition engines. The potential of both alternative powertrains [129] and
renewable energy sources to reduce emissions from automobiles has been widely
demonstrated. Extensive research on alternative fuels such as LPG and hydrogen [130],
CNG [131] and biodiesel [132], which may serve as future energy carriers is underway,
with hydrogen situated in a favourable position due to its clean combustion. As already
discussed in previous chapters, hydrogen can either be stored or produced on board. The
latter is likely to serve as a transition solution until issues associated with hydrogen
infrastructure, distribution and storage (which are deemed as the main factors hindering the
mass production of H2-fuelled ICEs) are resolved.
A variety of methods to produce hydrogen on-board have been investigated by various
authors. Tsolakis et al. [96] integrated a fuel reforming reactor within the EGR loop of a
compression ignition engine to derive hydrogen from diesel fuel. Plasmatron fuel
converters can also be used to produce hydrogen from hydrocarbon fuels [133]. Bari and
Mohammad Esmaeil [134] employed an Epoch EP-500 oxy-hydrogen generator machine
to produce a mixture of H2/O2 through water electrolysis, which was then sent into the
inlet manifold.
The aim of this chapter is to study the effects of the enrichment of the intake air with
hydrogen on the performance (hydrogen combustion efficiency and brake thermal
efficiency) and emissions (NOx, smoke, CO and THC) of the engine. The bottled hydrogen
was introduced into the engine through the intake pipe, replacing an equal volume of air.
In general, this technique results in a reduction in oxygen concentration (in contrast to the
direct-cylinder injection); nevertheless, it is the simplest and cheapest way and can be used
in conjunction with the hydrogen production techniques described above and the on-board
hydrogen storage.
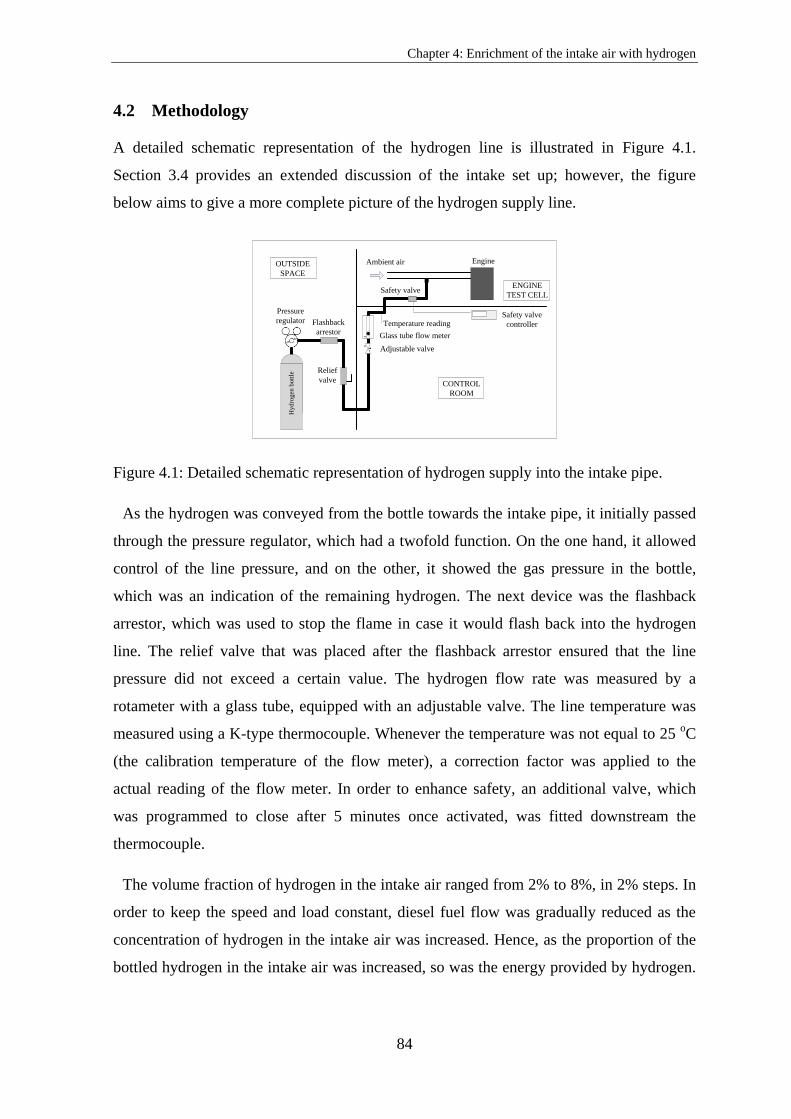
Chapter 4: Enrichment of the intake air with hydrogen
84
4.2 Methodology
A detailed schematic representation of the hydrogen line is illustrated in Figure 4.1.
Section 3.4 provides an extended discussion of the intake set up; however, the figure
below aims to give a more complete picture of the hydrogen supply line.
Glass tube flow meter
Pressure
regulator
Ambient air
Adjustable valve
`
H
ydro
gen
bott
le
Flashback
arrestor
Relief
valve
v
F
Safety valve
Engine
Temperature reading
ENGINE
TEST CELL
Safety valve
controller
OUTSIDE
SPACE
CONTROL
ROOM
Figure 4.1: Detailed schematic representation of hydrogen supply into the intake pipe.
As the hydrogen was conveyed from the bottle towards the intake pipe, it initially passed
through the pressure regulator, which had a twofold function. On the one hand, it allowed
control of the line pressure, and on the other, it showed the gas pressure in the bottle,
which was an indication of the remaining hydrogen. The next device was the flashback
arrestor, which was used to stop the flame in case it would flash back into the hydrogen
line. The relief valve that was placed after the flashback arrestor ensured that the line
pressure did not exceed a certain value. The hydrogen flow rate was measured by a
rotameter with a glass tube, equipped with an adjustable valve. The line temperature was
measured using a K-type thermocouple. Whenever the temperature was not equal to 25 oC
(the calibration temperature of the flow meter), a correction factor was applied to the
actual reading of the flow meter. In order to enhance safety, an additional valve, which
was programmed to close after 5 minutes once activated, was fitted downstream the
thermocouple.
The volume fraction of hydrogen in the intake air ranged from 2% to 8%, in 2% steps. In
order to keep the speed and load constant, diesel fuel flow was gradually reduced as the
concentration of hydrogen in the intake air was increased. Hence, as the proportion of the
bottled hydrogen in the intake air was increased, so was the energy provided by hydrogen.

Chapter 4: Enrichment of the intake air with hydrogen
85
Table 4.1 shows the volume fraction of hydrogen and the corresponding energy fraction it
constitutes, whereas Figure 4.2 presents the same information diagrammatically.
Table 4.1: Tabulated energy supplied by hydrogen.
H2 supply
[%vol.]
Intake air
[%vol.]
Energy from H2 [%], 1500 rpm Energy from H2 [%], 2500 rpm
2.5 bar BMEP 5 bar BMEP 2.5 bar BMEP 5 bar BMEP
0 100 0 0 0 0
2 98 13.65 9.51 11.73 7.92
4 96 27.62 19.00 24.47 15.90
6 94 45.15 28.83 - 25.34
8 92 - 39.13 - -
Figure 4.2: Diagram of the energy supplied by hydrogen.
At a fixed engine speed, the load was adjusted by changing the flow rate of diesel fuel.
Thus, the medium-load operating condition was achieved by increasing the amount of
diesel fuel, keeping the hydrogen flow rate constant. This clearly led to a reduction in the
energy supplied by hydrogen.
4.3 Results and discussion
The effects of hydrogen-rich intake air on the performance, combustion and emissions of a
diesel engine are presented in the following sections. In particular, the results obtained
include the NOx, BSN, CO and THC emissions as well as the brake thermal efficiency, the
0 2 4 6 80
5
10
15
20
25
30
35
40
45
50
Hydrogen [% vol]
En
erg
y s
up
pli
ed
by
hy
dro
gen
[%
]
SOI 9 CAD BTDC, 2.5 bar BMEP
SOI 9 CAD BTDC, 5 bar BMEP
0 2 4 6 8
Hydrogen [% vol]
SOI 9 CAD BTDC, 2.5 bar BMEP
SOI 9 CAD BTDC, 5 bar BMEP
Engine Speed 1500 rpm
Engine Speed 2500 rpm
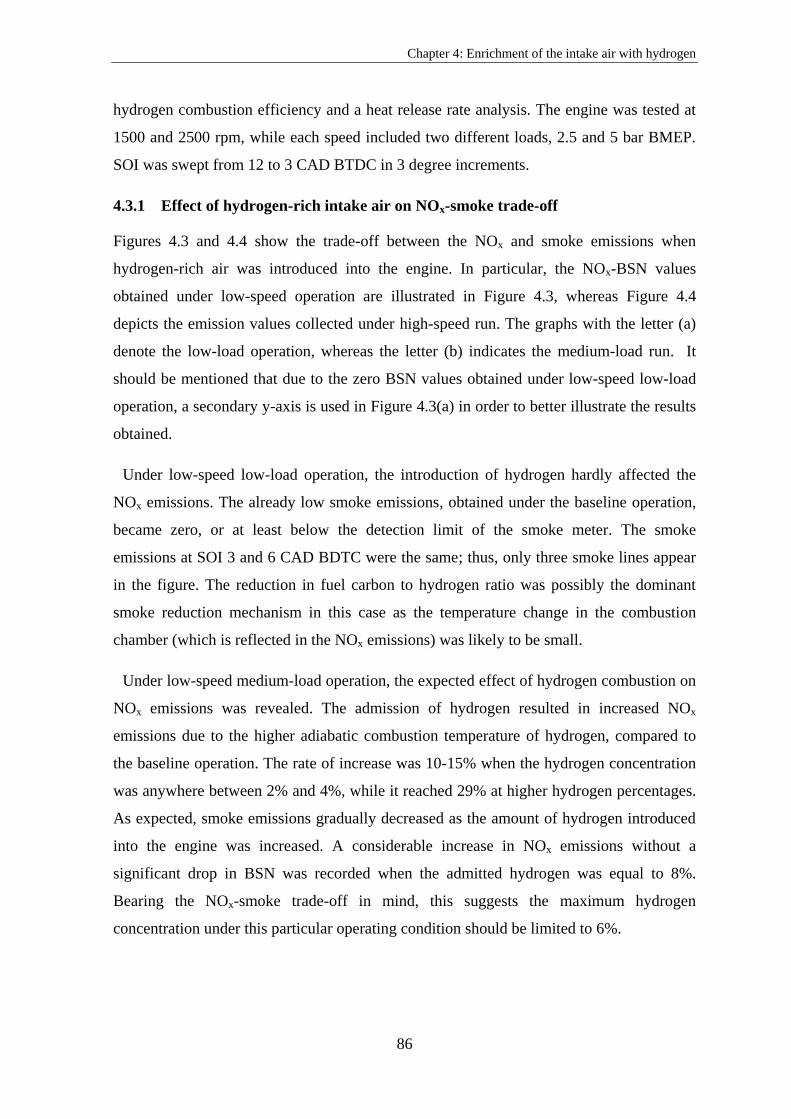
Chapter 4: Enrichment of the intake air with hydrogen
86
hydrogen combustion efficiency and a heat release rate analysis. The engine was tested at
1500 and 2500 rpm, while each speed included two different loads, 2.5 and 5 bar BMEP.
SOI was swept from 12 to 3 CAD BTDC in 3 degree increments.
4.3.1 Effect of hydrogen-rich intake air on NOx-smoke trade-off
Figures 4.3 and 4.4 show the trade-off between the NOx and smoke emissions when
hydrogen-rich air was introduced into the engine. In particular, the NOx-BSN values
obtained under low-speed operation are illustrated in Figure 4.3, whereas Figure 4.4
depicts the emission values collected under high-speed run. The graphs with the letter (a)
denote the low-load operation, whereas the letter (b) indicates the medium-load run. It
should be mentioned that due to the zero BSN values obtained under low-speed low-load
operation, a secondary y-axis is used in Figure 4.3(a) in order to better illustrate the results
obtained.
Under low-speed low-load operation, the introduction of hydrogen hardly affected the
NOx emissions. The already low smoke emissions, obtained under the baseline operation,
became zero, or at least below the detection limit of the smoke meter. The smoke
emissions at SOI 3 and 6 CAD BDTC were the same; thus, only three smoke lines appear
in the figure. The reduction in fuel carbon to hydrogen ratio was possibly the dominant
smoke reduction mechanism in this case as the temperature change in the combustion
chamber (which is reflected in the NOx emissions) was likely to be small.
Under low-speed medium-load operation, the expected effect of hydrogen combustion on
NOx emissions was revealed. The admission of hydrogen resulted in increased NOx
emissions due to the higher adiabatic combustion temperature of hydrogen, compared to
the baseline operation. The rate of increase was 10-15% when the hydrogen concentration
was anywhere between 2% and 4%, while it reached 29% at higher hydrogen percentages.
As expected, smoke emissions gradually decreased as the amount of hydrogen introduced
into the engine was increased. A considerable increase in NOx emissions without a
significant drop in BSN was recorded when the admitted hydrogen was equal to 8%.
Bearing the NOx-smoke trade-off in mind, this suggests the maximum hydrogen
concentration under this particular operating condition should be limited to 6%.
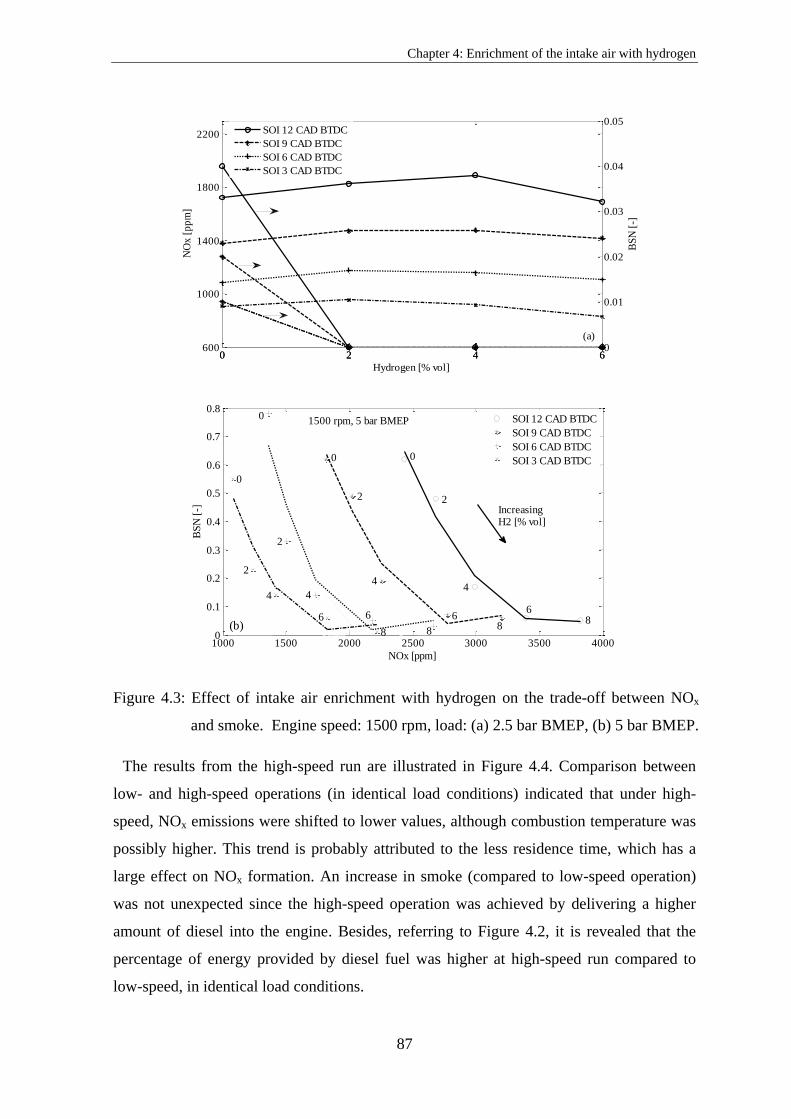
Chapter 4: Enrichment of the intake air with hydrogen
87
Figure 4.3: Effect of intake air enrichment with hydrogen on the trade-off between NOx
and smoke. Engine speed: 1500 rpm, load: (a) 2.5 bar BMEP, (b) 5 bar BMEP.
The results from the high-speed run are illustrated in Figure 4.4. Comparison between
low- and high-speed operations (in identical load conditions) indicated that under high-
speed, NOx emissions were shifted to lower values, although combustion temperature was
possibly higher. This trend is probably attributed to the less residence time, which has a
large effect on NOx formation. An increase in smoke (compared to low-speed operation)
was not unexpected since the high-speed operation was achieved by delivering a higher
amount of diesel into the engine. Besides, referring to Figure 4.2, it is revealed that the
percentage of energy provided by diesel fuel was higher at high-speed run compared to
low-speed, in identical load conditions.
0 2 4 6600
1000
1400
1800
2200
Hydrogen [% vol]
NO
x [
pp
m]
0 2 4 60
0.01
0.02
0.03
0.04
0.05
BS
N [
-]
SOI 12 CAD BTDC
SOI 9 CAD BTDC
SOI 6 CAD BTDC
SOI 3 CAD BTDC
(a)
1000 1500 2000 2500 3000 3500 40000
0.1
0.2
0.3
0.4
0.5
0.6
0.7
0.8
NOx [ppm]
BS
N [
-]
SOI 12 CAD BTDC
SOI 9 CAD BTDC
SOI 6 CAD BTDC
SOI 3 CAD BTDC
1500 rpm, 5 bar BMEP
(b)
IncreasingH2 [% vol]
88 8
0
0
0 0
4
8
44
2
2
22
4
66 66
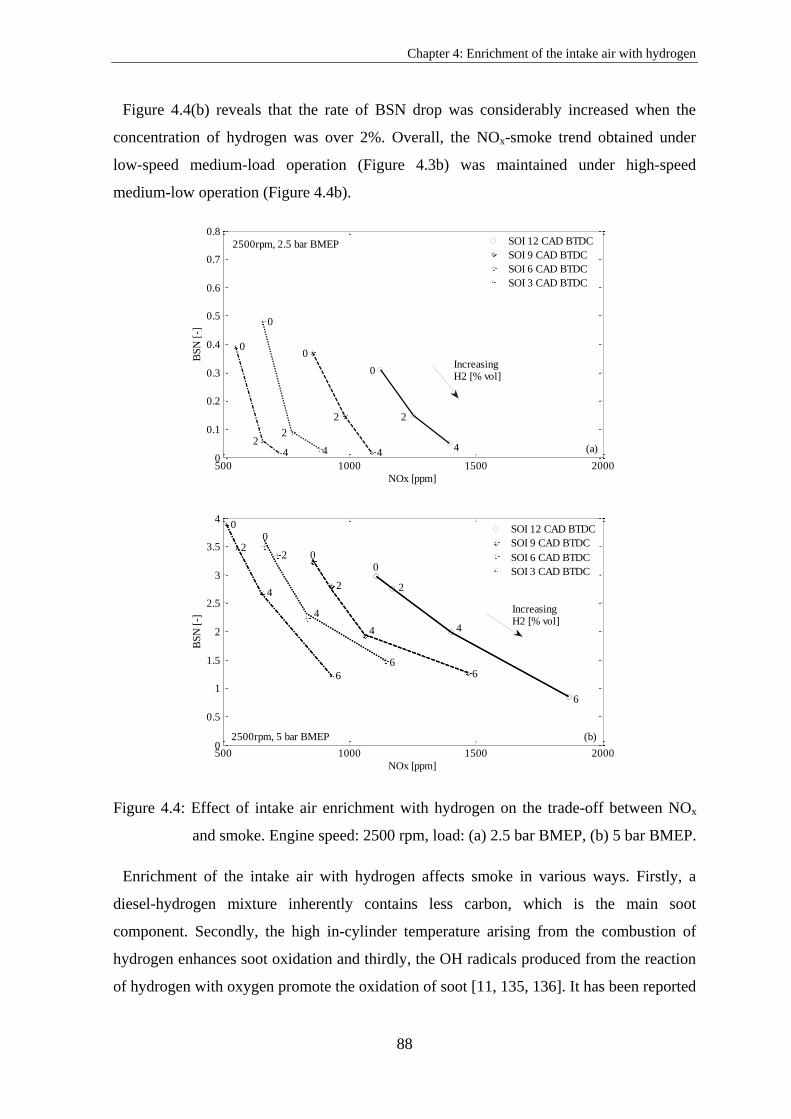
Chapter 4: Enrichment of the intake air with hydrogen
88
Figure 4.4(b) reveals that the rate of BSN drop was considerably increased when the
concentration of hydrogen was over 2%. Overall, the NOx-smoke trend obtained under
low-speed medium-load operation (Figure 4.3b) was maintained under high-speed
medium-low operation (Figure 4.4b).
Figure 4.4: Effect of intake air enrichment with hydrogen on the trade-off between NOx
and smoke. Engine speed: 2500 rpm, load: (a) 2.5 bar BMEP, (b) 5 bar BMEP.
Enrichment of the intake air with hydrogen affects smoke in various ways. Firstly, a
diesel-hydrogen mixture inherently contains less carbon, which is the main soot
component. Secondly, the high in-cylinder temperature arising from the combustion of
hydrogen enhances soot oxidation and thirdly, the OH radicals produced from the reaction
of hydrogen with oxygen promote the oxidation of soot [11, 135, 136]. It has been reported
500 1000 1500 20000
0.1
0.2
0.3
0.4
0.5
0.6
0.7
0.8
NOx [ppm]
BS
N [
-]
SOI 12 CAD BTDC
SOI 9 CAD BTDC
SOI 6 CAD BTDC
SOI 3 CAD BTDC
IncreasingH2 [% vol]
2500rpm, 2.5 bar BMEP
(a)
0
0
2
44
2
0
4
2
0
24
500 1000 1500 20000
0.5
1
1.5
2
2.5
3
3.5
4
NOx [ppm]
BS
N [
-]
SOI 12 CAD BTDC
SOI 9 CAD BTDC
SOI 6 CAD BTDC
SOI 3 CAD BTDC
IncreasingH2 [% vol]
2500rpm, 5 bar BMEP (b)
0
6
0
2
4
0
6
0
2
4
6
2
4
6
4
2

Chapter 4: Enrichment of the intake air with hydrogen
89
that particle size and mass distribution are not significantly affected by the admission of
hydrogen into a diesel engine [137]. [Heywood] [135, 136], [137]
In Figure 4.3(a), NOx emissions remained relatively unaffected irrespective of the
amount of hydrogen supplied into the engine. Hence, it would be interesting to compare
the in-cylinder pressure and the rate of heat release, obtained under this particular
operating condition, with a case in which hydrogen admission led to an increase in NOx
emissions. Figure 4.5 shows a comparison between the in-cylinder pressure data recorded
under low-speed low-load and low-speed medium-load operation and the corresponding
calculated rate of heat release. In Figure 4.5(a), admission of hydrogen into the engine
caused a slight drop in the in-cylinder pressure, compared to the baseline operation. It is
therefore clear that under this operating condition the combustion of hydrogen did not
contribute to an increase in the in-cylinder temperature, which would lead to an increase in
the production of NOx emissions. Under low-speed medium-load operation, fuelling on a
diesel-hydrogen mixture resulted in higher in-cylinder pressure as compared to the
baseline operation, Figure 4.5(b). It can therefore be deduced that the in-cylinder
temperature, the dominant NOx formation factor, reached a higher peak value. Also, in the
same figure, the premixed burn fraction was increased by the admission of hydrogen.
Figure 4.5: Effect of intake air enrichment with hydrogen on the pressure and heat release
rate. Engine conditions: speed 1500 rpm, load (a) 2.5 and (b) 5 bar BMEP,
hydrogen concentration 4% vol., SOI 9 CAD BTDC.

Chapter 4: Enrichment of the intake air with hydrogen
90
4.3.2 Effect of hydrogen-rich intake air on CO emissions
In general, compression ignition engines do not suffer from high CO production because
of their lean operation. Introduction of hydrogen into the engine causes a further reduction
in CO emissions as the carbon content of the fuel is reduced compared to the baseline
operation.
Figure 4.6: Effect of intake air enrichment with hydrogen on the CO emissions. Engine
speed: 1500 rpm, load: (a) 2.5 bar BMEP, (b) 5 bar BMEP.
Figures 4.6 and 4.7 depict the CO emissions as a function of the amount of hydrogen
delivered into the engine. In the majority of the points tested, an increase in the percentage
of hydrogen led to a reduction in CO emissions. The higher CO emissions recorded in a
0 2 4 6 850
100
150
200
250
300
350
400
Hydrogen [% vol]
CO
[p
pm
]
SOI 12 CAD BTDC
SOI 9 CAD BTDC
SOI 6 CAD BTDC
SOI 3 CAD BTDC
1500 rpm, 2.5 bar BMEP (a)
0 2 4 6 850
100
150
200
250
300
350
400
Hydrogen [% vol]
CO
[p
pm
]
SOI 12 CAD BTDC
SOI 9 CAD BTDC
SOI 6 CAD BTDC
SOI 3 CAD BTDC
(b)1500 rpm, 5 bar BMEP
Chapter 4: Enrichment of the intake air with hydrogen
91
few operating points (compared to the previous points in which the amount of hydrogen
was lower), might have been caused by diesel misfire, as the admission of hydrogen
imposed reductions in both oxygen concentration and diesel fuel. For instance, under the
following operating point: 1500rpm - 5 bar BMEP - SOI 12 CAD BTDC - 8% hydrogen
fraction, the COVimep was found to be 2.6%. When diesel injection was commenced
anywhere between 3 and 9 CAD BTDC (keeping the engine speed, load, and hydrogen
fraction constant), the COVimep was found to be 1.6%. The increase in the COVimep when
diesel injection was commenced at 12 CAD BTDC was probably caused by diesel
misfiring. It should be mentioned that under the baseline operation the COVimep did not
significantly change with diesel injection timing.
Figure 4.7: Effect of intake air enrichment with hydrogen on the CO emissions. Engine
speed: 2500 rpm, load: (a) 2.5 bar BMEP, (b) 5 bar BMEP.
0 2 4 6100
200
300
400
500
600
700
Hydrogen [% vol]
CO
[p
pm
]
SOI 12 CAD BTDC
SOI 9 CAD BTDC
SOI 6 CAD BTDC
SOI 3 CAD BTDC
2500 rpm, 2.5 bar BMEP (a)
0 2 4 6100
200
300
400
500
600
700
Hydrogen [% vol]
CO
[p
pm
]
SOI 12 CAD BTDC
SOI 9 CAD BTDC
SOI 6 CAD BTDC
SOI 3 CAD BTDC(b)2500 rpm, 5 bar BMEP
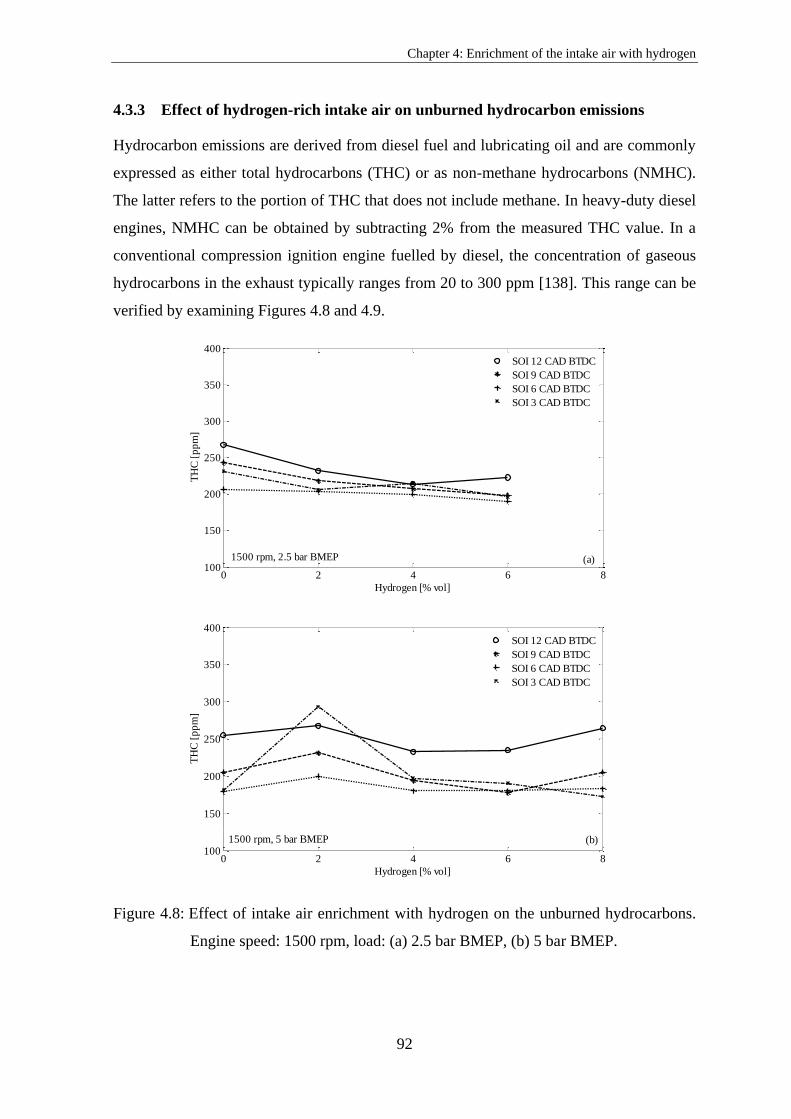
Chapter 4: Enrichment of the intake air with hydrogen
92
4.3.3 Effect of hydrogen-rich intake air on unburned hydrocarbon emissions
Hydrocarbon emissions are derived from diesel fuel and lubricating oil and are commonly
expressed as either total hydrocarbons (THC) or as non-methane hydrocarbons (NMHC).
The latter refers to the portion of THC that does not include methane. In heavy-duty diesel
engines, NMHC can be obtained by subtracting 2% from the measured THC value. In a
conventional compression ignition engine fuelled by diesel, the concentration of gaseous
hydrocarbons in the exhaust typically ranges from 20 to 300 ppm [138]. This range can be
verified by examining Figures 4.8 and 4.9.
Figure 4.8: Effect of intake air enrichment with hydrogen on the unburned hydrocarbons.
Engine speed: 1500 rpm, load: (a) 2.5 bar BMEP, (b) 5 bar BMEP.
0 2 4 6 8100
150
200
250
300
350
400
Hydrogen [% vol]
TH
C [
pp
m]
SOI 12 CAD BTDC
SOI 9 CAD BTDC
SOI 6 CAD BTDC
SOI 3 CAD BTDC
1500 rpm, 2.5 bar BMEP (a)
0 2 4 6 8100
150
200
250
300
350
400
Hydrogen [% vol]
TH
C [
pp
m]
SOI 12 CAD BTDC
SOI 9 CAD BTDC
SOI 6 CAD BTDC
SOI 3 CAD BTDC
1500 rpm, 5 bar BMEP (b)

Chapter 4: Enrichment of the intake air with hydrogen
93
Comparison of the baseline operations at the different speeds and loads tested revealed
that the high-speed medium-load operation produced the lowest THC emissions. From this
finding, it can be concluded that the in-cylinder temperature has a significant impact on the
oxidation of hydrocarbons. Another important finding is that, in the majority of the test
points, THC emissions increased with advancing the diesel injection timing because the
spray tip penetrated deeper (due to low charge density) leading to spray wall impingement.
Figure 4.9: Effect of intake air enrichment with hydrogen on the unburned hydrocarbons.
Engine speed: 2500 rpm, load: (a) 2.5 bar BMEP, (b) 5 bar BMEP.
Enrichment of the intake air with hydrogen led to higher, lower, or unchanged THC
emissions compared to the baseline operation. For instance, in Figure 4.9(b), THC
emissions increased with increasing the percentage of hydrogen. In essence, the hydrogen-
0 2 4 60
50
100
150
200
250
300
Hydrogen [% vol]
TH
C [
pp
m]
SOI 12 CAD BTDC
SOI 9 CAD BTDC
SOI 6 CAD BTDC
SOI 3 CAD BTDC
2500 rpm, 2.5 bar BMEP (a)
0 2 4 60
50
100
150
200
250
300
Hydrogen [% vol]
TH
C [
pp
m]
SOI 12 CAD BTDC
SOI 9 CAD BTDC
SOI 6 CAD BTDC
SOI 3 CAD BTDC
(b)2500 rpm, 5 bar BMEP
Chapter 4: Enrichment of the intake air with hydrogen
94
air mixture has a lower density compared to air which, in conjunction with the high
amount of diesel required in this operating condition, may have led to spray wall
impingement.
In Figure 4.8(a), the small diesel quantity delivered into the cylinder, together with the
excess air, probably compensated for the reduction in the intake charge density; hence, the
introduction of hydrogen did not negatively affect the THC emissions.
4.3.4 Hydrogen combustion efficiency
In a hydrogen-based economy the concentration of hydrogen in the atmosphere would
potentially increase (although it currently exists in trace levels), incurring negative
consequences in the environment [139]. It is therefore important to optimise the
combustion process of the hydrogen dual fuel engines, in order to minimise the unburned
hydrogen emitted in the atmosphere. Clearly, any unburned hydrogen in the exhaust is an
indication of either incomplete combustion or charge flowing past the exhaust valve during
the valve overlap period, both leading to a reduction in the engine thermal efficiency.
However, in a diesel-hydrogen dual fuel engine the unburned hydrogen can be utilised in
the regeneration process of the DPF. Moreover, it can be used to enhance the performance
of the NOx aftertreatment system [140, 141]. This could evidently improve both fuel
economy and CO2 emissions by reducing the burden on the aftertreatment systems.
In the current experimental setup, the unburned hydrogen was measured using a gas
chromatograph (TCD), as described in Section 3.6.4. The instrument was calibrated using
certified high purity bottled hydrogen the concentration of which was between 0% and 2%.
The combustion efficiency of hydrogen, depicted in Figures 4.10 and 4.11, was calculated
based on Equation (3.15).
Before taking any measurements from the dual fuel mode, it was considered necessary to
check whether the hydrogen measured in the exhaust gas was exclusively originated from
the bottle supply, and that there was no contribution from diesel reactions, which
according to Bond et al. [142] produce marginal hydrogen emissions. Exhaust samples
from the baseline operation were injected into the GC, which did not respond at all. Thus,
it was presumed that the baseline operation was not producing hydrogen, or the amount
produced was very low and could not be detected from the GC.

Chapter 4: Enrichment of the intake air with hydrogen
95
In order to interpret the results the flammability limit of hydrogen needs to be introduced.
As already shown in Chapter 3, the LFL of hydrogen is 4% at temperature and pressure 25
oC and 1 bar, respectively. Nevertheless, in a diesel engine combustion chamber, both
pressure and temperature are considerably higher resulting in different LFL. In fact, LFL
increases with pressure, whereas an increase in temperature leads to a reduction in LFL
[143].
Figure 4.10: Hydrogen combustion efficiency. Engine speed: 1500 rpm, load: (a) 2.5 bar
BMEP, (b) 5 bar BMEP.
Under low-speed low-load operation and a hydrogen percentage over 4% (above the
LFL), the combustion efficiency of hydrogen was over 90%, Figure 4.10(a). In general,
when the concentration of hydrogen is below the LFL, the flame cannot propagate into the
2 4 6 885
90
95
100
Injected Hydrogen [% vol]
H2
co
mb
ust
ion
eff
icie
ncy
[%
]
SOI 12 CAD BTDC
SOI 9 CAD BTDC
SOI 6 CAD BTDC
SOI 3 CAD BTDC
1500 rpm, 2.5 bar BMEP (a)
2 4 6 885
90
95
100
Injected Hydrogen [% vol]
H2
co
mb
ust
ion
eff
icie
ncy
[%
]
SOI 12 CAD BTDC
SOI 9 CAD BTDC
SOI 6 CAD BTDC
SOI 3 CAD BTDC1500 rpm, 5 bar BMEP (b)

Chapter 4: Enrichment of the intake air with hydrogen
96
hydrogen-air mixture because it is too lean. Hydrogen burns together with diesel fuel by
entraining into the diesel vapour [128]. In the same figure, the combustion efficiency of
hydrogen slightly deteriorated when the hydrogen concentration was increased from 2% to
4% with diesel injection commenced after 9 CAD BTDC.
In Figure 4.10(b), the combustion efficiency of hydrogen was gradually increased by
increasing the proportion of hydrogen. The dominant factors that contributed to the
enhancement of hydrogen combustion efficiency are: the exposure of hydrogen to higher
in-cylinder temperatures, leading to a reduction in the LFL, and the larger amount of diesel
delivered into the combustion chamber.
Figure 4.11: Hydrogen combustion efficiency. Engine speed: 2500 rpm, load: (a) 2.5 bar
BMEP, (b) 5 bar BMEP.
2 4 685
90
95
100
Injected Hydrogen [% vol]
H2
co
mb
ust
ion
eff
icie
ncy
[%
]
SOI 12 CAD BTDC
SOI 9 CAD BTDC
SOI 6 CAD BTDC
SOI 3 CAD BTDC
(a)2500 rpm, 2.5 bar BMEP
2 4 685
90
95
100
Injected Hydrogen [% vol]
H2
co
mb
ust
ion
eff
icie
ncy
[%
]
SOI 12 CAD BTDC
SOI 9 CAD BTDC
SOI 6 CAD BTDC
SOI 3 CAD BTDC2500 rpm, 5 bar BMEP (b)
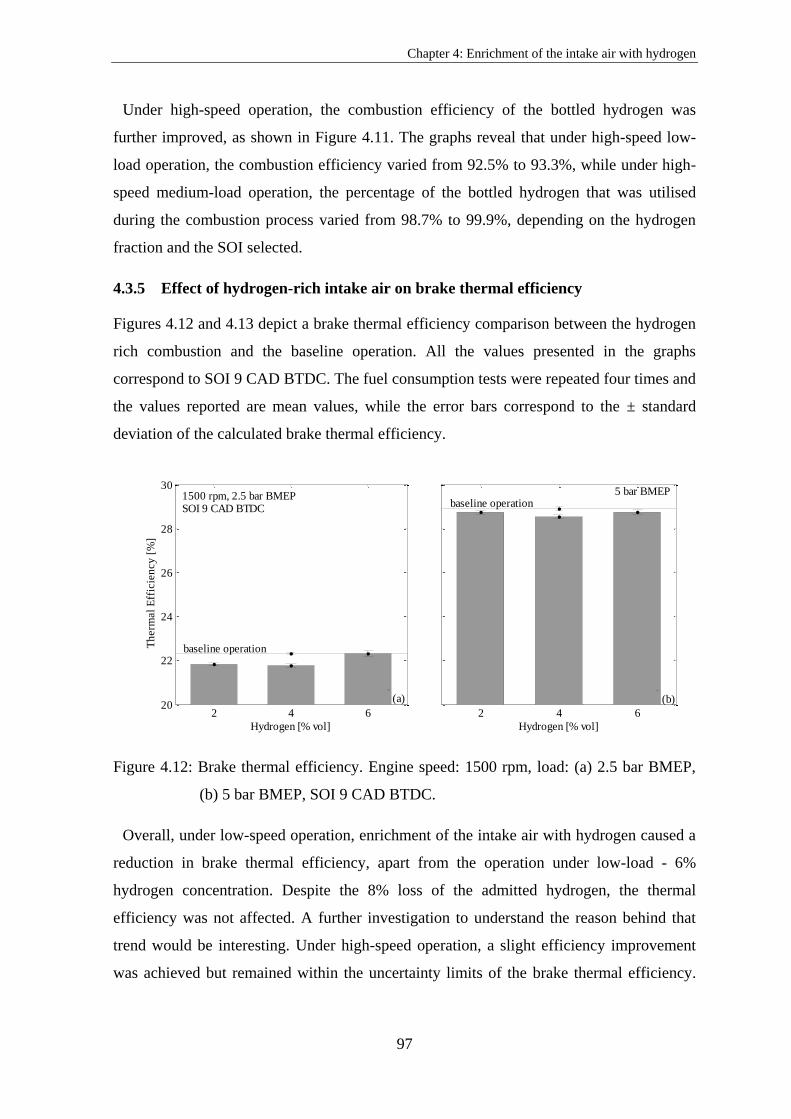
Chapter 4: Enrichment of the intake air with hydrogen
97
Under high-speed operation, the combustion efficiency of the bottled hydrogen was
further improved, as shown in Figure 4.11. The graphs reveal that under high-speed low-
load operation, the combustion efficiency varied from 92.5% to 93.3%, while under high-
speed medium-load operation, the percentage of the bottled hydrogen that was utilised
during the combustion process varied from 98.7% to 99.9%, depending on the hydrogen
fraction and the SOI selected.
4.3.5 Effect of hydrogen-rich intake air on brake thermal efficiency
Figures 4.12 and 4.13 depict a brake thermal efficiency comparison between the hydrogen
rich combustion and the baseline operation. All the values presented in the graphs
correspond to SOI 9 CAD BTDC. The fuel consumption tests were repeated four times and
the values reported are mean values, while the error bars correspond to the ± standard
deviation of the calculated brake thermal efficiency.
Figure 4.12: Brake thermal efficiency. Engine speed: 1500 rpm, load: (a) 2.5 bar BMEP,
(b) 5 bar BMEP, SOI 9 CAD BTDC.
Overall, under low-speed operation, enrichment of the intake air with hydrogen caused a
reduction in brake thermal efficiency, apart from the operation under low-load - 6%
hydrogen concentration. Despite the 8% loss of the admitted hydrogen, the thermal
efficiency was not affected. A further investigation to understand the reason behind that
trend would be interesting. Under high-speed operation, a slight efficiency improvement
was achieved but remained within the uncertainty limits of the brake thermal efficiency.
2 4 620
22
24
26
28
30
Hydrogen [% vol]
Th
erm
al
Eff
icie
ncy
[%
]
2 4 6
Hydrogen [% vol]
baseline operation
(a)
baseline operation1500 rpm, 2.5 bar BMEPSOI 9 CAD BTDC
5 bar BMEP
(b)

Chapter 4: Enrichment of the intake air with hydrogen
98
As discussed in Section 4.3.4, hydrogen combustion efficiency increased with the load and
speed. The largest efficiency loss (around 0.5%) was observed under low-speed low-load
operation when the concentration of hydrogen was below 4%. With reference to Figure
4.10(a), around 10% of the admitted hydrogen was not utilised in this particular operating
condition, and this was probably the main reason for the drop in thermal efficiency.
Figure 4.13: Brake thermal efficiency. Engine speed: 2500 rpm, load: (a) 2.5 bar BMEP,
(b) 5 bar BMEP, SOI 9 CAD BTDC.
4.4 Summary
The effects of hydrogen enrichment of the intake air on the performance and emissions of
an HSDI diesel engine were investigated. The concentration of hydrogen in the intake air
was varied from 2% up to 8% (v/v of the total intake charge), in 2% steps. The main
findings from this chapter can be summarised as follows:
In the majority of the conditions tested, part substitution of diesel fuel with
hydrogen reduced smoke at the expense of NOx emissions. Under low-speed low-
load operation, enrichment of the intake air with hydrogen was found to have an
insignificant effect on NOx emissions.
A considerable increase in NOx without a significant drop in BSN was recorded
under low-speed medium-load operation and hydrogen fraction equal to 8%.
Bearing the NOx-smoke trade-off in mind, this suggests the maximum hydrogen
concentration under this operating condition should be limited to 6%.
2 4 617
18
19
20
21
22
23
24
25
26
27
Hydrogen [% vol]
Th
erm
al
Eff
icie
ncy
[%
]
2 4 6
Hydrogen [% vol]
2500 rpm, 5 bar BMEPSOI 9 CAD BTDC
baseline operation
(b)
2500 rpm, 2.5 bar BMEPSOI 9 CAD BTDC
(a)
baseline operation
Chapter 4: Enrichment of the intake air with hydrogen
99
The high-speed operation resulted in lower NOx emissions compared to the low-
speed (at identical load, hydrogen concentration and start of diesel injection). The
reduction of residence time was probably the dominant factor that led to lower NOx
values.
The CO emissions were reduced as the amount of hydrogen supplied into the
engine was increased due to the reduction in the fuel carbon to hydrogen ratio.
The THC emissions increased with advancing injection timing because the spray
tip penetrated deeper into the cylinder, due to the low charge density, leading to
spray wall impingement.
Enrichment of the intake air with hydrogen can lead to higher, lower or unchanged
THC emissions compared to the baseline operation. For instance, under high-speed
medium-load operation, the THC emissions increased with increasing the
percentage of hydrogen. In essence, the hydrogen-air mixture has a lower density
compared to air which, in conjunction with the high amount of diesel required in
this operating condition, may have led to spray wall impingement. Under low-
speed low-load operation, the introduction of hydrogen did not negatively affect
the THC emissions, as the small diesel quantity delivered into the cylinder,
together with the excess air, probably compensated for the reduction in the intake
charge density.
Hydrogen combustion efficiency improved with increasing the speed, load and
hydrogen proportion. In general, unburned hydrogen in the exhaust gas originates
from incomplete combustion of hydrogen and charge flowing past the exhaust
valve during the valve overlap period. The latter can be eliminated by injecting
hydrogen after the closure of the exhaust valve.
Overall, under low-speed operation, enrichment of the intake air with hydrogen
caused a reduction in brake thermal efficiency. Under high-speed operation, a
slight efficiency improvement was achieved but remained within the uncertainty
limits of the brake thermal efficiency.
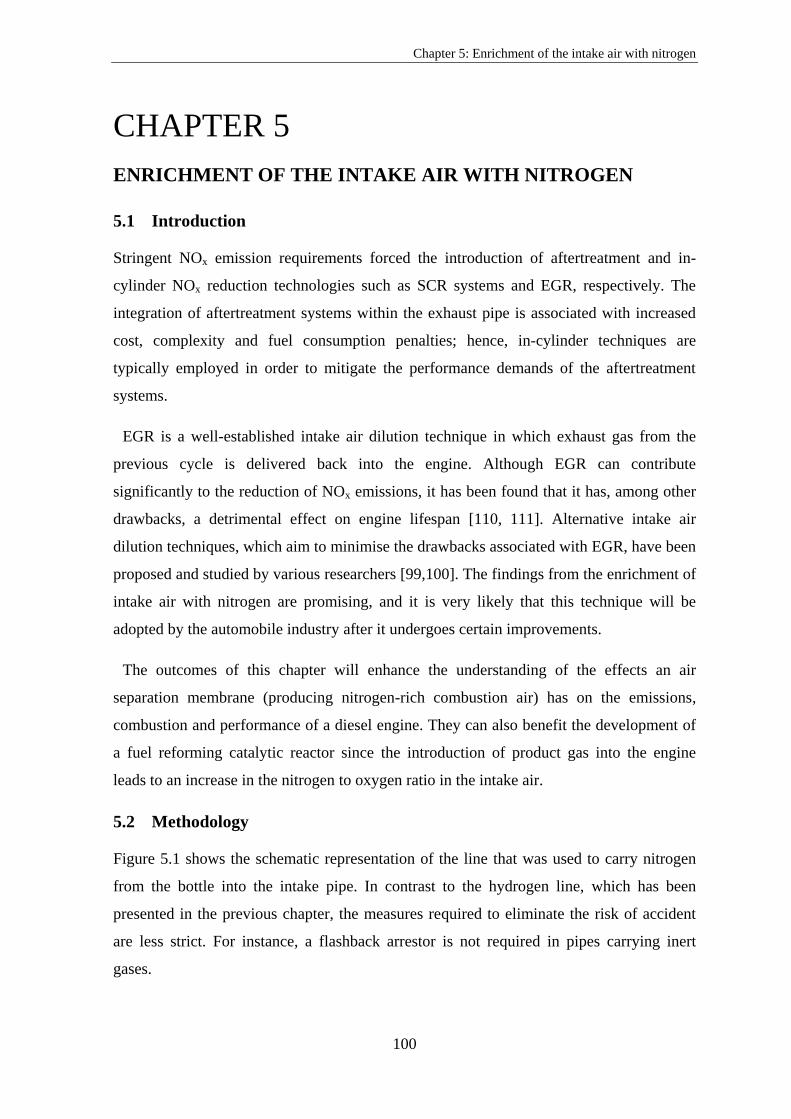
Chapter 5: Enrichment of the intake air with nitrogen
100
5 CHAPTER 5
ENRICHMENT OF THE INTAKE AIR WITH NITROGEN
5.1 Introduction
Stringent NOx emission requirements forced the introduction of aftertreatment and in-
cylinder NOx reduction technologies such as SCR systems and EGR, respectively. The
integration of aftertreatment systems within the exhaust pipe is associated with increased
cost, complexity and fuel consumption penalties; hence, in-cylinder techniques are
typically employed in order to mitigate the performance demands of the aftertreatment
systems.
EGR is a well-established intake air dilution technique in which exhaust gas from the
previous cycle is delivered back into the engine. Although EGR can contribute
significantly to the reduction of NOx emissions, it has been found that it has, among other
drawbacks, a detrimental effect on engine lifespan [110, 111]. Alternative intake air
dilution techniques, which aim to minimise the drawbacks associated with EGR, have been
proposed and studied by various researchers [99,100]. The findings from the enrichment of
intake air with nitrogen are promising, and it is very likely that this technique will be
adopted by the automobile industry after it undergoes certain improvements. [110] [111]
The outcomes of this chapter will enhance the understanding of the effects an air
separation membrane (producing nitrogen-rich combustion air) has on the emissions,
combustion and performance of a diesel engine. They can also benefit the development of
a fuel reforming catalytic reactor since the introduction of product gas into the engine
leads to an increase in the nitrogen to oxygen ratio in the intake air.
5.2 Methodology
Figure 5.1 shows the schematic representation of the line that was used to carry nitrogen
from the bottle into the intake pipe. In contrast to the hydrogen line, which has been
presented in the previous chapter, the measures required to eliminate the risk of accident
are less strict. For instance, a flashback arrestor is not required in pipes carrying inert
gases.
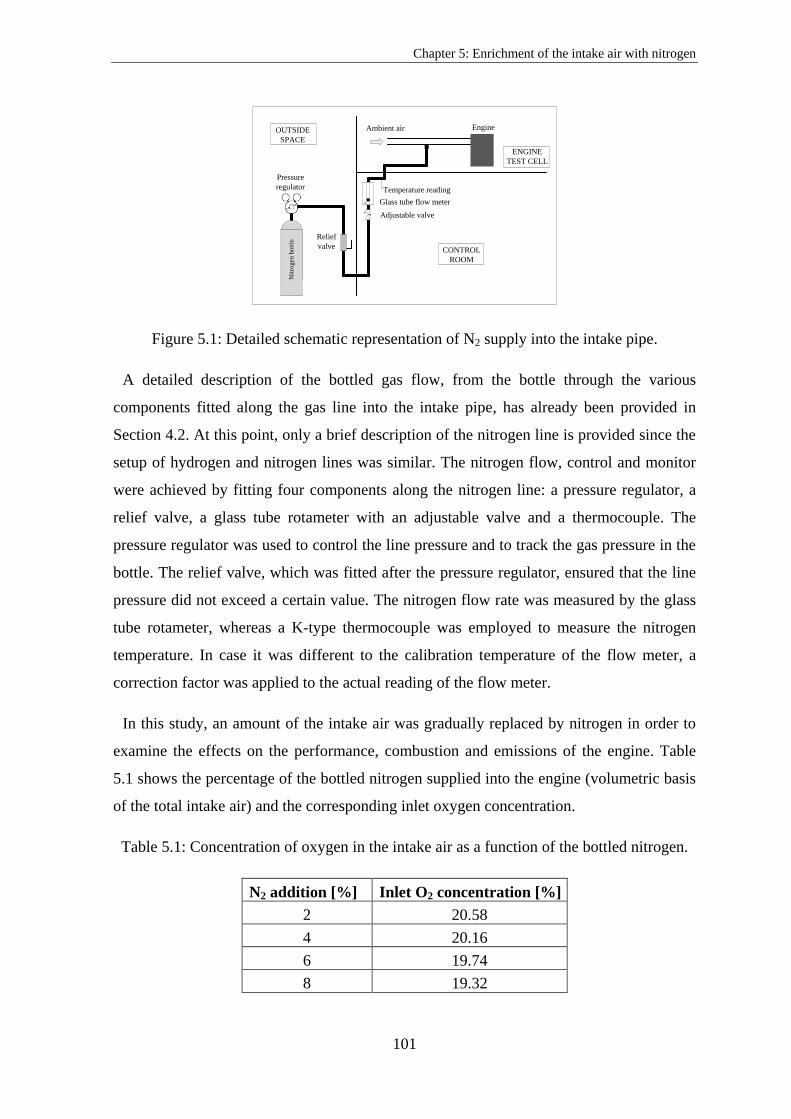
Chapter 5: Enrichment of the intake air with nitrogen
101
Glass tube flow meter
Pressure
regulator
Ambient air
Adjustable valve
`
N
itro
gen
bott
le
Relief
valve
v
F
Engine
Temperature reading
ENGINE
TEST CELL
OUTSIDE
SPACE
CONTROL
ROOM
Figure 5.1: Detailed schematic representation of N2 supply into the intake pipe.
A detailed description of the bottled gas flow, from the bottle through the various
components fitted along the gas line into the intake pipe, has already been provided in
Section 4.2. At this point, only a brief description of the nitrogen line is provided since the
setup of hydrogen and nitrogen lines was similar. The nitrogen flow, control and monitor
were achieved by fitting four components along the nitrogen line: a pressure regulator, a
relief valve, a glass tube rotameter with an adjustable valve and a thermocouple. The
pressure regulator was used to control the line pressure and to track the gas pressure in the
bottle. The relief valve, which was fitted after the pressure regulator, ensured that the line
pressure did not exceed a certain value. The nitrogen flow rate was measured by the glass
tube rotameter, whereas a K-type thermocouple was employed to measure the nitrogen
temperature. In case it was different to the calibration temperature of the flow meter, a
correction factor was applied to the actual reading of the flow meter.
In this study, an amount of the intake air was gradually replaced by nitrogen in order to
examine the effects on the performance, combustion and emissions of the engine. Table
5.1 shows the percentage of the bottled nitrogen supplied into the engine (volumetric basis
of the total intake air) and the corresponding inlet oxygen concentration.
Table 5.1: Concentration of oxygen in the intake air as a function of the bottled nitrogen.
N2 addition [%] Inlet O2 concentration [%]
2 20.58
4 20.16
6 19.74
8 19.32
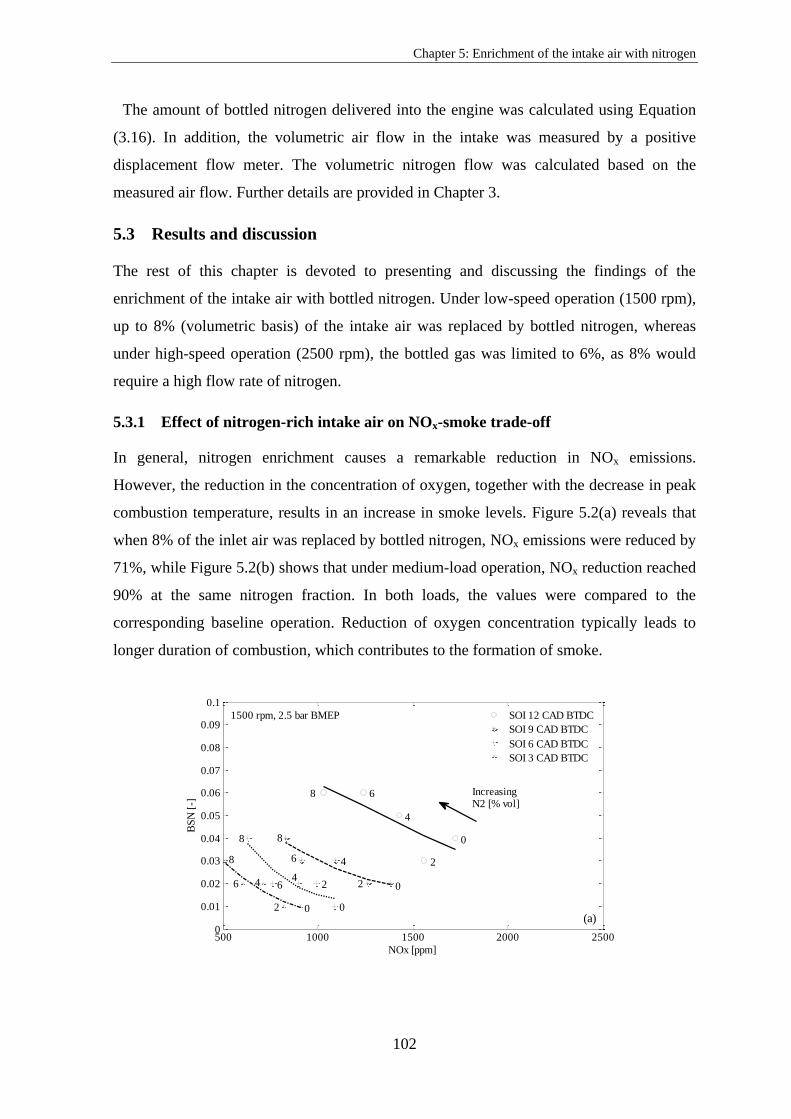
Chapter 5: Enrichment of the intake air with nitrogen
102
The amount of bottled nitrogen delivered into the engine was calculated using Equation
(3.16). In addition, the volumetric air flow in the intake was measured by a positive
displacement flow meter. The volumetric nitrogen flow was calculated based on the
measured air flow. Further details are provided in Chapter 3.
5.3 Results and discussion
The rest of this chapter is devoted to presenting and discussing the findings of the
enrichment of the intake air with bottled nitrogen. Under low-speed operation (1500 rpm),
up to 8% (volumetric basis) of the intake air was replaced by bottled nitrogen, whereas
under high-speed operation (2500 rpm), the bottled gas was limited to 6%, as 8% would
require a high flow rate of nitrogen.
5.3.1 Effect of nitrogen-rich intake air on NOx-smoke trade-off
In general, nitrogen enrichment causes a remarkable reduction in NOx emissions.
However, the reduction in the concentration of oxygen, together with the decrease in peak
combustion temperature, results in an increase in smoke levels. Figure 5.2(a) reveals that
when 8% of the inlet air was replaced by bottled nitrogen, NOx emissions were reduced by
71%, while Figure 5.2(b) shows that under medium-load operation, NOx reduction reached
90% at the same nitrogen fraction. In both loads, the values were compared to the
corresponding baseline operation. Reduction of oxygen concentration typically leads to
longer duration of combustion, which contributes to the formation of smoke.
500 1000 1500 2000 25000
0.01
0.02
0.03
0.04
0.05
0.06
0.07
0.08
0.09
0.1
NOx [ppm]
BS
N [
-]
SOI 12 CAD BTDC
SOI 9 CAD BTDC
SOI 6 CAD BTDC
SOI 3 CAD BTDC
(a)
IncreasingN2 [% vol]
1500 rpm, 2.5 bar BMEP
8 6
4
0
2
02
46
8
0
26
8
44
8
6
2 0
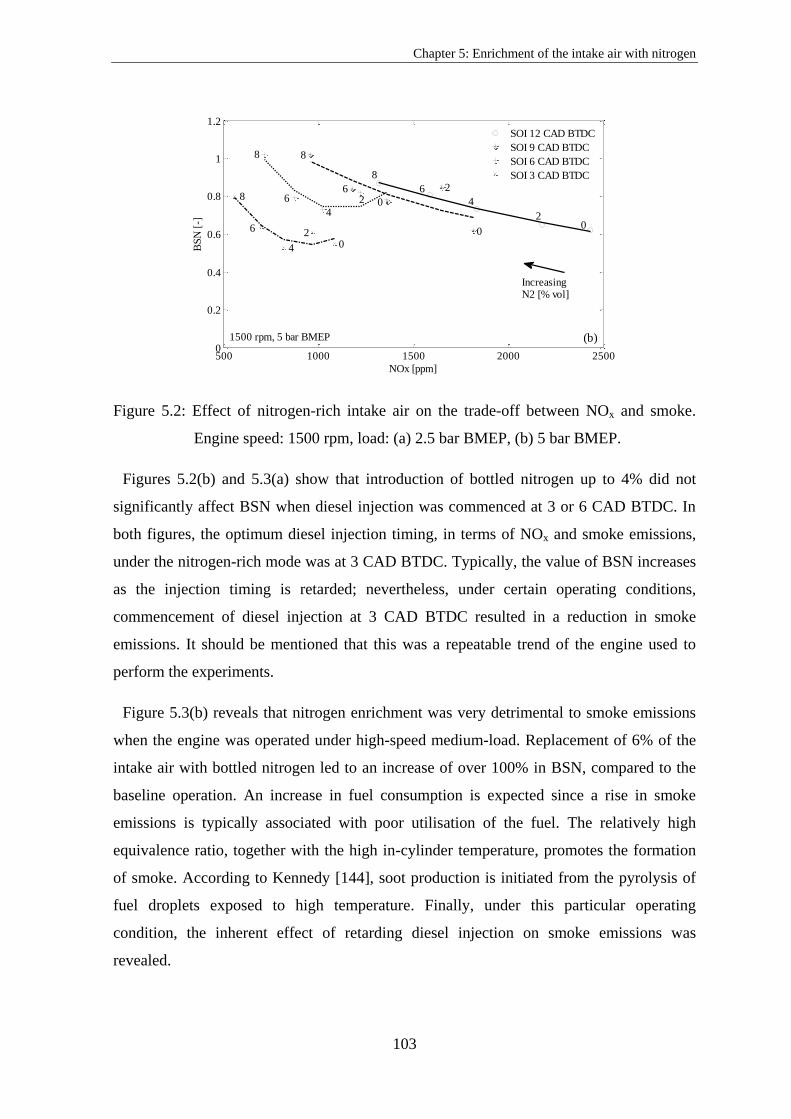
Chapter 5: Enrichment of the intake air with nitrogen
103
Figure 5.2: Effect of nitrogen-rich intake air on the trade-off between NOx and smoke.
Engine speed: 1500 rpm, load: (a) 2.5 bar BMEP, (b) 5 bar BMEP.
Figures 5.2(b) and 5.3(a) show that introduction of bottled nitrogen up to 4% did not
significantly affect BSN when diesel injection was commenced at 3 or 6 CAD BTDC. In
both figures, the optimum diesel injection timing, in terms of NOx and smoke emissions,
under the nitrogen-rich mode was at 3 CAD BTDC. Typically, the value of BSN increases
as the injection timing is retarded; nevertheless, under certain operating conditions,
commencement of diesel injection at 3 CAD BTDC resulted in a reduction in smoke
emissions. It should be mentioned that this was a repeatable trend of the engine used to
perform the experiments.
Figure 5.3(b) reveals that nitrogen enrichment was very detrimental to smoke emissions
when the engine was operated under high-speed medium-load. Replacement of 6% of the
intake air with bottled nitrogen led to an increase of over 100% in BSN, compared to the
baseline operation. An increase in fuel consumption is expected since a rise in smoke
emissions is typically associated with poor utilisation of the fuel. The relatively high
equivalence ratio, together with the high in-cylinder temperature, promotes the formation
of smoke. According to Kennedy [144], soot production is initiated from the pyrolysis of
fuel droplets exposed to high temperature. Finally, under this particular operating
condition, the inherent effect of retarding diesel injection on smoke emissions was
revealed.
500 1000 1500 2000 25000
0.2
0.4
0.6
0.8
1
1.2
NOx [ppm]
BS
N [
-]
SOI 12 CAD BTDC
SOI 9 CAD BTDC
SOI 6 CAD BTDC
SOI 3 CAD BTDC
IncreasingN2 [% vol]
(b)1500 rpm, 5 bar BMEP
6
4
20
8
0
28
6
4 02
8
6
4
8
6
02

Chapter 5: Enrichment of the intake air with nitrogen
104
Figure 5.3: Effect of nitrogen-rich intake air on the trade-off between NOx and smoke.
Engine speed: 2500 rpm, load: (a) 2.5 bar BMEP, (b) 5 bar BMEP.
5.3.2 Effect of nitrogen-rich intake air on CO emissions
CO levels in the exhaust of a modern conventional diesel engine typically range from
approximately 10 to 500 ppm [138]. Dilution of the intake air with nitrogen results in an
increase in CO emissions because it lowers the peak combustion temperature and
influences the local equivalence ratio. Figures 5.4 and 5.5 demonstrate the concentration of
CO in the exhaust gas as a function of the bottled nitrogen supplied into the engine under
low- and high-speed operation, respectively. Under low-speed operation, enrichment of
the intake air with over 2% nitrogen led to a considerable increase in CO emissions.
300 400 500 600 700 800 900 1000 1100 12000.2
0.3
0.4
0.5
0.6
0.7
0.8
0.9
1
1.1
1.2
NOx [ppm]
BS
N [
-]
SOI 12 CAD BTDC
SOI 9 CAD BTDC
SOI 6 CAD BTDC
SOI 3 CAD BTDC
2500rpm, 2.5 bar BMEP
IncreasingN2 [%vol]
(a)
0
2
46
0
24
6
4
024
6 0
2
6
200 300 400 500 600 700 800 900 1000 1100 12002
3
4
5
6
7
8
9
NOx [ppm]
BS
N [
-]
SOI 12 CAD BTDC
SOI 9 CAD BTDC
SOI 6 CAD BTDC
SOI 3 CAD BTDC
(b)
IncreasingN2 [%vol]
0
2
4
6
0
2
6
0
0
42
4
6
2
6
4
2500rpm, 5 bar BMEP
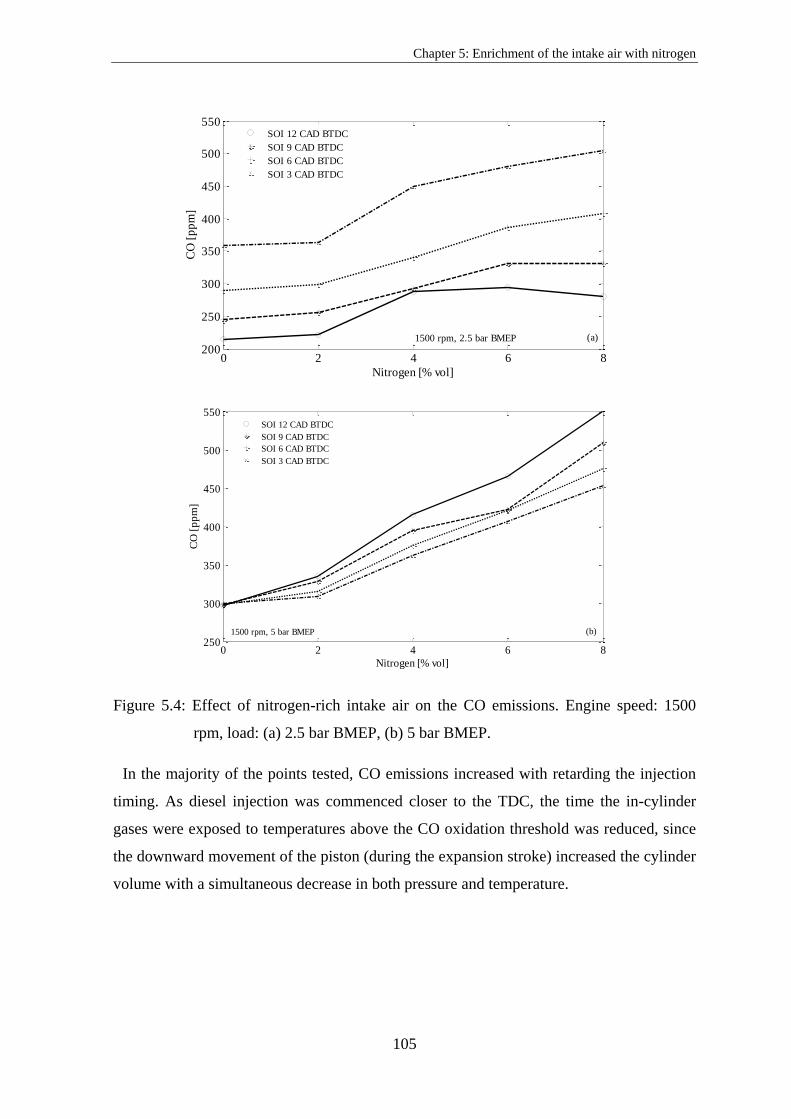
Chapter 5: Enrichment of the intake air with nitrogen
105
Figure 5.4: Effect of nitrogen-rich intake air on the CO emissions. Engine speed: 1500
rpm, load: (a) 2.5 bar BMEP, (b) 5 bar BMEP.
In the majority of the points tested, CO emissions increased with retarding the injection
timing. As diesel injection was commenced closer to the TDC, the time the in-cylinder
gases were exposed to temperatures above the CO oxidation threshold was reduced, since
the downward movement of the piston (during the expansion stroke) increased the cylinder
volume with a simultaneous decrease in both pressure and temperature.
0 2 4 6 8200
250
300
350
400
450
500
550
Nitrogen [% vol]
CO
[p
pm
]
SOI 12 CAD BTDC
SOI 9 CAD BTDC
SOI 6 CAD BTDC
SOI 3 CAD BTDC
1500 rpm, 2.5 bar BMEP (a)
0 2 4 6 8250
300
350
400
450
500
550
Nitrogen [% vol]
CO
[p
pm
]
SOI 12 CAD BTDC
SOI 9 CAD BTDC
SOI 6 CAD BTDC
SOI 3 CAD BTDC
(b)1500 rpm, 5 bar BMEP

Chapter 5: Enrichment of the intake air with nitrogen
106
Figure 5.5: Effect of nitrogen-rich intake air on the CO emissions. Engine speed: 2500
rpm, load: (a) 2.5 bar BMEP, (b) 5 bar BMEP.
5.3.3 Effect of nitrogen-rich intake air on the maximum in-cylinder pressure
Figures 5.6 and 5.7 illustrate the maximum in-cylinder pressure at the extreme start of
injection timings adopted throughout the experiments; that is, 12 and 3 CAD BTDC. In
general, admission of a diluent gas in the intake pipe affects the heat capacity of the intake
charge, the oxygen concentration and the reaction rates, which become slower.
Enrichment of the intake air with nitrogen resulted in a rather small change in heat
capacity. For instance, replacement of 8% of the intake air with bottled nitrogen caused
only a 0.012 kJ/kgK increase in heat capacity, compared to neat air. At the same fraction
0 2 4 6250
300
350
400
450
500
550
Nitrogen [% vol]
CO
[p
pm
]
SOI 12 CAD BTDC
SOI 9 CAD BTDC
SOI 6 CAD BTDC
SOI 3 CAD BTDC
2500 rpm, 2.5 bar BMEP (a)
0 2 4 60
1000
2000
3000
4000
5000
6000
7000
8000
Nitrogen [% vol]
CO
[p
pm
]
SOI 12 CAD BTDC
SOI 9 CAD BTDC
SOI 6 CAD BTDC
SOI 3 CAD BTDC
(b)2500 rpm, 5 bar BMEP
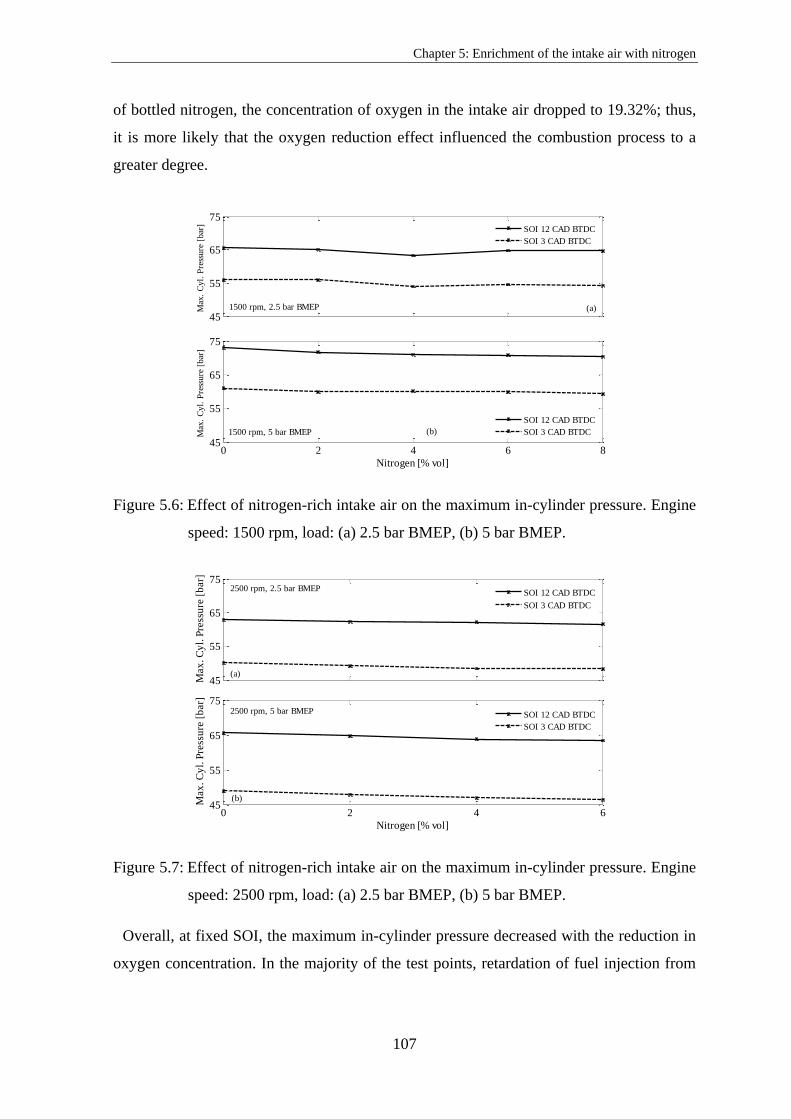
Chapter 5: Enrichment of the intake air with nitrogen
107
of bottled nitrogen, the concentration of oxygen in the intake air dropped to 19.32%; thus,
it is more likely that the oxygen reduction effect influenced the combustion process to a
greater degree.
Figure 5.6: Effect of nitrogen-rich intake air on the maximum in-cylinder pressure. Engine
speed: 1500 rpm, load: (a) 2.5 bar BMEP, (b) 5 bar BMEP.
Figure 5.7: Effect of nitrogen-rich intake air on the maximum in-cylinder pressure. Engine
speed: 2500 rpm, load: (a) 2.5 bar BMEP, (b) 5 bar BMEP.
Overall, at fixed SOI, the maximum in-cylinder pressure decreased with the reduction in
oxygen concentration. In the majority of the test points, retardation of fuel injection from
45
55
65
75
Max
. C
yl.
Pre
ssu
re [
bar
]
SOI 12 CAD BTDC
SOI 3 CAD BTDC
0 2 4 6 845
55
65
75
Nitrogen [% vol]
Max
. C
yl.
Pre
ssu
re [
bar
]
SOI 12 CAD BTDC
SOI 3 CAD BTDC
1500 rpm, 2.5 bar BMEP
1500 rpm, 5 bar BMEP
(a)
(b)
45
55
65
75
Max
. C
yl.
Pre
ssu
re [
bar]
SOI 12 CAD BTDC
SOI 3 CAD BTDC
0 2 4 645
55
65
75
Nitrogen [% vol]
Max
. C
yl.
Pre
ssu
re [
bar]
SOI 12 CAD BTDC
SOI 3 CAD BTDC
2500 rpm, 2.5 bar BMEP
2500 rpm, 5 bar BMEP
(a)
(b)

Chapter 5: Enrichment of the intake air with nitrogen
108
12 to 3 CAD BTDC resulted in approximately a 10 bar drop in the maximum in-cylinder
pressure. The reduction in the in-cylinder pressure that was caused by both the enrichment
of the intake air with nitrogen and the retardation of diesel injection can be linked to the
decrease in NOx formation, as presented in Section 5.3.1.
At the same load and nitrogen fraction, the in-cylinder pressure recorded under high-
speed operation was lower compared to low-speed. This, together with the less residence
time available, were the main factors that led to the reduction in NOx emissions under
high- speed operation, as already presented in Section 5.3.1.
5.3.4 Effect of nitrogen-rich intake air on ignition delay
The ignition delay is defined as the time interval between the SOI and the SOC. In this
study, the SOC was considered as the crank angle at which the heat release became
positive. The ignition delay is influenced by the diesel spray characteristics (fuel pressure
and droplet diameter), in-cylinder conditions (temperature and density) and oxygen
concentration of the intake charge (degree of dilution) [145, 146]. In this study, only the
final two parameters were varied, while the diesel spray characteristics were kept fixed.
The effect of in-cylinder temperature on ignition delay was investigated by changing the
start of injection, whereas variations on the oxygen concentration of the intake air were
achieved by adjusting the amount of bottled nitrogen.
0 2 4 6 83
3.5
4
4.5
5
5.5
6
Nitrogen [% vol]
Ign
itio
n d
ela
y [
CA
D]
SOI 12 CAD BTDC
SOI 9 CAD BTDC
SOI 6 CAD BTDC
SOI 3 CAD BTDC
1500 rpm, 2.5 bar BMEP (a)

Chapter 5: Enrichment of the intake air with nitrogen
109
Figure 5.8: Effect of nitrogen-rich intake air on the ignition delay. Engine speed: 1500
rpm, load: (a) 2.5 bar BMEP, (b) 5 bar BMEP.
Figures 5.8(a) and 5.8(b) show that a reduction in oxygen concentration led to an
increase in ignition delay. The temperature of the bottled nitrogen was the same as the
ambient air, while its effect on the intake charge density was insignificant. Enrichment of
the intake air with 8% bottled nitrogen resulted in a reduction in the intake charge density
by approximately 0.01 kg/m3. This clearly indicates that the increase in ignition delay,
when the intake air was enriched with bottled nitrogen, was exclusively caused by the
reduction in oxygen concentration.
0 2 4 6 83
3.5
4
4.5
5
5.5
6
Nitrogen [% vol]
Ign
itio
n d
ela
y [
CA
D]
SOI 12 CAD BTDC
SOI 9 CAD BTDC
SOI 6 CAD BTDC
SOI 3 CAD BTDC
1500 rpm, 5 bar BMEP (b)
0 2 4 63
3.5
4
4.5
5
5.5
6
6.5
7
7.5
8
Nitrogen [% vol]
Ign
itio
n d
ela
y [
CA
D]
SOI 12 CAD BTDC
SOI 9 CAD BTDC
SOI 6 CAD BTDC
SOI 3 CAD BTDC
2500 rpm, 2.5 bar BMEP (a)
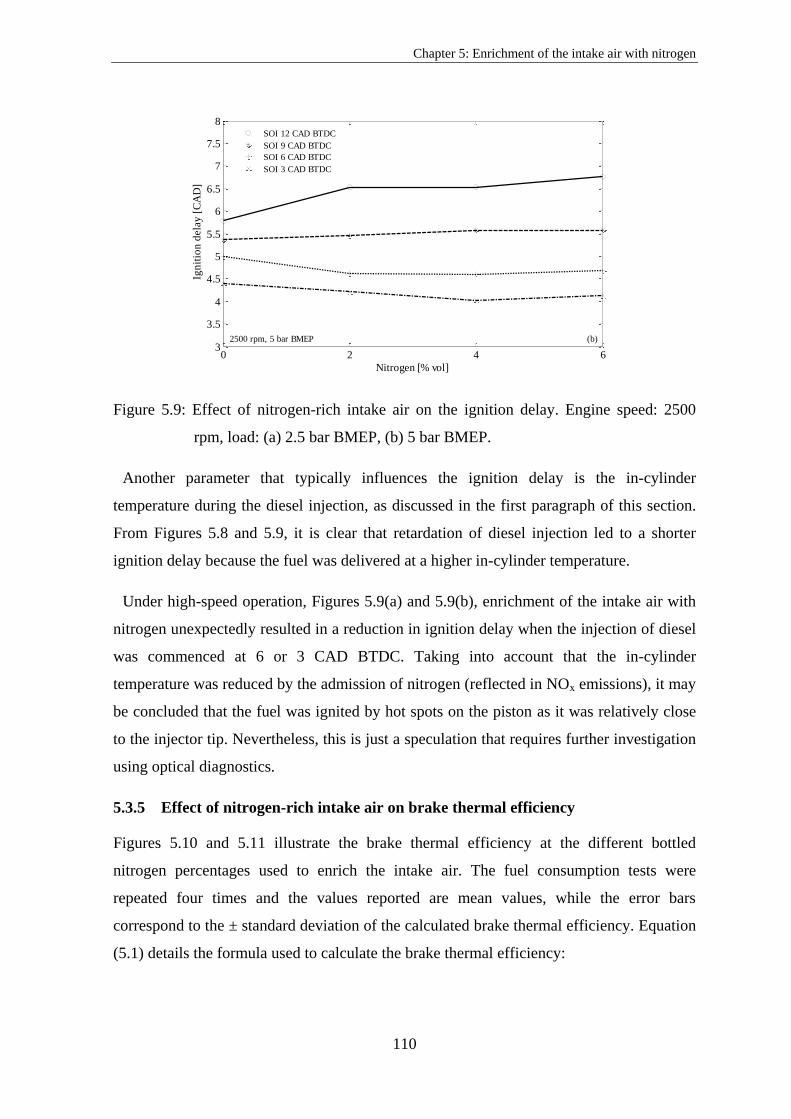
Chapter 5: Enrichment of the intake air with nitrogen
110
Figure 5.9: Effect of nitrogen-rich intake air on the ignition delay. Engine speed: 2500
rpm, load: (a) 2.5 bar BMEP, (b) 5 bar BMEP.
Another parameter that typically influences the ignition delay is the in-cylinder
temperature during the diesel injection, as discussed in the first paragraph of this section.
From Figures 5.8 and 5.9, it is clear that retardation of diesel injection led to a shorter
ignition delay because the fuel was delivered at a higher in-cylinder temperature.
Under high-speed operation, Figures 5.9(a) and 5.9(b), enrichment of the intake air with
nitrogen unexpectedly resulted in a reduction in ignition delay when the injection of diesel
was commenced at 6 or 3 CAD BTDC. Taking into account that the in-cylinder
temperature was reduced by the admission of nitrogen (reflected in NOx emissions), it may
be concluded that the fuel was ignited by hot spots on the piston as it was relatively close
to the injector tip. Nevertheless, this is just a speculation that requires further investigation
using optical diagnostics.
5.3.5 Effect of nitrogen-rich intake air on brake thermal efficiency
Figures 5.10 and 5.11 illustrate the brake thermal efficiency at the different bottled
nitrogen percentages used to enrich the intake air. The fuel consumption tests were
repeated four times and the values reported are mean values, while the error bars
correspond to the ± standard deviation of the calculated brake thermal efficiency. Equation
(5.1) details the formula used to calculate the brake thermal efficiency:
0 2 4 63
3.5
4
4.5
5
5.5
6
6.5
7
7.5
8
Nitrogen [% vol]
Ign
itio
n d
ela
y [
CA
D]
SOI 12 CAD BTDC
SOI 9 CAD BTDC
SOI 6 CAD BTDC
SOI 3 CAD BTDC
2500 rpm, 5 bar BMEP (b)
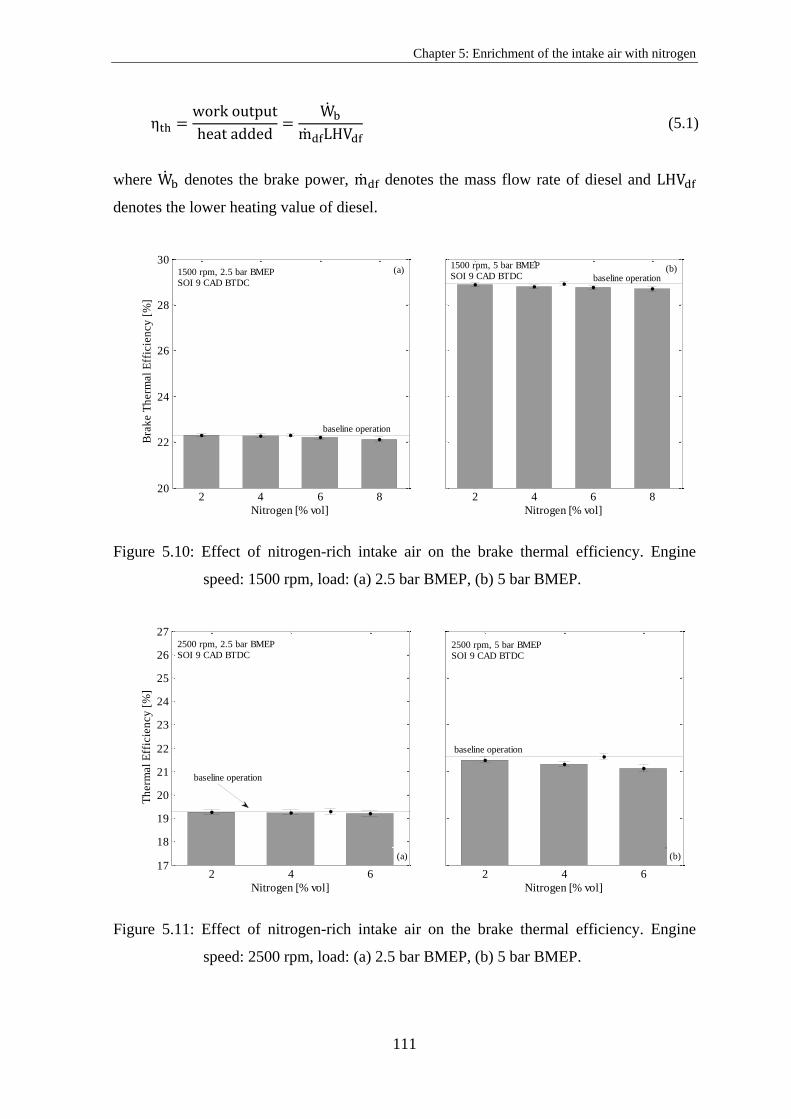
Chapter 5: Enrichment of the intake air with nitrogen
111
(5.1)
where denotes the brake power, denotes the mass flow rate of diesel and
denotes the lower heating value of diesel.
Figure 5.10: Effect of nitrogen-rich intake air on the brake thermal efficiency. Engine
speed: 1500 rpm, load: (a) 2.5 bar BMEP, (b) 5 bar BMEP.
Figure 5.11: Effect of nitrogen-rich intake air on the brake thermal efficiency. Engine
speed: 2500 rpm, load: (a) 2.5 bar BMEP, (b) 5 bar BMEP.
2 4 6 820
22
24
26
28
30
Nitrogen [% vol]
Bra
ke T
herm
al
Eff
icie
ncy
[%
]
2 4 6 8
Nitrogen [% vol]
baseline operation
baseline operation(a) (b)1500 rpm, 2.5 bar BMEP
SOI 9 CAD BTDC
1500 rpm, 5 bar BMEP
SOI 9 CAD BTDC
2 4 617
18
19
20
21
22
23
24
25
26
27
Nitrogen [% vol]
Th
erm
al
Eff
icie
ncy
[%
]
2 4 6
Nitrogen [% vol]
2500 rpm, 5 bar BMEP
SOI 9 CAD BTDC
2500 rpm, 2.5 bar BMEP
SOI 9 CAD BTDC
baseline operation
baseline operation
(a) (b)

Chapter 5: Enrichment of the intake air with nitrogen
112
In general, an increase in the proportion of nitrogen in the intake air leads to a thermal
efficiency drop. The increase in carbon-containing emissions in the exhaust gas,
originating from the incomplete combustion of diesel, as presented in Sections 5.3.1and
5.3.2, is associated with poorer utilisation of diesel fuel, which causes a reduction in brake
thermal efficiency.
In all the operating conditions tested, it was found that dilution of the intake air with up
to 2% bottled nitrogen had a very small impact on brake thermal efficiency. Operation
under high-speed medium-load and introduction of 6% bottled nitrogen, resulted in a
significant reduction in brake thermal efficiency. This was not unexpected, as this
particular operating point was the most BSN and CO emitting, as shown in Figures 5.3(b)
and 5.5(b), respectively.
5.4 Summary
The results obtained from the enrichment of the intake air of the engine with bottled
nitrogen were presented and discussed in this chapter. The concentration of the bottled
nitrogen varied from 2% up to 8% (v/v of the total intake charge), in 2% steps. The main
effects on the emissions, performance and combustion can be summarised as follows:
Enrichment of the intake air with nitrogen resulted in a reduction in NOx formation.
However, the reduction in the concentration of oxygen in the intake air, together
with the reduction in peak combustion temperature, had a detrimental effect on
smoke and CO emissions.
Under high-speed medium-load operation, nitrogen enrichment was very
detrimental to smoke emissions. In particular, at 6% bottled nitrogen, BSN more
than doubled compared to the baseline operation. The reduction of oxygen
concentration led to local fuel-rich zones, a lower peak combustion temperature
and poor oxidation of diesel fuel. These factors contributed to the formation of
smoke, which was not burned off later on as the in-cylinder temperature remained
relatively low due to the dilution of the intake air.
The CO emissions increased with the percentage of the admitted nitrogen. In the
majority of the points tested, retarded SOI resulted in higher CO emissions.

Chapter 5: Enrichment of the intake air with nitrogen
113
At a fixed start of injection, the maximum in-cylinder pressure decreased with the
reduction in oxygen concentration.
In the majority of the test points, retardation of fuel injection from 12 to 3 CAD
BTDC resulted in approximately a 10 bar drop in the maximum in-cylinder
pressure.
Enrichment of the intake air with nitrogen resulted in longer ignition delay as
compared to the baseline operation. Retardation of SOI shortened the ignition delay
because the fuel was delivered in a higher in-cylinder temperature.
Brake thermal efficiency reduced with the increase in the proportion of nitrogen.
This was not unexpected taking into account that carbonaceous emissions increased
when the intake air was diluted with nitrogen.
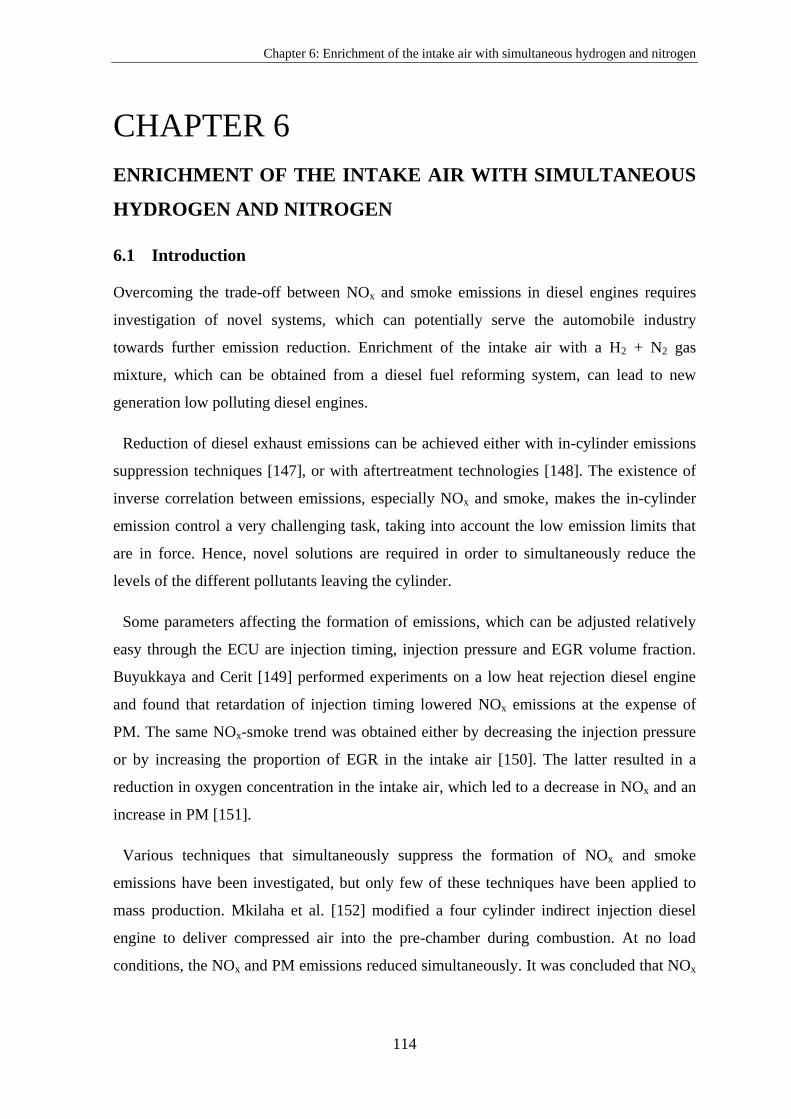
Chapter 6: Enrichment of the intake air with simultaneous hydrogen and nitrogen
114
6 CHAPTER 6
ENRICHMENT OF THE INTAKE AIR WITH SIMULTANEOUS
HYDROGEN AND NITROGEN
6.1 Introduction
Overcoming the trade-off between NOx and smoke emissions in diesel engines requires
investigation of novel systems, which can potentially serve the automobile industry
towards further emission reduction. Enrichment of the intake air with a H2 + N2 gas
mixture, which can be obtained from a diesel fuel reforming system, can lead to new
generation low polluting diesel engines.
Reduction of diesel exhaust emissions can be achieved either with in-cylinder emissions
suppression techniques [147], or with aftertreatment technologies [148]. The existence of
inverse correlation between emissions, especially NOx and smoke, makes the in-cylinder
emission control a very challenging task, taking into account the low emission limits that
are in force. Hence, novel solutions are required in order to simultaneously reduce the
levels of the different pollutants leaving the cylinder.
Some parameters affecting the formation of emissions, which can be adjusted relatively
easy through the ECU are injection timing, injection pressure and EGR volume fraction.
Buyukkaya and Cerit [149] performed experiments on a low heat rejection diesel engine
and found that retardation of injection timing lowered NOx emissions at the expense of
PM. The same NOx-smoke trend was obtained either by decreasing the injection pressure
or by increasing the proportion of EGR in the intake air [150]. The latter resulted in a
reduction in oxygen concentration in the intake air, which led to a decrease in NOx and an
increase in PM [151].
Various techniques that simultaneously suppress the formation of NOx and smoke
emissions have been investigated, but only few of these techniques have been applied to
mass production. Mkilaha et al. [152] modified a four cylinder indirect injection diesel
engine to deliver compressed air into the pre-chamber during combustion. At no load
conditions, the NOx and PM emissions reduced simultaneously. It was concluded that NOx

Chapter 6: Enrichment of the intake air with simultaneous hydrogen and nitrogen
115
reduction was caused by flame quenching, while the drop in PM was caused by the
enhanced mixing of diesel with air.
Many studies have shown that adoption of dual fuel is a feasible solution to the reduction
of emissions. This technique can affect various combustion parameters such as flame
propagation, ignition delay, adiabatic flame temperature, flammability limits, reduction in
intake charge oxygen concentration and combustion duration, which influence engine
emissions and performance.
Papagiannakis and Hountalas [153] investigated the effects of blending diesel with
natural gas on the performance and emissions of a DI diesel engine. It was shown that in
most of the operating points tested, admission of natural gas resulted in simultaneous
reductions in NO and PM. It was also reported that fuel consumption, CO and HC
emissions deteriorated under the dual fuel operation. In a different study, it was
demonstrated that operation with combined hydrogen and EGR can also offer
simultaneous reductions in NOx and smoke emissions [154].
Roy et al. [155] combined in-cylinder and aftertreatment emission reduction techniques
in a single-cylinder naturally aspirated DI diesel engine. The formation of NOx emissions
was suppressed using EGR, whereas the increased PM emissions, associated with EGR,
were treated by a cyclonic separator fitted into the exhaust pipe. The particles were subject
to centrifugal forces enabling the separation of soot from the exhaust gas. Nakatani et al.
[156] reported a more than 80% reduction in both NOx and PM emissions by developing
an aftertreatment system called DPNR (Diesel Particulate - NOx Reduction System).
Johnson [157] presented a review on NOx control and PM reduction technologies. Diesel
particulate filter is the technology currently used to remove PM from the exhaust gas,
whereas NOx emissions are treated with the aim of the SCR system. The integration of
both systems in the exhaust pipe allows simultaneous NOx and PM aftertreatment.
Yoshinobu et al. [158] proposed an electrochemical reduction system to reduce NOx and
smoke emissions from diesel engines. They claimed NOx and PM reductions over 90%.
The objective of this chapter is to present the effects of H2 + N2-enriched intake air on the
emissions, combustion and performance of an HSDI diesel engine. Bottled gases,
simulating diesel fuel reforming product gas, were introduced into the engine through the
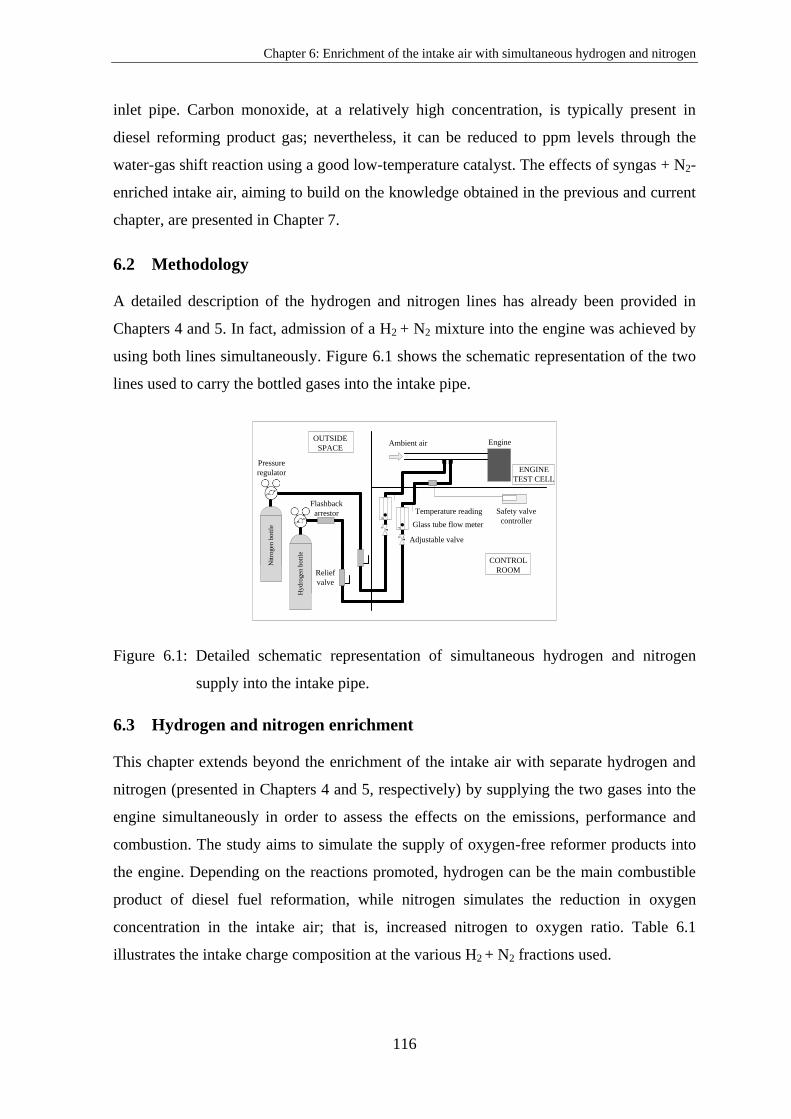
Chapter 6: Enrichment of the intake air with simultaneous hydrogen and nitrogen
116
inlet pipe. Carbon monoxide, at a relatively high concentration, is typically present in
diesel reforming product gas; nevertheless, it can be reduced to ppm levels through the
water-gas shift reaction using a good low-temperature catalyst. The effects of syngas + N2-
enriched intake air, aiming to build on the knowledge obtained in the previous and current
chapter, are presented in Chapter 7.
6.2 Methodology
A detailed description of the hydrogen and nitrogen lines has already been provided in
Chapters 4 and 5. In fact, admission of a H2 + N2 mixture into the engine was achieved by
using both lines simultaneously. Figure 6.1 shows the schematic representation of the two
lines used to carry the bottled gases into the intake pipe.
Glass tube flow meter
Pressure
regulator
Ambient air
Adjustable valve`
N
itro
gen
bott
le v
F
Engine
Temperature reading
ENGINE
TEST CELL
OUTSIDE
SPACE
CONTROL
ROOM`
H
ydro
gen
bott
le
v
F
Safety valve
controller
Flashback
arrestor
Relief
valve
Figure 6.1: Detailed schematic representation of simultaneous hydrogen and nitrogen
supply into the intake pipe.
6.3 Hydrogen and nitrogen enrichment
This chapter extends beyond the enrichment of the intake air with separate hydrogen and
nitrogen (presented in Chapters 4 and 5, respectively) by supplying the two gases into the
engine simultaneously in order to assess the effects on the emissions, performance and
combustion. The study aims to simulate the supply of oxygen-free reformer products into
the engine. Depending on the reactions promoted, hydrogen can be the main combustible
product of diesel fuel reformation, while nitrogen simulates the reduction in oxygen
concentration in the intake air; that is, increased nitrogen to oxygen ratio. Table 6.1
illustrates the intake charge composition at the various H2 + N2 fractions used.

Chapter 6: Enrichment of the intake air with simultaneous hydrogen and nitrogen
117
Table 6.1: Intake charge composition.
Bottled H2 + N2
[%vol. of intake air]
Intake charge composition
[%N2] [%O2] [%H2]
0 79 21 0
2+2 77.84 20.16 2
4+4 76.68 19.32 4
6+6 75.52 18.48 6
8+8 74.36 17.64 8
A review of the effects of enriching the intake air with separate hydrogen and nitrogen on
the combustion of a diesel engine has already been provided in Chapter 2; however, a brief
discussion is also provided in the following paragraph.
Nitrogen does not participate in the combustion process but the displacement of intake air
oxygen lowers the combustion temperature; hence, NOx emissions reduce at the expense of
CO, smoke and THC. The high adiabatic flame temperature of hydrogen contributes to the
increase in NOx formation; however, the combustion of hydrogen produces zero CO,
smoke and THC emissions. Enrichment of the intake air with simultaneous H2 + N2 allows
realisation (under certain operating conditions) of the benefits the two gases offer; namely,
simultaneous NOx, BSN and CO reduction. It is anticipated that H2 + N2 rich intake air
could lead to new advances in diesel engines with the reforming-based H2 + N2 serving as
the enabling technology for developing new frontier emission reducing engines.
6.4 Results and discussion
The results obtained from the H2 + N2 rich combustion are presented in this section. Along
with the regulated emissions, the effects of H2 + N2 enrichment on nitrogen exhaust
compounds such as NO, NO2, NH3 and N2O are provided. In addition, a combustion
analysis aims to clarify how a H2 + N2 gas mixture affects various combustion parameters
such as the in-cylinder pressure, the rate of heat release and the mass fraction burned. A
brake thermal efficiency comparison between the baseline and the H2 + N2 rich operation
is also presented.

Chapter 6: Enrichment of the intake air with simultaneous hydrogen and nitrogen
118
6.4.1 Effect of hydrogen- and nitrogen-rich intake air on the NOx-smoke trade-off
As already mentioned, N2-rich intake air reduces the formation of NOx emissions at the
expense of smoke, whereas hydrogen enrichment typically causes the opposite effect.
Simultaneous H2 + N2 enrichment can allow realisation of the benefits the two gases offer;
namely, simultaneous NOx and smoke emission reduction. In this section, among other
results, it is shown that under low-speed low-load operation, enrichment of the intake air
with simultaneous H2 + N2 can break the trade-off between NOx and smoke emissions.
Figures 6.2 and 6.3 show the NOx-BSN values recorded when the intake air was enriched
with a mixture of H2 + N2. It should be clarified that due to the zero BSN values in Figure
6.2(a) a secondary y-axis was adopted to better illustrate the results.
Figure 6.2(a) reveals that introduction of bottled H2 + N2 up to 4% caused a minor
reduction in NOx emissions. An increase in the volume of the admitted gas mixture beyond
4% led to a substantial suppression in the formation of NOx emissions. As already
presented in Chapter 4, under low-speed low-load operation, the combustion of a H2-diesel
blend hardly affected the levels of NOx emissions; therefore, it is speculated that the drop
in NOx when the intake air was enriched with a mixture of H2 + N2 (running the engine at
the same operating conditions) was caused by the reduction in the amount of oxygen in the
intake air. A comparison with the neat diesel operation showed a 71.5% reduction in NOx
formation when a 12% H2 + N2 gas mixture was used. It is worth mentioning that at 12%
H2 + N2 (6% H2 + 6% N2) proportion, in three out of four different injection timings, NOx
emissions were slightly lower compared to the NOx values obtained at 6% nitrogen
admission, Figure 5.2(a). The lower percentage of oxygen in the former case (18.48% as
compared to 19.74% in the latter) possibly compensated for the admission of hydrogen.
Concerning the BSN values, the reduction of carbon to hydrogen ratio in the H2-diesel
blend, compared to the baseline operation, resulted in a reduction in BSN that became
finally zero (or below the detection limit of the smoke meter). It should be noted that the
BSN lines at SOI 3 and 6 CAD BTDC coincide.
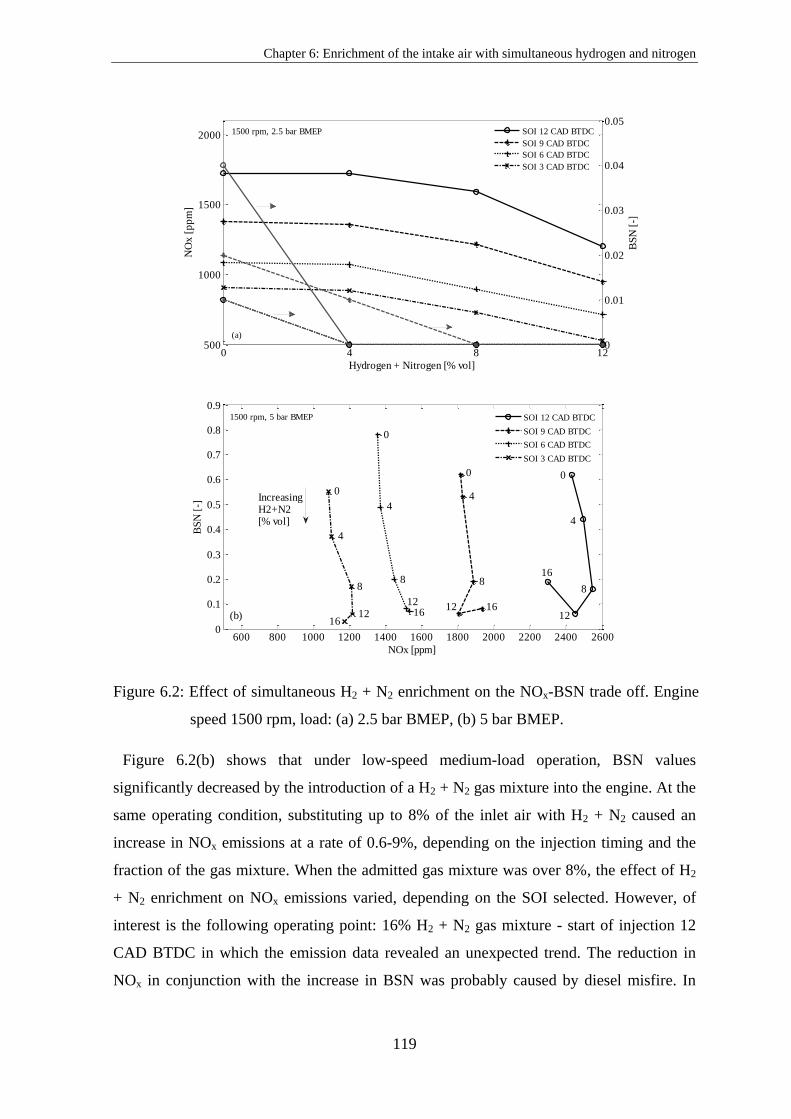
Chapter 6: Enrichment of the intake air with simultaneous hydrogen and nitrogen
119
Figure 6.2: Effect of simultaneous H2 + N2 enrichment on the NOx-BSN trade off. Engine
speed 1500 rpm, load: (a) 2.5 bar BMEP, (b) 5 bar BMEP.
Figure 6.2(b) shows that under low-speed medium-load operation, BSN values
significantly decreased by the introduction of a H2 + N2 gas mixture into the engine. At the
same operating condition, substituting up to 8% of the inlet air with H2 + N2 caused an
increase in NOx emissions at a rate of 0.6-9%, depending on the injection timing and the
fraction of the gas mixture. When the admitted gas mixture was over 8%, the effect of H2
+ N2 enrichment on NOx emissions varied, depending on the SOI selected. However, of
interest is the following operating point: 16% H2 + N2 gas mixture - start of injection 12
CAD BTDC in which the emission data revealed an unexpected trend. The reduction in
NOx in conjunction with the increase in BSN was probably caused by diesel misfire. In
500
1000
1500
2000
Hydrogen + Nitrogen [% vol]
NO
x [
pp
m]
0 4 8 120
0.01
0.02
0.03
0.04
0.05
BS
N [
-]
SOI 12 CAD BTDC
SOI 9 CAD BTDC
SOI 6 CAD BTDC
SOI 3 CAD BTDC
1500 rpm, 2.5 bar BMEP
(a)
600 800 1000 1200 1400 1600 1800 2000 2200 2400 26000
0.1
0.2
0.3
0.4
0.5
0.6
0.7
0.8
0.9
NOx [ppm]
BS
N [
-]
SOI 12 CAD BTDC
SOI 9 CAD BTDC
SOI 6 CAD BTDC
SOI 3 CAD BTDC
(b)
IncreasingH2+N2[% vol]
4
0
4
16
0
4
16
0
88 8
4
8
16
1212
1612
12
0
1500 rpm, 5 bar BMEP
Chapter 6: Enrichment of the intake air with simultaneous hydrogen and nitrogen
120
general, when injection timing is advanced, diesel is injected at lower in-cylinder
temperature. This condition, together with the reduction in diesel quantity and the
replacement of an amount of oxygen, may have led to poor fuel oxidation, reflected in
emissions with increased BSN (partially oxidised fuel) and reduced NOx (lower
temperature due to less fuel being utilised). The correctness of this speculation can be
verified by examining Figures 6.7 and 6.13(b), which show the in-cylinder pressure and
the CO emissions under this particular operating condition.
Figure 6.3: Effect of simultaneous H2 + N2 enrichment on the NOx-BSN trade off. Engine
speed 2500 rpm, load: (a) 2.5 bar BMEP, (b) 5 bar BMEP.
Under high-speed low-load operation, enrichment of the intake air with a mixture of H2 +
N2 exhibited a considerable reduction in smoke and relatively unaffected NOx emissions,
400 500 600 700 800 900 1000 1100 1200 1300 14000
0.2
0.4
0.6
0.8
1
1.2
NOx [ppm]
BS
N [
-]
SOI 12 CAD BTDC
SOI 9 CAD BTDC
SOI 6 CAD BTDC
SOI 3 CAD BTDC
0
8
4
0
4
8
0
4
8
0
4
8
2500 rpm, 2.5 bar BMEP
Increasing
H2+N2
[% vol]
(a)
400 500 600 700 800 900 1000 1100 1200 13001.5
2
2.5
3
3.5
4
4.5
NOx [ppm]
BS
N [
-]
SOI 12 CAD BTDC
SOI 9 CAD BTDC
SOI 6 CAD BTDC
SOI 3 CAD BTDC
Increasing
H2+N2 [% vol]
08
4
12
0
4
8
12
48
0
12
0
4
8
12
2500 rpm, 5 bar BMEP (b)
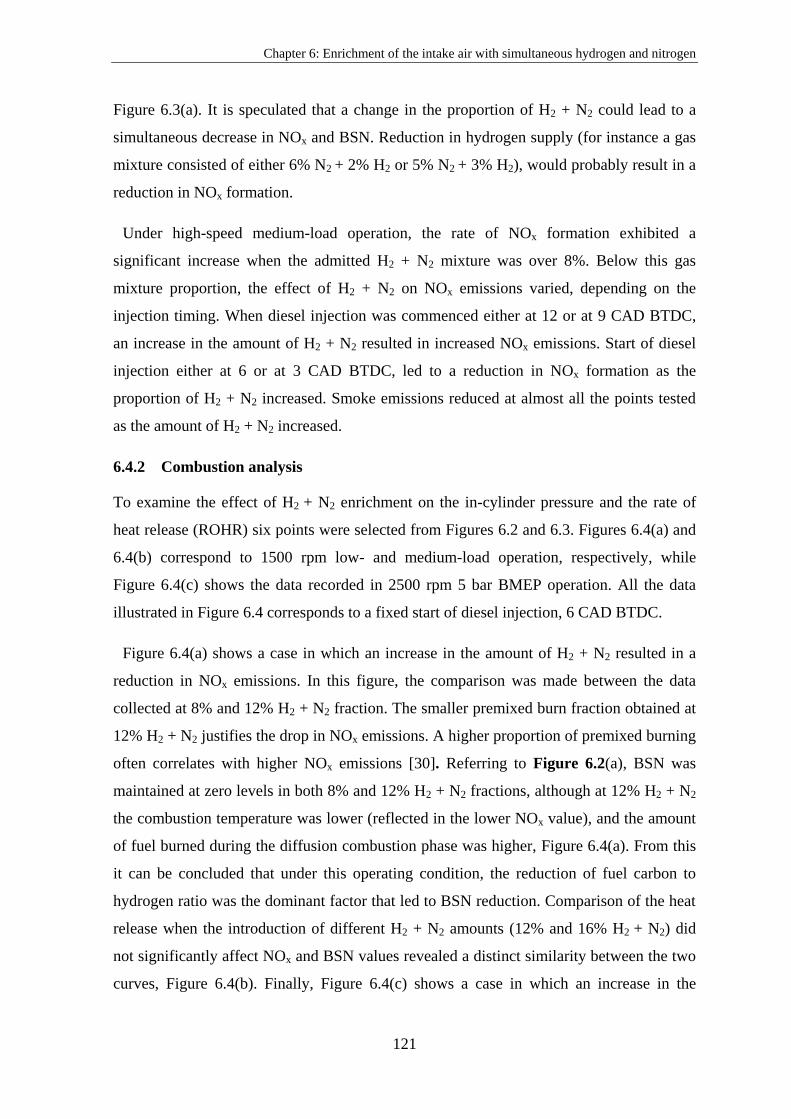
Chapter 6: Enrichment of the intake air with simultaneous hydrogen and nitrogen
121
Figure 6.3(a). It is speculated that a change in the proportion of H2 + N2 could lead to a
simultaneous decrease in NOx and BSN. Reduction in hydrogen supply (for instance a gas
mixture consisted of either 6% N2 + 2% H2 or 5% N2 + 3% H2), would probably result in a
reduction in NOx formation.
Under high-speed medium-load operation, the rate of NOx formation exhibited a
significant increase when the admitted H2 + N2 mixture was over 8%. Below this gas
mixture proportion, the effect of H2 + N2 on NOx emissions varied, depending on the
injection timing. When diesel injection was commenced either at 12 or at 9 CAD BTDC,
an increase in the amount of H2 + N2 resulted in increased NOx emissions. Start of diesel
injection either at 6 or at 3 CAD BTDC, led to a reduction in NOx formation as the
proportion of H2 + N2 increased. Smoke emissions reduced at almost all the points tested
as the amount of H2 + N2 increased.
6.4.2 Combustion analysis
To examine the effect of H2 + N2 enrichment on the in-cylinder pressure and the rate of
heat release (ROHR) six points were selected from Figures 6.2 and 6.3. Figures 6.4(a) and
6.4(b) correspond to 1500 rpm low- and medium-load operation, respectively, while
Figure 6.4(c) shows the data recorded in 2500 rpm 5 bar BMEP operation. All the data
illustrated in Figure 6.4 corresponds to a fixed start of diesel injection, 6 CAD BTDC.
Figure 6.4(a) shows a case in which an increase in the amount of H2 + N2 resulted in a
reduction in NOx emissions. In this figure, the comparison was made between the data
collected at 8% and 12% H2 + N2 fraction. The smaller premixed burn fraction obtained at
12% H2 + N2 justifies the drop in NOx emissions. A higher proportion of premixed burning
often correlates with higher NOx emissions [30]. Referring to Figure 6.2(a), BSN was
maintained at zero levels in both 8% and 12% H2 + N2 fractions, although at 12% H2 + N2
the combustion temperature was lower (reflected in the lower NOx value), and the amount
of fuel burned during the diffusion combustion phase was higher, Figure 6.4(a). From this
it can be concluded that under this operating condition, the reduction of fuel carbon to
hydrogen ratio was the dominant factor that led to BSN reduction. Comparison of the heat
release when the introduction of different H2 + N2 amounts (12% and 16% H2 + N2) did
not significantly affect NOx and BSN values revealed a distinct similarity between the two
curves, Figure 6.4(b). Finally, Figure 6.4(c) shows a case in which an increase in the

Chapter 6: Enrichment of the intake air with simultaneous hydrogen and nitrogen
122
amount of the gas mixture (from 8% to 12% H2 + N2) led to an increase in NOx emissions
and a reduction in BSN. Again, higher NOx were emitted from the combustion with the
larger premixed burn fraction.
The reduction in smoke emissions is attributed to the following reasons: Reduction in
carbon to hydrogen ratio as the amount of hydrogen is increased, better soot oxidation
when the combustion temperature is increased, enhancement of soot oxidation from the
production of OH radicals and reduction of the amount of fuel burned late in the expansion
cycle [11, 135, 136, 159]. [135] (Banerjee) [11] (Heywood) [136] (Das) [159]
Figure 6.4: Effect of simultaneous H2 + N2 enrichment on the in-cylinder pressure and rate
of heat release: (a) 1500 rpm, 2.5 bar BMEP; (b) 1500 rpm, 5 bar BMEP; (c)
2500 rpm, 5 bar BMEP.
Figure 6.5 depicts the 10, 50 and 90 % mass fraction burned points (obtained from the
integration of heat release rate) for the cases presented in Figure 6.4. The start of
combustion, taken as the point the heat release curve intersects the x-axis, is also indicated
on the graphs.
Under low-speed operation, an increase in the amount of the gas mixture introduced into
the engine did not significantly affect the MFB patters, as shown in Figures 6.5(a) and

Chapter 6: Enrichment of the intake air with simultaneous hydrogen and nitrogen
123
6.5(b), whereas under high-speed operation, a distinct change on combustion duration was
observed, Figure 6.5(c). In particular, a shorter 50% and 90% MFB was obtained by
increasing the proportion of H2 + N2 from 8% to 12%. Peirce et al. [160] conducted
experiments on a compression ignition engine fuelled by diesel and biodiesel and proved
that the fuel which is burned faster is the most NOx emitting one. The same holds true
when diesel is partly substituted by hydrogen [161]. Referring to Figure 6.3(b), it is clear
that the admission of 12% H2 + N2 gas mixture led to higher NOx emissions compared to
the 8% H2 + N2. Under this operating condition, an increase in the amount of hydrogen
resulted in more explosive burn, which is reflected in the shorter duration of combustion.
Taking into account the results presented in the previous paragraph, it can be concluded
that enrichment of the intake air with a H2-containing gas mixture does not always
contribute to faster combustion, which is typically associated with enhanced thermal
efficiency. This along with the incomplete hydrogen combustion and the dilution effect
usually lead to a reduction in thermal efficiency.
Figure 6.5: Comparison of mass fraction burned at different amounts of H2: (a) 1500 rpm,
2.5 bar BMEP; (b) 1500 rpm, 5 bar BMEP; (c) 2500 rpm, 5 bar BMEP.
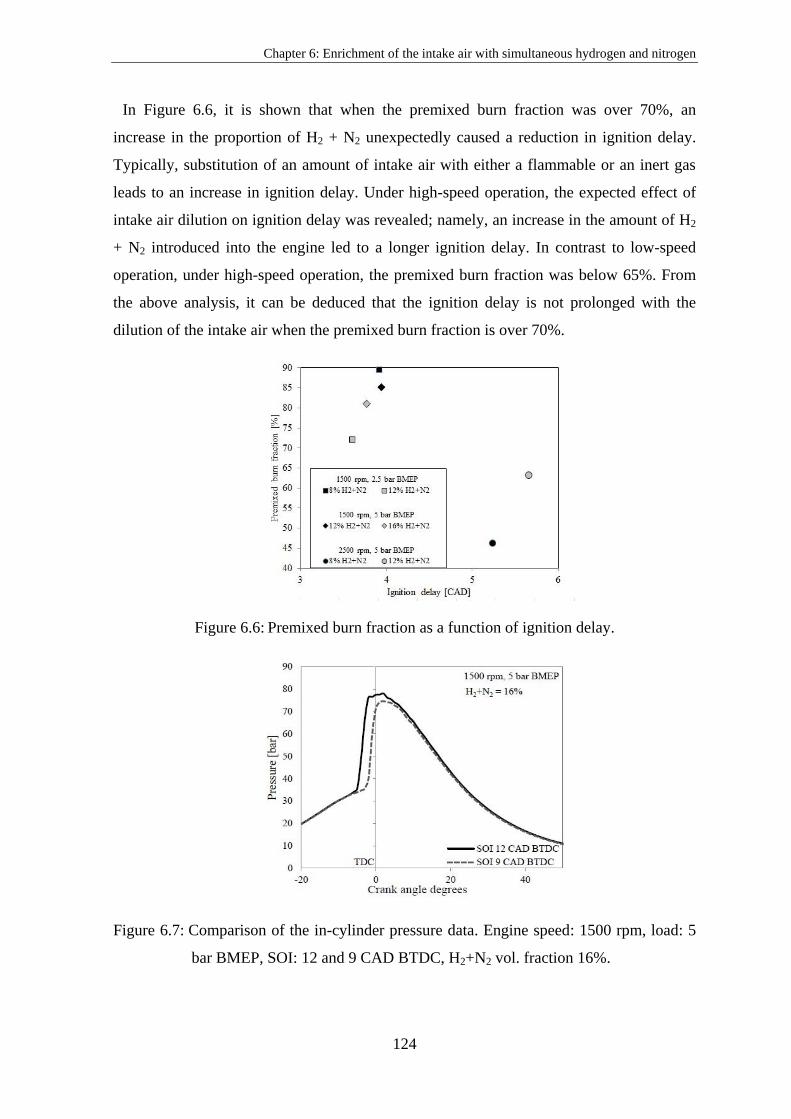
Chapter 6: Enrichment of the intake air with simultaneous hydrogen and nitrogen
124
In Figure 6.6, it is shown that when the premixed burn fraction was over 70%, an
increase in the proportion of H2 + N2 unexpectedly caused a reduction in ignition delay.
Typically, substitution of an amount of intake air with either a flammable or an inert gas
leads to an increase in ignition delay. Under high-speed operation, the expected effect of
intake air dilution on ignition delay was revealed; namely, an increase in the amount of H2
+ N2 introduced into the engine led to a longer ignition delay. In contrast to low-speed
operation, under high-speed operation, the premixed burn fraction was below 65%. From
the above analysis, it can be deduced that the ignition delay is not prolonged with the
dilution of the intake air when the premixed burn fraction is over 70%.
Figure 6.6: Premixed burn fraction as a function of ignition delay.
Figure 6.7: Comparison of the in-cylinder pressure data. Engine speed: 1500 rpm, load: 5
bar BMEP, SOI: 12 and 9 CAD BTDC, H2+N2 vol. fraction 16%.

Chapter 6: Enrichment of the intake air with simultaneous hydrogen and nitrogen
125
Figure 6.7 shows the in-cylinder pressure data that correspond to the following operating
conditions: low-speed medium-load, 16% H2 + N2 gas mixture, commencement of diesel
injection at 9 and 12 CAD BTDC. This figure verifies the assumption made in Section
6.4.1; namely, when diesel injection was commenced at 12 CAD BTDC the engine
probably misfired. Comparison of the two curves (the dotted curve corresponds to SOI at
9 CAD BTDC) shows that the peak of the solid curve is not as smooth as the dotted curve.
This abnormality implies an issue with the combustion, which is reflected on the emission
values, see Sections 6.4.1 and 6.4.6.
6.4.3 Effect of hydrogen- and nitrogen-rich intake air on nitric oxide and nitrogen
dioxide
The FTIR analyser is capable of measuring, among other chemical species, the nitrogen
compounds in the exhaust gas. In this chapter, apart from the regulated emissions, a
discussion on NO, NO2, N2O and NH3 emissions is also provided.
During the combustion process NO2 is produced through the oxidation of NO by
oxidative radicals, while it has been demonstrated that the type of the fuel used and the
engine operating conditions affect the conversion [11, 162]. The production of HO2
radicals, occurring at low temperatures through the reaction of H atoms with oxygen,
enhances the conversion of NO to NO2 [81]. [162]
Figures 6.8 and 6.9 show the NO and NO2 emissions produced under low-speed low-load
and high-speed medium-load operation, respectively. In the four different operating
conditions tested, the maximum NO2 fraction was measured under low-speed low-load,
whereas the minimum under high-speed medium-load operation. This is not unanticipated
since the amount of fuel supplied into the engine was increased by increasing either the
speed or the load, leading to a reduction in A/F ratio; namely, reduction in oxygen
concentration in the combustion products. Figure 6.8 shows an important trend concerning
the effect of fuel type on NO oxidation. When a H2 + N2 gas mixture, at any percentage,
was supplied into the engine, the amount of NO2 increased compared to the neat diesel
operation, although the admission of H2 + N2 replaced an equivalent volume of air. In
particular, under the baseline operation, the NO2 fraction was around 6%, whereas under
H2 + N2 rich intake air operation, the NO2 value varied from 11% up to 27%. It is worth

Chapter 6: Enrichment of the intake air with simultaneous hydrogen and nitrogen
126
mentioning that downstream a diesel oxidation catalyst the NO2/NO ratio may increase
[163].
Figure 6.8: NO-NO2 fraction. Engine speed 1500 rpm, load 2.5 bar BMEP.
Figure 6.9: NO-NO2 fraction. Engine speed 2500 rpm, load 5 bar BMEP.
6.4.4 Effect of hydrogen- and nitrogen-rich intake air on nitrous oxide
N2O is a greenhouse gas and air pollutant and has been found that this chemical compound
exists in the treated exhaust gases of automobiles [164, 165]. Figure 6.10 demonstrates that
raw exhaust gases contained marginal N2O emissions that showed a declining trend as the
proportion of H2 + N2 in the intake air was increased. Only the results obtained under low-
speed low-load operation are illustrated, since the emission levels were the same in all the
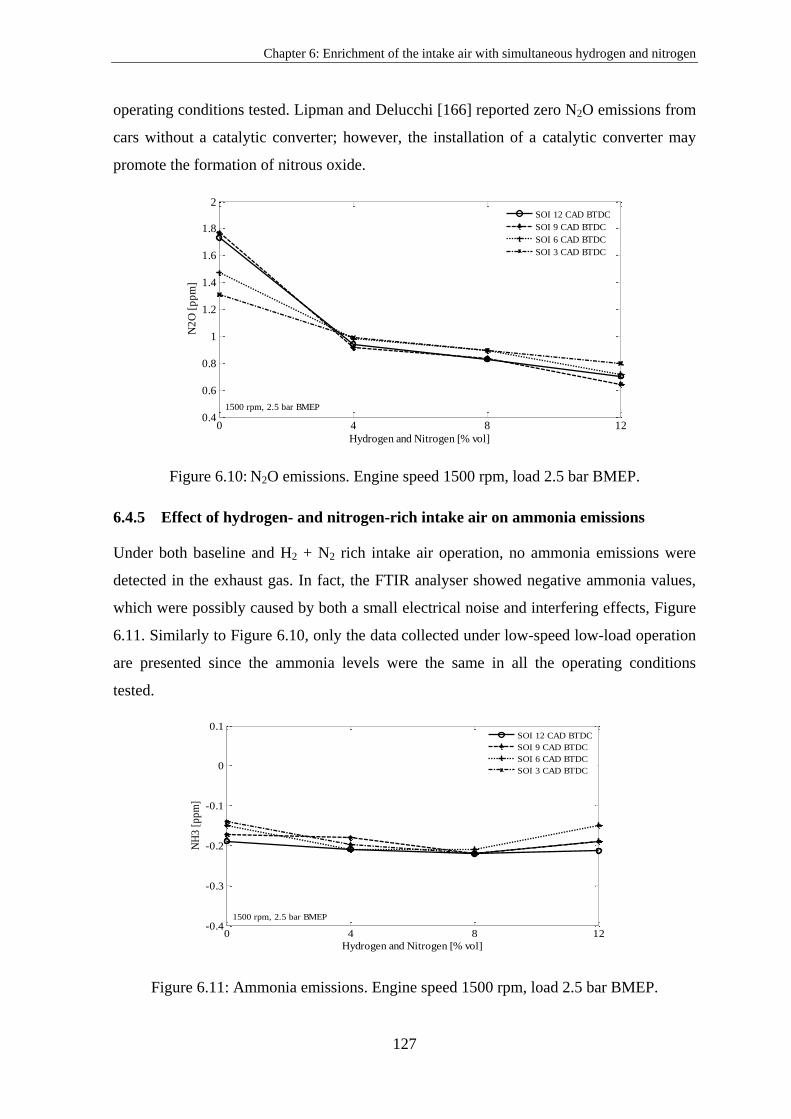
Chapter 6: Enrichment of the intake air with simultaneous hydrogen and nitrogen
127
operating conditions tested. Lipman and Delucchi [166] reported zero N2O emissions from
cars without a catalytic converter; however, the installation of a catalytic converter may
promote the formation of nitrous oxide.
Figure 6.10: N2O emissions. Engine speed 1500 rpm, load 2.5 bar BMEP.
6.4.5 Effect of hydrogen- and nitrogen-rich intake air on ammonia emissions
Under both baseline and H2 + N2 rich intake air operation, no ammonia emissions were
detected in the exhaust gas. In fact, the FTIR analyser showed negative ammonia values,
which were possibly caused by both a small electrical noise and interfering effects, Figure
6.11. Similarly to Figure 6.10, only the data collected under low-speed low-load operation
are presented since the ammonia levels were the same in all the operating conditions
tested.
Figure 6.11: Ammonia emissions. Engine speed 1500 rpm, load 2.5 bar BMEP.
0 4 8 120.4
0.6
0.8
1
1.2
1.4
1.6
1.8
2
Hydrogen and Nitrogen [% vol]
N2
O [
pp
m]
1500 rpm, 2.5 bar BMEP
SOI 12 CAD BTDC
SOI 9 CAD BTDC
SOI 6 CAD BTDC
SOI 3 CAD BTDC
0 4 8 12-0.4
-0.3
-0.2
-0.1
0
0.1
Hydrogen and Nitrogen [% vol]
NH
3 [
pp
m]
1500 rpm, 2.5 bar BMEP
SOI 12 CAD BTDC
SOI 9 CAD BTDC
SOI 6 CAD BTDC
SOI 3 CAD BTDC

Chapter 6: Enrichment of the intake air with simultaneous hydrogen and nitrogen
128
6.4.6 Effect of hydrogen- and nitrogen-rich intake air on CO emissions
Under low-load operation (cond. 1 and 3), enrichment of the intake air with simultaneous
H2 + N2, resulted in a considerable reduction in the levels of CO emissions, Figures 6.12(a)
and 6.13(a). A comparison between the CO emitted under the baseline and the H2 + N2
rich intake air operation (at the maximum H2 + N2 amount; namely, 12% in low-speed and
8% in high-speed operation), showed up to 273% and 77% reduction in CO emissions
under low- and high-speed operation, respectively.
Figure 6.12: Effect of simultaneous H2 + N2 enrichment on the CO emissions. Engine
speed: 1500 rpm, load: (a) 2.5 bar BMEP, (b) 5 bar BMEP.
0 4 8 120
100
200
300
400
500
600
Hydrogen and Nitrogen[% vol]
CO
[p
pm
]
SOI 12 CAD BTDC
SOI 9 CAD BTDC
SOI 6 CAD BTDC
SOI 3 CAD BTDC
(a)1500 rpm, 2.5 bar BMEP
0 4 8 12 160
100
200
300
400
500
600
Hydrogen and Nitrogen [% vol]
CO
[p
pm
]
1500 rpm, 5 bar BMEP
SOI 12 CAD BTDC
SOI 9 CAD BTDC
SOI 6 CAD BTDC
SOI 3 CAD BTDC
(b)
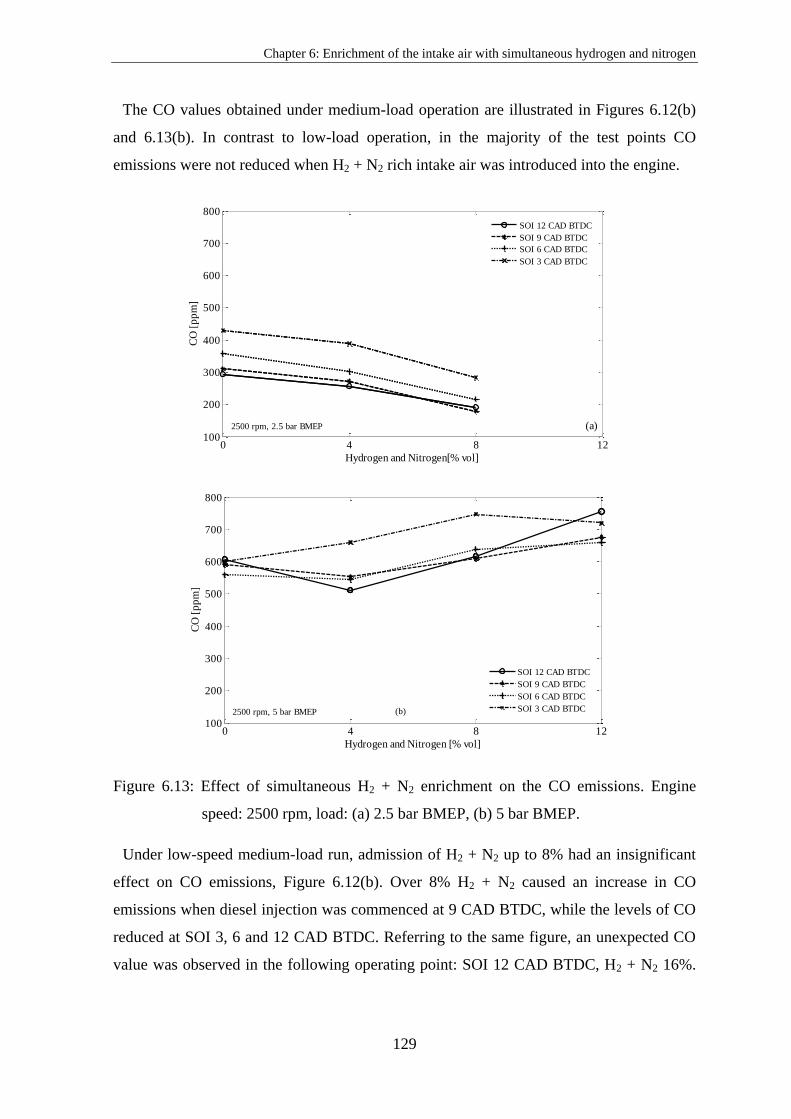
Chapter 6: Enrichment of the intake air with simultaneous hydrogen and nitrogen
129
The CO values obtained under medium-load operation are illustrated in Figures 6.12(b)
and 6.13(b). In contrast to low-load operation, in the majority of the test points CO
emissions were not reduced when H2 + N2 rich intake air was introduced into the engine.
Figure 6.13: Effect of simultaneous H2 + N2 enrichment on the CO emissions. Engine
speed: 2500 rpm, load: (a) 2.5 bar BMEP, (b) 5 bar BMEP.
Under low-speed medium-load run, admission of H2 + N2 up to 8% had an insignificant
effect on CO emissions, Figure 6.12(b). Over 8% H2 + N2 caused an increase in CO
emissions when diesel injection was commenced at 9 CAD BTDC, while the levels of CO
reduced at SOI 3, 6 and 12 CAD BTDC. Referring to the same figure, an unexpected CO
value was observed in the following operating point: SOI 12 CAD BTDC, H2 + N2 16%.
0 4 8 12100
200
300
400
500
600
700
800
Hydrogen and Nitrogen[% vol]
CO
[p
pm
]
SOI 12 CAD BTDC
SOI 9 CAD BTDC
SOI 6 CAD BTDC
SOI 3 CAD BTDC
2500 rpm, 2.5 bar BMEP (a)
0 4 8 12100
200
300
400
500
600
700
800
Hydrogen and Nitrogen [% vol]
CO
[p
pm
]
2500 rpm, 5 bar BMEP
SOI 12 CAD BTDC
SOI 9 CAD BTDC
SOI 6 CAD BTDC
SOI 3 CAD BTDC(b)

Chapter 6: Enrichment of the intake air with simultaneous hydrogen and nitrogen
130
Bearing in mind the data presented in Sections 6.4.1 and 6.4.2, the relatively high CO
value at this operating point was probably caused by diesel misfire. Concerning the high-
speed medium-load operation, up to 4% H2 + N2 admission, resulted in a reduction in CO
emissions when injection was commenced anywhere before 3 CAD BTDC. Over 4% H2 +
N2 led to an increase in CO levels compared to the baseline values, Figure 6.13(b).
6.4.7 Effect of hydrogen- and nitrogen-rich intake air on brake thermal efficiency
A brake thermal efficiency comparison is illustrated in Figures 6.14 and 6.15. The results
revealed that the engine was more fuel efficient under low-speed operation (1500 rpm).
Taking into account that thermal efficiency is improved as the peak in-cylinder pressure
occurs closer to TDC [106], it is not unexpected that the operation under 1500 rpm was
more fuel efficient compared to the operation under 2500 rpm, Figure 6.4.
Figure 6.14: Effect of simultaneous H2 + N2 enrichment on the brake thermal efficiency.
Engine speed 1500 rpm, load 2.5 and 5 bar BMEP, SOI 6 CAD BTDC.
In Chapter 4, it was shown that under high-speed medium-load operation the combustion
efficiency of hydrogen was over 98.7%. Figure 6.15 exhibits that under high-speed
medium-load operation, thermal efficiency gradually reduced as the concentration of H2 +
N2 in the intake air was increased. This suggests that under this operating condition, the
major contributor to the reduction in thermal efficiency was the incomplete utilisation of
diesel fuel (due to the dilution of the intake air), since almost all the hydrogen supplied
into the engine was burned during the combustion process.
0 4 8 12 1620
22
24
26
28
30
32
Hydrogen and Nitrogen [% vol]
Bra
ke t
herm
al
eff
icie
ncy
[%
]
1500 rpm, SOI 6 CAD BTDC
2.5 bar BMEP
5.0 bar BMEP
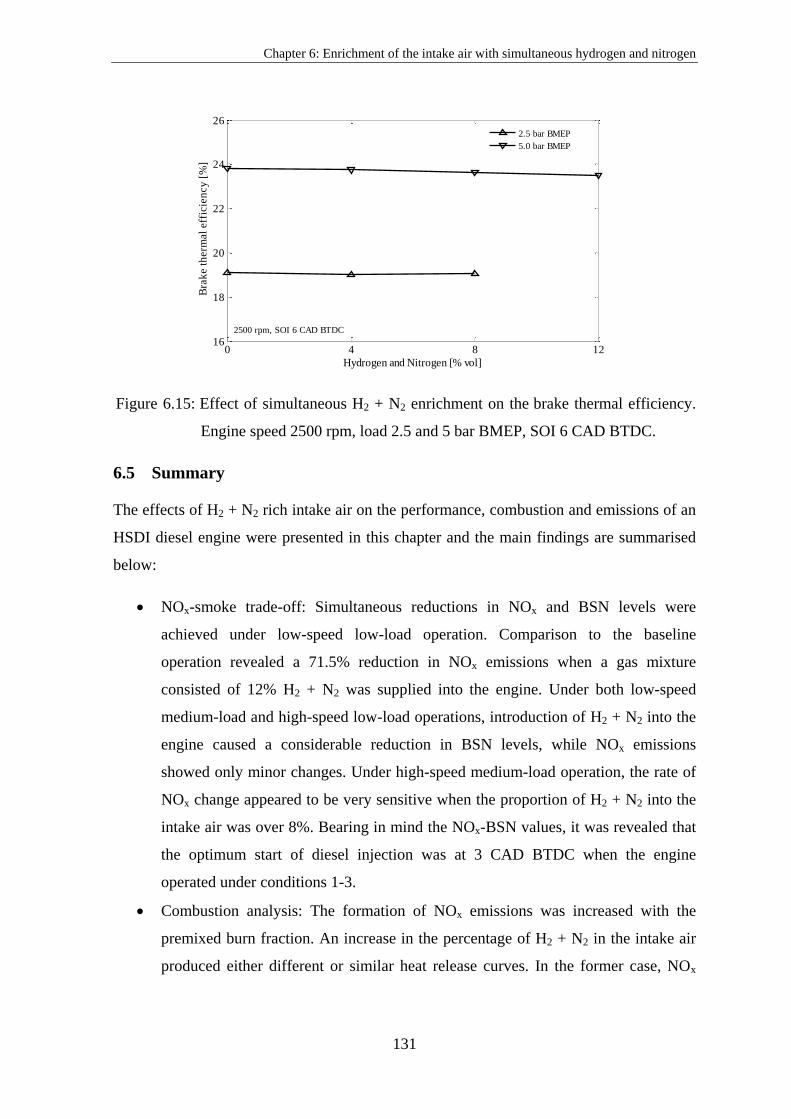
Chapter 6: Enrichment of the intake air with simultaneous hydrogen and nitrogen
131
Figure 6.15: Effect of simultaneous H2 + N2 enrichment on the brake thermal efficiency.
Engine speed 2500 rpm, load 2.5 and 5 bar BMEP, SOI 6 CAD BTDC.
6.5 Summary
The effects of H2 + N2 rich intake air on the performance, combustion and emissions of an
HSDI diesel engine were presented in this chapter and the main findings are summarised
below:
NOx-smoke trade-off: Simultaneous reductions in NOx and BSN levels were
achieved under low-speed low-load operation. Comparison to the baseline
operation revealed a 71.5% reduction in NOx emissions when a gas mixture
consisted of 12% H2 + N2 was supplied into the engine. Under both low-speed
medium-load and high-speed low-load operations, introduction of H2 + N2 into the
engine caused a considerable reduction in BSN levels, while NOx emissions
showed only minor changes. Under high-speed medium-load operation, the rate of
NOx change appeared to be very sensitive when the proportion of H2 + N2 into the
intake air was over 8%. Bearing in mind the NOx-BSN values, it was revealed that
the optimum start of diesel injection was at 3 CAD BTDC when the engine
operated under conditions 1-3.
Combustion analysis: The formation of NOx emissions was increased with the
premixed burn fraction. An increase in the percentage of H2 + N2 in the intake air
produced either different or similar heat release curves. In the former case, NOx
0 4 8 1216
18
20
22
24
26
Hydrogen and Nitrogen [% vol]
Bra
ke t
herm
al
eff
icie
ncy
[%
]
2500 rpm, SOI 6 CAD BTDC
2.5 bar BMEP
5.0 bar BMEP

Chapter 6: Enrichment of the intake air with simultaneous hydrogen and nitrogen
132
emissions increased or decreased, depending on the premixed burn fraction,
whereas in the latter case, NOx emissions remained relatively unaffected due to the
similar patterns of the premixed combustion.
Nitrogen exhaust compounds: When the speed or the load of the engine was
increased, the oxidation of NO was reduced because the combustion products
contained less amount of oxygen. Although the introduction of H2 + N2 replaced an
equivalent volume of air, under low-speed low-load operation, a higher NO2 to NO
ratio was obtained compared to the baseline operation. It is therefore clear that the
type of fuel affects the oxidation of NO. The raw exhaust gases contained marginal
N2O and zero NH3 emissions. The level of N2O, although very low, tended to
further reduce as the amount of H2 + N2 increased.
CO emissions: Under low-load operation (cond. 1 and 3), simultaneous enrichment
of the intake air with H2 + N2 resulted in a considerable CO reduction. Under low-
speed medium-load operation, admission of H2 + N2 into the engine had a minor
effect on CO emissions. Concerning the high-speed medium-load operation,
introduction of H2 + N2 over 4% led to an increase in CO emissions compared to
the baseline values.
Brake thermal efficiency: Enrichment of the intake air with a mixture of H2 + N2
had a detrimental effect on the brake thermal efficiency. The results revealed that
the engine was more fuel efficient under low-speed (1500 rpm) compared to high-
speed (2500 rpm) operation. A dominant factor that contributed to the increased
brake thermal efficiency under low-speed operation was the position of the peak in-
cylinder pressure, which was closer to the TDC.
Chapter 7: Enrichment of the intake air with a mixture of syngas and nitrogen
133
7 CHAPTER 7
ENRICHMENT OF THE INTAKE AIR WITH A MIXTURE OF
SYNGAS AND NITROGEN
7.1 Introduction
Exhaust gas assisted fuel reforming is an attractive on-board hydrogen production method,
which can open new frontiers in diesel engines. Apart from hydrogen, and depending on
the reactions promoted, the reformate typically contains a significant amount of carbon
monoxide, which is produced as a by-product. Moreover, admission of reformed gas into
the engine, through the inlet pipe, leads to an increase in the proportion of nitrogen in the
intake charge. It is therefore necessary to study how a mixture of syngas and nitrogen
affects the performance, combustion and emissions of a diesel engine, in order to gain a
better understanding of the effects of supplying fuel reformer products into the engine.
The production of hydrogen is classified into three categories: thermochemical,
electrochemical and biological [167]. In the first category (most hydrogen is derived from
this method), separation of hydrogen from a feedstock is achieved through endothermic
chemical reactions. The electrochemical method involves water decomposition into
hydrogen and oxygen by passing an electric current through the water. Concerning the
biological method, hydrogen can be produced from renewable sources by microorganisms
using carbohydrate-rich and non-toxic raw materials.
The hydrogen produced from the methods described above can be stored in an
automobile either as a gas dissolved in a metal, as a cryogenic liquid or as a compressed
gas [168]. Nevertheless, on-board hydrogen storage is deemed challenging as practical
issues (weight increase, volume occupation, hydrogen infrastructure and safety) need to be
overcome.
A widely acceptable alternative that is currently under research and development stage is
the on-board hydrogen production. Adoption of this technique requires the integration of a
fuel reformer within the exhaust pipe in order to generate hydrogen through a catalytic
interaction of the fuel with hot exhaust gases. The basic idea is to liberate the hydrogen
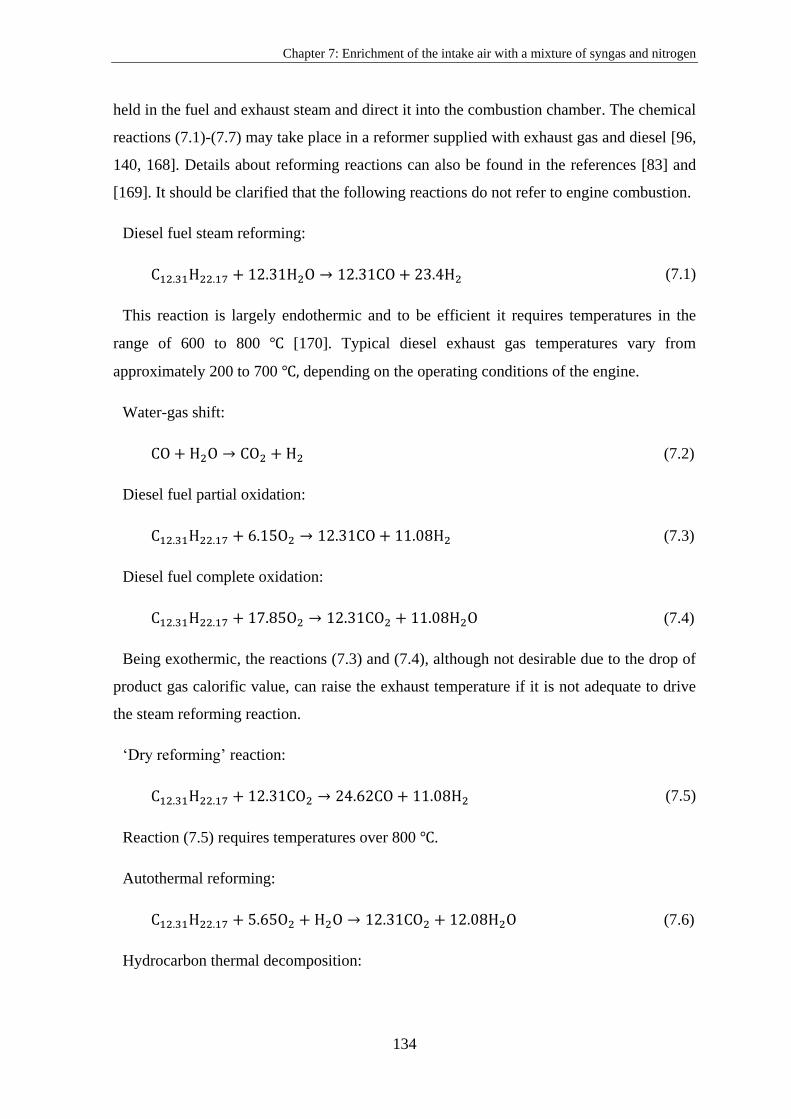
Chapter 7: Enrichment of the intake air with a mixture of syngas and nitrogen
134
held in the fuel and exhaust steam and direct it into the combustion chamber. The chemical
reactions (7.1)-(7.7) may take place in a reformer supplied with exhaust gas and diesel [96,
140, 168]. Details about reforming reactions can also be found in the references [83] and
[169]. It should be clarified that the following reactions do not refer to engine combustion.
Diesel fuel steam reforming: [96] [168] [169]
(7.1)
This reaction is largely endothermic and to be efficient it requires temperatures in the
range of 600 to 800 ℃ [170]. Typical diesel exhaust gas temperatures vary from
approximately 200 to 700 ℃ depending on the operating conditions of the engine.
Water-gas shift:
(7.2)
Diesel fuel partial oxidation:
(7.3)
Diesel fuel complete oxidation:
(7.4)
Being exothermic, the reactions (7.3) and (7.4), although not desirable due to the drop of
product gas calorific value, can raise the exhaust temperature if it is not adequate to drive
the steam reforming reaction.
‘Dry reforming’ reaction:
(7.5)
Reaction (7.5) requires temperatures over 800 ℃.
Autothermal reforming:
(7.6)
Hydrocarbon thermal decomposition:

Chapter 7: Enrichment of the intake air with a mixture of syngas and nitrogen
135
(7.7)
In fact, during a fuel reformation process more than one reaction may take place;
nevertheless, promotion of the most desirable can be achieved by tuning the reformation
process.
Tsolakis et al. [79] experimentally investigated the effect of REGR on a diesel engine. It
was concluded that, in the majority of the test conditions, dual fuel operation (diesel and
REGR) resulted in improved NOx, smoke and engine fuel consumption. The concentration
of hydrogen and CO in the exhaust gas was found relatively high at low engine load, and
as a result BSFC deteriorated due to the incomplete gaseous fuel utilisation.
Singh Bika [171] used a single-cylinder CI engine fuelled by syngas-diesel in order to
study the effect of varying syngas proportions on the cycle efficiency, NOx and CO
emissions. It was found that cycle efficiency reduced when the equivalence ratio of the
gaseous fuel was increased. Moreover, it was shown that NOx emissions remained
relatively constant at 2 bar IMEP, while at 4 bar IMEP they increased with diesel fuel
substitution. Also, it was proven that CO was utilized more efficiently at the high load
condition.
A typical diesel exhaust gas fuel reforming produces a gas mixture that is mostly
composed of hydrogen and carbon monoxide. Although the effects of providing syngas
into a diesel engine have been investigated by many researchers [80, 172-174], no papers
were found dealing with the effects of supplying syngas + N2. The effects of enriching the
intake air with separate and simultaneous hydrogen and nitrogen on the combustion and
emissions of the engine were presented in Chapters 4-6. The current chapter aims to take
this research effort further by introducing syngas and nitrogen (at varying concentrations)
into the engine. The syngas composition resembled that of typical diesel fuel reformation,
while the introduction of nitrogen simulated the effect of oxygen concentration reduction
in the inlet charge; that is, the increased N2 to O2 ratio. [80] [172, 173, 174]
7.2 Methodology
The engine was run in four different operating conditions, which included two different
speeds (1500 and 2500 rpm) and two different loads (2.5 and 5 bar BMEP). Start of
injection was swept from 12 to 3 CAD BTDC in three degree increments, while the bottled
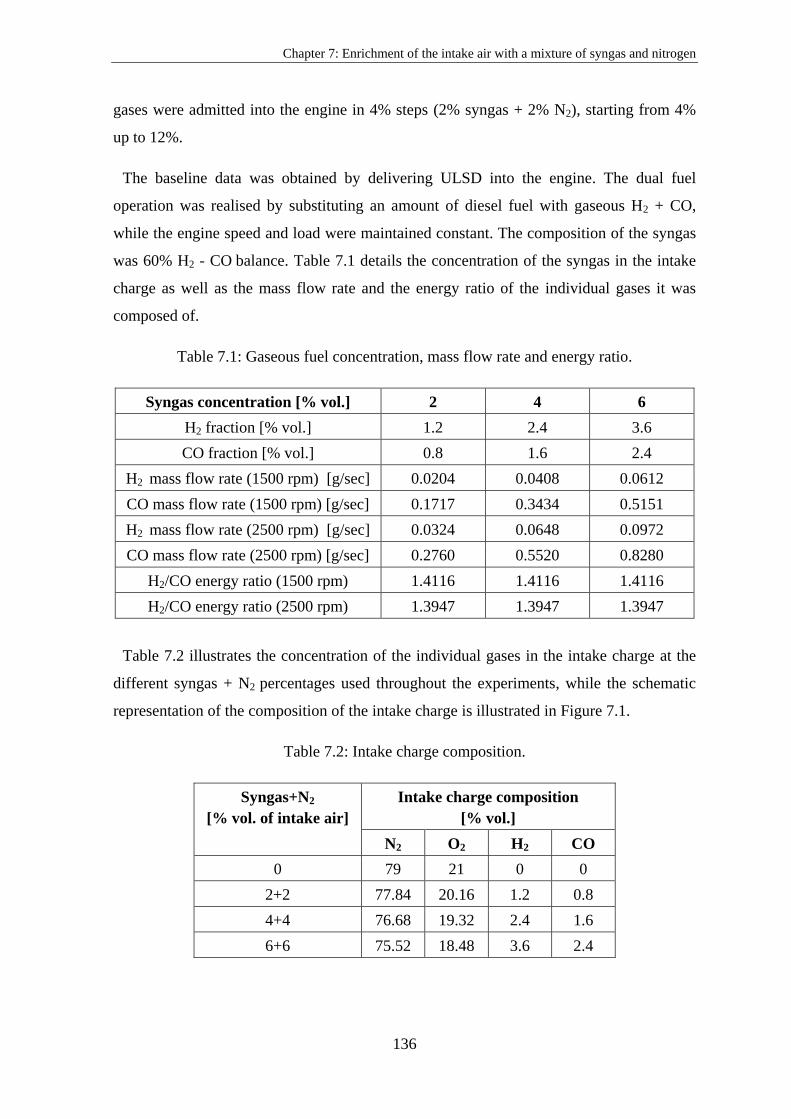
Chapter 7: Enrichment of the intake air with a mixture of syngas and nitrogen
136
gases were admitted into the engine in 4% steps (2% syngas + 2% N2), starting from 4%
up to 12%.
The baseline data was obtained by delivering ULSD into the engine. The dual fuel
operation was realised by substituting an amount of diesel fuel with gaseous H2 + CO,
while the engine speed and load were maintained constant. The composition of the syngas
was 60% H2 - CO balance. Table 7.1 details the concentration of the syngas in the intake
charge as well as the mass flow rate and the energy ratio of the individual gases it was
composed of.
Table 7.1: Gaseous fuel concentration, mass flow rate and energy ratio.
Syngas concentration [% vol.] 2 4 6
H2 fraction [% vol.] 1.2 2.4 3.6
CO fraction [% vol.] 0.8 1.6 2.4
H2 mass flow rate (1500 rpm) [g/sec] 0.0204 0.0408 0.0612
CO mass flow rate (1500 rpm) [g/sec] 0.1717 0.3434 0.5151
H2 mass flow rate (2500 rpm) [g/sec] 0.0324 0.0648 0.0972
CO mass flow rate (2500 rpm) [g/sec] 0.2760 0.5520 0.8280
H2/CO energy ratio (1500 rpm) 1.4116 1.4116 1.4116
H2/CO energy ratio (2500 rpm) 1.3947 1.3947 1.3947
Table 7.2 illustrates the concentration of the individual gases in the intake charge at the
different syngas + N2 percentages used throughout the experiments, while the schematic
representation of the composition of the intake charge is illustrated in Figure 7.1.
Table 7.2: Intake charge composition.
Syngas+N2
[% vol. of intake air]
Intake charge composition
[% vol.]
N2 O2 H2 CO
0 79 21 0 0
2+2 77.84 20.16 1.2 0.8
4+4 76.68 19.32 2.4 1.6
6+6 75.52 18.48 3.6 2.4
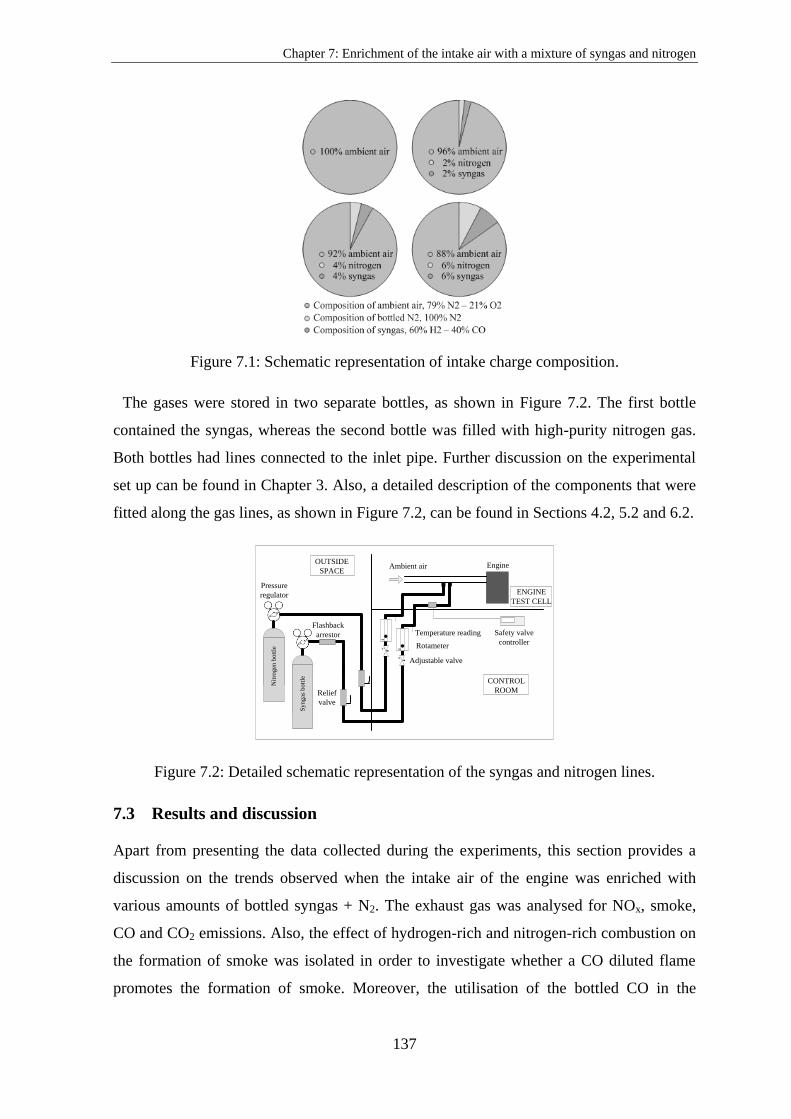
Chapter 7: Enrichment of the intake air with a mixture of syngas and nitrogen
137
Figure 7.1: Schematic representation of intake charge composition.
The gases were stored in two separate bottles, as shown in Figure 7.2. The first bottle
contained the syngas, whereas the second bottle was filled with high-purity nitrogen gas.
Both bottles had lines connected to the inlet pipe. Further discussion on the experimental
set up can be found in Chapter 3. Also, a detailed description of the components that were
fitted along the gas lines, as shown in Figure 7.2, can be found in Sections 4.2, 5.2 and 6.2.
Rotameter
Pressure
regulator
Ambient air
Adjustable valve`
N
itro
gen
bo
ttle v
F
Engine
Temperature reading
ENGINE
TEST CELL
OUTSIDE
SPACE
CONTROL
ROOM`
S
yn
gas
bo
ttle
v
F
Safety valve
controller
Flashback
arrestor
Relief
valve
Figure 7.2: Detailed schematic representation of the syngas and nitrogen lines.
7.3 Results and discussion
Apart from presenting the data collected during the experiments, this section provides a
discussion on the trends observed when the intake air of the engine was enriched with
various amounts of bottled syngas + N2. The exhaust gas was analysed for NOx, smoke,
CO and CO2 emissions. Also, the effect of hydrogen-rich and nitrogen-rich combustion on
the formation of smoke was isolated in order to investigate whether a CO diluted flame
promotes the formation of smoke. Moreover, the utilisation of the bottled CO in the

Chapter 7: Enrichment of the intake air with a mixture of syngas and nitrogen
138
different operating conditions and CO fractions used was calculated. Based on the in-
cylinder pressure data, a combustion analysis was performed to determine the MFB, the
maximum pressure and the maximum pressure rise rate. Finally, the effect of syngas + N2
rich combustion on the brake thermal efficiency is presented and compared to the baseline
operation.
7.3.1 Effect of intake air enrichment with a mixture of syngas + N2 on the NOx-
smoke trade-off
The effect of the enrichment of the intake air with a mixture of syngas + N2 on NOx-smoke
trade-off is presented in Figures 7.3 and 7.4. The tests were repeated four times and the
values reported are mean values. Tables 7.3 and 7.4 show the standard deviation of NOx
and BSN at 8% syngas + N2. Inclusion of error bars in the figures was proven impractical
because standard deviation values were too small compared to the values of the axes.
Table 7.3: Standard deviation of NOx emissions and BSN. Engine speed 1500 rpm, load
2.5 and 5 bar BMEP, syngas + N2 concentration 8%.
Speed 1500 rpm, load 2.5 bar BMEP Speed 1500 rpm, load 5 bar BMEP
SOI STDV of NOx
emissions
STDV of BSN
values
STDV of NOx
emissions
STDV of BSN
values
12 9.98 0.00 15.24 0.008
9 7.88 0.00 13.00 0.005
6 5.24 0.00 6.48 0.001
3 6.14 0.00 8.42 0.00
Simultaneous reductions in both NOx and BSN were achieved over a broad range of the
operating window of the engine. In particular, this desirable trend on NOx-BSN was
observed under low-speed low-load, low-speed medium-load and high-speed low-load
operations, the values of which are illustrated in Figures 7.3(a), 7.3(b) and 7.4(a),
respectively. Figure 7.4(b) shows that under high-speed medium-load operation the added
gas had an adverse effect on BSN, although neither the combustion of hydrogen nor the
combustion of CO generates smoke. The high dilution level of the intake air was probably
the main contributor to the increased BSN as there was less oxygen within the cylinder to
react with the diesel fuel.
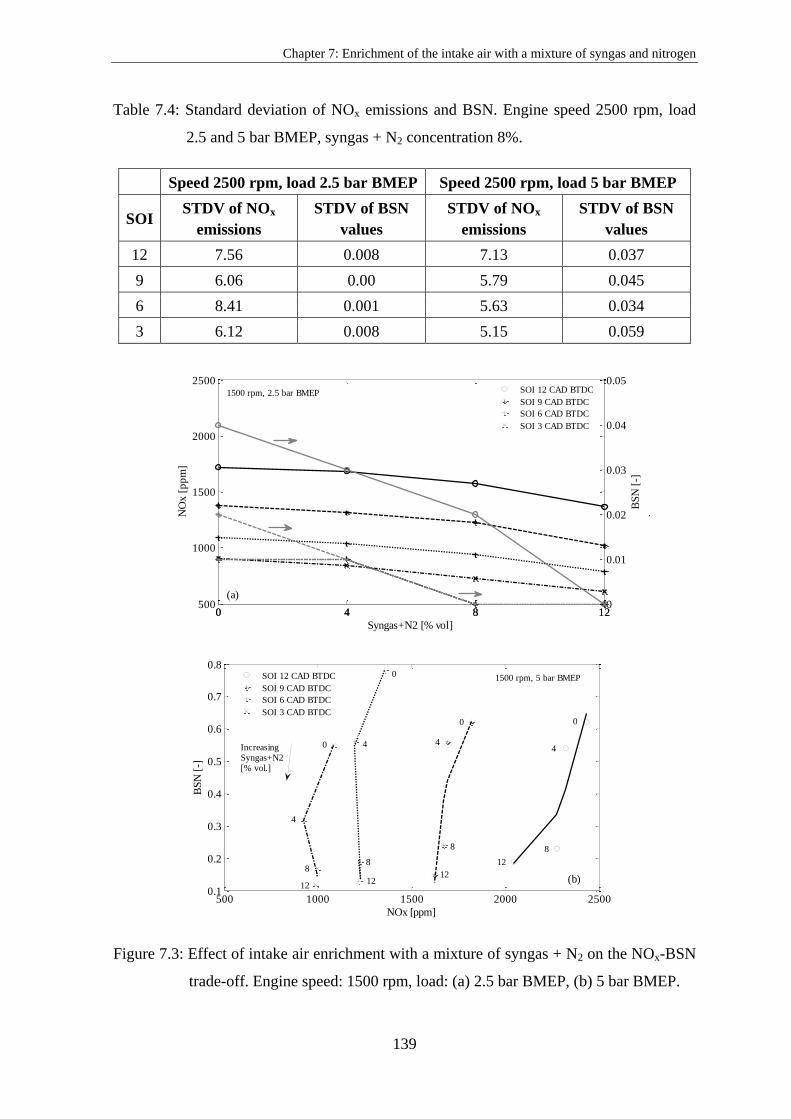
Chapter 7: Enrichment of the intake air with a mixture of syngas and nitrogen
139
Table 7.4: Standard deviation of NOx emissions and BSN. Engine speed 2500 rpm, load
2.5 and 5 bar BMEP, syngas + N2 concentration 8%.
Speed 2500 rpm, load 2.5 bar BMEP Speed 2500 rpm, load 5 bar BMEP
SOI STDV of NOx
emissions
STDV of BSN
values
STDV of NOx
emissions
STDV of BSN
values
12 7.56 0.008 7.13 0.037
9 6.06 0.00 5.79 0.045
6 8.41 0.001 5.63 0.034
3 6.12 0.008 5.15 0.059
Figure 7.3: Effect of intake air enrichment with a mixture of syngas + N2 on the NOx-BSN
trade-off. Engine speed: 1500 rpm, load: (a) 2.5 bar BMEP, (b) 5 bar BMEP.
0 4 8 12500
1000
1500
2000
2500
Syngas+N2 [% vol]
NO
x [
pp
m]
0 4 8 120
0.01
0.02
0.03
0.04
0.05
BS
N [
-]
SOI 12 CAD BTDC
SOI 9 CAD BTDC
SOI 6 CAD BTDC
SOI 3 CAD BTDC
1500 rpm, 2.5 bar BMEP
(a)
500 1000 1500 2000 25000.1
0.2
0.3
0.4
0.5
0.6
0.7
0.8
NOx [ppm]
BS
N [
-]
0
4
8
12
SOI 12 CAD BTDC
SOI 9 CAD BTDC
SOI 6 CAD BTDC
SOI 3 CAD BTDC
(b)
1500 rpm, 5 bar BMEP
Increasing
Syngas+N2
[% vol.]
4
0
8
12
4
0
8
12
0
4
8
12

Chapter 7: Enrichment of the intake air with a mixture of syngas and nitrogen
140
Isolation of the effect of nitrogen and hydrogen can clarify whether the admission of CO
(in addition to the dilution effect) contributed to smoke formation. According to Guo et al.
[175], the concentration of OH (which contributes to soot oxidation) is lower and the
concentration of H (which intensifies the soot surface growth rate) is higher in a CO
diluted flame due to the reaction CO + OH = CO2 + H, whose forward rate is increased
when CO is supplied into the engine.
Figure 7.4: Effect of intake air enrichment with a mixture of syngas + N2 on the NOx-BSN
trade-off. Engine speed: 2500 rpm, load: (a) 2.5 bar BMEP, (b) 5 bar BMEP.
Figure 7.5 shows the results obtained when a mixture of H2 + CO (w/o N2) was admitted
into the engine. BSN dropped below the values recorded in the baseline operation, and this
suggests that under this operating condition smoke formation was very sensitive to the
300 600 900 1200 15000
0.1
0.2
0.3
0.4
0.5
0.6
0.7
0.8
0.9
1
NOx [ppm]
BS
N [
-]
SOI 12 CAD BTDC
SOI 9 CAD BTDC
SOI 6 CAD BTDC
SOI 3 CAD BTDC
0
128
4
12 8
4
0
0
4
12 8
0
4
8
12
(a)
2500 rpm, 2.5 bar BMEP
Increasing
Syngas + N2
[% vol]
300 600 900 1200 15000
1
2
3
4
5
6
7
8
9
NOx [ppm]
BS
N [
-]
SOI 12 CAD BTDC
SOI 9 CAD BTDC
SOI 6 CAD BTDC
SOI 3 CAD BTDC
12
8
0
4
0
12
8
4
0
4
8
12
12
4
0
8
2500 rpm, 5 bar BMEP (b)
Increasing
Syngas + N2
[% vol]

Chapter 7: Enrichment of the intake air with a mixture of syngas and nitrogen
141
admission of nitrogen. Isolation of the CO effect (i.e. enrichment of the intake air with
hydrogen only) can extent this investigation in order to assess whether CO dilution affects
the oxidation of soot, as mentioned by Guo et al. The effect of hydrogen enriched intake
air on BSN has already been presented in Chapter 4. Comparison of the data collected in
identical operating conditions and gas admission indicated lower BSN levels when the
engine was fuelled by a mixture of diesel-H2. This verifies that a CO diluted flame
promotes the formation of smoke.
Because smoke exclusively originates from diesel, the above comparison is valid only if
a comparable amount of diesel was delivered into the cylinder when the engine was run on
(i) syngas-diesel and (ii) H2-diesel. The diesel flow rate measurements revealed that in the
first case the amount of diesel was slightly lower compared to the second case. This
finding can be verified by comparing the energy density (energy per unit volume) of the
two gases. The combustion of 1 litre of hydrogen releases 3.4% less energy compared to
that released from the combustion of a gas mixture composed of 60% H2 + 40% CO. From
this calculation, it is clear that in the diesel-H2 mode a slightly higher amount of diesel was
required in order to achieve a certain operating condition. This reinforces the conclusion
drawn in the previous paragraph as in the higher smoke case (that is, when a mixture of
syngas-diesel was used) a smaller quantity of diesel (the smoke producing fuel) was
required to achieve a certain speed and load.
Figure 7.5: Effect of intake air enrichment with a mixture of H2 + CO on the NOx-BSN
trade-off. Engine speed 2500 rpm, load 5 bar BMEP.
300 600 900 1200 15000
1
2
3
4
5
6
7
8
9
NOx [ppm]
BS
N [
-]
SOI 12 CAD BTDC
SOI 9 CAD BTDC
SOI 6 CAD BTDC
SOI 3 CAD BTDC
02
46
02
646
4
0
2
64
20
2500 rpm, 5 bar BMEP
IncreasingH2+CO [% vol]

Chapter 7: Enrichment of the intake air with a mixture of syngas and nitrogen
142
Enrichment of the intake air with a mixture of syngas + N2 resulted in a reduction in
oxygen concentration, which led to a decrease in lambda. From Figures 7.6 and 7.7, it can
be concluded that, in the majority of the operating conditions, a decrease in lambda led to
simultaneous reductions in NOx and BSN with a parallel increase in CO emissions.
Figure 7.6: Effect of lambda coefficient on the BSN, NOx and CO. Engine speed: 1500
rpm, SOI: 3 CAD BTDC, load: (a) 2.5 bar BMEP, (b) 5 bar BMEP.
Figure 7.7: Effect of lambda coefficient on the BSN, NOx and CO. Engine speed: 2500
rpm, SOI: 3 CAD BTDC, load: (a) 2.5 bar BMEP, (b) 5 bar BMEP.
Replacement of part of diesel fuel with syngas was possibly the dominant factor that
caused the reduction in BSN levels since dilution of the intake air has typically a
detrimental effect on smoke emissions. In Figure 7.7(b), the increase in BSN may have
been caused by both the high CO utilisation (as presented in the following section) and the
relatively low lambda value. The reduction in NOx emissions with decreasing the value of
2.25 2.3 2.35 2.4 2.45 2.52000
2500
3000
3500
4000
4500
5000
5500
lambda
CO
[p
pm
]
500
600
700
800
900
1000
NO
x [
pp
m]
0
0.01
0.02
0.03
0.04
0.05
BS
N [
-]
Increasing H2+CO + N2 [%vol]
8 412
(a)
1500 rpm, 2.5 bar BMEP
CO
NOx
BSN
1.35 1.4 1.45 1.5 1.55 1.6 1.65800
1000
1200
1400
1600
1800
2000
2200
2400
lambda
CO
[p
pm
]
600
700
800
900
1000
1100
1200
NO
x [
pp
m]
0
0.05
0.1
0.15
0.2
0.25
0.3
0.35
0.4
BS
N [
-]
Increasing H2+CO + N2 [%vol]
4812
NOx
BSN
CO
(b)1500 rpm, 5 bar BMEP
1.9 1.95 2 2.05 2.1 2.151500
2000
2500
3000
3500
4000
lambda
CO
[p
pm
]
300
350
400
450
500
550
600
NO
x [
pp
m]
0
0.05
0.1
0.15
0.2
0.25
0.3
0.35
0.4
BS
N [
-]
BSN
4812
CO
(a)2500 rpm, 2.5 bat BMEP
NOx
Increasing H2+CO + N2 [%vol]
1.05 1.1 1.15 1.2 1.25500
1000
1500
2000
lambda
CO
[p
pm
]
200
250
300
350
400
450
500
NO
x [
pp
m]
4
5
6
7
8
9
BS
N [
-]
BSN
CO
NOx
12 48
(b)2500 rpm, 5 bar BMEP
Increasing H2+CO + N2 [%vol]
Chapter 7: Enrichment of the intake air with a mixture of syngas and nitrogen
143
lambda was not unexpected as the concentration of oxygen within the cylinder is a
dominant NOx formation factor. The increase in CO emissions with the reduction in
lambda was caused, on the one hand, by the reduction in oxygen concentration, and on the
other, by the increase in the amount of bottled CO that was introduced into the engine.
7.3.2 Effect of intake air enrichment with a mixture of syngas + N2 on the carbon
monoxide, carbon monoxide utilisation and carbon dioxide emissions
Enrichment of the intake air with a CO-containing mixture inherently increases the
concentration of this pollutant in the exhaust gas. In essence, the increase in CO levels is
attributed to the next two factors. The first is the incomplete combustion of the admitted
gas, while the second is the slip of the CO-rich intake air during the valve overlap period.
Figures 7.8 and 7.9 depict the CO emissions collected in low- and high-speed operation,
respectively. Inset in each of the main figures is an estimation of the CO utilisation in the
combustion chamber, the calculation of which is explained later on in this section.
Under low-load operation, the bottled CO was not utilised as efficiently as in medium-
load, resulting in significantly high engine-out CO emissions. For instance, comparison of
Figure 7.8(a) with Figure 7.8(b) indicates that under low-load operation, the minimum CO
utilisation was 72.6% and the maximum 82.8%, whereas under medium-load, it ranged
from 88.1% to 92.4%. Concerning the engine speed, it is clear that the high-speed
operation was more favourable in terms of CO utilisation.
The above results indicate that the bottled CO was more completely burned at high
temperatures. This can be linked, among other factors, with the drop in the lower
flammability limit (LFL) of the gas at elevated temperatures [121, 176]. Using Le
Chatelier’s mixing rule [120], the LFL of the combustible gas mixture (that is, H2 + CO)
was found to be 5.45%, Equation (7.8).
∑
(7.8)
where LFLmix is the lower flammability limit of the mixture, xi is the concentration of
component i in the gas mixture and LFLi is the lower flammability limit of component i.
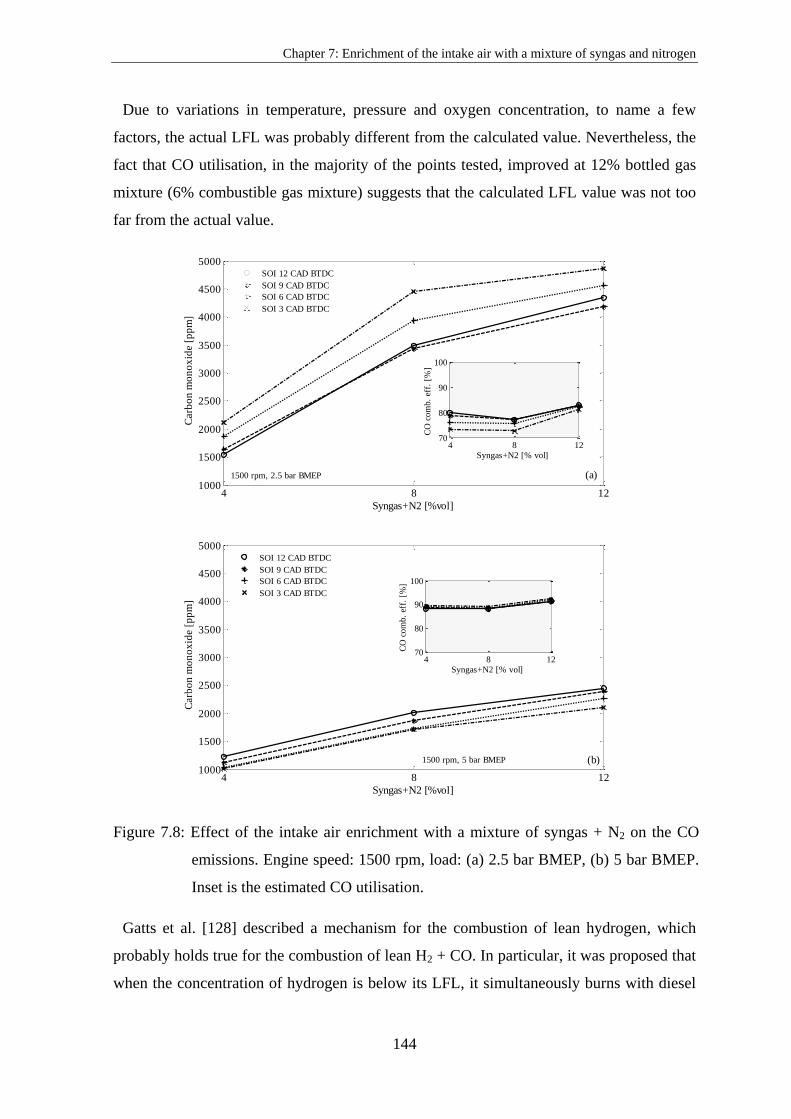
Chapter 7: Enrichment of the intake air with a mixture of syngas and nitrogen
144
Due to variations in temperature, pressure and oxygen concentration, to name a few
factors, the actual LFL was probably different from the calculated value. Nevertheless, the
fact that CO utilisation, in the majority of the points tested, improved at 12% bottled gas
mixture (6% combustible gas mixture) suggests that the calculated LFL value was not too
far from the actual value.
Figure 7.8: Effect of the intake air enrichment with a mixture of syngas + N2 on the CO
emissions. Engine speed: 1500 rpm, load: (a) 2.5 bar BMEP, (b) 5 bar BMEP.
Inset is the estimated CO utilisation.
Gatts et al. [128] described a mechanism for the combustion of lean hydrogen, which
probably holds true for the combustion of lean H2 + CO. In particular, it was proposed that
when the concentration of hydrogen is below its LFL, it simultaneously burns with diesel
4 8 121000
1500
2000
2500
3000
3500
4000
4500
5000
Syngas+N2 [%vol]
Carb
on
mo
no
xid
e [
pp
m]
SOI 12 CAD BTDC
SOI 9 CAD BTDC
SOI 6 CAD BTDC
SOI 3 CAD BTDC
4 8 1270
80
90
100
Syngas+N2 [% vol]
CO
com
b.
eff.
[%
]
(a)1500 rpm, 2.5 bar BMEP
4 8 121000
1500
2000
2500
3000
3500
4000
4500
5000
Syngas+N2 [%vol]
Carb
on
mo
no
xid
e [
pp
m]
SOI 12 CAD BTDC
SOI 9 CAD BTDC
SOI 6 CAD BTDC
SOI 3 CAD BTDC
4 8 1270
80
90
100
Syngas+N2 [% vol]
CO
com
b.
eff.
[%
]
1500 rpm, 5 bar BMEP (b)

Chapter 7: Enrichment of the intake air with a mixture of syngas and nitrogen
145
fuel by entraining into diesel vapour since the flame cannot propagate in the lean gas. In
addition, it was suggested that a wider diesel spray plume enhances the combustion of the
gaseous fuel.
Figure 7.9: Effect of the intake air enrichment with a mixture of syngas + N2 on the CO
emissions. Engine speed: 2500rpm, load: (a) 2.5 bar BMEP, (b) 5 bar BMEP.
Inset is the estimated CO utilisation.
The calculation process of the bottled CO utilisation is presented in this paragraph.
Equation (7.9) is a simplified one but gives a good indication of the CO utilisation in the
combustion chamber.
(7.9)
4 8 12500
1000
1500
2000
2500
3000
3500
Syngas+N2 [%vol]
Carb
on
mo
no
xid
e [
pp
m]
SOI 12 CAD BTDC
SOI 9 CAD BTDC
SOI 6 CAD BTDC
SOI 3 CAD BTDC
4 8 1275
80
85
90
95
100
Syngas+N2 [% vol]
CO
co
mb
. ef
f. [
%]
2500 rpm, 2.5 bar BMEP (b)
4 8 12500
1000
1500
2000
2500
3000
3500
Syngas+N2 [%vol]
Carb
on
mo
no
xid
e [
pp
m]
SOI 12 CAD BTDC
SOI 9 CAD BTDC
SOI 6 CAD BTDC
SOI 3 CAD BTDC
4 8 1275
80
85
90
95
100
Syngas+N2 [%vol]
CO
com
b.
eff.
[%
]
2500 rpm, 5 bar BMEP (b)

Chapter 7: Enrichment of the intake air with a mixture of syngas and nitrogen
146
where is the percentage of CO that was utilised [%], is the
CO measured in the exhaust gas when a mixture of syngas + N2 was admitted into the
intake pipe [ppm], is the estimated CO (estimation at equivalent hydrogen
fraction) in the exhaust gas when simultaneous H2 + N2 was introduced into the intake pipe
[ppm], represents the bottled CO supplied into the engine [ppm].
In order to isolate the contribution from diesel fuel on the CO measured in the exhaust
gas, the values obtained when a mixture of H2 + N2 was introduced into the engine were
subtracted from those obtained when a mixture of syngas + N2 was used. Since the
hydrogen content in the two gas mixtures (4% H2 + N2 contained 2% hydrogen, whereas
4% syngas + N2 contained 1.2% hydrogen taking into account that the composition of the
syngas was 60% H2-CO balance) was not the same, an estimation of CO (through the
linear interpolation method) that would be measured in the exhaust gas if the amount of
hydrogen was the same is required. The calculation is based on certain assumptions such
as possible dissociation reactions that produce CO are still the same when changing H2 +
N2 with syngas + N2 in the cylinder, CO generated from diesel fuel is similar when
changing H2 + N2 with syngas + N2 and assuming a linear relationship between CO
emissions and %H2 to get the values at 1.2, 2.4 and 3.6 %H2. As mentioned in Section
7.3.1, the two distinct gaseous fuels (H2 and H2 + CO) release similar amounts of energy;
hence, this suggests that the amount of diesel required to keep the speed and the load
constant when changing H2 + N2 with syngas + N2 in the cylinder is also similar.
Figure 7.10: Effect of syngas + N2 on the carbon dioxide emissions. (a) 1500 rpm 2.5 and
5 bar BMEP, (b) 2500 rpm 2.5 and 5 bar BMEP. SOI 3 CAD BTDC.
0 4 8 120
5
10
15
Syngas+N2[% vol]
Carb
on
dio
xid
e [
%]
1500 rpm, SOI 3 CAD BTDC
2.5 bar BMEP
5.0 bar BMEP
0 4 8 12
Syngas+N2[% vol]
2500 rpm, SOI 3 CAD BTDC
2.5 bar BMEP
5.0 bar BMEP
(a) (b)
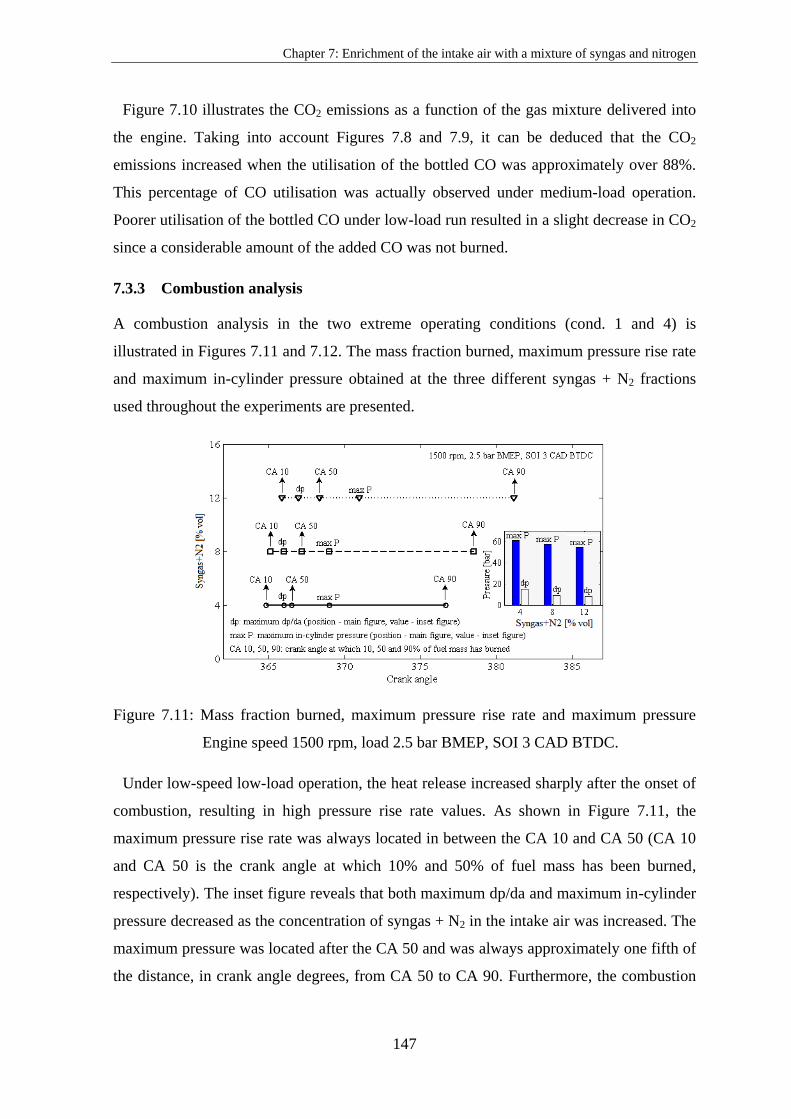
Chapter 7: Enrichment of the intake air with a mixture of syngas and nitrogen
147
Figure 7.10 illustrates the CO2 emissions as a function of the gas mixture delivered into
the engine. Taking into account Figures 7.8 and 7.9, it can be deduced that the CO2
emissions increased when the utilisation of the bottled CO was approximately over 88%.
This percentage of CO utilisation was actually observed under medium-load operation.
Poorer utilisation of the bottled CO under low-load run resulted in a slight decrease in CO2
since a considerable amount of the added CO was not burned.
7.3.3 Combustion analysis
A combustion analysis in the two extreme operating conditions (cond. 1 and 4) is
illustrated in Figures 7.11 and 7.12. The mass fraction burned, maximum pressure rise rate
and maximum in-cylinder pressure obtained at the three different syngas + N2 fractions
used throughout the experiments are presented.
Figure 7.11: Mass fraction burned, maximum pressure rise rate and maximum pressure
Engine speed 1500 rpm, load 2.5 bar BMEP, SOI 3 CAD BTDC.
Under low-speed low-load operation, the heat release increased sharply after the onset of
combustion, resulting in high pressure rise rate values. As shown in Figure 7.11, the
maximum pressure rise rate was always located in between the CA 10 and CA 50 (CA 10
and CA 50 is the crank angle at which 10% and 50% of fuel mass has been burned,
respectively). The inset figure reveals that both maximum dp/da and maximum in-cylinder
pressure decreased as the concentration of syngas + N2 in the intake air was increased. The
maximum pressure was located after the CA 50 and was always approximately one fifth of
the distance, in crank angle degrees, from CA 50 to CA 90. Furthermore, the combustion
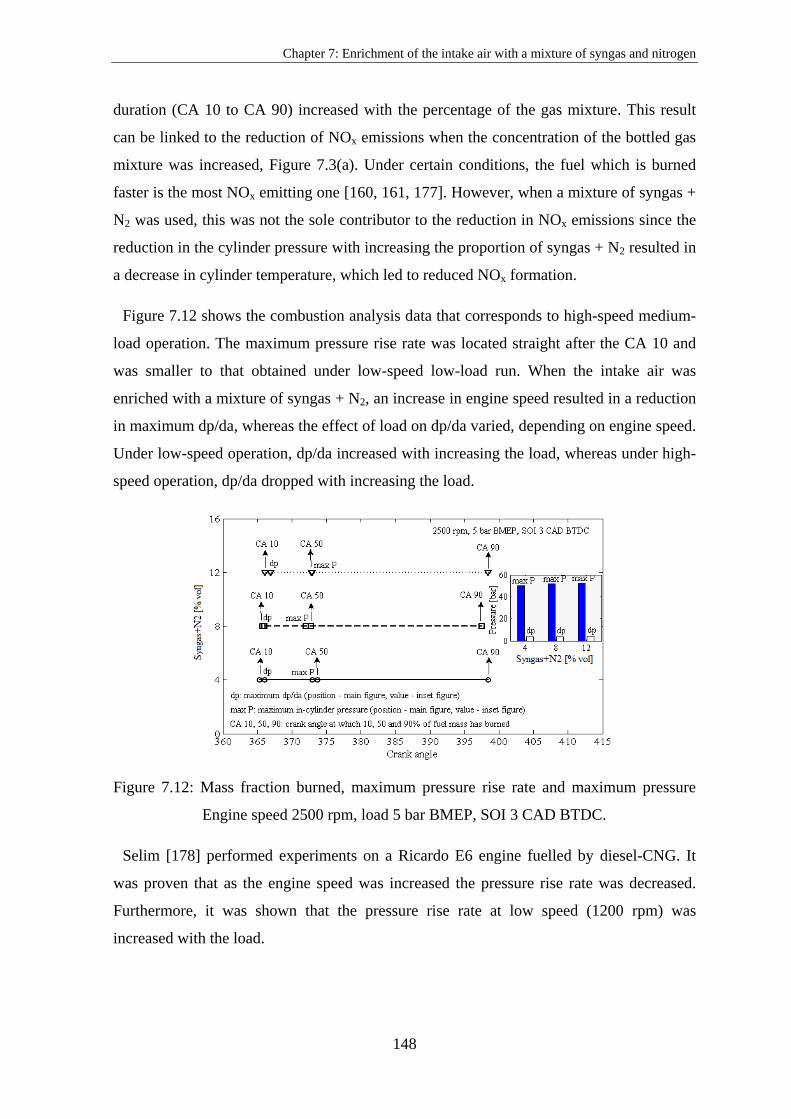
Chapter 7: Enrichment of the intake air with a mixture of syngas and nitrogen
148
duration (CA 10 to CA 90) increased with the percentage of the gas mixture. This result
can be linked to the reduction of NOx emissions when the concentration of the bottled gas
mixture was increased, Figure 7.3(a). Under certain conditions, the fuel which is burned
faster is the most NOx emitting one [160, 161, 177]. However, when a mixture of syngas +
N2 was used, this was not the sole contributor to the reduction in NOx emissions since the
reduction in the cylinder pressure with increasing the proportion of syngas + N2 resulted in
a decrease in cylinder temperature, which led to reduced NOx formation. [160] [161] [177]
Figure 7.12 shows the combustion analysis data that corresponds to high-speed medium-
load operation. The maximum pressure rise rate was located straight after the CA 10 and
was smaller to that obtained under low-speed low-load run. When the intake air was
enriched with a mixture of syngas + N2, an increase in engine speed resulted in a reduction
in maximum dp/da, whereas the effect of load on dp/da varied, depending on engine speed.
Under low-speed operation, dp/da increased with increasing the load, whereas under high-
speed operation, dp/da dropped with increasing the load.
Figure 7.12: Mass fraction burned, maximum pressure rise rate and maximum pressure
Engine speed 2500 rpm, load 5 bar BMEP, SOI 3 CAD BTDC.
Selim [178] performed experiments on a Ricardo E6 engine fuelled by diesel-CNG. It
was proven that as the engine speed was increased the pressure rise rate was decreased.
Furthermore, it was shown that the pressure rise rate at low speed (1200 rpm) was
increased with the load.
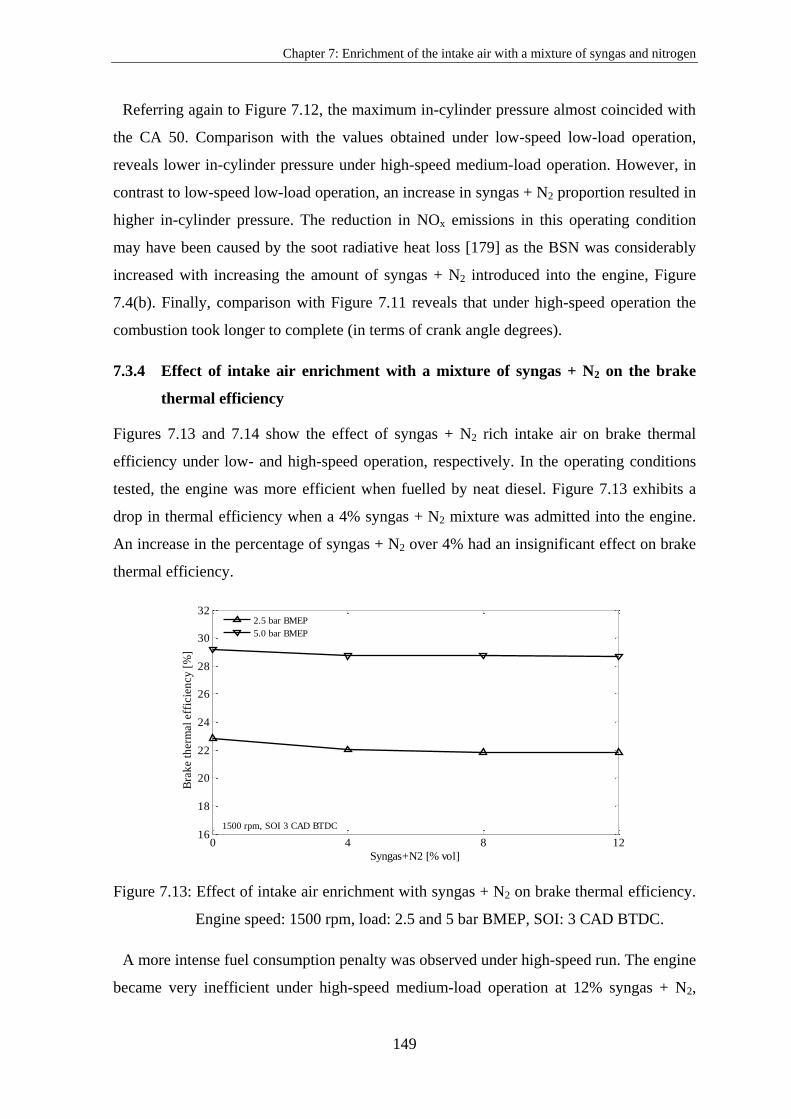
Chapter 7: Enrichment of the intake air with a mixture of syngas and nitrogen
149
Referring again to Figure 7.12, the maximum in-cylinder pressure almost coincided with
the CA 50. Comparison with the values obtained under low-speed low-load operation,
reveals lower in-cylinder pressure under high-speed medium-load operation. However, in
contrast to low-speed low-load operation, an increase in syngas + N2 proportion resulted in
higher in-cylinder pressure. The reduction in NOx emissions in this operating condition
may have been caused by the soot radiative heat loss [179] as the BSN was considerably
increased with increasing the amount of syngas + N2 introduced into the engine, Figure
7.4(b). Finally, comparison with Figure 7.11 reveals that under high-speed operation the
combustion took longer to complete (in terms of crank angle degrees).
7.3.4 Effect of intake air enrichment with a mixture of syngas + N2 on the brake
thermal efficiency
Figures 7.13 and 7.14 show the effect of syngas + N2 rich intake air on brake thermal
efficiency under low- and high-speed operation, respectively. In the operating conditions
tested, the engine was more efficient when fuelled by neat diesel. Figure 7.13 exhibits a
drop in thermal efficiency when a 4% syngas + N2 mixture was admitted into the engine.
An increase in the percentage of syngas + N2 over 4% had an insignificant effect on brake
thermal efficiency.
Figure 7.13: Effect of intake air enrichment with syngas + N2 on brake thermal efficiency.
Engine speed: 1500 rpm, load: 2.5 and 5 bar BMEP, SOI: 3 CAD BTDC.
A more intense fuel consumption penalty was observed under high-speed run. The engine
became very inefficient under high-speed medium-load operation at 12% syngas + N2,
0 4 8 1216
18
20
22
24
26
28
30
32
Syngas+N2 [% vol]
Bra
ke t
herm
al
eff
icie
ncy
[%
]
1500 rpm, SOI 3 CAD BTDC
2.5 bar BMEP
5.0 bar BMEP
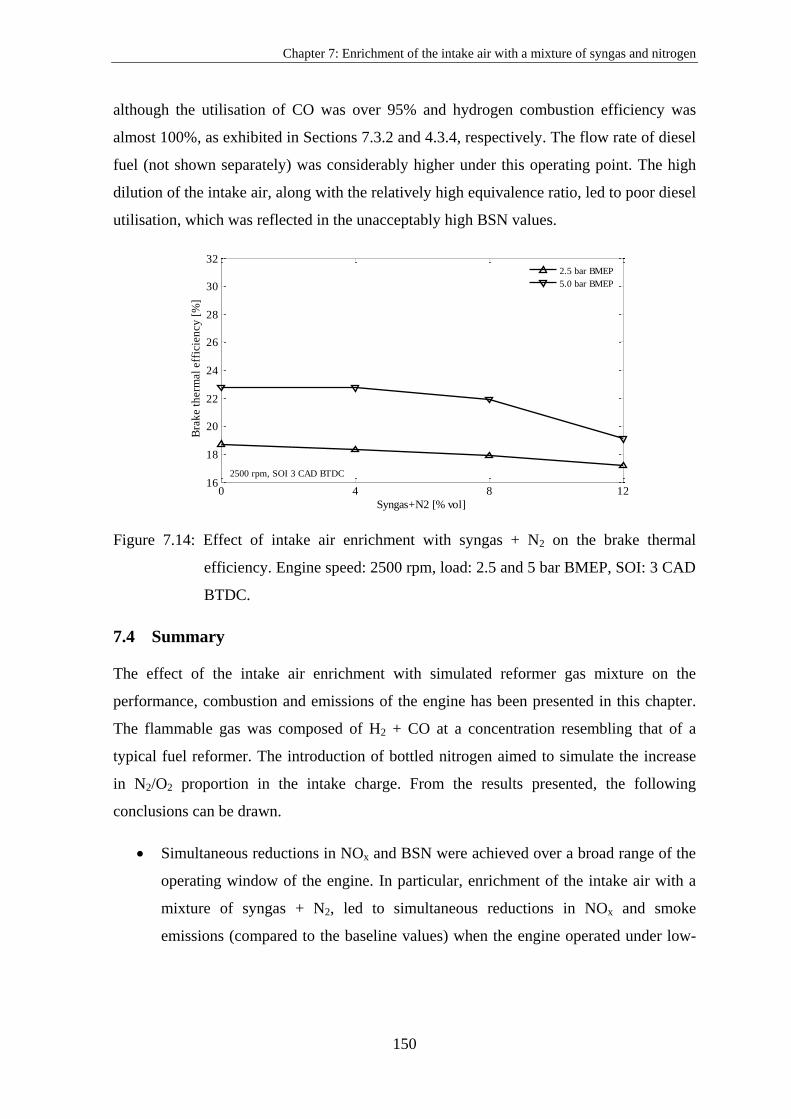
Chapter 7: Enrichment of the intake air with a mixture of syngas and nitrogen
150
although the utilisation of CO was over 95% and hydrogen combustion efficiency was
almost 100%, as exhibited in Sections 7.3.2 and 4.3.4, respectively. The flow rate of diesel
fuel (not shown separately) was considerably higher under this operating point. The high
dilution of the intake air, along with the relatively high equivalence ratio, led to poor diesel
utilisation, which was reflected in the unacceptably high BSN values.
Figure 7.14: Effect of intake air enrichment with syngas + N2 on the brake thermal
efficiency. Engine speed: 2500 rpm, load: 2.5 and 5 bar BMEP, SOI: 3 CAD
BTDC.
7.4 Summary
The effect of the intake air enrichment with simulated reformer gas mixture on the
performance, combustion and emissions of the engine has been presented in this chapter.
The flammable gas was composed of H2 + CO at a concentration resembling that of a
typical fuel reformer. The introduction of bottled nitrogen aimed to simulate the increase
in N2/O2 proportion in the intake charge. From the results presented, the following
conclusions can be drawn.
Simultaneous reductions in NOx and BSN were achieved over a broad range of the
operating window of the engine. In particular, enrichment of the intake air with a
mixture of syngas + N2, led to simultaneous reductions in NOx and smoke
emissions (compared to the baseline values) when the engine operated under low-
0 4 8 1216
18
20
22
24
26
28
30
32
Syngas+N2 [% vol]
2500 rpm, SOI 3 CAD BTDC
Bra
ke t
herm
al
eff
icie
ncy
[%
]
2.5 bar BMEP
5.0 bar BMEP
Chapter 7: Enrichment of the intake air with a mixture of syngas and nitrogen
151
speed low-load, low-speed medium-load and high-speed low-load at syngas + N2
concentration over 4%.
Under high-speed medium-load operation, BSN was very sensitive to the
admission of nitrogen. In addition, under the same operating condition, isolation of
the effect of hydrogen and nitrogen on NOx and smoke emissions revealed that a
CO diluted flame promotes the formation of smoke. Moreover, although higher in-
cylinder pressure was recorded when the proportion of syngas + N2 was increased,
NOx emissions exhibited a decreasing trend. The reduction in NOx emissions may
have been caused by the soot radiative heat loss as BSN was unacceptably high.
Enrichment of the intake air with a CO-containing mixture caused an increase in
the concentration of this pollutant in the exhaust. Estimation of the bottled CO
utilisation revealed that by increasing either the load or the speed of the engine, the
CO was more efficiently utilised. In essence, this suggests that the combustion of
CO was influenced, among other factors, by the in-cylinder temperature.
An increase in engine speed led to a reduction in maximum dp/da, whereas the
effect of load on dp/da varied depending on engine speed. Under low-speed
operation, dp/da increased with load, while under high-speed operation, dp/da
dropped when the load was increased.
The engine was more fuel efficient when operating on neat diesel. Under low-speed
operation, the brake thermal efficiency dropped when a 4% syngas + N2 mixture
was admitted into the engine. An increase in percentage of syngas + N2 over 4%
had an insignificant effect on brake thermal efficiency. A considerable thermal
efficiency reduction was observed under high speed operation.

Chapter 8: Conclusions and recommendations for future work
152
8 CHAPTER 8
CONCLUSIONS AND RECOMMENDATIONS FOR FUTURE
WORK
8.1 Conclusions
This chapter summarises the major findings of the enrichment of the intake air of an HSDI
diesel engine with separate hydrogen and nitrogen, simultaneous hydrogen and nitrogen
and a mixture of syngas and nitrogen.
8.1.1 Enrichment of the intake air with hydrogen
The main conclusions from Chapter 4 are summarised below:
1. Replacement of part of diesel fuel with hydrogen has resulted in reduced smoke
emissions at the expense of NOx, apart from the low-speed low-load operation in
which NOx emissions remained relatively unaffected.
2. The residence time was reduced with increasing the engine speed, from 1500 rpm
to 2500 rpm, leading to decreased NOx formation.
3. At a fixed engine speed and load, the production of CO emissions was lower when
the engine was fuelled by a mixture of diesel and hydrogen compared to diesel,
because the former contained less carbon atoms.
4. When diesel injection was advanced, the fuel was delivered in lower charge
density, leading to spray wall impingement and as a result increased THC
emissions.
5. The effect of hydrogen enrichment on THC emissions varied, depending on the
operating conditions. Although the combustion of hydrogen does not produce
THC, the density of the hydrogen-rich intake air was lower compared to air,
leading to spray wall impingement when a high quantity of diesel was supplied into
the engine; that is, under high-speed medium-load operation.
6. The combustion efficiency of hydrogen increased with increasing the speed, load
and percentage of hydrogen.
7. Under low-speed operation, enrichment of the intake air with hydrogen caused a
reduction in brake thermal efficiency. Under high-speed operation, a slight
Chapter 8: Conclusions and recommendations for future work
153
efficiency improvement was achieved but remained within the uncertainty limits of
the brake thermal efficiency.
8.1.2 Enrichment of the intake air with nitrogen
The following points summarise the effects of intake air enrichment with nitrogen:
1. The reduction in both oxygen concentration and peak combustion temperature led
to decreased NOx emissions at the expense of smoke and CO emissions.
2. Under high-speed medium-load operation, nitrogen enrichment was very
detrimental to smoke emissions. In particular, at 6% bottled nitrogen, BSN more
than doubled compared to the baseline operation. The reduction in oxygen
concentration led to local fuel-rich zones, a lower peak combustion temperature
and poor oxidation of diesel fuel. These factors contributed to the formation of
smoke, which was not burned off later on as the in-cylinder temperature remained
relatively low due to the dilution of the intake air.
3. At a fixed start of injection, the maximum in-cylinder pressure decreased with the
reduction in oxygen concentration.
4. Enrichment of the intake air with nitrogen resulted in longer ignition delay as
compared to the baseline operation. Retardation of SOI shortened the ignition delay
because the fuel was delivered in a higher in-cylinder temperature.
5. Brake thermal efficiency reduced with the increase in the proportion of nitrogen.
8.1.3 Enrichment of the intake air with simultaneous hydrogen and nitrogen
The purpose of Chapter 6 was to investigate the effect of product gas, mainly consisted of
a mixture of H2 + N2, on the emissions, combustion and performance of the engine. It
should be mentioned that carbon monoxide, at a relatively high concentration, is typically
present in diesel reforming product gas; nevertheless, it can be reduced to ppm levels
through the water-gas shift reaction, using a good low-temperature catalyst. The major
findings of this chapter are listed below:
1. NOx-smoke trade-off: Simultaneous reductions in NOx and BSN levels were
achieved under low-speed low-load operation. Comparison to the baseline
operation revealed a 71.5% reduction in NOx emissions when a gas mixture
consisted of 12% H2 + N2 was supplied into the engine. Under both low-speed
Chapter 8: Conclusions and recommendations for future work
154
medium-load and high-speed low-load operation, introduction of H2 + N2 into the
engine caused a considerable reduction in BSN levels, while NOx emissions
showed only minor changes. Under high-speed medium-load operation, the rate of
NOx change appeared to be very sensitive when the proportion of H2 + N2 into the
intake air was over 8%. Concerning the NOx-BSN values, it was revealed that the
optimum start of diesel injection was at 3 CAD BTDC when the engine operated
under the conditions 1-3.
2. Combustion analysis: The formation of NOx emissions was increased with the
premixed burn fraction. An increase in the percentage of H2 + N2 in the intake air
produced either different or similar heat release curves. In the former case, NOx
emissions either increased or decreased, depending on the premixed burn fraction,
whereas in the latter case, NOx emissions remained relatively unaffected due to the
similar patterns of the premixed combustion.
3. Nitrogen exhaust compounds: When the speed or the load of the engine was
increased, the oxidation of NO was reduced because the combustion products
contained less amount of oxygen. Although the introduction of H2 + N2 replaced an
equivalent volume of air, under low-speed low-load operation, a higher NO2 to NO
ratio was obtained compared to the baseline operation. It is therefore clear that the
type of fuel affects the oxidation of NO. The raw exhaust gases contained marginal
N2O and zero NH3 emissions. The level of N2O, although very low, tended to
further reduce as the amount of H2 + N2 increased.
4. CO emissions: Under low-load operation (cond. 1 and 3), simultaneous enrichment
of the intake air with H2 + N2 resulted in a considerable CO reduction. Under low-
speed medium-load operation, admission of H2 + N2 into the engine had a minor
effect on CO emissions. Concerning the high-speed medium-load operation,
introduction of H2 + N2 over 4% led to an increase in CO emissions compared to
the baseline values.
5. Brake thermal efficiency: Enrichment of the intake air with a mixture of H2 + N2
had a detrimental effect on brake thermal efficiency. The results revealed that the
engine was more fuel efficient under low-speed (1500 rpm) compared to high-
speed (2500 rpm) operation. A dominant factor that contributed to the increased
Chapter 8: Conclusions and recommendations for future work
155
brake thermal efficiency under low-speed operation was the position of the peak in-
cylinder pressure which was closer to the TDC.
8.1.4 Enrichment of the intake air with a mixture of syngas and nitrogen
From Chapter 7, the following conclusions as to the effects of enriching the intake air of
the engine with a mixture of syngas and nitrogen can be drawn:
1. Simultaneous reductions in NOx and BSN were achieved over a broad range of the
operating window of the engine. In particular, enrichment of the intake air with a
mixture of syngas + N2, led to simultaneous reductions in NOx and smoke
emissions (compared to the baseline values) when the engine operated under low-
speed low-load, low-speed medium-load and high-speed low-load at syngas + N2
concentration over 4%.
2. Under high-speed medium-load operation, BSN was very sensitive to the
admission of nitrogen. In addition, under the same operating condition, isolation of
the effect of hydrogen and nitrogen on NOx and smoke emissions revealed that a
CO diluted flame promotes the formation of smoke. Moreover, although higher in-
cylinder pressure was recorded when the proportion of syngas + N2 was increased,
NOx emissions exhibited a decreasing trend. The reduction in NOx emissions may
have been caused by the soot radiative heat loss as BSN was unacceptably high.
3. Enrichment of the intake air with a CO-containing mixture increased the
concentration of this pollutant in the exhaust gas. Estimation of the bottled CO
utilisation revealed that by increasing either the load or the speed of the engine, the
CO was more efficiently utilised. In essence, this suggests that the combustion of
CO was influenced, among other factors, by the in-cylinder temperature.
4. An increase in engine speed led to a reduction in maximum dp/da, whereas the
effect of load on dp/da varied depending on engine speed. Under low-speed
operation, dp/da increased with load, while under high-speed operation, dp/da
dropped when the load was increased.
5. The engine was more fuel efficient when operating on neat diesel. Under low-speed
operation, the brake thermal efficiency dropped when a 4% syngas + N2 mixture
was admitted into the engine. An increase in percentage of syngas + N2 over 4%
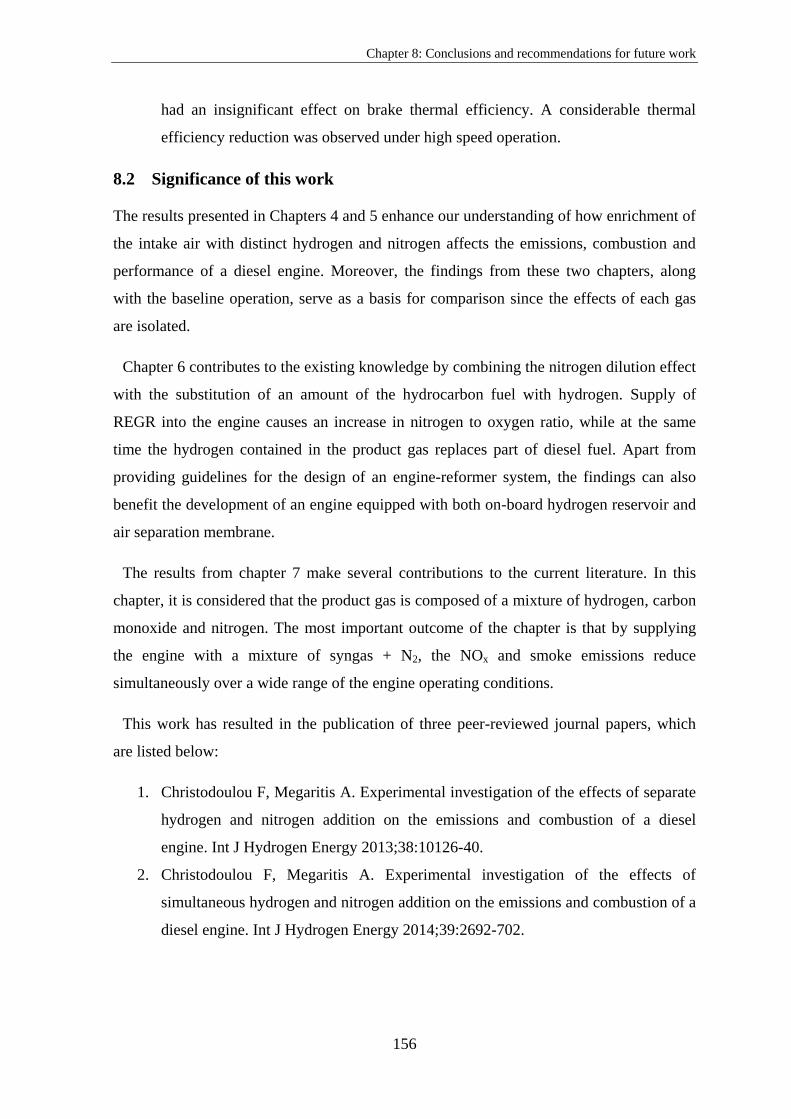
Chapter 8: Conclusions and recommendations for future work
156
had an insignificant effect on brake thermal efficiency. A considerable thermal
efficiency reduction was observed under high speed operation.
8.2 Significance of this work
The results presented in Chapters 4 and 5 enhance our understanding of how enrichment of
the intake air with distinct hydrogen and nitrogen affects the emissions, combustion and
performance of a diesel engine. Moreover, the findings from these two chapters, along
with the baseline operation, serve as a basis for comparison since the effects of each gas
are isolated.
Chapter 6 contributes to the existing knowledge by combining the nitrogen dilution effect
with the substitution of an amount of the hydrocarbon fuel with hydrogen. Supply of
REGR into the engine causes an increase in nitrogen to oxygen ratio, while at the same
time the hydrogen contained in the product gas replaces part of diesel fuel. Apart from
providing guidelines for the design of an engine-reformer system, the findings can also
benefit the development of an engine equipped with both on-board hydrogen reservoir and
air separation membrane.
The results from chapter 7 make several contributions to the current literature. In this
chapter, it is considered that the product gas is composed of a mixture of hydrogen, carbon
monoxide and nitrogen. The most important outcome of the chapter is that by supplying
the engine with a mixture of syngas + N2, the NOx and smoke emissions reduce
simultaneously over a wide range of the engine operating conditions.
This work has resulted in the publication of three peer-reviewed journal papers, which
are listed below:
1. Christodoulou F, Megaritis A. Experimental investigation of the effects of separate
hydrogen and nitrogen addition on the emissions and combustion of a diesel
engine. Int J Hydrogen Energy 2013;38:10126-40.
2. Christodoulou F, Megaritis A. Experimental investigation of the effects of
simultaneous hydrogen and nitrogen addition on the emissions and combustion of a
diesel engine. Int J Hydrogen Energy 2014;39:2692-702.

Chapter 8: Conclusions and recommendations for future work
157
3. Christodoulou F, Megaritis A. The effect of reformer gas mixture on the
performance and emissions of an HSDI diesel engine. Int J Hydrogen Energy
2014;39:9798-808.
8.3 Recommendations for future work
Although this work has made considerable contributions to the existing knowledge by
examining the effects of the intake air enrichment of a diesel engine with separate
hydrogen and nitrogen, simultaneous hydrogen and nitrogen and simultaneous syngas and
nitrogen on the emissions, combustions and performance, a number of possible future
studies using the same experimental setup could be performed.
It would be interesting to assess whether the increased NOx emissions, resulting from the
admission of hydrogen into the engine, could be reduced by fuelling the engine with
emulsified diesel, instead of diesel. The combustion of emulsified diesel has been reported
to reduce NOx and smoke emissions simultaneously by lowering the peak combustion
temperature and enhancing the mixing of fuel with air (due to the explosive evaporation of
water), respectively. Apart from the expected reduction in NOx emissions, the micro-
explosions in the combustion chamber may enhance the combustion efficiency of
hydrogen.
Further experiments could be performed using a pilot injection strategy. Adoption of this
technique leads to a reduction in NOx emissions due to the shorter ignition delay period;
therefore, the increased NOx emissions associated with hydrogen enrichment could be
compensated by adopting this injection strategy. In addition, different injection pressures
and amount of fuel could be tested at each stage of the injection process.
Another possible future study would be a more detailed combustion analysis when
introducing syngas + N2 into the engine. This would help gain a deeper understanding of
the mechanisms behind the simultaneous reductions in NOx and smoke emissions when
using this gas mixture. Also, isolation of the syngas and nitrogen effect in each operating
condition could produce interesting findings. Moreover, it is recommended to perform
experiments using combined syngas + EGR in boosted and naturally aspirated operation.
The percentage of unburned syngas in the exhaust gas could be minimised by employing a
control system that would supply syngas into the engine after the exhaust valve closes.
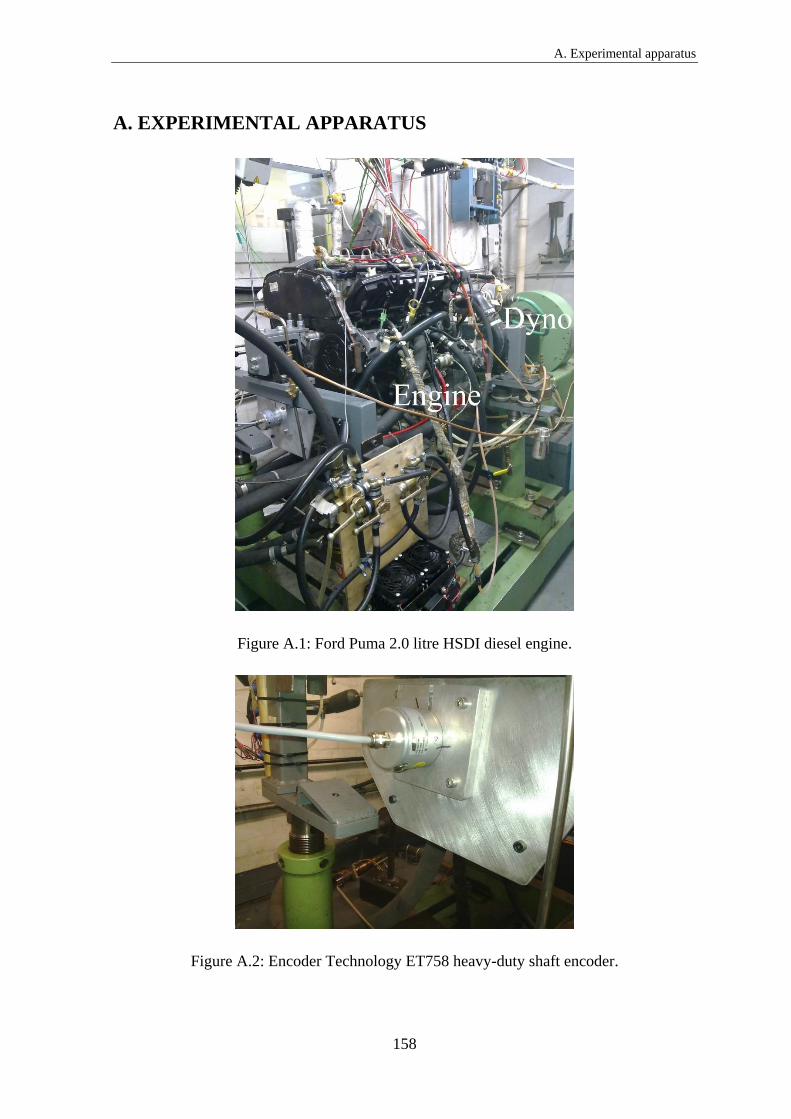
A. Experimental apparatus
158
9 A. EXPERIMENTAL APPARATUS
Figure A.1: Ford Puma 2.0 litre HSDI diesel engine.
Figure A.2: Encoder Technology ET758 heavy-duty shaft encoder.
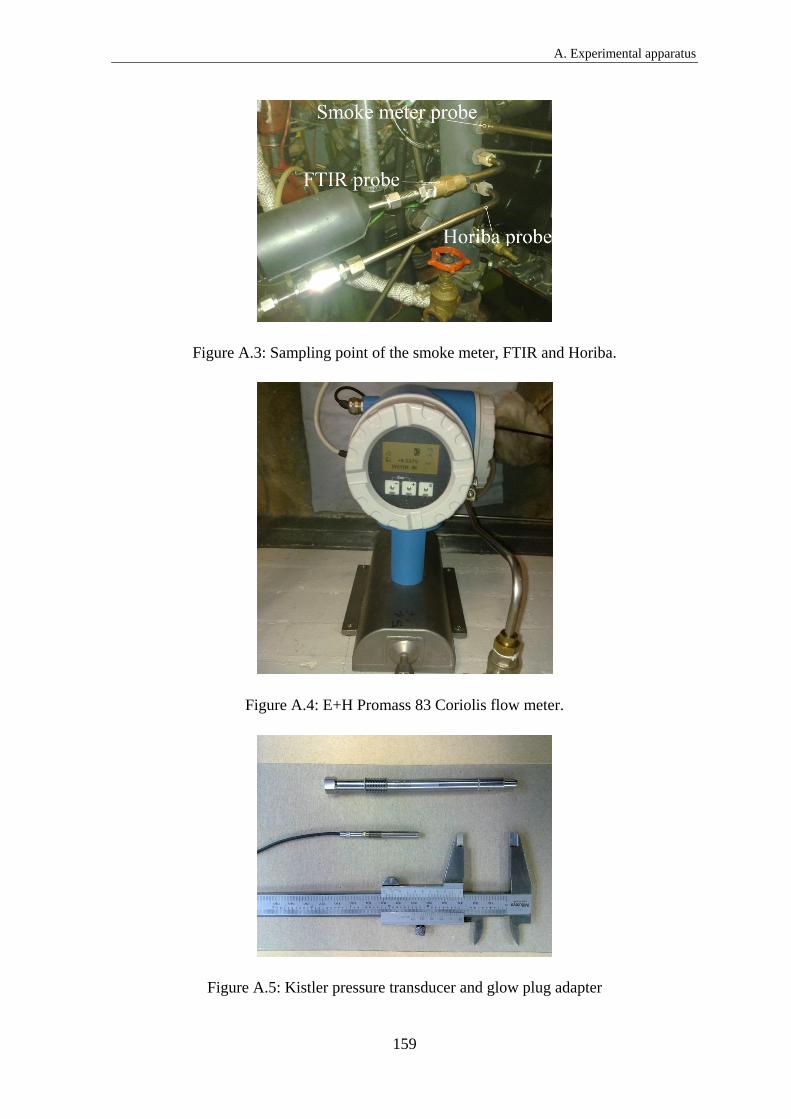
A. Experimental apparatus
159
Figure A.3: Sampling point of the smoke meter, FTIR and Horiba.
Figure A.4: E+H Promass 83 Coriolis flow meter.
Figure A.5: Kistler pressure transducer and glow plug adapter
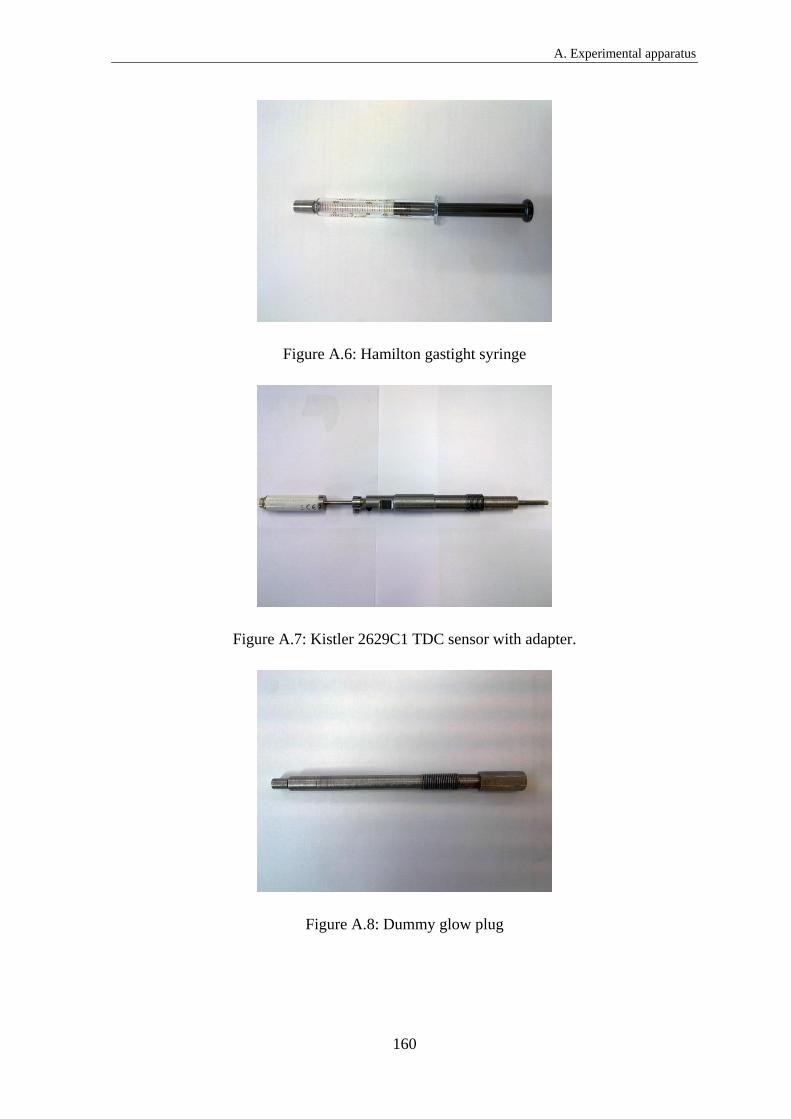
A. Experimental apparatus
160
Figure A.6: Hamilton gastight syringe
Figure A.7: Kistler 2629C1 TDC sensor with adapter.
Figure A.8: Dummy glow plug

References
161
10 REFERENCES
[1] Smolinska J. EU economic report 2008 ACEA.
[2] Potter S. In: Hensher DA, Button KJ, editor. ‘Transport energy and emissions: Urban
public transport’, chapter in ‘Handbook of transport and the environment’ Elsevier;
2003, ISBN 0-08-044103-3
[3] Ehsani M, Gao Y, Gay SE, Emadi A. Modern electric, hybrid electric, and fuel cell
vehicles. Texas: CRC Press; 2005.
[4] Chan CC, Chau KT. Modern electric vehicle technology. New York; Oxford
University Press; 2001.
[5] Holladay JD, Hu J, King DL, Wang Y. An overview of hydrogen production. Catal
Today 2009;139:244–60.
[6] Swain MR, Pappas JM, Adt RR Jr, Escher WJ. Hydrogen-fueled automotive engine
experimental testing to provide an initial design-data base. SAE paper; 1981. 810350.
[7] Du X, Wu Y, Fu L, Wang S, Zhang S, Hao J. Intake fraction of PM2.5 and NOx from
vehicle emissions in Beijing based on personal exposure data. Atmos Environ
2012;57:233-43.
[8] Payri F, Bermudez VR, Tormos B, Linares WG. Hydrocarbon emissions speciation in
diesel and biodiesel exhausts. Atmos Environ 2009;43:1273-79.
[9] Rohr AC, Wyzga RE. Attributing health effects to individual particulate matter
constituents. Atmos Environ 2012;62:130-52.
[10] Bertola AG. Technologies for lowest NOx and particulate emissions in DI-diesel
engine combustion - influence of injection parameters, EGR and fuel composition. PhD
thesis, Swiss federal institute of technology Zurich, Switzerland 2003.
[11] Heywood JB. Internal combustioon engine fundamentals. New York: McGraw-Hill;

References
162
1988.
[12] Khair MK, Jaaskelainen H. Emission formation in diesel engines. 2008. Online Source:
http://www.dieselnet.com. [Accessed 24 January 2013].
[13] Fluent Inc. Fluent Incorporated. 2003. Online Source: http://jullio.pe.kr/fluent6.1/help/
html/ug/node624.htm. [Accessed 27 08 2013].
[14] Habib MA, Elshafei M, Dajani M. Influence of combustion parameters on NOx
production in an industrial boiler. Comput Fluid 2008;37:12-23.
[15] Twigg MV, Phillips PR. Cleaning the air we breathe - Controlling diesel particulate
emissions from passenger cars. Platinum Met Rev 2009;5327-34.
[16] Majewski A. Diesel particulate matter. 2002. Online Source: http://www.dieselnet.com.
[Accessed 30 January 2013].
[17] McEntee JC, Ogneva-Himmelberger Y. Diesel particulate matter, lung cancer, and
asthma incidences along major traffic corridors in MA, USA: A GIS analysis. Health
Place 2008;14:817–28.
[18] Duggal V, Priede T, Khan I. A study of pollutant formation within the combustion
space of a diesel engine. SAE Paper; 1978. 780227.
[19] Chang YJ, Kobayashi H, Kaminoto T. A photographic study of soot formation and
combustion in diesel flame with a rapid compression machine. Proceedings of
Comodia 1985:149-57.
[20] Du CJ, Kittelson DB. Total cylinder sampling from a diesel engine: Part III - Particle
measurements. SAE Paper; 1983. 830243.
[21] Akihama K, Takatori Y, Inagaki K, Sasaki S, Dean AM. Mechanism of the smokeless
rich diesel combustion by reducing temperature. SAE paper; 2001. 2001-01-0655.
[22] Raub JA, Mathieu-Nolf M, Hampson NB, Thom SR. Carbon monoxide poisoning -
public health perspective. Toxicology 2000;145:1-14.
References
163
[23] Leigh-Smith S. Carbon monoxide poisoning in tends - A review. Wilder Environ Med
2004;15:157-63.
[24] Kaur S, Nieuwenhuijsen MJ, Colvile RN. Fine particulate matter and carbon monoxide
exposure consentrations in urban street trasport microenvironment. Atmos Environ
2007;41:4781-810.
[25] Mendez S, Kashdan JT, Bruneaux G, Thirouard B, Vangraefschepe F. Formation of
unburned hydrocarbons in low temperature diesel combustion. SAE Paper; 2009. 2009-
01-2729.
[26] Greeves G, Khan IM, Wang CHT, Fenne I. Origins of hydrocarbon emissions from
diesel engines. SAE Paper; 1977. 770259.
[27] Herfatmanesh MR. Investigation of single and split injection strategies in an optical
diesel engine. PhD thesis, Brunel University, London 2010.
[28] Environmental Protection Agency, US. EPA. 2012. Online Source: http://www.epa.gov
/otaq/consumer/milestones.htm. [Accessed 02 09 2013].
[29] Worldwide emissions standards. Delphi.com 2012.
[30] Majewski WA, Khair MK. Diesel emissions and their control. PA: SAE International;
2006.
[31] Brogan MS, Clark AD, Brisley RJ. Recent progress in NOx trap technology. SAE
paper; 1998. 980933.
[32] Majewski WA. Dieselnet. 2007. Online Source: www.dieselnet.com. [Accessed 08
2013].
[33] Li CG, Mao F, Swartzmiller SB, Wallin SA, Ziebarth RR. Properties and performance
of diesel particulate filters of an advanced ceramic material. SAE paper; 2004. 2004-
01-0955.
[34] Hemmings S, Megaritis A. Periodically regenerating diesel particulate filter with a
References
164
hydrogen/carbon monoxide mixture addition. Int J Hydrogen Energy 2012;37:3573-84.
[35] Musculus MP, Miles PC, Pickett LM. Conceptual models for partially premixed low-
temperature diesel combustion. Prog Energ Combust 2013;39:246-83.
[36] Dec JE. A Conceptual Model of DI Diesel Combustion Based on Laser-Sheet Imaging.
SAE paper; 1997. 970873.
[37] Flynn PF, Durrett RP, Hunter GL, Zur Loye AO, Akinyemi OC, Dec JE, Westbrook
CK. Diesel combustion: An integrated view combining laser diagnostics, chemical
kinetics, and empirical validation. SAE paper; 1999. 1999-01-0509.
[38] Li Z, Song C, Song J, Lv G, Dong S, Zhao A. Evolution of the nanostructure, fractal
dimension and size of in-cylinder soot during diesel combustion process. Combus
Flame 2011;158:1624-30.
[39] Arregle J, Lopez JJ, Garcıa JM, Fenollosa C. Development of a zero-dimensional
Diesel combustion model. Part 1: Analysis of the quasi-steady diffusion combustion
phase. Appl Therm Eng 2003;23:1301-17.
[40] Tsolakis A. Exhaust gas fuel reforming for compression ignition engines fuelled by
diesel and biodiesel. PhD thesis, University of Birmingham, United Kingdom 2004.
[41] Zhang Q, Yao M, Zheng Z, Liu H, Xu J. Experimental study of n-butanol addition on
performance and emissions with diesel low temperature combustion. Energy
2011;47:515-21.
[42] Ghorbanpour M, Rasekhi R. A parametric investigation of HCCI combustion to reduce
emissions and improve efficiency using a CFD model approach. Fuel 2013;106:157-65.
[43] Parks JE, Prikhodko V, Storey JME, Barone TL, Lewis SA, Kass MD, Huff SP.
Emissions from premixed charge compression ignition (PCCI) combustion and affect
on emission control devices, Catal Today 2010;151:278-84.
[44] Benajes J, Molina S, García A, Belarte E, Vanvolsem M. An investigation on RCCI
combustion in a heavy duty diesel engine using in-cylinder blending of diesel and

References
165
gasoline fuels. Appl Therm Eng 2014;63:66-76.
[45] Feng H, Zheng Z, Yao M, Cheng G, Wang M, Wang X. Effects of exhaust gas
recirculation on low temperature combustion using wide distillation range diesel.
Energy 2013;51:291-6.
[46] Han X, Zheng M, Wang J. Fuel suitability for low temperature combustion in
compression ignition engines. Fuel 2013;109:336-49.
[47] Stanglmaier RH, Roberts CE. Homogeneous charge compression ignition (HCCI);
Benefits, compromises and future engine applications. SAE paper; 1999. 1999-01-
3682.
[48] Neely GD, Sasaki S, Huang Y, Leet YA, Stewart DW. New diesel emission control
strategy to meet US tier 2 emissions regulations. SAE paper; 2005. 2005-01-1091.
[49] Guo H, Hosseini V, Neill WS, Chippior WL, Dumitrescu CE. An experimental study
on the effect of hydrogen enrichment on diesel fueled HCCI combustion. Int J
Hydrogen Energy 2011;36:13820-30.
[50] Boot MD, Luijten CCM, Somers LMT, Eguz U, van Erp DDTM, Albrecht A, Baert
RSG. Uncooled EGR as a means of limiting wall-wetting under early direct injection
conditions. SAE paper; 2009. 2009-01-0665.
[51] Beatrice C, Del Giacomo N, Guido C. Benefits and drawbacks of compression ratio
reduction in PCCI combustion application in an advanced LD diesel engine. SAE
paper; 2009. 2009-01-1447.
[52] Leermakers CAJ, Luijten CCM, Somers LMT, Kalghatgi GT, Albrecht BA.
Experimental study of fuel composition impact on PCCI combustion in a heavy-duty
diesel engine. SAE paper; 2011. 2011-01-1351.
[53] Splitter D, Wissink M, DelVescovo D, Reitz R. RCCI engine operation towards 60%
thermal efficiency. SAE paper; 2013. 2013-01-0279.
References
166
[54] Hanson R, Kokjohn S, Splitter D, Reitz R. Fuel effects on reactivity controlled
compression ignition (RCCI) combustion at low load. SAE paper; 2011. 2011-01-0361.
[55] Curran S, Hanson R, Wagner R, Reitz R. Efficiency and emissions mapping of RCCI
in a light-duty diesel engine. SAE paper; 2013. 2013-01-0289.
[56] Denso, DieselNet ECOpoint Inc. 2013. Online Source: http://www.dieselnet.com/news/
2013/06denso.php. [Accessed 27 01 2014].
[57] Agarwal AK, Chaudhary V, Agarwal A, Shukla PC. Comparative study of
macroscopic spray parameters and fuel atomization behaviour of SVO (Jatropha), its
biodiesel and blends. Therm Sci 2013;17:217-32.
[58] Chen PC, Wang WC, Roberts WL, Fang T. Spray and atomization of diesel fuel and its
alternatives from a single-hole injector using a common rail fuel injection system. Fuel
2013;103:850-61.
[59] Kuti OA, Zhu J, Nishida K, Wang X, Huang Z. Characterization of spray and
combustion processes of biodiesel fuel injected by diesel engine common rail system.
Fuel 2013;104:838-46.
[60] Mendez S, Thirouard B. Using multiple injection strategies in diesel combustion:
potential to improve emissions, noise and fuel economy trade-off in low CR engines.
SAE paper; 2008. 2008-01-1329.
[61] Badami M, Mallamo F, Millo F, Rossi EE. Influence of multiple injection strategies on
emissions, combustion noise and BSFC of a DI common rail diesel engine. SAE paper;
2002. 2002-01-0503.
[62] Boggavarapu P, Singh S. Computational study of injection rate-shaping for emissions
control in diesel engines. SAE paper; 2011. 2011-26-0081.
[63] Mahr B. Future and Potential of Diesel Injection Systems. Conferenc on Thermo- and
Fluid-Dynamic Processes in Diesel Engines, 2002.

References
167
[64] Wakasaka Y, Azensu A. Effect of fuel injection rate shaping and injection pressure on
intermittent spray combustion. SAE paper; 2000. 2000-01-2793.
[65] Wakasaka Y, Azensu A, Oikawa C. Effect of fuel injection rate shaping on spray
combustion. Proceedings of the 15th Internal Combustion Engines Symposium, 1999.
[66] Ghaffarpour M, Baranescu R. NOx reduction using injection rate shaping and
intercooling in diesel engines. SAE paper; 1996. 960845.
[67] Wakisaka Y, Azetsu A. Effects of fuel injection rate shaping on combustion and
emission formation in intermittent spray. SAE paper; 2002. 2002-01-1159.
[68] Antunes JMG. The use of hydrogen as a fuel for compression ignition engines. PhD
thesis, Newcastle University, United Kingdom 2010.
[69] Saravanan N, Nagarajan G, Dhanasekaran C, Kalaiselvan KM. Experimental
investigation of hydrogen port fuel injection in DI diesel engine. Int J Hydrogen
Energy 2007;32:4071-80.
[70] Shirk MG, McGuire TP, Neal GL, Haworth DC. Investigation of a hydrogen-assisted
combustion system for a light-duty diesel vehicle. Int J Hydrogen Energy 2008;33:
7237-44.
[71] McWilliam L, Megaritis T, Zhao H. Experimental investigation of the effects of
combined hydrogen and diesel combustion on the emissions of a HSDI diesel engine.
SAE paper; 2008. 2008-01-1787.
[72] Bose PK, Maji D. An experimental investigation on engine performance and emissions
of a single cylinder diesel engine using hydrogen as inducted fuel and diesel as injected
fuel with exhaust gas recirculation. Int J Hydrogen Energy 2009;34:4847-54.
[73] Christodoulou F, Megaritis A. Experimental investigation of the effects of separate
hydrogen and nitrogen addition on the emissions and combustion of a diesel engine. Int
J Hydrogen Energy 2013;38:10126-40.

References
168
[74] Köse H, Ciniviz M. An experimental investigation of effect on diesel engine
performance and exhaust emissions of addition at dual fuel mode of hydrogen. Fuel
Process Technol 2013;114:26-34.
[75] Lata DB, Misra A, Medhekar S. Effect of hydrogen and LPG addition on the efficiency
and emissions of a dual fuel diesel engine. Int J Hydrogen Energy 2012;37:6084-96.
[76] Pullagura G, Kumar KR, Verma PC, Jaiswal A, Prakash R, Murugan S. Experimental
investigation of hydrogen enrichment on performance and emission behaviour of
compression ignition engine. Int J Hydrogen Energy 2012;37:1223-32.
[77] Wichterlová B, Sazama P, Breen JP, Burch R, Hill CJ, Capek L, Sobalíka Z. An in situ
UV–vis and FTIR spectroscopy study of the effect of H2 and CO during the selective
catalytic reduction of nitrogen oxides over a silver alumina catalyst. J Catal
2005;235:195-200.
[78] Bromberg L, Cohn DR, Wong V. Regeneration of diesel particulate filters with
hydrogen rich gas. MIT Plasma Science and Fusion Centre 2005, PSFC/RR-05-2.
[79] Tsolakis A, Megaritis A, Yap D, Abu-Jrai A. Combustion characteristics and exhaust
gas emissions of a diesel engine supplied with reformed EGR. SAE paper; 2005. 2005-
01-2087.
[80] Sahoo BB, Sahoo N, Saha UK. Effect of H2:CO ratio in syngas on the performance of
a dual fuel diesel engine operation. Appl Therm Eng 2012;49:139-46.
[81] Bika AS, Franklin L, Kittelson D. Cycle efficiency and gaseous emissions from a
diesel engine assisted with varying proportions of hydrogen and carbon monoxide
(synthesis gas). SAE paper; 2011. 2011-01-1194.
[82] Dong C, Zhou Q, Zhao Q, Zhang Y, Xu T, Hui S. Experimental study on the laminar
flame speed of hydrogen/carbon monoxide/air mixtures. Fuel 2009;88:1858-63.
[83] Zhao H. Advanced direct injection combustion engine technologies and development:
Diesel engines (Volume 2). Cambridge: Woodhead Publishing Ltd and CRC Press;
References
169
2009.
[84] Wikipedia. 2013. Online Source: http://en.wikipedia.org/wiki/Autogas. [Accessed 07
11 2013].
[85] Sita Rama Raju AV, Musa SE, Ramesh A, Nagalingam B. Development and testing of
a learn burn spark ignition engine operation on LPG. Proceedings of the XV national
conference on I.C. engines and combustion, Chennai, 1997.
[86] Fontaras G, Manfredi U, Martini G, Dilara P, Deregibus G. Experimental assessment
of a diesel-LPG dual fuel supply system for retrofit application in city busses. SAE
paper; 2012. 2012-01-1944.
[87] Lata DB, Misra A, Medhekar S. Investigations on the combustion parameters of a dual
fuel diesel engine with hydrogen and LPG as secondary fuels. Int J Hydrogen Energy
2011;36:13808-19.
[88] Saleh HE. Effect of variation in LPG composition on emissions and performance in a
dual fuel diesel engine. Fuel 2008;87:3031-39.
[89] Fontaras G, Martini G, Manfredi U, Marotta A, Krasenbrink A, Maffioletti F, Terenghi
R, Colombo M. Assessment of on-road emissions of four Euro V diesel and CNG
waste collection trucks for supporting air-quality improvement initiatives in the city of
Milan. Sci Total Environ 2012;426:65-72.
[90] Abdelaal MM, Hegab AH. Combustion and emission characteristics of a natural gas-
fueled diesel engine with EGR. Energ Convers Manage 2012;64:301-12.
[91] Namasivayam AM, Korakianitis T, Crookes RJ, Bob-Manuel KD, Olsen J. Biodiesel,
emulsified biodiesel and dimethyl ether as pilot fuels for natural gas fuelled engines.
Appl Energ 2010;87:769-78.
[92] Board NB. Biodiesel org, National biodiesel board. 2013. Online Source: http://www.
biodiesel.org/what-is-biodiesel/biodiesel-basics. [Accessed 31 20 2013].
References
170
[93] Labecki L. Combustion and emission characteristics of biofuels in diesel engines. PhD
thesis, Brunel University, United Kingdom 2010.
[94] Lapuerta M, Armas O, Rodriguez-Fernandez and J. Effect of biodiesel fuels on diesel
engine emissions. Prog Energ Combust 2008;34:198-223.
[95] Atadashi IM, Aroua MK, Abdul Aziz A. High quality biodiesel and its diesel engine
application: A review. Renew Sust Energ Rev 2010;14:1999–2008.
[96] Tsolakis A, Megaritis A, Wyszynski ML, Low temperature exhaust gas fuel reforming
of diesel engine. Fuel 2004;83:1837-45.
[97] Tsolakis A, Megaritis A. Exhaust gas fuel reforming for diesel engines - A way to
reduce smoke and NOx emissions simultaneously. SAE Paper; 2004. 2004-01-1844.
[98] Abu-Jrai A, Tsolakis A, Megaritis A. The influence of H2 and CO on diesel engine
combustion characteristics, exhaust gas emissions, and after treatment selective
catalytic NOx reduction. Int J Hydrogen Energy 2007;32:3565-71.
[99] Ajhar M, Follmann M, Matthias C, Melin T. Membranes producing nitrogen-enriched
combustion air in diesel engines: Assessment via dimensionless numbers. J Membrane
Sci 2008;323:105-12.
[100] Poola RB, Longman DE, Anderson JL, Stork KC, Sekar R, Callaghan K,Nemser S.
Membrane-Based Nitrogen-Enriched Air for NOx Reduction in Light-Duty Diesel
Engines. SAE paper; 2000. 2000-01-0228.
[101] Li T, Izumi H, Shudo T, Ogawa H, Okabe Y. Characterization of Low Temperature
Diesel Combustion with Various Dilution Gases. SAE paper 2007. 2007-01-0126.
[102] Ladommatos N, Balian R, Horrocks R, Cooper L. The effect of exhaust gas
recirculation on combustion and NOx emissions in high-speed-direct-injection diesel
engine. SAE paper; 1996. 960840.
[103] Ajhar M, Follmann M, Matthias C, Melin T. Membranes producing nitrogen-enriched
combustion air in diesel engines: Assessment via dimensionless numbers. J Membrane
References
171
Sci 2008;323:105–12.
[104] Poola RB, Longman DE, Anderson JL, Callaghan K, Nemser S, Bell R. Membrane-
based nitrogen-enriched air for NOx reduction in light-duty diesel engines. SAE paper;
2000. 2000-01-0228.
[105] Li T, Izumi H, Shudo T, Ogawa H, Okabe Y. Characterization of low temperature
diesel combustion with various dilution gases. SAE paper; 2007. 2007-01-0126.
[106] Hsu BD. Practical diesel-engine combustion analysis. Warrendale: SAE International;
2002.
[107] Khair MK, Jaaskelainen H. Exhaust gas recirculation. DieselNet; 2012.
[108] Ladommatos N, Balian R, Horrocks R, Cooper L. The effect of exhaust gas
recirculation on soot formation in a high-speed direct-injection diesel engine. SAE
paper; 1996. 960841.
[109] Feng H, Zheng Z, Yao M, Cheng G, Wang M, Wang X. Effects of exhaust gas
recirculation on low temperature combustion using wide distillation range diesel.
Energy 2013;51:291-96.
[110] Singh SK, Agarwal AK, Srivastava DK, Sharma M. Experimental investigation of the
effect of exhaust gas recirculation on lubricating oil degradation and wear of a
compression ignition engine. J Eng Gas Turb Power 2006;128:921-7.
[111] George S, Balla S, Gautam M. Effect of diesel soot contaminated oil on engine wear.
Wear 2007;262:1113-22.
[112] Rajput RK. Electrical and Electronic Measurements and Instrumentation. New Delhi:
S. Chand Group; 2013.
[113] K2BW Environmental Equipment Services Co. 2013. Online Source: http://www.
k2bw.com/5_c_18.htm. [Accessed 09 12 2013].
[114] DieselNet, Ecopoint Inc. 2007. Online Source: http://www.dieselnet.com/tech/measure
References
172
_gas.php. [Accessed 09 12 2013].
[115] Thet K, Woo N. UC Davis ChemWiki. Online Source: http://chemwiki.ucdavis.edu/
Analytical_Chemistry/Instrumental_Analysis/Chromatography/Gas_Chromatography.
[Accessed 12 12 2013].
[116] MKS Instruments, MKS type multigas analyser hardware instruction manual. MKS
instruments; 2006.
[117] AVL List GmbH, AVL 415 variable sampling smoke meter operating manual. AVL;
1991.
[118] White CM, Steeper RR, Lutz AE. The hydrogen-fueled internal combustion engine: a
technical review. Int J Hydrogen Energy 2006;31:1292-305.
[119] Zink Hamworthy J. The John Zink Hamworthy combustion handbook. Florida:
Taylor&Francis; 2012.
[120] Mashuga CV, Crowl DA. Derivation of Le Chatelier’s mixing rule for flammable
limits. Process Saf Prog 2000;19:112-7.
[121] Wierzba I, Kilchyk V. Flammability limits of hydrogen–carbon monoxide mixtures at
moderately elevated temperatures. Int J Hydrogen Energy 2001;26:639-43.
[122] Choudhuri AR, Gollahalli SR. Characteristics of hydrogene-hydrocarbon composite
fuel turbulent jet flames. Int J Hydrogen Energy 2002;28:445-54.
[123] Verhelst S, Verstraeten S, Sierens R. A comprehensive overview of hydrogen engine
design features. J Auto Eng 2007;8:911-20.
[124] Cecrle E, Depcik C, Guo J, Peltier E. Analysis of the effects of reformate
(hydrogen/carbon monoxide) as an assistive fuel on the performance and emissions of
used canola-oil biodiesel. Int J Hydrogen Energy 2012;37:3510-27.
[125] Homsy SC, Atreya A. An experimental heat release rate analysis of a diesel engine
operating under steady state conditions. SAE paper; 1997. 970889.

References
173
[126] Egnell R. Combustion diagnostics by means of multizone heat release analysis and NO
calculation. SAE paper; 1998. 981424.
[127] Korakianitis T, Namasivayam A, Crookes R. Diesel and rapeseed methyl ester (RME)
pilot fuels for hydrogen and natural gas dual-fuel combustion in compression ignition
engines. Fuel 2011;90:2384-95.
[128] Gatts T, Liu S, Liew C, Ralston B, Bell C, Li H. An experimental investigation of
incomplete combustion of gaseous fuels of a heavy-duty diesel engine supplemented
with hydrogen and natural gas. Int J Hydrogen Energy 2012;37:7848-59.
[129] Christodoulou F, Giannakakis P, Kalfas A. Performance benefits of a portable hybrid
micro-gas-turbine power system for automotive applications. J Eng Gas Turb Power
2011;133:022301-8.
[130] Lata DB, Misra A. Theoretical and experimental investigations on the performance of
dual fuel diesel engine with hydrogen and LPG as secondary fuels. Int J Hydrogen
Energy 2010;35:11918-31.
[131] Singh R, Maji S. Dual fuelling of a twin-cylinder compression ignition engine with
diesel and CNG. J Eng Appl Sci 2012;7:90-9.
[132] Chokri B, Ridha E, Rachid S, Jamel B. Experimental study of a diesel engine
performance running on waste vegetable oil biodiesel blend. J Energ Resour Technol
2012;134:032202-7.
[133] Bromberg L, Cohn DR, Rabinovich A, Heywood J. Emissions reductions using
hydrogen from plasmatron fuel converters. Int J Hydrogen Energy 2001;26:1115-21.
[134] Bari S, Mohammad Esmaeil M. Effect of H2/O2 addition in increasing the thermal
efficiency of a diesel engine. Fuel 2010;89:378-83.
[135] Banerjee R, Kumar Bose P. An experimental investigation on the potential of hydrogen
in the reduction of the emission characteristics of an existing four-stroke single-
cylinder diesel engine operating under EGR. Int J Green Energy 2012;9:84-110.
References
174
[136] Das LM. Hydrogen-oxygen reaction mechanism and its implication to hydrogen engine
combustion. Int J Hydrogen Energy 1996;21:703-15.
[137] Tsolakis A, Hernandez JJ, Megaritis A, Crampton M. Dual fuel diesel operation using
H2. Effect on particulate emissions. Energ Fuel 2005;19:418-25.
[138] DieselNet, Ecopoint Inc. 2010. Online Source: https://www.dieselnet.com/tech/
emi_gas.php#hc. [Accessed 27 02 2014].
[139] Derwent R, Simmonds P, O’Doherty S, Manning A, Collins W, Stevenson D. Global
environmental impacts of the hydrogen. Int J Nucl Hydrog Prod Appl 2006;1:57-67.
[140] Hemmings S, Megaritis A. The effect of a H2/CO mixture at varying ratios on the
diesel particulate filter regeneration process: towards an optimised fuel reformer design
- diesel engine aftertreatment system. Int J Hydrogen Energy 2012;37:12332-41.
[141] Abu-Jrai A, Tsolakis A, Theinnoi K, Megaritis A, Golunski S. Diesel exhaust-gas
reforming for H2 addition to an aftertreatment unit. Chem Eng J 2008;141:290-7.
[142] Bond SW, Alvarez R, Vollmer MK, Steinbacher M, Weilenmann M, Reimann S.
“Molecular hydrogen (H2) emissions from gasoline and diesel vehicles. Sci Total
Environ 2010;408:3596-606.
[143] Karim GA, Wierzba I, Boon S. Some considerations of the lean flammability limits of
mixtures involving hydrogen. Int J Hydrogen Energy 1984;10:117-23.
[144] Kennedy IM. Models of soot formation and oxidation. Prog Energy Combust
1997;23:95-132.
[145] Sjöberg M, Dec JE. An investigation into lowest acceptable combustion temperature
for hydrocarbon fuels in HCCI engines. P Combust Inst 2005;30:2719-26.
[146] Minagawa T, Kosaka H, Kamimoto T. A study on Ignition Delay of Diesel Fuel Spray
via Numerical Simulation. SAE paper; 2000. 2000-01-1892.
[147] Herzog PL, Burgler L, Winklhofer E, Zelenka P, Cartellieri W. NOx reduction

References
175
strategies for DI diesel engines. SAE paper; 1992. 920470.
[148] Schaefer M, Hofmann L, Girot P, Rohe R. Investigation of NOx- and PM-reduction by
a combination of SCR-catalyst and Diesel Particulate filter for heavy-duty diesel
engine. SAE paper; 2009. 2009-01-0912.
[149] Buyukkaya E, Cerit M. Experimental study of NOx emissions and injection timing of a
low heat rejection diesel engine. Int J Therm Sci 2007;47:1096-106.
[150] Schubiger R, Bertola A, Boulouchos K. Influence of EGR on combustion and exhaust
emissions of heavy duty DI-diesel engines equipped with common-rail injection
systems. SAE paper; 2001. 2001-01-3497.
[151] Ladommatos N, Abdelhalim SM, Zhao H, Hu Z. The dilution, chemical and thermal
effects of exhaust gas recirculation on diesel engine emissions - part 1 : Effect of
reducing inlet charge oxygen. SAE paper; 1996. 1996-05-01.
[152] Mkilaha ISN, Inoue M, Kawai D, Naruse I, Ohtake K. Simultaneous reduction of
particulate matter and NOx in a diesel engine by compressed gas injection:
macroscopic study at residual load. IMechE 1997;211:227-36.
[153] Papagiannakis RG, Hountalas DT. Experimental investigation concerning the effect of
natural gas percentage on performance and emissions of a DI dual fuel diesel engine.
Appl Therm Eng 2003;23:353-65.
[154] Cho Y, Song S, Chun KM. H2 effects on diesel combustion and emissions with an
LPL-EGR system. Int J Hydrogen Energy 2013;38:9897-906.
[155] Mohon Roy M, Najmul Hoque SM, Ariful Islam M, Rahman Mustafizur M. Use of
exhaust gas recirculation (EGR) and cyclonic separator for simultaneous NOx and PM
reduction in DI diesel engines. J Pertol Gas Eng 2011;2:54-63.
[156] Nakatani K, Hirota S, Takeshima S, Itoh K, Tanaka T, Dohmae K. Simultaneous PM
and NOx reduction system for diesel engines. SAE paper; 2002. 2002-01-0957.

References
176
[157] Johnson TV. Review of diesel emissions and control. SAE Int J Fuels Lubr 2010;3:16-
29.
[158] Yoshinobu Y, Tsuda Y, Ueda H, Nakanishi Y, Gong J. Simultaneous reduction of NOx
and PM in diesel exhaust based on electrochemical reaction. SAE Int J Fuels Lubr
2010;3:50-60.
[159] Ragland KW, Bryden KM. Combustion engineering. Florida: Taylor & Francis; 2011.
[160] Peirce DM, Alozie NS, Hatherill DW, Ganippa LC. Premixed burn fraction: Its relation
to the variation in NOx emissions between petro- and biodiesel. Energ Fuels
2013;27:3838-52.
[161] Shin B, Cho Y, Han D, Song S, Min Chun K. Investigation of the effects of hydrogen
on cylinder pressure in a split-injection diesel engine at heavy EGR. Int J Hydrogen
Energy 2011;36:13158-70.
[162] Hori M, Matsunaga N, Marinov N, Pitz W, Westbrook C. An experimental and kinetic
calculation of the promotion effect of hydrocarbons on the NO-NO2 conversion in a
flow reactor. Combust Inst 1998;27:389-96.
[163] Ambs J, McClure B. The influence of oxidation catalyst on NO2 in diesel exhaust.
SAE paper; 1993. 932494.
[164] Jobson E, Smedler G, Malmberg P, Bernler H, Hjortsberg O, Gottberg I, et al. Nitrous
oxide formation over three-way catalyst. SAE paper; 1994. 940926.
[165] Koike N, Odaka M. Methane and nitrous oxide emission characteristics from
automobiles. SAE paper; 1996. 960061.
[166] Lipman T, Delucchi M. Emissions of nitrous oxide and methane from conventional and
alternative fuel motor vehicles. Clim Change 2002;53:477-516.
[167] Chaubey R, Sahu S, James O, Sudip M. A review on development of industrial
processes and emerging techniques for production of hydrogen from renewable and

References
177
sustainable sources. Renew Sust Energy Rev 2013;23:443-62.
[168] Jamal Y, Wyszynski M. On-board generation of hydrogen-rich gaseous fuels - a
review. Int J Hydrogen Energy 1994;19:557-72.
[169] Tsolakis A, Megaritis A, Golunski SE. Reaction profiles during exhaust assisted
reforming of diesel engine fuels. Energ Fuels 2005;19:744-52.
[170] Kopasz J, Wilkenhoener R, Ahmed S, Carter J, Krumpelt M. In: Gregoire Padro CE,
Lau F, editors. ‘Fuel flexible reforming of hydrocarbons for automotive applications’,
chapter in ‘Advances in hydrogen energy’ Springer; 2002, ISBN 0-306-46429-2.
[171] Singh Bika A. Synthesis gas use in internal combustion engines. PhD thesis, University
of Minnesota, United States 2010.
[172] Sahoo BB, Saha UK, Sahoo N. Theoretical performance limits of a syngas-diesel
fueled compression ignition engine from second law analysis. Energy 2011;36:760-9.
[173] Azimov U, Okuno M, Tsuboi K, Kawahara N, Tomita E. Multidimensional CFD
simulation of syngas combustion in a micro-pilot-ignited dual-fuel engine using a
constructed chemical kinetics mechanism. Int J Hydrogen Energy 2011;36:13793-807.
[174] Garnier C, Bilcan A, Le Corre O, Rahmouni C. Characterisation of a syngas-diesel
fuelled CI engine. SAE paper; 2005. 2005-01-1731.
[175] Guo H, Thomson KA, Smallwood GJ. On the effect of carbon monoxide addition on
soot formation in a laminar ethylene/air coflow diffusion flame. Combust Flame
2009;156:1135-42.
[176] Kondo S, Takizawa K, Takahashi A, Tokuhashi K. On the temperature dependence of
flammability limits of gases. J Hazard Mater 2011;187:585-90.
[177] Christodoulou F, Megaritis A. Experimental investigation of the effects of
simultaneous hydrogen and nitrogen addition on the emissions and combustion of a
diesel engine. Int J Hydrogen Energy 2014;39:2692-702.
References
178
[178] Selim M. Pressure-time characteristics in diesel engine fuelled with natural gas. Renew
Energy 2001;22:473-89.
[179] Musculus MP. Measurements of the influence of soot radiation on in-cylinder
temperatures and exhaust NOx in a heavy-duty DI diesel engine. SAE paper; 2005.
2005-01-0925.