SC16 BoF Report: On-Demand Infrastructure for Data...
13
SC16 BoF Report: On-Demand Infrastructure for Data Analytics and Storage Franck Cappello, 1,2 Katrin Heitmann, 1 Gabrielle Allen, 2 William Gropp, 2 Salman Habib, 1 Ed Seidel, 2 Brandon George, 4 Brett Bode, 2 Tim Boerner, 2 Maxine D. Brown, 3 Michelle Butler, 2 Randal L Butler, 2 Kenton G. McHenry, 2 Joe Insley, 1 Athol J Kemball, 2 Rajkumar Kettimuthu, 1 Ravi Madduri, 1 Alex Parga, 2 Silvio Rizzi, 1 Roberto R. Sisneros, 2 Corby B. Schmitz, 1 Sean R. Stevens, 2 Matthew J. Turk, 2 Tom Uram, 1 David Wheeler, 2 Michael J. Wilde, 1 Justin M. Wozniak 1 1 ANL, 2 NCSA, 3 UIC, 4 DDN This report describes the experiment on “on-demand infrastructure for data analytics and storage” that ANL, NCSA, UIC, DDN, and SCinet developed between December 2015 and November 2016. We needed to address several challenges to make this experiment a success. The report presents the motivation and scientific objectives, the design and implementation, and the scientific and technical results. 1. Motivations, Concept, and Experiment In this section we consider the factors motivating our experiment. We then describe the concept, briefly present the case we use to demonstrate that concept, and the experiment we devised and ran at SC16. 1.1 Motivations Three main trends motivate reconsideration of the scientific computing infrastructure. First, the data size and throughput are becoming main limiting factors of extreme-scale simulations and experiments. With current system computational capabilities, extreme-scale scientific simulations and experiments can generate much more data than can be stored at a single site, transferred between sites, or analyzed. The scientific community needs multilevel data access in order to perform complex and accurate analyses, while avoiding severe data reduction methods such as filtering and extrapolation. Second, often a single site cannot simultaneously satisfy both computing and data analytics requirements. For example, Mira at ANL is well suited for large-scale simulation, and Blue Waters at NCSA is an excellent system for data analytics with its large memory (1.5 PB) and its 4000+ GPU accelerators. Specialization, which is already the norm in scientific instruments because they are optimized for specific objectives, will become more prevalent in simulation and data analytics infrastructure as we reach the end of Moore’s law. Progress in performance is increasingly difficult to obtain from generic systems. Specialized architectures provide a solution to this problem by optimizing the systems for specific objectives. Example of such systems are the Anton machine for molecular dynamics and the GRAPE systems for astrophysics. Third, extreme-scale simulations and experiments tend to push toward a model where groups of researchers run simulations that are then analyzed by many other groups (the one-simulation, many- groups model), in contrast to each group running their own simulations and data analytics (the one- simulation, one-group model). In the one-to-many configuration, high-performance data access by different groups becomes a fundamental requirement of the scientific computing infrastructure. Current supercomputing centers are designed mostly for high-performance scientific computing and data analytics, while large-scale data centers (such as cloud centers) are optimized for data access and sharing. The scientific computing community will certainly benefit from lessons learned in large-scale data centers concerning data access and sharing. Several communities have already reconsidered their infrastructure to response to these trends. One example is the high energy physics (HEP) community with the Large Hadron Collider and its dedicated data analytics infrastructure, where the data produced by the experiments is sent to remote distributed
Transcript of SC16 BoF Report: On-Demand Infrastructure for Data...

SC16 BoF Report: On-Demand Infrastructure for Data Analytics and Storage Franck Cappello,1,2 Katrin Heitmann,1 Gabrielle Allen,2 William Gropp,2 Salman Habib,1 Ed Seidel,2 Brandon
George,4 Brett Bode,2 Tim Boerner,2 Maxine D. Brown,3 Michelle Butler,2 Randal L Butler,2 Kenton G.
McHenry,2 Joe Insley,1 Athol J Kemball,2 Rajkumar Kettimuthu,1 Ravi Madduri,1 Alex Parga,2 Silvio Rizzi,1
Roberto R. Sisneros,2 Corby B. Schmitz,1 Sean R. Stevens,2 Matthew J. Turk,2 Tom Uram,1 David Wheeler,2
Michael J. Wilde,1 Justin M. Wozniak1
1ANL, 2NCSA, 3UIC, 4DDN
This report describes the experiment on “on-demand infrastructure for data analytics and storage” that
ANL, NCSA, UIC, DDN, and SCinet developed between December 2015 and November 2016. We
needed to address several challenges to make this experiment a success. The report presents the
motivation and scientific objectives, the design and implementation, and the scientific and technical
results.
1. Motivations, Concept, and Experiment In this section we consider the factors motivating our experiment. We then describe the concept, briefly
present the case we use to demonstrate that concept, and the experiment we devised and ran at SC16.
1.1 Motivations Three main trends motivate reconsideration of the scientific computing infrastructure.
First, the data size and throughput are becoming main limiting factors of extreme-scale simulations and
experiments. With current system computational capabilities, extreme-scale scientific simulations and
experiments can generate much more data than can be stored at a single site, transferred between sites, or
analyzed. The scientific community needs multilevel data access in order to perform complex and accurate
analyses, while avoiding severe data reduction methods such as filtering and extrapolation.
Second, often a single site cannot simultaneously satisfy both computing and data analytics requirements.
For example, Mira at ANL is well suited for large-scale simulation, and Blue Waters at NCSA is an
excellent system for data analytics with its large memory (1.5 PB) and its 4000+ GPU accelerators.
Specialization, which is already the norm in scientific instruments because they are optimized for specific
objectives, will become more prevalent in simulation and data analytics infrastructure as we reach the end
of Moore’s law. Progress in performance is increasingly difficult to obtain from generic systems.
Specialized architectures provide a solution to this problem by optimizing the systems for specific
objectives. Example of such systems are the Anton machine for molecular dynamics and the GRAPE
systems for astrophysics.
Third, extreme-scale simulations and experiments tend to push toward a model where groups of
researchers run simulations that are then analyzed by many other groups (the one-simulation, many-
groups model), in contrast to each group running their own simulations and data analytics (the one-
simulation, one-group model). In the one-to-many configuration, high-performance data access by
different groups becomes a fundamental requirement of the scientific computing infrastructure. Current
supercomputing centers are designed mostly for high-performance scientific computing and data analytics,
while large-scale data centers (such as cloud centers) are optimized for data access and sharing. The
scientific computing community will certainly benefit from lessons learned in large-scale data centers
concerning data access and sharing.
Several communities have already reconsidered their infrastructure to response to these trends. One
example is the high energy physics (HEP) community with the Large Hadron Collider and its dedicated
data analytics infrastructure, where the data produced by the experiments is sent to remote distributed

storage and the data analytics is performed on other servers. Another example is the genomic
communities, who have their own data banks. However, the associated infrastructure in these cases is
dedicated (not shared by other large-scale experiments), specific (responds to specific data distribution
needs), and permanent (resources and policies are in place for 24/7 analysis needs).
1.2. On-Demand Data Analysis and Storage Concept We propose the concept of “on demand infrastructure for data analysis and storage.” This concept differs
from the existing infrastructure in HEP (LHC data analytics infrastructure) and genomic communities in
several ways. We consider the deployment of an elastic virtual infrastructure connecting several data
production sites (comprising both simulation and experiment), data centers for storage, and data analysis
centers. The infrastructure setup is not permanent; it is dynamically instantiated on demand for transient
needs (even if the data is stored on a long-term basis in the data centers). The same resources (data
production site, data centers, and analytics centers) could be used or shared by other scientific
communities instantiating their own transcient infrastructure, potentially aggregating other resources as
well.
Our concept relies on technologies needed for the convergence of high-performance computing (HPC) and
big data, such as virtualized resources, resource reservation, software deployment, user group
management, and policy management. It combines some grid principles by aggregating geographically
distributed resources owned by different institutions, as well as some cloud principles such as
infrastructure as a service, elasticity, and virtualization.
1.3. Use Case To demonstrate the benefit of this new concept, we consider the domain of computational cosmology and
propose a response to the pressing needs for higher accuracy for scientific discoveries. The science
requirements demand running large simulations, such as N-body runs with trillions of particles. The
resulting data products are scientifically rich and of interest to many research groups. It is therefore
desirable that the data be made broadly available. However, as a fiducial example, a trillion-particle
simulation with the HACC code generates 20 PB of raw data (40 TB per snapshot and 500 snapshots),
which is is more than petascale systems such as Mira and Blue Waters can store for a single run in their
file systems. An interesting point is that while one version of HACC is optimized for Mira and can scale
to millions of cores, Blue Waters offers exceptional data analytics capabilities with its thousands of GPUs.
This suggests a combined infrastructure based on using Mira for the simulation, Blue Waters for a first-
level data analysis, and a separate, possibly distributed, data center to store the distilled results. Users from
other universities and labs would then pull the data from the data center and run further data analytics
locally according to their particular scientific interests.
1.4. The SC16 Experiment To demonstrate the feasibility of this concept, a team of about 20 researchers and staff from ANL, NCSA,
UIC, and DDN and including SCinet leaders devised an experiment (Figure 1) and demonstrated it at the
2016 International Conference for High Performance Computing, Networking, Storage and Analysis
(SC16) in Salt Lake City.
Figure 1: Planned SC16 on-demand data analytics
and storage experiment.
The actual experiment used ANL for the second-
level data analytics and PDACS (see Section 2).
This experiment and demonstration covered several critical elements of on-demand data analytics and
storage. During the experiment a state-of-the-art cosmology simulation combining high spatial and
temporal resolution in a large cosmological volume was performed on Mira with 29 billion particles. All
time snapshots (500) of the simulation (L1 data) were transmitted, as they were produced, to NCSA by
using Globus. Note that in previous simulations users were able to analyze only ~100 snapshots because
of infrastructure limitations. A first level of data analytics (L2 data) and visualization was performed as
snapshots arrive at NCSA using the GPU partition of Blue Waters. Blue Waters also archived the L1 data
on tape. The L2 data (half the size of the L1 data) was sent immediately as produced to a DDN storage
server (playing the role of a data center). The DDN storage server was then hosted at the SC16 NCSA
booth to allow access to and sharing of the resulting data from remote sites. One site (ANL) played the
role of remote data analytic centers. It pulled and analyzed the L2 data as it was stored on the storage
server and performed specific and different data analytics using the Portal for Data Analysis Services for
Cosmological Simulations (PDACS) framework. The goal was to demonstrate that L2 data can be used by
other cosmology research groups. Data analysis results were displayed in ultra-high resolution using the
SAGE2 software at the SC16 NCSA booth on the show floor. The whole experiment was orchestrated by
the Swift parallel scripting language. Details about this workflow are presented in Section 2.
This experiment achieved three objectives never accomplished before: (1) running a state-of-the-art
cosmology simulation and analyzing all snapshots (currently only 1 snapshot of 5 or 10 is stored or
communicated); (2) combining three different types of systems (simulation on Mira, data analytics on
Blue Waters, and data storage on the DDN server) geographically distributed and belonging to different
administration domains to run an extreme-scale simulation; and (3) performing multiple different extreme-
scale cosmology data analyses from data stored on a remote data center.
To run this experiment, we needed to address several technical challenges:
Transfer: we needed to transfer the data produced by the simulation between the ALCF hosting
Mira and NCSA hosting Blue Waters at the sustained pace of 1 PB/day for 1 day. Orchestration: we needed to orchestrate the simulation run, the transfer of the snapshots as they
were produced between the ALCF and NCSA, the analytics, and the storage. Storage: we needed to demonstrate the feasibility of a dense data server capable of hosting the L1
and L2 data (1 PB) and receiving data at the sustained pace of 100 Gb/s during 1 day. SCinet: we needed to configure SCinet on the SC16 show floor to accommodate the 100 Gb/s
data transfer between NCSA and the DDN storage server hosted at the NCSA booth. In the following sections we describe the scientific case and discuss these three technical challenges in
detail.
2. Science Case Cosmological simulations that track the detailed evolution of structure in the Universe over time are
essential for the interpreting large observational surveys carried out to understand the history and content of
the Universe. Cosmological surveys are becoming ever more complex as telescopes reach deeper into
space, mapping out the distributions of galaxies at farther and farther distances. These observations provide
a treasure trove of information about the makeup of the Universe and its evolution from the first moments
to today. The nature of cosmology, however, precludes carrying out controlled experiments in the
laboratory. Instead, we must observe the Universe and interpret the results; and central to this process are
simulations that provide a unique way to create a virtual laboratory for cosmology. We are able to vary the
fundamental physics in the simulations, evaluate resulting measurements in a controlled way, and then
predict new phenomena. At the same time, we can model systematic errors in the data, mimic inaccuracies
due to limiting telescope and sensor artifacts, and understand how these limitations can influence our
scientific results.
In order to achieve the high-quality simulations that are required to serve as a “Universe in the Lab,” high
temporal and spatial resolution are of utmost importance. We need to track the evolution of small
overdensities in detail and follow how they evolve into larger structures. Events early in the life of such a
structure will determine what kind of galaxy it will host later, controlling, for example, the brightness,
color, and morphology of the galaxy. Current and next-generation supercomputers allow us to attain very
high spatial resolution in large cosmological volumes by simulating trillions of tracer particles. But more
challenges have to be overcome. (1) A snapshot in a trillion-particle simulation comprises 40 TB of raw
data. To enable the temporal resolution necessary to capture important details in the evolution of structure,
we have to analyze hundreds of snapshots, quickly leading to many petabytes of data. Currently, storing
this large amount of data over a long period of time is not possible. (2) The high-performance computer on
which the simulation is carried out might not be—and usually is not—the optimal system for data analysis.
Analysis tasks are often more out of balance than the actual simulation, and a wide variety of such tasks
need to be carried out. Optimizing all analysis tools for a particular HPC architecture is difficult. Therefore,
using a better-suited analysis machine is often desirable. (3) The simulation data is rich: we want to create
different virtual universes covering different wavelength ranges and enable the larger cosmology
community to carry out their own experiments on the simulation results. While doing so will not be
possible on the raw data, the processed data needs to be easily accessible; and some common analysis tools
should be provided to the wider community. Considering all these challenges, cosmological simulations
lend themselves extremely well to demonstrating the power of “on-demand infrastructure for data analytics
and storage.”
To demonstrate our vision and to carry out a state-of-the-art simulation that combines very high spatial and
temporal solution in a large cosmological volume, we developed and executed the following representative
scenario. We carried out a large simulation at the Argonne Leadership Computing Facility (ALCF), using
the HPC systems there. The simulation evolved 30723 particles (=29 billion) in a simulation box of volume
(512h-1Mpc)3. This led to an approximate
mass resolution (mass of individual
particles) of mp=3.8*108 h-1Msun. Each
snapshot holds 1.2 TB of data, split into
256 files, the number of files being
optimized for fast data transfer. For the
initial experiment, we wrote out 500
snapshots, leading to a raw data output of
~600 TB at Level 1. Later, we continued
the simulation further and wrote out
another 250 snapshots, leading to another
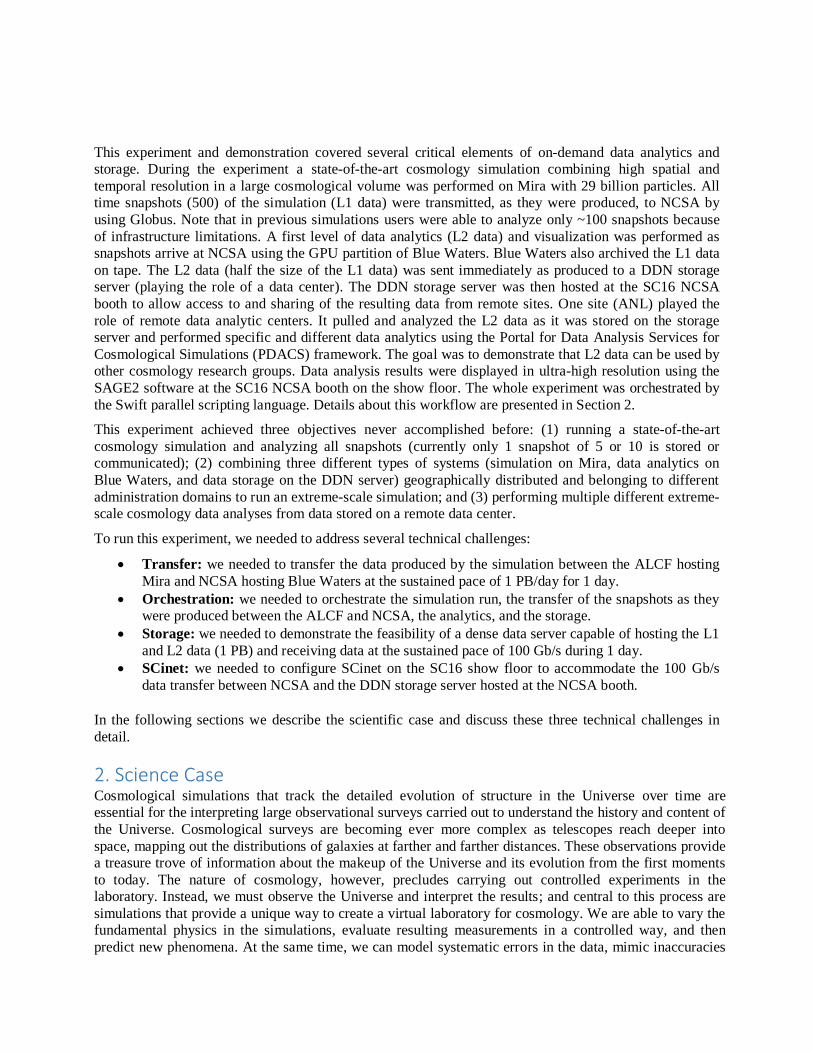
300 TB of data. An example of L1 data
from our experiment is shown in Figure 2,
a zoomed-in visualization for a late-time
snapshot, showing a very small portion of
the full simulation box. All the particles in
the region are visualized via Gaussian
splats, using the parallel visualization tool
vl3.
Next, as soon as a complete time snapshot was written out (L1 data), an automated transfer via Globus
Online was triggered on the ALCF system to NCSA’s Blue Waters. After the snapshot arrived on Blue
Figure 2: Zoomed-in visualization to a snapshot. Shown
are the particles (L1 data) late in the evolution. The visualization was carried out with vl3.
Waters, an analysis task submission was triggered. We note that the analysis tasks have to be carried out
sequentially (time step after time step): information from the previous time snapshot is captured in the
analysis in the next time snapshot in order to enable detailed tracking of the evolution of structures. The
workflow system therefore had to be carefully designed to resubmit any unsuccessful analysis job and had
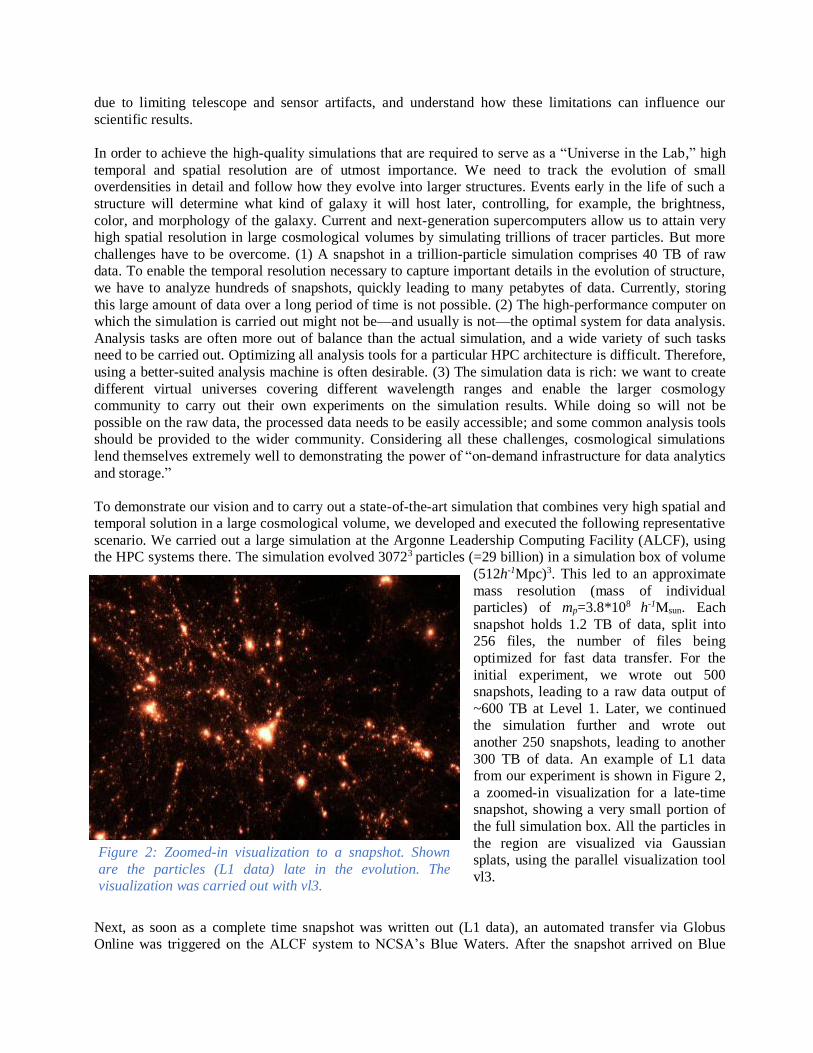
to wait for an analysis job to finish before starting the next one. Figure 3 shows a visualization of one of the
L2 data products resulting from the Blue Waters
analysis, the so-called halos.
Halos are bound structures that can be found via a
group-finding algorithm (in this case a friends-of-
friends finder). The image shows a view of the full
simulation box. Halos below a certain mass threshold
are visualized as Gaussian splats in blue; halos above
a certain mass threshold are shown as spheres,
colored with respect to their masses. As part of our
SC16 experiment we analyzed the first 500
snapshots, leading to an additional data set of ~80
TB. In our previous simulations, we were able to
analyze only ~100 snapshots. Here we wished to
analyze all snapshots to obtain very detailed time
evolution information. The L2 data was then moved
to a central storage and analysis system, in this case
residing at SC16. From there, users were able to
access, move, and analyze data via PDACS. The
portal provides back-ends for analysis at NERSC, on
local ANL clusters, and at the Oak Ridge Leadership
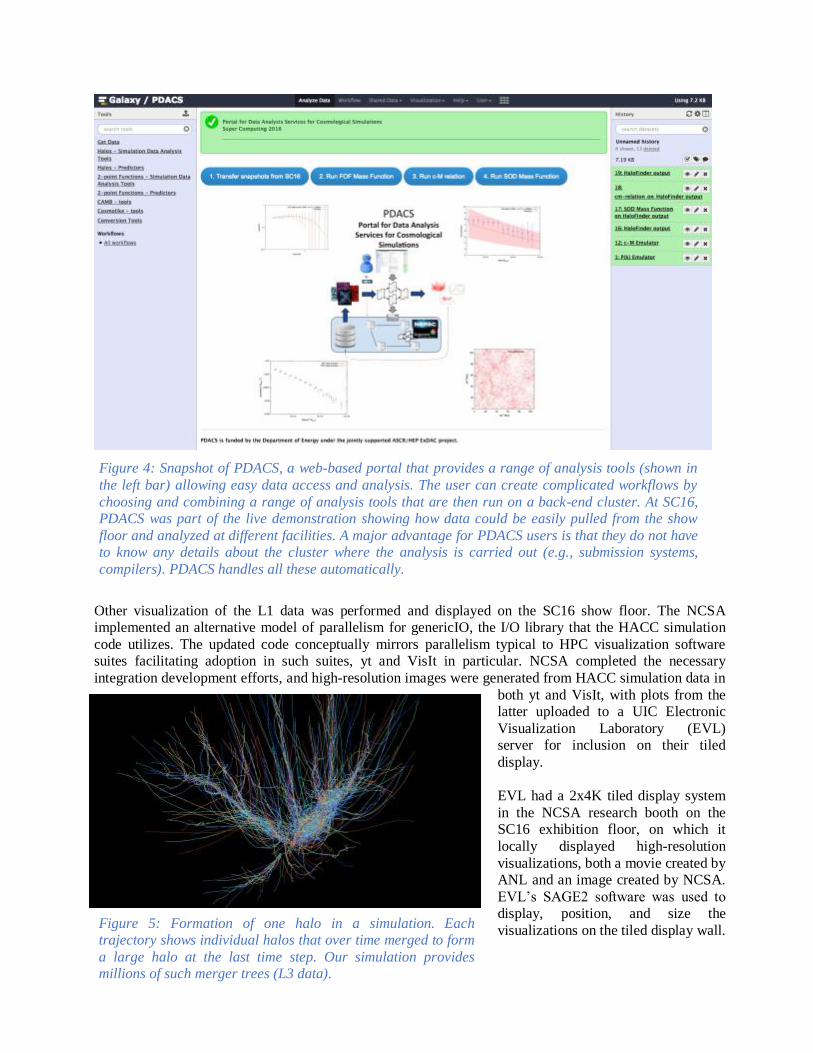
Computing Facility. Figure 4 shows a snapshot of the
PDACS web interface.
PDACS was originally based on Galaxy, a workflow system developed for biology. We adapted PDACS
for cosmological data analysis workflows. As part of our experiment, we showed how data was moved
from the storage unit on the show floor and then analyzed on a cluster at a PDACS location. The advantage
of PDACS is that the user does not need to know anything about the cluster environment where the analysis
is carried out (e.g., compilers or submission systems) and can use a large number of diverse analysis tools
readily available to carry out complex analysis workflows. These workflows will then lead to Level 3 data
products. This complex data movement and workflow scenario demonstrated how to capture the rich
science in future cosmological simulations.
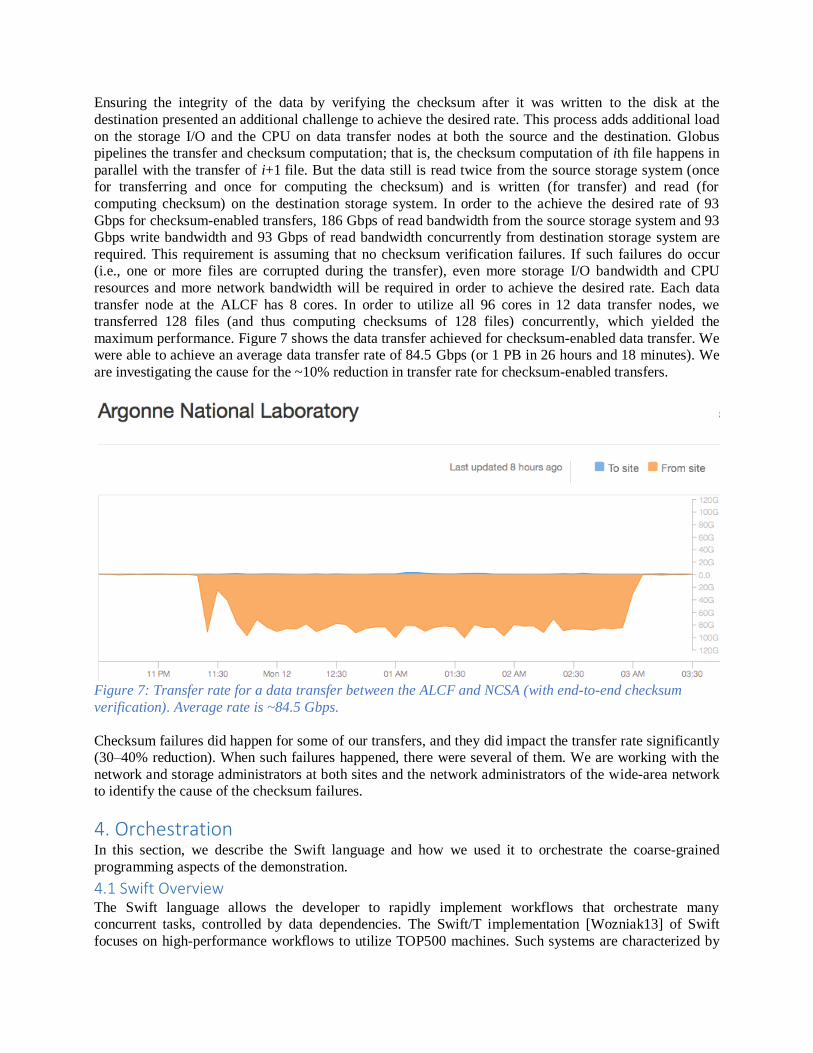
An example of a L3 data product is shown in Figure 5, a halo merger tree (this image is from an earlier
simulation, we are currently constructing the merger trees from our new simulation). For each halo in the
simulation, we have a detailed formation history and can track this history spatially and over time. The
resulting trajectories are complicated and are different for each halo. The construction of the merger trees is
an important input for semi-analytic approaches to galaxy formation modeling and will be the foundation
for galaxy catalogs used by surveys such as the Large Synoptic Survey Telescope. The merger trees also
hold a wealth of information about structure formation physics in general. Mining the data that resulted
from our experiment will be an exciting and challenging endeavor and result in many scientific papers.
Overall, this complex data movement and workflow scenario leading to different levels of data at very
different data sizes demonstrated how we can capture the rich science in future cosmological simulations.
Figure 3: Halos (L2 data) identified in a late
snapshot. Above a certain mass the halos are shown as spheres and colored by mass; below a
certain mass they are shown as blue Gaussian
splats.
Other visualization of the L1 data was performed and displayed on the SC16 show floor. The NCSA
implemented an alternative model of parallelism for genericIO, the I/O library that the HACC simulation
code utilizes. The updated code conceptually mirrors parallelism typical to HPC visualization software
suites facilitating adoption in such suites, yt and VisIt in particular. NCSA completed the necessary
integration development efforts, and high-resolution images were generated from HACC simulation data in
both yt and VisIt, with plots from the
latter uploaded to a UIC Electronic
Visualization Laboratory (EVL)
server for inclusion on their tiled
display.
EVL had a 2x4K tiled display system
in the NCSA research booth on the
SC16 exhibition floor, on which it
locally displayed high-resolution
visualizations, both a movie created by
ANL and an image created by NCSA.
EVL’s SAGE2 software was used to
display, position, and size the
visualizations on the tiled display wall. Figure 5: Formation of one halo in a simulation. Each trajectory shows individual halos that over time merged to form
a large halo at the last time step. Our simulation provides millions of such merger trees (L3 data).
Figure 4: Snapshot of PDACS, a web-based portal that provides a range of analysis tools (shown in
the left bar) allowing easy data access and analysis. The user can create complicated workflows by
choosing and combining a range of analysis tools that are then run on a back-end cluster. At SC16, PDACS was part of the live demonstration showing how data could be easily pulled from the show
floor and analyzed at different facilities. A major advantage for PDACS users is that they do not have to know any details about the cluster where the analysis is carried out (e.g., submission systems,
compilers). PDACS handles all these automatically.

3. Data Transfer At extreme scale, our scenario of cosmology simulations requires moving 1 PB of data in a day, which
requires an average rate of ~93 Gbps end to end. For the SC16 experiment, the source of the data was the
GPFS parallel file system on the Mira supercomputer at the ALCF, and the destination was the Lustre
parallel file system on the Blue Waters supercomputer at NCSA.
For moving the data we used the Globus file transfer service [Allen12]. The GridFTP protocol
specification [Allcock05] extends the File Transfer Protocol (FTP) to provide secure, reliable, and
efficient transfer of data across wide-area distributed networks. GridFTP extensions provide for the use of
multiple data movers on a cluster file system, parallelism (i.e., the use of multiple socket connections
between pairs of data movers), restart markers for fault tolerance, and control and data channel security.
Globus GridFTP [Allcock03] is an open source GridFTP implementation developed primarily at Argonne
National Laboratory and the University of Chicago. The Globus file transfer service [Allen12] implements
methods for managing the transfer of single files, sets of files, and directories, as well as rsync-like directory synchronization. It can manage security credentials, including for transfers across multiple
security domains; select transfer protocol parameters for high performance; monitor and retry transfers
when there are faults; and allow the user to monitor status.
The ALCF and NCSA have 12 and 29 nodes, respectively, dedicated for wide-area data transfer. Each of
those nodes has a GridFTP server running. We chose to use Globus to orchestrate our data transfers in
order to get automatic fault recovery and load balancing among the available GridFTP servers on both
ends. The challenge was to identify the appropriate distribution of the dataset (in terms of number of files
and file sizes) and the level of parallelism to use in order to achieve this rate on both the parallel file
systems and network in between. We performed a number of experiments to identify these parameters.
Each time step of the simulation generating 256 approximately equal-sized files turned to be the
appropriate distribution of the dataset that achieved the maximum performance. Concurrent transfer of 64
or 128 files with total TCP streams of 128 or 256 yielded the maximum transfer rate. Figure 6 shows the
data transfer achieved. We were able to achieve an average data transfer rate of 92.4 Gbps (or 1 PB in 24
hours and 3 minutes), a rate that is close to our goal. We note that this data transfer did not involve end-
to-end verification of the integrity of the data.
Figure 6: Transfer rate for a data transfer between the ALCF and NCSA (no end-to-end checksum
verification). Average rate is 92.4 Gbps.
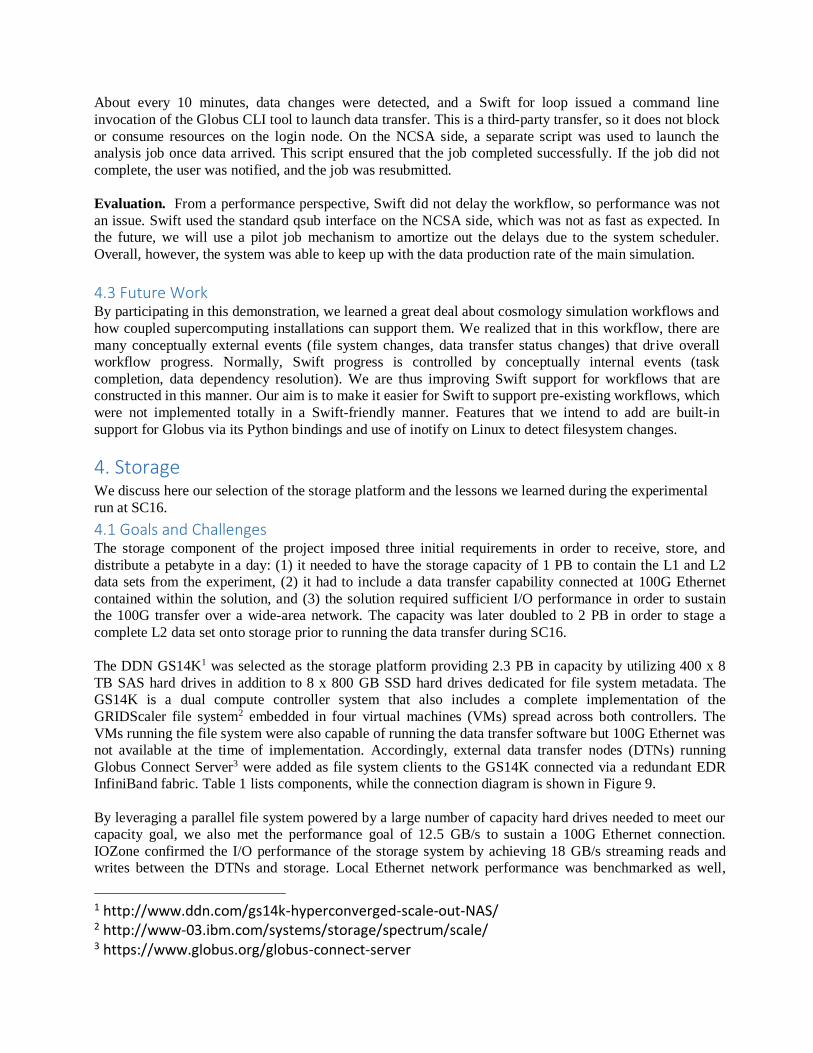
Ensuring the integrity of the data by verifying the checksum after it was written to the disk at the
destination presented an additional challenge to achieve the desired rate. This process adds additional load
on the storage I/O and the CPU on data transfer nodes at both the source and the destination. Globus
pipelines the transfer and checksum computation; that is, the checksum computation of ith file happens in
parallel with the transfer of i+1 file. But the data still is read twice from the source storage system (once
for transferring and once for computing the checksum) and is written (for transfer) and read (for
computing checksum) on the destination storage system. In order to the achieve the desired rate of 93
Gbps for checksum-enabled transfers, 186 Gbps of read bandwidth from the source storage system and 93
Gbps write bandwidth and 93 Gbps of read bandwidth concurrently from destination storage system are
required. This requirement is assuming that no checksum verification failures. If such failures do occur
(i.e., one or more files are corrupted during the transfer), even more storage I/O bandwidth and CPU
resources and more network bandwidth will be required in order to achieve the desired rate. Each data
transfer node at the ALCF has 8 cores. In order to utilize all 96 cores in 12 data transfer nodes, we
transferred 128 files (and thus computing checksums of 128 files) concurrently, which yielded the
maximum performance. Figure 7 shows the data transfer achieved for checksum-enabled data transfer. We
were able to achieve an average data transfer rate of 84.5 Gbps (or 1 PB in 26 hours and 18 minutes). We
are investigating the cause for the ~10% reduction in transfer rate for checksum-enabled transfers.
Figure 7: Transfer rate for a data transfer between the ALCF and NCSA (with end-to-end checksum
verification). Average rate is ~84.5 Gbps.
Checksum failures did happen for some of our transfers, and they did impact the transfer rate significantly
(30–40% reduction). When such failures happened, there were several of them. We are working with the
network and storage administrators at both sites and the network administrators of the wide-area network
to identify the cause of the checksum failures.
4. Orchestration In this section, we describe the Swift language and how we used it to orchestrate the coarse-grained
programming aspects of the demonstration.
4.1 Swift Overview The Swift language allows the developer to rapidly implement workflows that orchestrate many
concurrent tasks, controlled by data dependencies. The Swift/T implementation [Wozniak13] of Swift
focuses on high-performance workflows to utilize TOP500 machines. Such systems are characterized by

high concurrency (tens of thousands of processor cores or more) and low-latency networks. Swift/T can
utilize these systems well, producing over a billion tasks per second [Armstrong14]. As a workflow
language, Swift composes existing software components into an overall workflow. Such high performance
was not necessary for this demonstration; but since Swift/T can be run as a normal program on, for
example, the login nodes of ALCF and NCSA resources, we used it to orchestrate the demonstration.
The Swift language uses C-like syntax and conventional data types such as int, float, and string. It also has
typical control constructs such as if, for, and foreach. Swift code can be encapsulated into functions,
which can be called recursively. Swift can perform typical arithmetic and string-processing tasks
naturally. Swift also has a file type that allows dataflow processing on files. For this demonstration,
dataflow was used to trigger progress when log lines were added by the running simulation.
Swift is designed primarily to call into external user code, such as simulations or analysis routines
implemented in various languages. Thus Swift is a hierarchical programming model. Like many other
systems, Swift/T supports calls into the shell and has powerful syntax for expanding Swift expressions
into command lines. Launching is not efficient at large scale, however, and so Swift/T also supports calls
into native code libraries directly, as well as calls into optionally bundled interpreters for R, Python, Tcl,
and Java via the JVM scripting languages [Wozniak15]. For this demonstration, we used the command
line execution feature (specifically, a Swift app function) to launch calls to Globus transfer via the Globus
Command Line Interface client, which contacts Globus over SSH. We also used the Tcl feature to call a
short Tcl function that checked for changes in the log file.
4.2 Swift Orchestration for the SC16 Demonstration Swift was used to control the workflow presented in Figure 8.
Figure 8: Global workflow
run for the SC16 experiment.
The simulation was launched independently from Swift by the scientific user. The Swift script was started
any time after simulation start. Swift used a small Tcl function on a specific worker process to detect log
file additions and file creation. This Swift/T feature for location-aware task distribution allowed the
process to keep the same file descriptor open on the log file for efficient detection of additions. The
following code presents the Swift script used for the SC16 experiment.
ROOT = l ocati onFr omRank( 0); // The pr ocess t hat wi ll f oll ow t he l og fil e
// Loop until t he l og fil e t oken i ndi cat es compl eti on
f or (i nt i = 0, bool ean b = tr ue; i < I NT_ MAX() && b; i = i + 1, b = c) {
stri ng s; bool ean c;
(s, c) = @l ocati on=ROOT pol l (t ailfil e); // Poll t he l og file on r ank ROOT
stri ng t okens[] = split(s, " "); // Spl it stri ng i nt o words
// Di d we fil e a new fil e? If so, tr ansf er it!
if (t okens[ 0] == " XFER") { xf er(t okens[ 1]); }
}
About every 10 minutes, data changes were detected, and a Swift for loop issued a command line
invocation of the Globus CLI tool to launch data transfer. This is a third-party transfer, so it does not block
or consume resources on the login node. On the NCSA side, a separate script was used to launch the
analysis job once data arrived. This script ensured that the job completed successfully. If the job did not
complete, the user was notified, and the job was resubmitted.
Evaluation. From a performance perspective, Swift did not delay the workflow, so performance was not
an issue. Swift used the standard qsub interface on the NCSA side, which was not as fast as expected. In
the future, we will use a pilot job mechanism to amortize out the delays due to the system scheduler.
Overall, however, the system was able to keep up with the data production rate of the main simulation.
4.3 Future Work By participating in this demonstration, we learned a great deal about cosmology simulation workflows and
how coupled supercomputing installations can support them. We realized that in this workflow, there are
many conceptually external events (file system changes, data transfer status changes) that drive overall
workflow progress. Normally, Swift progress is controlled by conceptually internal events (task
completion, data dependency resolution). We are thus improving Swift support for workflows that are
constructed in this manner. Our aim is to make it easier for Swift to support pre-existing workflows, which
were not implemented totally in a Swift-friendly manner. Features that we intend to add are built-in
support for Globus via its Python bindings and use of inotify on Linux to detect filesystem changes.
4. Storage
We discuss here our selection of the storage platform and the lessons we learned during the experimental
run at SC16.
4.1 Goals and Challenges The storage component of the project imposed three initial requirements in order to receive, store, and
distribute a petabyte in a day: (1) it needed to have the storage capacity of 1 PB to contain the L1 and L2
data sets from the experiment, (2) it had to include a data transfer capability connected at 100G Ethernet
contained within the solution, and (3) the solution required sufficient I/O performance in order to sustain
the 100G transfer over a wide-area network. The capacity was later doubled to 2 PB in order to stage a
complete L2 data set onto storage prior to running the data transfer during SC16.
The DDN GS14K1 was selected as the storage platform providing 2.3 PB in capacity by utilizing 400 x 8
TB SAS hard drives in addition to 8 x 800 GB SSD hard drives dedicated for file system metadata. The
GS14K is a dual compute controller system that also includes a complete implementation of the
GRIDScaler file system2 embedded in four virtual machines (VMs) spread across both controllers. The
VMs running the file system were also capable of running the data transfer software but 100G Ethernet was
not available at the time of implementation. Accordingly, external data transfer nodes (DTNs) running
Globus Connect Server3 were added as file system clients to the GS14K connected via a redundant EDR InfiniBand fabric. Table 1 lists components, while the connection diagram is shown in Figure 9.
By leveraging a parallel file system powered by a large number of capacity hard drives needed to meet our
capacity goal, we also met the performance goal of 12.5 GB/s to sustain a 100G Ethernet connection.
IOZone confirmed the I/O performance of the storage system by achieving 18 GB/s streaming reads and
writes between the DTNs and storage. Local Ethernet network performance was benchmarked as well,
1 http://www.ddn.com/gs14k-hyperconverged-scale-out-NAS/ 2 http://www-03.ibm.com/systems/storage/spectrum/scale/ 3 https://www.globus.org/globus-connect-server
achieving 99 Gbps with iperf2 between DTNs across the Arista switch. All DTN TCP tuning was taken
from ESNet.4
Table 1: List of components used for the storage server.
Role Technology Description
Storage DDN GS14K 2 x dual socket compute controllers
4 VMs
8 x EDR IB networking
400 x 8 TB SAS hard drives with 20 spares
8 x 800 GB SSD’s with 2 spares
GRIDScaler 3.2.2 file system (IBM Spectrum Scale 4.2.0.2)
Data
transfer
nodes
Dell r630 Dual 3.2 GHz Intel E5-2667v3 CPUs
128 GB memory
2 x Mellanox dual port ConnectX-4 VPI, MOFED 3.2-2
RHEL6 OS
Globus Connect Server 4.0.41
InfiniBand
switch
Mellanox 7700 Managed, 36 x QSFP port, EDR IB
Ethernet
switch
Arista 7280QR-C36 36 x QSFP port, 24 x 40GbE and 12 x 100GbE
4.2 Lessons Learned and Recommendations The storage system performed well during a live data transfer to SC16 when GridFTP checksums were
disabled. The observed GS14K performance was 12.3 GB/s writes and approximately 98 Gbps total
network utilization. However, when the GridFTP transfer was restarted with checksums enable, the GS14K
performance was 11.75 GB/s writes and 7.956 GB/s reads, with an average data transfer rate of
approximately 84 Gbps. A greater drop in performance was observed with a checksum-enabled data
transfer between the Mira supercomputer at ANL and Blue Waters at NCSA.
We recommend that DTNs contain their own dedicated storage so that compute workloads and data
transfer workloads do not compete as the desired transfer rates increase. Additionally, adding a high-
performance SSD tier for initial data landing will address the subsequent reads that occur when GridFTP
checksums are enabled.
4 https://fasterdata.es.net/host-tuning/linux/

Figure 9: Connection diagram between Blue Waters at NCSA and the DDN storage server at
SC16.
6. Making the On-Demand Data Analytic and Storage Concept a Reality The SC16 experiment stressed the simulation, communication, storage, and analysis infrastructure, and the
orchestration and streaming software of the on-demand data analytics and storage concept. Several key
elements of the concept will remain to be tested, including the software for resource virtualization,
deployment, group management, and policy management. In particular, the software stack run by users
was static in the SC16 experiment. In a more complete implementation, software will be deployed as the
virtual infrastructure is instantiated.
7. Outcome of the Birds of a Feather Session and the Experiment The session was attended by about 40 participants. Speakers responsible for the different activities of the
experiment presented the challenges they had to address and the recommendations for the community.
Questions were asked about details of the experiment, in particular how the proposed infrastructure related
to virtualized environment used in cloud computing. Questions also were raised about the file transfers.
This experiment was a pilot to evaluate the feasibility of using SCinet for scientific purposes as part of a
nonpermanent infrastructure for simulation, storage, and analytics. We demonstrated that SCinet can be
used to analyze results that cannot be produced in existing permanent infrastructures.
An important outcome of the BoF and the experiment is the desire of the SC17 general chair to leverage
this pilot experiment and develop an SC activity focused on using SCinet for a broad range of scientific
experiments. The participants of the SC16 “On-Demand Infrastructure for Data Analytics and Storage”
experiment are committed to help establish this new activity and will help science teams willing to use
SCinet during SC17 for their experiments.
References [Allcock03] W. Allcock. GridFTP: Protocol extensions to FTP for the grid, 2003.
[Allcock05] W. Allcock et al. The Globus striped GridFTP framework and server, in Proceedings of
ACM/IEE SC 2005, p. 54.
[Allen12] B. Allen et al. Software as a service for data scientists. Commun. of the ACM, 55(2) 81-88,
2012.
[Armstrong14] T. G. Armstrong, J. M. Wozniak, M. Wilde and I. T. Foster, Compiler techniques for
massively scalable implicit task parallelism, in Proceedings of ACM/IEE SC 2014, pp. 209-310. [Wozniak13] J. M. Wozniak, T. G. Armstrong, M. Wilde, D. S. Katz, E. Lusk, and I. T. Foster, Swift/T:
Scalable data flow programming for distributed-memory task-parallel applications, in Proceedings of
IEEE CCGrid 2013. [Wozniak15] J. M. Wozniak, T. G. Armstrong, and K. C. Maheshwari, D. S. Katz, M. Wilde, and I. T.
Foster, Interlanguage parallel scripting for distributed-memory scientific computing, in Proceedings of the
10th Workshop in Support of Large-Scale Science, WORKS '15.