Savings Capacity of the Vulnerable Groups
4
Savings capacity of the vulnerable groups One of the indicators of economic buoyancy is the savings capacities of the vulne rable groups . The analyses of the vulnerabl e groups abili ty to sav e are made for the period of before and after micro credit use and the result portrayed by figure 5:10. FIGURE 5:10, SAVINGS CAPACITIES 0 10 20 30 40 50 60 70 80 90 79.27 0 81.71 77.44 12.19 24.39 13.41 12.19 8.54 34.15 4.88 9.15 0 26.83 0 1.22 0 14.43 0 0 PERCENTAGE SAVINGS CAPACITY (=N= 000) None (0) 1 to 50 51 to 100 101 to 150 151 to > 200 Source: Data analyses 2013 Figure 5:10 shows that the pattern of borrowers saving capacities after micro loans use is diff erent from the other three categori es. The borrowers savings capacity after using the micro loans have all gone above the amount of =N=25,000.00 and
Transcript of Savings Capacity of the Vulnerable Groups

7/29/2019 Savings Capacity of the Vulnerable Groups
http://slidepdf.com/reader/full/savings-capacity-of-the-vulnerable-groups 1/4
Savings capacity of the vulnerable groups
One of the indicators of economic buoyancy is the savings capacities of the
vulnerable groups. The analyses of the vulnerable groups ability to save are made
for the period of before and after micro credit use and the result portrayed by
figure 5:10.
FIGURE 5:10, SAVINGS CAPACITIES
0
10
20
30
40
50
60
70
80
9079.27
0
81.71
77.44
12.1924.39
13.41
12.19
8.54
34.15
4.889.15
0
26.83
0
1.22
014.43
0
0
PERCENTAGE SAVINGS CAPACITY (=N= 000)
None (0)
1 to 50
51 to 100
101 to 150
151 to > 200
Source: Data analyses 2013
Figure 5:10 shows that the pattern of borrowers saving capacities after micro loans
use is different from the other three categories. The borrowers savings capacity
after using the micro loans have all gone above the amount of =N=25,000.00 and

7/29/2019 Savings Capacity of the Vulnerable Groups
http://slidepdf.com/reader/full/savings-capacity-of-the-vulnerable-groups 2/4
moved to fall within =N=26,000.00 to =N=201,000.00. Whereas, the borrowers
before, the non-borrowers before and the non-borrowers after portray similar trend
of savings capacity where savings capacities within the low range of =N=1,000.00
to =N=25,000.00 remind very high and higher amount savings of =N=51,000.00
to =N=100,000.00 has gone low. Among these three groups savings from
=N=101,000.00 and above all remained zero.
5.10. Side Effects of Micro Credit scheme analyses
Side effects of the NACRDB micro credit scheme in Borno State were assessed on
both the beneficiary and non-beneficiary vulnerable groups. The data obtained are
analyzed by figure 5:11.
FIGURE 5:11. SIDE EFFECTS OF MICRO CREDIT

7/29/2019 Savings Capacity of the Vulnerable Groups
http://slidepdf.com/reader/full/savings-capacity-of-the-vulnerable-groups 3/4
14.41
6.69
5.5 5.675.99
13.51
7.86
13.22
4.56
5.96
16.64
0
2
4
6
8
10
12
14
16
18
SIDE EFFECTS OF MICRO CREDIT %
Figure 5:11 shows that over-proud by the micro loan borrowers have been the
greatest side effects of micro credit impacts. This is followed by too dependence
on the micro loan as a development variable. Increased land dispute, corruption
and bribery are also significant side effects. The other side effects are moderately
adverse, while rubbery cases take the least side effect but the most dangerous
among all.
5.11. Free Comments on Micro Credit Scheme Analysis
7/29/2019 Savings Capacity of the Vulnerable Groups
http://slidepdf.com/reader/full/savings-capacity-of-the-vulnerable-groups 4/4
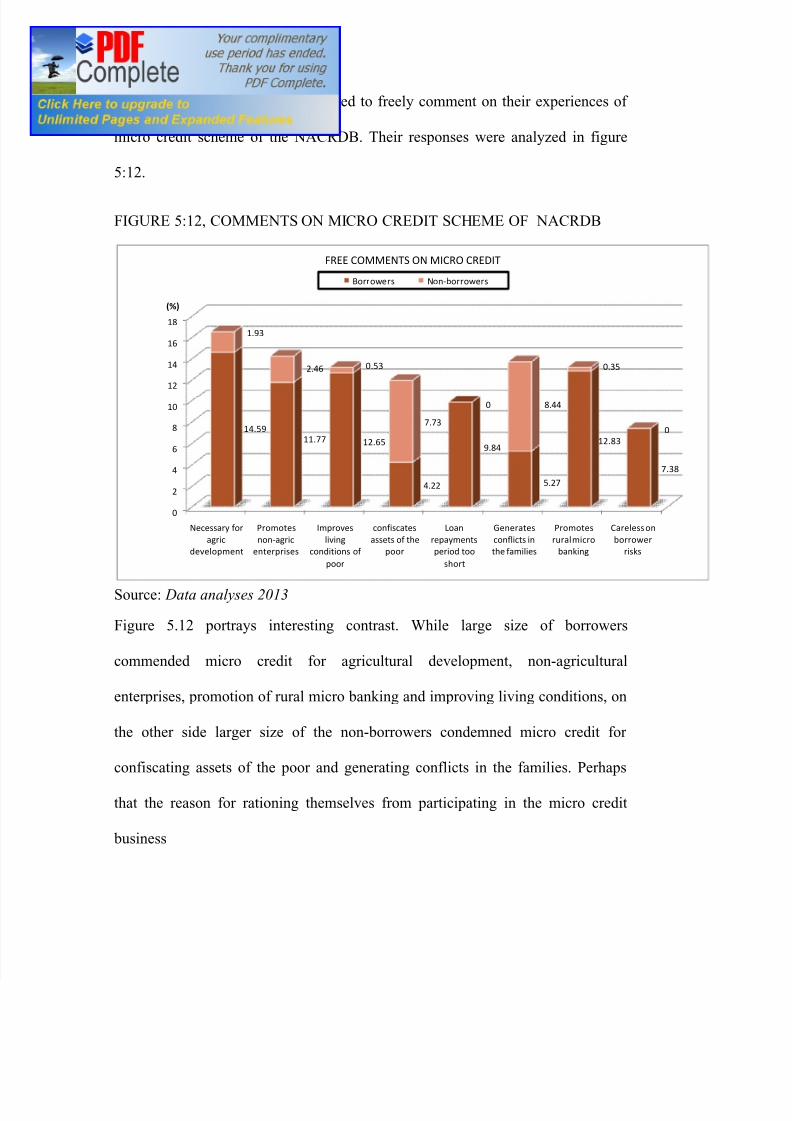
The vulnerable groups were requested to freely comment on their experiences of
micro credit scheme of the NACRDB. Their responses were analyzed in figure
5:12.
FIGURE 5:12, COMMENTS ON MICRO CREDIT SCHEME OF NACRDB
0
2
4
6
8
10
12
14
16
18
Necessary for
agric
development
Promotes
non-agric
enterprises
Improves
living
conditions of
poor
confiscates
assets of the
poor
Loan
repayments
period too
short
Generates
conflicts in
the families
Promotes
rural micro
banking
Careless on
borrower
risks
14.59
11.77 12.65
4.22
9.84
5.27
12.83
7.38
1.93
2.46 0.53
7.73
0 8.44
0.35
0
(%)
FREE COMMENTS ON MICRO CREDIT
Borrowers Non-borrowers
Source: Data analyses 2013
Figure 5.12 portrays interesting contrast. While large size of borrowers
commended micro credit for agricultural development, non-agricultural
enterprises, promotion of rural micro banking and improving living conditions, on
the other side larger size of the non-borrowers condemned micro credit for
confiscating assets of the poor and generating conflicts in the families. Perhaps
that the reason for rationing themselves from participating in the micro credit
business