Saurashtra Universityetheses.saurashtrauniversity.edu/519/1/mer_pk_thesis... · 2012-06-02 ·...
164
Saurashtra University Re – Accredited Grade ‘B’ by NAAC (CGPA 2.93) Mer, Pankaj K., 2010, “Synthesis and Physico-Chemical Investigation of some Thermosets and Their Composites”, thesis PhD, Saurashtra University http://etheses.saurashtrauniversity.edu/id/eprint/519 Copyright and moral rights for this thesis are retained by the author A copy can be downloaded for personal non-commercial research or study, without prior permission or charge. This thesis cannot be reproduced or quoted extensively from without first obtaining permission in writing from the Author. The content must not be changed in any way or sold commercially in any format or medium without the formal permission of the Author When referring to this work, full bibliographic details including the author, title, awarding institution and date of the thesis must be given. Saurashtra University Theses Service http://etheses.saurashtrauniversity.edu [email protected] © The Author
Transcript of Saurashtra Universityetheses.saurashtrauniversity.edu/519/1/mer_pk_thesis... · 2012-06-02 ·...
Saurashtra University Re – Accredited Grade ‘B’ by NAAC (CGPA 2.93)
Mer, Pankaj K., 2010, “Synthesis and Physico-Chemical Investigation of some
Thermosets and Their Composites”, thesis PhD, Saurashtra University
http://etheses.saurashtrauniversity.edu/id/eprint/519 Copyright and moral rights for this thesis are retained by the author A copy can be downloaded for personal non-commercial research or study, without prior permission or charge. This thesis cannot be reproduced or quoted extensively from without first obtaining permission in writing from the Author. The content must not be changed in any way or sold commercially in any format or medium without the formal permission of the Author When referring to this work, full bibliographic details including the author, title, awarding institution and date of the thesis must be given.
Saurashtra University Theses Service http://etheses.saurashtrauniversity.edu
© The Author
SYNTHESIS AND PHYSICO-CHEMICAL
INVESTIGATION OF SOME THERMOSETS AND
THEIR COMPOSITES
A
THESIS
SUBMITTED TO THE SAURASHTRA UNIVERSITY
FOR
THE DEGREE OF
DOCTOR OF PHILOSOPHY
IN
THE FACULTY OF SCIENCE (CHEMISTRY)
BY
Pankaj K. Mer
UNDER THE GUIDANCE
OF
Dr. P. H. PARSANIA
DEPARTMENT OF CHEMISTRY
SAURASHTRA UNIVERSITY
RAJKOT- 360 005
INDIA
APRIL-2010
Gram: UNIVERSITY Phone: (R) 2581097
Fax: 0281-2577633 (O) 2578512
SAURASHTRA UNIVERSITY
Dr. P. H. PARSANIA Residence
M.Sc., Ph.D. “Maulik”
Professor & Head 20-A/1, University
Department of Chemistry Karmachari Co. Hsg. Society
University Road,
Rajkot – 360 005
Gujarat – (INDIA)
Statement under O. Ph. D. 7 of Saurashtra University
The work included in the thesis is my own work under the supervision of
Dr. P. H. Parsania and leads to some contribution in Chemistry subsidized by a
number of references.
Date: -04-2010 (Mr. Pankaj K. Mer)
Place: Rajkot.
This is to certify that the present work submitted for the Ph. D. Degree of
Saurashtra University by Mr. Pankaj K. Mer is his own work and leads to
advancement in the knowledge of Chemistry. The thesis has been prepared under my
supervision.
Date : -04-2010 Dr. P. H. PARSANIA
Place : Rajkot Professor & Head
Department of Chemistry,
Saurashtra University
Rajkot - 360 005


ACKNOWLEDGEMENTS
First and foremost, I would like to pay my homage to THE ALMIGHTY
GOD “THE WONDERFUL CHEMIST” of this lovely world, whose blessings
have made this venture successful. By His grace I am lucky enough to find a real
mentor and philosopher Dr. P. H. Parsania - Professor and Head, Department of
Chemistry, Saurashtra University, Rajkot. It is my immense pleasure and privilege
to express my profound gratitudes to him for his never ending guidance and
perseverance. His keen interest, patience and constant encouragement during my
research work have enabled me to put my work in the form of the thesis. Association
with him has been a life time achievement for me.
I also thankful to all faculty members: Dr. A. K. Shah, Dr. V. H. Shah, Dr.
H. S. Joshi, Dr. S. Baluja, Dr. M. K. Shah, Dr. Y. T. Naliapara, Dr. U. C. Bhoya,
Dr. R. C. Khunt, Dr. F. D. Karia and administrative staff for their encouragement
during my research work.
I would like to extend my sincere thanks to my seniors as well as juniors -
Dr. Niral, Dr. Sunil, Dr. Paresh, Dr. Vrajesh, Dr. Viren, Bharat, Sandip, Jignesh,
Punit, Urvishbhai, Suresh, Pooja, Leena, Ritesh, Rizwan, Satish and Vishal for
their help and cooperation.
A special appreciation is extended to Mr. M. J. Meghpara for his
enthusiasm, devotion to task assigned and patience, while tracing figures.
I am also indebted to The Directors, Indian Institute of Science-Bangalore,
ERDA-Vadodara and SICART- V. V. Nagar for instrumental facilities.
I express my deepest thanks to Mrs. Vijyaben, Jignesh and Maulik Parsania
for the hospitality extended to me during prolonged research discussion at their home
during this work.
The never ending process of unsurpassable devotion, love and affection,
which was showered upon me by my father Kishorbhai, mother Jayshreeben,
brothers, sister in law, who have enlightened my path and always boosted me to go
ahead to reach the goal.
Pankaj K. Mer
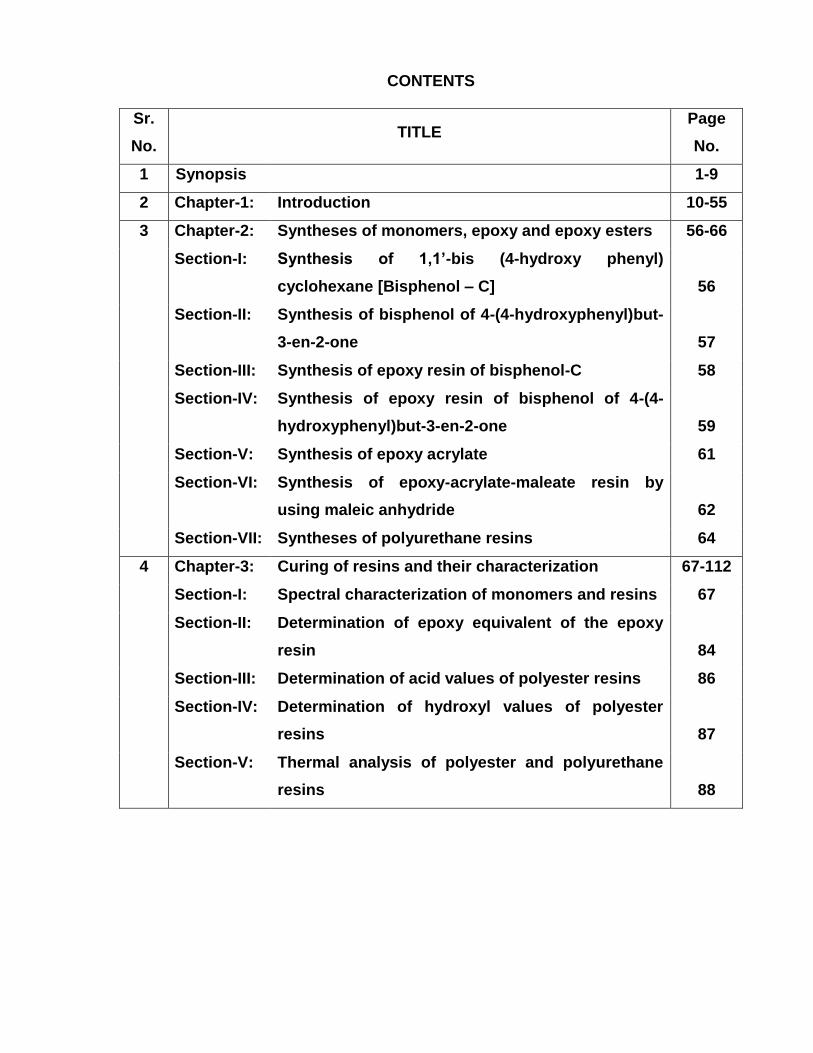
CONTENTS
Sr.
No. TITLE
Page
No.
1 Synopsis 1-9
2 Chapter-1: Introduction 10-55
3 Chapter-2: Syntheses of monomers, epoxy and epoxy esters 56-66
Section-I: Synthesis of 1,1’-bis (4-hydroxy phenyl)
cyclohexane [Bisphenol – C]
56
Section-II: Synthesis of bisphenol of 4-(4-hydroxyphenyl)but-
3-en-2-one
57
Section-III: Synthesis of epoxy resin of bisphenol-C 58
Section-IV: Synthesis of epoxy resin of bisphenol of 4-(4-
hydroxyphenyl)but-3-en-2-one
59
Section-V: Synthesis of epoxy acrylate 61
Section-VI: Synthesis of epoxy-acrylate-maleate resin by
using maleic anhydride
62
Section-VII: Syntheses of polyurethane resins 64
4 Chapter-3: Curing of resins and their characterization 67-112
Section-I: Spectral characterization of monomers and resins 67
Section-II: Determination of epoxy equivalent of the epoxy
resin
84
Section-III: Determination of acid values of polyester resins 86
Section-IV: Determination of hydroxyl values of polyester
resins
87
Section-V: Thermal analysis of polyester and polyurethane
resins
88
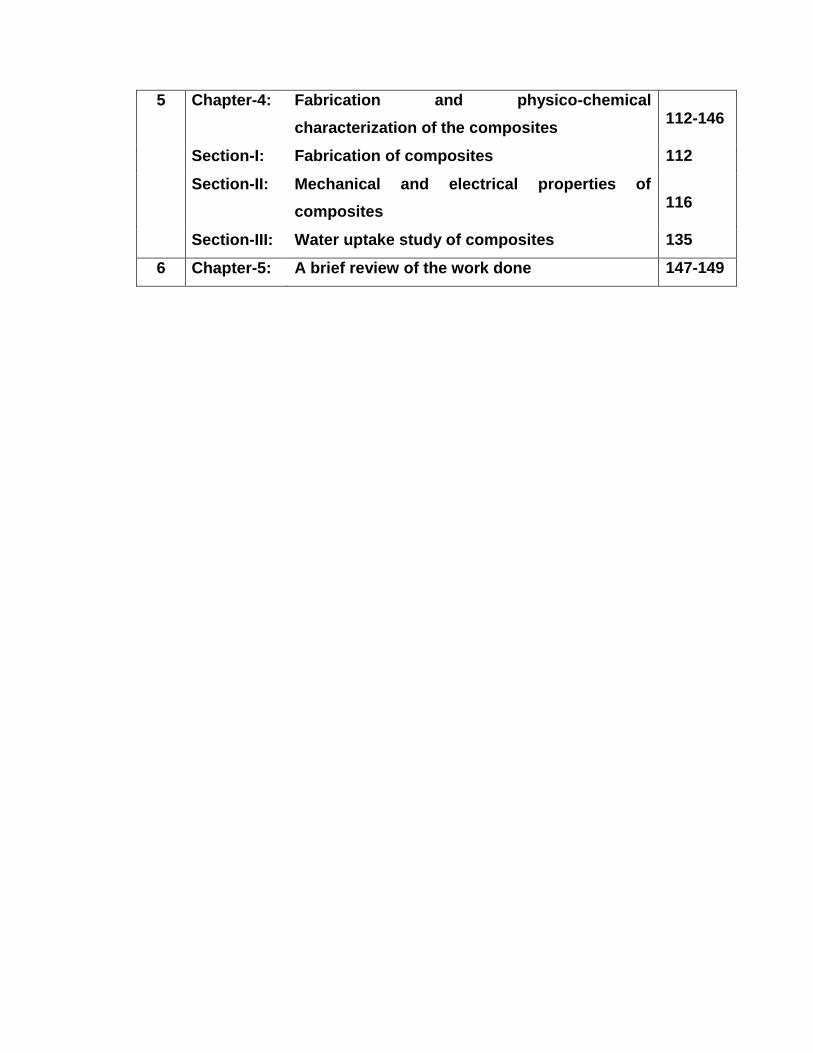
5 Chapter-4: Fabrication and physico-chemical
characterization of the composites
112-146
Section-I: Fabrication of composites 112
Section-II: Mechanical and electrical properties of
composites
116
Section-III: Water uptake study of composites 135
6 Chapter-5: A brief review of the work done 147-149
SYNOPSIS
SYNTHESIS AND PHYSICO-CHEMICAL INVESTIGATION OF SOME THERMOSETS
AND THEIR COMPOSITES
Mr. Pankaj K. Mer
DEPARTMENT OF CHEMISTRY,
SAURASHTRA UNIVERSITY, RAJKOT- 360 005
SYNOPSIS OF THE THESIS TO BE SUBMITTED TO
SAURASHTRA UNIVERSITY FOR THE DEGREE OF
DOCTOR OF PHILOSOPHY IN CHEMISTRY
FACULTY : SCIENCE
SUBJECT : CHEMISTRY
TITLE OF THE THESIS : SYNTHESIS AND PHYSICO-
CHEMICAL
INVESTIGATION OF SOME
THERMOSETS AND THEIR
COMPOSITES
NAME OF THE CANDIDATE : MER PANKAJ KISHORBHAI
REGISTRATION NO. : 3562
DATE OF REGISTRATION : 28th Feb. 2007 NAME OF THE GUIDE : Dr. P. H. PARSANIA
PROF. & HEAD
DEPARTMENT OF CHEMISTRY
SAURASHTRA UNIVERSITY
RAJKOT – 360 005
SUBMMITED TO : SAURASHTRA UNIVERSITY
PLACE OF THE WORK DEPARTMENT OF CHEMISTRY,
SAURASHTRA UNIVERSITY,
RAJKOT-360 005,
GUJRAT-INDIA
SSyynnooppssiiss… 1
GENERAL INTRODUCTION
The use of renewable starting materials in the preparation of polymers has
been stimulated over the years by researchers and governmental agencies all
over the world as a result of the real need to replace products of petrochemicals
origins. The use of renewable resources in the production of value added
polymers for various applications [1,2] is now a days an unquestionable reality
that aims to minimize the depletion of the ozone layer and green house effect
provoked by the improper use of fossil starting materials [3].
Vinyl ester (VE) resins are well-known for their outstanding corrosion
resistance and satisfy a critical requirement in fiber reinforced plastic
applications. VE resins are brittle in nature and therefore, toughening properties
is essential for both scientific and engineering purposes. Several techniques
have been developed to improve the toughness of VE resins including (1)
modifications of network structure via manipulation of VE molecular weight and
styrene content, (2) use of reactive and nonreactive rubber modifiers designed
for phase separation upon cure, and (3) use of nanostructured thermoplastic fiber
mats for interlaminar toughening [4].
Vinyl ester resins are thermosetting resins [5] that consist of a polymer
backbone (usually epoxy resins) with an acrylate or methacrylate termination.
The combination of excellent chemical resistance and mechanical properties [6,
7] of epoxies and handling properties comparable to those of unsaturated
1. Jeevananda, T. and Siddaramaiah, “Synthesis and characterization of
polyaniline filled PU/PMMA interpenetrating polymer networks.” Eur.
Polym. J. 39,569, 2003.
2. Kendagannaswamy, B. K., and Siddaramaiah, “Chain extended
polyurethane-synthesis and characterization.” J Appl. Polym. Sci. 84, 359,
2002.
3. Gandini, A, Comprehensive Polym. Sci., Suppl.1, 1992.
4. Robinette, E. J.; Ziaee, S. and Palmese, G. in International SAMPE
Symposium and Exhibition (Proceedings) 47(II), 1339, 2002
5. Launikitis, M. B. Vinyl ester resins. In Hand Book of Composities; Lubin,
G., Ed.; Van Nostran Reinhold Company: New York, 38–49 1982.

SSyynnooppssiiss… 2
polyesters has made them a viable product for various industrial applications
such as coatings, varnishes, radiation curable inks, laser video discs, spherical
lens materials and specialty coatings for optical fibers, printed circuit boards,
composites, etc. [8–14].
6. Poland, D. E.; Martineau, R. R. FRP in the bottle against acid rain, part-3.
Epoxy based vinyl ester resins as materials of construction. Mater. Process.
Tech. Environ. Prot. Min. Metall. Proc. Ibnt. Symp. 1993; Godbehev, P. W.,
Eds.; Chem. Abstr. 181350z, 15–163, 121, 1993.
7. Peng, L.; Xiaoping, Y.; Yunhua, Y.; Dingshing, Y. Cure kinetics,
microheterogeneity, and mechanical properties of the high temperature cure
of vinyl ester resins. J. Appl. Polym. Sci., 92 (2), 1124–1133, 2004.
8. Amendola, E.; Giamberini, M.; Carfagna, C.; Ambrogi, V. Self-toughening
liquid crystalline vinyl ester adhesives. Macromole. Symp., 180 (1), 153–168,
2002.
9. Yamada, K.; Yamane, H.; Kumada, K.; Tanabe, S.; Kajiyama, T. Plasma-
graft polymerization of a monomer with double bonds onto the surface of
carbon fiber and its adhesion to a vinyl ester resin. J. Appl. Polym. Sci., 90
(9), 2415–2419, 2003.
10. Howell, B. F.; De Realf, Pigmented coatings cured with visible light. Polym.
Mater Sci. & Engg., 74, 387–388, 1996.
11. Masujiro, S.; and Kazuyoshi, I. Thermosetting Printing Inks. JP 74, 67, 709.
esterification of monoepoxies 327, July 01, 1974.
12. Macinally, A.; and Miller, A. The Use of epoxy VER system in the marine,
offshore, chemical and construction industries. Proc. Int. Conf. Fiber Reinf.
Compos. 7th 1998.
13. Henne, M.; Breyer, C.; Niedermeier, M.; and Ermanni, P.A. New kinetic and
viscosity model for liquid composite molding simulations in an industrial
environment. Polym. Comp., 25 (3), 255–269, 2004.
14. da-Silva, A.L.; Teixcira, S.C.S.; Widal, A.C.C.; Coutinho, F.M.B. Mechanical
properties of polymer composites based on commercial epoxy vinyl ester
resin and glass fiber. Polym. Test., 20 (8), 895–899, 2001.
SSyynnooppssiiss… 3
HO OH
BC
The work to be incorporated in the thesis is divided into five chapters:
CHAPTER-1: Introduction
CHAPTER-2: Syntheses of monomers, epoxy and epoxy esters
CHAPTER-3: Curing of resins and their characterization
CHAPTER-4: Fabrication and physico-chemical characterization of
the composites
CHAPTER-5: A comprehensive summary of the work done
CHAPTER-1: Introduction
This chapter of the thesis describes the up to date literature survey on
synthesis, applications and characterization of epoxy resins, epoxy esters
(polyester polyols), vinyl ester resins and their composites in various fields of
science.
CHAPTER-2: Syntheses of monomers, epoxy and epoxy esters
This chapter is further subdivided into six sections:
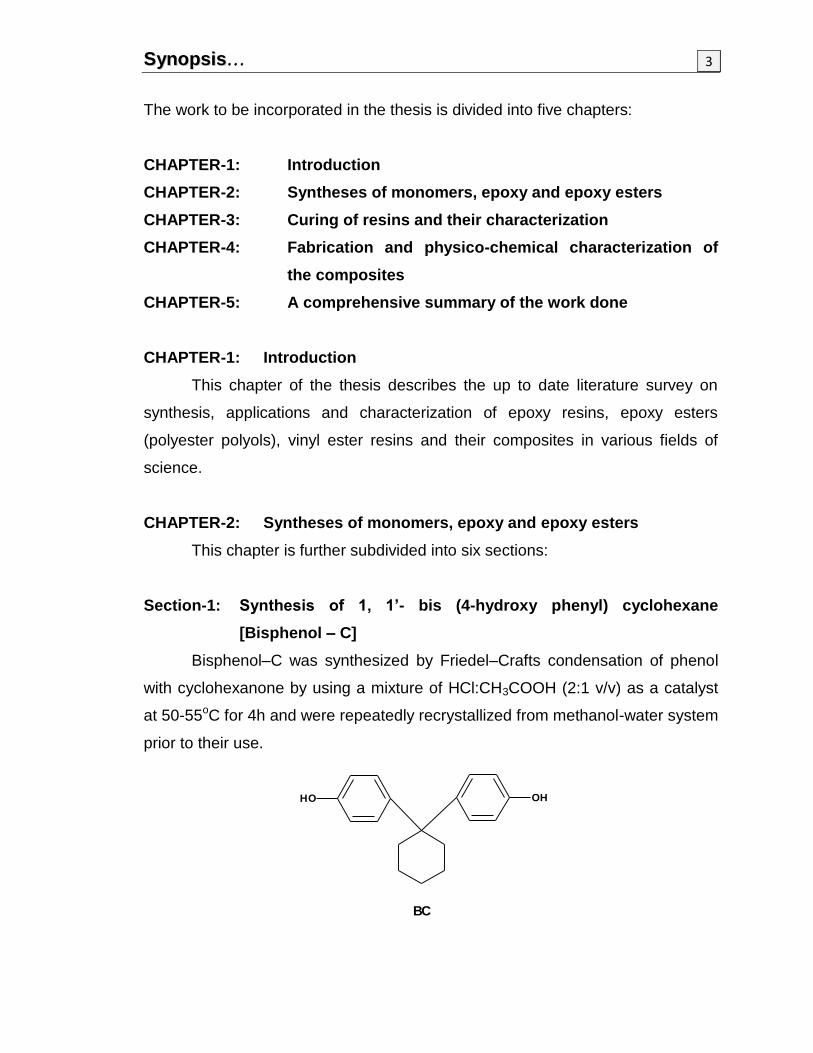
Section-1: Synthesis of 1, 1’- bis (4-hydroxy phenyl) cyclohexane
[Bisphenol – C]
Bisphenol–C was synthesized by Friedel–Crafts condensation of phenol
with cyclohexanone by using a mixture of HCl:CH3COOH (2:1 v/v) as a catalyst
at 50-55oC for 4h and were repeatedly recrystallized from methanol-water system
prior to their use.
SSyynnooppssiiss… 4
OH C OH
CH3
CH
CH
OH
BCN
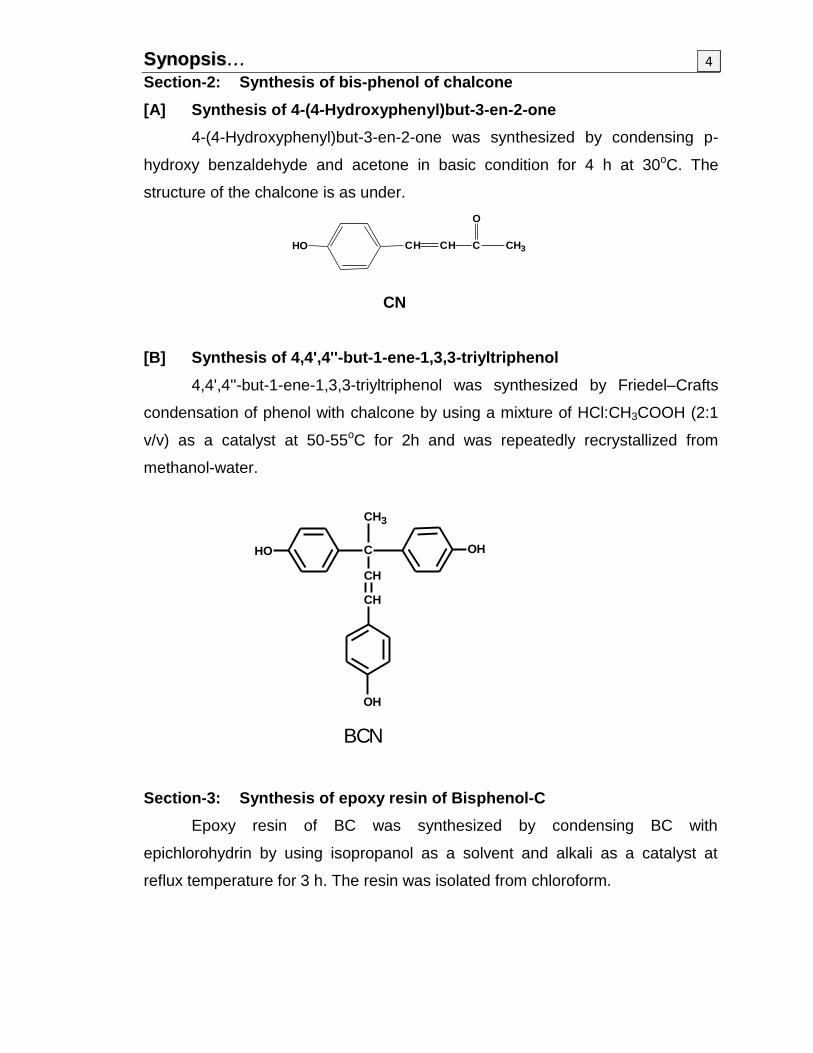
Section-2: Synthesis of bis-phenol of chalcone
[A] Synthesis of 4-(4-Hydroxyphenyl)but-3-en-2-one
4-(4-Hydroxyphenyl)but-3-en-2-one was synthesized by condensing p-
hydroxy benzaldehyde and acetone in basic condition for 4 h at 30oC. The
structure of the chalcone is as under.
CN
[B] Synthesis of 4,4',4''-but-1-ene-1,3,3-triyltriphenol
4,4',4''-but-1-ene-1,3,3-triyltriphenol was synthesized by Friedel–Crafts
condensation of phenol with chalcone by using a mixture of HCl:CH3COOH (2:1
v/v) as a catalyst at 50-55oC for 2h and was repeatedly recrystallized from
methanol-water.
Section-3: Synthesis of epoxy resin of Bisphenol-C
Epoxy resin of BC was synthesized by condensing BC with
epichlorohydrin by using isopropanol as a solvent and alkali as a catalyst at
reflux temperature for 3 h. The resin was isolated from chloroform.
OH CH CH C CH3
O
SSyynnooppssiiss… 5
H2C CH CH2O O
n
O O CH2 CH CH2
HO
O CH2O CH2CH
EBCA
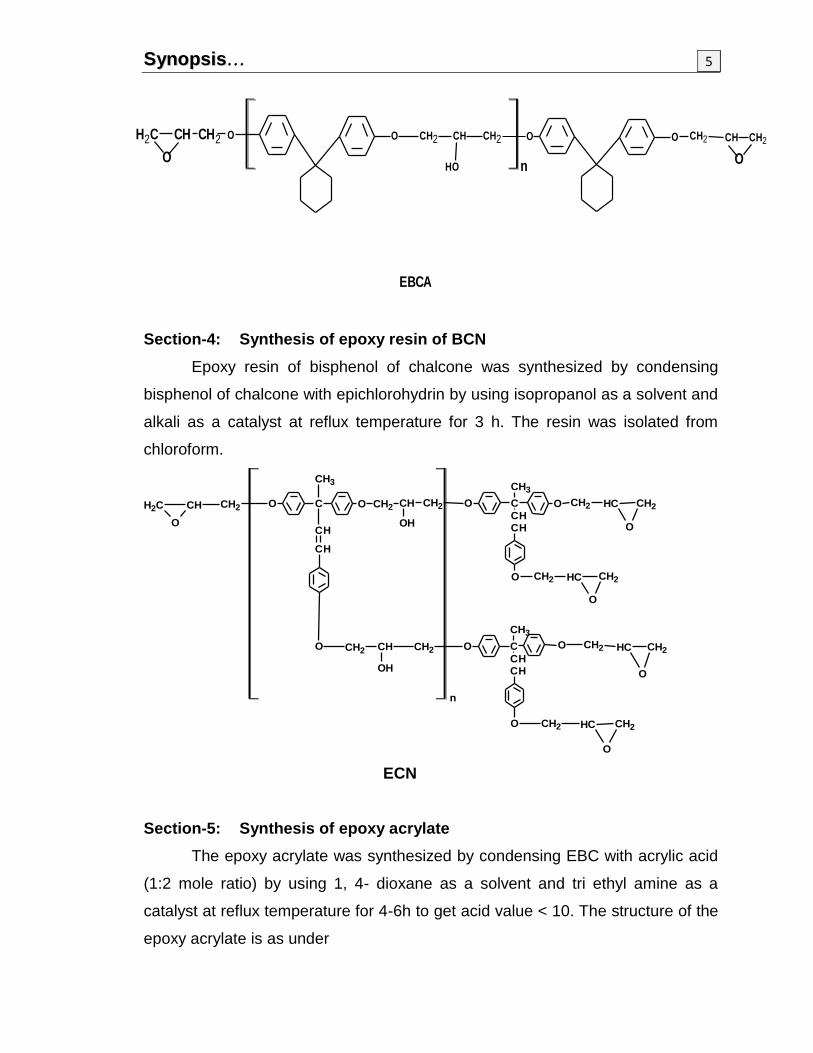
Section-4: Synthesis of epoxy resin of BCN
Epoxy resin of bisphenol of chalcone was synthesized by condensing
bisphenol of chalcone with epichlorohydrin by using isopropanol as a solvent and
alkali as a catalyst at reflux temperature for 3 h. The resin was isolated from
chloroform.
CH2 CH CH2
O
CH2 CH CH2
O
CO
CH3
CHCH
OCO
CH3
CHCH
CH2 CH CH2
OH
OCO
CH3
CH
CH
O
CH2 CH CH2
OH
O
CH2CHCH2
O
O
CH2 CH CH2
O
CH2 CH CH2
O
O
n
ECN
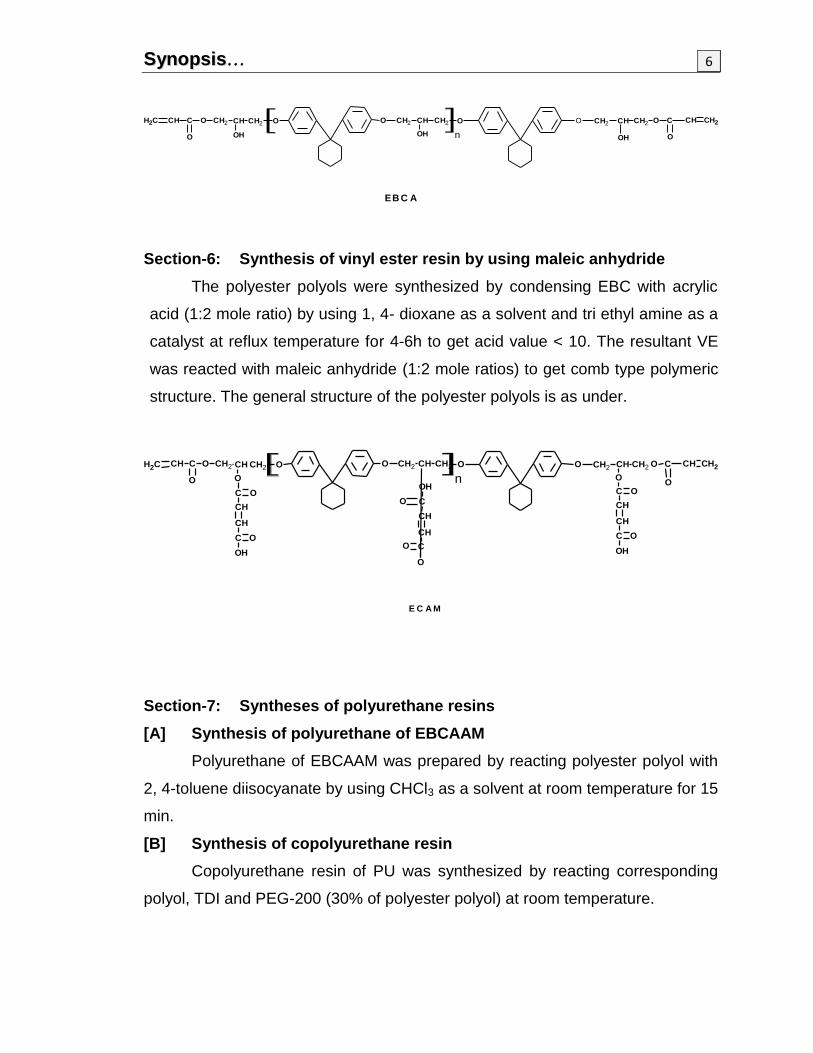
Section-5: Synthesis of epoxy acrylate
The epoxy acrylate was synthesized by condensing EBC with acrylic acid
(1:2 mole ratio) by using 1, 4- dioxane as a solvent and tri ethyl amine as a
catalyst at reflux temperature for 4-6h to get acid value < 10. The structure of the
epoxy acrylate is as under
OCH2CHCH2O
OH
C
O
CHCH2 O CH2 CH CH2 O C CH
OH
CH2
O
E B C A A
SSyynnooppssiiss… 6
nO CH2 CH CH2 O C
O
CH CH2
OH
OCH2CHCH2O
OH
C
O
CHCH2 O CH2 CH CH2
OH
O
E B C A
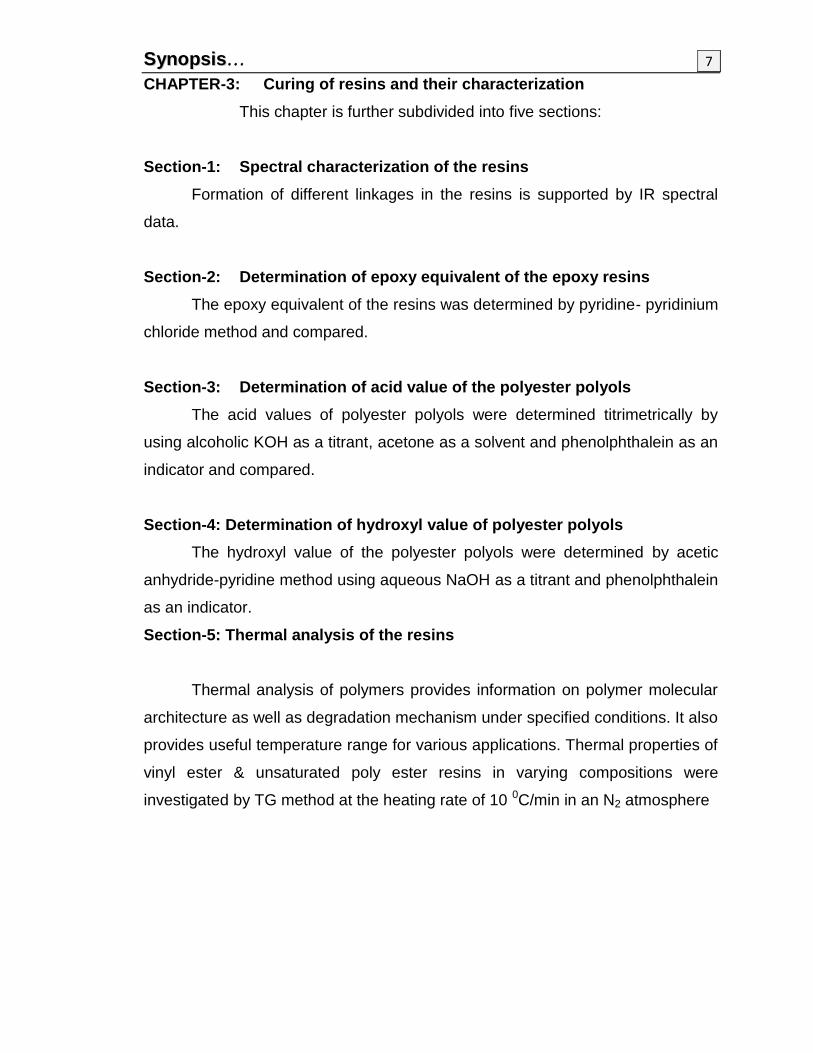
Section-6: Synthesis of vinyl ester resin by using maleic anhydride
The polyester polyols were synthesized by condensing EBC with acrylic
acid (1:2 mole ratio) by using 1, 4- dioxane as a solvent and tri ethyl amine as a
catalyst at reflux temperature for 4-6h to get acid value < 10. The resultant VE
was reacted with maleic anhydride (1:2 mole ratios) to get comb type polymeric
structure. The general structure of the polyester polyols is as under.
n
E C A M
O
O CH2 CH CH2 O C CH CH2
O
OCH2CHCH2O
O
C
O
CHCH2O CH2 CH CH2
O
O
C
CH
CH
C
OH
O
C
CH
CH
C
OH
O
O
C
CH
CH
C
OH
O
O
O
Section-7: Syntheses of polyurethane resins
[A] Synthesis of polyurethane of EBCAAM
Polyurethane of EBCAAM was prepared by reacting polyester polyol with
2, 4-toluene diisocyanate by using CHCl3 as a solvent at room temperature for 15
min.
[B] Synthesis of copolyurethane resin
Copolyurethane resin of PU was synthesized by reacting corresponding
polyol, TDI and PEG-200 (30% of polyester polyol) at room temperature.
SSyynnooppssiiss… 7
CHAPTER-3: Curing of resins and their characterization
This chapter is further subdivided into five sections:
Section-1: Spectral characterization of the resins
Formation of different linkages in the resins is supported by IR spectral
data.
Section-2: Determination of epoxy equivalent of the epoxy resins
The epoxy equivalent of the resins was determined by pyridine- pyridinium
chloride method and compared.
Section-3: Determination of acid value of the polyester polyols
The acid values of polyester polyols were determined titrimetrically by
using alcoholic KOH as a titrant, acetone as a solvent and phenolphthalein as an
indicator and compared.
Section-4: Determination of hydroxyl value of polyester polyols
The hydroxyl value of the polyester polyols were determined by acetic
anhydride-pyridine method using aqueous NaOH as a titrant and phenolphthalein
as an indicator.
Section-5: Thermal analysis of the resins
Thermal analysis of polymers provides information on polymer molecular
architecture as well as degradation mechanism under specified conditions. It also
provides useful temperature range for various applications. Thermal properties of
vinyl ester & unsaturated poly ester resins in varying compositions were
investigated by TG method at the heating rate of 10 0C/min in an N2 atmosphere
SSyynnooppssiiss… 8
CHAPTER-4: Fabrication and physico-chemical characterization of the
composites
This chapter is further subdivided into three sections.
Section-I: Fabrication of composites
Composite materials are formed by combination of two or more materials
that retain their respective characteristic properties when combined together but
they are superior to those of individual constituents. Main constituents of the
composites are matrix materials i.e. resins and reinforcing materials
(synthetic/natural fibers).
Composite of jute fibers were prepared by hand lay up compression
molding under pressure of 30.4 MPa and at appropriate temperature.
Section-II: Mechanical and electrical properties of composites
Polymeric composites have found their applications in a variety of fields
because of their excellent physico-chemical properties and low cost as compared
to conventional materials. Tensile strength, flexural strength, volume resistivity
and electric strength of the composites are determined according to ASTM
methods. The results are discussed in light of related materials.
Section-III: Chemical resistance and boiling water study of composites
The composites of the 50mm x 50mm dimensions were prepared and the
edges of composites were sealed with the resins. The chemical resistance of the
composites was determined at room temperature and at the interval of 24 h
against water, 10% each of aqueous solutions of HCl and NaCl at room
temperature by change in mass method till equilibrium was established. The
moisture uptake data are interpreted in light of medium and fiber modification.
In order to study effect of moisture absorption in boiling water, preweighed
composites of 50mm x 50mm were placed into a 250 ml beaker containing
boiling water. The samples were taken out of boiling water at the interval of 1h,
cooled, wiped the surfaces with tissue papers, reweighed and reimmersed in
boiling water till equilibrium was established. The data are interpreted in light of
effect of temperature on moisture uptake.
SSyynnooppssiiss… 9
CHAPTER-5: A brief summary of the work done
A brief review of the work incorporated in the thesis is described in this
chapter.
Supervisor Candidate
Dr. P. H. Parsania Mr. Pankaj K. Mer
(Prof. and Head)
Department of Chemistry,
Saurashtra University,
Rajkot – 360 005
Date:

Chapter – 1
Introduction
Literature Survey on…
10
General Introduction
Materials have such an influence on our lives that the historical periods of
humankind have been dominated and named after materials with the advent of
the modern civilization and development of scientific knowledge, there has been
an upsurge in demand for developing newer materials for novel applications.
Historians frequently classify the early ages of man according to the
materials that he used for making his implements and other basic necessities.
The most well- known of these periods are the Stone Age, the Iron Age and the
Bronze Age.
From the ancient civilizations of Egypt and Babylonia he was employing a
range of materials such as stones, woods, ceramics, glasses, skins and fibers.
Until the 19th century man‟s inanimate possessions, his home, his tools, his
furniture, were made from varieties of these classes of materials.
During last century and a half, two new closely related classes of materials
have been introduced, which have not only challenged the older materials for
their well established uses, but have also made possible new products, which
have helped to extend the range of activities of mankind. Without these two
groups of materials, rubber and plastics, it is difficult to conceive how such
everyday features of modern life such as the car, telephone, television set could
ever been developed.
The most ancient polymeric materials, mentioned in the book of „Genesis‟
(Chapter-11) described that the builders in the “Babylonia” had a brick of stone
and slime they had for mortar”.
In Ancient Egypt mummies were wrapped in a cloth dipped in a solution of
bitumen in oil of lavender, which was known variously as Syrian Asphalt. On
exposure to light, the product hardened and became insoluble. It would appear
that this process involved the action of chemical cross-linking. This in modern
times became of great importance in the vulcanization of rubber and production
of thermosetting plastics.
Literature Survey on…
11
[A] LITERATURE SURVEY ON BISPHENOLS
Bisphenols are the important constituents or intermediates in dyes, drugs,
paints and varnishes, coatings, pesticides, plasticizers, fertilizers, bactericides
and in other applications. They are widely applied in manufacturing thermally
stable polymers, epoxy resins and polyester resins.
Farbenind [1, 2] has studied the condensation of phenols and ketones in
the presence of acetic acid, hydrochloric acid at 50oC and also reported the
melting points of 1,1‟-bis(4-hydroxy phenyl) cyclohexane (186oC). 1,1‟-bis(3-
methyl-4- hydroxyl phenyl) cyclohexane (186oC) and 1,1‟-bis(4-hydroxy phenyl)-
4-methyl cyclohexane (179oC). The products are useful as inter- mediates for
dyes and drugs.
McGreal et al [3] have reported the condensation of ketones (0.5 mol) and
phenols (1.0 mol) in acetic acid. The solutions were saturated with dry HCl for 3-
4 h and the mixture was kept up to 4 weeks until the mass crystallized. The
yields with aliphatic and aromatic ketones were 10-25% and with cyclic ketones
50-80%.
They have also proposed the following mechanism:
1. The addition of phenol to ketone
PhOH + R2CO → R2C(OH)C6H4OH
2. R2C(OH)C6H4OH + PhOH → R2C(C6H4OH)2 + H2O
1. I. G. Farbenind. Condensation of ketones with phenols. Fr. Patent
647,454; C.A. 23, 2540, 1929.
2. I. G. Farbenind. Ger. Patent 467,728 1927; C.A. 23, 1929.
3. M. E. McGreal, V. Niedert and J. B. Niedert. Condensation of ketones with
phenols. J. Am. Chem. Soc., 61, 345-348, 1939.
Literature Survey on…
12
Johnson and Musell [4, 5] have reported synthesis of 1,1‟-bis(4-hydroxy
phenyl) cyclohexane (I) using 5 mol of phenol, 1 mol of a cyclohexanone, H2S or
BuSH below 40oC with 0.1-0.3 mol dry HCl gave (I) m.p.186-187oC; 4-Me-I
178oC; 1,1‟-bis(4-hydroxy-3-methyl phenyl) cyclohexane m.p. 187oC and 1,1‟-
bis(4-hydroxy-3-isopropyl phenyl) cyclohexane, m.p. 109-111.5oC. Mash
containing small quantities of bisphenol (I) protect chickens from coccidiosis
better than does a sulfaguanidine.
Bender et al. [6] have reported preparation of various bisphenols by
reacting phenol, NaOH and acetone. The mixture was refluxed for 16 h and
acidified to pH 2-3 with 6N HCl. The yield was 47.5%. Similarly they have also
synthesized 1,1‟-bis(4-hydroxy phenyl) cyclohexane (m.p. 187oC), 1,1‟-bis(3-
methyl-4-hydroxy phenyl) cyclohexane (m.p.186-9oC) and 1,1‟-bis(3-chloro-4-
hydroxy phenyl) cyclohexane (m.p. 134-41oC).
Bender et al. [7] have reported the preparation of bisphenols by irradiating
a mixture of ketone and phenol at 20-100o C with β –rays or ultraviolet in the
presence of 37% aq. HCl or 70% H2SO4 as condensing agent and stirring at 30-
37oC. 1,1‟-Bis(4-hydroxy phenyl) cyclohexane (m.p. 186-189o C) was obtained in
93% yield from 1 mol cyclohexanone and 4 mol phenol.
Farbenfabriken [8] has reported the preparation of 4,4‟-dihydroxy diphenyl
cyclohexane (m.p.186oC) using cyclohexanone (78 kg) and excess phenol (400
kg) in the presence of 38% HCl as a catalyst at room temperature for 6 days.
4. J. E. Johnson and D. R. Musell. Bis (hydroxy phenyl) cyclohexane
compositions. U.S. 2,538,725 1951; C.A. 45, 4412, 1951.
5. J. E. Johnson and D. R. Musell. Diphenol compound composition for
coccidiosis, U.S. 2,535,014 1950., C.A. 45, 2635, 1951.
6. H. L. Bender, L. B. Conte and F. N. Apel. Bisphenols. U.S. 2,858,342
1958; C.A. 53, 6165, 1959.
7. H.L.Bender, L.B.Conte and F.N.Apel. Diphenol compound composition for
coccidiosis control. U.S. 936,272 1960; C.A. 45, 2635, 1951.
8. Farbenfabriken. Bisphenols. Ger. 1,031,788 1958; C.A. 54, 19603, 1960.
Literature Survey on…
13
Alexandru [9] has reported the preparation of bisphenols by reaction of a
ketone (cyclohexanone) with phenol, BuSH, ClCH2CH2Cl and Me3SiCl.The
mixture was stirred and heated to 50-55oC and finally at 65oC to give bisphenol-
Z.
Freudewald et al. [10] have reported the condensation of phenol (94 g)
with cyclohexanone (98 g) in the presence of 2 g EtSH and anhydrous HCl (4.7
g) and heating at 70oC in closed system for 3 h to give 97% yield of 1,1‟-bis(4-
hydroxy phenyl) cyclohexane.
Rao et al. [11] have reported a convenient method for the preparation of
bisphenols. Cyclohexanone was treated with PhOH at 40oC and with o-cresol at
room temperature in the presence of HCl and AcOH to give 1,1‟-bis(4-hydroxy
phenyl) cyclohexane and 1,1‟-bis(3-methyl-4-hydroxy phenyl) cyclohexane,
respectively.
Garchar et al. [12-15] have studied optimization reaction conditions for the
synthesis of 1,1‟-bis(R, R‟-4-hydroxy phenyl) cyclohexane by condensing
cyclohexanone (0.05 mol) and phenol, o-cresol, and 2,6-dimethyl phenol (0.1
mol) in the presence of varying mixture of hydrochloric acid and acetic acid (2:1
v/v) at four different temperatures : 40o, 50o, 60o, 70oC.
9. B.S. Alexandru, U.S. Patent 4,766,255 1988; C.A. 110, 38,737, 1989. 10. Freudewald, E. Joachim, Konarad and M. Frederic. p-Phenylphenol. Fr.
1,537,574, 1968; C.A. 71, 21868, 1969. 11. M. V. Rao, A. J. Rojivadiya, P. H. Parsania and H. H. Parekh. Convenient
method for the preparation of the bisphenols. J. Indian Chem. Soc., 64, 758-759, 1987.
12. H. H. Garchar, H. N. Shukla and P. H. Parsania. Kinetics of formation of 1,1‟-bis(3-methyl-4-hydroxy phenyl) cyclohexane, Indian Acad. Sci. (Chem. Sci)., 103, 149-153, 1991.
13. H. H. Garchar, S. H. Kalola and P. H. Parsania. Synthesis and evaluation of bisphenol-C and its derivatives as potential antimicrobial and antifungal agents. Asian J. Chemistry, 5, 340-347, 1993.
14. H. H. Garchar and P. H. Parsania. Optimization reaction conditions for synthesis of 1,1‟-bis(3,5-dimethyl-4-hydroxy phenyl) cyclohexane. Asian J. Chemistry, 6, 87-91, 1994.
15. H. H. Garchar and P. H. Parsania. Optimization reaction conditions for synthesis of 1,1‟-bis(4-hydroxy phenyl) cyclohexane. Asian J. Chemistry, 6, 135-137, 1994.
Literature Survey on…
14
They have reported optimum catalyst concentration (10-15 ml), time (30-
90 min) and temperature (55-70oC) for obtaining yields greater than 80%. They
have also synthesized chloro, bromo and nitro derivatives and screened for their
potential antimicrobial and antifungal activities against different microbes. Some
of these compounds are significantly found active against B. subtilis, S. pyogens
and A. niger. The nitro compounds are found to be the most active antifungal
agents.
[B] LITERATURE SURVEY ON EPOXY RESINS, EPOXY ESTERS (POLY
ESTER POLYOLS)
Epoxy resins are the most versatile class of contemporary plastics. Due to
tendency of undergoing variety of chemical reactions and became material of
choice for researchers for several years. By the help of reactions like co-
polymerization, chain extension by reactive diluents, side chain modification,
incorporation of variety of fillers and structure modifiers, the resin structure can
be modified. The capabilities of undergoing vast chemical reactions of the resins
the desire properties can be achieved.
Epoxy resins are widely used as a matrix in composites in different
applications where chemical, mechanical, thermal, and dielectric properties are
necessary. In addition, epoxy resins are versatile crosslinked thermosetting
polymers with an excellent chemical resistance and good adhesion properties to
different substrates. Due to these properties, they are used as adhesives and
coatings [16]. Epoxy is best for laminates in combination with glass fiber to
achieve excellent electrical insulators.
16. Hackman, and L. Hollaway. Composites Part A, 37, 1161–1170, 2006.

Literature Survey on…
15
Use of epoxy resins in composite matrix in high technology areas is
limited, as these areas require material with inherent low thermal expansion
coefficients and high toughness [17,18] and better heat and moisture stability.
Recently, a lot of research work has been done to improve the required
parameters of epoxy resins through modifications in both the backbone and
pendant groups. Urea-formaldehyde and silicon resins have been reported to
have excellent properties as modifiers for the epoxy resins. The first commercial
attempts to prepare resins from epichlorohydrin were made in 1927 in the United
States. Credit for the first synthesis of bisphenol-A-based epoxy resins is shared
by Dr. Pierre Castan of Switzerland and Dr. S.O. Greenlee of the United States in
1936. Dr. Castan's work was licensed by Ciba, Ltd. of Switzerland, which went on
to become one of the three major epoxy resin producers worldwide. Ciba's epoxy
business was spun off and later sold in the late 1990s and is now the advanced
materials business unit of Huntsman Corporation of the United States. Dr.
Greenlee's work was for the firm of Devoe-Reynolds of the United States. Devoe-
Reynolds, which was active in the early days of the epoxy resin industry, was
sold to Shell Chemical (now hexion, formerly Resolution Polymers and others).
Desai et. al [19] have synthesized polyester polyols using vegetable oil
fatty acids having different characteristics (mainly in terms of hydroxyl
functionality) and epoxy resin, using triethyl amine as a catalyst. Polyols were
characterized by FTIR spectroscopy. PU adhesives were synthesized from it and
used in bonding the rubber. Treatment of sulphuric acid on the non-polar styrene-
butadiene rubber (SBR) surface as studied for the bond strength improvement
17. D. Puglia, L. B. Manfredi, A. Vazquez and J. M. Kenny. Thermal
degradation and fire resistance of epoxy-amine phenolic blends. Polym.
Degr. and Stab., 73(3), 521–527, 2001.
18. K. E. L. Gersifi, N. Destais-Orvoe¨n, and G. Tersac. Glycolysis of epoxid–
amine hardened networks. 1. diglycidylether/aliphatic amines model
networks. Polymer, 44(14), 3795–3801, 2003.
19. S. D. Desai, A. L. Emanuel and V. K. Sinha. Polyester-polyol based PU-
adhesives; effect of treatment on rubber surface. J. Polym. Research. 10,
141-149, 2003.
Literature Survey on…
16
via an increase in wettability of the rubber surface. Wettability was found by
measuring the contact angle using Goniometer.Bond strength was evaluated by
a 1800 T-peel strength test. The surface modification and mode of bond failure
were studied by scanning electron microscopy (SEM).
The epoxy resin can be converted into three dimensional infusible
networks together by covalent bonds. This conversion from a liquid or a friable
brittle solid into tough cross-linked polymer is called curing or hardening in epoxy
technology. Mainly amine hardening and acid hardening systems are employed
for curing of epoxy resins.
Epoxy resins are widely used for land, marine and space transportation,
automobile and electrical components, rehabilitations products and pollution
control equipments. The characteristic properties of epoxy resins make them
suitable for an increasing number of engineering applications, such as high
strength and stiffness, good dielectric behavior, resistance to chemicals, low
shrinkage during cure, etc. Despite of excellent properties their brittle behavior
with low elongation restricts their use for high performance applications [20].
Many researchers have tried to modify the epoxy resin to improve its mechanical
properties by reacting it with dienes [21], acrylates, etc. This modification of
epoxy resin is feasible due to highly reactive epoxy ring, which can also undergo
ring opening reaction in the presence of acids [22] to yield polyester polyol
containing a free hydroxyl group that can be utilized to produce polyurethanes.
To make an economic production of polyurethanes, efforts have been made to
prepare polyester polyols from the low cost natural oils and their derivatives.
20. A. F. Yee, and R. A. Pearson, Toughening mechanisms in elastomer
modified epoxies: Part-1 mechanical studies, J. Mater. Sci., 21, 2462-2474,
1986.
21. A. V. Cunliffe, M. B. Huglin, P. J. Pearce and D. H. Richards, An anionically
prepared flexible adhesive: 1: Synthesis. Polymer, 16, 654-658, 1975.
22. C. A. May, Epoxy Resins- Chemistry and Technology, Marcel Dekker, New
York, 1988.
Literature Survey on…
17
All the vegetable oil fatty acids are used for polyester polyol (epoxy esters)
manufacturing but the most commonly used are listed below with their specific
properties they confer on the polyester polyol (epoxy esters). Today‟s technology
of epoxy resins had started only by late 1930‟s and early 1940s, when a number
of patents were applied simultaneously in U.S.A. and Europe. Special mention
may be made of the work carried out by Dr. Castan of Switzerland and Dr.
Sylvan Greenlee of the United States simultaneously around the year 1938, who
had patented the first epoxy resin out of reaction of epichlorohydrin and
bisphenol-A
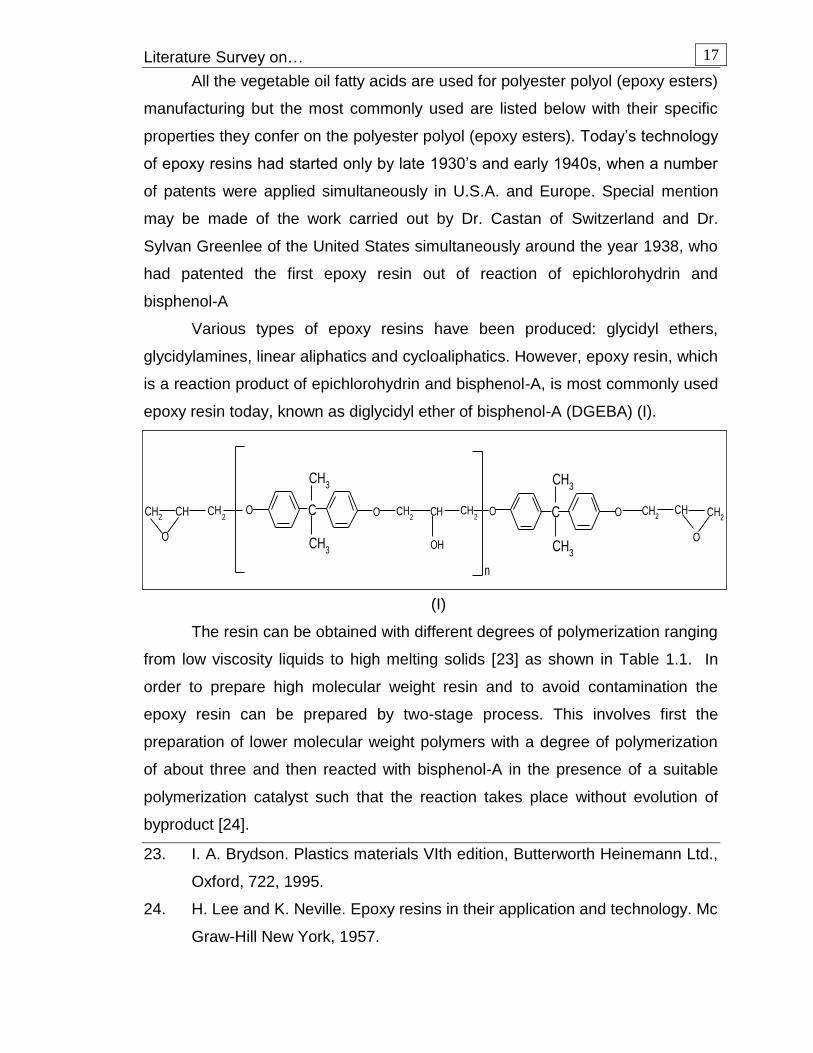
Various types of epoxy resins have been produced: glycidyl ethers,
glycidylamines, linear aliphatics and cycloaliphatics. However, epoxy resin, which
is a reaction product of epichlorohydrin and bisphenol-A, is most commonly used
epoxy resin today, known as diglycidyl ether of bisphenol-A (DGEBA) (I).
.
(I)
The resin can be obtained with different degrees of polymerization ranging
from low viscosity liquids to high melting solids [23] as shown in Table 1.1. In
order to prepare high molecular weight resin and to avoid contamination the
epoxy resin can be prepared by two-stage process. This involves first the
preparation of lower molecular weight polymers with a degree of polymerization
of about three and then reacted with bisphenol-A in the presence of a suitable
polymerization catalyst such that the reaction takes place without evolution of
byproduct [24].
23. I. A. Brydson. Plastics materials VIth edition, Butterworth Heinemann Ltd.,
Oxford, 722, 1995.
24. H. Lee and K. Neville. Epoxy resins in their application and technology. Mc
Graw-Hill New York, 1957.
CH2 CH CH2
O
CH2 OCHCH2
O OH
O H HC 2O C OCH2
n
C
CH3
CH3
C
CH3
CH3

Literature Survey on…
18
Table – 1.1: Effect of reactant ratios on molecular weight
Mole ratio of
epichlorohydrin/
bisphenol-A
Softening
point (oC)
Molecular
Weight
Epoxide
equivalent
2.0 43 451 314
1.4 84 791 592
1.33 90 802 730
1.25 100 1133 862
1.2 112 1420 1176

Literature Survey on…
19
The epoxide resins of the glycidyl ether are usually characterized by six
parameters:
Resin viscosity (of liquid resin)
Epoxide equivalent
Hydroxyl equivalent
Average molecular weight
Melting point (of solid resin)
Heat distortion temperature (of cured resin)
The epoxy resin can be converted into three dimensional infusible networks
together by covalent bonds. This conversion from a liquid or a friable brittle solid
into tough cross-linked polymer is called curing or hardening in epoxy
technology. Mainly amine hardening and acid hardening systems are employed
for curing of epoxy resins.
Epoxy resins are widely used for land, marine and space transportation,
automobile and electrical components, rehabilitations products and pollution
control equipments. The characteristic properties of epoxy resins make them
suitable for an increasing number of engineering applications, such as high
strength and stiffness, good dielectric behavior, resistance to chemicals, low
shrinkage during cure, etc. Despite of excellent properties their brittle behavior
with low elongation restricts their use for high performance applications [25].
Chemie Produkte [26] has reported the sealing composition for pipe joints
and building materials. A typical composition consists of a mixture of an epoxy
resin, a hardener and tar, which polymerized rapidly.
Many researchers have tried to modify the epoxy resin to improve its
mechanical properties by reacting it with dienes[27], acrylates, etc. This
25. A. F. Yee, and R. A. Pearson. Toughening mechanisms in elastomer
modified epoxies: Part-1 mechanical studies. J. Mater. Sci., 21, 2462-
2474, 1986.
26. Chemie Produkte. Epoxy resins containing sealing compositions. Ger.
1,020,140, 1957., C.A. 54, 179704, 1957.
Literature Survey on…
20
modification of epoxy resin is feasible due to highly reactive epoxy ring, which
can also undergo ring opening reaction in the presence of acids [28] to yield
polyester polyol containing a free hydroxyl group that can be utilized to produce
polyurethanes. To make an economic production of polyurethanes, efforts have
been made to prepare polyester polyols from the low cost natural oils and their
derivatives.
All the vegetable oil fatty acids are used for polyester polyols (epoxy
esters) manufacturing but the most commonly used are listed Table-1.2 with their
specific properties they confer on the polyester polyols (epoxy esters). Polyester
polyol is more effective than polyether polyol in the production of polyurethane.
The commercial interest in epoxide resins was first made apparent by the
publication of German patent 6, 76, 117 by I. G. Farben in 1939, which described
liquid poly epoxides. In 1943 P. Casten filed US patent 23, 24, 483 covering the
curing of the resins with dibasic acids. The Ciba Company subsequently
exploited this important process. A later patent of Casten (US patent 24, 44, 333)
covered the hardening of epoxide resins with alkaline catalyst used in the range
0.1–5 %. This patent, however, became of somewhat restricted value as the
important amine hardeners are usually used in quantities higher than 5%.
In the early stage of their development, epoxy resins were used almost
entirely for surface coating. The developments in this field are due to the
research work of S. O. Greenlee and described in a number of patents. These
include work on the modification of epoxy resins with glycerol, the esterification
with drying oil acids and reaction with phenolic and amino resins.
27. A. V. Cunliffe, M. B. Huglin, P. J. Pearce and D. H. Richards. An
anionically prepared flexible adhesive, Polymer, 16, 654-658, 1975.
28. C. A. May. Epoxy resins- chemistry and technology. Marcel Dekker, New
York, 1988.
Literature Survey on…
21
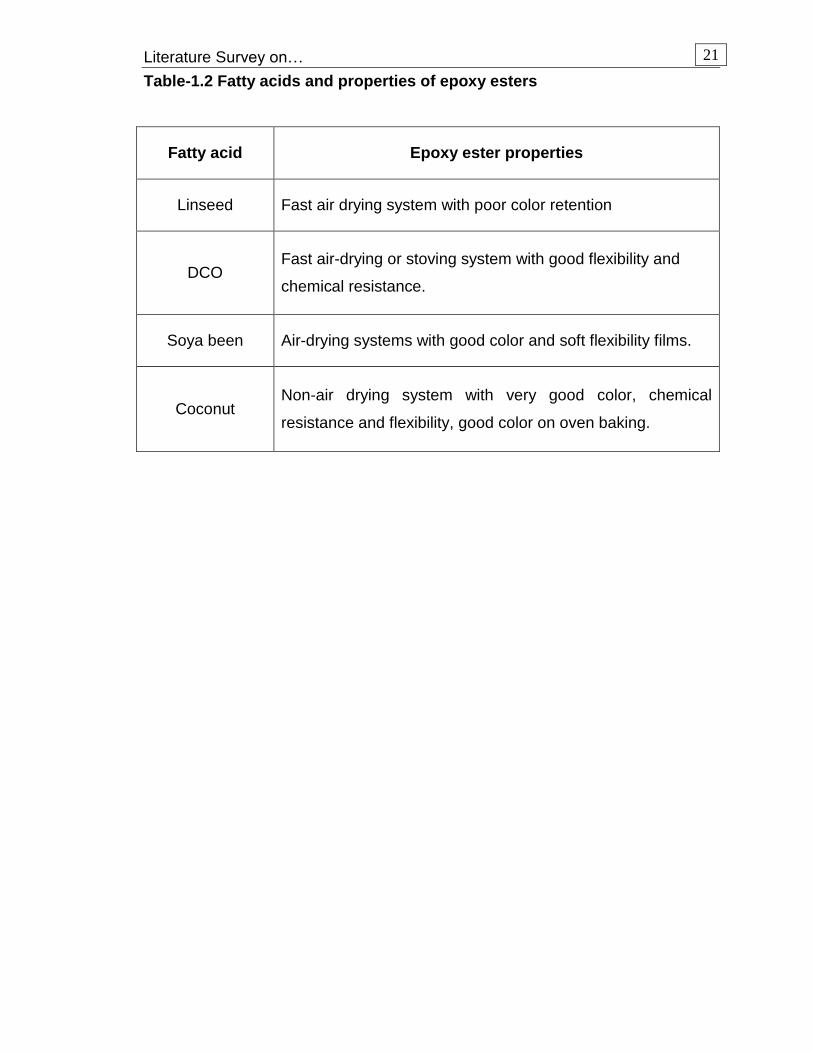
Table-1.2 Fatty acids and properties of epoxy esters
Fatty acid Epoxy ester properties
Linseed Fast air drying system with poor color retention
DCO Fast air-drying or stoving system with good flexibility and
chemical resistance.
Soya been Air-drying systems with good color and soft flexibility films.
Coconut Non-air drying system with very good color, chemical
resistance and flexibility, good color on oven baking.
Literature Survey on…
22
Greenlee [29] has prepared the rapid drying composition from diphenols
and epichlorohydrin and esterified this product with Tall–oil.
Chemie Produkte [30] has reported the sealing composition for pipe joints
and building materials. A typical composition consists of a mixture of an epoxy
resin, a hardener and tar, which polymerized rapidly.
Lederman [31] has reported varnish based on bisphenols. A wrinkle
varnish or base comprising a blend of tung-oil varnish and fish-oil varnish is
described. It gives a fine texture wrinkle finish, good toughness and flexibility.
Petri et al. [32] have prepared epoxy resin foams from aqueous
dispersions. Epoxy resin based on bisphenol-A, benzsulfohydrazide, dipropylene
triamine were dispersed in water by 2,3-dibromopropyl phosphate as a
dispersing medium. Rigid foam was obtained by this composition, which is
suitable for architectural uses.
CIBA Ltd. [33] has reported coating composition for floors, roofs, walkers
and walls based on bisphenol–A epoxy resin. The composition was room
temperature hardenable having quartz sand, epoxy resin, dibutyl phthalate
together with triethylene tetramine. This composition has consistency of mortar
and a pot life of 2.0 – 2.5h. It is spread on a concrete floor to a depth of 4mm.
hardening required 24-48h. The composition shows excellent adhesion in non-
cracking and is highly resistance to chemical.
Union Carbide Co. [34] has reported curing of polyepoxides with liquid
glycol diamines (H2N(CH2)3O(CnH2nO)x (CH2)3NH2), where n is 2-5 and x is 1-11.
29. S. O. Greenlee. Tall-oil esters, U.S. 2,493,486, 1949; C.A. 44 2770, 1950.
30. Chemie Produkte. Epoxy resins containing sealing compositions. Ger.
1,020,140 1957; C.A. 54, 179704, 1957.
31. B. E. Lederman (Midland Chemical Co.). Bisphenol-modified wrinkle
varnish. C.A. 53, 1779, 1959.
32. R. Petri, H. Reinhard and L. Keller. Epoxy resin foams from aqueous
dispersions Ger. 1,080,774, 1960; C.A. 55, 14,982, 1961.
33. CIBA Ltd. Epoxy resin containing coatings. Brit. 883,521, 1961 C.A. 56,
11746, 1962.
Literature Survey on…
23
The cured compounds have excellent impact strength and flexibility and are
stable as protective coatings. Thus, 100 g of diglycidyl ether of 2,2‟-bis(p-
hydroxy-phenyl) propane was mixed with 29.4 g stoichiometric amount of H2N
(CH2)3O (CH2CH2O)2(CH2)3NH2 for 5 min. The mixture was applied on cold-rolled
steel and was cured by storing 7 days at room temperature.
Minnesta Mining and Manufacturing Co. [35] have reported synthesis of
flexible adhesive film having honeycomb structure. Thus, an epoxy resin mixture
was prepared by heating 100 parts of glycidyl ether of bisphenol–A at 121oC,
adding 2-parts fine SiO2 and stirring at 149oC for 10-20 min. A mixture of 145
parts isophthaloyl dihydrazide, 10 parts MgO and 1 part dimethyl diocta decyl
ammonium bentonite was added to epoxy mixture at 104oC and the resulting
mixture was milled at 77oC to complete dispersion.
Bremmer [36] has synthesized flame-retardant epoxy resin. In a typical
composition tetra bromo bisphenol-A was added to bisphenol-A-diglycidyl ether
(epoxide equivalent 186) at 70oC under an N2 atmosphere with stirring. The
composition was cured by triethyl amine.
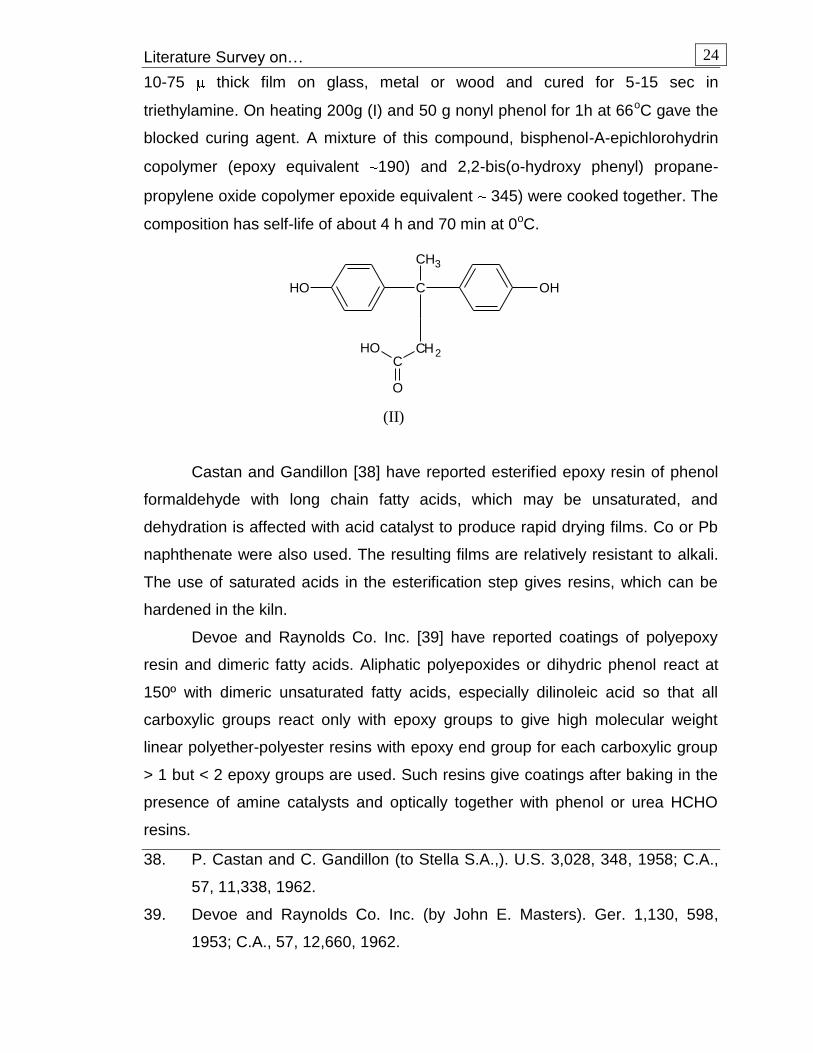
Taft [37] has reported new polymeric coating agents with improved
properties. Such composition consists of a reaction product of hydroxy or epoxy
containing compound capped with the bisphenol acid, 4-4‟-bis(4-hydroxy phenyl)
valeric acid (II) with a poly isocyanate and cross linked with an amine.
Thus (II) reacts with 1,6-hexanediol and the reaction product was treated
with Mondur HC (poly isocyanate) to give a composition, which was sprayed to a
34. Union Carbide Co. (by Norman H. Reinking.). Liquid glycol diamine curing
agent for polyepoxides. Brit. 904, 403, 1962; C.A. 58, 1643, 1963.
35. Minnesta (Mining and Manufacturing Co.). Flexible adhesive film, Ger.
1,100,213, 1961; C.A. 58, 11551, 1963.
36. B. J. Bremmer (Dow Chemicals Co.). Flame retardant epoxy resin. U.S.3,
294,742, 1966; C.A. 66, 38487, 1967.
37. D. D. Taft. (Ashland Oil Inc.). Polymeric coating agents. U.S. 2,203,594,
1971; C.A. 77, 154099, 1972.
Literature Survey on…
24
10-75 thick film on glass, metal or wood and cured for 5-15 sec in
triethylamine. On heating 200g (I) and 50 g nonyl phenol for 1h at 66oC gave the
blocked curing agent. A mixture of this compound, bisphenol-A-epichlorohydrin
copolymer (epoxy equivalent 190) and 2,2-bis(o-hydroxy phenyl) propane-
propylene oxide copolymer epoxide equivalent 345) were cooked together. The
composition has self-life of about 4 h and 70 min at 0oC.
(II)
Castan and Gandillon [38] have reported esterified epoxy resin of phenol
formaldehyde with long chain fatty acids, which may be unsaturated, and
dehydration is affected with acid catalyst to produce rapid drying films. Co or Pb
naphthenate were also used. The resulting films are relatively resistant to alkali.
The use of saturated acids in the esterification step gives resins, which can be
hardened in the kiln.
Devoe and Raynolds Co. Inc. [39] have reported coatings of polyepoxy
resin and dimeric fatty acids. Aliphatic polyepoxides or dihydric phenol react at
150º with dimeric unsaturated fatty acids, especially dilinoleic acid so that all
carboxylic groups react only with epoxy groups to give high molecular weight
linear polyether-polyester resins with epoxy end group for each carboxylic group
> 1 but < 2 epoxy groups are used. Such resins give coatings after baking in the
presence of amine catalysts and optically together with phenol or urea HCHO
resins.
38. P. Castan and C. Gandillon (to Stella S.A.,). U.S. 3,028, 348, 1958; C.A.,
57, 11,338, 1962.
39. Devoe and Raynolds Co. Inc. (by John E. Masters). Ger. 1,130, 598,
1953; C.A., 57, 12,660, 1962.
COH OH
CH3
CH2C
O
OH

Literature Survey on…
25
Kinck and Ditrych [40] had synthesized epoxy resin ester of Bisphenol-C
1, epichlorohydrin 1.16, and NaOH 1.25 moles in organic solvents at 80-100º
until the softening point was 100ºC. The resin obtained had an ester equivalent of
180 content of epoxy groups 0.11 mole/100 g, and no. of -OH groups 0.33
mole/100 g. Fatty acid (1600 parts) isolated from a soyabean oil was treated with
400 parts dicyclopentadiene at 280ºC during 3h.Volatile and unreacted
components were distilled in vacuum. The prepared resin (900 parts) was mixed
in a stainless steel vessel with the prepared acids (950 parts) and heated to
140oC, and stirred under CO2. When the mixture was homogenized, the product
was heated to 230oC during 2 h and kept at the temperature until the acid no was
10 mg KOH /g, then the mixture was cooled to 170oC and dissolved in a 1:1
mixture of xylene and ligronine to form a varnish containing 30% of dry
substances. The hot varnish was filtered and used as an air drying varnish after
adding 0.05 % Co-naphthenate.
Nemours & Co. [41] has reported salt spray resistant coating composition
of alkyd resin, drying oil (soyabean oil), and liquid epoxy resin (condensation)
product of epichlorohydrin and diphenyl isoporpane. These compositions exhibit
good adhesion and corrosion resistance under topcoats of acrylic enamel.
Shimizu et al. [42] have esterified epoxy resins with higher fatty acids like
dehydrated linseed oil fatty acid in the presence of alkali metal salt catalyst and
xylene for 8 h at 230–240ºC under nitrogen atmosphere to give polyester with Q
Gardner viscosity (as a 50 % xylene solution).
Neumann and Hoenel [43] have prepared epoxy resins based on
bisphenols useful in adhesive, coating, molded articles, where a part of
bisphenols compounds are modified at the aromatic rings with an aryl alkyl
40. J. Kinck and Z. Ditrych, Czech. 101,431, 1961; C.A., 58, 674, 1963.
41. Nemours and Co. (by Ralph G. Swanson) Belg. 632, 997, 1963; C.A., 59,
14,734, 1964.
42. Shimizu Shigeo, Tachibana Akihiro, Aritomi Michio, Mori Akitshi, Suzuki
Tsotoma (Toko Chemical Industry Co., Ltd). Japan Kokai 4,90,14,600,
1974; C.A. 81, 1,53,510, 1974.
Literature Survey on…
26
group. For example bisphenol-F and styrene were reacted in presence of catalyst
at 120oC, and equivalent weight 670-690 g/mol and viscosity at 25oC in 40%
butyl diglycol solutions 480-510 mPas.
Nakahara et al. [44] have developed new type of epoxy resin containing a
4,4 -biphenylene moiety in the backbone (Bis-EBP) and confirmed its structure
by elemental analyses, infrared spectroscopy and 1H-nuclear magnetic
resonance spectroscopy (NMR). In addition, to evaluate the influence of the 4,4 -
biphenylene group in the structure, an epoxy resin having a 1,4-phenylene group
in place of the 4,4 -biphenylene moiety (Bis-EP) was synthesized. The cured
polymer obtained through the curing reaction between the new biphenyl-
containing epoxy resin and phenol novolac was used for making a comparison of
its thermal and physical properties with those obtained from Bis-EP and
bisphenol-A (4,4 -isopropylidenediphenyl)-type epoxy resin (Bis-EA). The cured
polymer obtained from Bis-EBP showed markedly higher fracture toughness of
1.32 MPa, higher than that of glass.
Liu et al. [45] have prepared simultaneous interpenetrating polymer
networks (IPNs) based on epoxy (diglycidyl ether of bisphenol-A) and
unsaturated polyester resin (UP) using m-xylene diamine and benzoyl peroxide
as curing agents. A single glass transition temperature for each IPN was
observed with differential scanning calorimetry (DSC), which suggested good
compatibility of epoxy and UP. This compatibility was further confirmed by the
single damping peak of the rheometric dynamic spectroscopy. Curing behaviors
were studied with dynamic differential scanning calorimetry and the curing rates
were measured with a Brookfield RTV viscometer. It was noted that an interlock
43. U. Neumann and M. Hoenel, Can. Pat. Appl. CA 95, 2,152,427, 1995;
C.A. 124, 234985, 1996.
44. K. Nakahara, T. Endo and M. Kaji. Synthesis of a bifunctional epoxy
monomer containing biphenyl moiety and properties of its cured polymer
with phenol novolac. J. Appl. Polym. Sci., 74, 690-698, 1999.
45. C. C. Liu, C. T. Lee and M. S. Lin. Toughened interpenetrating polymer
network materials based on unsaturated polyester and epoxy. J. Appl.
Polym. Sci., 72, 585-592, 1999.

Literature Survey on…
27
between the two growing networks did exist and led to a retarded viscosity
increase. However, the hydroxyl end groups in UP catalyzed the curing reaction
of epoxy; in some IPNs where the hydroxyl concentration was high enough, such
catalytic effect predominated the network interlock effect, leading to fast viscosity
increase. In addition, the entanglement of the two interlocked networks played an
important role in cracking energy absorption and reflected in a toughness
improvement.
Sanariya et al. [46] have reported a convenient method for the preparation
of epoxy resins based on bisphenols-C. The epoxy resins of bisphenols-C
derivatives were synthesized by condensing corresponding derivative (0.5 moles)
with epichlorohydrin (1.1 moles) by using isopropanol (500 ml) as a solvent and
sodium hydroxide (1.0 mol in 40 ml water) as a catalyst. The reaction mixture
was stirred at reflux temperature for 4h. Excess of solvent was distilled off and
the viscous resin was isolated from distilled water. The resin was extracted from
chloroform and evaporated to dryness to obtain pure resin. The yield was 75-80
%.
Kagathara et al. [47] have reported a convenient method for the
preparation of epoxy resins based on halogenated bisphenols-C. The epoxy
resins of bisphenols-C derivatives were synthesized by condensing
corresponding derivative (0.5 moles) with epichlorohydrin (1.1 moles) by using
isopropanol (500 ml) as a solvent and sodium hydroxide (1.0 mole in 40 ml
water) as a catalyst. The reaction mixture was stirred at reflux temperature for
4h. Excess of solvent was distilled off and the viscous resin was isolated from
distilled water. The resin was extracted from chloroform and evaporated to
dryness to obtain pure resin. The yield was 75-80 %.
46. M. R. Sanariya, D. R. Godhani, S. Baluja and P. H. Parsania. Synthesis
and characterization of epoxy resins based on 1,1‟-bis(4-hydroxyphenyl)
cyclohexane and 1,1‟-bis(3-methyl-4-hydroxyphenyl) cyclohexane. J.
Polym. Mater., 15, 45-49, 1998.
47. V. M. Kagathara, M. R. Sanariya and P. H. Parsania. Selected topics in
polymer science. S. K. Dolui Edi., Prof. Sukumar Maiti, Polymer Award
Foundation, Kolkata, 1-8, 2001.

Literature Survey on…
28
Liu et al. [48] have reported combination of epoxy and novolac resins. In a
typical study, a novel phosphorus-containing Ar-alkyl novolac (Ar-DoPo-N) was
prepared. The Ar-DoPo-N blended with novolac and used as a curing agent for
o-cresol formaldehyde novolac epoxy, resulting in cured epoxy resins with
various phosphorus contents. The epoxy resins exhibited high glass-transition
temperatures (159-176oC), good thermal stability (>320oC).
Polyesters
Polyester resins are unsaturated resins formed by the reaction of dibasic
organic acids and polyhydric alcohols. Among other uses, it is the basic
component of sheet moulding compound and bulk moulding compound.
Unsaturated polyesters are condensation polymers formed by the reaction of
polyols (also known as polyhydric alcohols, organic compounds with multiple
alcohol or hydroxy functional groups) and polycarboxylic that contain double
bonds. Typical polyols used are glycols such as ethylene glycol. The usual
polycarboxylic acids used are phthalic acid and maleic acid. Water, which is a by-
product of this esterification reaction, is removed from the reaction mass as soon
as it is formed to drive the reaction to completion.
Polyester resins are produced by different reactions such as the
esterification of acids or alcoholysis or acidolysis of epoxies, etc. The wide
selection of raw materials available allows a very large choice of finished
products, with a wide range of properties. Polyester polyols are obtained by using
a stoichiometric excess of di- or polyfunctional alcohols over the acid monomers
during manufacture, which produces polyester backbones with hydroxyl reactive
groups. The selection of raw materials and conditions of polymerization will
produce polyesters with primary or secondary hydroxyl groups. The position of
these groups will have a strong effect on the final properties of the polyurethane,
especially reactivity. Polyester resin is used for casting, auto body repair, wood
48. Y. L. Liu, C. S. Wu and K. Y. Hsu. Flame retardant epoxy resins from o-
cresol novolac epoxy cured with a phosphorus containing aralkyl novolac.
J. Polym. Sci. Part A, 40, 2329-2339, 2002.
Literature Survey on…
29
filling, and as an adhesive. It has good wear and adhesive properties, and can be
used to repair and bond together many different types of materials. Polyester
resin has good longevity, fair UV resistance, and good resistance to water. It is
important to recognize that all polyester resin products are not created equal;
their chemical makeup is complex and can have a wide range of properties. As
filler in auto repair, for example, this material is formulated for superior adhesion
to paints and metals.
Epoxy resin possessing the secondary hydroxyl groups can be used as
polyols. Special silicone resins are especially suitable for the heat stable PU
coatings. Vinyl polymers alone or in combination with other polyols can be
effectively used as polyols. Also the vegetable or plant oils such as castor oil,
linseed oil, tall oil, etc. can be used as polyols. Coal tar contains numerous
groups with active hydrogen so it can also be used as polyols.
[C] LITERATURE SURVEY ON POLYURETHANE RESINS
Polyurethanes (PUs) are known to be very attractive materials for various
applications such as electrical/electronic potting and encapsulation,
constructions, water proofing membranes, asphalt extended membranes,
highway sealants, sound and vibration damping, automotive and rubber parts,
etc. Due to their unique property, they offer the elasticity of rubber combined with
the toughness and durability of plastics. Polyurethanes form an important class of
polymers, whose structures and performances can be designed to meet the
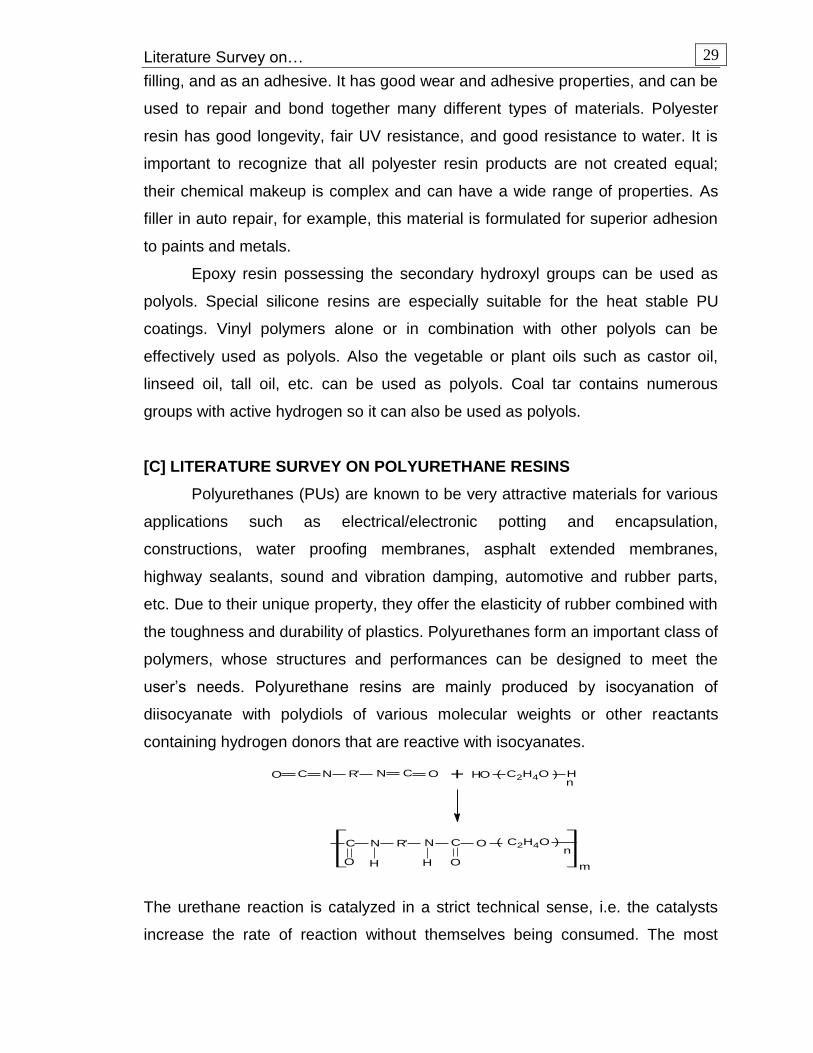
user‟s needs. Polyurethane resins are mainly produced by isocyanation of
diisocyanate with polydiols of various molecular weights or other reactants
containing hydrogen donors that are reactive with isocyanates.
The urethane reaction is catalyzed in a strict technical sense, i.e. the catalysts
increase the rate of reaction without themselves being consumed. The most
R' NN CC OO + C2H4O HHOn
R' NN CC O C2H4On
( )
( )
O OH H m
Literature Survey on…
30
commonly used catalysts are organo tin compound for example dibutyl
tindilaurate (DBTDL) and tertiary amines for example 1,4-diazobicyclo(2,2,2)-
octane (DABCO), and tetramethyl butane diamine (TMBDA). Polyurethane
resins are characterized by a segmented structure, consisting of flexible
segment, the polyol chains, and hard segments, crystallizability of segment,
segmental length, intra and inter segment interactions such as H-bonding, overall
compositions and molecular weight.
Polyurethanes possess a unique combination of performance and
application properties with excellent abrasion resistance, flexibility, hardness,
chemical resistance, UV light resistance and anti-microbial characteristics [49]. A
great number of factors, which affect or influence the properties of polyurethane
resins, are nature of polyol and diisocyanate, crosslinking density, NCO/OH ratio,
curing conditions, etc [50, 51]
Over the last few decades polyurethanes are widely used as adhesive
materials and have developed a reputation for reliability and high performance in
many applications including footwear industry, packaging applications, plastic
bonding, furniture assembly and the automotive industry. Polyurethanes are
rapidly developing products of coating and paint industry because of unique
combinations of performance and application properties such as excellent
elasticity, high hardness, high scratch and abrasion resistance, excellent impact
resistance, high water, solvents, acids and alkali resistance and resistance to
degradation from light and weathering. The polyurethane coated fabrics find
applications in inflatable structures, conveyer belts, protective coatings,
biomaterials, etc [52, 53].
A urethane is essentially an ester of carbamic acid or substituted carbamic
acid. The main advantage of polyurethane is that it can be tailor made to meet
49. M. X. Xu, W. G. Liu, Y. L. Guan, Z. P. Bi and K. D. Yao. Study on phase behavior-impact strength relationship of unsaturated polyester/PU hybrid polymer network. Polym. Inter., 38, 205-209, 1995.
50. J. M. Buist. Development in polyurethane-1. Applied Science Publishers Ltd. London, 1978.
51. I. S. Lin, J. Biranowski and D. H. Lorenz. Urethane chemistry and applications. K.N. Edwards, Ed; ACS Symposium Series, 172, 34, p. 523, 1981.

Literature Survey on…
31
the diversified demands of modern technologies such as coatings, adhesives,
foams, rubbers, reaction molding plastics, thermoplastic elastomers and
composites. The pioneering work on polyurethane polymers was conducted by
Otto Bayer and his coworkers in 1937 at the laboratories of I.G. Farben in
Leverkusen, Germany [54]. They recognized that using the polyaddition principle
to produce polyurethanes from liquid diisocyanates and liquid polyether or
polyester diols seemed to point to special opportunities, especially when
compared to already existing plastics that were made by polymerizing olefins, or
by polycondensation. The new monomer combination also circumvented existing
patents obtained by Wallace Carothers on polyesters [55].
In 1969, Bayer AG exhibited a plastic car in Dusseldorf, Germany. Parts of
this car were manufactured using a new process called RIM (Reaction Injection
Molding). RIM technology uses high-pressure impingement of liquid components
followed by the rapid flow of the reaction mixture into a mold cavity. Large parts,
such as automotive fascia and body panels, can be molded in this manner.
Polyurethane RIM evolved into a number of different products and processes.
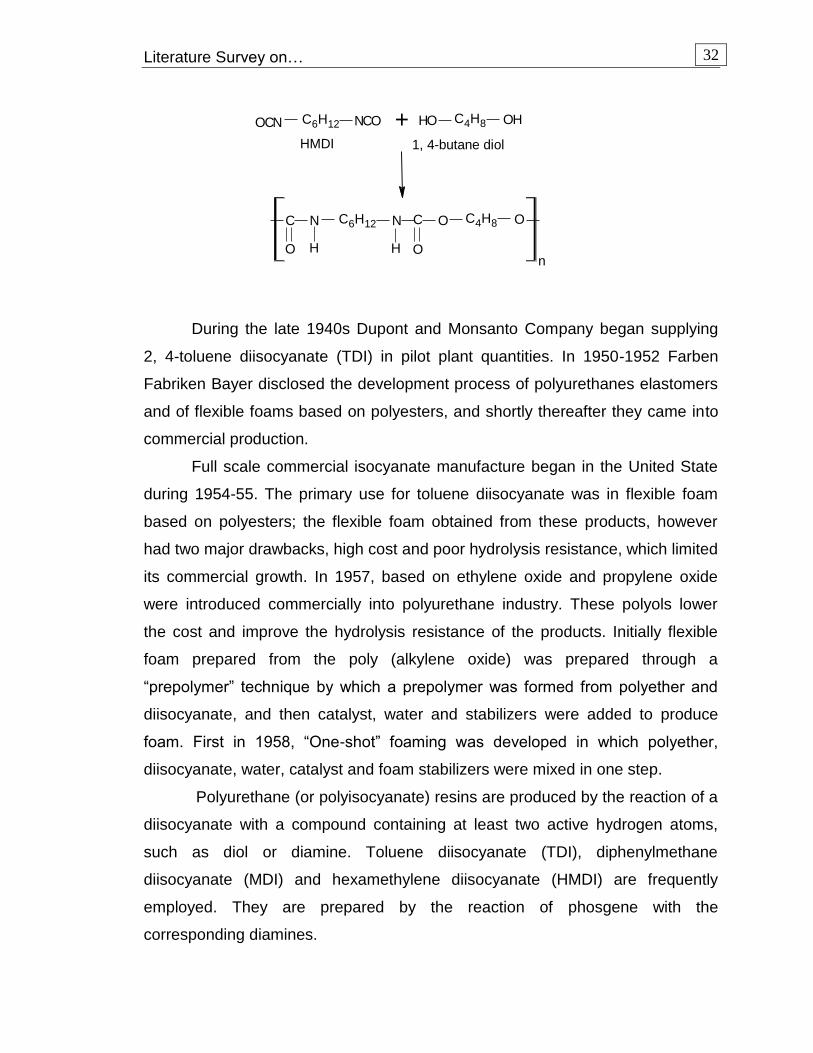
The history of polyurethane can be traced back to the 1930s in the World
War II, when Germany was looking for the synthetic material for tyre. Bayer
made aromatic diisocyanate in 1930 and he produced the first polyurethane in
1937 by reacting hexamethylene diisocyanate (HMDI) with 1, 4–butane diol
(BDO).
52. J. A. Grapski and S. L. Cooper. Synthesis and characterization of biocidal polyurethanes Biomaterials. 22, 2239-2246, 2001.
53. A. Z. Okeema and S. L. Cooper. Effect of carboxylate and/or sulphone ion incorporation on the physical and blood contacting properties of polyetherurethane. Biomaterials, 12, 668-676, 1991.
54. I. G. Farben. German Patent 728.981, 1937. 55. B. Raymond, Seymour George, B. Kauffman. Polyurethanes: A class of
modern versatile materials. J. Chem. Ed., 69, 909, 1992.
Literature Survey on…
32
During the late 1940s Dupont and Monsanto Company began supplying
2, 4-toluene diisocyanate (TDI) in pilot plant quantities. In 1950-1952 Farben
Fabriken Bayer disclosed the development process of polyurethanes elastomers
and of flexible foams based on polyesters, and shortly thereafter they came into
commercial production.
Full scale commercial isocyanate manufacture began in the United State
during 1954-55. The primary use for toluene diisocyanate was in flexible foam
based on polyesters; the flexible foam obtained from these products, however
had two major drawbacks, high cost and poor hydrolysis resistance, which limited
its commercial growth. In 1957, based on ethylene oxide and propylene oxide
were introduced commercially into polyurethane industry. These polyols lower
the cost and improve the hydrolysis resistance of the products. Initially flexible
foam prepared from the poly (alkylene oxide) was prepared through a
“prepolymer” technique by which a prepolymer was formed from polyether and
diisocyanate, and then catalyst, water and stabilizers were added to produce
foam. First in 1958, “One-shot” foaming was developed in which polyether,
diisocyanate, water, catalyst and foam stabilizers were mixed in one step.
Polyurethane (or polyisocyanate) resins are produced by the reaction of a
diisocyanate with a compound containing at least two active hydrogen atoms,
such as diol or diamine. Toluene diisocyanate (TDI), diphenylmethane
diisocyanate (MDI) and hexamethylene diisocyanate (HMDI) are frequently
employed. They are prepared by the reaction of phosgene with the
corresponding diamines.
C6H12 NCOOCN + C4H8 OHHO
C6H12N C4H8 ON CC
O OH H
O
n
HMDI 1, 4-butane diol
Literature Survey on…
33
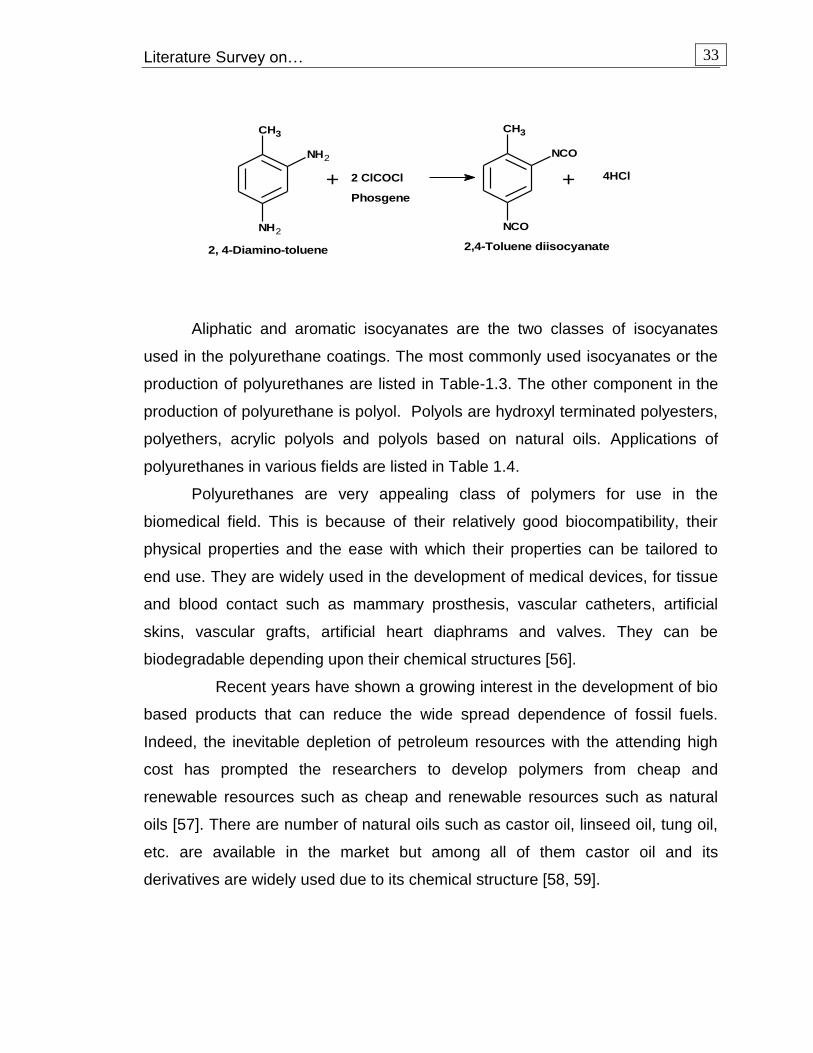
Aliphatic and aromatic isocyanates are the two classes of isocyanates
used in the polyurethane coatings. The most commonly used isocyanates or the
production of polyurethanes are listed in Table-1.3. The other component in the
production of polyurethane is polyol. Polyols are hydroxyl terminated polyesters,
polyethers, acrylic polyols and polyols based on natural oils. Applications of
polyurethanes in various fields are listed in Table 1.4.
Polyurethanes are very appealing class of polymers for use in the
biomedical field. This is because of their relatively good biocompatibility, their
physical properties and the ease with which their properties can be tailored to
end use. They are widely used in the development of medical devices, for tissue
and blood contact such as mammary prosthesis, vascular catheters, artificial
skins, vascular grafts, artificial heart diaphrams and valves. They can be
biodegradable depending upon their chemical structures [56].
Recent years have shown a growing interest in the development of bio
based products that can reduce the wide spread dependence of fossil fuels.
Indeed, the inevitable depletion of petroleum resources with the attending high
cost has prompted the researchers to develop polymers from cheap and
renewable resources such as cheap and renewable resources such as natural
oils [57]. There are number of natural oils such as castor oil, linseed oil, tung oil,
etc. are available in the market but among all of them castor oil and its
derivatives are widely used due to its chemical structure [58, 59].
CH3
NH2
NH2
+ 2 ClCOCl
CH3
NCO
NCO
+ 4HCl
2, 4-Diamino-toluene
Phosgene
2,4-Toluene diisocyanate
Literature Survey on…
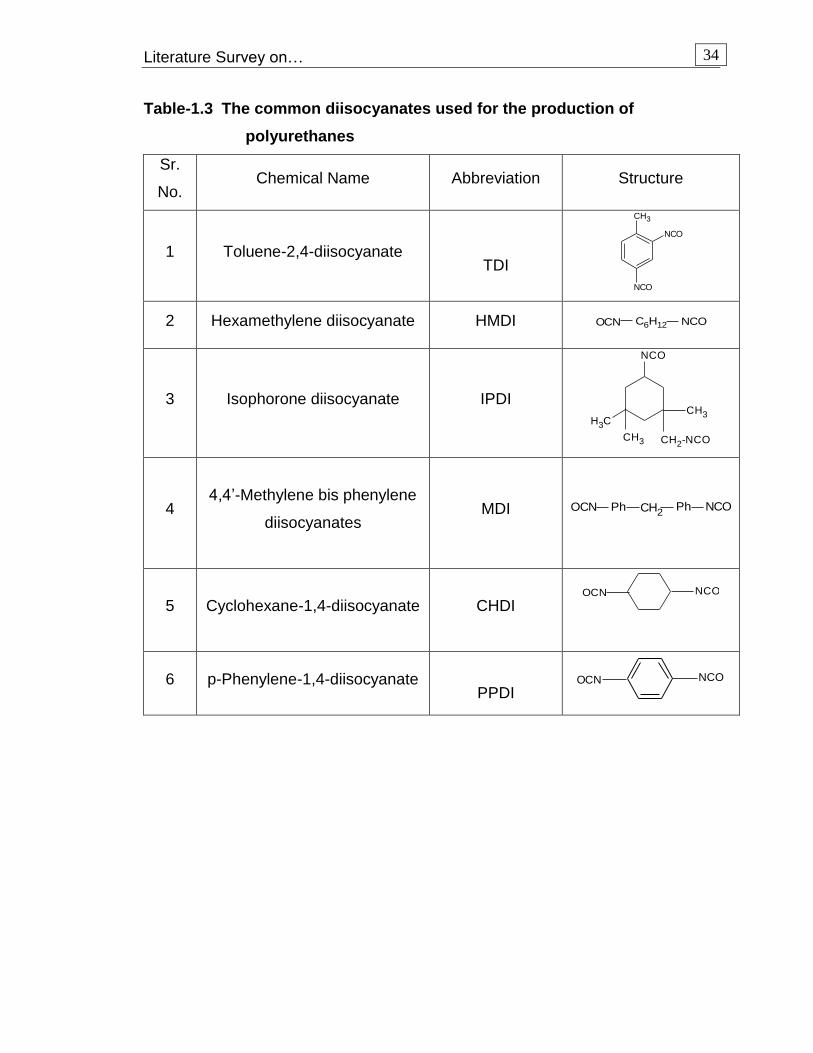
34
Table-1.3 The common diisocyanates used for the production of
polyurethanes
Sr.
No. Chemical Name Abbreviation Structure
1 Toluene-2,4-diisocyanate
TDI
CH3
NCO
NCO
2 Hexamethylene diisocyanate HMDI C6H12 NCOOCN
3 Isophorone diisocyanate IPDI CH3
NCO
CH3
CH2-NCOCH3
4
4,4‟-Methylene bis phenylene
diisocyanates
MDI CH2 PhPh NCOOCN
5
Cyclohexane-1,4-diisocyanate CHDI NCOOCN
6 p-Phenylene-1,4-diisocyanate
PPDI NCOOCN

Literature Survey on…
35
Table-1.4 Applications of polyurethanes in various fields
Application Amount of polyurethane used
(millions of pounds) Percentage of total
Building & Construction 1,459 26.8
Transportation 1,298 23.8
Furniture & Bedding 1,127 20.7
Appliances 278 5.1
Packaging 251 4.6
Textiles, Fibers & Apparel 181 3.3
Machinery & Foundry 178 3.3
Electronics 75 1.4
Footwear 39 0.7
Other uses 558 10.2
Literature Survey on…
36
Lower embedded energy as compared to other structural materials like
steel, aluminium
Composites have lower vibration transmission than metal
Long life offers excellent fatigue, impact, environmental resistance and
reduced maintenance
Composites enjoy reduced life cycle cost as compared to metals
Improved appearance with smooth surface and wood like finish
Schoener et al. [60] have synthesized moisture curable
polyurethane coating compositions with improved pot life. Such enhancement is
accomplished by blending with said coating composition a stabilized amount of
stabilizing agent from the group of a mercapto compound, a polyphenol
characterized by being reactable with an isocyanate group in the presence of a
tertiary amine catalyst, and mixtures thereof. The amounts of stabilizing agents
ranged from about 1% to 10% by weight. The enhanced pot life is realized even
in the presence of significant quantities of water.
56. R. Jayakumar, M. Rajkumar, R. Nagendran and S. Nanjundan. Synthesis
and characterization of metal-containing polyurethanes with antibacterial
activity. J. Appl. Polym. Sci., 85, 194-206, 2002.
57. G. Scott. Polymer and environment. Cambridge: Royal Society of
Chemistry, 27, 1999.
58. L. W. Barrett, L. H. Sperling, J. Gilmer and S. G. Mylonakis. Crystallization
kinetics of poly (ethylene terephthalate) in compositions containing
naturally functionalized triglyceride oil. J. Appl. Polym. Sci., 48, 1035-
1050, 1993.
59. H. Q. Xi, X. D. Huang and G. G. Wang. Electronic-ionic conducting
interpenetrating polymer networks based on (castor oil-polyethylene
glycol) polyurethane and poly(vinyl pyridine). Eur. Polym. J., 30, 1227-
1230, 1994.
60. S. E. Thomas, B. A. Blakely and G. M. Carlson. Stabilized moisture
curable PU coatings. EP 0,276,667, 1988.

Literature Survey on…
37
Ashraf et al. [61] have synthesized polyurethane from linseed oil epoxy
and have developed anticorrosive coatings from it. Trans hydroxylation of linseed
oil epoxy was carried out in situ. It is further reacted with TDI to synthesize
polyurethane. Physico-chemical characterization of the synthesized resin was
carried out as per standard methods. Structural elucidation was carried out using
IR and NMR spectral data. Physico-mechanical and weather resistance
performance of the coated samples were also studied and found that synthesized
resin showed good performance in various corrosion tests.
Mao and Li [62] have studied the damping properties of epoxy resin / PU
(EP/PU) semi interpenetrating polymer networks (IPNs) by dynamic mechanical
analysis (DMA) method. It showed that the semi IPNs have excellent damping
properties at ordinary temperature. The maximum value of tanδ is about 1 when
the weight composition of EP/PU is 70/30. Tensile tests also indicate that the
system has good tensile strength and elongation at break at this ratio. The effect
of structures on the properties of semi-IPNs is discussed. Applied to the
cavitation corrosion resistant coating, the semi-IPNs showed good cavitation
corrosion resistance.
Opera [63] has synthesized epoxy urethane acrylate from epoxy resins,
acrylic acid and 4,4‟-diphenyl methane diisocyanate using two stage
polymerization. The oligomer obtained was studied by IR and 1H NMR
spectroscopy. The oligomer was cured using thermal treatment. All of these
materials formed transparent films used for testing. The low molecular weight
oligomers can be used as solvent less coating.
Kolekar and Athawale [64] have synthesized interpenetrating networks
composed of glycerol modified castor oil based polyurethane (CG-PU) and
61. S. Ahmad, S. M. Ashraf, E. Sharmin, F. Zafar and A. Hasant. Studies on
ambient cured PU modified epoxy coatings synthesized from sustainable
resource. Prog. Cryst. Grow. Chara. Mater., 45, 83-88, 2002.
62. S. Mao and Y. Li. Study on the properties and application of epoxy
resin/PU semi-interpenetrating polymer networks. J. Appl. Polym. Sci., 61,
2059-2063, 1996.
63. S. Opera. Epoxy-urethane acrylate. Eur. Polym. J., 36, 373-378, 2000.
Literature Survey on…
38
PMMA. The effects of polyol modification, change in NCO/OH ratio and
PU/PMMA composition, mechanical, chemical and thermal properties of IPNs
were studied. It was found that among the three IPNs synthesized from (1)
unmodified castor oil PU (2) glycerol modified castor oil PU (3) glycerol modified
mixture of castor and linseed oil PU and PMMA, glycerol modified PU IPNs (CG-
IPN) exhibited better tensile strength and chemical resistance. The detailed study
of CG-IPNs revealed that tensile strength and hardness increased, while
elongation decreased with increase in NCO/OH ratio. However, an exactly
reverse trend was observed with increase in PU composition in PU/PMMA IPNs.
The chemical resistance and thermal properties of the IPNs were unaffected by
the change in NCO/OH ratio and PU/PMMA composition.
Mahesh and Alagar [65] have prepared the inter crosslinked networks of
bismaleimide modified polyurethane-epoxy systems and cured in the presence of
4,4‟-diaminodiphenyl methane. The grafting of PU onto epoxy skeleton was
confirmed by the IR spectral analysis. The prepared matrices were studied by
mechanical, thermal and morphological studies. The results revealed that the
incorporation of PU into epoxy increased the mechanical strength and decreased
the glass transition temperature and thermal stability, while incorporation of chain
extended bismaleimide into PU modified epoxy system increased the thermal
stability and tensile and flexural properties, while decreased the impact strength
and glass transition temperature. The scanning electron microscopy was carried
to study the surface morphologies of the matrices.
Prabu and Alagar [66] have prepared two different inter crosslinked
networks (ICN) of siliconized polyurethane- epoxy / unsaturated polyester (UP)
coatings. Epoxy and unsaturated polyester resins were modified with
polyurethane prepolymer and hydroxyl terminated polydimethylsiloxane
(HTPDMS) using γ-amino propyl triethoxysilane and vinyl triethoxysilane as
silane crosslinker and dibutyltindilaurate as a catalyst. The coating materials
were obtained in the form of tough films and characterized for their ASTM
64. S. Kolekar and V. Athawale. Interpenetrating polymer networks based on
polyol modified castor oil polyurethane and PMMA. Eur. Polym. J., 34,
1447-1451, 1998.
Literature Survey on…
39
methods, while thermal stability of the ICN coatings was studied using differential
thermal analysis and thermogravimetric analysis and compared with unmodified
epoxy/PU systems. The results revealed that the mechanical properties was
increased by the incorporation of the PU (10 wt %) and silicone (10 wt %), while
the thermal stability was decreased. Whereas, the incorporation of 10% silicone
into the PU modified epoxy/PU system, the thermal stability was increased due to
the partial ionic nature, high energy and thermal stability of Si-O-Si linkages have
synthesized polyurethane resins from chemoenzymatically modified castor oil
and different isocyanates and studied the difference in hardness, flexibility,
impact strength and chemical resistance, when the different isocyanate
precursors were used. The interesterification of castor oil and linseed oil was
carried out near ambient temperature using lipase as a catalyst. The resultant
interesterification product (IP) was reacted with isocyanate to form polyurethane
resins. Polyurethane synthesized by this method is light in color and compared to
conventional ones obtained from chemically catalyzed interested ification
reactions at high temperature.
Keun et al. [67] have synthesized the two component polyurethane flame
retardant coatings by blending chlorine containing modified polyesters (DCAOs)
and polyisocyanates and compared the various properties of these coatings with
non flame retardant coatings. The DCAOs used were synthesized by the
polycondensation of dichloro acetic acid, a flame retardant carboxylic acid, with
1, 4-butane diol, trimethylol propane and adipic acid. The content of dichloro
65. K. P. O. Mahesh and M. Alagar. Preparation and characterization of chain
extended bismaleimide modified polyurethane-epoxy matrices. J. Appl.
Polym. Sci., 87, 1562-1568, 2003.
66. A. A. Prabu and M. Alagar. Mechanical and thermal studies of inter-
crosslinked networks based on siliconized polyurethane-
epoxy/unsaturated polyester coatings. Prog. Org. Coatings, 49, 236-243,
2004.
67. J. Keun, K. Lee and H. Park. Syntheses and physical properties of two-
component polyurethane flame retardant coatings using chlorine
containing modified polyesters. J. Polym. Sci. Part-A, 34,1455-1464, 1996.
Literature Survey on…
40
acetic acid was varied in 10, 20 and 30% in polycondensation reaction. The
resultant flame retardant coatings were rapid drying and possessed the pot life of
8-10h. Coatings with 30% dichloroacetic acid were not fired by the vertical
burning test.
Jimenez et al. [68] have studied the effect of soft segment structure and
molecular weight on the microphase separation in segmented polyurethane
(SPU) by means of DSC, small-angle X-ray scattering, dielectric constant
measurements, pulsed nuclear magnetic resonance and thermoluminesence
Possible changes in the structural properties of SPU after cyclic mechanical
fatigue were monitored using the same technique described as above. Samples
were divided into two series according to their soft segment structure, i.e. one is
linear poly (tetramethylene glycol) (PTMG) and another with methyl group on the
PTMG chain. Hard segment consisted of 4, 4‟-diphenyl methane diisocyanate
(MDI) and 1, 4-butane diol as chain extender in both the sets. It was found that
the phase separation increased for both types of SPU as the soft segment
molecular weight increased. Samples with methyl group showed little soft
segment crystallization. Upon fatigue, samples with methyl group showed a
better fatigue resistance.
Chen et al. [69] have synthesized two parts adhesive having superior
strength at cryogenic temperatures, which contains a urethane resin composition
part and a hardner part. The urethane resin composition part comprises 50-99%
by weight of a modified polyurethane prepolymer having an epoxy group at each
of its respective end and 1-50% by weight of a modified urethane compound
having substantially no ether cyanate (NCO) groups and at least two epoxy
groups per molecule and a molecular weight less than 800 daltons. The hardener
part is a polyamine containing primary or secondary amine groups. The
equivalent ratio of the amine groups of the polyamine to the epoxy groups of the
urethane resin composition part is 0.5-2.0.
68. G. Jimenez, A. Shishido, M. Sumita and S. Asai. Effect of the soft
segment on the fatigue behavior of segmented polyurethanes. Eur. Polym.
J., 36, 2039-2050, 2000.
69. D. S. Chen, H. C. Hsia, C. C. M. Ma and W. N. Wang. Cryogenic adhesives made from epoxy terminated urethane. U.S.P. 5,484,853, 1996.
Literature Survey on…
41
Somani et al. [70] have synthesized polyurethane adhesives from different
polyester polyols. The polyester polyols were synthesized by reacting castor oil
derivatives with glycols (diols), while adhesives have been synthesized by
reacting different polyester polyols with diisocyanate adducts in different
NCO/OH ratios. The polyols and polyurethanes were characterized by FTIR
spectroscopy. The effect of NCO/OH ratios, types of isocyanate adducts, and
chain length of glycols were studied by determining wood to wood adhesion
strength, i.e. by lap shear strength measurements and the change in lap shear
strength after being placed in cold water, hot water, acid or alkali solutions was
tested. Thermal stability of PU adhesives was determined by TGA.
Papon et al. [71] have synthesized the thermoplastic polyurethane
elastomers (TPUs) of constant composition by prepolymer method and studied
the influence of synthesis condition (pre polymerization and chain-extension
time) on the final properties of TPUs. The TPUs were characterized by gel
permeation chromatography, differential scanning calorimeter, stress-strain
measurements and contact angle measurements. The adhesion properties of the
TPUs were determined by measuring the T-peel strength and found that above
the threshold value the pre polymerization time influenced the final properties of
the TPUs (viscosity of solutions, molecular weight, mechanical and adhesive
behavior), whereas chain extension time does not. Therefore this is possible to
prepare TPUs with specific properties by changing the polymerization conditions.
Papon et al. [72] have prepared thermoplastic polyurethane elastomers
(TPUs) including different amounts of rosin in their composition, which is used
either as an additive or as a reactant in the chain- extension step of the polymer
70. K. P. Somani, S. S. Kansara, N. K. Patel and A. K. Rakshit. Castor oil based PU adhesives for wood to wood bonding. Inter. J. Adhes. Adhe., 23, 269-275, 2003.
71. E. Papon, J. J. Villenave and M. S. S. Adsuar. Influence of synthesis
conditions on the properties of thermoplastic polyurethane elastomers. J.
Appl. Polym. Sci., 76, 1590-1595, 2000.
72. E. Papon, J. J. Villenave and M. S. S. Adsuar. Properties of thermoplastic
elastomers chemically modified by rosin. J. Appl. Polym. Sci., 82, 3402-
3408, 2001.
Literature Survey on…
42
synthesis. The properties of the materials are studied using solution viscosity
measurements, size exclusion chromatography, stress controlled rheometry,
differential scanning calorimetry (DSC), wide angle X-ray diffraction and contact
angle measurements. Rosin as a chain extender led to increase the viscosity and
molecular mass as well as improvements of rheological properties and changes
in morphology. The crystalline regions are more affected (variations in the
softening temperature and enthalpy) than the amorphous ones (quite constant
glass transition temperature). The rosin act as actual chain extender and
modified the organizations of both soft and hard segments of the polymers. The
adhesive properties of the TPUs were determined by measuring the T- peel
strength of the PVC/TPUs adhesive joints.
Kim et al. [73] have prepared polyurethane membranes by an immersion
precipitation method. The effect of dope concentration, coagulation bath
composition and the chemical structure of the polyurethane on the morphology of
the membranes were studied. The degree of concentration was measured by
quenching freshly formed polyurethane membranes in liquid nitrogen. A
mechanism for the formation of the membrane morphology during immersion
precipitation is proposed.
Bessaha et al. [74] have studied the role of prepolymer on the interfacial
strength of polyurethane-based assemblies for two hydroxyl-terminated
(telechelic) polybutadienes, R45M and R45HT. In this study, they showed that
two main effects have to be considered: the length of the free chains, which
could diffuse across the interface during the formation of the joint and the relative
reactivity of the various hydroxyl groups of the chains and chain extenders with
the isocyanate. The R45M chains were more efficient connectors than the
R45HT chains.
73. Y. D. Kim, J. Y. Kim, H. K. Lee and S. C. Kim. Formation of PU
membranes by immersion precipitation II.Morphology formation. ,J.
Appl.Polym. Sci., 74, 2124-2132, 1999.
74. N. Bessaha , J. Schultz , J. Maucourt , C. Combette and M. F. Vallat.
Adhesive behavior of polyurethane-based materials. J. Appl. Polym. Sci.,
76, 665-671, 2000.
Literature Survey on…
43
Migration of chain extenders and isocyanate over large distances created a
thick interphase, where physical crosslinks appeared. This interphase was
thicker for R45M-based polyurethane showing the role of the chain reactivity.
Pechar et al. [75] have synthesized the polyurethane networks (PUNs)
using polyols derived from soybean oil, petroleum, or a blend of the two in the
conjunction with diisocyanate. The soybean-based polyols (SBPs) were prepared
using air oxidation, or by hydroxylating epoxidized soybean oil. Some of the
networks were subjected to several solvents to determine their respective
swelling behavior and solubility parameters. Sol-fractions were also determined,
and DMA experiments were utilized to monitor the changes in storage modulus
and tan with temperature for networks with sol and with the sol extracted. A
linear relationship was noted between the hydroxyl number of a SBP and the
glass transition temperature of its corresponding unextracted PU network within
the range of hydroxyl numbers (i.e., 55-237 mg KOH/g) and glass transition
temperatures (i.e., -21 to +83°C) encountered in this work. This same linear
relationship was realized between the weighted hydroxyl number of soy and
petroleum-based polyol blends and the glass transition temperature of the
resulting unextracted and extracted network PUs within the ranges utilized in this
study (i.e., 44-57 mg KOH/g, -54-19°C).
Kumar et al. [76] have prepared polyethylene glycol-400 (PEG) based
polyurethane (PU) and polyacrylonitrile (PAN) semi-interpenetrating polymer
networks (SIPNs) (PU/PAN; 90/10, 70/30, 60/40 and 50/50) by sequential
polymerization method. The prepared SIPNs have been characterized by physico
75. T. W. Pechar, S. Sohn, S. Ghosh, C. E. Frazie, A. Fornof , T. E. Long and
G. L. Wilkes. Characterization and comparison of polyurethane networks
prepared using soybean-based polyols with varying hydroxyl content and
their blends with petroleum-based polyols. J. Appl. Polym. Sci., 101,
1432-1443, 2006.
76. H. Kumar, R. Somashekar, S. S. Mahesh, S. Abhishek, T. N. Guru Row,
G. S. Kini and Siddaramaiah. Structure-property relationship of
polyethylene glycol-based PU/PAN semi-interpenetrating polymer
networks. J. Appl. Polym Sci., 99, 177-187, 2006.

Literature Survey on…
44
mechanical properties. The microcrystalline parameters such as crystal size
( N ,lattice disorder (g), surface (Ds) and volume (Dv) weighted crystal size of
SIPNs were estimated using wide angle X-ray scattering studies, and
quantification of the polymer network has been carried out on the basis of these
parameters. The microstructural parameters were established using exponential,
lognormal, and reinhold asymmetric column length distribution functions and the
results are compiled.
[C] NATURAL FIBER REINFORCED COMPOSITES
Composite materials are formed by the combination of two or more
materials, which retain their respective characteristics when combined together,
but their chemical and mechanical properties are improved upon combination.
“Two or more dissimilar materials when combined are stronger than that of
individual materials.”
Today, where in world market demands for product performance are ever
increases, composite materials have proven to be effective in reducing cost and
improve in performance. Composites solve problems; raise performance levels
by development of many new materials.
History
The use of natural composite materials has been a part of man‟s
technology; the first ancient builder used straw to reinforce mud bricks.
The 12th century Mongols made the advance weapons of their day with
bows that were smaller and more powerful than their rivals. These bows were
composite structures made by combining cattle tendons, horn, bamboo, which
bonded with natural pine resin. The tendons were placed on the tense of the
bow, the bamboo was used as a core, and sheets of horn were laminated the
compression side of the bow. The entire structure was tightly wrapped using the
rosin adhesive. The 12th century weapons designers certainly understood the
principles of composite design. In the recent time some of the old museum
pieces were strung and tested.

Literature Survey on…
45
They were about 80% as some modern composite bows [77].
In the late 1800s Canoe builders were experimenting with gluing together
1st graft paper with shellac to form paper laminates. While the concept was such
the materials did not perform well.
In the year between 1870 and 1890, revolution was occurring in chemistry,
first synthetic (man made) resins were developed, which could be converted
liquid to solid polymerization. These polymer resins are transformed from liquid
state to solid state by crosslinking the molecules. Early synthetic resin included
cellulose, melamine and Bakelite.
In the early 1930s two chemical companies that were working on the
development of polymer resins were American Cyanamid and DuPont. In the
course of the experimentation, both the companies independently formulated
polyester resin first time. In the same time period, Owens-Illinois Glass Company
began the glass fiber into a textile fabric on commercial bases.
During the time between 1934 and 1936, experimenter Ray Green, in
Ohio combined these two new products and began molding small boats. This
was the beginning of modern composites. During World War II the development
of required non-metallic housings and the US military advanced fledgling
composites technology with many research projects. Immediately following war II
composite materials immersed as major engineering material.
First composites industry began in earnest in the late 1940s and
developed in 1950s. Most of the composites processing methods used today like
molding, filament winding, hand lay-up technique, resin transfer molding, vacuum
bagging were all developed and used in production between 1946 and 1950.
Some products manufactured from composites during this period included: boats
bodies (corvette), truck parts, aircrafts component, underground storage tank,
buildings and many familiar products. Composites typically use thermoset resins,
which begin as liquid polymers converted to solid during the molding process.
This process known as crosslinking is irreversible. Because of this, these
77. W. Doppler. Farmer‟s Business and Participation for Sustainable
Agriculture. Proc. of SATHLA International Conference, Rio de Janeiro,
Brazil, March-1998.

Literature Survey on…
46
polymers are known as thermosets and can not be melted and reshaped. The
benefit of composite materials have fueled growth of new application markets
such as transportation, constructions, corrosion resistance, marine infrastructure,
consumer products, electrical, aircraft and aerospace application and business
equipments.
The benefits of using composites materials include:
High strength: Composite materials can be designed to meet the specific
requirements of an application. A distinct advantage of composites over other
materials is ability to use many combinations of resins and reinforcement.
Light weight: Composites are materials that can be designed for both light
weight and high strength. In fact composites are used to produce the highest
strength to weight ratio structures known to man.
Corrosion resistance: Composites products provide long-term resistance
from severe chemical and temperature environments. Composites are the
materials choice for outdoor exposure, chemical handling application and
severe environments service.
Design flexibility: Composites have an advantage over other materials
because they can mold into complex shapes at relatively low cost. The
flexibility creating complex shapes offers designers a freedom that hallmarks
composites achievement.
Durability: Composite structures have an exceedingly along life span with low
maintenance requirements, the longevity of composite is a beneficial critical
applications. In a half–century of composite development, well-desired
composite structures have yet to wear out.
Compare a ¼ inch diameter steel rod to a ¼ inch diameter glass fiber
composites rod. The steel rod will have higher tensile strength and compressive
strength, but weight is more. If the fiber glass rod were increased in diameter to
the same weight as steel rod, it would be stronger [78].
Automotive industries in Europe show large interest in NFC (Natural Fiber
Composite) that can be used in load bearing elements of cars. Some of the
78. Composites Fabricators Association–The Composites Industry
Overview-2003.
Literature Survey on…
47
beneficial points for using composites over conventional ones are below [79].
Tensile strength of composites is four to six times greater than that of steel
or aluminium
Improved torsional stiffness and impact properties
Composite have higher fatigue endurance limit (up to 60% of ultimate
tensile strength)
Composite materials are 30-45% lighter than aluminium structures
designed to the same functional requirements
Lower embedded energy compared to other structure materials like steel,
aluminium, etc.
Composites are more versatile than metals and can be tailored to meet
performance needs and complex design requirements
Long life offers, excellent fatigue, impact, environmental resistance and
reduced maintenance
Composites enjoy reduced life cycle cost compare to metals
Composite exhibit excellent corrosion resistance and fire retardancy
Improved appearance with smooth surfaces and readily incorporable
integral decorative melamine are other characteristics of composites
Composite parts can eliminate joints/ fasteners, providing part by
simplification and integrated design compared to conventional metallic
parts.
Different types of fibers for reinforcement and study of their properties. Natural
cellulose based fibers are gaining attention as their application is diversified into
engineering end uses such as building materials and structural parts for motor
vehicles [80, 81], where light weight is required. There are at least 1000 types of
plant that bear usable fibers [82].
79. U. Gayer and Th. Schuh. Automotive applications of Natural Fiber
Composites. First International Symposium on ligno-cellulosic Composites
–UNESP- Sao Paulo State, 1999.
80. A. Maguno. 2nd International Wood and Natural Fiber Composites
Symposium. Kassel, Germany, 29-1, June 28-29, 1999.
Literature Survey on…
48
Khan et al. [83] have fabricated jute reinforced polyurethane composites
under gamma irradiation. Thick polymer film was prepared under gamma
irradiation using urethane acrylate in the presence of N-vinyl pyrrolidone, ethyl
hexyl acrylate, and trimethylol propane triacrylate. Both jute dust and hessain
cloth (jute fabric) were used to constitute composites based on the prepared
resin matrix. Some of their mechanical and physical properties were studied.
Some additives such as acetic acid, acrylamide, urea, talc and titanium
oxide were incorporated into the formulation to investigate their effect on the
physical and mechanical properties, water absorption and weathering resistance
of the resin and composites were also investigated.
Tay et al. [84] have fabricated oil palm empty fruit bunch composites with
polyethylene glycol (PEG) molecular weight (MW) of 200 (PEG-200), 400 (PEG-
400), polypropylene glycol (PPG) with MW of 400 (PPG-400) used as polyols.
The effect of isocyanate (NCO) / hydroxyl (OH) ratio and PPG-400/ PEG-400
ratio on the impact strength, dimensional stability (immersion test), and thermal
behavior were investigated. The study revealed that, as NCO/OH ratio was
increased from 0.8 to 1.1 the impact strength and enthalpy increased, while
swelling of composites either in water or DMF and onset and peak temperatures
decreased. While for NCO/OH ratio above 1.1 the onset and peak temperature
increased, while enthalpy decreased due to formation of allophanates. Thermal
81. H. A. Al-Qureshi. 2nd International wood and natural fiber composites
symposium, Kassel, Germany, 32-1, June 28-29, 1999.
82. J. Robson, J. Hague, G. Newman, G. Jeronimidis and M. P. Ansell. Report
No. EC/ 431/ 92 to DTI LINK, Structural Composites Committee. January
1993.
83. Y. S. Yeo, G. S. Tay, A. Abubakar and H. D. Rozman. The mechanical
and physical properties of PU composites based on rice husk and PEG.
Polymer Testing, 22, 617-623, 2003.
84. G. S. Tay, A. Abubakar and H. D. Rozman. Oil palm EFB-PU composites:
The extent of NCO/ glycol ratio, glycol type and glycol mixture on the
impact strength, dimensional stability and thermal properties. Polym.
Plast. Technol. Eng., 42, 811-826, 2003.

Literature Survey on…
49
behavior of the composites made from the glycol mixture was predominantly
influenced by the PPG -400.
Tay et al. [85] have fabricated the oil palm EFB-PU composites and
investigated the effect of isocyanate (NCO)/ glycol (OH) ratio, glycol type and
mixtures [polyethylene glycol PEG-400 (MW- 400) and polypropylene glycol PPG
(MW-400)] on the flexural properties. Composites made with PEG-200 exhibited
higher flexural properties than with PEG-400 and PPG-400. The flexural
properties were also found to be influenced by the PPG-400/ PEG-400 ratio.
Wolcott et al. [86] have fabricated ligno cellulosic fiber reinforced PU
composites using difunctional and trifunctional poly(propylene oxide) based
polyol. The mechanical properties of the composites were found to depend on
the type of fiber and accessibility of hydroxyl functionality on the fiber. Dynamic
mechanical analysis, swelling behavior and scanning electron micrographs of
failure surfaces all provided the evidence of a substantial interface in the
composites that directly impacted the performance properties. Trifunctional
polyols generally increased the strength and stiffness, regardless of fiber type.
The data suggested that synthetic polyol functionality and relative accessibility of
the internal polymer structure of the fiber wall are dominant factors in determining
the extent of interphase development. In order to save a crop from extinction and
to ensure a reasonable return to the farmers, non-traditional outlets have to be
explored for the fiber. One such avenue is in the area of fiber-reinforced
composites. Such composites can be used as a substitute for timber as well as in
number of less demanding applications [87].
In order to save a crop from extinction and to ensure a reasonable return
to the farmers, non-traditional outlets have to be explored for the fiber. One such
avenue is in the area of fiber-reinforced composites. Such composites can be
85. G. S. Tay, A. Abusamah and H. D. Rozman. The effect of glycol type,
glycol mixture and isocyanate/glycol ratio on flexural properties of oil palm
EFB-PU composites. J. Wood Chemi. Technol., 23, 249-260, 2003.
86. M. P. Wolcott, J. M. Nassar and T. G. Rials. Interfacial contributions in
lignocellulosic fiber reinforced PU- composites. J. Appl. Polym. Sci., 80,
546-555, 2001.
Literature Survey on…
50
used as a substitute for timber as well as in number of less demanding
applications [87].
The estimated global tonnage of fibrous raw material from agricultural
crops is provided in Table 1.5 [88]. Jute, sisal, banana and coir, the major
sources of natural fibers are grown in many parts of the world. Some of them
have aspect ratios (ratio of length to diameters) > 1000 and can be woven easily.
These fibers are extensively used for cordage, sacks, fishnets, matting and rope
and as filling for mattresses and cushions. Cellulosic fibers are obtained from
different parts of plants, e. g. Jute are obtained from stem; sisal, banana and
pineapple from the leaf; cotton from seeds; coir from fruit, vegetables. The
properties of some of the natural fibers are compared in Table-1.6 [89]. The
comparison of mechanical properties for jute and glass fibers [90] is given in
Table-1.7. Jane L. O‟Dell has reported the comparative properties of lingo
cellulosic fibers with glass and carbon fibers [91]. The comparisons of properties
of different fibers are given in Table-1.8.
87. S. Biswas, G. Srikanth and S. Nangia. Development of Natural Fiber
Composites in India-Composites 2001 convention and Trade show,
Composites Fabricators Association. October 3- 6, 2001, Tampa – FL, USA.
88. R. Kozlowski. A report on Green Fibers and Their Potential in Diversified
Application, Institute of Natural Fibers, Poland, 2003.
89. S. Nangia and S. Biswas. Jute composite: Technology and business
Opportunities in News and Views, 2003.
90. Jane L. O‟Dell. Natural fibers in Resin Transfer Molded Composites. The
fourth International Conference on Wood Fiber-Plastic Composites, Forest
Products Society, Madison, 1997.
91. M. K. Sridhar, G. Basavarappa, S. G. Kasturi and N. Balasubramaniam.
Mechanical properties of jute / polyester composites. Indian J. Tech., 22,
213-218, 1984.
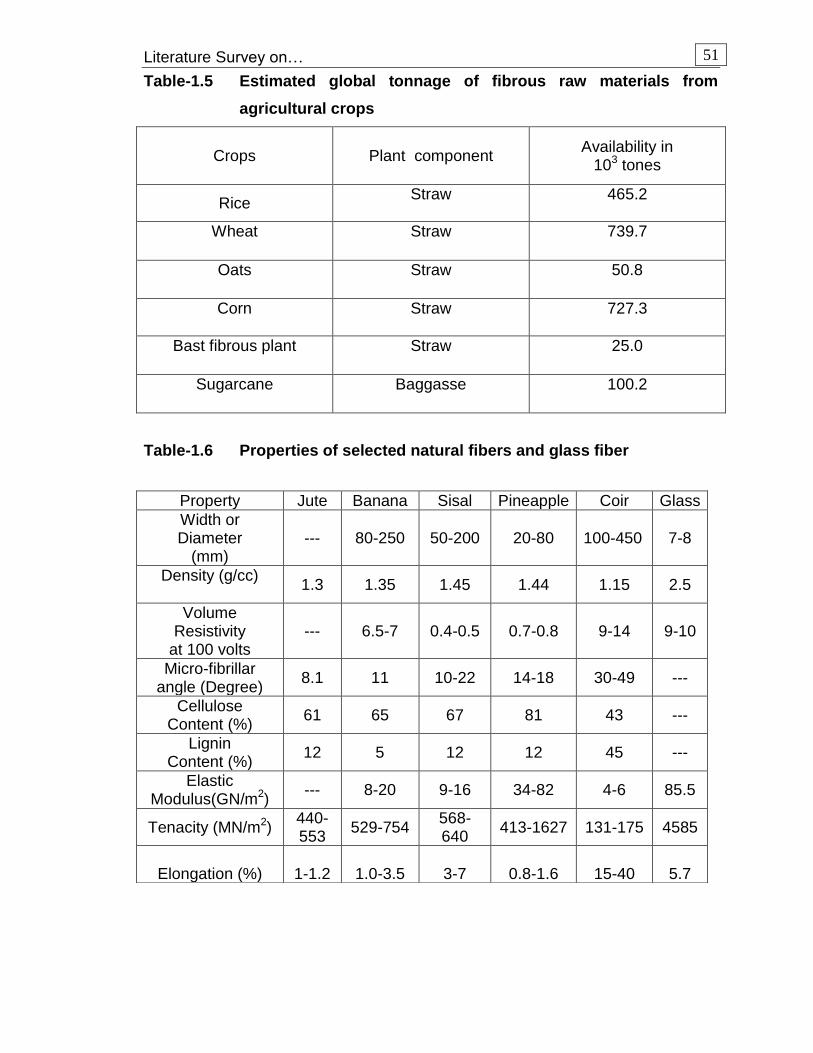
Literature Survey on…
51
Table-1.5 Estimated global tonnage of fibrous raw materials from
agricultural crops
Crops Plant component Availability in 103 tones
Rice Straw 465.2
Wheat Straw 739.7
Oats Straw 50.8
Corn Straw 727.3
Bast fibrous plant Straw 25.0
Sugarcane Baggasse 100.2
Table-1.6 Properties of selected natural fibers and glass fiber
Property Jute Banana Sisal Pineapple Coir Glass Width or Diameter
(mm) --- 80-250 50-200 20-80 100-450 7-8
Density (g/cc) 1.3 1.35 1.45 1.44 1.15 2.5
Volume Resistivity
at 100 volts --- 6.5-7 0.4-0.5 0.7-0.8 9-14 9-10
Micro-fibrillar angle (Degree) 8.1 11 10-22 14-18 30-49 ---
Cellulose Content (%) 61 65 67 81 43 ---
Lignin Content (%) 12 5 12 12 45 ---
Elastic Modulus(GN/m2) --- 8-20 9-16 34-82 4-6 85.5
Tenacity (MN/m2) 440-553 529-754 568-
640 413-1627 131-175 4585
Elongation (%)
1-1.2
1.0-3.5
3-7
0.8-1.6
15-40
5.7

Literature Survey on…
52
Table-1.7 Mechanical properties of glass and jute fibers
Table-1.8 Comparison of properties of different fibers
Property E-Glass Jute
Specific gravity 2.5 1.3
Tensile strength
(MN/m2) 3400 442
Young‟s modulus
(MN/m2) 72 55.5
Specific strength
(MN/m2) 1360 340
Specific modulus 28.8 42.7
Fiber Specific
gravity
Specific
tensile strength
(GPa)
Cost
(US $ / ton)
Energy to
Produce
(GJ / ton)
Lignocellulosic 0.6-1.2 1.6-2.95 200 - 1000 4
Glass 2.6 1.35 1,200 – 1,800 30
Carbon 1.8 1.71 12,500 130
Literature Survey on…
53
The attractive features of natural fibers like jute [92-93], sisal [94], coir [95,
96], and banana [97] are their low cost, light weight, high specific modulus,
renewability and biodegradability. Many plant fibers have lots of applicable part
as commercialized materials are concerned. One of the common and very
critical environmental solutions is biodegradable nature of all these natural fibers,
which increases their demand in world composite manufacture markets. Plant
fibers are composed of cellulose, hemicellulose and lignin. Other components,
usually regarded as surface impurities, are pectin and wax substances (Table-
1.9) [98].
Diversified uses of green fibers
Global trends towards sustainable development have brought to light
natural, renewable, biodegradable raw materials. Science and technology
continue in extending their use in textile and other industries. Recent achieve-
ments and new applications of green fibers and associated products, bast fibrous
92. P. Kumar. Mechanical behavior of jute fiber and their composites. Indian J.
Tech., 24, 29-32, 1986.
93. A. N. Shah and S. C. Lakkad. Mechanical properties of jute reinforced
plastics. Fiber Sci. Tech., 15, 41-45, 1981.
94. E. T. N. Bisanda and M. P. Ansell. The effect of silane treatment on the
mechanical and physical properties of sisal-epoxy composites. Compos.
Sci. Tech., 41, 165-78, 1991.
95. S. V. Prasad, C. Pavithran and P. K. Rohatgi. Alkali treatments of coir
fibers for coir-polyester composites. J. Mater. Sci., 18, 1443-1449, 1983.
96. J. Rout, M. Mishra, S. K. Nayak, S. S. Tripathy and A. K. Mohanty. Effect
of surface modification of coir fiber on physico-mechanical behavior of
coir-polyester composites In: A. K. Ghosh, editor. Polymers beyond AD
2000, P. 489-91, 1999
97. L. A. Pothan, S. Thomas and N. R. Neelakantan. Short banana fiber
reinforced polyester composites: Mechanical, failure ageing
characteristics. J. Reinforced Plastics, 16, 744-751, 1997.
98. L. Y. Mwaikambo and Martin P. Ansell. Chemical modification of hemp, sisal, jute and kapok fibers by alkalization. J. Appl. Polym. Sci., 84, 2222-2236, 2002.
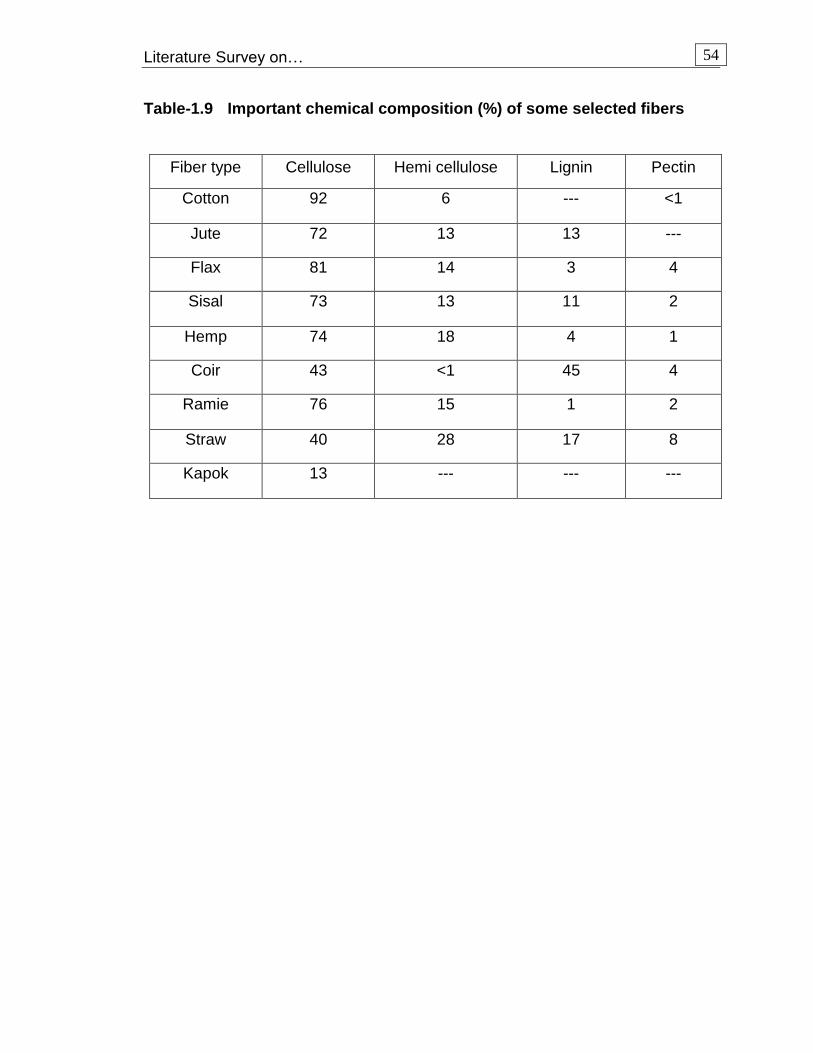
Literature Survey on…
54
Table-1.9 Important chemical composition (%) of some selected fibers
Fiber type Cellulose Hemi cellulose Lignin Pectin
Cotton 92 6 --- <1
Jute 72 13 13 ---
Flax 81 14 3 4
Sisal 73 13 11 2
Hemp 74 18 4 1
Coir 43 <1 45 4
Ramie 76 15 1 2
Straw 40 28 17 8
Kapok 13 --- --- ---
Literature Survey on…
55
plants can provide from the background for following conclusions:
1. Fast growing population, eco and health awareness creates large space
for future expansion of other than cottons, natural cellulosic fibers.
2. Present achievements in breading/production/ processing extended the
use of bast fibers in textiles. To make the way for these, difficult in
processing fibers, into textile production being beyond their reach for
centuries, it was necessary to develop : new, softer, finer 100 percent bast
or bast blended yarns, amongst them knitting yarns; new crease- resistant
finishing treatments; new products, which could meet the needs of
demanding apparel sector.
3. All the textile goods made on the basis of green fibers can boast high
comfort / health properties and are ecological items. They can be labeled
as “NATURAL”. This is the key to market success.
4. Green fibers / bast fibrous plants will also be used in growing amounts in
wide spectrum of biocomposites materials. Being lignocellulosic they can
be combined with man-made or natural polymers to provide a wide range
of useful composites in textiles.
AIMS AND OBJECTIVES
In the field of polymers, these have always been and will continue to be a
need for new and novel resins and polymers for the economically viable and
environmental beneficial applications. Our efforts are focused on use of the
agriculture waste fibers in order to fabricate composites and polyurethane resins
for coating and adhesive applications.
I. To collect literature on syntheses and characterization of monomers,
resins, and their applications.
II. To synthesize and modify resins and evaluate their thermal, mechanical
and electrical properties.
III. To fabricate jute composites and evaluate their mechanical and electrical
properties.
IV. To study water absorption behavior of the composites in various
environments.

Chapter – 2
Syntheses of monomers,
epoxy and epoxy esters
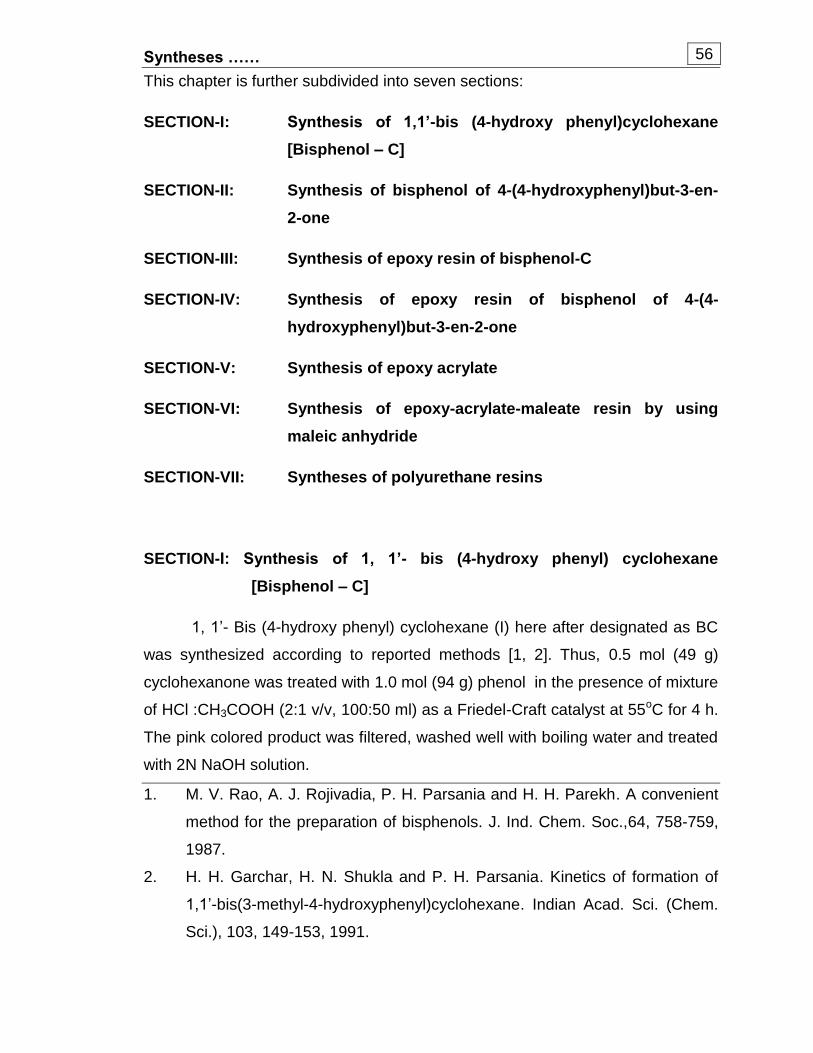
Syntheses …… 56
This chapter is further subdivided into seven sections:
SECTION-I: Synthesis of 1,1’-bis (4-hydroxy phenyl)cyclohexane
[Bisphenol – C]
SECTION-II: Synthesis of bisphenol of 4-(4-hydroxyphenyl)but-3-en-
2-one
SECTION-III: Synthesis of epoxy resin of bisphenol-C
SECTION-IV: Synthesis of epoxy resin of bisphenol of 4-(4-
hydroxyphenyl)but-3-en-2-one
SECTION-V: Synthesis of epoxy acrylate
SECTION-VI: Synthesis of epoxy-acrylate-maleate resin by using
maleic anhydride
SECTION-VII: Syntheses of polyurethane resins
SECTION-I: Synthesis of 1, 1’- bis (4-hydroxy phenyl) cyclohexane
[Bisphenol – C]
1, 1’- Bis (4-hydroxy phenyl) cyclohexane (I) here after designated as BC
was synthesized according to reported methods [1, 2]. Thus, 0.5 mol (49 g)
cyclohexanone was treated with 1.0 mol (94 g) phenol in the presence of mixture
of HCl :CH3COOH (2:1 v/v, 100:50 ml) as a Friedel-Craft catalyst at 55oC for 4 h.
The pink colored product was filtered, washed well with boiling water and treated
with 2N NaOH solution.
1. M. V. Rao, A. J. Rojivadia, P. H. Parsania and H. H. Parekh. A convenient
method for the preparation of bisphenols. J. Ind. Chem. Soc.,64, 758-759,
1987.
2. H. H. Garchar, H. N. Shukla and P. H. Parsania. Kinetics of formation of
1,1’-bis(3-methyl-4-hydroxyphenyl)cyclohexane. Indian Acad. Sci. (Chem.
Sci.), 103, 149-153, 1991.
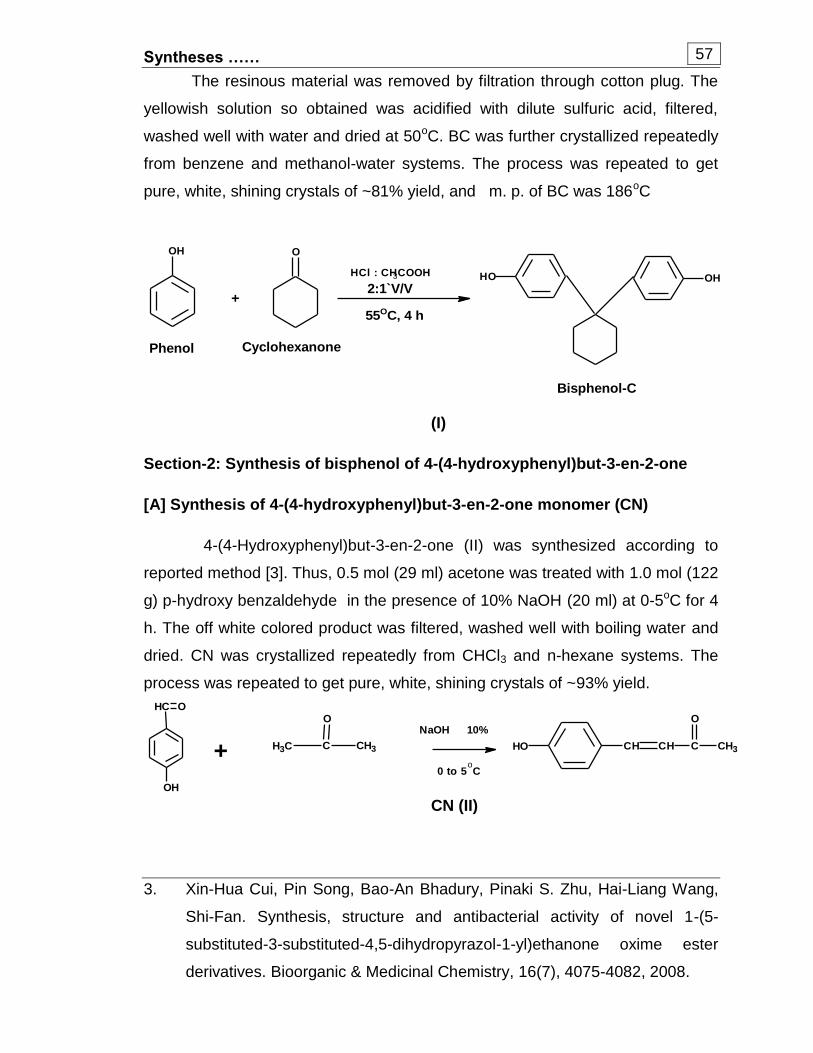
Syntheses …… 57
OH
+
O
HCl : CH3COOH
2:1`V/V
55OC, 4 h
OHHO
Phenol Cyclohexanone
Bisphenol-C
The resinous material was removed by filtration through cotton plug. The
yellowish solution so obtained was acidified with dilute sulfuric acid, filtered,
washed well with water and dried at 50oC. BC was further crystallized repeatedly
from benzene and methanol-water systems. The process was repeated to get
pure, white, shining crystals of ~81% yield, and m. p. of BC was 186oC
(I)
Section-2: Synthesis of bisphenol of 4-(4-hydroxyphenyl)but-3-en-2-one
[A] Synthesis of 4-(4-hydroxyphenyl)but-3-en-2-one monomer (CN)
4-(4-Hydroxyphenyl)but-3-en-2-one (II) was synthesized according to
reported method [3]. Thus, 0.5 mol (29 ml) acetone was treated with 1.0 mol (122
g) p-hydroxy benzaldehyde in the presence of 10% NaOH (20 ml) at 0-5oC for 4
h. The off white colored product was filtered, washed well with boiling water and
dried. CN was crystallized repeatedly from CHCl3 and n-hexane systems. The
process was repeated to get pure, white, shining crystals of ~93% yield.
CN (II)
3. Xin-Hua Cui, Pin Song, Bao-An Bhadury, Pinaki S. Zhu, Hai-Liang Wang,
Shi-Fan. Synthesis, structure and antibacterial activity of novel 1-(5-
substituted-3-substituted-4,5-dihydropyrazol-1-yl)ethanone oxime ester
derivatives. Bioorganic & Medicinal Chemistry, 16(7), 4075-4082, 2008.
OH CH CH C CH3
O
OH
CH O
+ CH3 C CH3
ONaOH 10%
0 to 5 oC
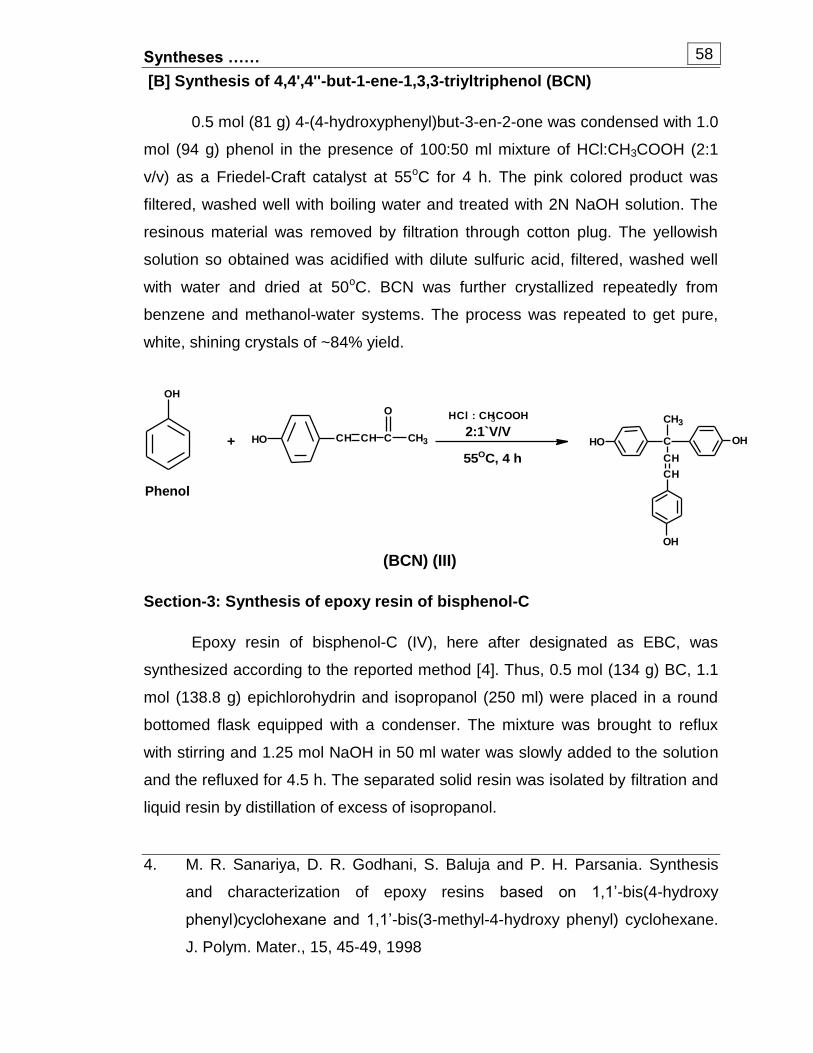
Syntheses …… 58
[B] Synthesis of 4,4',4''-but-1-ene-1,3,3-triyltriphenol (BCN)
0.5 mol (81 g) 4-(4-hydroxyphenyl)but-3-en-2-one was condensed with 1.0
mol (94 g) phenol in the presence of 100:50 ml mixture of HCl:CH3COOH (2:1
v/v) as a Friedel-Craft catalyst at 55oC for 4 h. The pink colored product was
filtered, washed well with boiling water and treated with 2N NaOH solution. The
resinous material was removed by filtration through cotton plug. The yellowish
solution so obtained was acidified with dilute sulfuric acid, filtered, washed well
with water and dried at 50oC. BCN was further crystallized repeatedly from
benzene and methanol-water systems. The process was repeated to get pure,
white, shining crystals of ~84% yield.
(BCN) (III)
Section-3: Synthesis of epoxy resin of bisphenol-C
Epoxy resin of bisphenol-C (IV), here after designated as EBC, was
synthesized according to the reported method [4]. Thus, 0.5 mol (134 g) BC, 1.1
mol (138.8 g) epichlorohydrin and isopropanol (250 ml) were placed in a round
bottomed flask equipped with a condenser. The mixture was brought to reflux
with stirring and 1.25 mol NaOH in 50 ml water was slowly added to the solution
and the refluxed for 4.5 h. The separated solid resin was isolated by filtration and
liquid resin by distillation of excess of isopropanol.
4. M. R. Sanariya, D. R. Godhani, S. Baluja and P. H. Parsania. Synthesis
and characterization of epoxy resins based on 1,1’-bis(4-hydroxy
phenyl)cyclohexane and 1,1’-bis(3-methyl-4-hydroxy phenyl) cyclohexane.
J. Polym. Mater., 15, 45-49, 1998
OH
+
HCl : CH3COOH
2:1`V/V
55OC, 4 h
Phenol
OH C OH
CH3
CH
CH
OH
OH CH CH C CH3
O
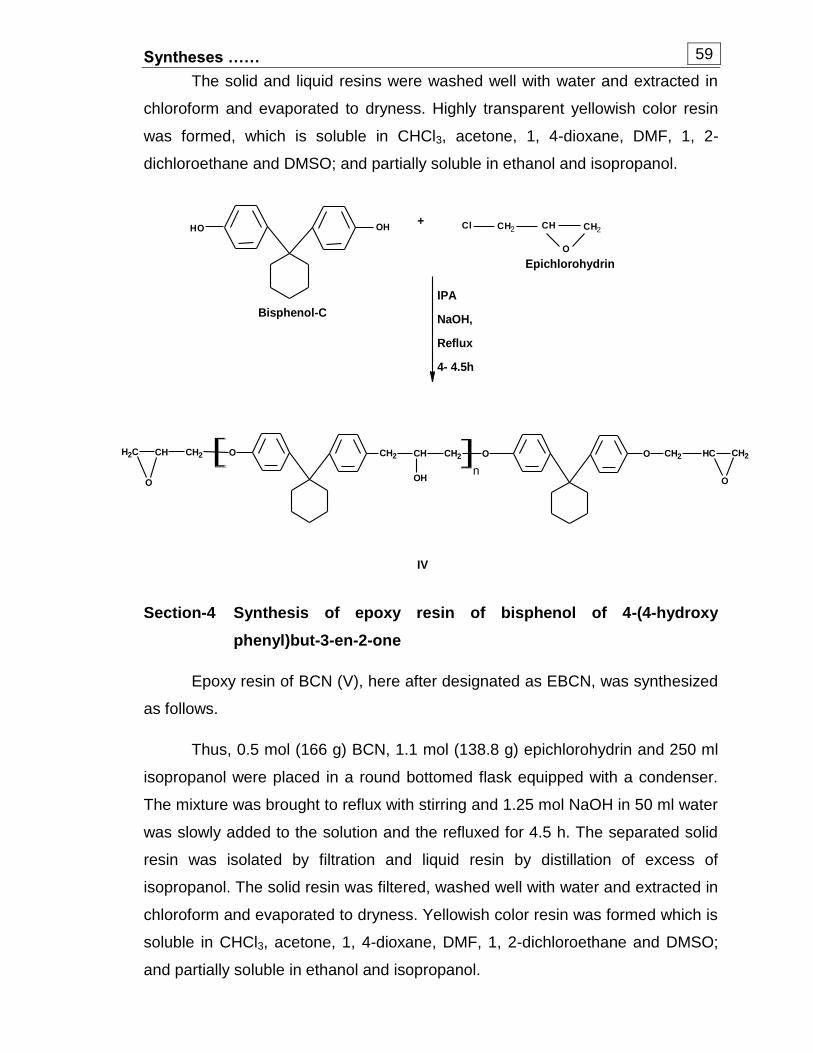
Syntheses …… 59
The solid and liquid resins were washed well with water and extracted in
chloroform and evaporated to dryness. Highly transparent yellowish color resin
was formed, which is soluble in CHCl3, acetone, 1, 4-dioxane, DMF, 1, 2-
dichloroethane and DMSO; and partially soluble in ethanol and isopropanol.
Section-4 Synthesis of epoxy resin of bisphenol of 4-(4-hydroxy
phenyl)but-3-en-2-one
Epoxy resin of BCN (V), here after designated as EBCN, was synthesized
as follows.
Thus, 0.5 mol (166 g) BCN, 1.1 mol (138.8 g) epichlorohydrin and 250 ml
isopropanol were placed in a round bottomed flask equipped with a condenser.
The mixture was brought to reflux with stirring and 1.25 mol NaOH in 50 ml water
was slowly added to the solution and the refluxed for 4.5 h. The separated solid
resin was isolated by filtration and liquid resin by distillation of excess of
isopropanol. The solid resin was filtered, washed well with water and extracted in
chloroform and evaporated to dryness. Yellowish color resin was formed which is
soluble in CHCl3, acetone, 1, 4-dioxane, DMF, 1, 2-dichloroethane and DMSO;
and partially soluble in ethanol and isopropanol.
IV
OHHO Cl CH2 CH CH2
O
Epichlorohydrin
CH2 CH
OH
CH2 OOCH2 CH
O
CH2 O CH2CH
O
CH2
IPA
NaOH,
Reflux
4- 4.5h
Bisphenol-C
n
+
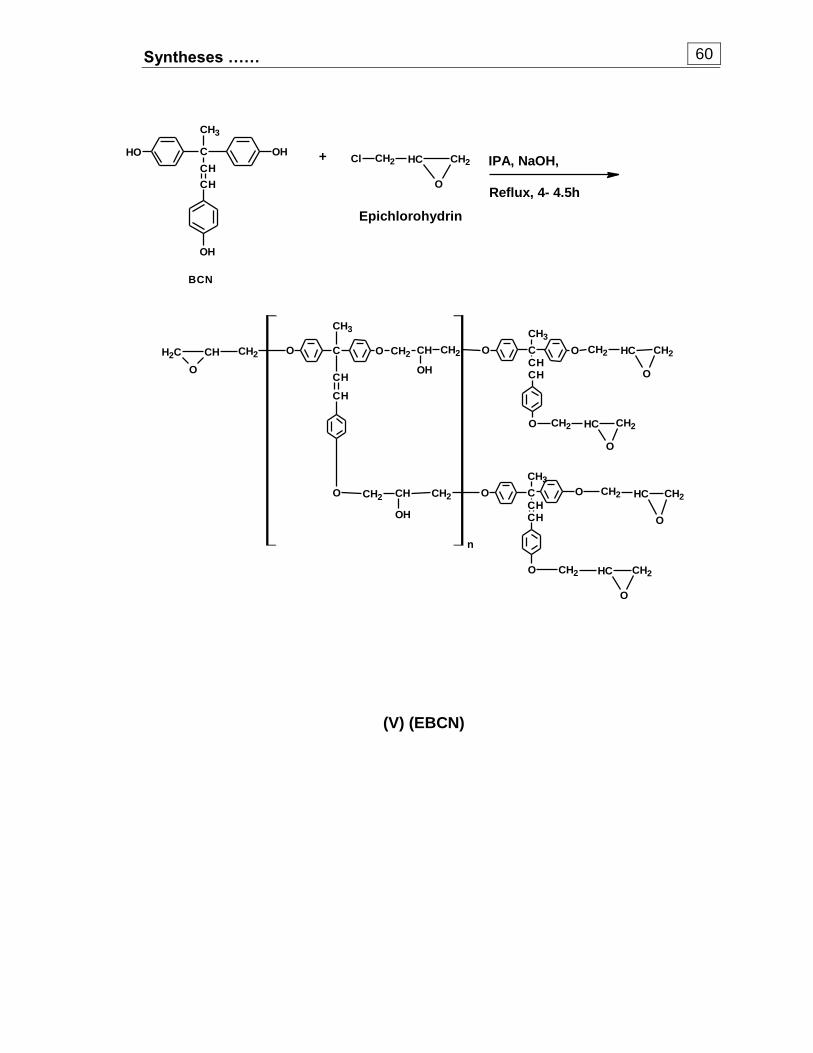
Syntheses …… 60
(V) (EBCN)
+
Epichlorohydrin
OH C OH
CH3
CH
CH
OH
Cl CH2 CH CH2
O
IPA, NaOH,
Reflux, 4- 4.5h
CH2 CH CH2
O
CH2 CH CH2
O
CO
CH3
CHCH
OCO
CH3
CHCH
CH2 CH CH2
OH
OCO
CH3
CH
CH
O
CH2 CH CH2
OH
O
CH2CHCH2
O
O
CH2 CH CH2
O
CH2 CH CH2
O
O
n
BCN
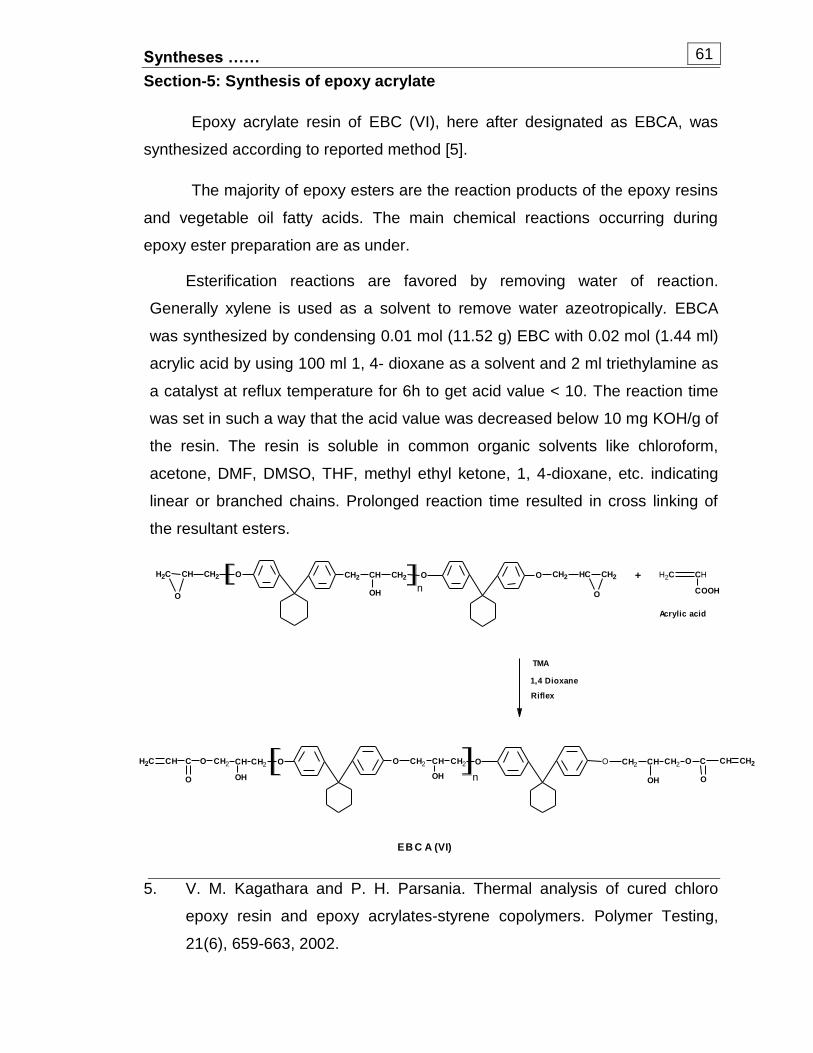
Syntheses …… 61
Section-5: Synthesis of epoxy acrylate
Epoxy acrylate resin of EBC (VI), here after designated as EBCA, was
synthesized according to reported method [5].
The majority of epoxy esters are the reaction products of the epoxy resins
and vegetable oil fatty acids. The main chemical reactions occurring during
epoxy ester preparation are as under.
Esterification reactions are favored by removing water of reaction.
Generally xylene is used as a solvent to remove water azeotropically. EBCA
was synthesized by condensing 0.01 mol (11.52 g) EBC with 0.02 mol (1.44 ml)
acrylic acid by using 100 ml 1, 4- dioxane as a solvent and 2 ml triethylamine as
a catalyst at reflux temperature for 6h to get acid value < 10. The reaction time
was set in such a way that the acid value was decreased below 10 mg KOH/g of
the resin. The resin is soluble in common organic solvents like chloroform,
acetone, DMF, DMSO, THF, methyl ethyl ketone, 1, 4-dioxane, etc. indicating
linear or branched chains. Prolonged reaction time resulted in cross linking of
the resultant esters.
5. V. M. Kagathara and P. H. Parsania. Thermal analysis of cured chloro
epoxy resin and epoxy acrylates-styrene copolymers. Polymer Testing,
21(6), 659-663, 2002.
+ CH2 CH
COOH
TMA
1,4 Dioxane
Riflex
CH2 CH
OH
CH2 OOCH2 CH
O
CH2 O CH2CH
O
CH2
n
nO CH2 CH CH2 O C
O
CH CH2
OH
OCH2CHCH2O
OH
C
O
CHCH2 O CH2 CH CH2
OH
O
Acrylic acid
E B C A (VI)
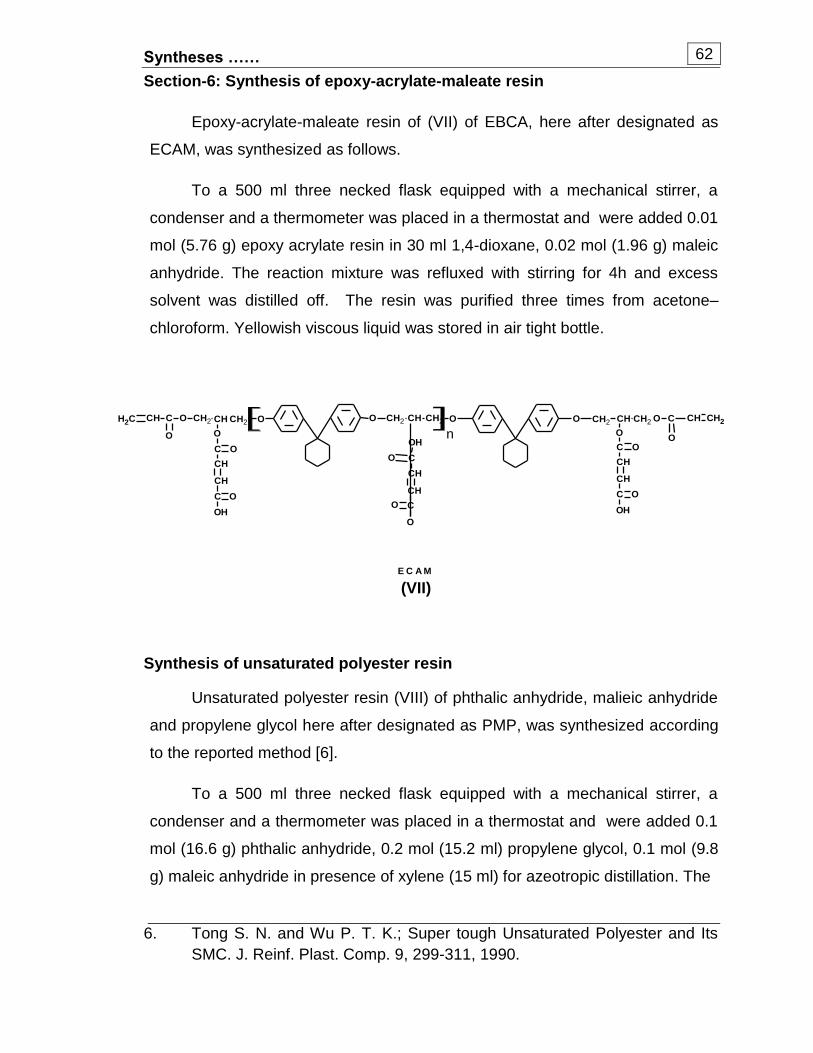
Syntheses …… 62
Section-6: Synthesis of epoxy-acrylate-maleate resin
Epoxy-acrylate-maleate resin of (VII) of EBCA, here after designated as
ECAM, was synthesized as follows.
To a 500 ml three necked flask equipped with a mechanical stirrer, a
condenser and a thermometer was placed in a thermostat and were added 0.01
mol (5.76 g) epoxy acrylate resin in 30 ml 1,4-dioxane, 0.02 mol (1.96 g) maleic
anhydride. The reaction mixture was refluxed with stirring for 4h and excess
solvent was distilled off. The resin was purified three times from acetone–
chloroform. Yellowish viscous liquid was stored in air tight bottle.
(VII)
Synthesis of unsaturated polyester resin
Unsaturated polyester resin (VIII) of phthalic anhydride, malieic anhydride
and propylene glycol here after designated as PMP, was synthesized according
to the reported method [6].
To a 500 ml three necked flask equipped with a mechanical stirrer, a
condenser and a thermometer was placed in a thermostat and were added 0.1
mol (16.6 g) phthalic anhydride, 0.2 mol (15.2 ml) propylene glycol, 0.1 mol (9.8
g) maleic anhydride in presence of xylene (15 ml) for azeotropic distillation. The
6. Tong S. N. and Wu P. T. K.; Super tough Unsaturated Polyester and Its SMC. J. Reinf. Plast. Comp. 9, 299-311, 1990.
n
E C A M
O
O CH2 CH CH2 O C CH CH2
O
OCH2CHCH2O
O
C
O
CHCH2O CH2 CH CH2
O
O
C
CH
CH
C
OH
O
C
CH
CH
C
OH
O
O
C
CH
CH
C
OH
O
O
O
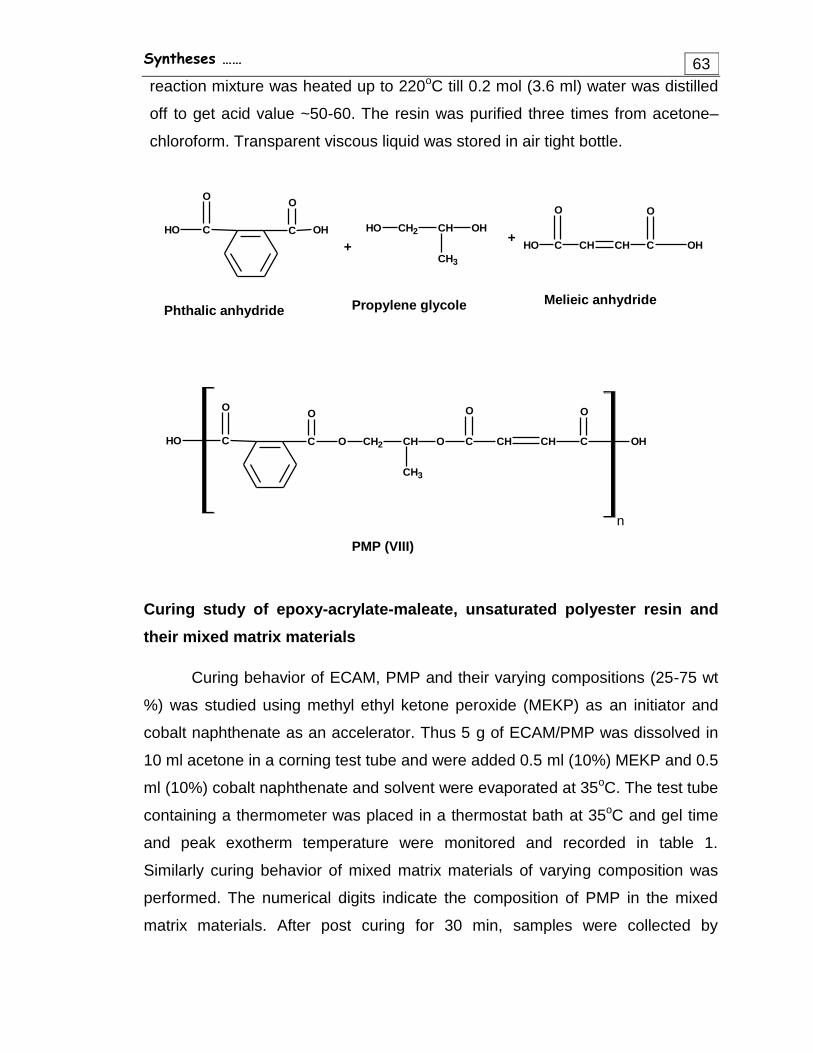
Syntheses …… 63 reaction mixture was heated up to 220oC till 0.2 mol (3.6 ml) water was distilled
off to get acid value ~50-60. The resin was purified three times from acetone–
chloroform. Transparent viscous liquid was stored in air tight bottle.
Curing study of epoxy-acrylate-maleate, unsaturated polyester resin and
their mixed matrix materials
Curing behavior of ECAM, PMP and their varying compositions (25-75 wt
%) was studied using methyl ethyl ketone peroxide (MEKP) as an initiator and
cobalt naphthenate as an accelerator. Thus 5 g of ECAM/PMP was dissolved in
10 ml acetone in a corning test tube and were added 0.5 ml (10%) MEKP and 0.5
ml (10%) cobalt naphthenate and solvent were evaporated at 35oC. The test tube
containing a thermometer was placed in a thermostat bath at 35oC and gel time
and peak exotherm temperature were monitored and recorded in table 1.
Similarly curing behavior of mixed matrix materials of varying composition was
performed. The numerical digits indicate the composition of PMP in the mixed
matrix materials. After post curing for 30 min, samples were collected by
n
C
O
OH C
O
O CH2 CH
CH3
O C
O
CH CH C
O
OH
C
O
OH C
O
OH
+
OH CH2 CH
CH3
OH+
OH C
O
CH CH C
O
OH
Phthalic anhydride Propylene glycole Melieic anhydride
PMP (VIII)
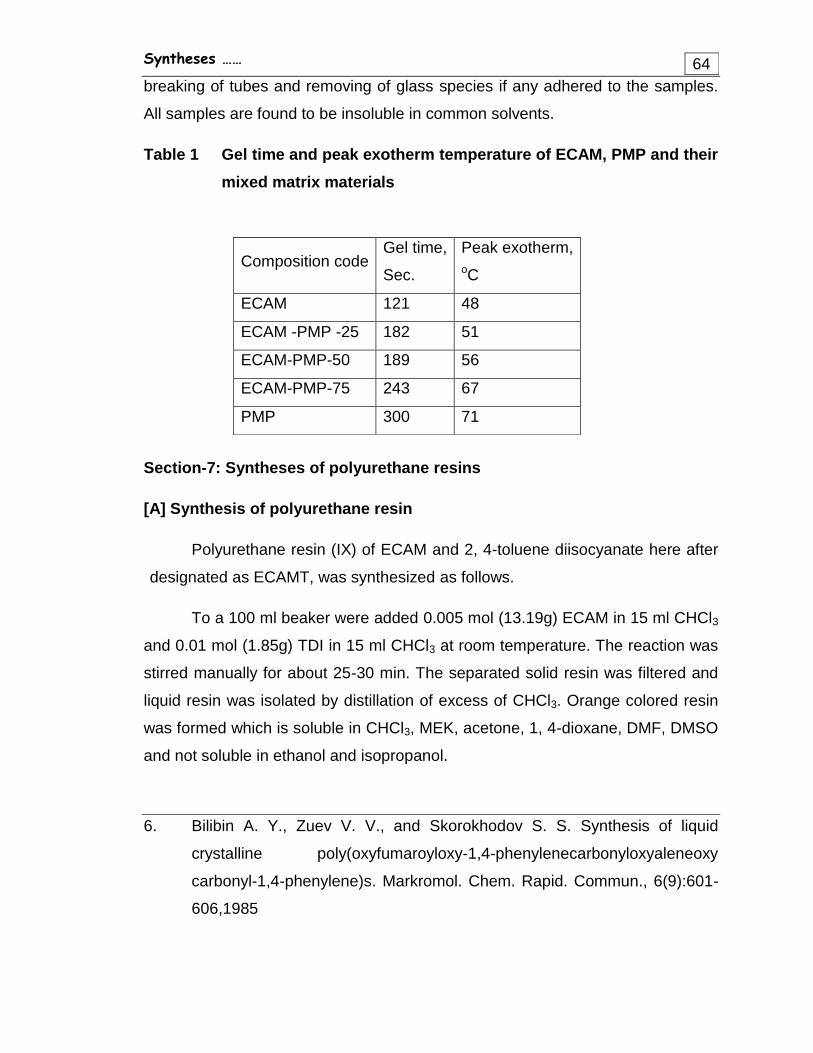
Syntheses …… 64 breaking of tubes and removing of glass species if any adhered to the samples.
All samples are found to be insoluble in common solvents.
Table 1 Gel time and peak exotherm temperature of ECAM, PMP and their
mixed matrix materials
Section-7: Syntheses of polyurethane resins
[A] Synthesis of polyurethane resin
Polyurethane resin (IX) of ECAM and 2, 4-toluene diisocyanate here after
designated as ECAMT, was synthesized as follows.
To a 100 ml beaker were added 0.005 mol (13.19g) ECAM in 15 ml CHCl3
and 0.01 mol (1.85g) TDI in 15 ml CHCl3 at room temperature. The reaction was
stirred manually for about 25-30 min. The separated solid resin was filtered and
liquid resin was isolated by distillation of excess of CHCl3. Orange colored resin
was formed which is soluble in CHCl3, MEK, acetone, 1, 4-dioxane, DMF, DMSO
and not soluble in ethanol and isopropanol.
6. Bilibin A. Y., Zuev V. V., and Skorokhodov S. S. Synthesis of liquid
crystalline poly(oxyfumaroyloxy-1,4-phenylenecarbonyloxyaleneoxy
carbonyl-1,4-phenylene)s. Markromol. Chem. Rapid. Commun., 6(9):601-
606,1985
Composition code Gel time,
Sec.
Peak exotherm, oC
ECAM 121 48
ECAM -PMP -25 182 51
ECAM-PMP-50 189 56
ECAM-PMP-75 243 67
PMP 300 71
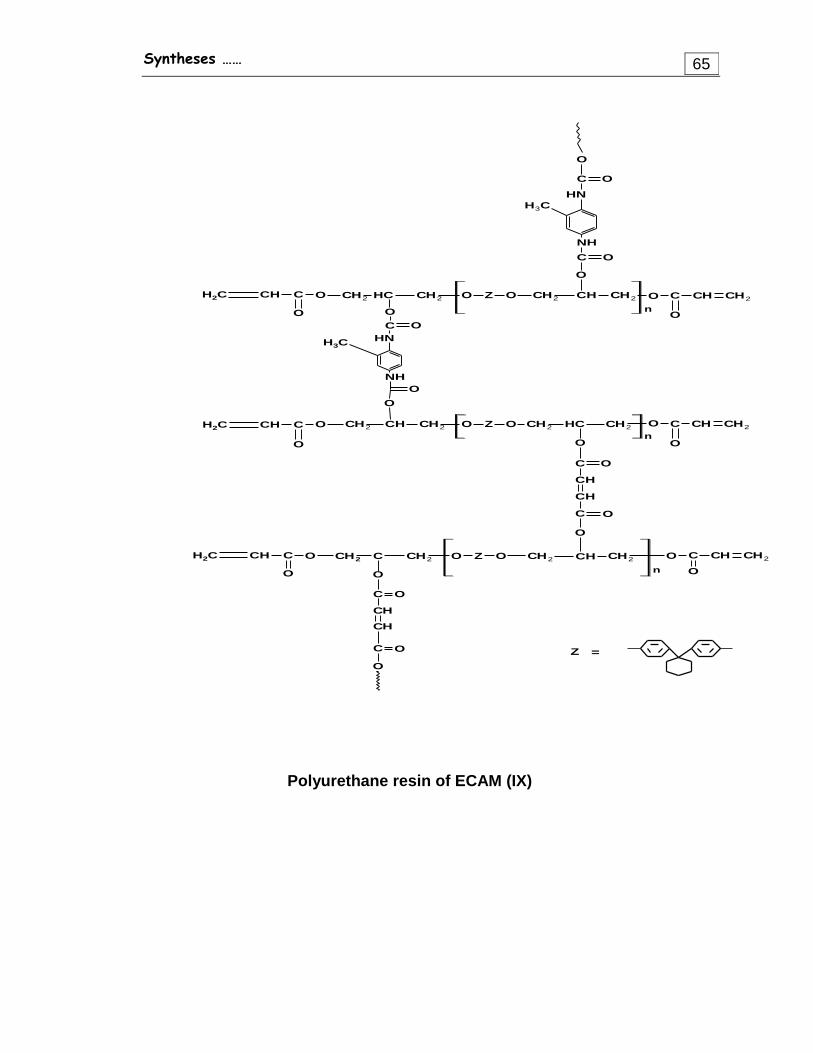
Syntheses …… 65
Polyurethane resin of ECAM (IX)
n
n
n
CH2CHC
O
OCH2CHCH2OCH2 CH C
O
O CH2 C CH2 O Z
O
CH2CHC
O
OCH2CHCH2OCH2 CH C
O
O CH2 CH CH2 O Z
CH2CHC
O
OCH2CHCH2OCH2 CH C
O
O CH2 CH CH2 O Z
C O
CH
CH
C O
O
H3C
NH
C O
O
NH
C O
O
O
C O
CH
CH
C O
O
CH3NH
C O
O
NH
O
O
Z =
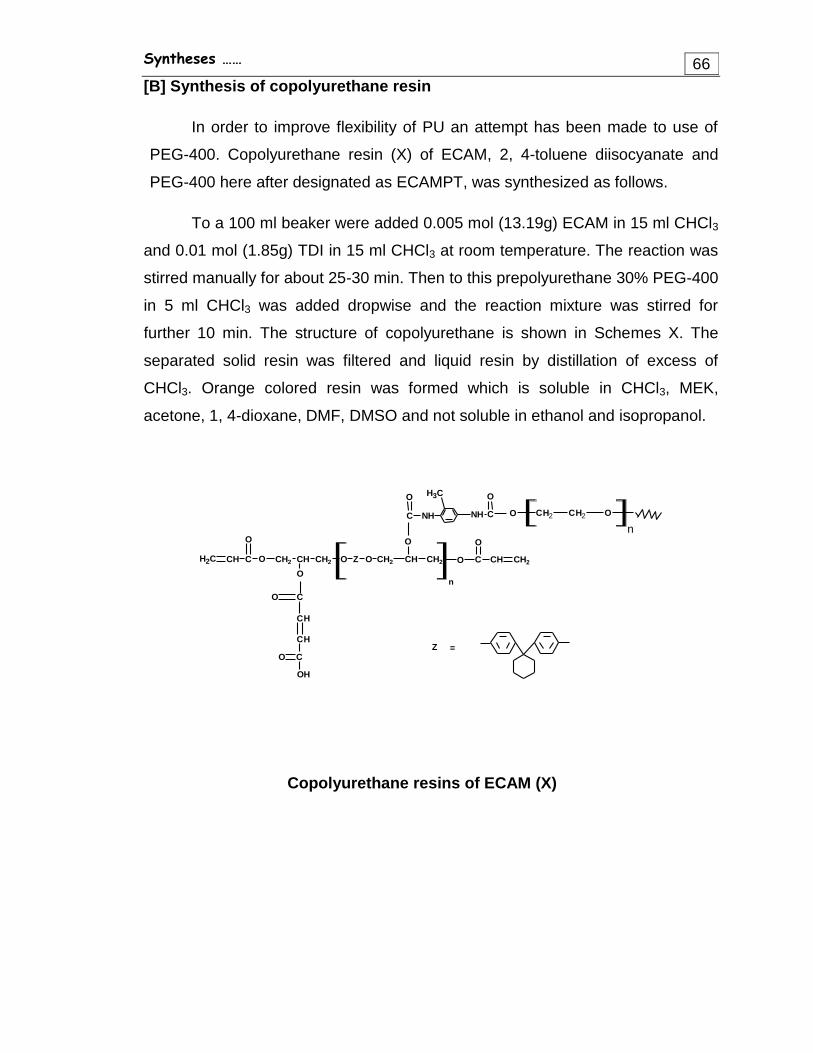
Syntheses …… 66 [B] Synthesis of copolyurethane resin
In order to improve flexibility of PU an attempt has been made to use of
PEG-400. Copolyurethane resin (X) of ECAM, 2, 4-toluene diisocyanate and
PEG-400 here after designated as ECAMPT, was synthesized as follows.
To a 100 ml beaker were added 0.005 mol (13.19g) ECAM in 15 ml CHCl3
and 0.01 mol (1.85g) TDI in 15 ml CHCl3 at room temperature. The reaction was
stirred manually for about 25-30 min. Then to this prepolyurethane 30% PEG-400
in 5 ml CHCl3 was added dropwise and the reaction mixture was stirred for
further 10 min. The structure of copolyurethane is shown in Schemes X. The
separated solid resin was filtered and liquid resin by distillation of excess of
CHCl3. Orange colored resin was formed which is soluble in CHCl3, MEK,
acetone, 1, 4-dioxane, DMF, DMSO and not soluble in ethanol and isopropanol.
Copolyurethane resins of ECAM (X)
n
Z =
CH2CHC
O
OCH2CHCH2OCH C
O
O CH2 CH CH2 O Z
O
O
CH2
NHC
O
NH C
OCH3
CH2 CH2O O
n
C
CH
CH
C
OH
O
O

Chapter – 3
Curing of resins and their
characterization

Characterization……
67
This chapter of the thesis describes the determination of epoxy equivalent
of the epoxy resins, acid and hydroxyl values of the polyester polyols, thermal,
and spectral characterization of the resins. This chapter is subdivided into five
subsections.
Section-I: Spectral characterization of monomers and resins
Section-II: Determination of epoxy equivalent of the epoxy resin
Section-III: Determination of acid values of polyester resins
Section-IV: Determination of hydroxyl values of polyester resins
Section-V: Thermal analysis of polyester and polyurethane resins
Section-I: Spectral characterization of monomers and resins
This section of the thesis includes the IR, Mass and NMR spectral
characterization of the monomers, epoxy resin, epoxy ester, unsaturated
polyester, epoxy-acylate-maleate and polyurethane resins:
[A] IR spectral characterization
IR spectroscopy is an excellent technique for the qualitative analysis
because except for optical isomers, the spectrum of compound is unique.
Information about the structure of a molecule could frequently be obtained from
its absorption spectrum. An infrared spectrum is obtained by passing infrared
radiation through a sample. A detector generates a plot of % transmission of
radiation versus the wave number or wavelength of the radiation transmitted. At
100% transmission, all the energy of radiation passes through the molecule. At
lower values of % transmission, some of the energy is being absorbed by the
compound. Each spike in the infrared (IR) spectrum represents absorption of
energy. These spikes are called absorption bands. Electromagnetic radiation with
wave numbers from 4000 to 400 cm-1 has just the right energy to correspond to
stretching and bending vibrations in molecules. Electromagnetic radiation with
Characterization……
68
this energy is known as infrared radiation because it is just below the “red region”
of visible light. (Infra is Latin word meaning “below”).
The intensity of an absorption band depends on the size of dipole moment
change associated with the vibration. In other words, depends on polarity of the
vibrating bond. Intensity of the absorption band also depends on number of
bonds responsible for the absorption. The concentration of the sample used to
obtain an IR spectrum also affects the intensity of absorption bands.
The IR spectra of resins and polymers were scanned on a Shimadzu-8400
FTIR spectrometer over the frequency range from 4000-400 cm-1. The IR
spectra of resins and polymers are shown in Figs. 3.1 to 3.10. The characteristic
IR absorption frequencies (cm-1) are reported in Tables-3.1 and 3.3.
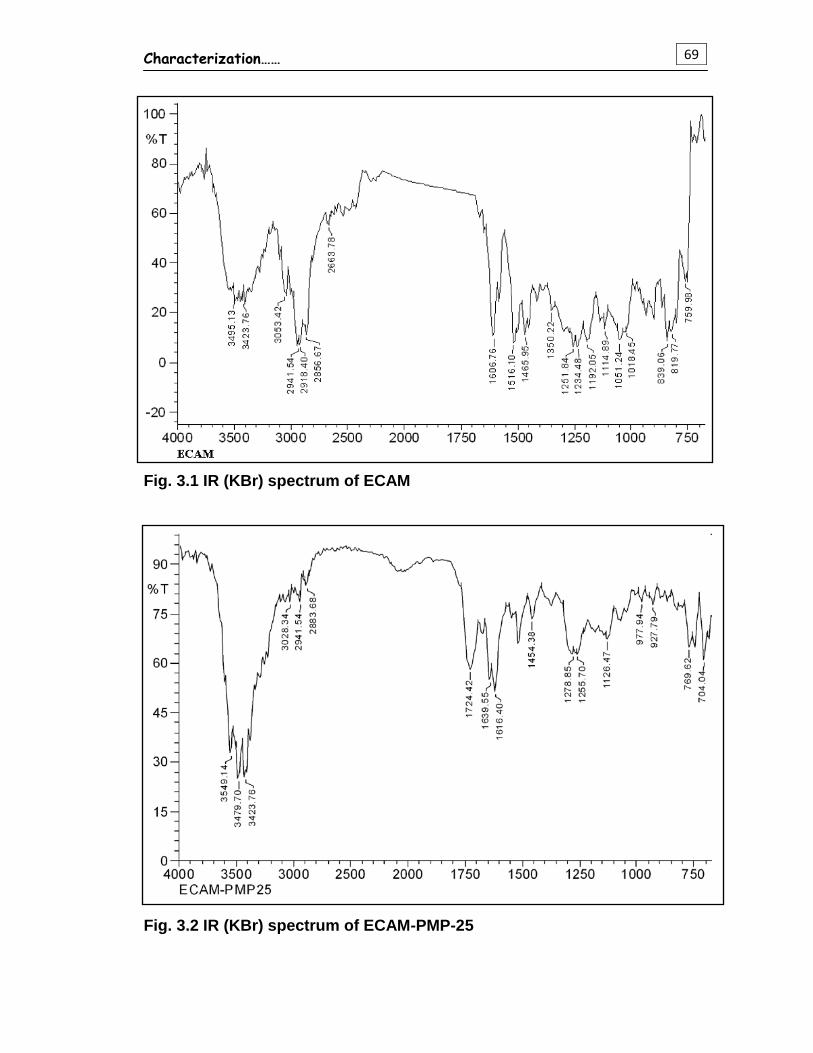
Characterization……
69
Fig. 3.1 IR (KBr) spectrum of ECAM
Fig. 3.2 IR (KBr) spectrum of ECAM-PMP-25
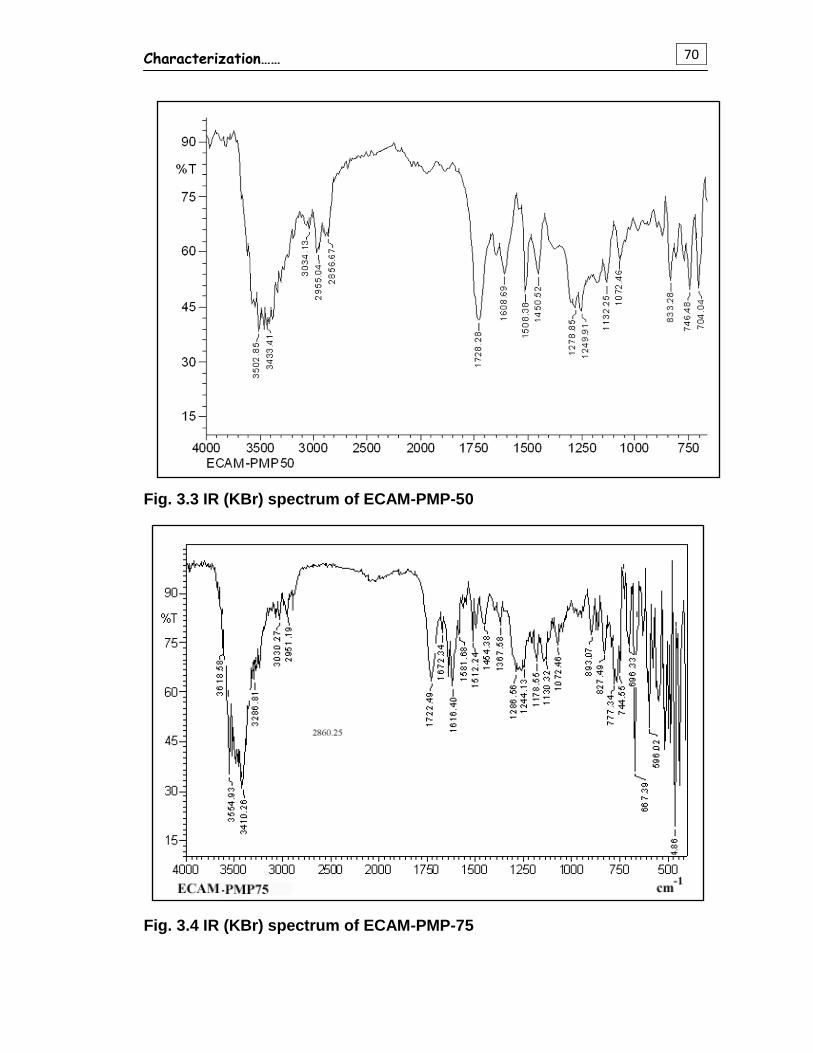
Characterization……
70
Fig. 3.3 IR (KBr) spectrum of ECAM-PMP-50
Fig. 3.4 IR (KBr) spectrum of ECAM-PMP-75
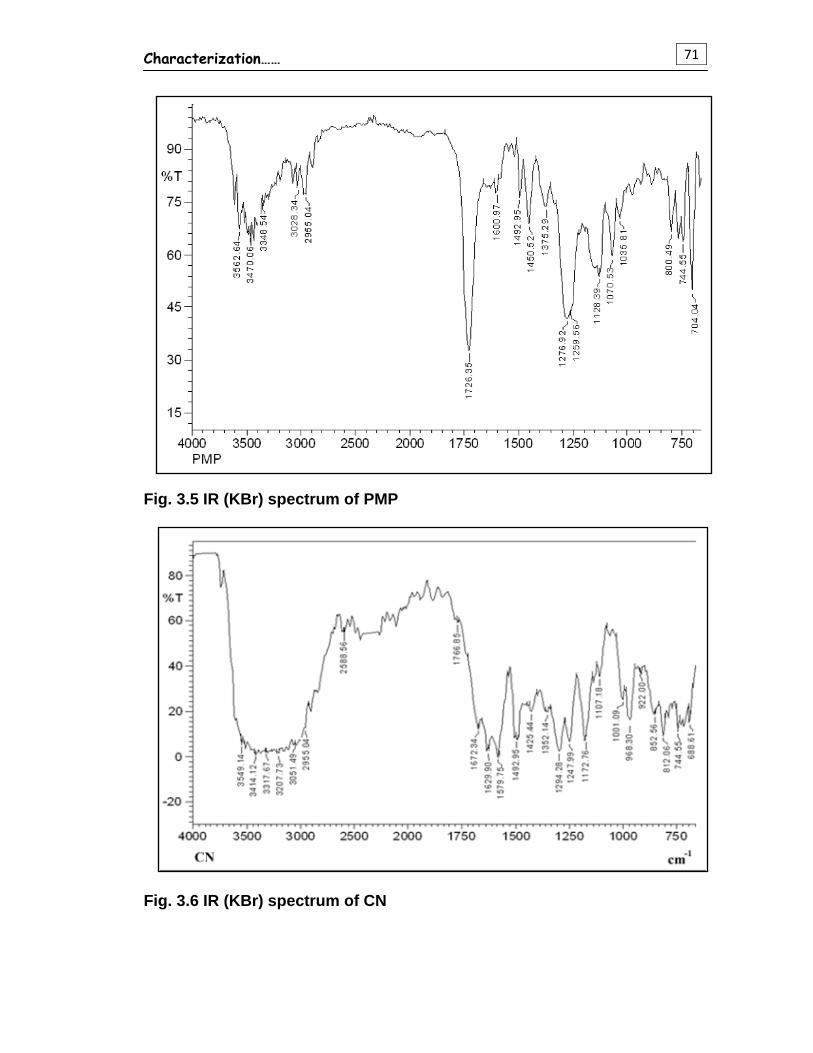
Characterization……
71
Fig. 3.5 IR (KBr) spectrum of PMP
Fig. 3.6 IR (KBr) spectrum of CN
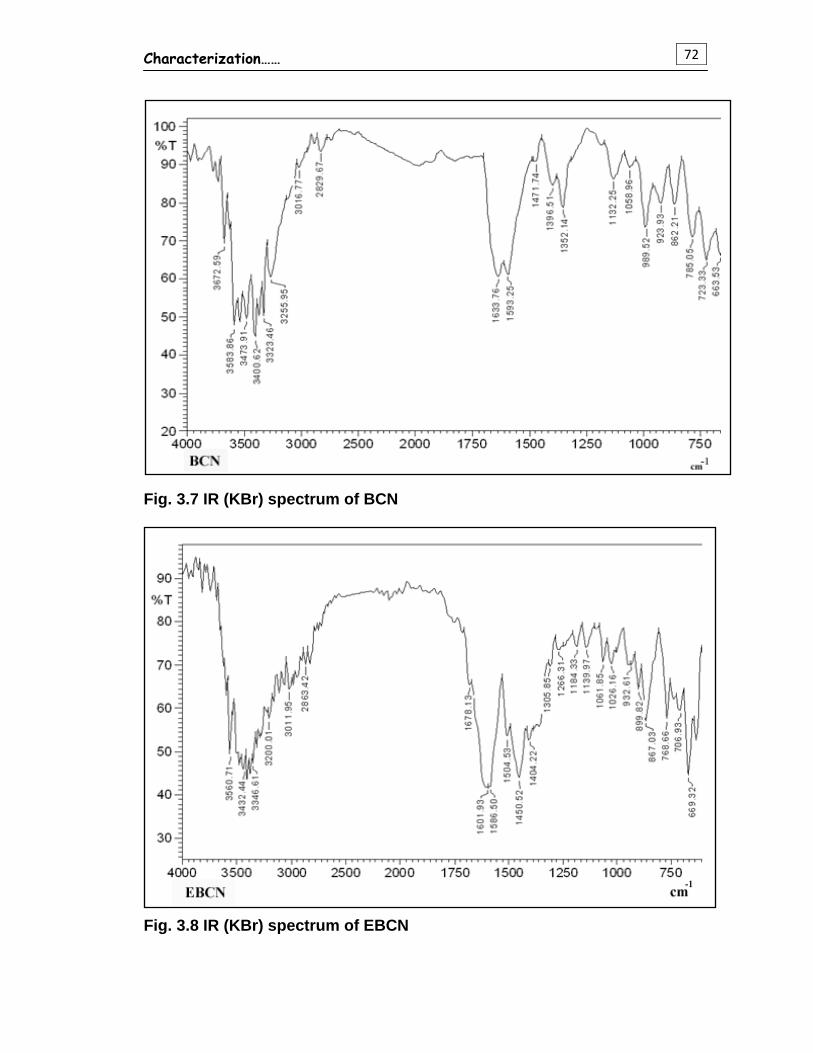
Characterization……
72
Fig. 3.7 IR (KBr) spectrum of BCN
Fig. 3.8 IR (KBr) spectrum of EBCN
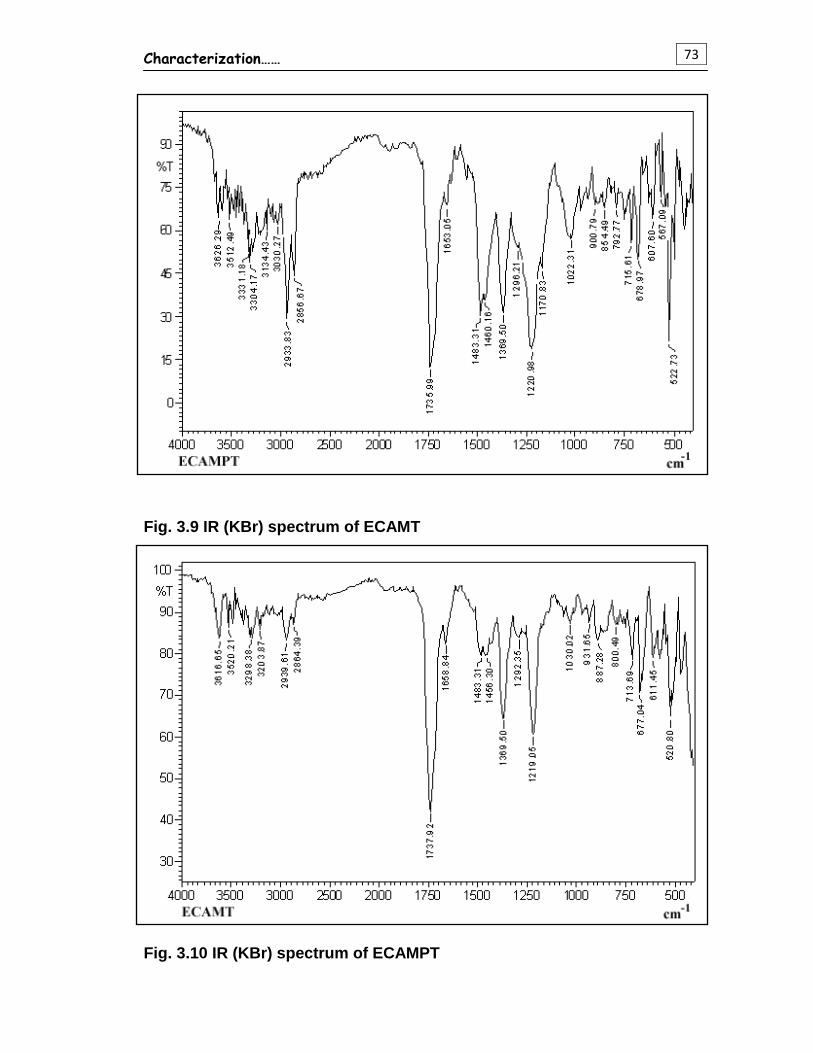
Characterization……
73
Fig. 3.9 IR (KBr) spectrum of ECAMT
Fig. 3.10 IR (KBr) spectrum of ECAMPT
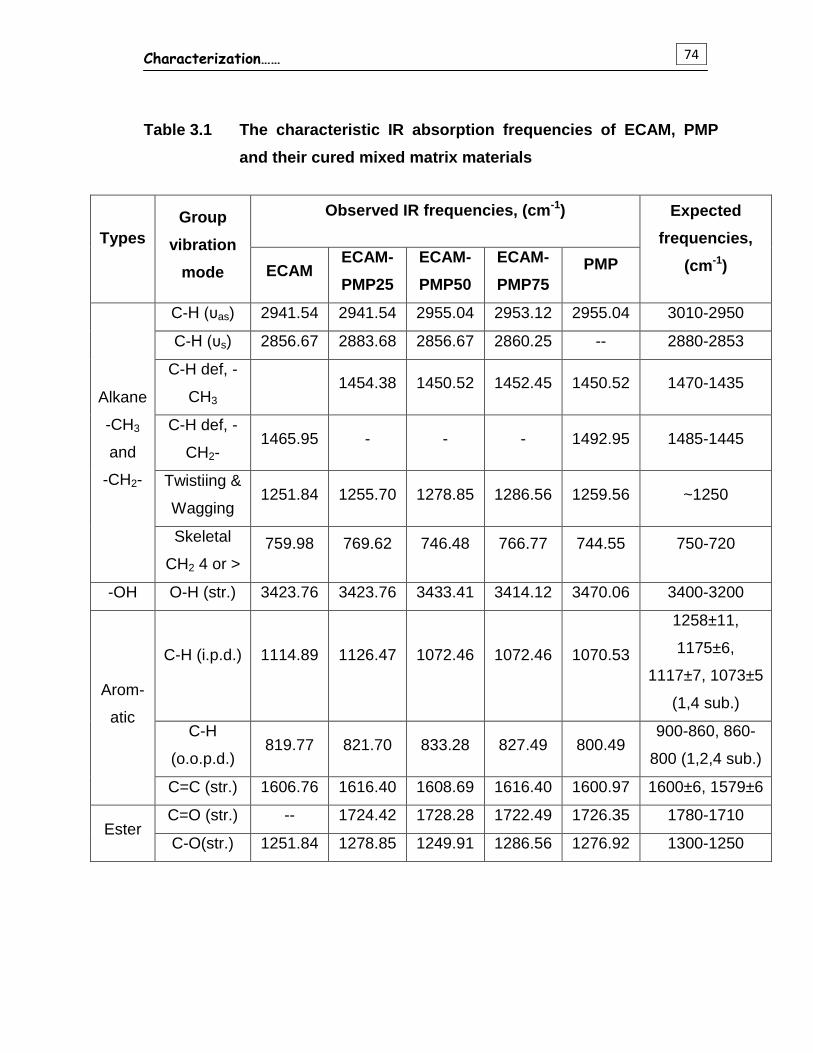
Characterization……
74
Table 3.1 The characteristic IR absorption frequencies of ECAM, PMP
and their cured mixed matrix materials
Types
Group
vibration
mode
Observed IR frequencies, (cm-1) Expected
frequencies,
(cm-1) ECAM ECAM-
PMP25
ECAM-
PMP50
ECAM-
PMP75
PMP
Alkane
-CH3
and
-CH2-
C-H (υas) 2941.54 2941.54 2955.04 2953.12 2955.04 3010-2950
C-H (υs) 2856.67 2883.68 2856.67 2860.25 -- 2880-2853
C-H def, -
CH3 1454.38 1450.52 1452.45 1450.52 1470-1435
C-H def, -
CH2- 1465.95 - - - 1492.95 1485-1445
Twistiing &
Wagging 1251.84 1255.70 1278.85 1286.56 1259.56 ~1250
Skeletal
CH2 4 or > 759.98 769.62 746.48 766.77 744.55 750-720
-OH O-H (str.) 3423.76 3423.76 3433.41 3414.12 3470.06 3400-3200
Arom-
atic
C-H (i.p.d.) 1114.89 1126.47 1072.46 1072.46 1070.53
1258±11,
1175±6,
1117±7, 1073±5
(1,4 sub.)
C-H
(o.o.p.d.) 819.77 821.70 833.28 827.49 800.49
900-860, 860-
800 (1,2,4 sub.)
C=C (str.) 1606.76 1616.40 1608.69 1616.40 1600.97 1600±6, 1579±6
Ester C=O (str.) -- 1724.42 1728.28 1722.49 1726.35 1780-1710
C-O(str.) 1251.84 1278.85 1249.91 1286.56 1276.92 1300-1250

Characterization……
75
Table 3.2 The characteristic IR absorption frequencies of CN, BCN and
EBCN
Types Group
vibration mode
Observed IR frequencies, (cm-1) Expected
frequencies,
(cm-1) CN BCN EBCN
Alkane
-CH3
and
-CH2-
C-H (υas) 2955.04 3016.77 3011.95 3010-2950
C-H (υs) - 2829.67 2863.42 2880-2853
C-H def, -CH3 1425.44 1396.51 1450.52 1470-1435
C-H def, -CH2- 1492.95 1471.74 1504.53 1485-1445
Twistiing &
Wagging 1247.99 - - ~1250
-OH O-H (str.) 3317.67 3323.46 3432.44 3400-3200
Arom-
atic
C-H (i.p.d.) 1172.76 1132.25 1139.97
1258±11,
1175±6,
1117±7,
1073±5 (1,4
sub.)
C-H (o.o.p.d.) 852.56 862.93 867.03
900-860, 860-
800 (1,2,4
sub.)
C=C (str.) 1629.90 1633.76 1601.93 1600±6,
1579±6
Ester C=O (str.) 1672.34 - - 1780-1710
C-O(str.) 1294.28 - 1266.31 1300-1250

Characterization……
76
Table 3.3 The characteristic IR absorption frequencies of ECAMT and
ECAMPT
Type
Absorption frequencies, cm-1
ECAMT ECAMPT
-N-H Str. 3616.65 3626.29
-CH2Str. (sym.)
-CH2Str. (asym.) 2864.39 2856.67
Urethane
-C=O Str. 1737.92 1735.99
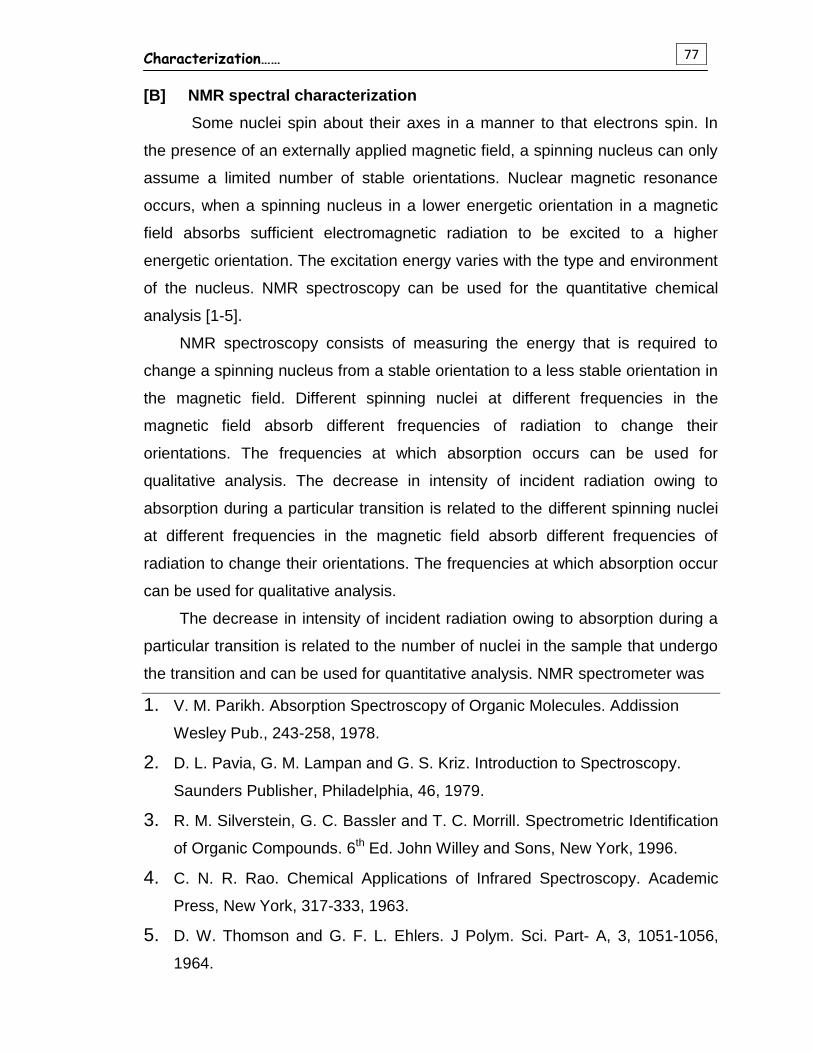
Characterization……
77
[B] NMR spectral characterization
Some nuclei spin about their axes in a manner to that electrons spin. In
the presence of an externally applied magnetic field, a spinning nucleus can only
assume a limited number of stable orientations. Nuclear magnetic resonance
occurs, when a spinning nucleus in a lower energetic orientation in a magnetic
field absorbs sufficient electromagnetic radiation to be excited to a higher
energetic orientation. The excitation energy varies with the type and environment
of the nucleus. NMR spectroscopy can be used for the quantitative chemical
analysis [1-5].
NMR spectroscopy consists of measuring the energy that is required to
change a spinning nucleus from a stable orientation to a less stable orientation in
the magnetic field. Different spinning nuclei at different frequencies in the
magnetic field absorb different frequencies of radiation to change their
orientations. The frequencies at which absorption occurs can be used for
qualitative analysis. The decrease in intensity of incident radiation owing to
absorption during a particular transition is related to the different spinning nuclei
at different frequencies in the magnetic field absorb different frequencies of
radiation to change their orientations. The frequencies at which absorption occur
can be used for qualitative analysis.
The decrease in intensity of incident radiation owing to absorption during a
particular transition is related to the number of nuclei in the sample that undergo
the transition and can be used for quantitative analysis. NMR spectrometer was
1. V. M. Parikh. Absorption Spectroscopy of Organic Molecules. Addission
Wesley Pub., 243-258, 1978.
2. D. L. Pavia, G. M. Lampan and G. S. Kriz. Introduction to Spectroscopy.
Saunders Publisher, Philadelphia, 46, 1979.
3. R. M. Silverstein, G. C. Bassler and T. C. Morrill. Spectrometric Identification
of Organic Compounds. 6th Ed. John Willey and Sons, New York, 1996.
4. C. N. R. Rao. Chemical Applications of Infrared Spectroscopy. Academic
Press, New York, 317-333, 1963.
5. D. W. Thomson and G. F. L. Ehlers. J Polym. Sci. Part- A, 3, 1051-1056,
1964.
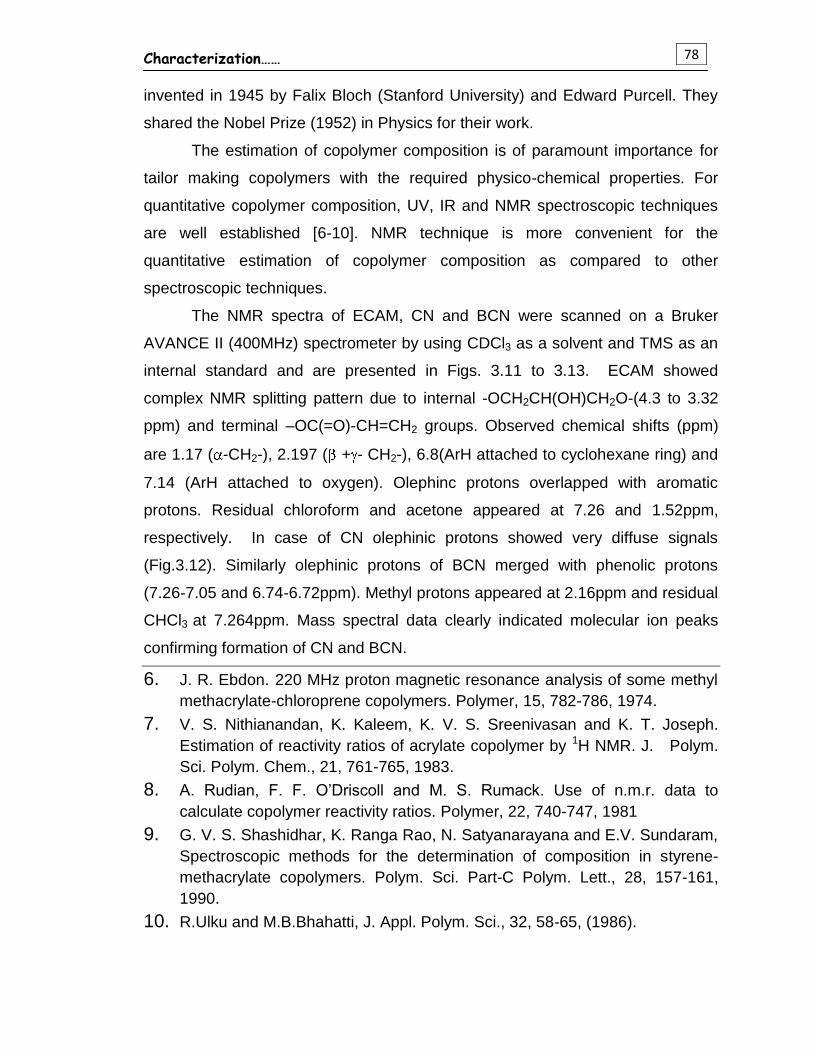
Characterization……
78
invented in 1945 by Falix Bloch (Stanford University) and Edward Purcell. They
shared the Nobel Prize (1952) in Physics for their work.
The estimation of copolymer composition is of paramount importance for
tailor making copolymers with the required physico-chemical properties. For
quantitative copolymer composition, UV, IR and NMR spectroscopic techniques
are well established [6-10]. NMR technique is more convenient for the
quantitative estimation of copolymer composition as compared to other
spectroscopic techniques.
The NMR spectra of ECAM, CN and BCN were scanned on a Bruker
AVANCE II (400MHz) spectrometer by using CDCl3 as a solvent and TMS as an
internal standard and are presented in Figs. 3.11 to 3.13. ECAM showed
complex NMR splitting pattern due to internal -OCH2CH(OH)CH2O-(4.3 to 3.32
ppm) and terminal –OC(=O)-CH=CH2 groups. Observed chemical shifts (ppm)
are 1.17 ( -CH2-), 2.197 ( + - CH2-), 6.8(ArH attached to cyclohexane ring) and
7.14 (ArH attached to oxygen). Olephinc protons overlapped with aromatic
protons. Residual chloroform and acetone appeared at 7.26 and 1.52ppm,
respectively. In case of CN olephinic protons showed very diffuse signals
(Fig.3.12). Similarly olephinic protons of BCN merged with phenolic protons
(7.26-7.05 and 6.74-6.72ppm). Methyl protons appeared at 2.16ppm and residual
CHCl3 at 7.264ppm. Mass spectral data clearly indicated molecular ion peaks
confirming formation of CN and BCN.
6. J. R. Ebdon. 220 MHz proton magnetic resonance analysis of some methyl methacrylate-chloroprene copolymers. Polymer, 15, 782-786, 1974.
7. V. S. Nithianandan, K. Kaleem, K. V. S. Sreenivasan and K. T. Joseph. Estimation of reactivity ratios of acrylate copolymer by 1H NMR. J. Polym. Sci. Polym. Chem., 21, 761-765, 1983.
8. A. Rudian, F. F. O’Driscoll and M. S. Rumack. Use of n.m.r. data to calculate copolymer reactivity ratios. Polymer, 22, 740-747, 1981
9. G. V. S. Shashidhar, K. Ranga Rao, N. Satyanarayana and E.V. Sundaram, Spectroscopic methods for the determination of composition in styrene-methacrylate copolymers. Polym. Sci. Part-C Polym. Lett., 28, 157-161, 1990.
10. R.Ulku and M.B.Bhahatti, J. Appl. Polym. Sci., 32, 58-65, (1986).

Characterization……
79
Fig. 3.11 NMR (400MHZ) spectrum of ECAM
Fig. 3.12 NMR (400MHZ) spectrum of CN

Characterization……
80
Fig. 3.13 NMR (400MHZ) spectrum of BCN
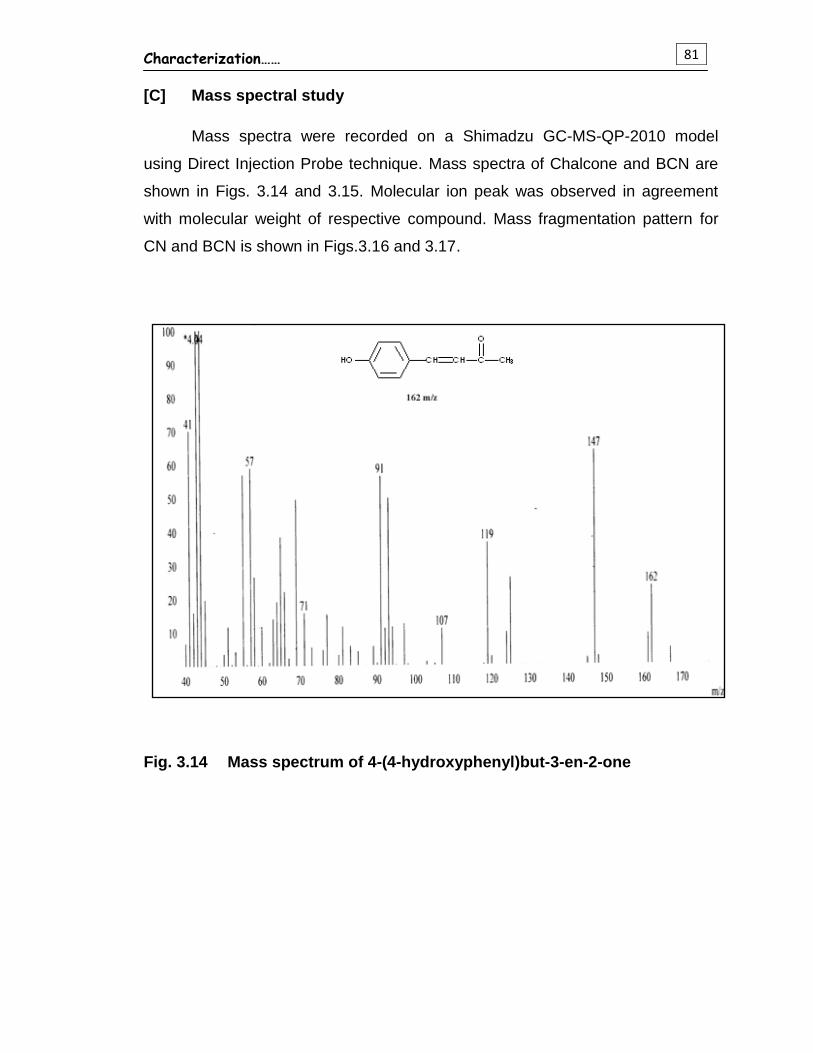
Characterization……
81
[C] Mass spectral study
Mass spectra were recorded on a Shimadzu GC-MS-QP-2010 model
using Direct Injection Probe technique. Mass spectra of Chalcone and BCN are
shown in Figs. 3.14 and 3.15. Molecular ion peak was observed in agreement
with molecular weight of respective compound. Mass fragmentation pattern for
CN and BCN is shown in Figs.3.16 and 3.17.
Fig. 3.14 Mass spectrum of 4-(4-hydroxyphenyl)but-3-en-2-one
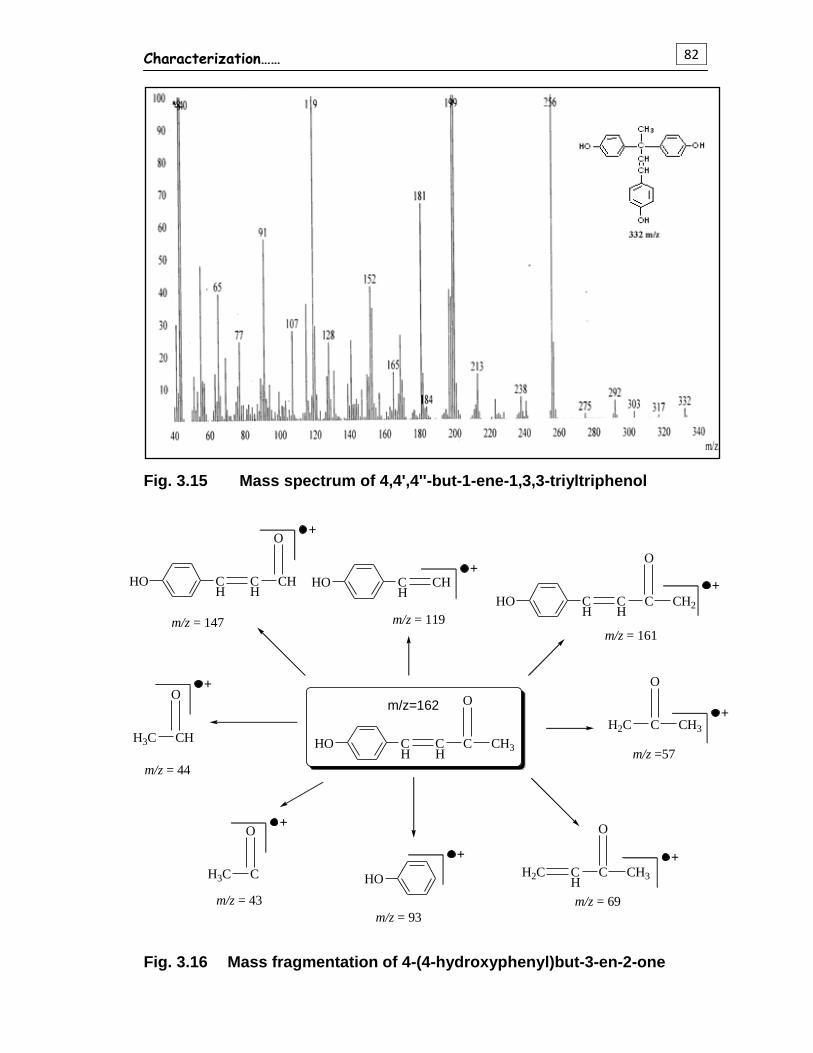
Characterization……
82
Fig. 3.15 Mass spectrum of 4,4',4''-but-1-ene-1,3,3-triyltriphenol
Fig. 3.16 Mass fragmentation of 4-(4-hydroxyphenyl)but-3-en-2-one
HO CH
CH
C
O
CH3
HO CH
CH
CH
O
m/z = 147
HO CH
CH
H2C CH
C
O
CH3
H2C C
O
CH3H3C CH
O
HO
HO CH
CH
C
O
CH2
+
m/z = 119
+
m/z = 69
+
m/z = 161
m/z = 44
H3C C
O
m/z = 43
m/z = 93
+
m/z =57
+
+
+
+m/z=162
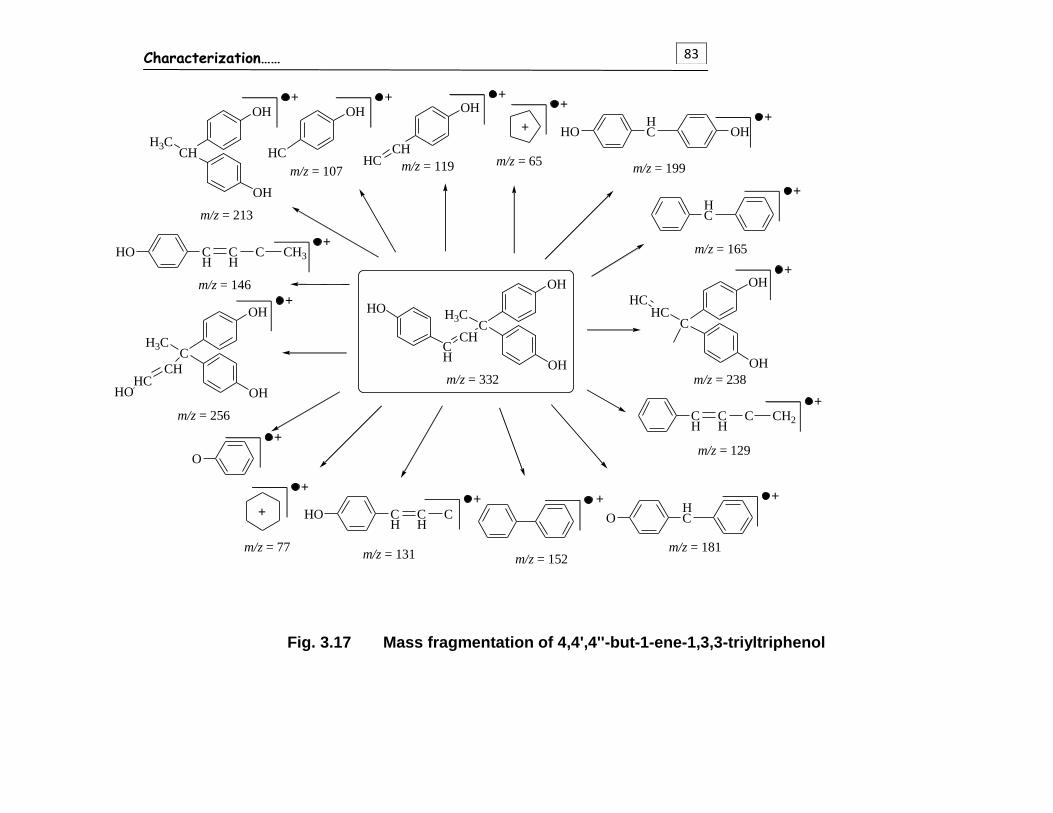
Characterization……
83
Fig. 3.17 Mass fragmentation of 4,4',4''-but-1-ene-1,3,3-triyltriphenol
HO
CH
CHC
H3C
OH
OHm/z = 332
CHH3C
OH
OH
+
m/z = 213
HCCH
OH+
m/z = 119
HCHO OH
+
m/z = 146
HC
m/z = 165
CHC
OH
OH
HC
+
+
m/z = 238
CH
CH
C CH2
+
m/z = 129
HCO
m/z = 181
+
m/z = 152
CH
CH
HO C
m/z = 131
+
CH3C
OH
OH
CHHC
HO
m/z = 256
m/z = 199
+
CH
CH
HO C CH3
+
+
m/z = 77
HC
OH+
m/z = 107
+
m/z = 65
+
O
+
+
+
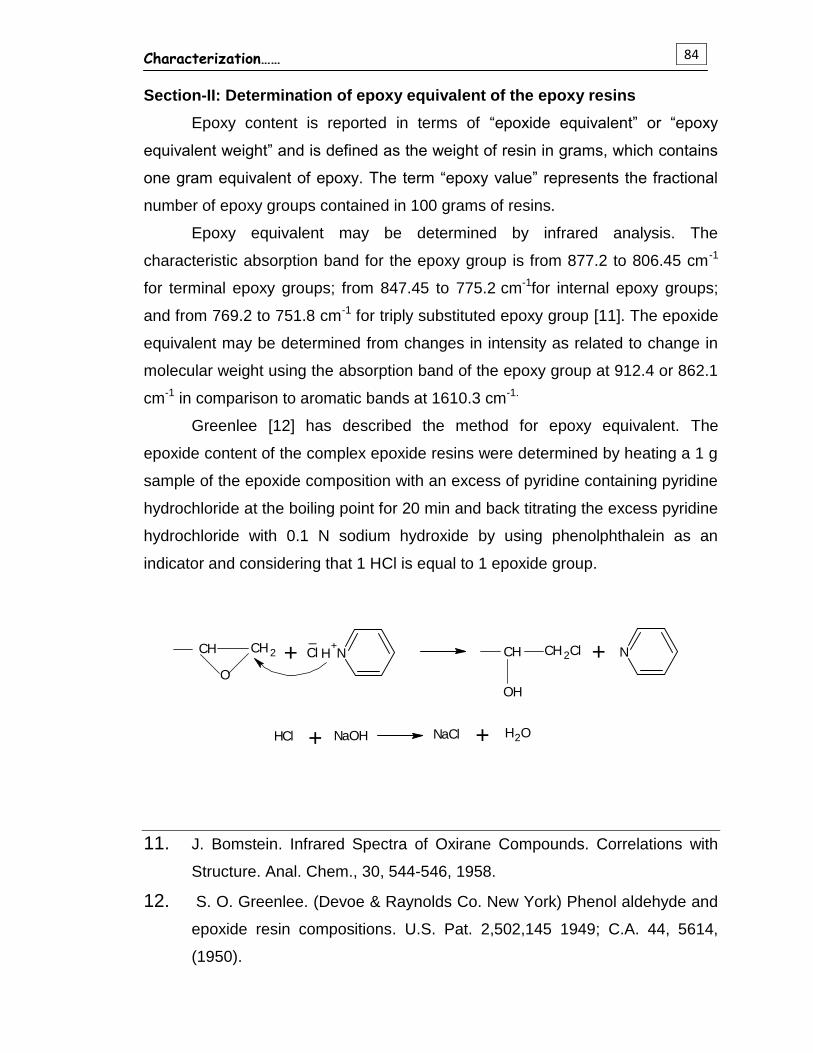
Characterization……
84
Section-II: Determination of epoxy equivalent of the epoxy resins
Epoxy content is reported in terms of “epoxide equivalent” or “epoxy
equivalent weight” and is defined as the weight of resin in grams, which contains
one gram equivalent of epoxy. The term “epoxy value” represents the fractional
number of epoxy groups contained in 100 grams of resins.
Epoxy equivalent may be determined by infrared analysis. The
characteristic absorption band for the epoxy group is from 877.2 to 806.45 cm-1
for terminal epoxy groups; from 847.45 to 775.2 cm-1for internal epoxy groups;
and from 769.2 to 751.8 cm-1 for triply substituted epoxy group [11]. The epoxide
equivalent may be determined from changes in intensity as related to change in
molecular weight using the absorption band of the epoxy group at 912.4 or 862.1
cm-1 in comparison to aromatic bands at 1610.3 cm-1.
Greenlee [12] has described the method for epoxy equivalent. The
epoxide content of the complex epoxide resins were determined by heating a 1 g
sample of the epoxide composition with an excess of pyridine containing pyridine
hydrochloride at the boiling point for 20 min and back titrating the excess pyridine
hydrochloride with 0.1 N sodium hydroxide by using phenolphthalein as an
indicator and considering that 1 HCl is equal to 1 epoxide group.
11. J. Bomstein. Infrared Spectra of Oxirane Compounds. Correlations with
Structure. Anal. Chem., 30, 544-546, 1958.
12. S. O. Greenlee. (Devoe & Raynolds Co. New York) Phenol aldehyde and
epoxide resin compositions. U.S. Pat. 2,502,145 1949; C.A. 44, 5614,
(1950).
CH CH2
O+ NH
+Cl_
CH CH2Cl
OH
+ N
+ +HCl NaOH NaCl H2O
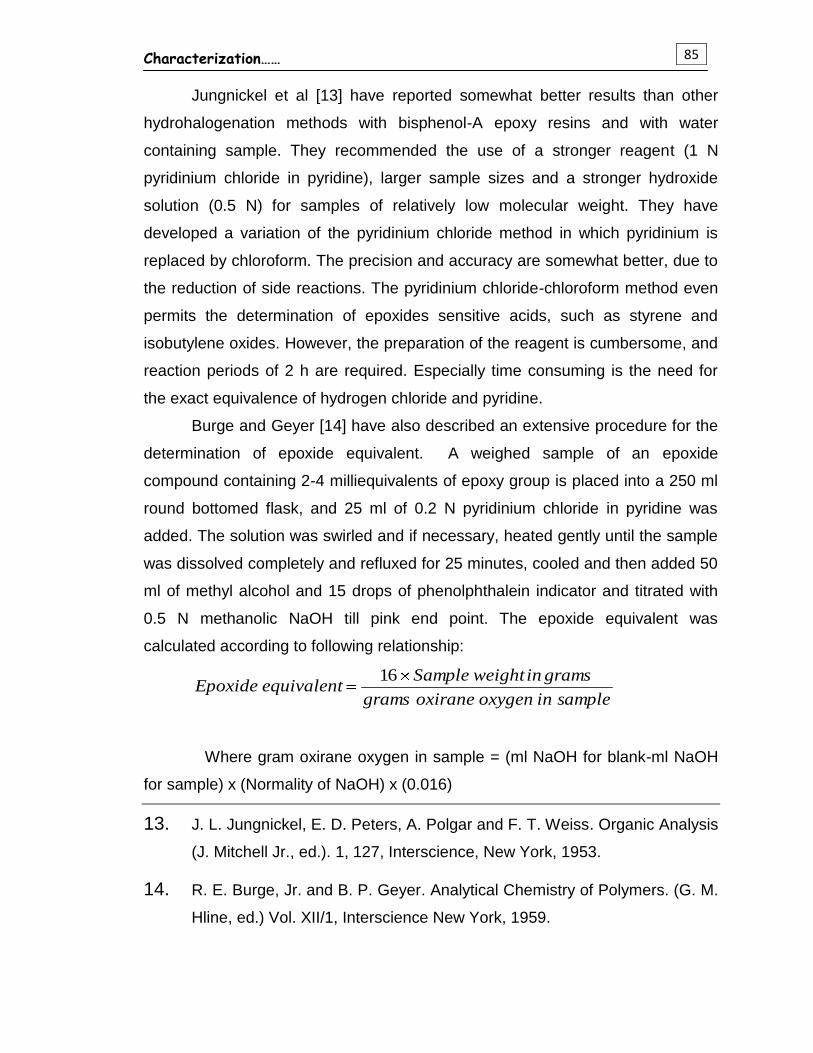
Characterization……
85
Jungnickel et al [13] have reported somewhat better results than other
hydrohalogenation methods with bisphenol-A epoxy resins and with water
containing sample. They recommended the use of a stronger reagent (1 N
pyridinium chloride in pyridine), larger sample sizes and a stronger hydroxide
solution (0.5 N) for samples of relatively low molecular weight. They have
developed a variation of the pyridinium chloride method in which pyridinium is
replaced by chloroform. The precision and accuracy are somewhat better, due to
the reduction of side reactions. The pyridinium chloride-chloroform method even
permits the determination of epoxides sensitive acids, such as styrene and
isobutylene oxides. However, the preparation of the reagent is cumbersome, and
reaction periods of 2 h are required. Especially time consuming is the need for
the exact equivalence of hydrogen chloride and pyridine.
Burge and Geyer [14] have also described an extensive procedure for the
determination of epoxide equivalent. A weighed sample of an epoxide
compound containing 2-4 milliequivalents of epoxy group is placed into a 250 ml
round bottomed flask, and 25 ml of 0.2 N pyridinium chloride in pyridine was
added. The solution was swirled and if necessary, heated gently until the sample
was dissolved completely and refluxed for 25 minutes, cooled and then added 50
ml of methyl alcohol and 15 drops of phenolphthalein indicator and titrated with
0.5 N methanolic NaOH till pink end point. The epoxide equivalent was
calculated according to following relationship:
sampleinoxygenoxiranegrams
gramsinweightSampleequivalentEpoxide
16
Where gram oxirane oxygen in sample = (ml NaOH for blank-ml NaOH
for sample) x (Normality of NaOH) x (0.016)
13. J. L. Jungnickel, E. D. Peters, A. Polgar and F. T. Weiss. Organic Analysis
(J. Mitchell Jr., ed.). 1, 127, Interscience, New York, 1953.
14. R. E. Burge, Jr. and B. P. Geyer. Analytical Chemistry of Polymers. (G. M.
Hline, ed.) Vol. XII/1, Interscience New York, 1959.

Characterization……
86
The number 0.016 is the mili equivalent weight of oxygen in grams. The
epoxide equivalent of the epoxy resin of bisphenol-C and epoxy resin of
bisphenol of 4-(4-hydroxyphenyl)but-3-en-2-one resin used was found to be 576
and 889, respectively.
Section-III: Determination of acid values of the epoxy ester and epoxy-
acrylate-maleate
Acid value is a measure of the free fatty acids content of oil and is
expressed as the number of milligrams of potassium hydroxide required to
neutralize the free acid in 1 gram of the sample. Acid value quantifies the
reaction, which is in the beginning of the reaction, the acid value is high but as
the reaction progresses acid is consumed to form ester and at the end of the
reaction the acid value is low which signifies the completion of the ester reaction.
Acid values of epoxy ester were determined according to standard
reported method [15]. Epoxy ester and epoxy-acrylate-maleate was exactly
weighed (1- 2 g) in a small capsule and placed carefully in a 250 ml RBF and to it
50 ml of acetone was added. The flask was swirled for some time and heated
gently for some time to dissolve sample completely. The solution was cooled and
titrated with standard 0.1 N methanolic KOH by using phenolphthalein as an
indicator. The procedure was repeated for blank titration under similar condition.
The acid value of a given sample was determined according to following
relationship.
Where N = Normality of KOH
A = Sample burette reading
B = Blank burette reading
W = Weight of sample in grams
The average of three measurements of each of epoxy ester and epoxy-
acrylate-maleate are reported in Table-3.7.
15. ASTM-D-1639-61
56.1 x N x (A - B)Acid Value = W
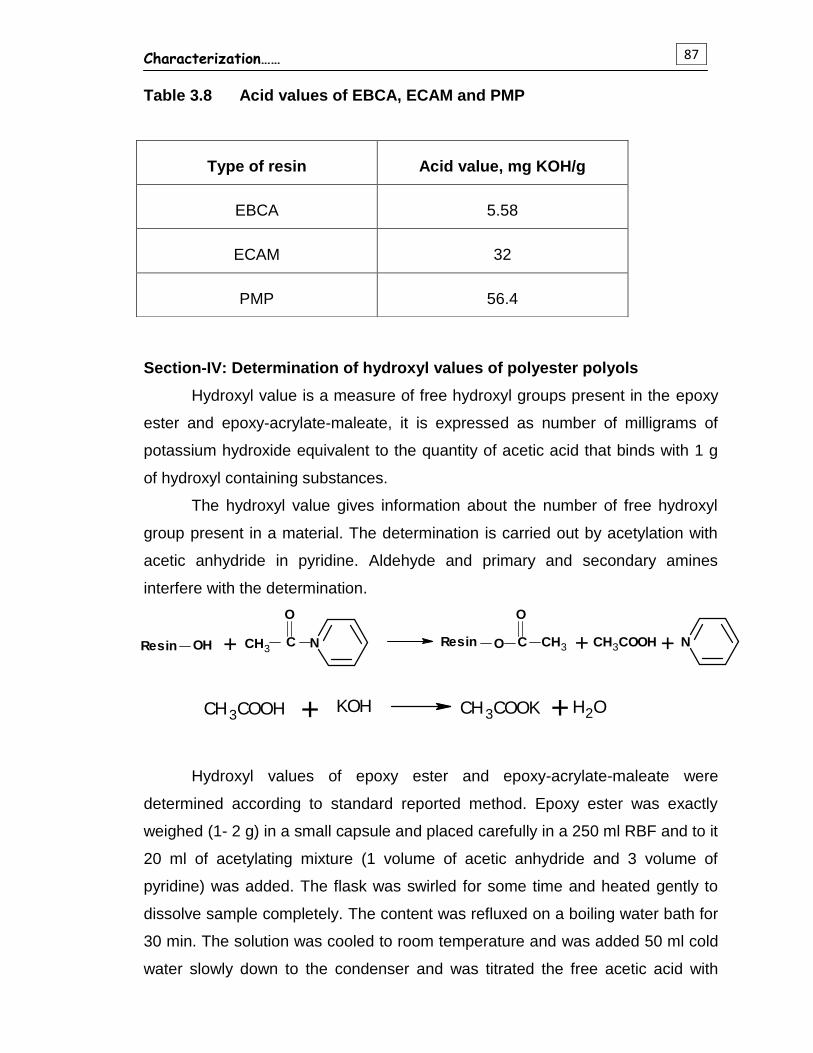
Characterization……
87
+ N + NCCH3
O
Resin O C
O
CH3Resin OH CH3COOH +
Table 3.8 Acid values of EBCA, ECAM and PMP
Section-IV: Determination of hydroxyl values of polyester polyols
Hydroxyl value is a measure of free hydroxyl groups present in the epoxy
ester and epoxy-acrylate-maleate, it is expressed as number of milligrams of
potassium hydroxide equivalent to the quantity of acetic acid that binds with 1 g
of hydroxyl containing substances.
The hydroxyl value gives information about the number of free hydroxyl
group present in a material. The determination is carried out by acetylation with
acetic anhydride in pyridine. Aldehyde and primary and secondary amines
interfere with the determination.
Hydroxyl values of epoxy ester and epoxy-acrylate-maleate were
determined according to standard reported method. Epoxy ester was exactly
weighed (1- 2 g) in a small capsule and placed carefully in a 250 ml RBF and to it
20 ml of acetylating mixture (1 volume of acetic anhydride and 3 volume of
pyridine) was added. The flask was swirled for some time and heated gently to
dissolve sample completely. The content was refluxed on a boiling water bath for
30 min. The solution was cooled to room temperature and was added 50 ml cold
water slowly down to the condenser and was titrated the free acetic acid with
Type of resin Acid value, mg KOH/g
EBCA 5.58
ECAM 32
PMP 56.4
+ +H2OCH3COOH KOH CH3COOK
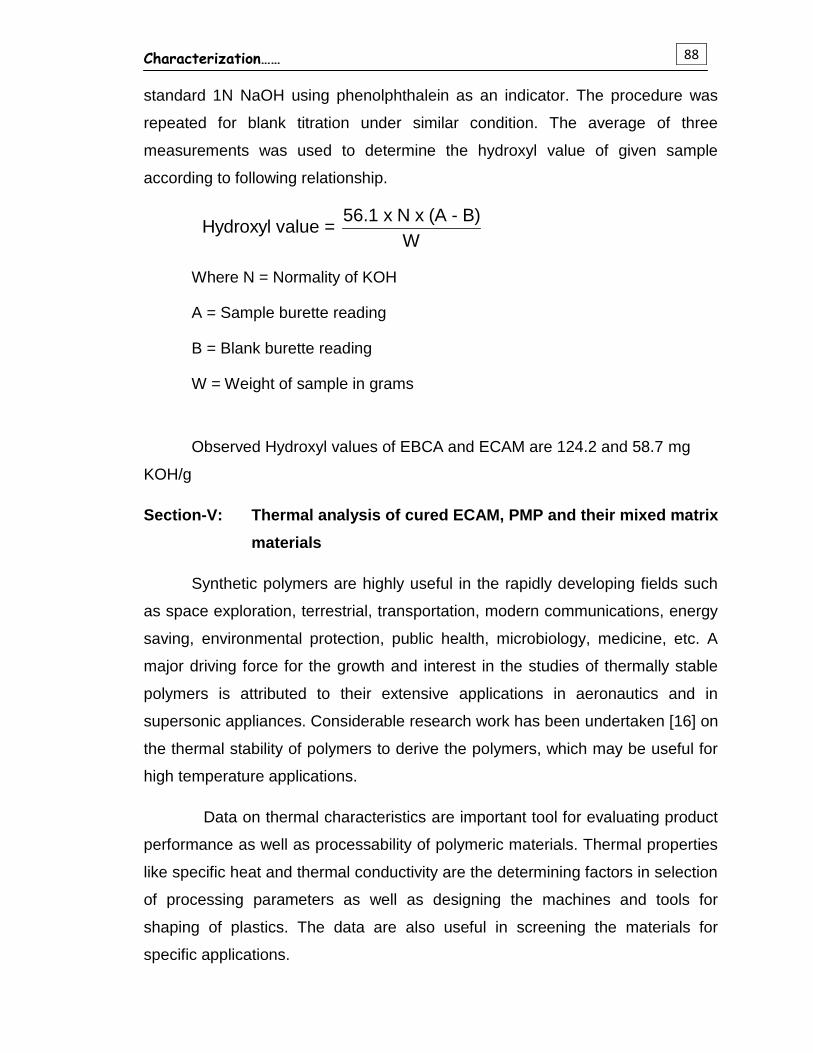
Characterization……
88
standard 1N NaOH using phenolphthalein as an indicator. The procedure was
repeated for blank titration under similar condition. The average of three
measurements was used to determine the hydroxyl value of given sample
according to following relationship.
56.1 x N x (A - B)Hydroxyl value = W
Where N = Normality of KOH
A = Sample burette reading
B = Blank burette reading
W = Weight of sample in grams
Observed Hydroxyl values of EBCA and ECAM are 124.2 and 58.7 mg
KOH/g
Section-V: Thermal analysis of cured ECAM, PMP and their mixed matrix
materials
Synthetic polymers are highly useful in the rapidly developing fields such
as space exploration, terrestrial, transportation, modern communications, energy
saving, environmental protection, public health, microbiology, medicine, etc. A
major driving force for the growth and interest in the studies of thermally stable
polymers is attributed to their extensive applications in aeronautics and in
supersonic appliances. Considerable research work has been undertaken [16] on
the thermal stability of polymers to derive the polymers, which may be useful for
high temperature applications.
Data on thermal characteristics are important tool for evaluating product
performance as well as processability of polymeric materials. Thermal properties
like specific heat and thermal conductivity are the determining factors in selection
of processing parameters as well as designing the machines and tools for
shaping of plastics. The data are also useful in screening the materials for
specific applications.
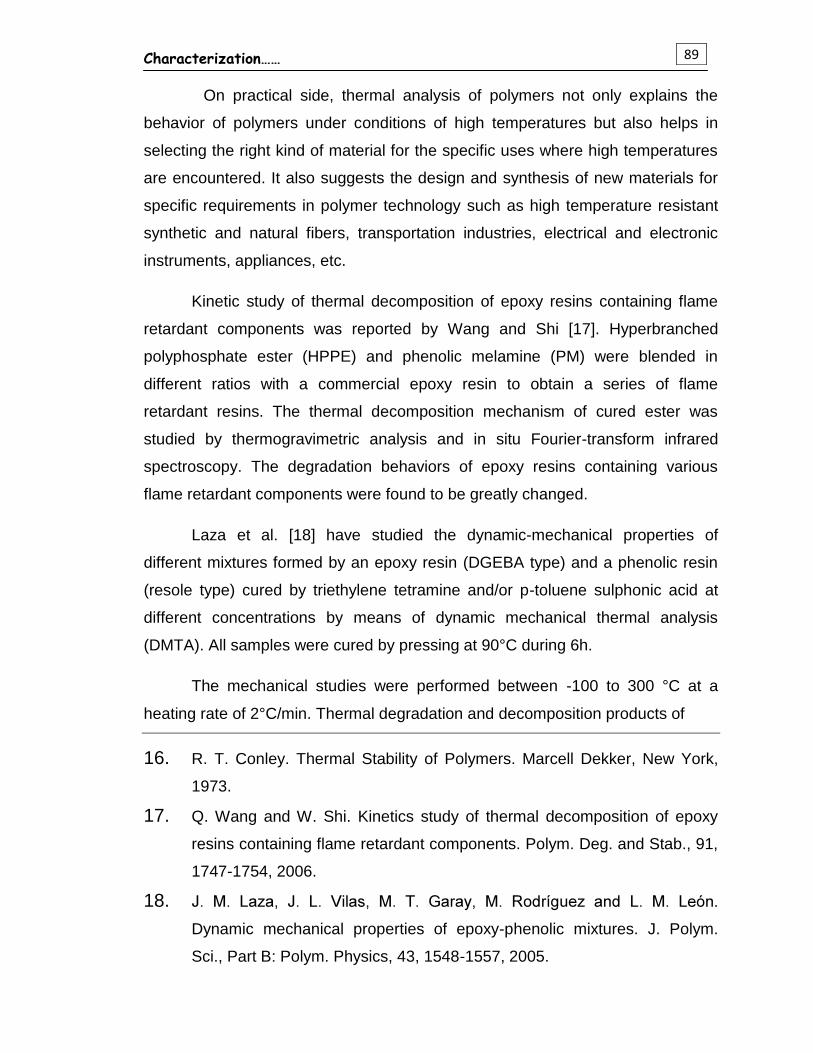
Characterization……
89
On practical side, thermal analysis of polymers not only explains the
behavior of polymers under conditions of high temperatures but also helps in
selecting the right kind of material for the specific uses where high temperatures
are encountered. It also suggests the design and synthesis of new materials for
specific requirements in polymer technology such as high temperature resistant
synthetic and natural fibers, transportation industries, electrical and electronic
instruments, appliances, etc.
Kinetic study of thermal decomposition of epoxy resins containing flame
retardant components was reported by Wang and Shi [17]. Hyperbranched
polyphosphate ester (HPPE) and phenolic melamine (PM) were blended in
different ratios with a commercial epoxy resin to obtain a series of flame
retardant resins. The thermal decomposition mechanism of cured ester was
studied by thermogravimetric analysis and in situ Fourier-transform infrared
spectroscopy. The degradation behaviors of epoxy resins containing various
flame retardant components were found to be greatly changed.
Laza et al. [18] have studied the dynamic-mechanical properties of
different mixtures formed by an epoxy resin (DGEBA type) and a phenolic resin
(resole type) cured by triethylene tetramine and/or p-toluene sulphonic acid at
different concentrations by means of dynamic mechanical thermal analysis
(DMTA). All samples were cured by pressing at 90°C during 6h.
The mechanical studies were performed between -100 to 300 °C at a
heating rate of 2°C/min. Thermal degradation and decomposition products of
16. R. T. Conley. Thermal Stability of Polymers. Marcell Dekker, New York,
1973.
17. Q. Wang and W. Shi. Kinetics study of thermal decomposition of epoxy
resins containing flame retardant components. Polym. Deg. and Stab., 91,
1747-1754, 2006.
18. .
Dynamic mechanical properties of epoxy-phenolic mixtures. J. Polym.
Sci., Part B: Polym. Physics, 43, 1548-1557, 2005.
Characterization……
90
electronic boards containing BFRs have been studied by the Barontini et al. [19].
They have investigated the thermal degradation behavior of electronic boards
manufactured using tetrabromobispheno-A and diglycidyl ether of bisphenol-A
epoxy resins. Qualitative and quantitative information was obtained on the
products formed in the thermal degradation process, and the bromine distribution
in the different product fractions was determined. The more important
decomposition products included hydrogen bromide, phenol, polybrominated
phenols, and polybrominated bisphenol-A species.
Wang et al. [20] have reported the cure study of addition-cure-type and
condensation-addition-type phenolic resins by the incorporation of propargyl and
methylol groups on to novolac backbone, a series of addition-curable phenolic
resins and condensation-addition dual-cure type phenolic resins (novolac
modified by propargyl groups referred as PN, and novolac modified by propargyl
and methylol groups simultaneously referred as MPN) were synthesized.
The processing characteristics, thermal cure and catalytic cure behavior
for both resins were investigated mainly by means of viscosity measurements
and non-isothermal differential scanning calorimetry (DSC). The effect of
propargyl and methylol content of PN and MPN, the molecular weight and the
configuration of the parent novolac, on the processing and cure behavior was
studied in details. Processing parameters and curing kinetic parameters were
obtained. Both resins exhibit excellent processing properties. Thermal cure of PN
resins possessed one cure mechanism and that of MPN resins possessed two
cure mechanisms according to DSC analysis. The dual-cure-type mechanism
made MPN resins superior to PN resins in terms of a mild and controllable cure
process. Compared with thermal cure, catalytic cure of PN resins showed lower
initiation temperature and cure temperature by about 60 °C. These novel resins
19. F. Barontini, K. Marsanich, L. Petarca and V. Cozzani. Thermal
degradation and decomposition products of electronic boards containing
BFRs. Ind. and Eng. Chem. Res., 44, 4186-4193, 2005.
20. M. Wang, L. Wei and T. Zhao. Cure study of addition-cure-type and
condensation-addition type phenolic resins. Eur. Polym., J., 41, 903-917,
2005.
Characterization……
91
have a bright prospect of application as matrix for thermal-structural
composite materials.
Nair et al. [21] have reported the thermal characteristics of addition-cure
phenolic resins. The thermal and pyrolysis characteristics of four different types
of addition-cure phenolic resins were compared as a function of their structure.
Whereas the propargyl ether resins and phenyl azo functional phenolics
underwent easy curing, the phenyl ethynyl and maleimide-functional required
higher thermal activation to achieve cure. All addition-cure phenolics exhibited
improved thermal stability and char-yielding properties in comparison to
conventional phenolic resole resin. The maleimide-functional resins exhibited
lowest thermal stability and those crosslinked via ethynyl phenyl azo groups were
the most thermally stable systems. Propargylated novolac and phenyl ethynyl
functional phenolics showed intermediate thermal stability. The maximum char
yield was also given by ethynyl phenyl azo system. Non-isothermal kinetic
analysis of the degradation reaction implied that all the polymers undergo
degradation in at least two steps, except in the case of ethynyl phenyl azo resin,
which showed apparent single step degradation.
Effect of various operating parameters
1. Atmosphere
The atmosphere associated with any thermal analysis, which is composed
of gases that are introduced from outside and those are evolved from the
samples. The presence or absence of such gases may have strong influence on
the results. These gases may react with the sample or with each other and
change the reaction mechanism or product composition. Inert atmosphere and
vacuum will influence the decomposition processes as well. In vacuum the
primary decomposition of gases will tend to be pumped away from the sample
before the molecules collide with the surface and undergo secondary reactions.
When these molecules collide with inert gas molecules, they may undergo
21. C. P. Reghunadhan Nair, R. L. Bindu and K. N. Ninan. Thermal
characteristics of addition-cure phenolic resins. Poly. Deg. and Stab., 73,
251-263, 2001.
Characterization……
92
homogeneous reactions or may be reflected back to the sample surface and
react there.
2. Container geometry
The container geometry influences the gaseous environment and heat
transfer to the samples. Even with a flowing gaseous atmosphere, a deep narrow
container will limit the contact between the sample surface and gas, whereas a
shallow, broad container will promote the contact.
3. Container material
It is reasonable to expect that in some cases the container material will
react with material being tested or some of the products.
4. Sample size
Two major effects are associated with the sample size, namely surface
and bulk effects. In carrying out degradation studies, it is customary to reduce
film thickness or particle size until the rate of the decomposition becomes
independent of size.
5. Rate of heating
In the case where only kinetic considerations are significant, an increase
in rate of temperature rise will cause the process to be displayed to a higher
temperature because they will be at the lower temperature for a shorter length of
time. The rate of change of the measured parameter will also be greater for
faster heating.
Differential scanning calorimetry (DSC) and differential thermal analysis
(DTA)
Physical transformation [22] such as glass transition, cold crystallization
and crystallization from melts, crystalline disorientation, and melting can be
studied by differential scanning calorimetry (DSC) and differential thermal
analysis (DTA). Glass transition involves the motion of short segments in the
amorphous region and is related to the brittleness of the polymer. Crystallization
from the melt is of great practical importance. A number of properties of polymers
Characterization……
93
like melting range, heat of fusion and melting point depression, degree of
crystallinity, random copolymer structure and stereo regularity and identification
of composition of a mixture may be studied through melting. DSC is a method
where by the energy necessary to establish a zero temperature difference
between a substance and a reference material is recorded as a function of
temperature or time. The energy input to the sample is compensated by an
increased energy input to the sample in order to maintain a zero temperature
difference because this energy input is precisely equivalent in magnitude to the
energy absorbed during the transition in direct calorimetric measurement. The
combination of programmed and isothermal techniques has been used for
characterizing unresolved multistep reactions in polymers [23]. DSC provides
useful information about crystallinity, stability of crystallites, glass transition
temperature, cross linking, kinetic parameters such as the activation energy, the
kinetic order, frequency factor, entropy change and heat of polymerization.
Thermo Gravimetric Analysis (TGA)
Thermogravimetry is a useful analytical technique for recording weight
loss of a test sample as a function of the temperature or time, which may be
useful for understanding the chemical nature of the polymer. Thus, the weight of
a substance in an environment heated or cooled at a controlled rate is recorded
as a function of time or temperature. There are three types of thermogravimetry
namely
1. Static or isothermal thermogravimetry,
2. Quasistatic thermogravimetry and
3. Dynamic thermogravimetry
Most of the studies of polymers are generally carried out with dynamic
thermogravimetry. Normally sample starts losing weight at a very slow rate up to
a particular temperature and thereafter, the rate of loss becomes large over
narrow range of temperature. After this temperature the loss in weight levels off.
22. E. Heisenberg. Cellulose Chemie, 12,159, 1931; C.A. 25, 59, 823, 1931.
23. A. A. Duswalt. The practice of obtaining kinetic data by differential
scanning calorimetry. Thermochemica Acta, 8, 57-68, 1974.
Characterization……
94
TGA curves are characteristic for given polymers because of unique
sequence of physico-chemical reactions, which occur over definite temperature
ranges and at the rates that are function of the polymer structures.
The change in weight is a result of the rupture and/or formation of various
physical and chemical bonds at elevated temperatures that lead to the evaluation
of volatile products in the formation of heavier reaction products. Pyrolysis of
many polymers yields TG curves, which follow relatively simple sigmoidal curves.
In such a case weight of sample decreases slowly as reaction begins and then
decreases rapidly over a comparatively narrow range of temperature and finally
levels off as the reaction gets completed. The shape of the curve depends on the
kinetic parameters: reaction order (n), frequency factor (A) and activation energy
(Ea). The values of these parameters have been shown to be of major
importance to elucidate the mechanism in polymer degradation [24, 25].
Reich and Levi [26] have described several temperature characteristics for
qualitative assessment of relative thermal stability of polymers:
1. Initial decomposition temperature (To)
2. Temperature for 10% weight loss (T10)
3. Temperature for maximum rate of decomposition (Tmax)
4. Half volatilization temperature (Ts)
5. Differential decomposition temperature
6. Integral procedural decomposition temperature (IPDT)
For the estimation of kinetic parameters from TG traces, several so called
exact methods have been proposed. All these methods involve the two
assumptions that thermal and diffusion barriers are negligible and that Arrhenius
equation is valid. Since small quantities of materials are employed in TG studies,
thermal and diffusion barriers would be negligible.
24. D. W. Levi, L. Reich and H. T. Lee. Degradation of polymers by thermal
gravimetric techniques. Polym. Engg. Sci., 5, 135-141, 1965.
25. H. L. Friedman, U. S. Dept. Com., Office. Tech. 24 pp, (1959); C.A. 55,
26, 511, 1961.
26. L. Reich and D. W. Levi, Macromol. Rev.Eds. Peterlin Goodman Willey
Interscience, New York, 173, 1968.

Characterization……
95
Since the shape of any TG curve is dependent on the nature of apparatus
and the way in which it is used. Most kinetic treatments are based on relationship
of the type.
dC
dt = k f (C) … 3.1
Where C = Degree of conversion, t = time; k=rate constant,
f (C) = temperature independent function of C
The constant k is generally assumed to have the Arrhenius form
k = A e –Ea/RT … 3.2
C is defined as the conversion with respect to initial material
C = 1 oW
W ... 3.3
Where Wo= Initial weight of the material and W= weight of the material at any
time.
The residual weight fraction is given by
oW
W = (1 C)
and the rate of conversion is given by
dC
dt =
dt
dW
WO
1 ... 3.4
For homogeneous kinetics, the conversion would be assumed to have the form
f (C) = (1 C)n …3.5
Where n = order of the reaction
Upon substituting Eqns. 3.2 and 3.5 into Eqn. 3.1
dC
dt = A e –Ea/RT (1 C)n
OR
dT
dC = A
(e –Ea/RT) (1-C)n ... 3.6
Where β= Rate of heating
Methods of single heating rate
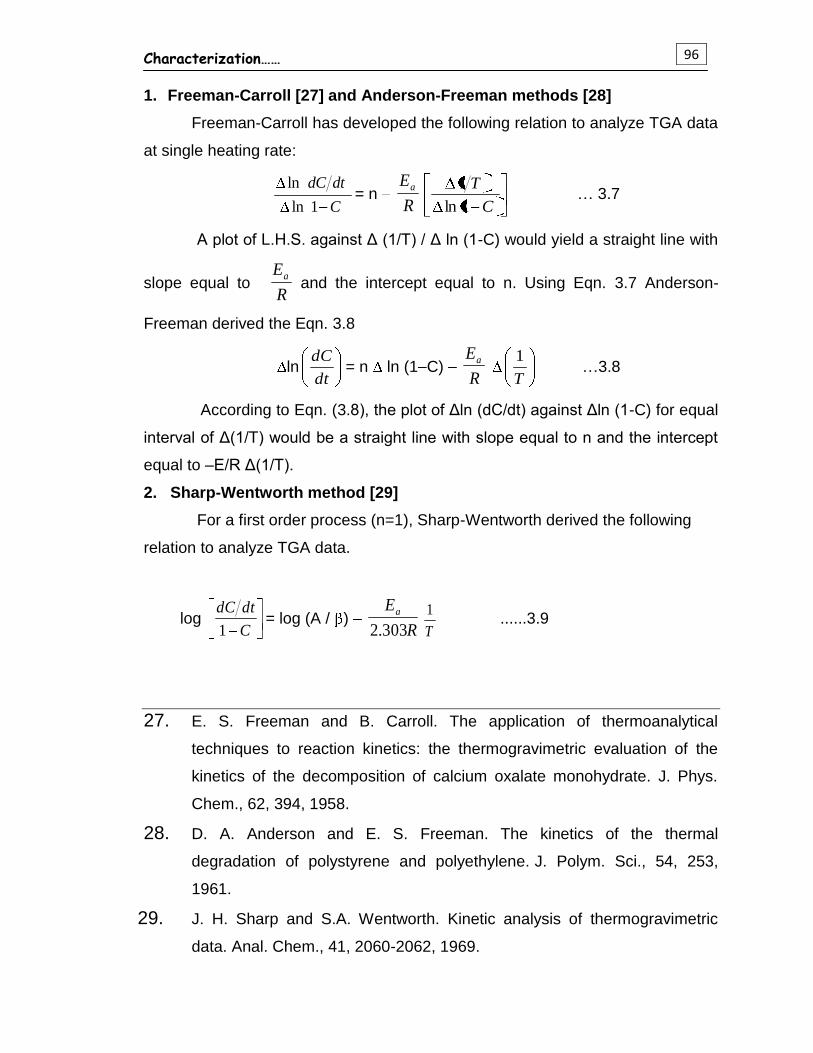
Characterization……
96
1. Freeman-Carroll [27] and Anderson-Freeman methods [28]
Freeman-Carroll has developed the following relation to analyze TGA data
at single heating rate:
ln
ln 1
dC dt
C= n
R
Ea
C
T
1ln
1 … 3.7
A plot of L.H.S. against Δ (1/T) / Δ ln (1-C) would yield a straight line with
slope equal to R
Ea
and the intercept equal to n. Using Eqn. 3.7 Anderson-
Freeman derived the Eqn. 3.8
lndt
dC= n ln (1 C)
R
Ea T
1
…3.8
According to Eqn. (3.8), the plot of Δln (dC/dt) against Δln (1-C) for equal
interval of Δ(1/T) would be a straight line with slope equal to n and the intercept
equal to –E/R Δ(1/T).
2. Sharp-Wentworth method [29]
For a first order process (n=1), Sharp-Wentworth derived the following
relation to analyze TGA data.
log C
dtdC
1= log (A / )
R
Ea
303.2 T
1 ......3.9
27. E. S. Freeman and B. Carroll. The application of thermoanalytical
techniques to reaction kinetics: the thermogravimetric evaluation of the
kinetics of the decomposition of calcium oxalate monohydrate. J. Phys.
Chem., 62, 394, 1958.
28. D. A. Anderson and E. S. Freeman. The kinetics of the thermal
degradation of polystyrene and polyethylene. J. Polym. Sci., 54, 253,
1961.
29. J. H. Sharp and S.A. Wentworth. Kinetic analysis of thermogravimetric
data. Anal. Chem., 41, 2060-2062, 1969.
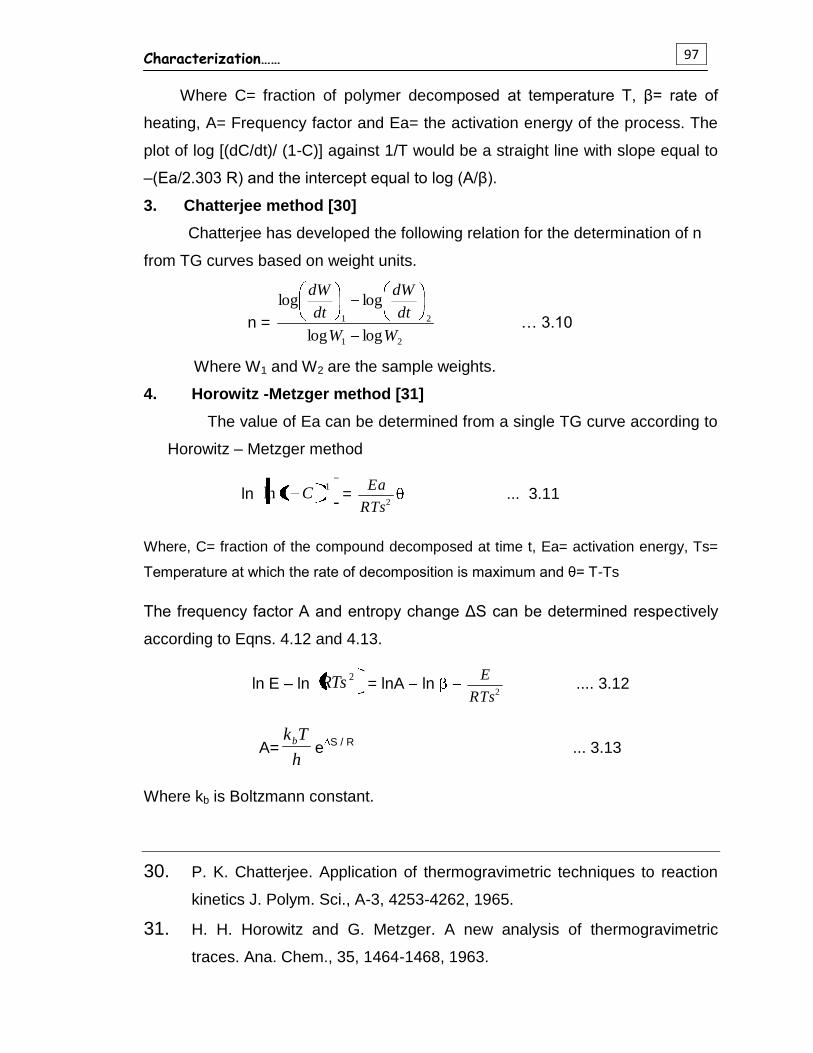
Characterization……
97
Where C= fraction of polymer decomposed at temperature T, β= rate of
heating, A= Frequency factor and Ea= the activation energy of the process. The
plot of log [(dC/dt)/ (1-C)] against 1/T would be a straight line with slope equal to
–(Ea/2.303 R) and the intercept equal to log (A/β).
3. Chatterjee method [30]
Chatterjee has developed the following relation for the determination of n
from TG curves based on weight units.
n = 21
21
loglog
loglog
WW
dt
dW
dt
dW
… 3.10
Where W1 and W2 are the sample weights.
4. Horowitz -Metzger method [31]
The value of Ea can be determined from a single TG curve according to
Horowitz – Metzger method
ln 11ln C =
2RTs
Ea ... 3.11
Where, C= fraction of the compound decomposed at time t, Ea= activation energy, Ts=
Temperature at which the rate of decomposition is maximum and θ= T-Ts
The frequency factor A and entropy change ΔS can be determined respectively
according to Eqns. 4.12 and 4.13.
ln E – ln 2RTs = lnA ln 2RTs
E .... 3.12
A=h
Tkb e S / R ... 3.13
Where kb is Boltzmann constant.
30. P. K. Chatterjee. Application of thermogravimetric techniques to reaction
kinetics J. Polym. Sci., A-3, 4253-4262, 1965.
31. H. H. Horowitz and G. Metzger. A new analysis of thermogravimetric
traces. Ana. Chem., 35, 1464-1468, 1963.

Characterization……
98
Experimental
TGA and DSC thermograms of ECAM, PMP and their mixed matrix
material were scanned on Perkin Elmer DSC-TGA (Model Pyris-I) at the heating
rate of 10oC/min in nitrogen atmosphere.
Results and Discussion
DSC thermograms of ECAM, PMP and mixed matrix material are
presented in Figs. 3.18 to 3.22. The DSC transitions are summarized in Table
3.10. Endothermic transitions (69-91oC) below 100oC are due to melting of
uncured ECAM and mixed matrices. Endothermic transition at 122oC for ECAM
due to some chemical change in is further supported by weight loss over the
temperature range 100-200oC in the TG thermogram (Fig.3.23) and other
endothermic transition at 225oC is due to some physical change (glass transition
temperature) is supported by partially no loss over the temperature range 200-
300oC. Endothermic transition at 415.7oC for ECAM-PMP-25 is due to some
physical change. A small but broad endothermic transition at 172.8oC for ECAM-
PMP-75 is probably due to glass transition temperature and other endothermic
transition at 388.7oC is due to some physical change. Again a small but broad
endothermic transition at 226.8oC for PMP is probably due to glass transition
temperature and other endothermic transition is due to some physical change.
Thus, physical/chemical change for each sample is supported in corresponding
TG curves (Fig.3.23) of the samples.
From Fig.3.23, it is evident that all samples apparently followed single step
degradation leaving 10-25% residue above 400oC except ECAM. The initial
decomposition temperature (To), decomposition range and temperature of
maximum decomposition along with % weight loss involved and % residue for
each sample are presented in table 3.10. ECAM is more thermally stable than
that of PMP, while mixed matrix materials possess intermediate thermal stability
of ECAM and PMP. Similar trend is also for observed in Tmax. High magnitude %
residue for ECAM above 400oC indicated formation of high cross-linked product
as a consequence of primary decomposition.

Characterization……
99
The plots of lndW
dt against lnW are presented in Figs. 3.24-3.28
Associated kinetic parameters and detail calculation schemes are presented in
Table 3.11to 3.15. The energy of activation (Ea), frequency factor (A),
temperature of maximum weight loss (Tmax) and entropy change (ΔS*) are
determined according to Anderson-Freeman method [28] (Eqn. 3.8) and are
reported in Table 3.16 from which, it is clear that cured samples followed
fractional (0.6-2.4) order degradation kinetics. Upon comparing kinetic
parameters of ECAM and PMP, it is observed that PMP is somewhat more rigid
than that of ECAM and this may be due to more cross-linking density. Maleate
branching courses low degree of cross-linking due to comparatively a large
distance between to branches and vinyl ester. In case of mixed matrix materials
both E & A are lower than parent materials indicated improvement in flexibility
mainly due to flexible maleate linkages. The entropy change ∆S* was determined
at their respective Tmax according to equation 3 and is also reported in Table 3.
The large and negative magnitudes of ∆S* confirmed highly ordered transition
state than individual polymer molecules.
Degradation process is a complex process and involves a variety of
reactions such as chain cleavage, branching, rearrangement, cross-linking, etc.
Selective degradation occurs from weak points in the chains and consequently
formation of free radials result, which further undergo a variety of reactions and
degrade at higher temperature (>4000C) to form low molecular weight
substances.
Ether and ester groups (main chain and side chain) in ECAM and ester
and pendent methyl groups in PMP are thermally weak points in the resin
molecules and therefore selective degradation is likely from these points.
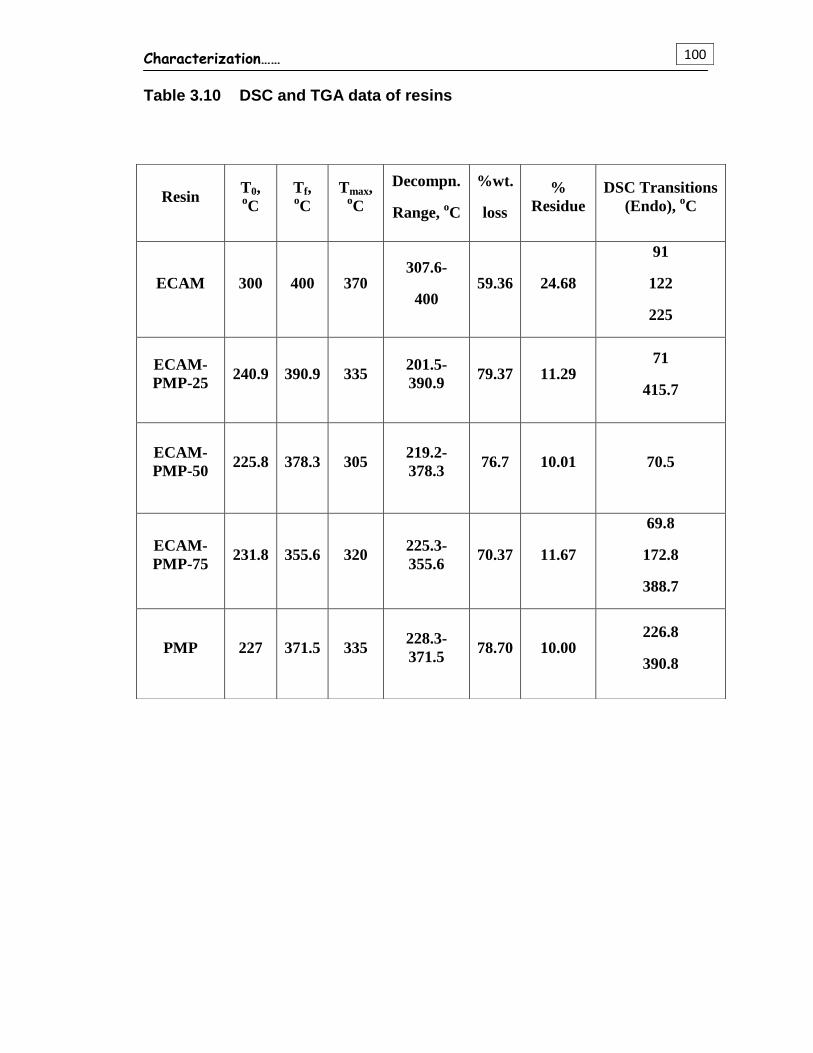
Characterization……
100
Table 3.10 DSC and TGA data of resins
Resin T0, oC
Tf, oC
Tmax, oC
Decompn.
Range, oC
%wt.
loss
%
Residue
DSC Transitions
(Endo), oC
ECAM 300 400 370 307.6-
400 59.36 24.68
91
122
225
ECAM-
PMP-25 240.9 390.9 335
201.5-
390.9 79.37 11.29
71
415.7
ECAM-
PMP-50 225.8 378.3 305
219.2-
378.3 76.7 10.01 70.5
ECAM-
PMP-75 231.8 355.6 320
225.3-
355.6 70.37 11.67
69.8
172.8
388.7
PMP 227 371.5 335 228.3-
371.5 78.70 10.00
226.8
390.8
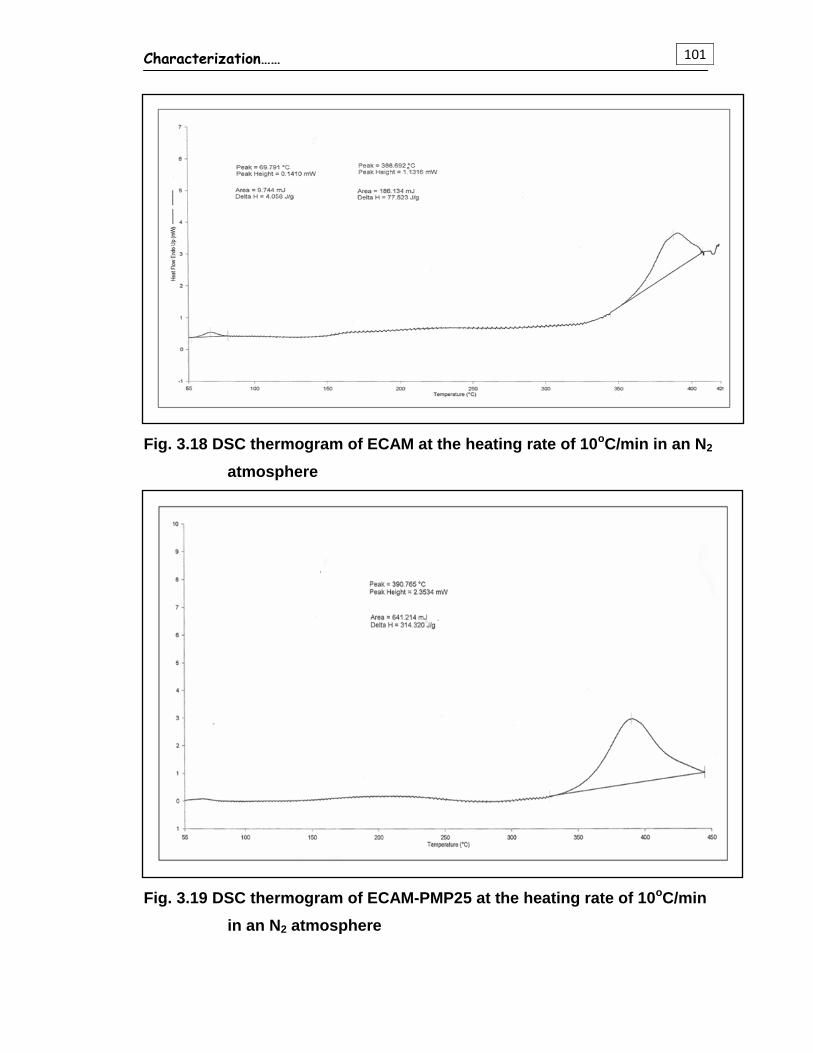
Characterization……
101
Fig. 3.18 DSC thermogram of ECAM at the heating rate of 10oC/min in an N2
atmosphere
Fig. 3.19 DSC thermogram of ECAM-PMP25 at the heating rate of 10oC/min
in an N2 atmosphere
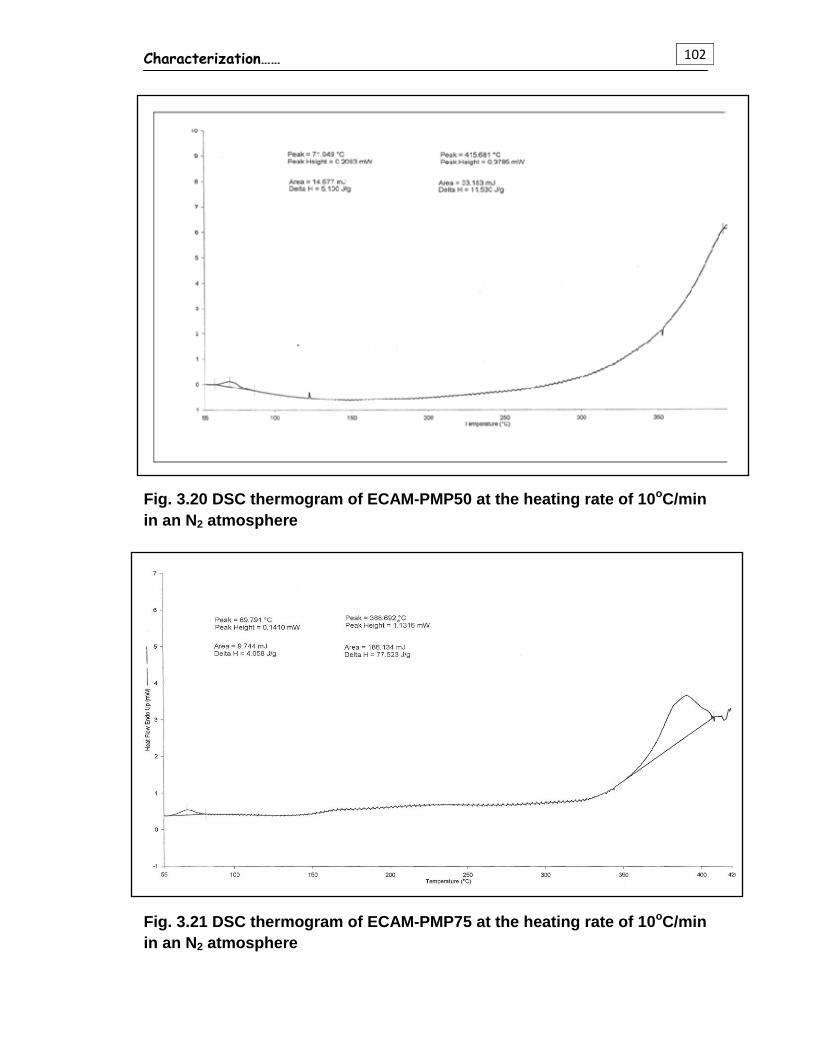
Characterization……
102
Fig. 3.20 DSC thermogram of ECAM-PMP50 at the heating rate of 10oC/min
in an N2 atmosphere
Fig. 3.21 DSC thermogram of ECAM-PMP75 at the heating rate of 10oC/min
in an N2 atmosphere
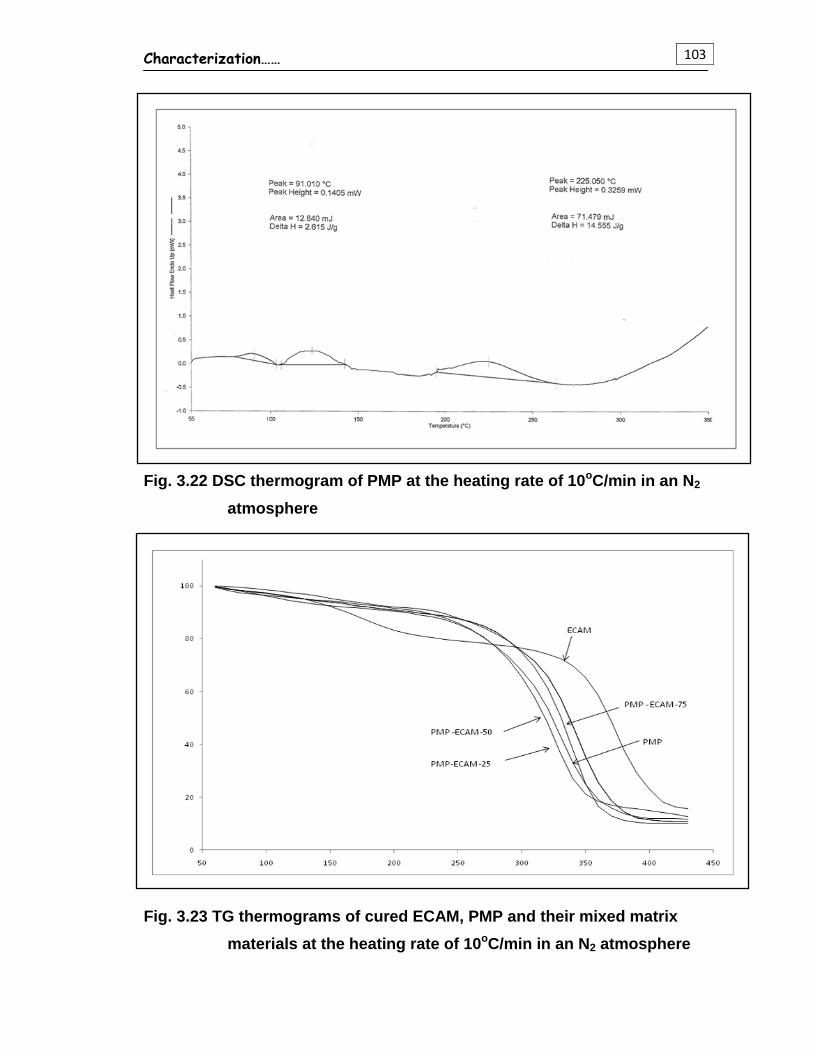
Characterization……
103
Fig. 3.22 DSC thermogram of PMP at the heating rate of 10oC/min in an N2
atmosphere
Fig. 3.23 TG thermograms of cured ECAM, PMP and their mixed matrix
materials at the heating rate of 10oC/min in an N2 atmosphere
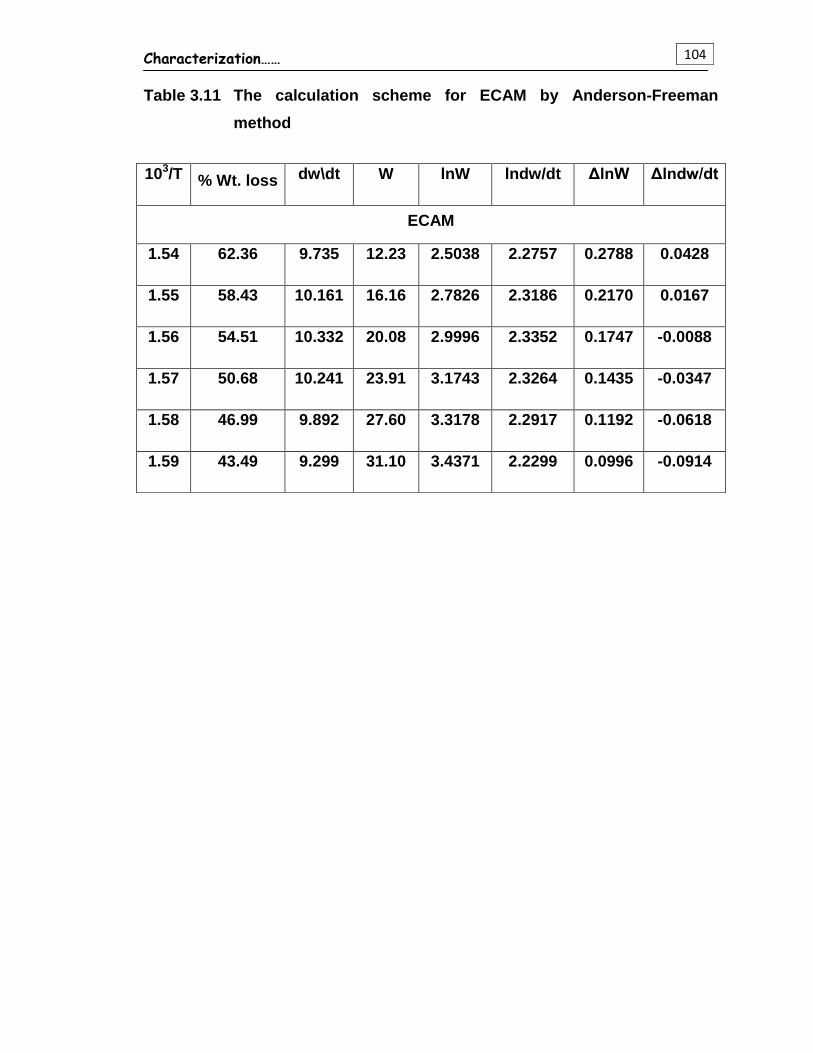
Characterization……
104
Table 3.11 The calculation scheme for ECAM by Anderson-Freeman
method
103/T % Wt. loss dw\dt W lnW lndw/dt ΔlnW Δlndw/dt
ECAM
1.54 62.36 9.735 12.23 2.5038 2.2757 0.2788 0.0428
1.55 58.43 10.161 16.16 2.7826 2.3186 0.2170 0.0167
1.56 54.51 10.332 20.08 2.9996 2.3352 0.1747 -0.0088
1.57 50.68 10.241 23.91 3.1743 2.3264 0.1435 -0.0347
1.58 46.99 9.892 27.60 3.3178 2.2917 0.1192 -0.0618
1.59 43.49 9.299 31.10 3.4371 2.2299 0.0996 -0.0914
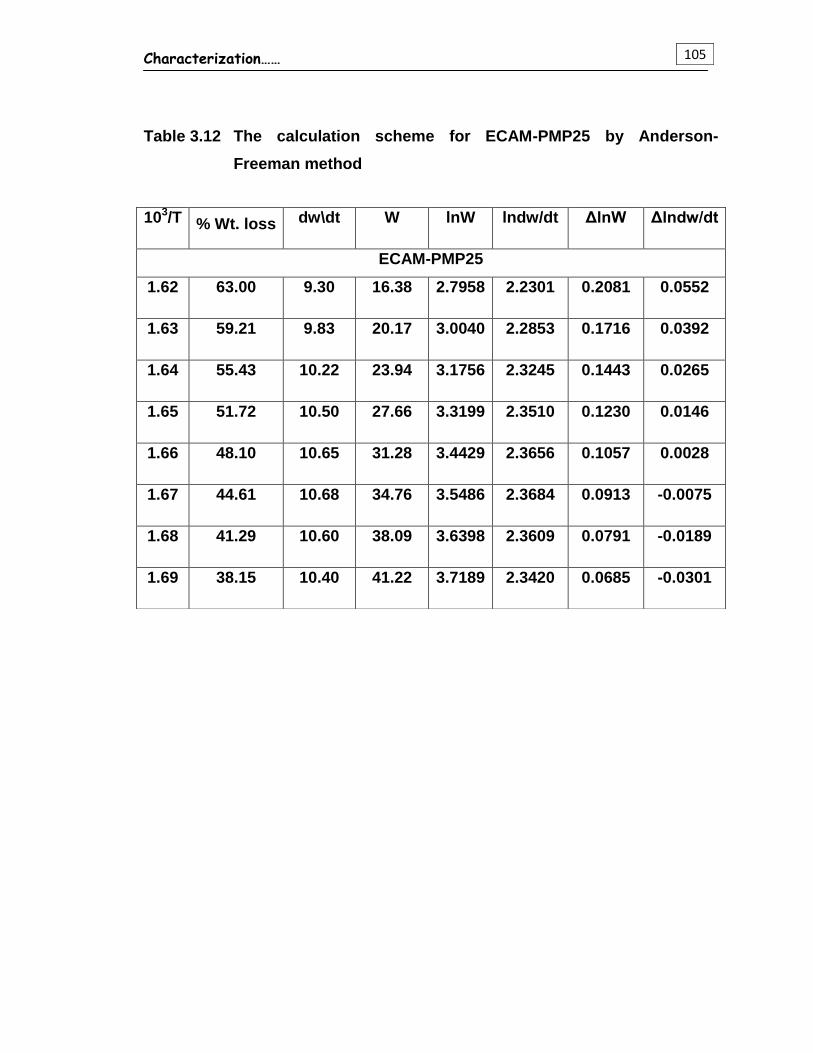
Characterization……
105
Table 3.12 The calculation scheme for ECAM-PMP25 by Anderson-
Freeman method
103/T % Wt. loss dw\dt W lnW lndw/dt ΔlnW Δlndw/dt
ECAM-PMP25
1.62 63.00 9.30 16.38 2.7958 2.2301 0.2081 0.0552
1.63 59.21 9.83 20.17 3.0040 2.2853 0.1716 0.0392
1.64 55.43 10.22 23.94 3.1756 2.3245 0.1443 0.0265
1.65 51.72 10.50 27.66 3.3199 2.3510 0.1230 0.0146
1.66 48.10 10.65 31.28 3.4429 2.3656 0.1057 0.0028
1.67 44.61 10.68 34.76 3.5486 2.3684 0.0913 -0.0075
1.68 41.29 10.60 38.09 3.6398 2.3609 0.0791 -0.0189
1.69 38.15 10.40 41.22 3.7189 2.3420 0.0685 -0.0301
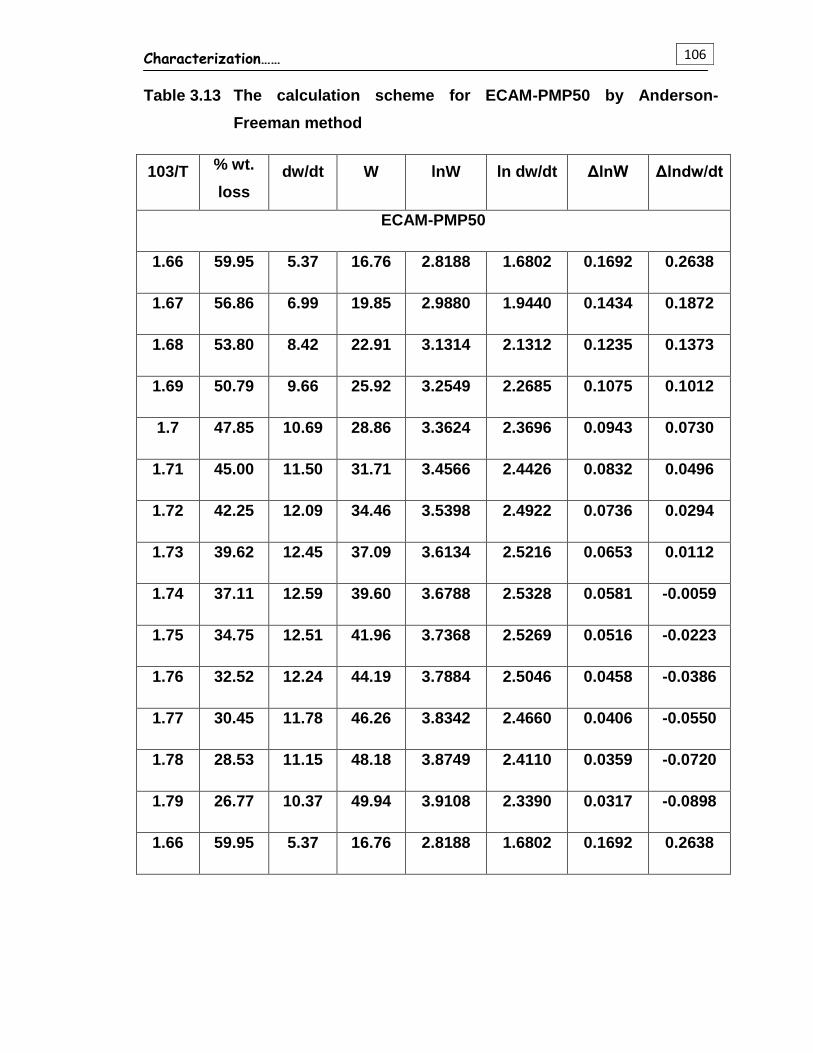
Characterization……
106
Table 3.13 The calculation scheme for ECAM-PMP50 by Anderson-
Freeman method
103/T % wt.
loss
dw/dt W lnW ln dw/dt ΔlnW Δlndw/dt
ECAM-PMP50
1.66 59.95 5.37 16.76 2.8188 1.6802 0.1692 0.2638
1.67 56.86 6.99 19.85 2.9880 1.9440 0.1434 0.1872
1.68 53.80 8.42 22.91 3.1314 2.1312 0.1235 0.1373
1.69 50.79 9.66 25.92 3.2549 2.2685 0.1075 0.1012
1.7 47.85 10.69 28.86 3.3624 2.3696 0.0943 0.0730
1.71 45.00 11.50 31.71 3.4566 2.4426 0.0832 0.0496
1.72 42.25 12.09 34.46 3.5398 2.4922 0.0736 0.0294
1.73 39.62 12.45 37.09 3.6134 2.5216 0.0653 0.0112
1.74 37.11 12.59 39.60 3.6788 2.5328 0.0581 -0.0059
1.75 34.75 12.51 41.96 3.7368 2.5269 0.0516 -0.0223
1.76 32.52 12.24 44.19 3.7884 2.5046 0.0458 -0.0386
1.77 30.45 11.78 46.26 3.8342 2.4660 0.0406 -0.0550
1.78 28.53 11.15 48.18 3.8749 2.4110 0.0359 -0.0720
1.79 26.77 10.37 49.94 3.9108 2.3390 0.0317 -0.0898
1.66 59.95 5.37 16.76 2.8188 1.6802 0.1692 0.2638
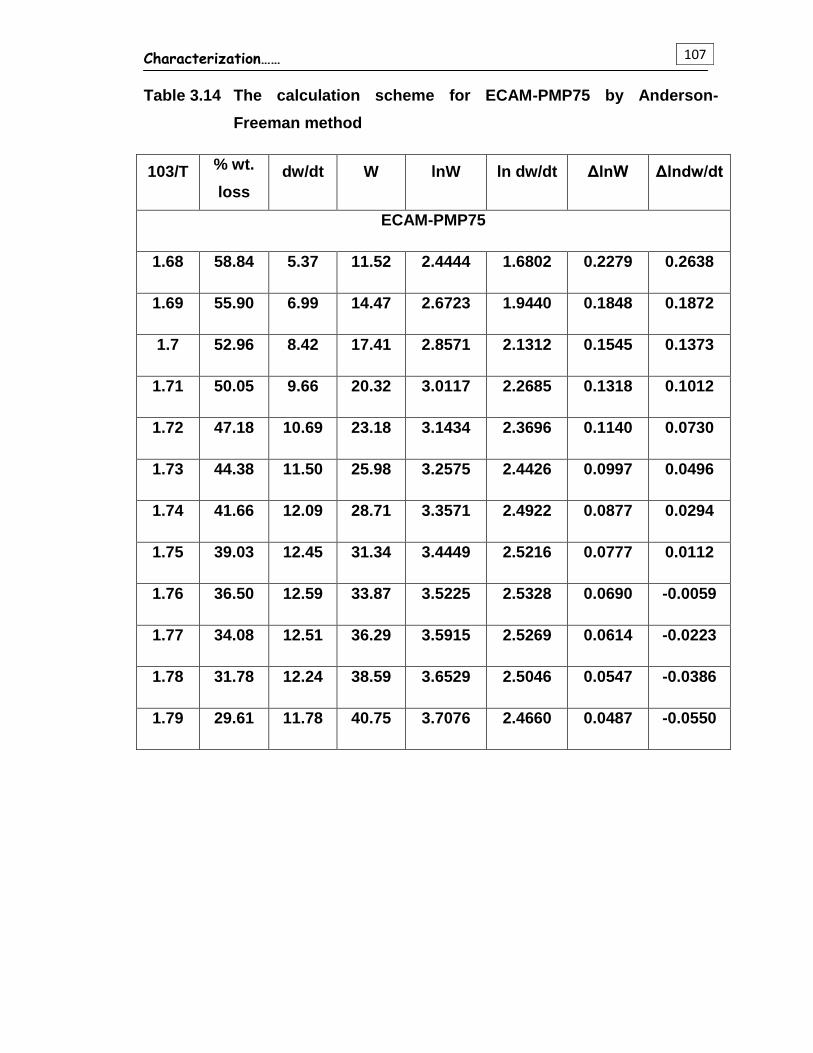
Characterization……
107
Table 3.14 The calculation scheme for ECAM-PMP75 by Anderson-
Freeman method
103/T % wt.
loss
dw/dt W lnW ln dw/dt ΔlnW Δlndw/dt
ECAM-PMP75
1.68 58.84 5.37 11.52 2.4444 1.6802 0.2279 0.2638
1.69 55.90 6.99 14.47 2.6723 1.9440 0.1848 0.1872
1.7 52.96 8.42 17.41 2.8571 2.1312 0.1545 0.1373
1.71 50.05 9.66 20.32 3.0117 2.2685 0.1318 0.1012
1.72 47.18 10.69 23.18 3.1434 2.3696 0.1140 0.0730
1.73 44.38 11.50 25.98 3.2575 2.4426 0.0997 0.0496
1.74 41.66 12.09 28.71 3.3571 2.4922 0.0877 0.0294
1.75 39.03 12.45 31.34 3.4449 2.5216 0.0777 0.0112
1.76 36.50 12.59 33.87 3.5225 2.5328 0.0690 -0.0059
1.77 34.08 12.51 36.29 3.5915 2.5269 0.0614 -0.0223
1.78 31.78 12.24 38.59 3.6529 2.5046 0.0547 -0.0386
1.79 29.61 11.78 40.75 3.7076 2.4660 0.0487 -0.0550
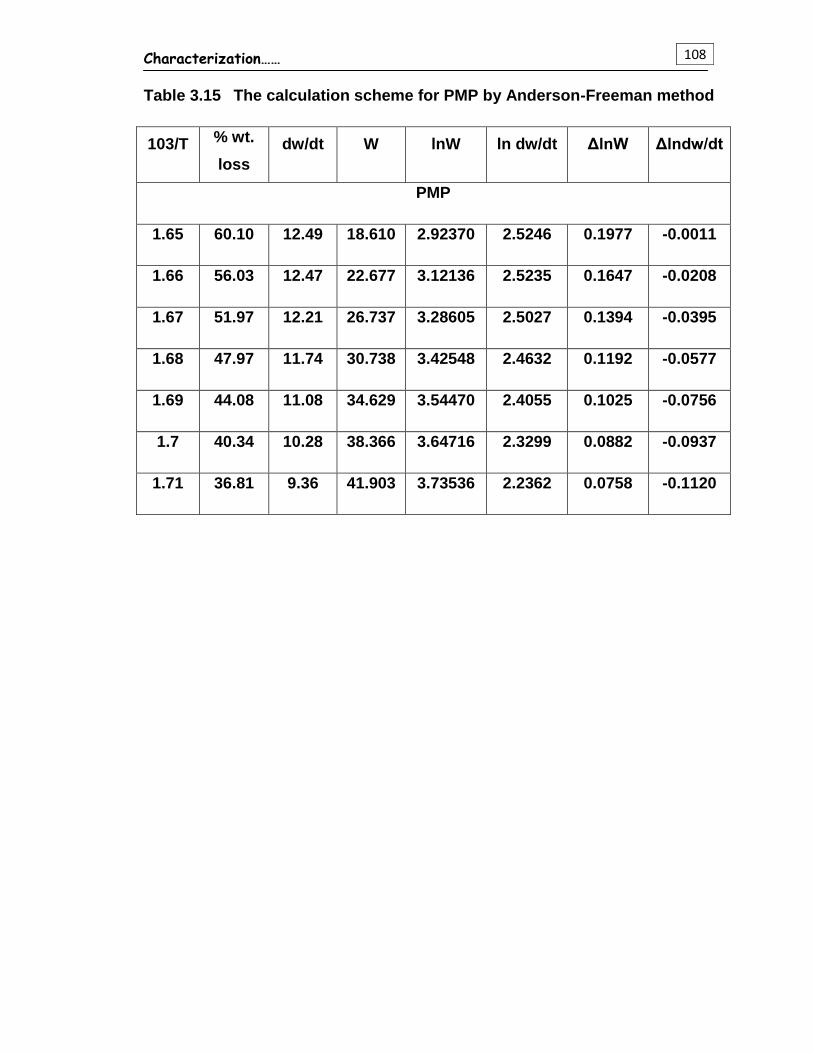
Characterization……
108
Table 3.15 The calculation scheme for PMP by Anderson-Freeman method
103/T % wt.
loss
dw/dt W lnW ln dw/dt ΔlnW Δlndw/dt
PMP
1.65 60.10 12.49 18.610 2.92370 2.5246 0.1977 -0.0011
1.66 56.03 12.47 22.677 3.12136 2.5235 0.1647 -0.0208
1.67 51.97 12.21 26.737 3.28605 2.5027 0.1394 -0.0395
1.68 47.97 11.74 30.738 3.42548 2.4632 0.1192 -0.0577
1.69 44.08 11.08 34.629 3.54470 2.4055 0.1025 -0.0756
1.7 40.34 10.28 38.366 3.64716 2.3299 0.0882 -0.0937
1.71 36.81 9.36 41.903 3.73536 2.2362 0.0758 -0.1120
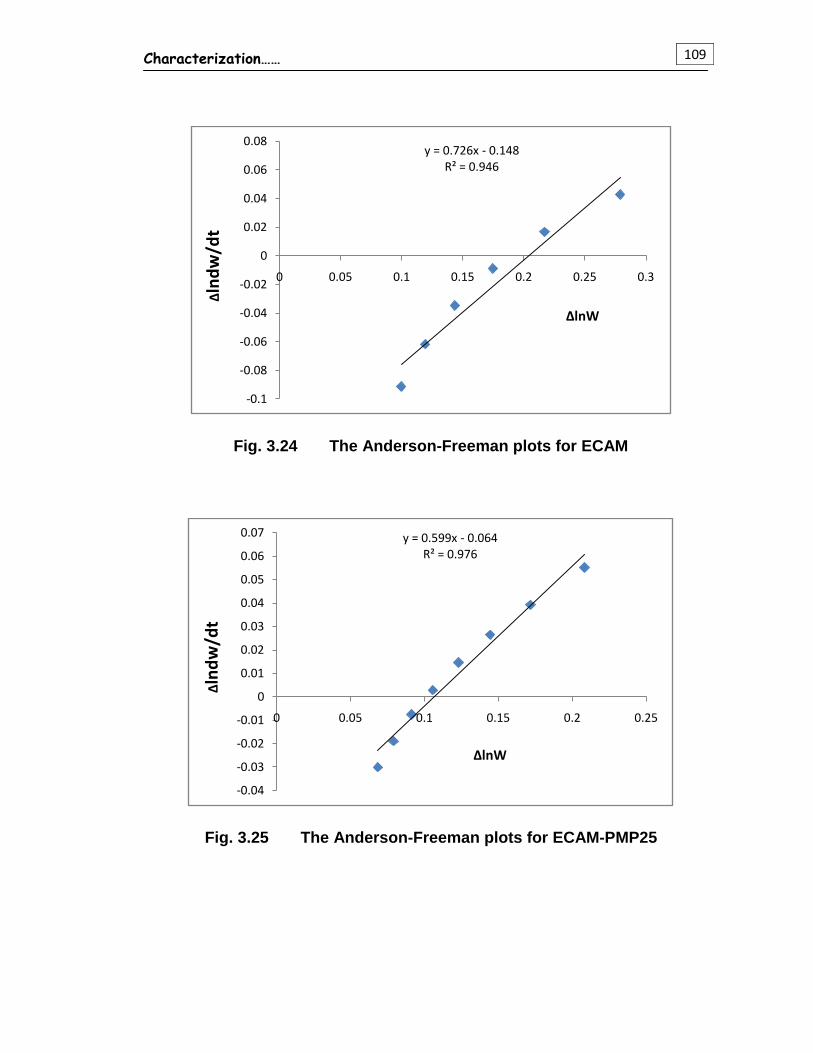
Characterization……
109
Fig. 3.24 The Anderson-Freeman plots for ECAM
Fig. 3.25 The Anderson-Freeman plots for ECAM-PMP25
y = 0.726x - 0.148R² = 0.946
-0.1
-0.08
-0.06
-0.04
-0.02
0
0.02
0.04
0.06
0.08
0 0.05 0.1 0.15 0.2 0.25 0.3
Δln
dw
/dt
ΔlnW
y = 0.599x - 0.064R² = 0.976
-0.04
-0.03
-0.02
-0.01
0
0.01
0.02
0.03
0.04
0.05
0.06
0.07
0 0.05 0.1 0.15 0.2 0.25
Δln
dw
/dt
ΔlnW
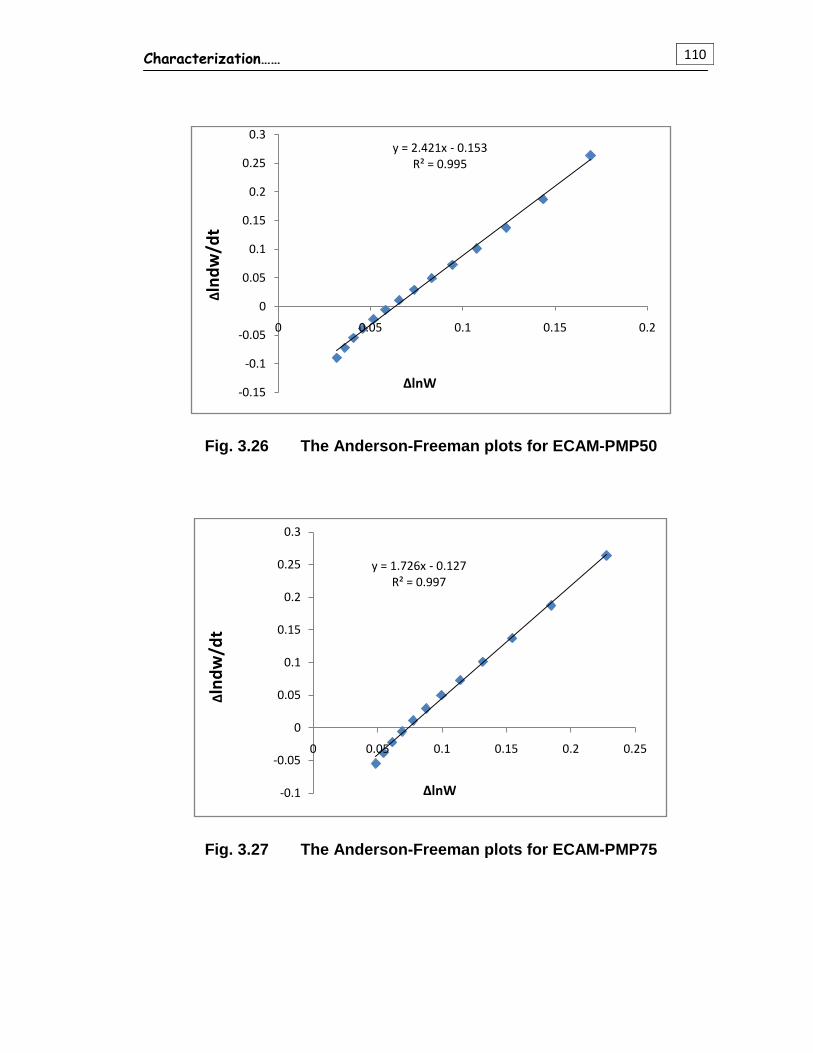
Characterization……
110
Fig. 3.26 The Anderson-Freeman plots for ECAM-PMP50
Fig. 3.27 The Anderson-Freeman plots for ECAM-PMP75
y = 2.421x - 0.153R² = 0.995
-0.15
-0.1
-0.05
0
0.05
0.1
0.15
0.2
0.25
0.3
0 0.05 0.1 0.15 0.2
Δln
dw
/dt
ΔlnW
y = 1.726x - 0.127R² = 0.997
-0.1
-0.05
0
0.05
0.1
0.15
0.2
0.25
0.3
0 0.05 0.1 0.15 0.2 0.25
Δln
dw
/dt
ΔlnW
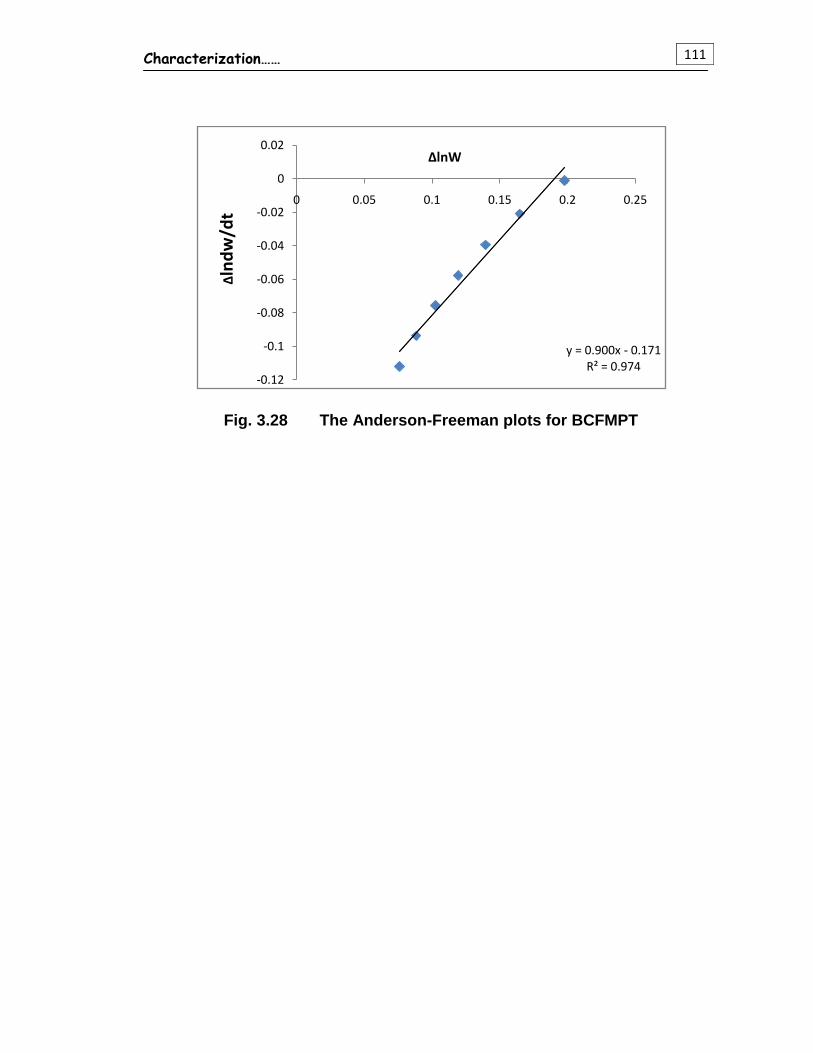
Characterization……
111
Fig. 3.28 The Anderson-Freeman plots for BCFMPT
y = 0.900x - 0.171R² = 0.974
-0.12
-0.1
-0.08
-0.06
-0.04
-0.02
0
0.02
0 0.05 0.1 0.15 0.2 0.25
Δln
dw
/dt
ΔlnW
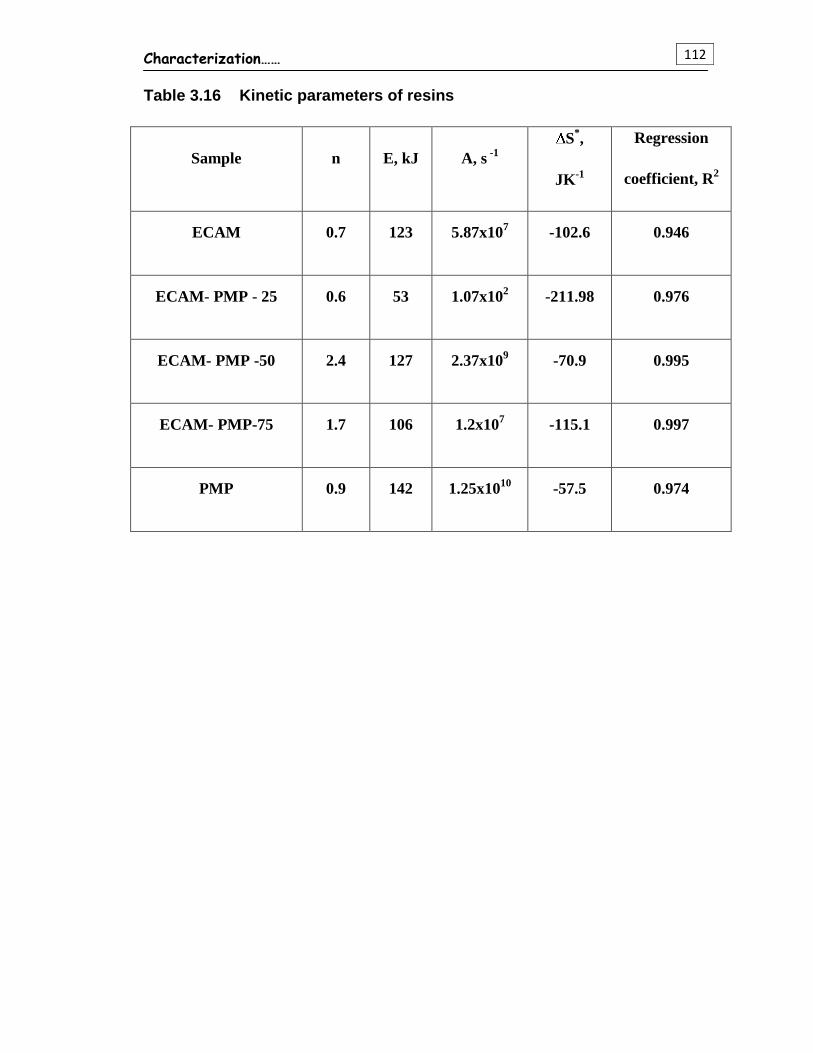
Characterization……
112
Table 3.16 Kinetic parameters of resins
Sample n E, kJ A, s -1
S*,
JK-1
Regression
coefficient, R2
ECAM 0.7 123 5.87x10⁷ -102.6 0.946
ECAM- PMP - 25 0.6 53 1.07x10² -211.98 0.976
ECAM- PMP -50 2.4 127 2.37x10⁹ -70.9 0.995
ECAM- PMP-75 1.7 106 1.2x10⁷ -115.1 0.997
PMP 0.9 142 1.25x10¹⁰
-57.5 0.974
Chapter – 4
Fabrication and physico-
chemical characterization
of the composites
Fabrication of Composites
112
This chapter of the thesis describes the composites based on jute fibers.
This chapter is further subdivided into three sections:
Section-I: Fabrication of composites
Section-II: Mechanical and electrical properties of composites
Section-III: Water uptake study of composites
Section-I: Fabrication of composites
There are many processes which are applicable for fabrication of
composites such as,
Wet filament winding
Hand lay-up technique
Automated tape placement
Resin transfer molding
Pultrusion
Injection molding
Vacuum bagging
Machine finishing
Among all the processes, hand lay-up technique is the cheapest process
and all the composites reported in this chapter are fabricated by this technique.
Many researchers have reported the fabrication of composites by hand lay-up
technique since 1978 onwards [1-7].
Appropriate selection of fabrication-process is important part in composite
preparation because manufacturing process is directly affects the cost of the
composite. When the uses of composite at any specific applicable field like space
application, where cost is not prior point than applicability, at that field any
suitable process can be used. But hand lay-up technique is better for routine
application fields like manufacturing hardboard, construction devices, partition
board, medium density fiber boards, panels, packaging, etc. than any other
Fabrication of Composites
113
techniques. Many composite industries and research institutes, which are
working on composites in India using hand lay-up technique for fabrication of
composites.
Woven jute fibers (Brown jute, Corchorus Capsularis) used in present
study was collected from the local market. ECAM resin was synthesized and
purified according to section 6 of Chapter 2.
Fabrication of Mixed matrix materials of epoxy-acrylate-maleate and
Unsaturated polyester resin composites
ECAM and unsaturated polyester resin (PMP) used for the preparation of
hybrid composite were prepared as under.
1. Carignani and Giancarlo. GRP expanded plastic composites. Kunstat. Ger.
Plast., 68, 8-17, 1978.
2. P. K. Pal. Jute reinforced plastics: A low cost composite material. Plast. and
Rubber Proc. and Appl., 4, 215-222, 1984.
3. Mc Cormack and E. William. Fabrication and joining of polymer-matrix
composites: Flight-vehicle materials, structures, and dynamics–assessment
and future directions. J. Appl. Polym. Sci., 1, 348-356, 1994.
4. M. A. Hayat and S. M. A. Suliman. Mechanical and structural properties of
glass reinforced phenolic laminates. Polym. Test., 17, 79-85, 1998.
5. J. Sinke. Manufacturing of GLARE parts and structures. App. Compos.
Mater., 10, 293-305, 2003.
6. S. R. Dyer, L. V. J. Lassila, M. Jokinen and P. K. Vallittu. Effect of cross-
sectional design on the modulus of elasticity and toughness of fiber-reinforced
composite materials. J. Prosthetic Dentistry, 94, 219-226, 2005.
7. P. Thomas, K. Dwarkanath, P. Sampathkumaran, S. Seetharamu and
Kishore. Influence of moisture absorption on electrical characteristics of
glass-epoxy polymer composite system. Proceedings of the International
Symposium on Electrical Insulating Materials, 3, 605, 2005.
Fabrication of Composites
114
Mixed matrix materials (ECAM and PMP of varying compositions) used for
the composite preparation were 50 wt. % of jute fabric (15 cm x 15 cm and 5 cm
x 5 cm). Required matrix materials (Table-4.1) were dissolved in 100/10 ml
acetone and then were added 5 ml cobalt naphthenate and 5 ml MEKP as an
initiator. The solution was applied to jute sheets with a smooth brush. Ten such
prepregs were dried in sunlight for 15 min, staked one over other and pressed
between two preheated stainless steel plates under 15.4 MPa pressure at 150oC
for 2 h and at room temperature for 12 h. Silicone spray was used as a mold
releasing agent. The edges of 5 cm x 5 cm composites were sealed using same
matrix materials.
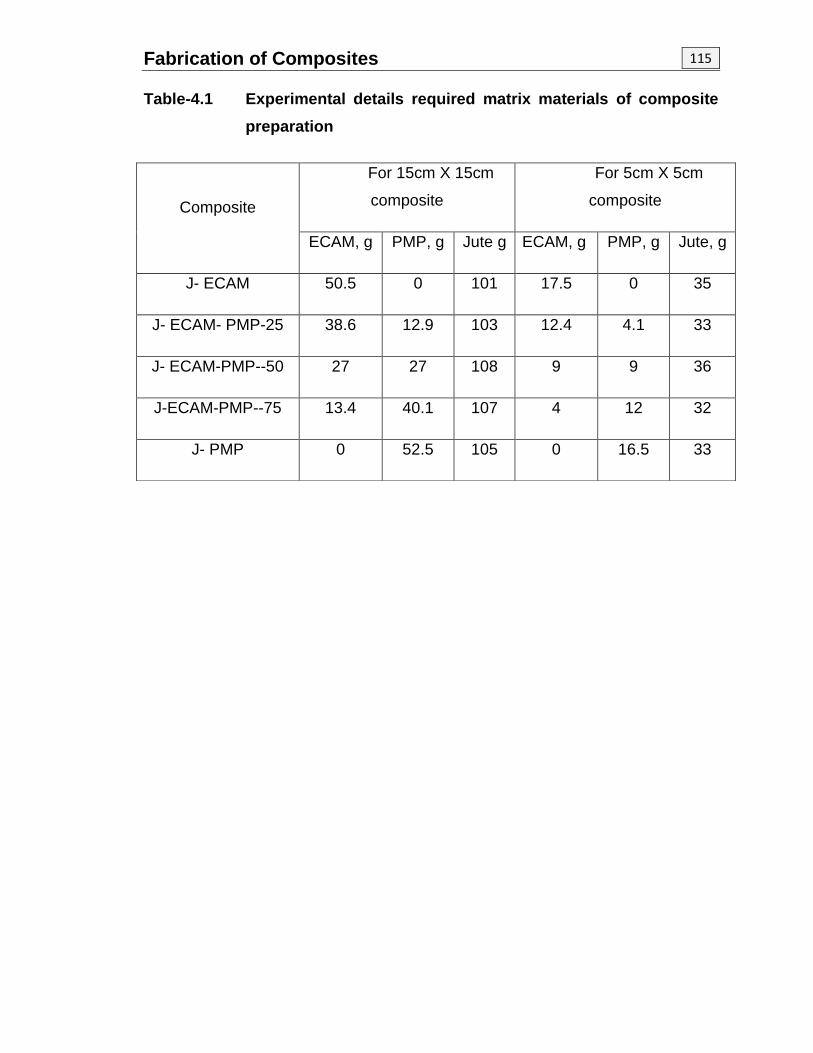
Fabrication of Composites
115
Table-4.1 Experimental details required matrix materials of composite
preparation
Composite
For 15cm X 15cm
composite
For 5cm X 5cm
composite
ECAM, g PMP, g Jute g ECAM, g PMP, g Jute, g
J- ECAM 50.5 0 101 17.5 0 35
J- ECAM- PMP-25 38.6 12.9 103 12.4 4.1 33
J- ECAM-PMP--50 27 27 108 9 9 36
J-ECAM-PMP--75 13.4 40.1 107 4 12 32
J- PMP 0 52.5 105 0 16.5 33
Fabrication of Composites
116
Section-II: Mechanical and electrical properties of composites
Mechanical properties
The foremost requirement for a designer of a composite product is the
data on the mechanical properties, which enable him to select the one best
suited for the desired application. Recently, composites are being widely used as
load bearing and engineering applications by allowing various fibers of high
strength as a base for composite fabrication. By selection of appropriate matrix-
reinforcing systems, desired properties can be achieved.
During service, composite has to suffer the cyclic stress, tensile, flexural,
impact forces, bending, friction, wear and different types of stresses on it.
Depending upon the mode of application, composite must be mechanically
strong to suit the job. The geometrical response to loading leads to a wide range
of mechanical properties grouped under stress-strain properties, visco-elasticity
and failure properties. The various mechanical properties of the composites
depend upon following factors:
Type of reinforcing fiber
Fiber-matrix adhesion
Time and temperature of cure
Molecular weight of polymer
Fiber strength, modulus, fiber length and orientation
Compatibilizers and impact modifiers
Fiber content
Presence of soft and hard segments
Fiber loading, etc.
Depending on the property to be measured, standard test methods have
been developed. However, they vary from each other in terms of loading
conditions, shape and size of the test specimens, etc.
The mechanical properties of the plastic materials can be broadly
classified into the following types:
Short-term mechanical properties
They are measured at a constant rate of stress or strain in different modes
Tensile strength

Fabrication of Composites
117
Flexural strength
Compression strength
Shear strength
Long-term mechanical properties
They are the measurements of deformation or stress decay with respect to
time in static conditions
Visco-elasticity
Creep
Stress relaxation
Surface properties
The mechanical properties of the surface include
Hardness
Scratch resistance
Friction
Abrasion resistance
The study of stress in relation to strain in tension depicts the tensile
properties of the material. Tensile properties of materials are most widely useful
for engineering design and understanding quality characteristics of polymeric
materials. In tensile testing, samples can be prepared by different ways namely
molding, compression molding and punching. In present investigation samples
were prepared by compression molding as per prescribed standard tests for
tensile and flexural testing.
The tensile strength ( ) of the composites was determined according to
Eqn.4.1:
Wσ =
A … 4.1
Where W= the load value at break and A=original cross sectional area of the
sample
Flexural strength is the resistance of material under the bending mode.
Flexural properties are useful for quality control and classification of materials
with respect to bending strength and stiffness. They depend upon various factors
namely
Fabrication of Composites
118
Type and amount of additives, which can soften or reinforce the material
Method of sample preparation e.g. molding or machining
Temperature
Surface roughness, sinks, voids and other imperfections
Anisotropy
Accuracy in measured dimensions.
Flexural strength of the composites was determined according to Eqn.4.2:
Flexural strength = 1.5FL
2wt … 4.2
Where F = breaking load, L = span length (60-65mm), w = sample width (mm)
and t = sample thickness (mm)
The mechanical behavior of polymers can be divided into three main
groups: (I) Elastic (II) Plastic and (III) Brittle. The same sample can behave as a
brittle, tough or rubber-like above and below the glass transition temperature.
Slow rate of testing will simulate stiffer molecules and harder properties. The
mechanical tests are classified as impact, tensile, flexural, hardness, etc. based
on applied deforming stress.
The mechanical properties may best be divided into three sections:
(1) Reversible rigidity/flexibility or modulus, which measures the stiffness of
the polymer
(2) Mechanical failure by yielding (Permanent deformation) or breaking at low
or high rates of test or under a multiple cyclic stress
(3) Complex mechanical properties involving a combination of these simpler
processes
Joffe et al. [8] have studied the composites based on flex as a reinforcing
fiber. They have fabricated natural fiber composites (NFC) and compared their
mechanical properties with glass mat thermoplastics (GMT). The investigation
showed that NFC have mechanical properties such as matrix/fiber compatibility,
stiffness, strength and fracture toughness are as high as GMT or even higher in
8. R. Joffe, L. Wallstrom and L. A. Berflund. Natural fiber composites based
on flax matrix effects. Proceedings of International Scientific Colloquium,
Modeling for Saving Resources, Riga, May 17, 2001.
Fabrication of Composites
119
some cases. They have concluded that such a good mechanical properties in
combination with lightweight makes use of NFC very attractive for automotive
industries.
Vajrasthira et al. [9] have investigated the mechanical and dynamic
mechanical properties of thermoplastic polyurethane (TPU) elastomers
reinforced with two types of aramid short fibers, m-aramid (Teijin-Conex) and
copoly(p-aramid) (Technora) with respect to the fiber loading. In general, both
types of composites exhibited very similar stress-strain behaviors, except that
Technora-TPU was stronger than Conex-TPU. This was primarily due to the
intrinsic strength of the reinforcing fibers. The morphologies of cryogenically
fractured surfaces of the composites and extracted fibers, investigated with
scanning electron microscopy, revealed possible polar-polar interactions
between the aramid fibers and TPU matrices.
Reboredo et al. [10] have fabricated the composites of unsaturated
polyester using saw dust and Eucalyptus saligna oil or calcium carbonate as
reinforcing fillers and studied the effect of filler concentration and surface
treatment on the ultimate strength, elongation, modulus and dynamic mechanical
properties.
Gassan [11] have fabricated the composite of jute-polypropylene and
apply fiber-surface treatment and studied the effect of filler concentration and
surface treatment on the ultimate strength, elongation, modulus and dynamic
mechanical properties.
9. C. Vajrasthira, T. Amornsakchai and S. B Limcharoen. Fiber-matrix
interactions in aramid-short-fiber-reinforced thermoplastic polyurethane
composites. J. Appl. Polym. Sci., 87, 1059-1067, 2003.
10. M. M. Reboredo, M. I. Aranguren and N. E. Marcovich. Composites from
saw dust and unsaturated polyester. J. Appl. Polym. Sci., 61,119-124,
1996.
11. J. Gassan and A. K Bledzki. The influence of fiber-surface treatment on
the mechanical properties of jute-polypropylene composites. Composites
Part-A. 28, 1001-1005, 1997.
Fabrication of Composites
120
Tay et al. [12] have fabricated the empty fruit bunch–polyurethane (EFB–
PU) composites reacting EFB and polyethylene glycol (PEG) with diphenyl
methane diisocyanate (MDI) and determined their tensile properties. The results
revealed that the tensile properties were influenced by the percentage of -OH
groups of EFB, coupled with the reinforcing effect of EFB filler. In addition to that,
the formation of PU matrix from PEG and isocyanate proved to be crucial in
producing good stress transfer from the matrix to the filler. SEM study showed
that surface area of the filler also contributed towards the strength of the
composites.
Gassan et al. [13] have fabricated flax fiber reinforced polyurethane
composites and determined their mechanical properties. Flax fibers coated with
two types and various amounts of silicones. Coating conditions have been found
to affect strongly the composites properties. The effect of these two types and
different amounts of silicone on the impact toughness, flexural strength and
modulus, dynamic modulus and loss-energy and notch sensitivity are
determined.
Carvalho et al. [14] have evaluated the tensile and impact behavior of jute
fabrics-polyester composites as a function of the fabric style (knitted or weaved
clothes), fiber weight fraction, and direction of the applied load. The tensile
properties of plain-weave-fabric-reinforced composites (PWF) were higher than
ethane diol to prepare a series of sheets. Their structure and properties were
12. K. R. Ahmadhilmi, A. Abubakar and H. D. Rozman. Polyurethane (PU)-oil
palm empty fruit bunch (EFB) composites: the effect of FBG reinforcement
in mat form and isocyanate treatment on the mechanical properties.
Polym. Testing, 23, 559-565, 2004.
13. J. Gassan, T. Dietz and A. K. Bledzki. Effect of silicone interphase on the
mechanical properties of flax-polyurethane composites. Compos
Interfaces, 7, 103-115, 2000.
14. L. H. de Carvalho, J. M. F. Cavalcante and J. R. Md.’ Almeida.
Comparison of the mechanical behavior of plain weave and plain weft knit
jute fabric-polyester-reinforced composites. Polym. Plast. Technol. Eng.
45, 791-797, 2006.

Fabrication of Composites
121
those of plain weft knit cloth composites (WKT) and were dependent on fiber
content and test direction. The properties of the WKT, however, were
independent of these variables. The obtained results indicate that the orthogonal
fiber alignment of weaved cloths favors anisotropy, while the interconnected
loops in knit fabrics favors isotropy. The results also indicated weak fiber-matrix
interactions in both fabrics and a better fabric impregnation for the plain weave
fabric, if compared with that of the knit fabric. The impact strength of both
composites was higher than that of the matrix and was shown to increase with
fiber content. WKT-reinforced composites showed better impact absorption
capacity than PWF composites.
Sastra et al. [15] have determined the tensile strength of arenga pinnata
fiber as a natural fiber and epoxy resin as a matrix. For this the arenga pinnata
fibers were mixed with epoxy resin at the various fiber weight percentages of
10%, 15%, and 20% arenga pinnata fiber and with different fiber orientations
such as long random, chopped random, and woven roving. Results from the
tensile tests of arenga pinnata fiber reinforced epoxy composite were that the
10 wt% woven roving arenga pinnata fiber showed the highest value for
maximum tensile properties. The tensile strength and Young's modulus values
for 10 wt. % of woven roving arenga pinnata fiber composite are 51.7 MPa and
1255.8 MPa, respectively. The above results indicated that the woven roving
arenga pinnata fiber has a better bonding between its fiber and matrix compared
to long random arenga pinnata fiber and chopped random arenga pinnata fiber.
Scanning electron microscopy (SEM) tests were also carried out after tensile
tests to observe the interface of fiber and matrix adhesion.
Wang et al. [16] have fabricated waterborne polyurethane (WPU)
composites and have studied the effect of crosslinking agent on the different
properties. Waterborne polyurethane (WPU) and casein (1:1 by weight) were
blended at 90°C for 30 min, and then were crosslinked by adding 1-10 wt %
ethane diol to prepare a series of sheets. Their structure and properties were
15. H. Y. Sastra, J. P. Siregar, S. M. Sapuan and M. M. Hamdan. Tensile
properties of arenga pinnata fiber-reinforced epoxy composites. Polym.
Plast. Technol. Eng. 45, 149-155, 2006.
Fabrication of Composites
122
characterized by using infrared spectroscopy, scanning electron microscopy
(SEM), thermogravimetric analysis (TGA), dynamic mechanical analysis, and
tensile testing. The results indicated that crosslinked blend sheets exhibited a
certain degree of miscibility, and exhibited much higher tensile strength and
water resistivity than did the WPU, casein, and the uncrosslinked blend from
WPU and casein. When the ethane diol content was 2 wt %, the tensile strength
and elongation at break of crosslinked sheets achieved 19.5 MPa and 148% in
the dry state, and 5.0 MPa and 175% in the wet state, respectively. A 2 wt %
content of ethane diol played an important role in the enhancement of
mechanical properties, thermal stability, and water resistivity of the blends of
WPU and casein.
Cao et al. [17] have fabricated water borne polyurethane (WPU)/starch
(ST) with different contents (10-90 wt %) composites and studied the effect of
different starch content on the various properties of the composites. Their
miscibility, structure, and properties were investigated by wide-angle X-ray
diffraction (WAXD), scanning electron microscope (SEM), different scanning
calorimetry (DSC), dynamic mechanical thermal analysis (DMTA), and the tensile
tests, respectively. The results indicated that tensile strength of composite
materials not only dependent on the starch content, but also related to the
microstructure of WPU. The sample WPU2 (1.75 of -NCO/-OH molar ratio)
exhibited hard-segment order, but WPU1 (1.25 of -NCO/-OH molar ratio) had no
hard-segment order. The blend material from 80 wt % WPU1 and 20 wt % starch
exhibited better tensile strength (27MPa), elongation at break (949%), and
toughness.
Fengchang and Weibo [18] have studied the dynamic mechanical and
vibration damping properties of polyether urethane and epoxy composites. The
16. N. Wang, Y. Lu, Y. Du and L. Zhang. Properties of crosslinked
casein/waterborne polyurethane composites. J. Appl. Polym. Sci. 91, 332-
338, 2004.
17. X. Cao, J. Huang, G. Yang, Y. Wang and L. Zhang. Structure-properties
relationship of starch/waterborne polyurethane composites. J. Appl. Polym.
Sci. 90, 3325-3332, 2003.
Fabrication of Composites
123
experimental results showed that the crosslink density was an important factor
that influenced the loss factor of polyether-urethane damping materials;
increasing the amount of pendant methyl of the backbone contributed to raising
the value of the loss factor (tan ) and broadened the damping temperature
range; adding the planar filler can increase the shear motion and the internal
dissipation in polyurethane materials. As the thickness ratio and the Young's
modulus of the constraining layer increase, the composite loss factor increased
significantly.
Kumar and Siddaramaiah [19] have fabricated the alkali treated and
untreated bamboo fibers (Bambusa balcooa) reinforced polyurethane/ PMMA
interpenetrating polymer network (IPN) based composites. The mechanical
properties, like tensile strength and tensile modulus, and the chemical resistance
of bamboo fibers before and after coating with PU and PU/PMMA IPN have been
studied. Improvement in tensile strength, tensile modulus and chemical
resistance of bamboo fibers were observed after coating with polymers. The
PU/PMMA coated system showed better performance as compared to PU-
coated bamboo fiber composite.
Musa et al. [20] have produced rice husk (RH)-unsaturated polyester
(USP) composites and investigated their tensile, flexural, impact and dimensional
properties. From the results, it was observed that the tensile, flexural and impact
properties decreased as the percentage of filler was increased. The composites
with smaller filler size displayed higher tensile, flexural and impact properties
18. Z. Fengchang and H. Weibo. Studies on the dynamic mechanical and
vibration damping properties of polyether-urethane and epoxy composites.
J. Appl. Polym. Sci. 50, 277-283, 1993.
19. H. Kumar and Siddaramaiah. Studies on bamboosa balcooa bamboo fiber
for green composites with polyurethane and polyurethane / poly (methyl
methacrylate) semi-interpenetrating polymer network. J. Bamboo and
Rattan, 3, 237-243, 2004.
20. L. Musa, A. Abubakar and H. D. Rozman. The mechanical and
dimensional properties of rice husk (RH)-unsaturated polyester
composites. Polym. Plast. Technol. Eng., 44, 489-500, 2005.
Fabrication of Composites
124
than those with larger filler size. This might be attributed to the higher surface
area of the RH, which resulted in more interaction between the -OH groups of RH
of the polyester matrix. The water absorption and thickness swelling of the
composites showed an increasing trend as the immersion time was increased.
However, samples with smaller filler size showed lower water absorption and
thickness swelling than those with larger filler size.
Hazlan et al. [21] have produced rice husk (RH)–glass fiber (GF) hybrid
polyester composites have been produced. Tensile, flexural, impact, and
dimensional properties of the composites have been investigated. From the
results, it was observed that GF imparted higher tensile, flexural, and impact
properties. The presence of RH in the matrix produced composites with
comparable tensile, flexural, and impact properties especially in the middle range
of RH:GF ratios. Longer GF had a profound effect on the strength and
toughness, while the shorter GF contributed the modulus of the composites.
Ang et al. [22] have fabricated polyurethane composites with rice husk
(RH) with polypropylene glycol, molecular weight (Mw) of 400 used as polyols and
investigated the effect of percentage of RH (by weight), percentage of RH
hydroxyl (-OH) groups, and RH size on the flexural, tensile, and impact
properties. For most tests, the properties increased as the percentage of RH or
percentages of RH -OH groups were increased. However, after exceeding a
threshold value, the properties started to decrease. A dimethylformamide (DMF)
immersion test showed that absorption and swelling decreased as the
percentage of RH was increased. The size of RH also played a significant role in
the properties, where smaller size RH produced composites with higher strength.
This is due to the greater surface area for interaction between the -OH groups
from the RH and -NCO groups from MDI, which could be detected by scanning
21. A. Hazlan, A. Abubakar and H.D. Rozman. Preliminary study on
mechanical and dimensional stability of rice husk–glass fiber hybrid
polyester composites. Polym. Plast. Technol. Eng., 43, 1129-1140, 2004.
22. L. G. Ang, G. S. Tay, A. Abubakar and H. D. Rozman. The mechanical
properties of rice husk-polyurethane composites. Polym. Plast. Technol.
Eng. 42,327-343, 2003.
Fabrication of Composites
125
electron microscope (SEM) analysis. The increased in water absorption and
thickness swelling as the percentage of RH was increased was attributed to the
ability of RH -OH groups to absorb water, causing the cell wall to swell.
Fujii et al. [23] have fabricated bamboo reinforced polypropylene
composites for ecological purposes (Eco-composites) and have studied their
basic mechanical properties. The steam explosion technique was applied to
extract bamboo fibers from raw bamboo trees. The experimental results showed
that the bamboo fibers (bundles) had a sufficient specific strength, which is
equivalent to that of conventional glass fibers. The tensile strength and modulus
of PP based composites using steam-exploded fibers increased about 15 and
30%, respectively, due to well impregnation and the reduction of the number of
voids, compared to the composite using fibers that were mechanically extracted.
The steam explosion technique was an effective method to extract bamboo fibers
for reinforcing thermoplastics.
Nakamura R, [24] have fabricated the composite of fully green composite
laminates and natural fibers at high temperatures and studied the effect of filler
concentration and surface treatment on the Tensile properties, r-values, deep
drawing, modulus and dynamic mechanical properties.
23. T. Fujii, Y. Yamamoto and K. Okubo. Development of bamboo-based
polymer composites and their mechanical properties. Composites: Part-A:
Appl. Sci. and Manuf., 35, 377-383, 2004.
24. R. Nakamura, K. Goda, J. Noda ang J. Ohgi. High temperature tensile
properties and deep drawing of fully green composites. eXPRESS Polymer
Letters, 3, 19-24, 2009.
Fabrication of Composites
126
MEASUREMENTS
Tensile strength and flexural strength (IS 6748:1994) measurements were
made on a Shanta Engineering Tensile Testing Machine, Model No. SET/T/50 at
a speed of 50 mm/min. Tensile strength and flexural strength of J-ECAM, J-PMP
and their hybrid composites are shown in Table-4.2 from which it is clear that
tensile and flexural strengths are intermediate of the parent matrix-jute
composites. ECAM composite is 1.8 times stiffer than that of PMP composite.
Similarly ECAM composite is 2.2 times stronger than PMP composite.
Comparatively good tensile and flexural properties of ECAM composite are due
to better matrix–fiber interfacial bonding. Thus, moderate tensile and flexural
properties of the composites signify their importance for low load bearing
applications especially for housing units. The mechanical properties of the
composites depend on number of factors namely fiber content, fiber orientation
(Figure 1), nature of fibers, fiber modification, interfacial bonding, additives like
fillers, compatibilizer and impact modifier, humidity and mode of testing, etc[25].
Mechanical performance and durability of the composites are governed by
reinforcement, matrix material and interfacial bond strength. Strength, stiffness
and stability of fibers and matrix are very important for long term service of
composites. Natural fibers are hygroscopic and possess low wettability with
hydrophobic matrix material and therefore it is necessary to modify fibers and
improve resin compatibility. Good interfacial bond strength is necessary for
effective stress transfer from matrix to fiber in the composites. There are two
types of interfacial interactions namely covalent and H-bonding. Hydroxyl groups
of jute serve as reaction sites with various functional groups present in the mixed
material (hydroxyl, ester and carboxyl groups). Jute fibers serve as filler as well
as a reactive component. Comparatively good tensile and flexural strengths of
the composites indicated their usefulness as low load bearing housing units.
25. D. Ray, B. K. Sarkar, S. Das and A. K. Rana. Dynamic mechanical and
thermal analysis of vinylester-resin-matrix composites reinforced with
untreated and alkali-treated jute fibres. Compos. Sci. Technol., 62, 911-
917, 2002.
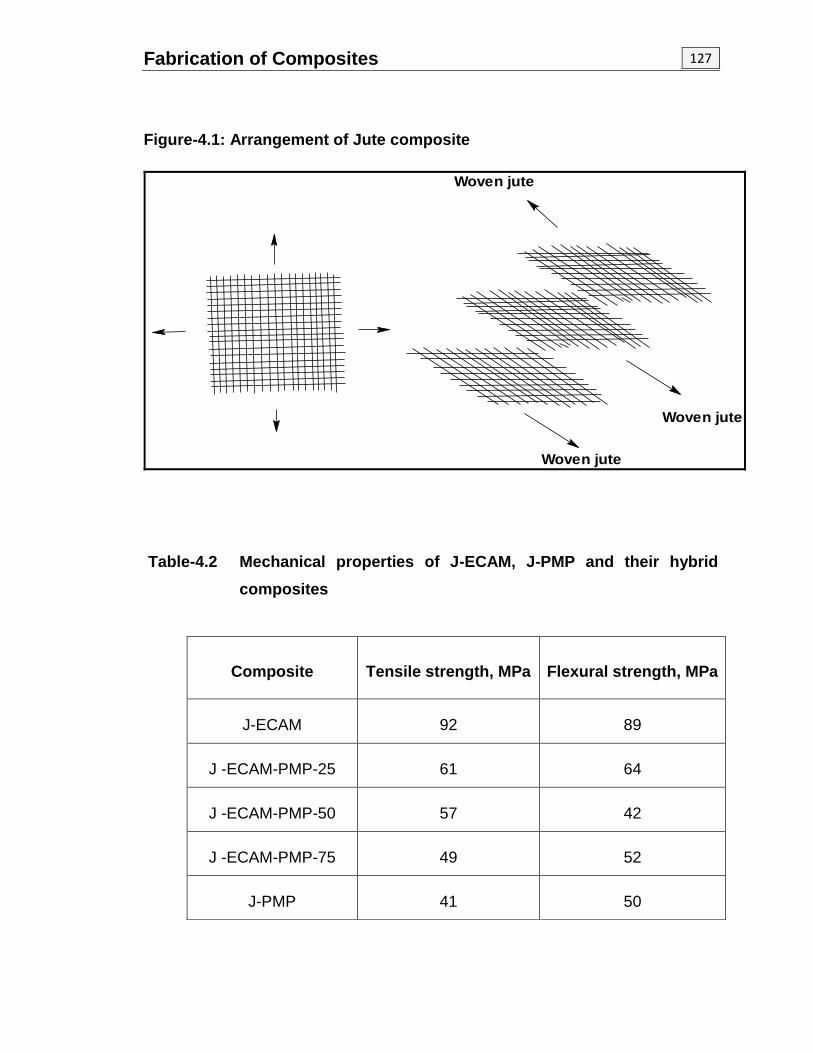
Fabrication of Composites
127
Figure-4.1: Arrangement of Jute composite
Woven jute
Woven jute
Woven jute
Table-4.2 Mechanical properties of J-ECAM, J-PMP and their hybrid
composites
Composite Tensile strength, MPa Flexural strength, MPa
J-ECAM 92 89
J -ECAM-PMP-25 61 64
J -ECAM-PMP-50 57 42
J -ECAM-PMP-75 49 52
J-PMP 41 50
Fabrication of Composites
128
Electrical properties
Synthetic polymers are known for their electrical insulation characteristics.
The majority of them are organic in nature, having covalent linkages; they
provide high resistance to electric current flow. Earlier materials like wood,
amber, ceramic, gutta-percha and natural rubber were the main materials used
as insulating materials. Their limited range of mechanical properties and
difficulties in fabrication were some of the reason why these materials could not
provide the support to the electrical industry. Nowadays large numbers of
synthetic polymers are available, which possess excellent mechanical properties
in combination with high electrical resistance. When assessing a potential
insulating material, information on the following properties will be required.
Dielectric constant (specific inductive capacity, relative permeability) over a
wide range of temperature and frequencies
Power factor over a range of temperature and frequency
Dielectric strength (usually measured in kV/cm)
Volume resistivity (usually measured in Ω cm or Ω m)
Surface resistivity (usually measured in Ω cm)
Tracking and arc resistance
The electrical properties of polymer materials are of considerable
importance, where plastics are used in or near electrical equipments as
insulating materials, supporting assemblies, connectors, housing, etc. The use of
polymers in engineering as dielectrics is becoming increasingly important. The
choice of polymeric dielectrics for each concrete case depends on its dielectric
and other physical properties over a wide range of temperatures and electrical
field frequencies. Investigations of dielectric properties are most important for
studying polymer structure.
Typical electrical properties of some selected plastic materials are
reported in Table-4.3. In order to study the dielectric properties of composites, an
ideal contact should be satisfied the certain conditions.
(1) It should not induce a resistance to the flow of the current
(2) It should not react chemically with semi conducting material
Fabrication of Composites
129
(3) The contact properties should not be affected by variation of ambient
conditions like illumination, temperature, electrical field, etc.
(4) The –OH m’s low should apply to the semiconductor with contacts
The working voltage applied to an electrical insulating material must be
much lower than the voltage, which causes the material rupture. Electrical
discharge through a material at a minimum voltage called break down or
disruptive voltage Vbr [26]. In some cases voltage lower than the break down
voltage gives rise to a surface discharge that dose not penetrate deep into the
bulk of a material. This is a surface or creeping, breakdown occurring at a
surface break down voltage. The basic characteristic of an electrical insulating
material is its breakdown or dielectric strength Ebr (also called electric strength),
which is a minimum strength of the uniform electric field that causes dielectric
breakdown. The calculation of breakdown strength calls for measuring the
breakdown voltage of the material under test. The breakdown voltage (Ubr) is
proportional to the electric field strength (Ebr) only if the field is uniform. Such a
field exists between two electrodes, which have the shape of the bodies of
revolution; the surface of these electrodes may be described by Rogovsky
equation [26].
t
UE br
br … 4.3
Where, t is the thickness of the material
It is common practice to use electrodes of a simple shape in the form of
discs with rounded edges or as spheres; the field produced between such
electrodes is very nearly uniform under certain conditions in a uniform field, break
down voltage allows calculation of dielectric strength with measure of the
thickness of the specimen at the point of rupture. The dielectric strength is
expressed in volts per millimeter.
26. O. M. Kazarnovasky, B. M. Tareev, I. O. Forsilova and L. I. Lybimov.
Testing of electrical insulating materials. Mir Publishers, Moscow, 1982.
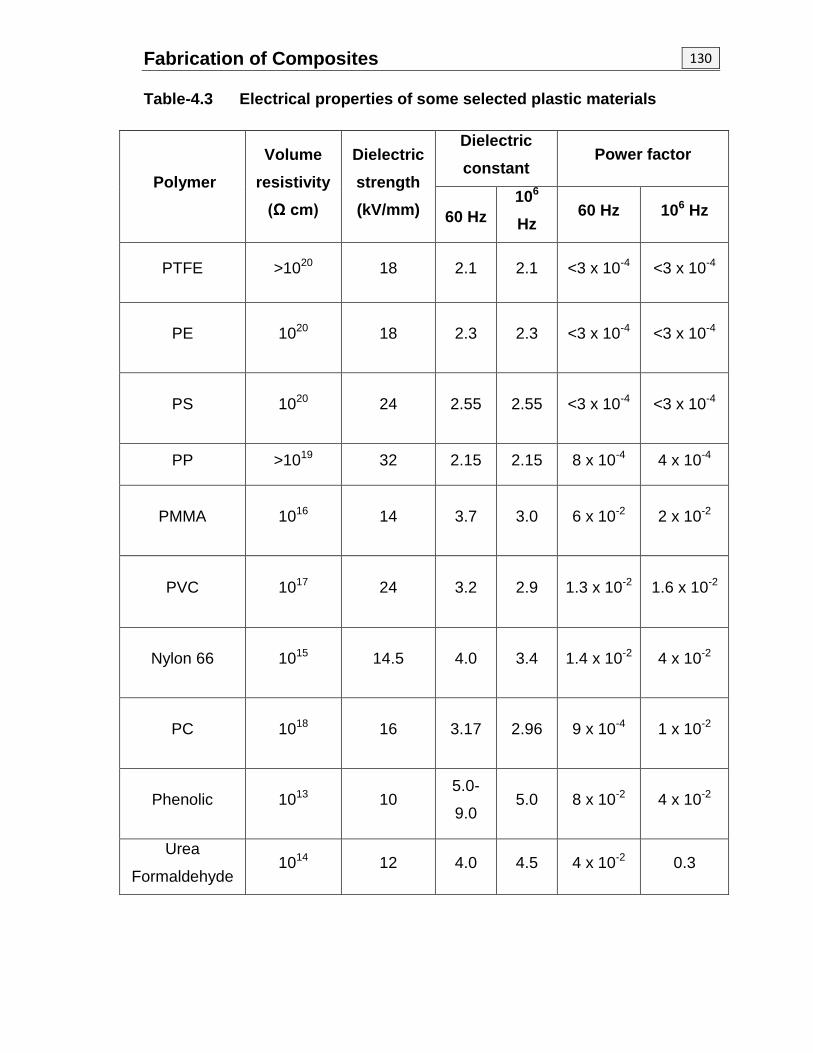
Fabrication of Composites
130
Table-4.3 Electrical properties of some selected plastic materials
Polymer
Volume
resistivity
(Ω cm)
Dielectric
strength
(kV/mm)
Dielectric
constant Power factor
60 Hz
106
Hz 60 Hz 106 Hz
PTFE >1020 18 2.1 2.1 <3 x 10⁻⁴ <3 x 10⁻⁴
PE 1020 18 2.3 2.3 <3 x 10⁻⁴ <3 x 10⁻⁴
PS 1020 24 2.55 2.55 <3 x 10⁻⁴ <3 x 10⁻⁴
PP >1019 32 2.15 2.15 8 x 10⁻⁴ 4 x 10⁻⁴
PMMA 1016 14 3.7 3.0 6 x 10⁻² 2 x 10⁻²
PVC 1017 24 3.2 2.9 1.3 x 10⁻² 1.6 x 10⁻²
Nylon 66 1015 14.5 4.0 3.4 1.4 x 10⁻² 4 x 10⁻²
PC 1018 16 3.17 2.96 9 x 10⁻⁴ 1 x 10⁻²
Phenolic 1013 10 5.0-
9.0 5.0 8 x 10⁻² 4 x 10⁻²
Urea
Formaldehyde 1014 12 4.0 4.5 4 x 10⁻² 0.3
Fabrication of Composites
131
Dielectric strength i.e. the minimum required voltage at which the
insulating material fails to resist the electric current is called as dielectric
strength, which is used to determine uniformity of the material and the
manufacturing process. Although such determinations are not adequate for
design purposes, they do give some relative indication of amount of insulating
material that will be required to support a certain voltage level. Flexible plastics
are characterized by high dielectric and mechanical strengths in thin sections are
useful as insulating taps [27].
The dielectric strength of the materials can be determined by the following
equation:
Dielectric strength = V
t … 4.4
Where V = puncture voltage (volts) and t = sample thickness (mm)
Volume resistivity i.e. the property of a bulk material is defined as, “The electrical
resistance between the two faces of a 1 cm cube of the material.” Volume
resistivity data are useful for designers to compare the relative insulation quality
for the purpose of material selection, to evaluate the effects of material
composition and environment and for material specification. The resistivity data
can also be useful in determining the effect of moisture, determination of
presence of impurities, studying of resin cure and in investigating the
fundamental characteristics of materials. Volume resistivity increases with
increasing the degree of resin cure, while it decreases with increasing the
temperature. The volume resistivity of the material can be determined by the
following equation:
Volume resistivity = vR A
t … 4.5
Where Rv = volume resistance (ohms), A = area of electrodes (19.6 cm2) and t =
sample thickness (cm)
Naik and Mishra [28] have fabricated wood polymer composites from agro-
waste (banana, hemp, and agave fibers) and novalac resin and determined their
electrical properties. Banana, hemp, and agave fibers were treated with novalac
27. A. B. Mathur and I. S. Bhardwaj. Testing and Evaluation of Plastics. Allied
Publishers Pvt. Ltd., 2003.
Fabrication of Composites
132
resin for the formation of their composites in the different ratios of 60:40, 55:45,
50:50, 45:55, and 40:60 (wt/wt). These fibers were also treated with maleic
anhydride and the effect of maleic anhydride was studied on surface resistivity
and volume resistivity of wood polymer composites. The maximum surface and
volume resistivities were found in maleic anhydride treated and untreated banana
fiber composites, respectively. The treatment of maleic anhydride improved the
surface resistivity of respective fiber composites. Maleic anhydride treated
banana fiber composites showed maximum surface resistivity, while untreated
agave fiber composites showed minimum surface resistivity.
Jain and Chand [29] have fabricated different directionally oriented sisal
fiber reinforced epoxy resin composites and studied the effect of temperature and
frequency variation on dielectric constant (ε′), dielectric dissipation factor (tan δ)
and on A.C. conductivity (ζa.c.) of the samples. Measurements were in the
temperature range 24–180 °C and in the frequency range 1–20 kHz. The sisal
fiber epoxy composites were oriented parallel and perpendicular to the electric
field. It was found that the dielectric constant, tan δ and A.C. conductivity
increased with increasing temperature. The dependence of dielectric constant,
tan δ and A.C. conductivity with frequency have also been studied and it was
found that ε′ and tan δ of the epoxy and 0 and 900C oriented sisal fiber epoxy
composites decreased with increasing frequency and A.C. conductivity increased
with increasing frequency. Near the transition temperature of theepoxy the
observed properties showed anomalous behavior. Peaks for dielectric constant,
tan δ and A.C. conductivity were observed. Clear relaxation peaks for tan δ
around 169 °C were observed in epoxy resin, shifting to the lower temperature
side with increasing frequency. The relaxation time of epoxy and 0 and 900
28. J. B. Naik and S. Mishra. Studies on electrical properties of wood polymer
composites based on agro-waste and novolac. Polym. Plast. Technol. Eng.
43, 1085-1091, 2004.
29. D. Jain and N. Chand. Effect of sisal fiber orientation on electrical
properties of sisal fiber reinforced epoxy composites. Compos. Part-A, 36,
594-602, 2005.
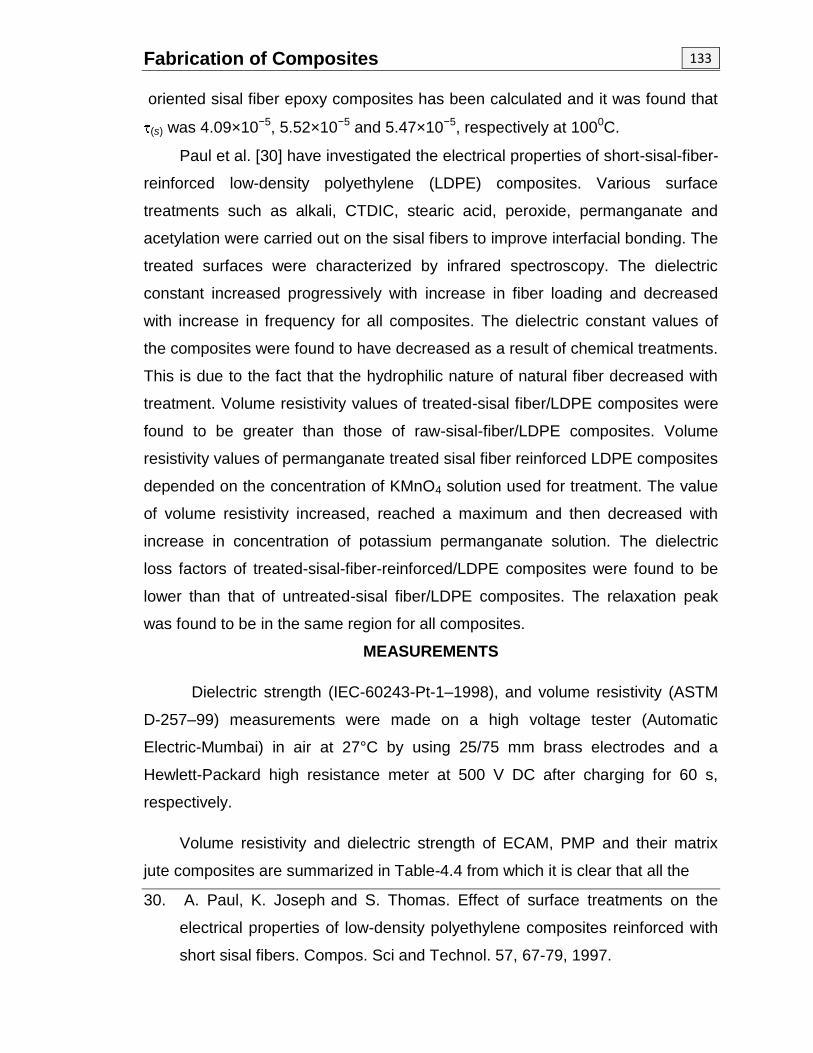
Fabrication of Composites
133
oriented sisal fiber epoxy composites has been calculated and it was found that
(s) was 4.09×10⁻⁵, 5.52×10⁻⁵ and 5.47×10⁻⁵, respectively at 1000C.
Paul et al. [30] have investigated the electrical properties of short-sisal-fiber-
reinforced low-density polyethylene (LDPE) composites. Various surface
treatments such as alkali, CTDIC, stearic acid, peroxide, permanganate and
acetylation were carried out on the sisal fibers to improve interfacial bonding. The
treated surfaces were characterized by infrared spectroscopy. The dielectric
constant increased progressively with increase in fiber loading and decreased
with increase in frequency for all composites. The dielectric constant values of
the composites were found to have decreased as a result of chemical treatments.
This is due to the fact that the hydrophilic nature of natural fiber decreased with
treatment. Volume resistivity values of treated-sisal fiber/LDPE composites were
found to be greater than those of raw-sisal-fiber/LDPE composites. Volume
resistivity values of permanganate treated sisal fiber reinforced LDPE composites
depended on the concentration of KMnO4 solution used for treatment. The value
of volume resistivity increased, reached a maximum and then decreased with
increase in concentration of potassium permanganate solution. The dielectric
loss factors of treated-sisal-fiber-reinforced/LDPE composites were found to be
lower than that of untreated-sisal fiber/LDPE composites. The relaxation peak
was found to be in the same region for all composites.
MEASUREMENTS
Dielectric strength (IEC-60243-Pt-1–1998), and volume resistivity (ASTM
D-257–99) measurements were made on a high voltage tester (Automatic
Electric-Mumbai) in air at 27°C by using 25/75 mm brass electrodes and a
Hewlett-Packard high resistance meter at 500 V DC after charging for 60 s,
respectively.
Volume resistivity and dielectric strength of ECAM, PMP and their matrix
jute composites are summarized in Table-4.4 from which it is clear that all the
30. A. Paul, K. Joseph and S. Thomas. Effect of surface treatments on the
electrical properties of low-density polyethylene composites reinforced with
short sisal fibers. Compos. Sci and Technol. 57, 67-79, 1997.
Fabrication of Composites
134
composites possess moderate volume resistivity and low dielectric strength in
comparison to PFR and UFR materials (Table-4.3). Electrical properties of the
polymeric composites are affected by several factors namely humidity,
impurities, degree of resin cure, temperature, nature of polymers and nature of
fillers and additives, geometry, electrode area and electrode material, sample
thickness, time of voltage application, current frequency and extent of ageing. In
conclusion composites possess good mechanical and moderate electrical
properties signifying their importance for low load bearing applications in housing
units and electrical electronic appliances.
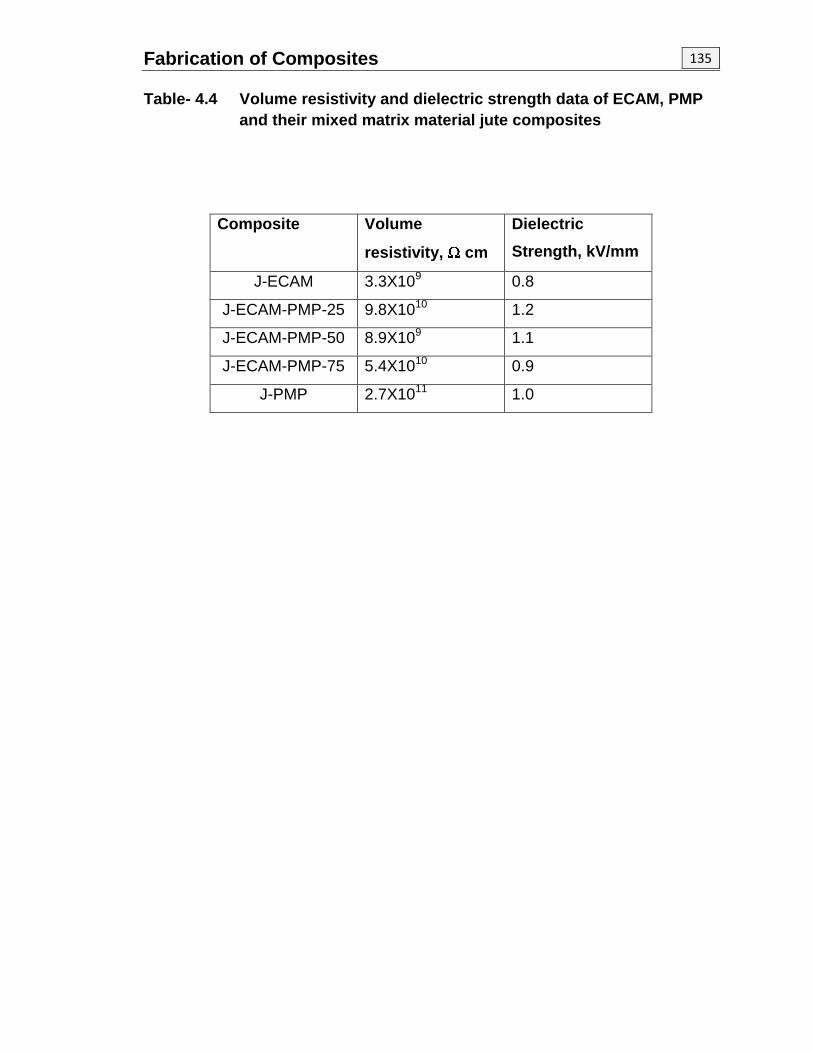
Fabrication of Composites
135
Table- 4.4 Volume resistivity and dielectric strength data of ECAM, PMP
and their mixed matrix material jute composites
Composite Volume
resistivity, cm
Dielectric
Strength, kV/mm
J-ECAM 3.3X10⁹ 0.8
J-ECAM-PMP-25 9.8X10¹⁰ 1.2
J-ECAM-PMP-50 8.9X10⁹ 1.1
J-ECAM-PMP-75 5.4X10¹⁰ 0.9
J-PMP 2.7X10¹¹ 1.0
Fabrication of Composites
136
Section-3: Chemical resistance study of composites
The unique combinations of properties found in polymers have made it
possible to use them in almost all areas of applications. Tailoring of polymer
molecules to specifically achieve the required performance properties has further
widened the scope of their applications. The performance and life span of
polymeric materials depend on various factors, their molecular characteristics
being the controlling one; exposure of polymers to different environmental
conditions impairs their useful properties.
The highest consumption area of the plastic material is in packaging. This
is mainly due to the superiority of plastic material over the other materials in
terms of inertness and stability to contacting chemicals like water, oxidizing
agents, oils, lubricants, industrial solvents and food stuffs. The selection of
particular plastic materials for specific industrial applications has to be based on
the chemical environment to which they will be exposed.
The interaction of chemicals with plastics can take place in different ways,
affecting adversely their useful properties at varying rates and to varying
degrees. The mechanisms involved can be chemical reaction, solvation,
absorption, plasticization and stress cracking. The strength of chemical bonds,
the degree of crystallinity, branching and polarity are the decisive factors for the
chemical resistance of polymers. Rise in temperature increases the rate of
chemical interaction. A number of standard chemical resistance tests have been
developed, which include tests for moisture and water absorption, effects of
immersion in chemicals, stain resistance and stress cracking. Most of these tests
involve measurement of change in weight, dimensions and appearance and
mechanical properties before and after the exposure to chemical reagents.
Exposure time, temperature, concentration and reactivity of the reagents are the
important factors for the tests. The most common methods used to determine
chemical resistance are described below.
(1) Chemical resistance by change in mass method
(2) Chemical resistance by change in linear dimensions
(3) Chemical resistance by change in mechanical properties
Fabrication of Composites
137
All polymers and composites absorb moisture in humid atmosphere and
when immersed in water. Natural fibers absorb more water as compared to
synthetic fibers. Jute and other natural fibers are highly hygroscopic and possess
low wettability with hydrophobic resins mainly due to hydroxyl groups of
cellulose, hemi cellulose and lignin [31-34]. Hemi cellulose is mainly responsible
for water absorption although non crystalline cellulose and lignin also play an
important role in this process. The effect of absorbed water is to degrade tensile
strength [35].
Absorbed water causes swelling of fibers and it continues till the cell walls
are saturated with water. Beyond saturation point water exists as free water in
the void structure leading to composite delamination or void formation. Absorbed
water leads to weakening of interface and accelerates delamination and hence
decreases the strength of the composites.
Absorbed water causes hydrolytic degradation of both matrix and interface
during service [36].
31. B. N. Das, A. K. Rana, H. K. Mishra, S. K. Nayak and S. S. Tripathy. Novel
low-cost jute-polyester composites. III. Weathering and thermal behavior. J.
Appl. Polym. Sci., 78, 1671-1679, 2000.
32. J. Gassan and A. K. Bledzky. The influence of fiber-surface treatment on the
mechanical properties of jute-polypropylene composites. Composites, 28,
1001-1005, 1997.
33. S. Das, A. K. Saha, P. K. Choudhary, R. K. Basak, B. C. Mitra, T. Todd and
S. Lang. Effect of steam pretreatment of jute fiber on dimensional stability of
jute composite. J. Appl. Polym. Sci., 76, 1652-1661, 2000.
34. S. Pavlidou and C. D. Papaspyrides. The effect of hygrothermal history on
water sorption and interlaminar shear strength of glass/polyester composites
with different interfacial strength. Composite Part-A, 34, 1117-1124, 2003.
35. S. L.Gibson, V. Baranauskas, J. S. Riffle and U. Sorathia. Cresol-novalac
epoxy networks: properties and processability. Polymer, 43, 7389-7398,
2002.
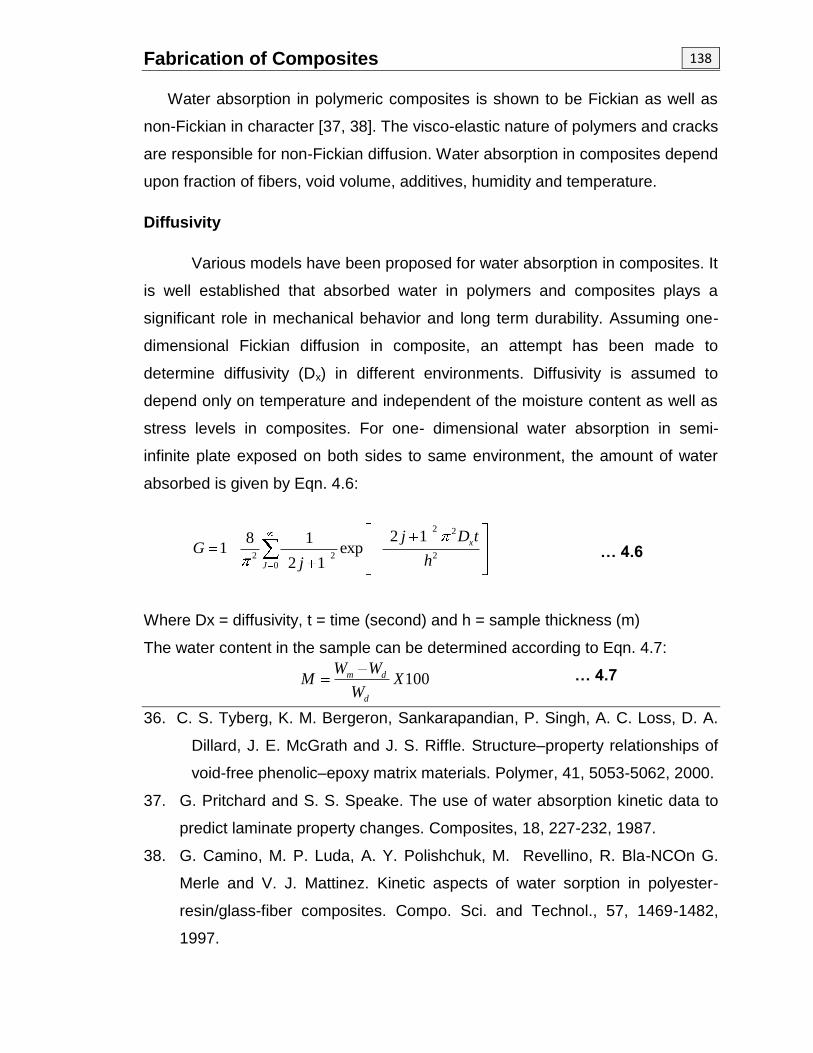
Fabrication of Composites
138
2 2
2 2 20
2 18 11 exp
2 1
x
J
j D tG
hj
Water absorption in polymeric composites is shown to be Fickian as well as
non-Fickian in character [37, 38]. The visco-elastic nature of polymers and cracks
are responsible for non-Fickian diffusion. Water absorption in composites depend
upon fraction of fibers, void volume, additives, humidity and temperature.
Diffusivity
Various models have been proposed for water absorption in composites. It
is well established that absorbed water in polymers and composites plays a
significant role in mechanical behavior and long term durability. Assuming one-
dimensional Fickian diffusion in composite, an attempt has been made to
determine diffusivity (Dx) in different environments. Diffusivity is assumed to
depend only on temperature and independent of the moisture content as well as
stress levels in composites. For one- dimensional water absorption in semi-
infinite plate exposed on both sides to same environment, the amount of water
absorbed is given by Eqn. 4.6:
… 4.6
Where Dx = diffusivity, t = time (second) and h = sample thickness (m)
The water content in the sample can be determined according to Eqn. 4.7:
… 4.7
36. C. S. Tyberg, K. M. Bergeron, Sankarapandian, P. Singh, A. C. Loss, D. A.
Dillard, J. E. McGrath and J. S. Riffle. Structure–property relationships of
void-free phenolic–epoxy matrix materials. Polymer, 41, 5053-5062, 2000.
37. G. Pritchard and S. S. Speake. The use of water absorption kinetic data to
predict laminate property changes. Composites, 18, 227-232, 1987.
38. G. Camino, M. P. Luda, A. Y. Polishchuk, M. Revellino, R. Bla-NCOn G.
Merle and V. J. Mattinez. Kinetic aspects of water sorption in polyester-
resin/glass-fiber composites. Compo. Sci. and Technol., 57, 1469-1482,
1997.
100m d
d
W WM X
W
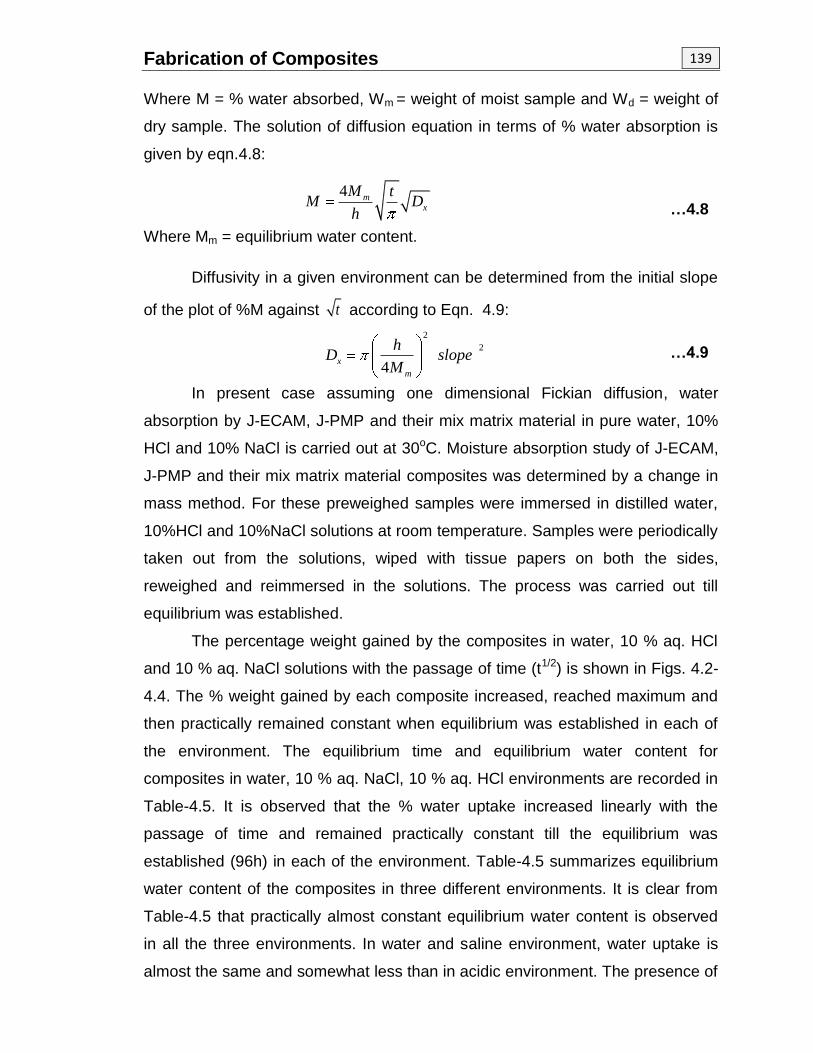
Fabrication of Composites
139
4 mx
M tM D
h
2
2
4x
m
hD slope
M
Where M = % water absorbed, Wm = weight of moist sample and Wd = weight of
dry sample. The solution of diffusion equation in terms of % water absorption is
given by eqn.4.8:
…4.8
Where Mm = equilibrium water content.
Diffusivity in a given environment can be determined from the initial slope
of the plot of %M against t according to Eqn. 4.9:
…4.9
In present case assuming one dimensional Fickian diffusion, water
absorption by J-ECAM, J-PMP and their mix matrix material in pure water, 10%
HCl and 10% NaCl is carried out at 30oC. Moisture absorption study of J-ECAM,
J-PMP and their mix matrix material composites was determined by a change in
mass method. For these preweighed samples were immersed in distilled water,
10%HCl and 10%NaCl solutions at room temperature. Samples were periodically
taken out from the solutions, wiped with tissue papers on both the sides,
reweighed and reimmersed in the solutions. The process was carried out till
equilibrium was established.
The percentage weight gained by the composites in water, 10 % aq. HCl
and 10 % aq. NaCl solutions with the passage of time (t1/2) is shown in Figs. 4.2-
4.4. The % weight gained by each composite increased, reached maximum and
then practically remained constant when equilibrium was established in each of
the environment. The equilibrium time and equilibrium water content for
composites in water, 10 % aq. NaCl, 10 % aq. HCl environments are recorded in
Table-4.5. It is observed that the % water uptake increased linearly with the
passage of time and remained practically constant till the equilibrium was
established (96h) in each of the environment. Table-4.5 summarizes equilibrium
water content of the composites in three different environments. It is clear from
Table-4.5 that practically almost constant equilibrium water content is observed
in all the three environments. In water and saline environment, water uptake is
almost the same and somewhat less than in acidic environment. The presence of
Fabrication of Composites
140
strong electrolytes in water affects the structure of water and hence diffusion in
fiber through capillary action. Water absorption continues till the cell walls are
saturated with water. Beyond saturation point, water exists as free water in the
void structure leading to composite delamination or blistering.
Diffusivity in different environments was determined according to Eqns.
4.8 and 4.9 and is reported in Table-4.5 from which it is observed that diffusion
coefficient of J-ECAM and J-PMP and it is somewhat varied for hybrid
composites and J-PMP in three different environments but for J-ECAM it is quite
different. Thus, little electrolyte effect on diffusion behavior in hybrid composites
and J-PMP is observed.
Absorption of water in composites causes swelling of fibers till the cell walls
are saturated with water and beyond that water exists as free water in the void
structure leading to composites delamination or void formation. Absorbed water
causes weakening of interfacial adhesion and hydrolytic degradation of both
matrix and fibers [39]. Cracking and blistering of fibers cause high water
absorption, while degradation causes leaching of small molecules [40].
39. S. Lin-Gibson, V. Baranauskas, J. S. Riffle and U. Sorathia. Cresol novolac-
epoxy networks: Processability and properties. Polymer, 43, 7389-7398,
2002.
40. L. R. Bao and A. F. Yee. Effect of temperature on moisture absorption in a
bismaleimide resin and its carbon fiber composites. Polymer, 43, 3987-
3997, 2002.
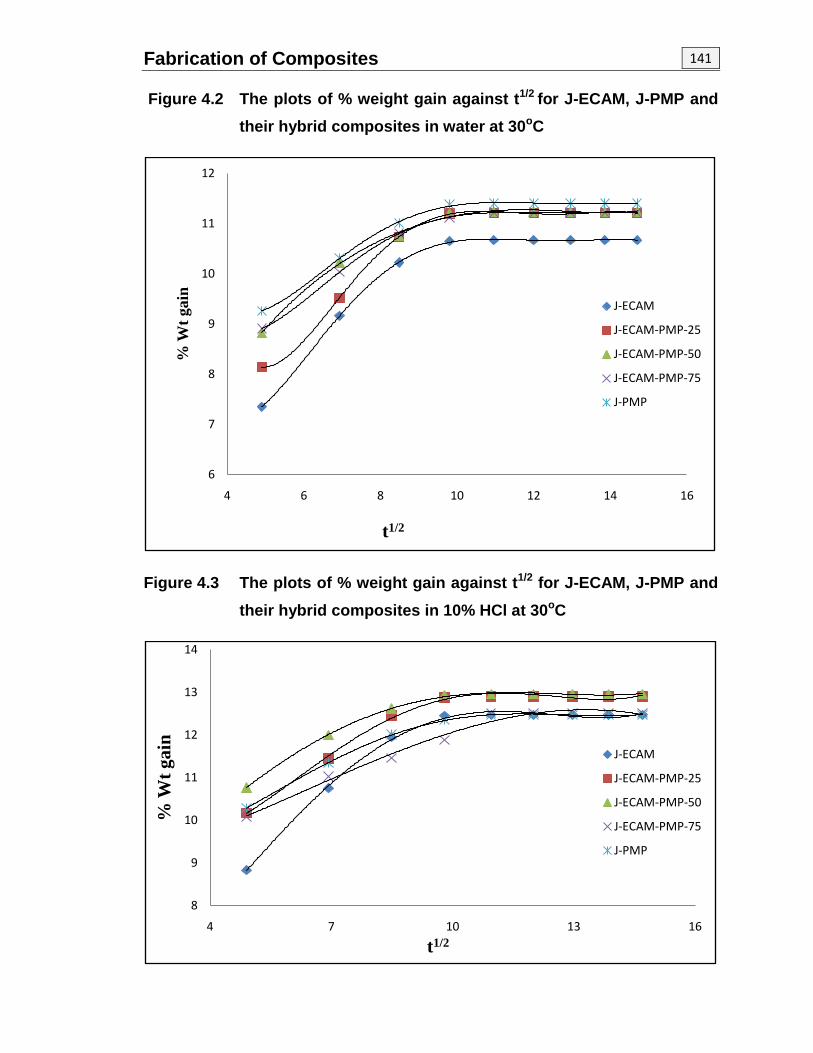
Fabrication of Composites
141
Figure 4.2 The plots of % weight gain against t1/2 for J-ECAM, J-PMP and
their hybrid composites in water at 30oC
Figure 4.3 The plots of % weight gain against t1/2 for J-ECAM, J-PMP and
their hybrid composites in 10% HCl at 30oC
6
7
8
9
10
11
12
4 6 8 10 12 14 16
% W
t gain
t1/2
J-ECAM
J-ECAM-PMP-25
J-ECAM-PMP-50
J-ECAM-PMP-75
J-PMP
8
9
10
11
12
13
14
4 7 10 13 16
% W
t g
ain
t1/2
J-ECAM
J-ECAM-PMP-25
J-ECAM-PMP-50
J-ECAM-PMP-75
J-PMP
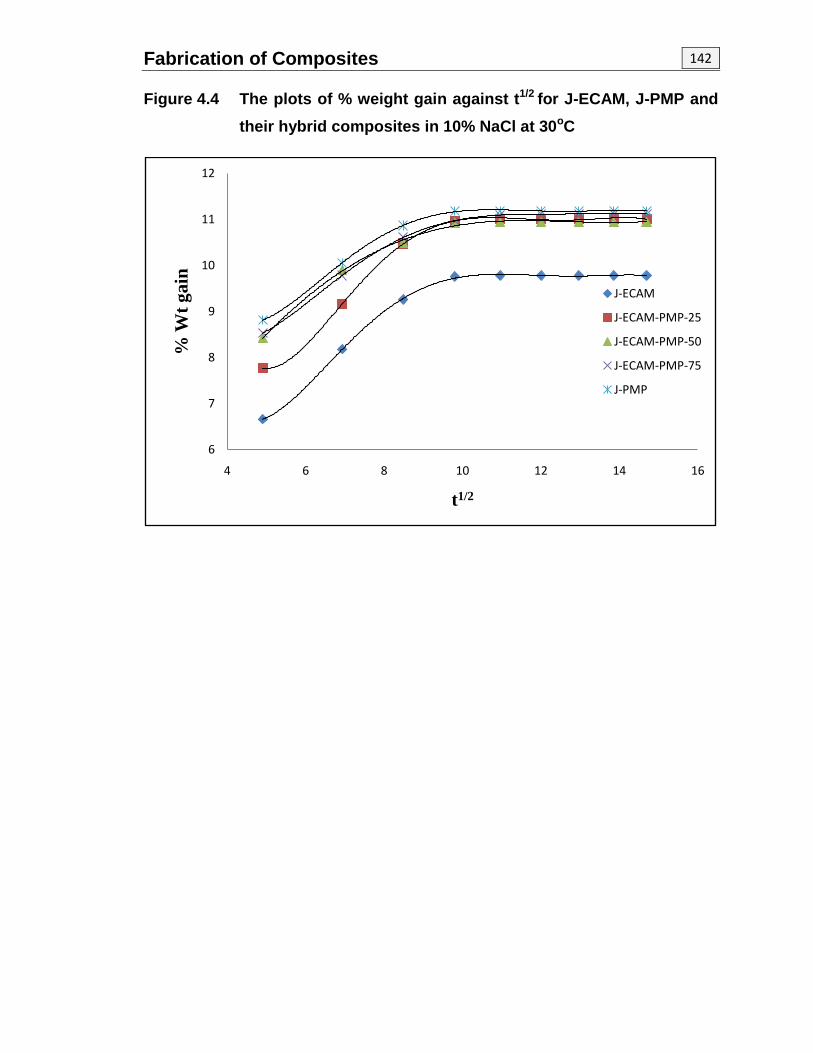
Fabrication of Composites
142
Figure 4.4 The plots of % weight gain against t1/2 for J-ECAM, J-PMP and
their hybrid composites in 10% NaCl at 30oC
6
7
8
9
10
11
12
4 6 8 10 12 14 16
% W
t g
ain
t1/2
J-ECAM
J-ECAM-PMP-25
J-ECAM-PMP-50
J-ECAM-PMP-75
J-PMP
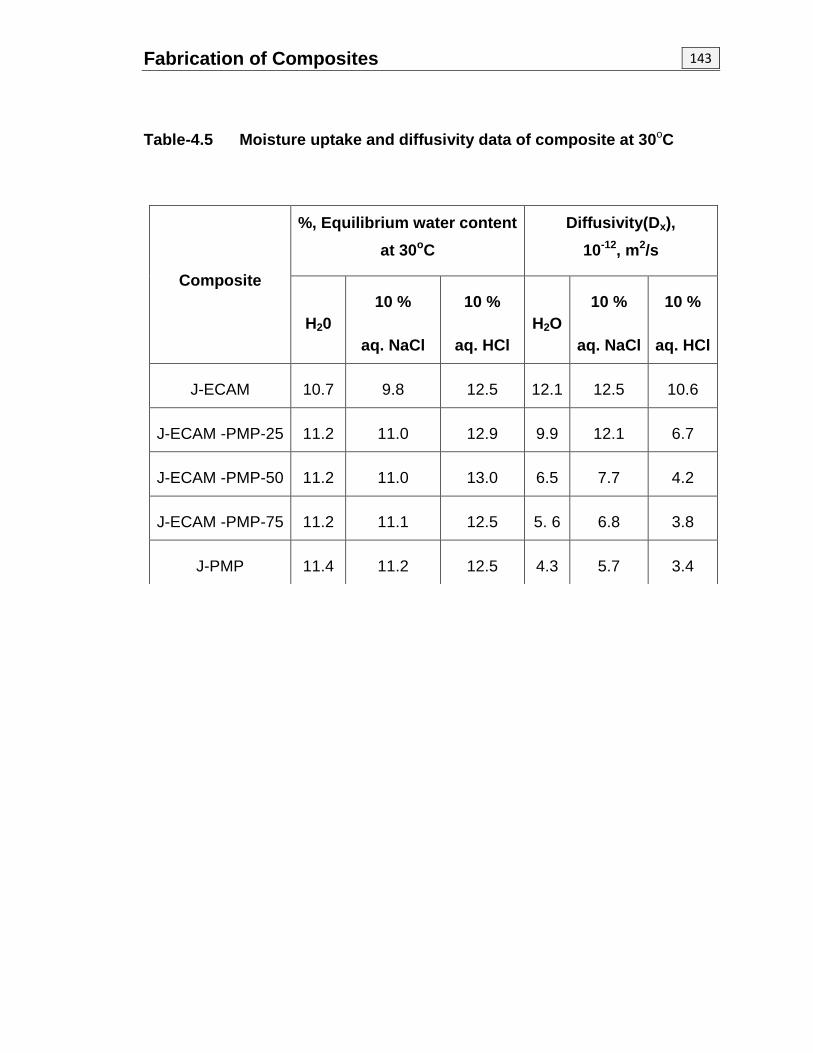
Fabrication of Composites
143
Table-4.5 Moisture uptake and diffusivity data of composite at 30oC
Composite
%, Equilibrium water content
at 30oC
Diffusivity(Dx),
10-12, m2/s
H20
10 %
aq. NaCl
10 %
aq. HCl
H2O
10 %
aq. NaCl
10 %
aq. HCl
J-ECAM 10.7 9.8 12.5 12.1 12.5 10.6
J-ECAM -PMP-25 11.2 11.0 12.9 9.9 12.1 6.7
J-ECAM -PMP-50 11.2 11.0 13.0 6.5 7.7 4.2
J-ECAM -PMP-75 11.2 11.1 12.5 5. 6 6.8 3.8
J-PMP 11.4 11.2 12.5 4.3 5.7 3.4
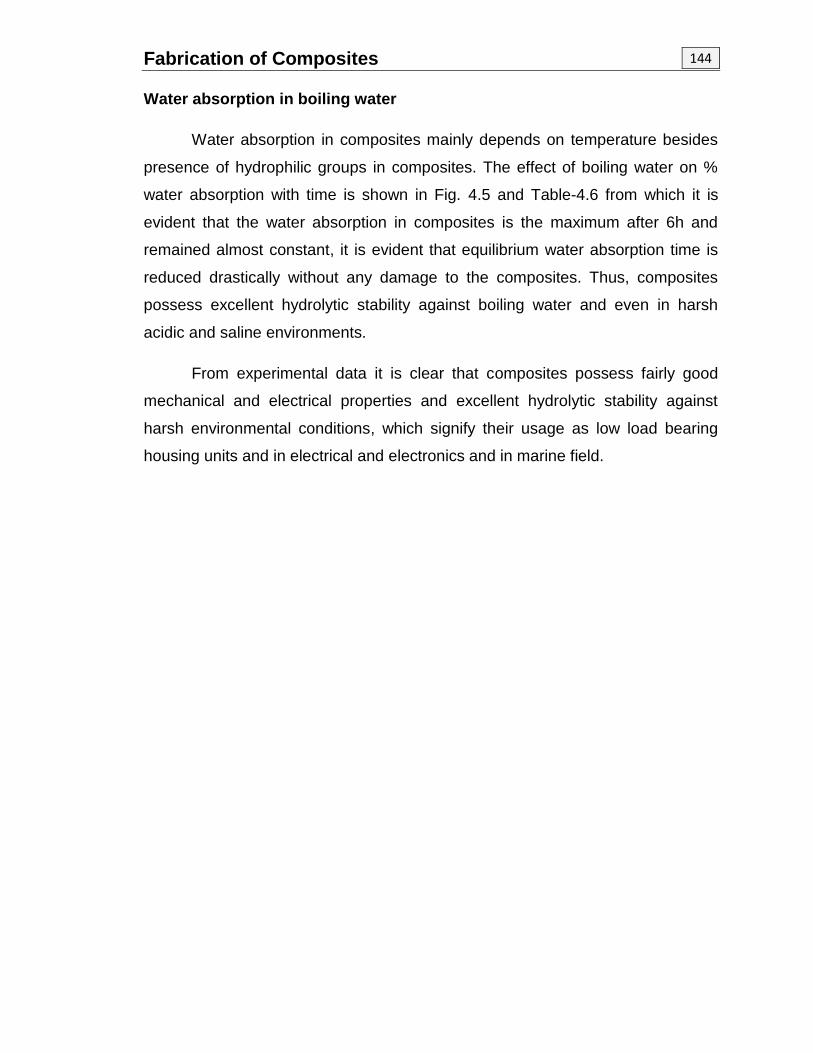
Fabrication of Composites
144
Water absorption in boiling water
Water absorption in composites mainly depends on temperature besides
presence of hydrophilic groups in composites. The effect of boiling water on %
water absorption with time is shown in Fig. 4.5 and Table-4.6 from which it is
evident that the water absorption in composites is the maximum after 6h and
remained almost constant, it is evident that equilibrium water absorption time is
reduced drastically without any damage to the composites. Thus, composites
possess excellent hydrolytic stability against boiling water and even in harsh
acidic and saline environments.
From experimental data it is clear that composites possess fairly good
mechanical and electrical properties and excellent hydrolytic stability against
harsh environmental conditions, which signify their usage as low load bearing
housing units and in electrical and electronics and in marine field.
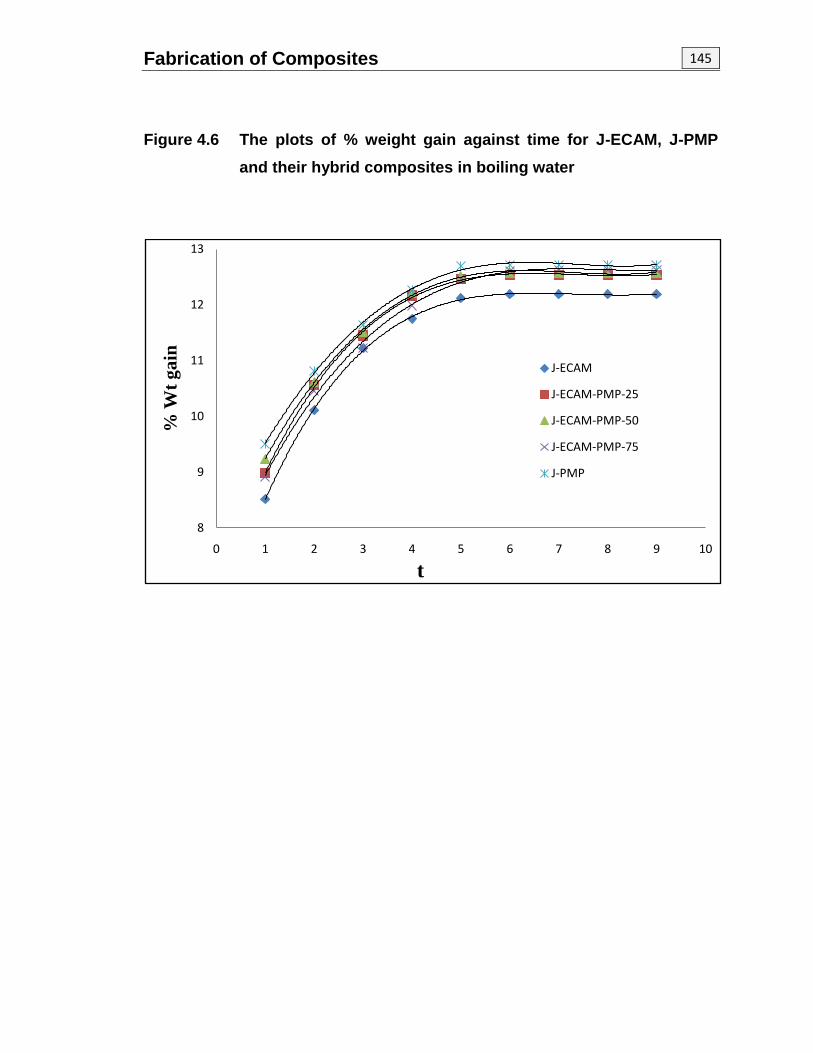
Fabrication of Composites
145
Figure 4.6 The plots of % weight gain against time for J-ECAM, J-PMP
and their hybrid composites in boiling water
8
9
10
11
12
13
0 1 2 3 4 5 6 7 8 9 10
% W
t g
ain
t
J-ECAM
J-ECAM-PMP-25
J-ECAM-PMP-50
J-ECAM-PMP-75
J-PMP
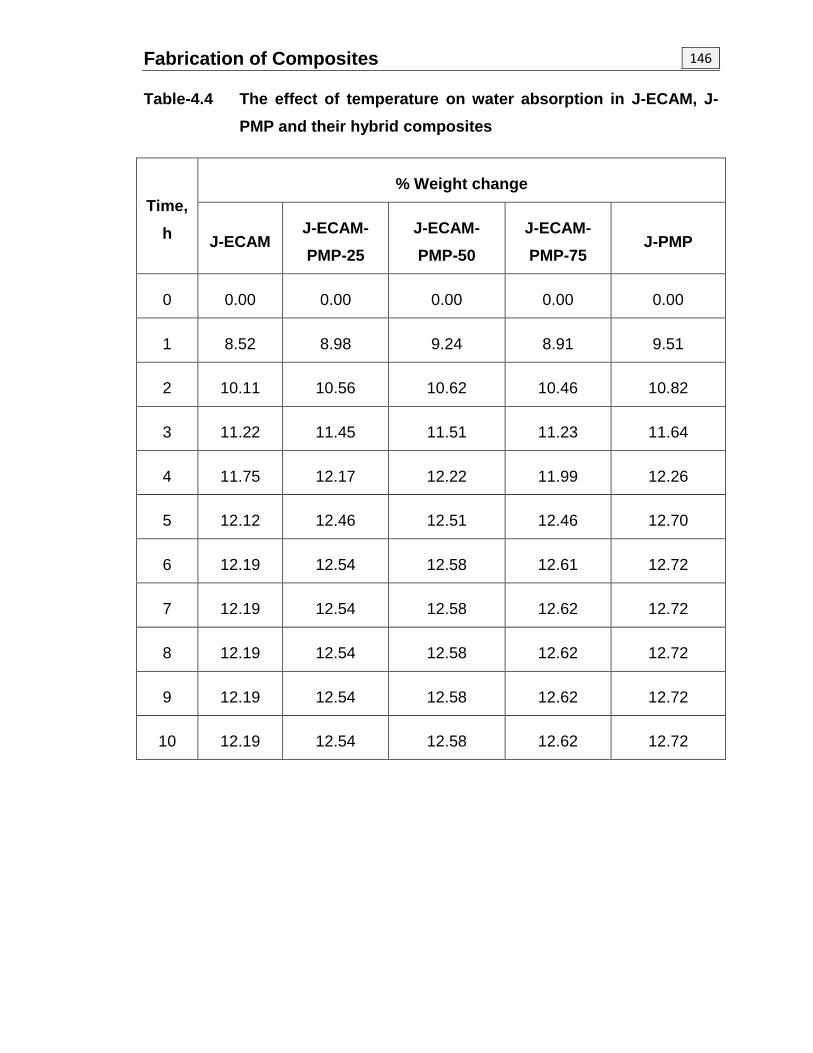
Fabrication of Composites
146
Table-4.4 The effect of temperature on water absorption in J-ECAM, J-
PMP and their hybrid composites
Time,
h
% Weight change
J-ECAM J-ECAM-
PMP-25
J-ECAM-
PMP-50
J-ECAM-
PMP-75 J-PMP
0 0.00 0.00 0.00 0.00 0.00
1 8.52 8.98 9.24 8.91 9.51
2 10.11 10.56 10.62 10.46 10.82
3 11.22 11.45 11.51 11.23 11.64
4 11.75 12.17 12.22 11.99 12.26
5 12.12 12.46 12.51 12.46 12.70
6 12.19 12.54 12.58 12.61 12.72
7 12.19 12.54 12.58 12.62 12.72
8 12.19 12.54 12.58 12.62 12.72
9 12.19 12.54 12.58 12.62 12.72
10 12.19 12.54 12.58 12.62 12.72

Chapter – 5
A brief review of
the work done
A brief review…… 147 This chapter of the thesis deals with brief summary of the work incorporated
in the thesis.
CHAPTER-1
This chapter of the thesis describes up to date literature survey on
bisphenols, epoxy, epoxy esters, epoxy-acrylate-maleate resin, polyurethane
resins, properties, applications of natural fibers and composites in diverse fields.
CHAPTER-2
This chapter deals with the synthesis of 1,1’-bis (4-hydroxy phenyl)
cyclohexane, 4-(4-hdroxyphenyl)but-3-en-2-one, 4,4',4''-but-1-ene-1,3,3-triyl
triphenol, its epoxy resin, epoxy ester based on acrylic acid, epoxy-acrylate-
maleate resin and their polyurethane resins, resin and its epoxy resin.
CHAPTER-3
This chapter describes the characterization of the resins by IR, 1HNMR, Mass
spectral data, epoxy equivalent, acid values, and hydroxyl values of the epoxy
resins and epoxy ester resin, DSC and TGA. The epoxy equivalent of the EBC
and EBCN are found to be 576, 889, respectively. The acid values of the EBCA,
PMP and ECAM were found to be 5.58, 56.4 and 32 mg KOH/g, respectively.
The hydroxyl values of the EBCA and ECAM were found to be 124.2 and 58.7
mg KOH/g, respectively. TG thermograms of the ECAM, PMP and their mixed
matrix materials were scanned at the heating rate of 10oC/ min in the nitrogen
atmosphere. Endothermic transitions (69-91oC) below 100oC are due to melting
of uncured ECAM and mixed matrices. Endothermic transition at 122oC for
ECAM due to some chemical change in is further supported by weight loss over
the temperature range 100-200oC in the TG thermogram and other endothermic
transition at 225oC is due to some physical change (glass transition temperature)
is supported by partially no loss over the temperature range 200-300oC.
Endothermic transition at 415.7oC for ECAM-PMP-25 is due to some physical
change. A small but broad endothermic transition at 172.8oC for ECAM-PMP-75
is probably due to glass transition temperature and other endothermic transition
at 388.7oC is due to some physical change. Again a small but broad endothermic
A brief review…… 148 transition at 226.8oC for PMP is probably due to glass transition temperature and
other endothermic transition is due to some physical change. it is evident that all
samples apparently followed single step degradation leaving 10-25% residue
above 400oC except ECAM.
ECAM is more thermally stable than that of PMP, while mixed matrix
materials possess intermediate thermal stability of ECAM and PMP. Similar trend
is also for observed in Tmax. High magnitude % residue for ECAM above 400oC
indicated formation of high cross-linked product as a consequence of primary
decomposition. It is clear that cured samples followed fractional (0.6-2.4) order
degradation kinetics. Upon comparing kinetic parameters of ECAM and PMP, it is
observed that PMP is somewhat more rigid than that of ECAM and this may be
due to more cross-linking density. Maleate branching courses low degree of
cross-linking due to comparatively a large distance between to branches and
vinyl ester. In case of mixed matrix materials both E & A are lower than parent
materials indicated improvement in flexibility mainly due to flexible maleate
linkages. The entropy change ∆S* was determined at their respective Tmax
according to equation 3 and is also reported in Table 3. The large and negative
magnitudes of ∆S* confirmed highly ordered transition state than individual
polymer molecules.
Degradation process is a complex process and involves a variety of
reactions such as chain cleavage, branching, rearrangement, cross-linking, etc.
Selective degradation occurs from weak points in the chains and consequently
formation of free radials result, which further undergo a variety of reactions and
degrade at higher temperature (>4000C) to form low molecular weight
substances. Ether and ester groups (main chain and side chain) in ECAM and
ester and pendent methyl groups in PMP are thermally weak points in the resin
molecules and therefore selective degradation is likely from these points.
CHAPTER-4
This chapter of the thesis elaborates fabrication and evaluation of
mechanical, electrical and chemical resistance of the composites. Jute
composites were prepared by hand-lay-up technique under 15.4 MPa pressure.
A brief review…… 149 ECAM composite is 1.8 times stiffer than that of PMP composite. Similarly ECAM
composite is 2.2 times stronger than PMP composite. Comparatively good tensile
and flexural properties of ECAM composite are due to better matrix–fiber
interfacial bonding. Comparatively good tensile and flexural strengths of the
composites indicated their usefulness for low load bearing housing units.
It is observed that the % water uptake increased linearly with the passage
of time and remained practically constant till the equilibrium was established
(96h) in each of the environment. In water and saline environment, water uptake
is almost the same and somewhat less than in acidic environment. The presence
of strong electrolytes in water affects the structure of water and hence diffusion in
fiber through capillary action. Water absorption continues till the cell walls are
saturated with water.
The diffusion coefficient of J-ECAM and J-PMP and it is somewhat varied
for hybrid composites and J-PMP in three different environments but for J-ECAM
it is quite different. Thus, little electrolyte effect on diffusion behavior in hybrid
composites and J-PMP is observed.


![SAURASHTRA UNIVERSITY, RAJKOT. 2016.pdf · 1 | SAURASHTRA UNIVERSITY RAJKOT SYLLABUS OF MCOM CBCS [[SAURASHTRA UNIVERSITY, RAJKOT FACULTY OF COMMERCE SYLLABUS FOR M. COM. [CBCS PROGRAMME]](https://static.fdocuments.in/doc/165x107/5e79675574cbc9252d4438ab/saurashtra-university-rajkot-2016pdf-1-saurashtra-university-rajkot-syllabus.jpg)


![FACULTY OF COMMERCE - Oshwal Education Trust · 2019-07-01 · saurashtra university, rajkot 1 saurashtra university, rajkot faculty of commerce syllabus for b. com. [cbcs programme]](https://static.fdocuments.in/doc/165x107/5e4f7a25559414422252db7c/faculty-of-commerce-oshwal-education-2019-07-01-saurashtra-university-rajkot.jpg)