Saurashtra Universityetheses.saurashtrauniversity.edu/632/1/kanani_nm_thesis...SHRI J.H. BHALODIYA...
216
Saurashtra University Re – Accredited Grade ‘B’ by NAAC (CGPA 2.93) Kanani, N. M., 2005, “Problems and Prospects of Fiscal Balance in Gujarat”, thesis PhD, Saurashtra University http://etheses.saurashtrauniversity.edu/id/eprint/632 Copyright and moral rights for this thesis are retained by the author A copy can be downloaded for personal non-commercial research or study, without prior permission or charge. This thesis cannot be reproduced or quoted extensively from without first obtaining permission in writing from the Author. The content must not be changed in any way or sold commercially in any format or medium without the formal permission of the Author When referring to this work, full bibliographic details including the author, title, awarding institution and date of the thesis must be given. Saurashtra University Theses Service http://etheses.saurashtrauniversity.edu [email protected] © The Author
Transcript of Saurashtra Universityetheses.saurashtrauniversity.edu/632/1/kanani_nm_thesis...SHRI J.H. BHALODIYA...

Saurashtra University Re – Accredited Grade ‘B’ by NAAC (CGPA 2.93)
Kanani, N. M., 2005, “Problems and Prospects of Fiscal Balance in Gujarat”, thesis PhD, Saurashtra University
http://etheses.saurashtrauniversity.edu/id/eprint/632 Copyright and moral rights for this thesis are retained by the author A copy can be downloaded for personal non-commercial research or study, without prior permission or charge. This thesis cannot be reproduced or quoted extensively from without first obtaining permission in writing from the Author. The content must not be changed in any way or sold commercially in any format or medium without the formal permission of the Author When referring to this work, full bibliographic details including the author, title, awarding institution and date of the thesis must be given.
Saurashtra University Theses Service http://etheses.saurashtrauniversity.edu
© The Author
A THESIS ON
“PROBLEMS AND PROSPECTS OF FISCAL BALANCE
IN GUJARAT” [POST REFORM ANALYSIS]
TO BE PRESENTED TO
THE SAURASHTRA UNIVERSITY FOR THE DEGREE
OF DOCTOR OF PHILOSOPHY
IN ECONOMICS
IN THE FACULTY OF ARTS
by KANANI N. M.
LECTURER IN ECONOMICS SHRI J.H. BHALODIYA WOMEN’S COLLEGE
(COMMERCE & BBA) ,RAJKOT.
Guide SHRI HATHI TUSHAR R.
LECTURER IN ECONOMICS SMT. M.T. DHAMSANIA COLLEGE OF COMMERCE,
RAJKOT
2005

STATEMENT NO. – 1
C e r t I f I c a t e
I here by declare that the research work undertaken by me on
the title “PROBLEMS AND PROSPECTS OF FISCAL BALANCE “PROBLEMS AND PROSPECTS OF FISCAL BALANCE
IN GUJARAT [POST REFORM ANALYSIS]”IN GUJARAT [POST REFORM ANALYSIS]” is based on the
secondary data and it is my own work. I have not
submitted such work previously to this University or
other University for any other degree or diploma.
Place: Rajkot Date: 04-4-2005 Name and Signature of Researcher
Kanani N. M.
STATEMENT NO. – 2
C e r t I f I c a t e
This is to certify that the research work undertaken by
KANANI N. M.KANANI N. M. on “PROBLEMS AND PROSPECTS OF FISCAL “PROBLEMS AND PROSPECTS OF FISCAL
BALANCE IN GUJARAT [POST REFORM ANALYSIS]”BALANCE IN GUJARAT [POST REFORM ANALYSIS]” is his
own work. To the best of my knowledge he has not submitted
such work previously to this or any other University for any
other degree or diploma.
Place : Rajkot Date : 04-4-2005
Name and Signature of Guide Hathi Tushar R.

Acknowledgement I pray to Almighty whose love and blessings have enabled me to
complete this task.
I humbly remember my parents at this moment.
I express my sense of gratitude to my guide Dr. Tushar Hathi for
his guidance at different stages of work.
My Pricipal Shri R. M. Fuletra has provided me encouragement
and inspiration for this task. I acknowledge the same with great
respect Pri. Shri T. T. Raiyani is also kind enough to have his all well
wishes for my work.
I am thankful to Prof. K.V.Oza (retd . Jamnagar), Prof. V. H. Joshi
(Retd. University Dept.), Prof. Dr. B. A. Pandya (retd. Uni. Dept.) and
Prof. Dr. K. K. Khakkhar for their keen interest in developing my
career.
I am always accompanied by my good friends who have through
out my work cooper ated me. I appreciate cooperation in this regard of
Vijay Bhatasana, Prof. Koringa Sir, Prof. N. C. Choksi, Raju Lalakiya and
Prof. K. H. Atkotiya.
Althrough this task, My wife Darshana and my son Umang and
deprived a little of the warmth and co operation . I heartily take note
of their tolerance and cooperation.
ShreeShivam Computers has completed the typographic work
neatly and accurately.
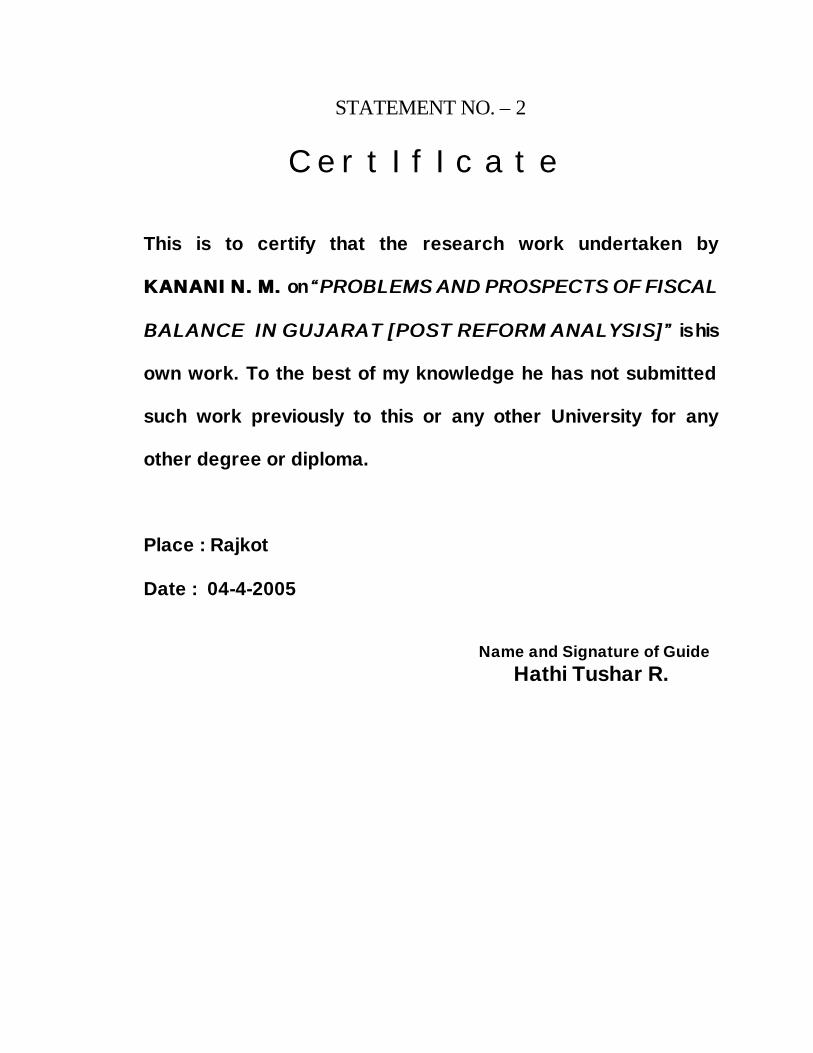
Table Index
4.4.1 What did the states get 89
4.4.2 States Stake 90
4.5.1 Central Government Expenditure 91
4.5.2 Central & State Government Expenditure
General Services 94
4.5.3 Central & State Government Expenditure
Social Services 97
4.5.4 Central & State Government Expenditure
Economic Services 100
4.5.5 Central Government Aid to State Government 102
4.5.6. Compensation and assignments to local bodies and
panchayat institutions 103
4.5.7 Central government’s receipts 105
4.5.8 Central government receipts (net of states’ share) 107
4.5.9 Central Government’s Tax Revenue 109
4.5.10 Central Government Deficit 111
5.1.1 Aggregate Fiscal Receipts and Expenditure Gujarat
1978-1996 118
5.1.2 Revenues and Receipts As percentage of Total
Expenditure 1978-96 119
5.1.3 Major Fiscal Indicators 1978-96 120
5.2.4 State Government Expenditure 124
5.2.5 Revenue Expenditure - All states Gujarat with
Percentage change over the year 126
5.2.6 Capital (incl. Loans & Advances) Expenditure –
All states Gujarat with Percentage change over the year 126
5.2.7 Revenue Expenditure - All states - Gujarat with
Percentage change over the year 130
5.2.8 Capital (incl. Loans & Advances) Expenditure –
All states Gujarat with Percentage change over the year 132
5.2.9 Revenue Expenditure - All states - Gujarat with
Percentage change over the year 134
5.2.10 Capital (incl. Loans & Advances) Expenditure –
All states - Gujarat with Percentage change over the year 136
5.2.11 Grant in aid: Compensation & assignments to
local bodies & Panchayat Raj institutions - All states –
Gujarat with Percentage change over the year
Revenue Expenditure 138
5.2.12 Capital (incl. Loans & Advances) Expenditure –
All states Gujarat with Percentage change over the year 140
5.2.13 Discharge of Internal Debt Capital (incl. Loans &
Advances) Expenditure - All states Gujarat with
Percentage change over the year 142
5.2.14 Repayment of loans to the center Capital (incl. Loans
& Advances) Expenditure - All states Gujarat with
Percentage change over the year 143
5.2.15 145-146
(A) Medical & Public Health Revenue Expenditure - All states Gujarat
with Percentage change over the year
(B) Capital (incl. Loans & Advances) - All states Gujarat with
Percentage change over the year
(C) Total Expenditure medical and public health All states Gujarat
with percentage change over the year
5.2.16 148-149
(A) Social Services : Family welfare Revenue Expenditure - All
states Gujarat with Percentage change over the year
(B) Capital (incl. Loans & Advances) - All states Gujarat with
Percentage change over the year
(C) Total Expenditure family welfare All states Gujarat with
percentage change over the year
5.2.17 Water supply and sanitation 150-151
(A) Revenue Expenditure - All states Gujarat with Percentage change
over the year
(B) Capital (incl. Loans & Advances) - All states Gujarat with
Percentage change over the year
(C) Total Expenditure Water Supply and Sanitation All states Gujarat
with percengtage change over the year
5.2.18 Housing 152-153
(A) Revenue Expenditure - All states Gujarat with Percentage change
over the year
(B) Capital (incl. Loans & Advances) - All states Gujarat with
Percentage change over the year
(C) Total Expenditure housing. All states - Gujarat with percengtage
change over the year
5.2.19 Urban development 155-156
(A) Revenue Expenditure - All states Gujarat with Percentage change
over the year
(B) Capital (incl. Loans & Advances) - All states Gujarat with
Percentage change over the year
(C) Total Expenditure Urban development. All states - Gujarat with
percengtage change over the year
5.2.20 Welfare of SC, ST & OBC 157-158
(A) Revenue Expenditure - All states Gujarat with Percentage change
over the year
(B) Capital (incl. Loans & Advances) - All states Gujarat with
Percentage change over the year
(C) Total Expenditure Welfare of SC, ST & OBC. All states - Gujarat
with percengtage change over the year
5.2.21 Labour and employment 159-160
(A) Revenue Expenditure - All states Gujarat with Percentage change
over the year
(B) Capital (incl. Loans & Advances) - All states Gujarat with
Percentage change over the year
(C) Total Expenditure Labor and employment. All states - Gujarat with
percengtage change over the year
5.2.22 Economic Services 162-163
(A) Revenue Expenditure - All states Gujarat with Percentage change
over the year
(B) Capital (incl. Loans & Advances) - All states Gujarat with
Percentage change over the year
(C) Total Expenditure Economic Services. All states - Gujarat with
percengtage change over the year
5.2.23 Agriculture and allied services 164-165
(A) Revenue Expenditure - All states Gujarat with Percentage change
over the year
(B) Capital (incl. Loans & Advances) - All states Gujarat with
Percentage change over the year
(C) Total Expenditure Agriculture and Allied services. All states
Gujarat with percengtage change over the year
5.2.24 Rural Development 167-168
(A) Revenue Expenditure – All states Gujarat with Percentage change
over the year
(B) Capital (incl. Loans & Advances) - All states Gujarat with
Percentage change over the year
(C) Total Expenditure Rural development. All states Gujarat with
percengtage change over the year
5.2.25 Energy 169-170
(A) Revenue Expenditure - All states Gujarat with Percentage change
over the year
(B) Capital (incl. Loans & Advances) - All states Gujarat with
Percentage change over the year
(C) Total Expenditure Energy. All states-Gujarat with percengtage
change over the year
5.2.26 Industries and Minerals 171-172

(A) Revenue Expenditure - All states Gujarat with Percentage change
over the year
(B) Capital (incl. Loans & Advances) - All states Gujarat with
Percentage change over the year
(C) Total Expenditure Industries and Mineral. All states-Gujarat with
percengtage change over the year
5.2.27 Transport & Communication 173-174
(A) Revenue Expenditure - All states Gujarat with Percentage change
over the year
(B) Capital (incl. Loans & Advances) - All states Gujarat with
Percentage change over the year
(C) Total Expenditure Transport and Communication. All states-
Gujarat with percengtage change over the year
5.2.28 Expenditure pattern under planning period
[Percentage to total expenditure] 175
5.2.29 Total receipts all states and Gujarat 178
5.2.30 Revenue Receipt - All states Gujarat with Percentage
change over the year 181
5.2.31 Capital Receipt - All states Gujarat with Percentage
change over the year 182
5.2.32 Tax Revenue - All states Gujarat with Percentage
change over the year 183
5.2.33 Non-Tax Revenue - All states Gujarat with Percentage
change over the year 185
5.2.34 Tax Revenue : State's own tax Revenue - All states
Gujarat with Percentage change over the year 186

5.2.35 Tax Revenue : Share in Central Taxes - All 188
States Gujarat with Percentage change over the year
5.2.36 Tax Revenue : States Sales Tax - All states
Gujarat with Percentage change over the year 189
5.2.37 Tax Revenue : Central Sales Tax - All states
Gujarat with Percentage change over the year 190
5.2.38 Composition of the State's own taxes 191
5.2.39 Collection of own tax and non-tax revenue in Gujarat 193
5.2.40 Un-recover variable cost of non- merit services by
social and economic sectors 196
5.2.41 Potential Revenue Through Improvement in Cost
Recovery Rates of Selected Non-merit Services 197
5.2.42 Central Subsidy to Gujarat State (Rs. Crore) 198
5.2.43 State Governments Liabilities (Total Debt.) 199
5.2.44 Department wise Guarantee outstanding 200
5.2.45 Debt. / GSDP ratio 201
5.2.46 Revenue Deficit as % of GSDP 202
5.2.47 Gross Fiscal Deficit - All states Gujarat with
Percentage change over the year 203
5.2.48 Gorss fiscal deficit as percentage of GSDP 203
1
Chapter – 1
Public Finance Concept and Overview
1.1 Introduction:
Public finance has attained greater importance under the new
economic order in the earlier days. It was considered as dull, extremely
limited and irrelevant discipline. Today it is known as one of the most
exciting areas in political economy. It is also known as public sector
economics or public economics.
In the history of economics it is found that the classical economist did
not pay much attention to the public economics. Though Adam Smith
provided broader and firm ground the study of public finance, he did not
refer to unlimited power to the state. It was understood that Govt.’s
intervention is necessary for law and order, apart from that no kind of
Govt.’s intervention is required. Adam Smith in this regard believed that
natural liberty require a frame work of security and legal rule which only
Govt.’s could provide. Adam Smith did not discuss however Govt.’s
necessities for market failure in general in detail. Ricardo and J.B. Say also
largely subscribe to the view that, “The very best of all plans of finance is to
spent little and the best of all taxes is that which is least in amount.”
J.S. Mill tried to examine the proper scope of Govt., though in general
he also said that absolute freedom should be the general practice but for
some greater good Govt. intervention is necessary. He explained that govt.
should intervene where individual are unable to evaluate the utility of certain
products like elementary education for children. Secondly Govt. should
intervene when because of lack of foresight, the individuals may enter into

2
contract, which are exploitative in nature and thirdly where there are chances
of monopoly. Leading to conflicts of interest. In general basic infrastructure
work is the core part where govt. should play its role.
Historically one finds clear difference in respect of public finance
between the west European countries and British economy. In Britain it was
generally found that the market should be accepted as the rule and public
sectors as the expectation. While in a country like Germany, it was believed
that public sector also be as important as the private sector. British economy
is largely based on individual entitlements and free exchange. In respect of
public finance much debate is also found regarding subjective value and
social goods. This debate refers to the concept of social policy objective in
fiscal affairs. Detailed literature is available in this regard from wicksell
Jevons Pigon etc.
The fundamental changes have occurred in the field of public finance
theory and policy since the Keynesian revolution. Even in those days no
systematic and integrated theory of public finance appropriate for an under
developed but developing economy was formulated. There were attempts
being made to study the problems of public finance in underdevelop
countries. The fiscal division of the department of economic affairs of the
UNO has undertaken both country-by-country and thematic studies. The
USA had also dispatched several fiscal missions to many poor countries. It
was because of all these efforts that the knowledge and understanding of the
fiscal practices and problems of under developed countries have
significantly increased. Since the end of Second World War, in the second
half of the twentieth century, under developed also began to recommend the
application of Keynesian tools in their own economy. It was believed that
the objectives of fiscal policy are more or less the same in advanced and the
3
poor countries. In poor country the people in general aspire for regular and
maximum flow, as development should move towards the poor groups. They
also wish that let there should be economic stability to control inflammatory
pressure and to reduce the extreme inequalities of wealth, income and
consumption. Thus these areas are much more similar with the areas of
developed economy. However this similarity in goals should not be regarded
as the need for equal tools with equal approach to be applied. There is vast
difference in cultural, legal and political environment between developed
and under developed countries. There for to follow the same policy could
not be effective solution to the problems. It is in this regard that leading
economist advocate for separate policy measures in under developed
countries. It is generally found that in most developing countries per capita
income is very low to turn into cumulative. Therefore without public
intervention market does not provide correct guidance. In order to strengthen
the economy, ordinary public finance instruments like taxation; public
expenditure and public borrowings are regarded more useful.
Public finance is also given due importance in under developed
economy in respect of its key role for capital accumulation for the
development of economy. Rugnar Nurkes throws light on the role of public
finance in under developed economy with special reference to capital
formation Richard Goode is also of the opinion that in an under developed
country where it is determined to avoid both stagnation and inflation it
would be necessary to find ways for raising large and growing amount of tax
revenue.
It is largely found that there has been the rapid expansion of the public
sector in recent times, and the emergence of fiscal crises during the 1980
have made public finance a greater subject of development challenge. The

4
world bank also clearly admits the fact that there has been growing
awareness increasingly observed in both developed and under developed
countries. Development economist considers the emergency of public sector
as a natural and necessary part of development. It is termed as public interest
view according to which Govt. are required intervention to foster
development. In the World Bank report of 1988. It is clearly mentioned that
market mechanism may produce insufficient growth as well as macro
economic imbalances such as balance of payments deficits and
unemployment. According to public interest view, these market failures need
to be corrected by Govt. through public provision of goods and services,
through public savings and investments and through taxes, subsides and
regulation.
Public intervention emerging out of public interest view has also led
to some problems, which can be regarded as Govt. failures. It is experienced
that the countries having more public intervention has led to slow growth,
lagging private savings and investments high rates of inflation, huge balance
of payment deficits, heavy debt burden and continued poverty and
unemployment. However advocates of public interest view have expressed
the opinion that these problems are not inevitable or irreversible. According
to them policy and administrative reforms have been proposed to correct
such Govt. failures.
The advocate of private interest view claim that there is inefficient
public and private provision of goods and services, which has led to fiscal
imbalances. These fiscal imbalances have placed difficulties in
implementing effective stabilization and adjustment programs in developing
countries from this it is concluded that these is a negative co-relation
between economic growth and the share of Govt. spending in GDP.

5
The world bank has come forwarded in this regard with some concrete
guide lines, according to the world bank a pragmatic view is one that
considers the public & private interest view not as too opposing approaches
but as complementary one to understand the significance of public sector
and public finance. According to World Bank a pragmatic approach to
public analysis might begin by ranking areas of economic activities,
according to the extent to which Govt. intervention is desirable. The ranking
should be in respect of efficiency, growth, poverty alleviation and
stabilization.
1.2 Basic Concept
There are many disciplines in economics. Public finance is one of the
important disciplines of economics. It involves certain basic concepts in
view of making academic exercise related to particular disciplines. It is
worth while to have a look at the primary concept of the said discipline
concepts largely used in relation to public finance can be mentioned as
under.
A. Public finance:
According to Harold grooves, “public finance is a filed of inquiry that
treats of the income and the out go of Govt.’s (federal state and local). In
modern times this includes four major division public revenue, public
expenditure, public debt and certain problems of the fiscal system as a whole
such as fiscal administration and fiscal policy.”
According to Musgrave, “The complex of problems that center on the
revenue expenditure process of Govt.’s is referred to traditionally as public
finance.”
6
Thus public finance is the discipline in which largely Govt.’s
economic activities are discussed. It included various aspects of Govt.’s
income and expenditure.
B. Private finance:
It is the statement or analysis of individual’s income and expenditure.
It refers to the personal income and spending. It is private in the sense that
there is no Govt.’s direct or indirect responsibility for the generation of
income and spending of income.
Private finance in general is not the direct subject of economics. It has
necessarily economic linkages. But it does not fall directly in the scope of
economics.
C. Federal finance:
This concept is more important especially in the countries where there
is a particular political structure of the state in which the union and the units
forming the union are studied in view of economic activities. It refers to two
tires of governance. The state having it’s own political boundary and the
union having the political boundary of aggregate states. Federal finance
refers to the inflow towards center from the states and out flow towards the
states from the center. Constitutionally economic powers are assigned to the
states and the center, and responsibility is also entrusted to the states and
center. There is clean defining constitutional provision for mutual economic
relations between center and the state. Federal finance assumes greater
significance to understand the relationship between the center and the state
in general and for economic activities in particular.
7
D. Fiscal policy
The term fiscal is divided from ‘fisc’ a Latin word it means related
with Govt.’s treasury. Any Govt. is expected to undertake economic
activities more or less. This demands the account of income and expenditure.
Any govt. action or the policy, which leads to the balance or the
management of govt. revenue and expenditure, is considered as fiscal policy.
It includes several issues regarding the sources of govt. revenue and the
nature and amount of govt. expenditure under federal financial structure.
Fiscal policy is framed for the nation by the union govt. and the state govt.,
also frame certain policy measures restricted to the state activities.
E. GDP: gross domestic product
It refers to the income of the state which is generated from within the
boundary of the country only, therefore it does not include the revenue
accrued to the state from out side the country.
F. Public expenditure:
Total expenditure incurred to any govt. during the financial year is
known as public expenditure. It incurred to the Govt.’s for undertaking
different activities as part of welfare objective. It however includes
expenditures like development and non-development expenditure, plan and
non plan expenditure.
In context of India some new classification of expenditure is made it
follow as under.
a. Development expenditure:
Any expenditure made by the govt. for the total development
activities, it is regarded as development expenditure. Central. Govt. includes

8
expenditure on social and community services, economic services and grant
in aid to the states and union territories for development purpose. All these
expenditure as earlier formed the part of civil expenditure.
b. Non development expenditure
That expenditure increased to the Govt., which is not productive in
nature largely form the part of non-development expenditure. Expenditures
incurred to collect the tax and duties administrative services, interest
payment, pension and other retirement benefit, defense expenditure all such
can be included in non development expenditure.
c. Plan and non plan expenditure
From 1987-88 budgets Govt. has classified public expenditure into
two categories non-plan expenditure and plan expenditure.
That expenditure which does not directly form the part of Central
Govt. plan is non-plan expenditure. It is again divided in to revenue and
capital expenditure.
Under revenue, expenditure generally interest payment, defense
revenue expenditure, reserve subsidies, interest and other subsidy, debt relief
to farmers, postal deficit, police pensions, other general services social
services – economic services and grants to the states.
Under capital non-plan expenditure, defense capital expenditure, loans
to public enterprises, loans to states & union territories and loans to foreign
govt.
9
d. Plan expenditure
It is the second major items of central govt. expenditure it refers to
that expenditure which necessarily forms the part of the Govt. plan central
Govt.’s, plans on agriculture, rural development, irrigation and flood control,
energy – industry & mineral, transport, communication, science and
technology and environment, social services and others. Apart from these,
central Govt. also provides assistance for plan states and union territories.
G. Capital receipts.
On one hand Govt. has to make certain capital expenditure and on the
other hand govt. also receives certain capital receipts. These receipts form
the part of Govt. capital activities. It refers to net recoveries of loans and
advances to state Govt. and union territories and public sector enterprises,
net market borrowings and net small saving collections. It however includes
other capital receipts arising from provident funds special deposit etc.
H. Tax revenue
Govt. receives the income through tax revenue. It is that revenue
accrued to the state by levying taxes – these taxes could be direct and
indirect.
In the direct tax, taxes on income, taxes on property and capital is
included. While tax revenue generated through the taxes on commodities
and services form the part of indirect tax.
Non-tax revenue is that revenue which is generated through the
sources other than tax. This generally includes currency, coinage and mint.
Interest receipts and dividend.
10
I. Deficit financing
When Govt. tries to bridge the deficit between income and
expenditure, it is known as deficit financing. It basically refers to additional
money circulation and or Govt.’s own borrowing. It is regarded as artificial
attempts to cover the natural deficit. Generally, monetary expert advice to
the economy to go for deficit financing strictly in restriction. It could be
used as medicine but not as regular diet. Underdeveloped countries generally
fill the need for such deficit financing. There is a fear of inflation due to
excessive use of deficit financing.
J. Different deficits
When govt. fails to equal the receipts with the expenditure, the
problems of deficit arises. These deficits are termed differently as under.
a. Revenue deficit:
The concept of revenue deficit is a simple and straight one. When
revenue expenditure is in excess to the revenue receipts. It is known as
revenue deficit. On one hand Govt. incurs current revenue expenditure and it
is mat out of current revenue receipts. Therefore it can be said that revenue
deficit reflects the failure of the Govt. to meet its current expenditure from it
current revenue. In India the deficit has become a special treat of Govt.
budgeting from the 1970s.
b. Budget deficit:
When govt.’s total expenditure is more than the total receipts it
becomes budget deficit. Here all expenditure includes revenue and capital
11
expenditure. Similarly all revenues refer to revenue and capital receipts.
Actually deficit financing by the Govt. of India is to meet this deficit.
c. Fiscal deficit:
Fiscal deficit is technically budgetary deficit + market borrowing and
other liabilities of the Govt. of India. It is the most important deficit; it
shows the gap between Govt. receipts and Govt. expenditure. It reflects the
true extent of borrowing. All international institutions consider fiscal deficit
as the efficiency criteria for Govt. financial performance.
d. Primary deficit
It is the most recently introduced kind of deficit. It refers to fiscal
deficit interest payments.
However this concept of primary deficit is not more recognized or
more popular in other countries of the world.
e. Grant in aid
It is constitutional provision made under the constitution. The states
are expected to perform some welfare functions but state Govt.’s may not be
having adequate revenue to perform such functions. It was to over come this
problem that the constitution provided for a mechanism of grants from the
center to the state. It is a kind of assistance in amount, which is not to be
returned to the center. It is provided generally to over come current revenue
deficit, or to correct inter state disparities in resource. It may be for specific
purposes such as the promotion of education in a back ward state or for
toning up of administration.

12
f. Subsidy
It is a kind of direct assistance, provided by the central to the state, or
in follow through by the state to the local governing institutions. It refers to
the assistance provided by the Govt. to over come the loss incurred for
meeting welfare requirements. Subsidy is also found of different nature,
when food or fertilizer provided to the consumer at the price lower than the
Govt. procurement price, it is called cash subsidy. When small-scale
industries or priority sector loans provided to the individuals at the rate
lower than the market rate, it is called interest or credit subsidy.
Free medical services provided at Govt. hospitals, equipments
provided to the physically handicap persons, all these is kind subsidy.
There is also regulatory subsidy when prices of goods produced by
public sector is fixed less than its cost it is regulatory subsidy – such subsidy
is provided as purpose for inputs to industry for helping certain other
categories of consumers.
K. Privatization
It is the concept, which has attained greater significance under new
economy. When govt. is determined to withdraw from any of its own
undertaking. It refers to the privatization. When govt. finds that the greater
amount of public interest can well be served through handling over govt.
activities to the private it is regarded as privatization. Generally it is said that
privatization of public enterprises is justified when it leads to an increase in
social welfare. It is generally made to improve the performance of public
enterprises in respect of production and allocation of resources. It is also
made to reduce the budget deficit. It has become more important in context
of changing economic environment.

13
L. Disinvestments
When govt. is determined to sale out it’s equity, it is known as
disinvestments. When any public sector unit fail to maintain the efficiency
and it incurred burden of loss on Govt. It is decided to have the policy of
disinvestments. It is an indicator of basic change that is taking place in
economic operations. It provides greater scope for private sector initiation
development process.
1.3 PURE THEORY OF PUBLIC EXPENDITURE
The pure theory of public expenditure relates to those principles,
which govern the "optimal" provision of public goods. Two principles are
generally considered in this context. They are "ability-to-pay" principle and
the "benefit" principle
1.3.1 Pigou and Ability-to-pay Theory
The use of the ability -to-pay theory to the determination of the
optimum level of public expenditure has received most comprehensive
treatment in the hand of Pigou1. He says that goods and services, which are
provided by government departments and can be sold for fees so arranged as
to cover cost of production pose no problem. The amount of resources, which
should be devoted to these purposes is determined automatically by public
demand. But fees can cover neither bulk of non-transfer expenditure of
government such as defence, civil administration and so forth nor transfer
expenditure. "Hence there is no automatic machinery to determine how far
expenditure shall be carried; and some other method has to be employed."
Bulk of current transfer expenditure—debt services, war pensions,
old age pensions—is regulated by practically irrevocable contracts. But
14
large parts of non-transfer expenditure are optional. The optional parts of
public outlay—transfer as well as non-transfer need to be "regulated with
some reference to the burden involved in raising funds to finance them"
Pigou propounds the principle of balance based on the concept of margin.
The optimum amount of government expenditure is determined at the point
at which the satisfaction obtained from the last rupee spent is equal to the
satisfaction lost in respect of the last rupee called upon by government
service. Pigou states the conditions when government expenditure could be
larger. It is stated, the greater is the aggregate income of the community, the
larger will optimum amount of the government expenditure be. Second, in
case if new opportunities for expenditure by government are opened up but
there is no corresponding opportunity for private expenditure, the balance
between marginal benefit of expenditure and marginal disutility of revenue
will be struck at a higher point. Third, given aggregate income and
population, greater the concentration of income in the hands of a few rich
persons, higher the optimum level of public expenditure. It is for the
simple reasons that tax scheme can be so framed as to raise A given
revenue with lower marginal sacrifice.
The principle of balance—equality of marginal satisfaction of
expenditure with the marginal sacrifice of raising revenue—can be
applied to the distribution of government resources "between battle-ships
and poor relief," that is, between different types of expenditure by the
Government. As Pigou states, "... just as an individual will get more
satisfaction out of his income by maintaining a certain balance between
different sorts of expenditure, so also will community through its
government."4 Expenditure should be so distributed among different

15
heads that the last rupee "devoted to each of them yields the same return
or satisfaction."5
1.3.2 Voluntary Exchange Theory of Lindahl for determination of
Public Expenditure
It is understood that the price mechanism, which can lead to the
realization of Pareto optimality, does not exist for the provision of public
goods and services because they are jointly consumed. Hence, they cannot
be split up and sold to individual buyers. Further once these goods and
services, are supplied, all members of the society consume them—those
who pay for them as well as those who do not (i.e., the free-riders). In
spite of these difficulties attempts have been made to construct a theory of
public expenditure based on price mechanism as applicable to private
consumption. The first clear statement of this theory was provided by the
Swedish economist Erik Lindahl in 1919. The relevant portion of this
theory is printed in English in the book
16
entitled "Classics in the Theory of Public Finance" edited by R.A.
Musgrave and Allan T. Peacock.
The fundamental point of Lindahl's theory is that "he regards the
determination of public expenditure in connection with the distribution of
the corresponding tax burden among the groups within the community. The
distribution ratio for this burden will then play a role similar to that of
prices in the adjustment between supply and demand in any ordinary
market.
In this theory the revenue-expenditure process, as a phenomenon of
economic value and price, is arrived at in a threefold decision. (1) Before
determining the relative distribution of tax shares between various
taxpayers, a choice must be made between the satisfaction of alternative
wants by private households. Suppose a given sum is to be raised from the
taxpayers A and B jointly. Now if B pays a larger share of the total tax,
A's curtailment of his own private outlays will be smaller (that is, A pays
less tax) and vice versa. (2) A second choice is now required. It is
between the satisfaction of alternative wants in the public sector. If more is
spent on defense, less can be spent on education. (3) In order to determine
the total revenue to be collected and spent, a third choice is to be made
between the satisfaction of public wants and private wants. If Public
expenditures are lower, taxes will be required in smaller quantity and
there will be less curtailment of private spending. "This third decision
cannot be rendered without a knowledge of the relative distribution of tax
shares and the expenditure allocation corresponding to varying revenue
expenditure totals. The three decisions, therefore, are mutually
interdependent and must be rendered jointly."8
17
In Lindahl's theory, the same process is followed for public
economy too. Hence, the allocation of the total cost of production of two
joint products X and Y is done according to the respective supply prices
of the two products based on the demand prevailing for the two products
respectively, and not according to cost imputation. Suppose A is the
purchaser of X, while B is the buyer of Y. If A is willing to share only
a small portion of the total cost of producing both X and Y, then B will
be required to contribute a correspondingly larger share. In the opposite
case when B is willing to contribute a smaller portion, A will be called
upon to contribute a larger share. A's dependence upon B is due to the
fact that benefits derived from the supply of public services are not
divisible into individual benefits; they are received jointly by all
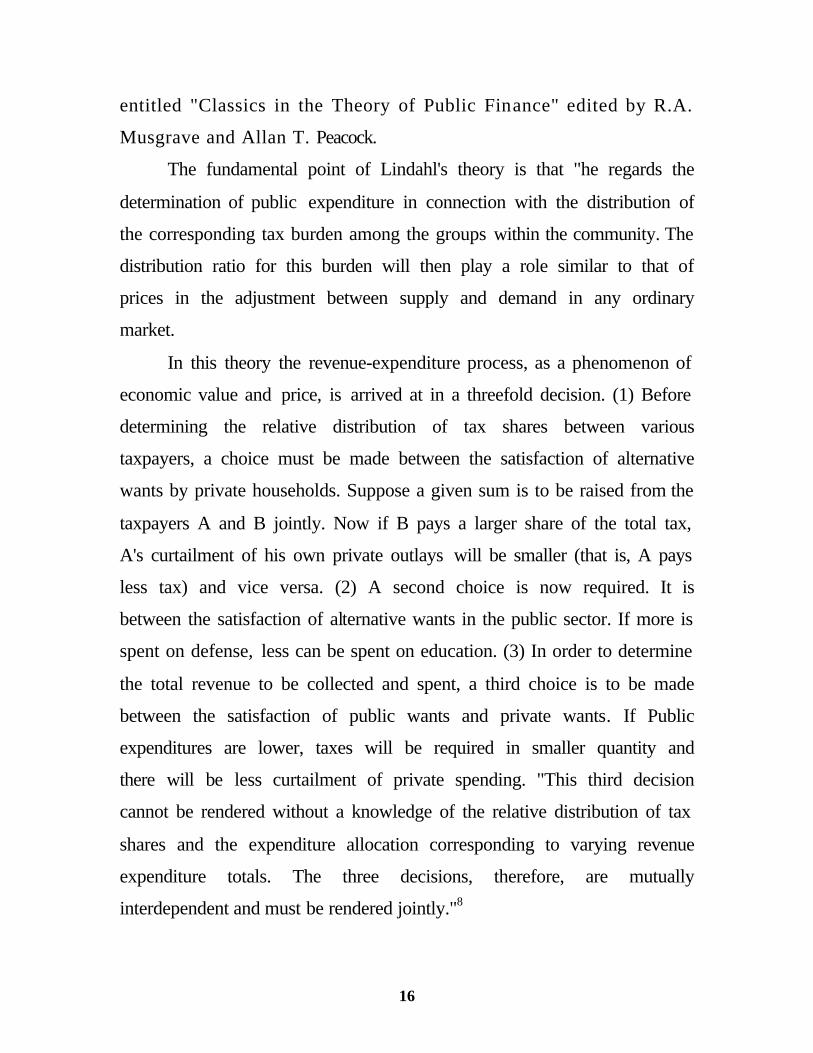
members of the community. This is presented in Following figure.
Lindahl.
In the figure we continue to assume two taxpayers, A and B.
Percentages of total cost contributed by A are measured along the vertical
line, while the quantities of public goods which they purchase (in equal
quantities) are measured on the horizontal axis. Curve aa shows the
varying percentages of total costs incurred in providing these goods which
A is willing to ' contribute. Similarly, curve bb indicates the percentages of
18
total costs which B will be willing to share. The figure shows that the
maximum amount of the public good that can be produced is OM. For this
quantity A is willing to contribute PM percentage of the total cost of
production. B is, willing to share the remaining portion of the total cost, that
is, PN percentage. For any other amount, the total cost is either over-
contributed or under-contributed. If, for instance, the good is produced in
OK quantity, A is willing to contribute KQ percentage of the total cost,
while B shows his willingness to pay LR percentages. Their joint
contribution comes to KQ + LR which is more than the total cost LK. In the
situation when OS quantity is produced, the entire cost ' of production will
not be contributed by A and B together. A is willing to pay only DS
percentages while B is not willing to contribute more than TC percentages.
Thus CD portion of the total cost remains uncovered,
1.3.3 Samuelson's Pure Theory
Samuelson states that his exposition of the pure theory of public
expenditure goes back to Italian, Austrian and Scandinavian writers who are
responsible for the renaissance of the benefit approach.
Public goods are provided collectively. They cannot be provided by
private enterprise. Private goods are provided on the basis of preferences
revealed freely by individuals in the market. Individual preferences are
not known in the case of public goods. So how can the market principle
be applied to the provision of public goods? Answer to it is that in "a
democratic society.... The ultimate justification of the governmental
provision of public goods or other activities is the desire of the members
of society for such goods and activities, rather than an authoritarian
determination that such action is desirable."9 Though government may
19
largely influence individual preferences for public goods, it may yet be
assumed that such preferences are the ultimate source of justification for
governmental activities. On this assumption let us analyse how the
market principle can be applied to the determination of the optimal
provision and financing of public goods. In order to do this we take the
familiar supply and demand diagram. Its application to social goods is
not realistic but it may serve as a good starting point.
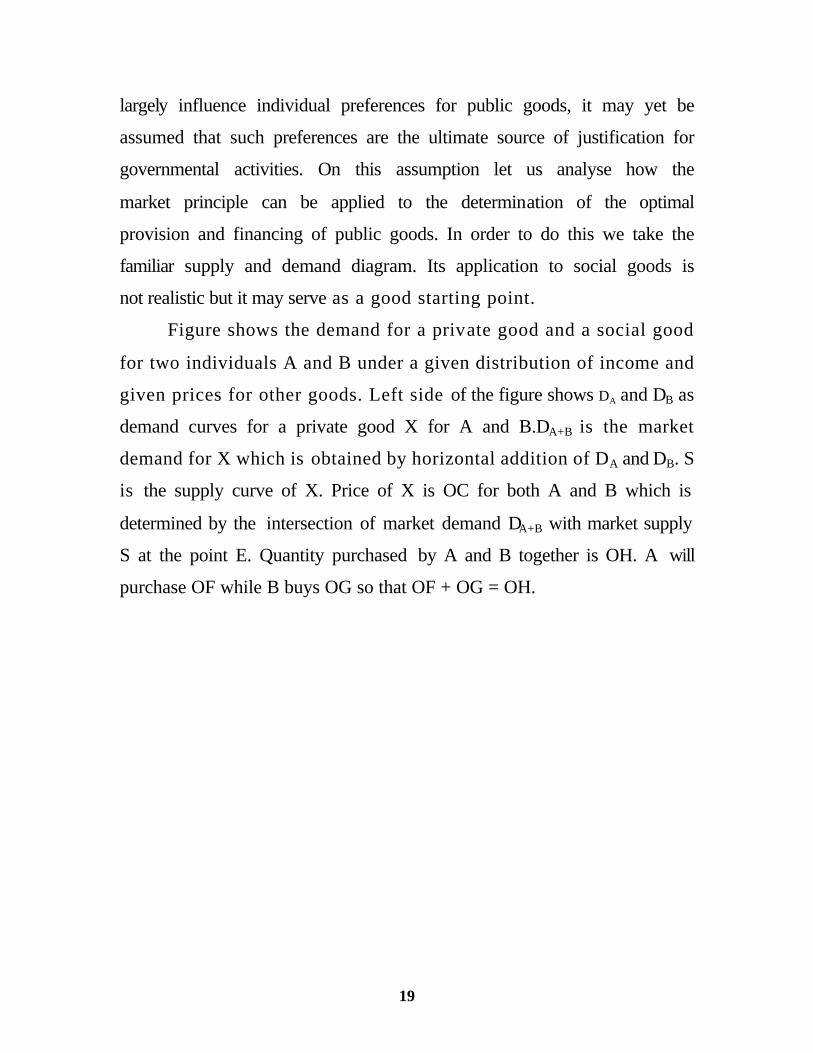
Figure shows the demand for a private good and a social good
for two individuals A and B under a given distribution of income and
given prices for other goods. Left side of the figure shows DA and DB as
demand curves for a private good X for A and B.DA+B is the market
demand for X which is obtained by horizontal addition of DA and DB. S
is the supply curve of X. Price of X is OC for both A and B which is
determined by the intersection of market demand DA+B with market supply
S at the point E. Quantity purchased by A and B together is OH. A will
purchase OF while B buys OG so that OF + OG = OH.

20
Quantity of Private Good Quantity of Social Good
Right side of Figure shows that DA and DB are demand schedules'" for A
and B and DA+B which is obtained by vertical addition of DA and DB, is the
market demand for the social good, G. Since all taxpayer-consumers
consume G in the same quantity, market demand for social good requires
vertical addition of individual demand curves. S is the supply schedule of
G. Equilibrium between demand for and supply of G is given at E.
Consumption of G by both A and B is ON and the combined price is OK,
of which OM is paid by A and OL by B so that OK = OM + OL.
It should be clear from the above that the production of social good
and its pricing are determined by the same principle which applies to the
case of a private good. However, one important difference should be noted.
Samuelson says that efficiency requirement in the case of private good is one
in which marginal benefit from such good for each individual equals its
marginal cost. In the case of a social good this rule requires that marginal
benefit for each individual differs and the sum of such marginal benefits
equals marginal cost. Consequently, application of the same pricing principle
21
to both social and private goods gives us different results'. Each individual
purchases the same amount of a social good but pays different prices for it
depending on his valuation of the good. In the case of private good, each
consumer pays the same price but purchases different amounts of this
commodity. Here in this curve marginal benefit derived by A and B in
consuming OF and OG respectively is equal to the marginal cost HE (case of
private good). Each individual consumes ON quantity of the social good but
A pays OM price for it while B pays a price equal to OL. Yet in both cases,
the same pricing rule is applied. Each consumer pays a single price for
successive units of the good purchased while the price equals the marginal
benefit that the purchaser derives.
1.4 Global economy at glance.
Public expenditure plays important role in development of economy.
It is found that public expenditure has its task both in the developed and less
developed countries. However variation is found in the extent and the nature
of public expenditure with changes in the status of economic development.
The amount of public expenditure is largely determined in respect of
economic and non-economic fact. Musgrave explains this as “the theory of
public expenditure developments.”
With the process of development, the needs of the economy get
changed. With this change there is a change related to both the allocation
and distribution aspects of expenditure. Allocation is more related with the
level of public expenditure. The distribution aspect is related with the
question weather there is an increasing or decreasing need for distributional
measures with the growth of economy. These questions are part of economic
factors.
22
Generally economic factors influence the allocation and distributional
aspects. However existing social and economic factors also influence the
state finance. It depends on demographic changes, technological
environment and some other non-economic elements. Non-economic factors
and economic factors are basically different in nature but these have close
interdependence. Therefore a strict divide would not be more effective in
smooth functioning of public expenditure.
In economic factors there is allocation and distribution, which have
strong influence in shaping the economy. In any economy public
expenditure is also lead by some other determinants. These could be social
cultural and political. Generally we find difference in the volume of public
expenditure between developed countries and less developed countries.
There may be some variations in the heads of public expenditure. Close
examination of the pattern of pubic expenditure both in the developed and
less developed countries leads us to conclude that the basic expenditure is
common to country at all levels of development. Important things is found
with regard to the share of public expenditure is that there is found greater
difference in the volume of public expenditure in relation to the GDP of
economy. It is observed that the developed countries or the richer countries,
generally spent more on defense and on the public debt. In less developed
countries or in poor countries more amount is spent on the providing of
social securities health – education etc.
The richer countries spend for more on defense. Public Dept. and
Agri. subsidies. At global level the cost of public debt is found highest in
UK. Followed by Newzeland. Newzeland leads in the field of social
insurance, while in USA much is spent on defense.
23
In respect of public expenditure capital expenditure is less easy to
compare then is basic current expenditure. It is less easy because there is
problem of working out variations in the budget. Initially in the year 1953-
54. India spend 2.3% of GNP while a capitalist country like Sweden the
expenditure was 14.0%. It reflects wide range of variation. Generally the
extent of public capital expenditures depends on the dependence of
productive sectors like agriculture – transport, industry on Govt. for finance.
On the other hand it is experienced that in different countries importance of
public saving is also increasing. This could be attributed to the several
factors like very less private saving in poor countries, inadequate private
international investment, budget surplus by way of excess in investment over
saving and move to create new capital in the public sector.
The pattern of Public expenditure as reflected in between 1950-60
tends to reveal the facts that there is very little difference in the amount on
spending on education as % of national income or as % of total expenditure
between poor and rich countries. A similar trend is also observed in respect
of health and some other primary expenditure. Broadly it can be said that
Asian countries spend more on defense as % of GNP.
Looking at the public expenditure of various countries it is also found
that there are differences between functional expenditure and economic
expenditure. Functional expenditure, included general public service-
defense, educational, health, housing, Agri. and allied activities, running
electricity, roads, communications, water etc. While economic expenditure
includes spending on goods and services, interest payment subsidies and
capital expenditure like fixed capital assets and capital transfers.
The last two-decade of the twentieth century express relatively
significant changes in the pattern of public expenditure. The changing trend
24
is found more in the developing countries rather than developed countries.
With the dimensional changes in the international economic order the nature
and volume of public expenditure is also influenced.
The resources with Govt.’s to meet the demand are found scarce in
less developed countries. Public undertaking in such countries has also
proved less efficient in respect of revenue generation. It is the poor
performance of public sector, which led to the deficit. Because of this deficit
basically the increasing Govt. expenditure has not remained productive as
much as expected. Therefore the issue of public debt. becomes more
significant. After the completion of Second World War many small
countries had began to borrow. In the last two decades the changes are found
mainly because of the changes in the conditionality of international
institution. In respect of public finance the issue of public dept. needs to be
examined separately. It is true that the countries depending on external
borrowing did get command over there current produced goods. It makes
possible for the borrowing countries to finance its self without displacing
household and enter prize spending. But a matter of concern for less
developed countries is that the payment of interest on foreign borrowing and
repayment of the principal has not reduced in the transfer of resources.
Therefore it is found that the less developed countries do find immediate
gain to balance the resources but the future real cost of debt services and
debt repayment causes a challenge. Debt service ratio is the ratio of debt
service (interest and amortization) to the value of exports of goods and
services. This ratio measures the burden of debt in the short term in the
medium terms or in the long run a better indicator of debt burden is the ratio
of debt to GNP.
25
This debt service ratio to exports is found to have increased for all
developing countries. After 1980 there has been a shift in industrial
countries toward anti inflationary macro economic policy leading to rapid
rise in nominal interest rate. Policy changes, at the international level have
severely heat the developing countries in the last two decades. As per the
world development report of 2003, the total external debt. of chine in the
year 2000 was 149800 million dollars, which was 13% of GNP. It was found
99062 million dollars in India. One of the seriously heat country is Ethiopia
where in the external debt was 5481 million dollars that was 52% of the
GNP. Malaysia also was facing the problem with 52% of GNP amounting to
41797 million dollars. In aggregate the total external debt burden of law
income countries was 552095 million dollars. While it was 1798508 million
dollars in middle-income countries. This data reveal the picture of
document, the share of debt burden, as resource component of public finance
amongst the less developed countries.
Global economic scenario definitely indicates global slowdown. This
global slowdown virtually reflects down fall of the economy in respect of
spending of the economy. It is important to note that slowdown is common
characteristics found in most of the countries of the world. However the
ground for slowdown that which exists in the developed economy and which
is found in under developed economy is distinct from the each other. One of
the major causes for the slowdown in poor countries is declining purchasing
power. It means that drastic policy changes at the Govt. level have resulted
into the crises. It is in this regard that once again global scenario Indicate the
necessity of an increasing public expenditure in different form with different
angles.
26
1.5 Federal financial structure of Indian economy:
India became independent on 15th August, 1947. Indian constitution as
republic nation comes in to force from 26th January 1950. As a nation India
is formed of different states with the central union. Therefore federal
structure of Indian economy is constitutional one. However the present
federal system of finance in India has been achieved through an evolutionary
process spread over the last 100 years or so.
1.5.1. Historical Look
Under the colonial rule finances of British India were highly
centralized. William Massey made an effective scheme of federal finance in
British Indian administration. It was implemented in 1858. However
successful and modest scheme for financial centralization was drafted by
lord mayo and was adopted in 1871, in 1877 heads of revenue were de
marketed in to central and provinces. The system of consolidated federal
finance was implemented through the Govt. of India in 1919 under that act,
for the first time some sort of financial autonomy was awarded to the
provincial Govt.’s Again in 1935 the govt. of India passed the act for the
formation of federal form of govt. at the center with autonomy to provinces.
This situation regarding financial relations between the center and the
provinces- continued till 1947. In the very beginning of independence C.D.
Deshmukh gave the final shape of decentralized finance in 1949. That
recommended a new scheme of distribution of the revenue between the
center & the state. The constitution of India adopted in 1950 opted for
federal financial arrangement.
27
1.5.2. Fiscal federalism
India has clearly chosen a federal structure in which constitutional
distinction is made between the union and state functions and sources of
revenue, but the residual power belong to the center. The transfer of resource
from the central Govt. to the state is an essential feature of the present
financial system.
Under this system the union is assigned with the power to collect
mainly the following taxes.
1. Taxes on income except agri. income
2. Corporation duties
3. Custom duties
4. Excise duties with some exceptions
5. Estate and succession duties other then on agriland
6. Taxes on the capital value of assets
7. Rate of stamp duties on financial documents
8. Taxes on railway freight & fares
9. Terminal taxes on passengers carried by railways, sea or air
10. Taxes on the sail or purchase of Govt.’s in the course of inter state
trade
Certain taxes fall within the boundaries of the state like land revenue.
Taxes on the sales and purchase of goods accept newspaper. Taxes on
certain agri–income, Taxes on land and building succession and state duty
on agri-land state excise- Taxes on mineral rights.
Taxes on electricity stamp duties, except financial documents. Taxes
on vehicles taxes on luxuries, talls, Professional Tax, capitation tax etc. In
general the essential features of Indian federal finance exhibit A federation
with ‘strong centralizing tendency’. In India in federal finance we find

28
horizontal imbalance and vertical imbalance, horizontal imbalance refers to
inter states different in budgetary receipts and expenditure arising out of
differential per capita fiscal capacities. Vertical imbalances is between the
center and the state. It indicates high degree of concentration of economic
power on the one hand, and diminution in the degree of freedom enjoyed by
the state.
1.5.3. Comparison with other federal countries
Vithal BPR and Shastri M.L. has tried to provide a comparative
picture of inter governmental fiscal relations existing in different countries.
They have tried to compare India’s federal relation with those of Canada.
Australia and USA in respect of certain parameters.
It is observed that as long as divisions of functions is concerned there
is similarity found between the four country referred to in all these country
important functions like defense foreign affairs. Communications are with
center and certain functions relating to education, law and order, health is
with the state. In respect of tax power important and elastic taxes are with
center in all these country, but center has over riding power over the states is
found in India & Australia. However India is an exceptional country where
center can not levy all taxes. Inter governmental fiscal relations are found
formal in India & Australia informal in Canada & USA. Large degree of
vertical imbalances is found in all the four countries and high horizontal
imbalances is found in all four countries how ever one finds strong
centralizing tendency in respect of revenue rising in India. It is observed that
roughly 85% of direct taxes and 55% of indirect taxes on commodities are
collected by the center on the other hand expenditure responsibility of the
states is found more. It was about 50% in 1975 and in the early 1990 it was
29
60% while the share of the state was hardly 50% (in total income of center)
Amresh bagachi and M.G. Rao also subscribe to the view that in India the
financial dependence of the states on the center to meet their rising
expenditure was the highest among the federations compared.
1.5.4. Institutional Provisions
In India under federal financial structure there are certain constitution
provisions for healthier and concrete financial relation between the center
the states. There are two main institutions which influences the financial
functioning of center & the state under the provisions of Article 280 of the
constitutions the precedence is required to appoint a finance commission for
the specific purpose of devolution of non plan revenue resources finance
commission generally make recommendation to the president in respect of
the distribution of net proceeds of taxes to be shared between union and the
states to recommend the principles which should govern the payment by the
union of grants in aid to the revenue of the states and recommend for any
other matter related between the union and the state.
The appointment of the finance commission is of great importance. It
enables the financial relation between the center & the states to be altered in
accordance with changes in need and circumstances. Right from 1951 the
country has received awards from eleven financial commissions. Currently
twelfth financial commission is under operation. The report is just released.
Generally the recommendation of the finance commission can be grouped
under different heads, like (1) Division and distribution at income tax (2)
Center’s Loans to the states.

30
Planning commission is another institutional set up. Planning
commission is led by the prime minister of India. There are some important
differences between the finance commission and the planning commission.
Finance commission is a statutory body appointed by the president,
every five years. The planning commission of India a non statutory
permanent body. Members of the planning commission are like full time
govt.’s employee holding their position at the pleasure of the govt.
The finance commission helps to transfer non plan resources from the
center to the states. While planning commission has discretion to transfer
plan resources from the center to the states. The finance commission
recommendation are in from of award and the central govt. is bound to
accept them. On the other hand the planning commission’s transfer of fund
is only discretionary. Planning commission is only an instrument of the
center. The finance commission get their authority from the constitution.
They are not the instrument of the central govt.
General experience is that there has been long standing need for co-
ordination between plan transfer and non plan revenue transfer from the
central to the state.
Finance commissions award are given in respect of certain criteria and
weights to determine the relative share of states. There is general filling that
as long as development view point is concerned and fiscal balance is
concerned there is a need to have permanent kind of finance commission. It
is demanded largely to avoid devolution of funds by the center to the state
on ad-hoc basis. It is also experienced that in India transfers of funds are not
always designed purely on economic considerations. More often they are
made through political bargains. An important pre condition for a successful
inter governmental transfer system is that, besides being equitable and
31
generating proper incentives, it should be transparent, adaptable to the
changing need of the center and individual states and should be distributed
in objective manner.
1.5.5. Fiscal federation under liberalization:
The traditional federal financial structure in India provides
concentrated powers of revenue to the center and more expenditure
responsibility to the state. It is important to study the federal financial
relations under the period of new economic policy after implementation of
the forces like Liberalization, privatization and globalization. The economic
structure of the country is changed considerably. It is in this regard that the
quality of fiscal management under liberalization has gained more
significance.
The changing pattern of central transfers, and or average annual
resources mobilization are the important points to under stand the changes in
fiscal management. The changing composition of the central transfer during
the period of 1991 to 2001 broadly expresses the shift in the nature of
transfers. In 1991 states received 35% of the total transfer as tax share that
share after some fluctuation rose to 43% by the year 1996-97. However this
share was declined in 2000-2001 for less than 32%. The share of grants
behaved more or less in similar fashion to share of loan which was more
than in 1990-91, came down to the lowest share of about ¼ by 1993-94. In
1998-99 this share again stood at more than 38%. It means that, in India the
total resources transfer from center to states suggest that, the share of tax and
grants are on the decline in recent years.
Indian states are characterized by varying degrees of development. It
is found that the average per capita SDP of the richest state like GOA was
32
Rs. 14589 for the period 1990 to 1996. It is 4.33 times that the per capita
SDP of the poorest state of Bihar Rs. 3369. One of the major objectives of
planning and fiscal measures was to put the states at a minimum level of
socio – economic development.
The states in this regard put in to five categories, such as - very poor,
poor, middle, rich and very rich. It is found that the poor states can be said as
more favored in the devolution of central transfers inclusive of loans to
highest per capita of Rs 9300 received by the poor states. Very poor states
received little less than that Rs 8850. Coming to the high income and
middle income state, the per capita received was very close to the average of
very poor states. It was Rs. 8700 by rich states and Rs 8600 by the middle
income states. Similarly the highest per capita grants was received by the
low income states. Which was 30% higher than the per capita receipt of very
poor states on an average. It is also found that the high income states
received an average per capita grants more or less of the some size of the
very poor states. (Rs. 2658 by very poor states and Rs 2630 by the rich
states.) Thus the pattern does not seem progressive in respect of provisioning
of resources.
Fiscal management between the center & the states can also be looked
in terms of plan and capita expenditure. It is found that the share had shown
some improvement in the initial years of reform. In case of the center it has
sleeped down consirederably, down fall is more reported in the case of
capital expenditure it was declined over the years from 30.2% in 1990-91 to
14.7% percent in 2000-2001. In the case of states also the plan expenditure
in 2000-2001. Declined from 21.3% to 17.8%. This fall was much more
sharp in the case of the center.
33
The last important parameter in respect of the fiscal management is
the deficit angel. It is found in this regard that revenue deficit rose in
comparison to their previous years. The size of growth in revenue deficit
was also found high in the case of states. The average annual growth rate
during the period was around 35% but it was less than 20% in the case of the
center. Regarding fiscal deficit, it is found that the average annual growth
rate was 13% in case of center while it was 19% in case of states. Thus it is
clearly revealed that the fiscal conditions of the states have got much more
worsened in the last decade. Thus it can be also said that the fiscal
management of nether the center nor the state have made any qualitative
improvement in the liberalization period, While the finances especially that
at the states leaves much to be desired, though there is considerable
devolution of resources to the state, it is less progressive in allocation among
the state.
1.6 Prob. of imbalance between fiscal needs and capacity
It is generally observed that in many of the countries, where there is
existence of federal financial structure, there appears to be a wide gap
between the earning of the state through various sources and their
responsibility to full fill fiscal needs. This imbalance is generally found of
two types. One is known as vertical imbalance and the other is known as
horizontal imbalance. When states have the resources adequate in relation to
their requirement it is called vertical imbalance. Some times states may be
having homogeneity in respect of functions and resources but it is because of
difference in the economic conditions that there tend to be gap between
fiscal needs and fiscal capacity. It is known as horizontal imbalance. This

34
prob. of fiscal imbalance is found not only in India but it is also found in
Australia, Canada and America.
Causes of fiscal imbalance.
In a federal structure fiscal imbalance is found in the form of
increasing budgetary deficit and this trend of budgetary deficit is varied from
state to state. Such imbalance is largely attributed to two of the causes - first
is the maximum weighted given in practice to the theory of efficiency.
Theory of efficiency is not consistent with the principle of adequacy. State
are generally designed of devoid functions and resource on the ground of
efficiency. Center does have more productive and all elastic monetary
sources against its requirement, hence center experiences more the state of
balance over expenditure, while in reverse to that the states do have less
productive and less elastic monetary sources, which results into imbalance in
the form of deficits.
Second important reason for fiscal imbalance is the difference in
economic condition of the state. Generally all the states affiliated to union
govts do not have equal economic development or condition some states are
highly progressive and prosper us while some are very slow in development
and some remaining are more backward. It is this difference in economic
condition, which leads to the gap between fiscal needs and fiscal capacity.
A state like Gujarat is industrially and commercially more developed
state while neighboring state like Rajasthan is relatively poor. Therefore
resources are found in plenty in a state like Gujarat while Rajsthan
experiences the scares in source.
Similarly there happens to be sizable gap in the per capita expenditure
between the different states. For the same kind of function backward states
have to spend more for the fulfillment of the requirements. In other words
35
developed states have relatively more resources against the required
expenditure and the backward states do experience limited resources for
more requirements. It is the distinctive gap between fiscal needs and fiscal
capacity.
Index of imbalance:
It is very important to have basic idea of index of imbalance. There
can be genuine deficit owing to inadequate resources against the
requirements. Despite states efforts for revenue mobilization, they fail to
match with the requirements. The genuine deficit is because of the limitation
of resources. It is at this juncture that center may provide the resources
through transfer.
However central govt. deed is more dangerous, looking to the
tendency of manipulating the real picture. Sometime it is found that states
are making exaggerating in drawing the economic picture real state of
imbalance can be known through fiscal capacity of the state. Tax efforts
made by the state economy applied in non plan expenditure and the state of
social and economic backwardness of the state. Prof. D.T. Lakdawala and
R.N. Bhargave have made detailed exposition in respect of an inquiry in the
nature and causes of fiscal imbalance and remedies to over come imbalance.

36
References
A. C. Piguo, “A Study in Public Finance McMillan. 1947. Chapter V.
A. G. Buchler, “Government Finance in a State Economy”, The Annuals, 1964.
Amaresh Bagchi, “Evaluating India’s Fiscal Federalism : Some Reflections on Post Half Century in “Fiscal Fedrelism in India” Deep and Deep Publication, New Delhi.
B. P. Aderkar, “The Principles and Problems of Federal Finance” Chapter 5.,1, (Chapter V)
H. M. Groves, “Financing Government Henry Holt and Company, New York, Fifth edition, 1958.
J. A. Schumpeter, “History of Economic Analysis”, George Allen and Unwin, 1955, p.200.
James Buchanan, quoted in Alan S. Blinder, It al (ed.) “The Economics of Public Finance, The Brookings Institutions, 1964, p. 237.
Knut Wicksell, “A new Principle on Just Taxation”, in Musgrave and Peacock (ed.), “Classics in the Theory of Public Finance” , McMillan, 1962.
Lakadawal D.T. Union State Financial Relations.
Mukul G. Aher, “The traditional theory of Public Finance and Its Relevance to Development studies, Indian Economic Journal, Vol. 29 No.4 (April June 1982)
P. K. Bhargava, “Centre State Resource Transfer in India” Need for a Pragmatic Approach in R. K. Chaubey (ed.) Fiscal Federalism in India Deep and Deep Publication, New Delhi.
R. K. Chaubey (ed.) Fiscal Federalismin India, Deep and Deep Publication, New Delhi, 2003.
R.A. Musgrave, “Public Finance in a Democratic Society, Vol. II, Wheat Sheaf (UK) 1986.
Ragnar Nurkers, “Problems of Capital Formation in under developed countries – oxford university press, 1953, p.193.

37
Raja J. Chellian, Fiscal Policy in underdeveloped Countries, George Allen and unwin, 1976.
S. K. Singh, “Public Finance in Theory and Practice” S Chand & Company.
Wayland D. Gardner, “Governemtn Finance, Prentice Hall, 1978.
World Bank – World Development Report, 1988, Oxford University Press, June 1988.
38
Chapter -2
Technical Structure
2.1 The research Problem:
This research is Pertaining to the analysis of the fiscal situation in
Gujarat. It has assumed greater significance particularly in context of severe
financial crisis fact by the India - States during last ten years. Central Govt.
has also expressed concern over deteriorating condition of state finances. It
is observed in the last decade. The Worldbank has categorically asked the
central govt. to reduce the transfer to the states to consolidate central’s own
fiscal strength. In the report of the tenth finance commission it was stated
that the primary responsibility for strengthening the resource based is that of
the states. Thus in general there is around pressures on the states to find out
ways to earn larger revenue for meeting their expenditure needs. It indicates
the importance of nontax revenues besides the tax revenue.
It is true that fiscal position of most of the states has worsened.
Looking at the performance of certain standard indicators like revenue
deficit, fiscal deficit, debt – GDP ratio – the clear judgment can be made
regarding states’ fiscal health. But in a federal financial structure like our’s it
is equally important to inquire into the states receipts from center over the
period of time. Broadly it can be said that currently there does not exist one
to one correspondence between the states contribution to the center and in
reciprocity center flow to the states. Constitutionally, as noted earlier, the
responsibility of carrying out developmental activities largely rests on the
state govt. Besides at the center there is tendency to declare number of
populist schemes from the center. These schemes are more political
motivated. It is in this context that the states are required to spare financial
39
as well as real resources in terms of man power and infrastructure facilities.
It is also observed that because of fast industrialization in various states
there is faster rate of urbanization and high growth of population resulting
from high rate of migration amounting to increase in the demand for basic
amenities like water, severage & housing. The important area of loud
thinking is that from the various taxes collected by the center, only to
namely income tax and excise tax is shared by the center. Two important
taxes – i.e. corporate tax and custom duties, more elastic in nature are not
shared at all by the center. To add to the problems of the states, it is
observed that the proportionate sharing of excise revenue is to be shared
with the states and it is exclusively left at the discretion of the finance
commission. It is because of this fact that the center has never shared more
than 45% of the total excise revenue.
The states in India are not found balanced in economic nature. Some
of the states are found to have managed fiscal operations with little more
care and prudence. Gujarat state is one of those states having relatively
better fiscal performance till economic reforms. There are some other states
where fiscal position is not smooth.
With this background fiancé commission awards for the devolution of
the funds are not in tune with the functioning of the good performing. There
is found indifference and apathy towards the efficient states. In this situation
largely the efficient states are looser and the in efficient are gainers. Gujarat
is one of the looser states. As per the eleventh fiancé commission award
Gujarat was the third largest looser state from amongst ten such states.
When the central govt. does not show inclination to levy various taxes
under article 269, it is direct loss to the states. Changes in the criterion by the
finance commission have also worsened the situation. Various reports also
40
indicate that the state of economic growth in the 1990’s shows declining
trends leading to the resource requirement gap and virtually it is this gap that
lead to fiscal disparity or fiscal mess and fiscal stress. It is this clear
discrimination, which has made the good performing states more inefficient
in respect of fiscal deficits. Allocation design adopted by the planning
commission is also equally responsible for the current fiscal problem of
several states including Gujarat. Most of the economist, scholars and
researchers have virtually found that there prevails in general the approach
of penalizing the efficient states and rewarding the inefficient states through
subjective approach of devolution. Many a economist have been insisting for
certain specific prudent fiscal norms to determine the devolution of funds
from center to states. Looking at the economy it can also be found that the
states do not enjoy the power and the freedom for collecting revenues as
much as the center enjoys. It is in light of this background that it would be
worthwhile to examine the actual performance of the states toward meeting
the challenges of total fiscal balance. – Gujarat economy, particularly
Gujarat state finances require to be studied in this regard.
There has been in general the deteriorating state of fiscal in Gujarat. It
can be observed through various indicators like revenue deficit & fiscal
deficit. Though the growth of the real income of the state during the period
1990-91-1997 was found more significant, this can be compared with that of
the miraculous growth of south – east, Asian countries. How ever there has
been considerable fall in the growth of the state after 1997. The state, which
was at the top with 9% growth rate per annum, could muster only 4.4%
growth rate between 1997 to 2000. Fiscal deficit in relation to GDP and the
monetary volume of it expresses deep concern. The other factors like
increasing burden of non-interest payment have worsened the situation.
41
There is found clear shift in rise of expenditure for present consumption on
to expenditure for capital assets.
A matter of serious concern is found more in respect of tax network.
The state is not able to collect revenue from the non-tax sources.
Subsidizations both in quantum and nature have added fuel to the problem.
In aggregate one time progressive and dynamic state is lagging far
behind to other states as long as the financial strength is concerned. Is it the
state, experiencing scarce of resources for revenue generation ? Is there any
possibility of prudence in down sizing the expenditure? Can govt. do
implement progressive taxation mechanism? Is it because of the intervention
that the response for revenue is slow and less? What is the scope for
implementation of VAT specially in respect of revenue generation? Given
the political environment, would it be possible for any govt. to restore fiscal
discipline?
These are the several issues demanding an inquiry in context of the
existing financial structure. There fore an attempt is made to study these
issues with broad microscopic look at the fiscal state of Gujarat.
2.2 objectives
This research work is undertaken in context of the following broad
objectives.
(1) To have broader look at the fiscal condition of the state after the
reforms period – more specially after 1997.
(2) To under stand the on going fiscal trends in context of Indian public
finance.
(3) To point out silent feature – merits & demerits of the state finance
trends
42
(4) To examine fiscal imbalance that largely prevails in context of non-
tax revenue & subsidies.
(5) To work out the likely future trend in consideration of the existing
fiscal norms.
2.3 Research methodology:
This research work is exclusively based on secondary data. The
subject being related with the state finance, it would be worth while to focus
on the available govt. data & examine this data in accordance with the
objectives framed for the study. An attempt is made to inquire in detail,
state’s own revenue and expenditure during the last decade. This exercise is
necessarily linked with the Indian govt. finance, therefore efforts are made to
look in to the criterion determined by the tenth and eleventh finance
commission for the devolution of certain funds from the center to the state.
The last twelfth commission report is also overviewed. Thus a-part of the
research work also throws the light on state receipts from the central govt.
In this research study emphasis is laid on non tax revenue and
subsidies. This is exposed in detail that is i.e. sectoral subsidies and merit
non merit subsidies – To understand the problem, data is also referred with
that of the total states. To that extent a comparative view is presented. This
research study is based on analytical approach.
The data collected and compiled is arranged in to different tables and
accordingly tabulation analysis is furnished. This is also explained
graphically, average index and or maxi-mini-ratio which ever is applicable
to strengthen the analysis. In view of having a look at the fiscal trends of the
state an attempt is made to refer certain books and periodicals, which is
related with the research work. Past studies in context of public finance

43
revealing theoretical ground in relation to exiting scenario is also referred to.
Besides critical comment, analytical studies undertaken by different
economist and economic journalists is also taken into consideration for the
purpose of review of research.
Sources of data
This study is based on secondary data made available through the
different sources as under
(1) Govt.’s report on govt.’s finance
(2) Budget document of different years
(3) Annual reports and monthly bulletin published by RBI
(4) Socio – economic review published by directorate of economics &
statistics govt. of Gujarat – Gandhinagar
(5) Special volume on public finance published by center for monitoring
Indian economy - November 2004.
2.4 Hypothesis:
This research study is aimed at examining the following hypothesis as
null and void.
(1) Gujarat govt.’s Financial condition is found to have improved in the
second half of the reforms.
(2) The state accrues large chunk of revenue from the non tax sources.
(3) Volume of subsidy is found to have decreased and there prevels
sectoral balance in subsidization.
(4) State Govt. is benefited in terms of transfer from union govt. because
of the change criterion.

44
2.5 Chapter Plan:
This research work is basically divided in to six chapters. This
research largely incorporates the following area into the different chapter.
It begins an introduction to the public finance in general. It refers to
certain basic concepts, which are necessarily the part of this research work.
In follow through global economic scenario in terms of public finance is
highlighted and attempt is made to provide an over view of Indian federal
financial structure and the fiscal trends under Liberalization.
The second chapter deals with necessary technical details on which
this research work is based. It includes the research problem, objectives
methodology hypothesis and limitations etc.
The third chapter presents exclusively the review of past research in
brief. It broadly includes the researches made in theories and comments and
evaluations on the finances of the state over a period of time.
Forth chapter largely focuses on the fiscal reforms applied both at
national as well as state level. It also provides birds views on Indian and
state experience of fiscal reforms.
The fifth chapter is the fundamental or the core part of the research
work. It examines in detail general view of the state finance, behavioral
trends of income & expenditure, sectoral variation that of and implications
of reforms on the state fiscal position. This chapter is partially narrative but
more analytical. It highlights in general the reform period and in particular
ninth five year plan period.
In sixth and the last chapter first part is devoted to the comments of
the hypothesis followed by conclusion derived from the tabulation analysis.
Apart from these, suggestions for future planning is also mentioned, the

45
research work technically ends with the indication of the scope of further
research.
2.6 Limitations of the study
Efforts are made to provide systematic presentation of the areas
involved in the research work. Detailed literature is also referred to in
consideration of the proposed research work; however the study can not be
regarded as the perfect one. Broad limitations can be highlight as under.
(1) This research work is not a comparative one. It is not a comparative
study either with union govt. or with other states.
(2) This research study also does not compare the trends of the past, i.e.
this is not exactly a comparative study of present reforms period with
the previous period.
(3) Though all efforts are made to collect and compile the data, however
the state finance is in it self very vast area covering relative
transactions with other countries – states – union govt.’s And also
local govt.’s Here the analysis is restricted to the broad and basic data
only.
(4) This research study is simple analytical study.

46
Chapter – 3
Review of Literature
There is vast Literature available in context of public finance & its
relative components. Economist has explored this subject in detail both from the
theoretical perspectives and imperial observation of the countries across.
Attempts are made to make an objective assessment of the system prevailing in
different countries in respect of public finance. Following is the giest of the
several studies referred to in context of the proposed research work. This have
been classified into two sections as under.
3.1 The theoretical perspectives
(1) Robert Dorfman, “The Price System”, Prentice Hall, New Delhi 1965:
has tried to analysis various economic systems to solve economic
problems. He has emphasized more on market oriented economy. He has
opined that like public economic intervention, market oriented system
focuses on resource allocation on the basis of consumers choice, hence it
is preferable to public economics intervention.
(2) Boumol W.J. “Welfare economics & the theory of state.” Harvad
University press, 1965.
Boumol has analyzed in detail the social and private costs and
benefit in respect of the spill over advantages. He explains that there
exists external diseconomies where spill over benefit is available and
there is external is economic where spill over cost is there.
(3) R.A. Musgrave, “The theory of public finances.” International student
addition
He has examined in detailed several issues emerged in public
finance and he explains that govt.’s expenditure largely grows more in
relative terms rather than absolute terms.
47
(4) Masgrave D. Rostow, Political and stages at growth
Musgrave and rostow argues that in the initial stage of economic
development, public sector investment tends to be very high largely due
to infrastructure and social over head. They both express the opinion that
with the space of development public sector investment gradually
declines.
(5) Allen Pecock & Jack Wisemen The growth of public expenditure in Great
Brittan
Pecock & Wisemen have analyzed in detail the rising trends of
public expenditure in great Britain. They have proved with the evidences
of public expenditure statistics that rise in public expenditure is the type
of step like development unlike the continuous development process.
Their study reveal the fact that public expenditure in great Britain had
attend new height along with certain crisis period they found that it is
because of the inspiration effect and or concentration effect.
(6) Geraid Scully, The size of the state, economic growth and efficient
utilization of national resource, public choice page No.63-1989.
Scully has studied about hundred countries data in relation to the
level of govt. spending and economic growth. He has derived the
conclusion that there is a functional relationship between economic
growth and the level of govt. spending. He is of the opinion that because
of the provision of public goods by Govt. the over all efficiency of
private sector also increases. It is because of the positive externalities
emerging through public provisioning, which leads to unpaid benefits.
(7) D.J. Lakdawala ,Union state financial relations 1976 page-45
Prof. Lakdawala has exposed in detail the horizontal and vertical
imbalances between fiscal needs and fiscal capacities. He has
categorically observed that like Australia, Canada & America, Indian
federal finance is experiencing the problem at fiscal imbalances.
48
(8) George break & Lieon keyserling, “Revenue sharing its implications for
present & future inter govt. fiscal system. The case fot and against”
published in “National Tax Journal vol. 24 No.3 page No.307 321
They have tried to present argument for and against the tax
partnership system according to Break un conditional grant is the second
best solution, top most is to share the taxes between the center and the
states – He has advocated for this largely in context of USA. However it
is equally applicable to all union Govt. While keyserling expressed the
view that sharing in the tax system is constraint to achieve the objective
of full employment.
(9) R.N. Bhargave, “Theory and working of union finance in India.” 1967.
Prof. Bhargave has largely discussed in theory of federal finance.
The same concepts which have been presented by Prof. A.C. Pigon in his
“A study in public finance.” According to Bhargave the federal govt.
should not content it self merely by following the principles of public
finance in the limited fear of functions and resources assigned to it. It
should act in a co-coordinating capacity to effect such transfer so that the
principles of public finance is not violated for the nation as a whole.
(10) World development report 1988, “On the very first page of the report it is
categorically marked that public finance is no longer and extremely
limited irrelevant discipline. Its activity now extend to almost all aspects
of the life of and individual as also of the whole society.
(11) Deviti Marco – first principles of public finance Jonathan cap- 1950,
page-52.
Macro has discussed the feudal system of public finance with
medieval period. He acclaims that the system in Germany is patrimonial
in Germany financial advisor of prince also took a paternalistic view of
state, according to them state is conceived as “A magnified family with a
49
big farm as it property” and there was hardly any different between the
welfare at the people and the welfare at the prince.
(12) H.M. Groves, “Financing govt.” Henery holt and company Network 1958
– page 514.
Groves has described in detail the changes in emphasis in the study
at public finance. According to him, financing govt. involves three basic
functions, Taxing, spending and debt management. Fiscal theory and
fiscal policy which derives from theory deals with all the problems
relating to those functions.
(13) W.W. Heller, “Fiscal policies for under develop countries.” In bird and
oldman (ed) “Reading on taxation in developing countries. Third
addition, 1975, page 586.
Heller observe that the pursuit of the aspiration of the people of
poor countries involves acceptance of the objectives of tax and
budgetary policy. They are mainly to make available for economic
development the maximum flow of human and material resources to
maintain reasonable economic activities in fact of long run inflationary
present and to reduce the extreme in equalities in wealth-income and
consumption standard.
(14) Aurther Smithies: federal budgeting & fiscal policy In a survey of
contemporary eco volume – 1 – 1949 page 144.
Smithies have tried to explain the roots of fiscal policy. According
to him it is the policy under which the govt. uses its expenditure &
revenue programmes to produce desirable effects and avoid undesirable
effects on the national income, production & employment.
(15) K.K. Kuriharu: The keynecian theory of Economic Development p-153.
Kurihara observed that fiscal policy is a branch of economics
which has undergone revolutionary changes with historical shift of
50
emphasis from revenue to welfare and more recently from cyclical
stabilization to secular growth.
(16) David Fand: Some issues in monetary economics fiscal policy
assumption & related multiplier in John T Boorman and Thomas M.
Haverilesky, Money supply, money demand & macro economics models
– Allyn & Bacon INC – Bostan 1974 p 474.
Fiscal deficits are often associated with it not directly responsible
for substantial increase in monetary aggregate. The experience is that
fiscal deficit finance by the banking system will tend to accelerate the
growth in money stock, while a fiscal surplus weather impounded or used
to retire debt. Will tend to decelerate the money stock, growth.
(17) Semualson- “Summery of the friedman type monetarism in readings on
economics. TATA Mc gro Hill New Delhi – 1973 p.120-121.
Semualson has tried to briefly explain the monetarism of Friedman.
According to Friedman fiscal policy as such has no independent
systematic effect upon aggregate dollar demand – increasing tax rate, but
with the understanding that money growth remains unchanged, will have
no effect in lessoning the degree of inflation. He is of the view that the
rate of growth of money supply is vastely more important than any
changes in taxes or govt. expenditure.
(18) W.Arther Levis: The theory of economic growth P.N. 236
Arther lewis observe that the central problem in the theory of
economic development is regarding raising the consumption level which
could be misused for tax evasion. The rise of the capitalist class might
take a century. Since no developing countries can afford to wait along the
alternative path of public saving, like taxation has to be chosen and it is
of greater significance in the early stage of development.
(19) K.K. George & I.S. Gulati ,Central state resource transfers 1951-84 EPW
February 16, 1984 p.290.
51
Regarding fiscal transfers George & Gulati have remarked that
only 2/5 of the central transfer are effected within the framework of the
constitutional provision governing the role of the finance commission can
be said to reflect on how the constitution at scheme has been side stepped
in actual practice.
(20) Amres bagachi: TAPAS SEN and V.B. Tulsidas, “Issues before ninth
finance commission EPW may 7, 1988 p.956.
These critics have strongly commented regarding the terms of
reference for the ninth commission. They have explained that removal of
the distinction between plan and non plan together. With the direction to
ensure generation of surpluses for investment indicates that the finance
commission would have to assess the dimension of the revenue
component of the next plan. It is feared that there could be an overlap of
the function of the planning commission and the finance commission and
under mining of the Gadgil formula.
3.2 Some Imperial observations
(1) Pramatnanath Banerjea: “The future of Indian finance” published in
P.Jagdish Gandhi (Ed) Economic development and policies in India –
Haranand publicationbs 1994 P.N. 152 to 155.
In the presidential address delivered at the annual conference of
the IEA (Indian Economic ass.) held at Lahore in 1931 – Mr. Banerjea
had expressed deep concern regarding the British govt. approach toward
Indian public finance. He reported that about fifty lacks pound (50 Lacks)
was subtracted from the wealth of India and added to the wealth of
England, which was the most serious injury, which India suffered from its
connection with England. The than British govt. had paid too much
attention to the defense and internal order with very little care for the
health happiness and progress of the people depend. In those days the

52
central British govt. did not reallocate much to make it possible for the
provinces to achieve substantial progress in the development of primary
secondary or social sector.
(2) M.V. Mathur: “Institutional framework of planning and union – state
financial relations.” Published in R.K. Sinha (E.D.) “planning and
development in India.” Haranand pub. 1994 page No. 116 to 128.
In the presidential address delivered at the annual conference of the I.E.A.
held at Madras – December 1967.
According to Mr. Mathur along with the union level planning
commission the state level planning commissions are required to set up
with significant role. He has expressed a matter of concerned over the
tendency of Indian states to be little active for the revenue generation. He
firmly believes that the negative attitude on the part of the govt. has put
economic and political health of the nation.
(3) Kamta Prasad: “Planning in India some basic issues relating to
operational & strategic aspect.” Published in Rajkumar Sen (ed) from
diamand to platinum – I.E.A. presidencial addresses. I.E.A. trust for
research and development page No. 270 to 301.
In his detailed analytical presidential address, Kamta Prasad
expressed the view that the gadgil formula for the inter state allocation of
plan funds which had been in force from 1969 had not given adequate
weightage to consideration related to backwardness. The working pattern
of financial institutions is not found consistent with the objective of more
equitable regional development.
The central funds should be distributed primarily with respect to
the developmental needs of state which in tern should be determined on
the basis of the gap between their existing and projected per capita
incomes. There is also a need for the states to be provided some incentive
for greater mobilization of resources under their jurisdiction.

53
(1) B.P.R. Vithal: Federal financial relations the plan/non plan conundrum.
Published in EPW February 13, 1999 page 431 to 436.
Mr. Vithal has tried to expose in detail the division of total revenue
expenditure in to plan & non plan and the division of functions and
responsibilities between the planning commission and finance
commission; he has suggested various changes, according to which there
should be changes in the role of planning commission in the past, the plan
process had either built in a certain amount of deficit in its calculations or
had, at least condoned it after the event in order to enter in to the period
of fiscal discipline the primary and undisputed objective has to be that
there can be no deficit on the revenue account what ever the fiscal deficit
may be.
(2) N.J. Kurian: “State govt. finances a survey of recent trends.” EPW may 8,
1999, page No.1115 to 1125.
Mr. Kurian has attempted to bring out the deteriorating trend in
state finances in recent years, in particular during the 1996-1999 he has
observed that failure to control wasteful expenditure and reluctant to raise
additional resources on the part of the states are main causes. Secondly
tax wars among state govt. to attract private investment in the wars of
economic reforms as well as competitive populism on the part of ruling
parties for power is also responsible. The last blow has been the pay
revision of employee forced upon the state govt. by the centers unilateral
decision to implement pay commission report. As a result the essential
investment need in social and infrastructure sectors. Large borrowing are
resorted to by several states just to meet the current expenditure. Almost
all the indicators of fiscal health of the state economics are steadily
deteriorating. In the concluding part he has warned that unless drastic
measures to correct the situation are not implemented in time, finances of
several states may collapse.
54
(3) NIPEP – 1981 Treurs & issues in Indian federal finance – Allied
Publication Delhi
The impact of union resource transfers on tax effort was
specifically examined for the first time by a study team from NIPEP
under the leadership of R.J. Chelliah. This study taken in to account 15
major states for the period from 1965-66 to 1974-75. The study
concluded that federal transfer as a whole, seem to be having a
dampening effect on the tax efforts of the states, though the effect may
not be specifically attributed to the policies proposed by the finance
commission.
(4) Ranjana 1984, “Allocative effects of inter governmental flows in India –
A new perspective 1952 to 1977.” Margin April 1984.
Ranjana & Thimmaiah made separate attempt to analyze the
allocative effect of inter government flows. They did not take into
consideration the inter temporal effect and the individual characteristic of
different states. They largely concluded that in aggregate large variations
are found in respect of the effect of inter govt. mental flows and
allocations have influenced the tax efforts of the states.
(5) Rao Hemlatta – 1981 center state financial relations – Allied Pub – New
Delhi
She has used different analytical techniques to analyze the effect of
transfer of finance commission and planning commission – She
concluded that both of them measurably failed to achieve their objectives
of augmenting state resources in and equitable manner.
(6) M- Nagnathan & K.Shivgnanam, “Federal transfers and tax efforts of the
states in India.”
The Indian economic journal April – June 1999-2000 page 101 to
111. These two have made an attempt to highlight the impacts of union
resource transfers at the tax efforts of the state. The relationship between
55
union transfer & the tax efforts of the states are interlinked as the transfer
policy may encourage or discourage the tax efforts of the states in order
to overcome the controversy and to get a comparative picture. The study
used both time series & cross section data. The study in general
concluded that the finance commission transfer have discouraged the
revenue efforts of the states. However the existence of negative
implications in it self may not be a cause for concern. If there exist and
efficient and equitable mechanism of inter government transfers strongly
linked to revenue effort as criterion to encourage the revenue
mobilization efforts of the states.
(7) Emmanuel Anoruo & Sanjay Ram Chander, “Current account and fiscal
deficits evedence from India.”
Indian economic journal – Jaun – March – 1997 – 98 – page No. 66
to 75. This paper examined the relationship between the current account
and fiscal deficits regarding India. This issue known as the twin deficits
problem has important policy implications. The study empirically
investigated the twin deficit hypothesis that persistent fiscal deficit has
been the prime cause increasing Indian trade deficits – The finding of the
study however revealed that trade deficit is to cause budget deficit but not
vi – ce – versa.
(8) K.Shambhat, “Political economy of public expenditure and tax revenue in
India.” The Indian economic journal – July – September – 1996 – 97
Page No. 108 to 114.
This paper is a systematic effort to examine the main factors
governing the Govt. expenditure and tax revenue of India during 1960-61
to 1990-91 and to test weather the changes in the political rule will have
influence on public expenditure but not on tax revenue. The analysis
reveled that the size of public expenditure of the central Govt. of India is
positively influenced by degree of openness and unemployment rate of
56
the lagged one year and negatively determined by the density of
population. It is also found that politicians tendency for populist measures
lead to increased the size of public expenditure but it does not result into
more tax revenue.
(9) Govind Rao M – 1981, “Political economy of tax and expenditure
determinants” A case study of for India states.” Allied publishers private
limited New Delhi.
This research work was undertaken specially in Indian context. The
study exposed that the ideological learning of the party in power do not
affect significantly the level of expenditure in the state but intend to
creates imaginary out put differentiation on this stability consideration.
Less stable govt. tended to increase significantly higher levels of govt.
expenditures particularly on social & economic services.
(10) Mihir Rakshit, “Restoring fiscal balance through legistative fiat the
Indian experiment.” EPW June 9 to 15 – 2001 page 2053 to 2061-
Mihir Rakshit has made an attempt to examine the major provision
and the objectives of the fiscal responsibility and budget management
bill. He has observed that the bill attested to the seriousness with which
the govt. seeks to take the problems of revenue & fiscal deficits and the
high ratio of public debt to gross domestic product. The programs
arranged in context of the bills are well designed. These programs make
works as effective tools – how ever some serious doubt regarding the bill
can be raised – some of the provisions of the bill are inappropriate in
respect of the primary, objectives. The analysis suggest that public saving
promotes inter generational equity primarily, seems along with growth in
the countries per capita income and elimination of poverty and illiteracy
improvements in health and quality of life. The bill poses obstacles to
attainment of these objectives. It is also likely that the targets for
reduction in fiscal deficit and programmes for using revenue surpluses for

57
the purpose of public debt. May prevent govt. investment over the next
decade. The bill in general has omission of time bound target. It also does
not seriously address to the problem of financing public expenditure.
(11) Ajit Karnik, “Fiscal responsibility & budget management bill – offering
credible commitment.”
Karnik has discussed in detailed the fiscal responsibility bill. He
has tried to offer a credible commitment for the seriousness of the govt.
about fiscal consolidation. However he has expressed disappointment and
deep concerned over the attitude of the political parties with major
improvement suggested in the bill. He is of the opinion that with the
elimination of all targets related to gross fiscal deficit and revenue deficit.
The govt. would not violet any provision of the bill. He opines that now
the bill is nothing but a cheap promise. It is as a meaning full document is
as good as dead.
(12) Coondoo–Majumadar–Mukharjee & Niyogi – “Relative tak performances
analysis for selected states in India.” EPW October 6 to 12, 2001 page
3869 to 3871.
This paper examines the relative tax performance of some selected
states based on annual data on state tax revenue for the period 1986 – 87
to 1996- 97. The technique of cortile regression is used in the paper. This
paper is a part of the results of a project on measurement of taxable
capacity of the states in India – commissioned by eleventh finance
commission. They have observed that the tax performance in a federal
structure of governance like that of India is an extremely interesting and
important issue in respect of the fiscal management of Indian economy.
The results clearly show that the states in south and west India display a
superior tax performance compared to the remaining states of the country.
The differential performance if categories into the factors, these can be
identified as economic demographic and socio – political determinants.
58
(13) EPW Research foundation – “Finances of govt. of India” EPW April 13
to 19 – 2002.
EPW foundation published special statistics series to highlight the
quantitative dimension of the changes which have accrued in different
components of the Govt.’s of India budgetary operations aggregate
picture of the center & states together show and improvement in the
recent years in respect of the combined tax revenue as % of GDP it was
found 16% in the early 1990 it went as law as 13.4% in 1999 but again as
per the budget estimates of 2001-02 it touched 15.5%. However debt to
GDP ratio is found to have increased at the center as well as the states in
2001-02 as against what it was in 1997-98.
(14) Shikha Zha: “Strengnting local govts rural fiscal decentralization in
India.” EPW June 29 to July 5, 2001 page No 2611 to 2622.
This paper is revised version of a background paper on “over view
of rural decentralization in India 2000.” It reevaluates the fiscal success
of recent efforts toward reforming and training rural Govt.’s in India.
His comment is that fiscal decentralization is only the first step towards
achieving better living standards. In fact the Panchayati Raj institutions
need substantial nourishment in the form of better institutional capacity
larger resources and most importantly, higher authority to spend them on
improving local services.
(15) M.Govind rao, “State finances in India issues and changes” ,EPW August
3 to 9 2002 page 3261 to 3271.
Govind Rao has exposed in detail the areas of reform the state
should focus on to impart efficiency and improve revenue of un
productive expenditure. He has tried to highlight the deteriorating fiscal
condition both at the center & state level in view of this fact. He however
indicates some creative efforts put in by the states like Andhrapradesh,
Karnataka, Kerla, Maharashtra, Tamilnadu & Uttarpradesh. He has
59
referred to the emerging challenges before the state Govt.’s in respect of
providing quality social & physical infrastructure. It is in this regard that
he has suggested for improvement in efficiency of electric city bords,
reforms in tax system – building up appropriate information system and
so on the fiscal reform journey toward achieving fiscal balance and
consolidation and generation of quality infrastructure would meet with
strong opposition from wasted political interest.
(16) T.Ravikumar Murlidhar Vemury, ‘Centre states transfer of resources the
population factor.” EPW August 17 to 23, 2002 page No. 3406 – 3409.
An attempt is made to evaluate the effect of statutory use of the
1971 population as a policy variable for the last four financial
commission award. This strategy of freezing the population factor to
1971 levals for resource allocation has been successful in denying states
with higher rate of growth of population. The benefit of a larger
proportion of resources, however include most of least developed regions
of India. This policy also decreases the importance of the population as
an indicator of the need of a state. It is lacking in respect of encouraging
state to curb high rates of growth of population.
(17) B.P.R. Vithnal & J.V.M. Sharma,
Twelfth finance commission framing its terms of reference for the
twelfth final coming. It is expressed that to make the recommendations
more effective, there should be removal of artificial restriction on the
financial commission scope of operation. To concentrate on macro
economic stability. To streamline management of Govt. Debt, to provide
appropriate incentives to induce fiscal responsibilities to take integrated
view of tax assignment and to provide operational guidelines for the state
level finance commissions.
(21) S. Gurumurthy, “Twelfth finance commission and states” debt. burden.
E.P.W. Oct. 5 toll, 2002 page no. 4142.
60
Gurumurthy has tried to study the schemes and allocations for the
states formulated by the 10th
& 11th finance commission – having
reviewed in detail the experiences; he has suggested that the twelfth
finance commission should recommend the planning commission not to
approve any state plan, which is in excess of its estimated resources.
Secondly it is suggested that the commission should make in depth
exercise to evolve some parameters to indicate the fiscal health of the
state. The Author has also warned for a greem situation like Brazil, if a
fresh innovation and dynamic approach is not adopted to final lasting
solution to the serious debt burden of the state.
(22) Madhav Godbole, Law on fiscal responsibility and budget management –
exercise into talkenism. E.P.W. March 15 to 21, 2003 p. 1018. Giving a
commentary on fiscal responsibility bill Mr. Godbole expresses deep
concern over the central govt.’s lukewarm attitude towards the said bill.
He fears that in democratic policy of India there is a bad tradition of the
state to follow the center if it is remains the same, there is very little
possibility for improvement of the fiscal health of the states. He therefore
subscribed to the view that the central govt. must play positive and
leading role to set an illustrious examples for fiscal discipline.
(23) E.P.W. research foundation, Finances of Govt. of India May 10 to 16,
2003 – page no. 1887.
In the introductory remarks to the special statistics published by the
foundation, it appears that there is major credibility gap in the whole
process of governance. There have been dimensional changes in revenue
and expenditure of the center as well as the states during the post reform
period. It is expressed that there is much hype and pretence of budgetary
dynamism. Every year however the broad budgetary heads have remained
static in relation to the size of the national economy during the past ten to
twelve years. The plan of non plan expenditure is also found relatively

61
high. Fiscal deficits in aggregate has remained static the radical changes
that one expected in the roll of the fiscal in the national economy as a
result of reforms are no were to be seemed.
(24) D. Badopadhyay, “Twelfth finance Commission and Panchyat finances”
E.P.W. June 7 to 13 2003, p. 2243.
Banopadhyay has raised some issues for the consolidation of the
twelfth finance commission regard to its task of making recommendation
to augment the consolidated fund of the states in order to supplement the
resources of Panchayat and municipalities. He has suggested developing
the devolution index which should be periodically updated. Such
devolution index could work as effective instrument to allocate the
resources with balance approach.
(25) R. Kannan , S.M. Pillai, R. Kausaliya and Jay Chander. Finance
Commission award and fiscal stability in states., E.P.W. January 31 to
February 6- 2004 p. 479
The authors have tried to examine the efficacy of finance
commission award in bringing about fiscal stability among the states. An
empirical analysis reveals that though transfers helped to reduce the over
all gross fiscal deficits of the states. The issue of reducing horizontal
fiscal in equity is yet to be addressed. They find wild inter state disparity
in respect of transfer and suggest streamlining disbursement criteria on
basis of individual state characteristics rather than a general approach
across states.
(26) Rajan Gopal, “Does higher fiscal deficit rend to rise in interest rates? an
impirical investigation”, E.P.W. May 21 to 28, 2004 p. 2128.
The relationship between fiscal deficit and the rate of interest is
still and unsettered issue. In a small research paper Goyal re examines
62
this issue. He argues that the absence of an apparent fiscal impact on
interest rate is essentially the result of higher liquidity in the system. His
findings are there is a two way relationship between long term real
interest deficits tends to put upward pressure on interest rates. It is also
observed that when govt. borrowing is at market related rate, rise in
market interest leads to higher interest payment and higher fiscal deficit.
(27) Acharya Sanker, “India’s macro economic management in the ninetees-
Indian council for research on international economic relations – New
Delhi.
Shrinasan, Acharya & Ahluwalia have presented the data to show
that India’s fiscal and debt indicators are comparable to or worse that in
Argentina – Brazil and Turkey-Countries, which have actually
experienced a serious recent macro economic crisis. Acharya argues that
to consolidate the fiscal position and to eliminate the threat to sustain
growth, there is a need to improve spending composition which would be
conducive to faster growth and poverty reduction and reducing deficits
gradually.
(28) Brian Pinto & Farak Zahir, “Why fiscal adjustment now”, E.P.W. March
6- 2004, 1039 to 1046.
In a special article in context of fiscal adjustment, the authors argue
that it is unlikely to grow out of its debt problem in spite of today’s low
interest rate, to contorary a fiscal adjustment is needed to insist faster
growth. The challenge is to translate Govt. efforts into a road map of
fiscal adjustment. It may create a better investment climate to help to
promote long run growth and poverty reduction at the accelerated pace as
suggested in the tenth plan.
(29) C. Rangrajam D. K. Shrivastav, “Fiscal transfer in Canada Drawing
comparison and lessons”, E.P.W. May 8 to 14, 2004, page 1897 to 1909.

63
In a special article the Authors examine the relevance and
applicability of the Canadian system of inter governmental transfers in
the Indian case. Their contention is that the source by source approach of
Canada is less practical in India because of the problem of Comparable
and reliable information required to apply the method. Indian macro is of
course a more practical alternative but let there be the application of the
indicators of fiscal capacity as against assuring availability of resources
for maintaining the per capita expenditure of select basic services at
certain level among states
(30) A. Premchand, “Ethical dimensions of Public expenditure management”
EPW, Feb. 21-27, 2004. page 813 to 822.
In a special article regarding Public expenditure management the
Author has tried to highlight the limitations of the international financial
institutions in respect of controlling public expenditure. The Author
argues that it is essential to restore the credibility of Governmental
system by formulating programme aimed at achieving improved public
expenditure management. He refers to the inclusion of improved internal
control system, restoration of balance between the executive code for
Govt. establishment of effective channel for public participation. He
however warms that the agenda is far wider than what is funded by the
IFI. The fiscal responsibility for seeking improvement depends on the
people of a country. External stimulus has many limitations of its own.
(31) Bok Derek, The trouble with govt., “Harward University Press,
Cambridge 2001, page no. 384 – 390.
With reference to the observance of fiscal norms by the govt. Bok
has raised a critical question “how much effort citizens are prepared to

64
make to help their Govt. function effectively. He opines that largely there
prevails a large gap between peoples expectation from the govt. &
peoples performance for the govt. He therefore concludes that let the
communities role be accepted as key tool to achieve fiscal efficiency. It is
only through bringing them directly into the channel at development that
their own expectation priorities and action would change.
(32) C. Rangrajan, “Issues before the twelth finance commission” paper
presented at the seminar organized by NIPFP at Delhi published in EPW
June 26, July 2- 2004 P.No. 2707-2717
Rangrajan has exposed in detail the prevailing fiscal trends and the
factors responsible for that. He has focused on sustainability issues,
different dimension of fiscal transfer and restructuring the fiscal
mechanism. He expresses the hope that a good transfer system must be
established and appropriate balance between equity and efficiency a
system in which, fiscal disadvantage is taken care of but fiscal imprudent
is effectively discouraged.
(33) RBI annual report – 2002-03 on Govt. Finances – P. 52.
In general most of the reports published since mid 1990’s throw
light on deteriorating fiscal state of central and state, the similar
conclusion is expressed in the other publication like report on currency
and finance. The economic survey, World Bank etc. In this last report it is
categorically mentioned that “the steady improvement in the primary
deficit coupled with the fall in capital outlay during the 1990’s indicates
that the burden of unrelenting expansion in interest outgoes devolves on
unproductive spending. Continuous rise in public debt has introduced the
Govt. Sector’s utility to generate savings and to service its internal debt.
The quality of fiscal deficit has worsened with the revenue deficit having
increased substantially.

65
(34) International Momentary Fund (IMF) 2002 “Selected issues and
Statistical appendix for India” Country report 2/193/.
Whenever a cross over of any revenue over GDP growth occurs,
there is a tendency to panic and describe the situation as a debt trap or
equivalent. It is pointed out in the report as a factor inducing debt un-
sustainability.
(35) Raju Raman – Indira & H Mukhopadhyay – 2000. “Sustainability of
Public domestic debt in India” in fiscal federation in India contemporary
changes, D. K. Shrivastav (FD) Haranand Publications.
In a widely sighted study on debt. Stability Raju Raman &
Mukhopadhyay has stated the interest rate is found to have increased
since mid 1980 it crossed over nominal growth for the first time in 1997-
98. The years 1996-98 thus march a cross over to a regime where the
primary deficit is found no longer pos-pond able in the interest of public
solvency.
(36) “Survey of state finances”, It is stated in the report that the eleventh
finance commission has recommended the establishment of an incentive
fund for purpose of encouraging fiscal reforms in the states on the basis
of a mentionable fiscal programme. As per the recommendation incentive
fund of about Rs. 1000/- crore was created to reward the states that
achieve a 5% point reduction in their revenue deficit to revenue receipt
ratio until 2004-05.
(37) Vivek Murthy, “India’s primary deficit and interest payments burden an
assessment” EPW June 26 July 2 – 2004, p. 2711.
The researcher has made an attempt to present the comment over
the “Consensus” view that a worse revenue deficit and debt situation have
66
prevented fiscal consolidation. He has tried to explain the distinction
between worsened deficit and debt condition with using time period
approach. It shows that a rising debt ration, which might appear to be due
to un favorable interest rate dynamics fund to related to a previous rise in
the primary deficit.
(38) Abha Prasad – Rajan Goal, Anupam Prakash – “States debt and relief”
A paper presented at the seminar on “issues before the twelvth finance
commission organized at Delhi by NIPFP – represented organized at
Delhi by NIPFP represented in EPW June 26 – July 2, 2004, p. 2726.
In this paper an attempt is made to highlight the deterioration in the fiscal
performance of the states since the mid 1980’s. It is expressed in the
paper that all indicators’ fiscal deficit, revenue deficit and debt GDP ratio
reflects deteriorating situation. In view of providing some suggestions it
is preferred from the study that lowering the primary deficit, besides a
reduction in interest rate should be an integrated part of any policy to
make sustainable at the state level.
(39) Amresh Bagchi – Pinaki Chakraborty “Towards a rational system of
center state revenue transfers” A paper presented at the national seminar
on issues before the twelve finance commission – organized by NIPFP
reprinted in EPW June 26 – July 2, 2004.
An in-depth exercise is made with substantial evidences to
investigate into the center states revenue transforms. They have observed
that there are deficiency mainly in respect of multiplicity of transfer
channel, faulty design of F.C. transfers and institutional weakness of the
system. They put more emphases on reforming the scheme of center state
revenue transfer to achieve the goal of efficiency and equity. They also
67
suggested for integration of transfers provisioning for special grants to
equalize the level of basic services.
(40) Tapas K. Sen Christo Trebesch, “Use of socio economic criteria for
inter governmental transfers” Paper presented at the national seminar on
issues before the twelfth finance commission.
The Authors have tried to examine the transfer system that operates
in India through the institution of finance commission. The paper focuses
on an evaluation of the need, appropriateness and manner of use of
various socio-economic creations, in the design transforms mandated by
finance commissions over the years. The paper considers these issues in
context of international experiences.
Their general conclusion is that the F.C. have super imposed
performance indicators on the other type of indicator. They stand by the
opinion that any significant transfers based on the origin of tax revenue is
not logically maintainable.
(41) Bird and Tarasov 2002, Alm & Martinez 2002, “Closing the gap fiscal
imbalances and inter governmental transfers in developed federation –
working paper II. International studies programme, Georgia State
University, on the use of budgetary norms as a tool for fiscal
management. Working paper 15 et. al.
In context of working out different Criteria of expenditure needs,
these scholars have tried to examine the area indicator. They are of the
view that the cost of delivering public services tend to be higher in very
densely populated areas. In fact in Germany, city state receives higher
allocation due to the disadvantages of urbanization. Similar arrangement
can be found in koria and again Japan
68
(42) Rao Goving M. 2002, “State level fiscal reforms in India”. Working
paper.
In respect of non-plan expenditure he observes the reduction in non
plan expenditure as % of GDP, but not in nominal terms. He is in
agreement with the observation that increased provision to social sectors
and physical infrastructure can be made only when the size in revenue
GDP ratio is reveres.
(43) Anupam Rastogi – restructuring public finance. ,Paper presented at the
national seminar on issues before the twelfth finance commission
organized by NIPFP. Reprinted in EPW June 26 to July 2, 2004, p. 2756.
The scholar has tried to inquire in to the possibilities of restructuring
public finance with the help of the analysis of past data, he shows no
improvement on any of major fiscal indicators. Performance based
sectors pacific transfer could set and example for state finance
commission. He expresses the hope that in the coming years as states are
expected to raise part of the resources from the capital market. The roles
of state plans and central planning commission need to be reexamined.
(44) Archana Dhodakiya, “Problems and prospects of fiscal balance in
Gujarat” occasional paper No. 3 published by Dr. Lakdawala memorial
trust GIDR Ahmedabad June 2000.
In a paper presented at the Lakdawala memorial seminar the
scholar tried to examine and analyze the fiscal situation in Gujarat. After
reviewing in detail it is concluded that the center should take the steps
like developing a normative approach to determine the states resources
requirement and resources capacity. Making them more accountable for
their expenditure decision – appropriate weighted could be give to
revenue collection efforts with allowing greater degree of freedom for
direct and indirect tax collection.
69
(45) Archana Dhidakiya, Fiscal imbalance in Gujarat non tax revenue &
subsidies EPW, August 26 to Sep 2 , 2000, page 3217.
In a research article she has analyzed Gujarat non tax revenue &
subsidies find possibilites of improvement. She has found that contorary
to the spirit of economic reforms, the state in Gujarat is more active in
areas from which it should withdraw as shown by high economic
subsidies, and it is less active in areas where intervention is called for as
shown by low social sector subsidies.
3.3 Summary
Detailed studies pertaining to the theories of public finance and empirical
observations of applied practices in general suggest very clearly that the states
have frequently changed their approach towards finance. Most importantly it is
found that in democratic nations, it is the political ideology which has by
enlarge influenced the policy of public expenditure and revenue. Very few
studies reveal that governments have become the right task master in order to
regularize public finance mechanism. Studies in respect of central Govt.
transferred to states also have raised some important issues, which are likely to
affect the future political economy in a country like India.
70
Reference
Robert Dorfman, “The Price System”, Prentice Hall, New Delhi 1965:
Boumol W.J. “Welfare economics & the theory of state.” Harvad University
press, 1965.
R.A. Musgrave, “The theory of public finances.”
Masgrave D. Rostow, Political and stages at growth
Allen Pecock & Jack Wisemen, “The growth of public expenditure in Great
Brittan”
Geraid Scully, “The size of the state, economic growth and efficient utilization
of national resource, public choice”, page No.63-1989.
D.T. Lakdawala,”Union state financial relations”, 1976 page-45
George break & Lieon keyserling, “Revenue sharing its implications for present
& future inter govt. fiscal system. The case fot and against” published in
“National Tax Journal” vol. 24 No.3 page No.307 321
R.N. Bhargave, “Theory and working of union finance in India.” 1967.
World development report 1988
Deviti Marco – first principles of public finance Jonathan cap- 1950, page-52.
H.M. Groves, “Financing govt.” Henery holt and company Network 1958 –
page 514.
W.W. Heller, “Fiscal policies for under develop countries.” In bird and oldman
(ed) “Reading on taxation in developing countries. Third addition, 1975, page
586.
Aurther Smithies: federal budgeting & fiscal policy In a survey of contemporary
eco volume – 1 – 1949 page 144.
K.K. Kuriharu: The keynecian theory of Economic Development p-153.
David Fand: “Some issues in monetary economics fiscal policy assumption &
releted multiplier in John T Boorman and Thomas M. Haverilesky, Money
supply, money demand & macro economics models – Allyn & Bacon INC –
Bostan 1974 p 474.
71
Semualson- “Summery of the friedman type monetarism in readings on
economics.” TATA Mc gro Hill New Delhi – 1973 p.120-121.
W.Arther Levis: The theory of economic growth P.N. 236
K.K. George & I.S. Gulati, “Central state resource transfers” 1951-84 EPW
February 16, 1984 p.290.
Amres bagachi: TAPAS SEN and V.B. Tulsidas
“Issues before ninth finance commission” EPW may 7, 1988 p.956.
Pramatnanath Banerjea: “The future of Indian finance” published in P.Jagdish
Gandhi (Ed) Economic development and policies in India – Haranand
publicationbs 1994 P.N. 152 to 155.
M.V. Mathur: “Institutional framework of planning and union – state financial
relations.” Published in R.K. Sinha (E.D.) “planning and development in India.”
Haranand pub. 1994 page No. 116 to 128.
Kamta Prasad: “Planning in India some basic issues relating to operational &
strategic aspect.” Published in Rajkumar Sen (ed) from diamand to platinum –
I.E.A. presidencial addresses. I.E.A. trust for research and development page
No. 270 to 301.
B.P.R. Vithal: Federal financial relations the plan/non plan conunbrum.
Published in EPW February 13, 1999 page 431 to 436.
N.J. Kurian: “State govt. finances a survey of recent trends.” EPW may 8, 1999,
page No.1115 to 1125.
NIPEP – 1981 Treurs & issues in Indian federal finance – Allied Publication
Delhi
Ranjana 1984
“Allocative effects of inter governmental flows in India – A new perspective
1952 to 1977.” Margin April 1984.
Rao Hemlatta – 1981 centre state financial relations – Allied Pub – New Delhi
72
M- Nagnathan & K.Shivgnanam “Federal transfers and tax efforts of the stated
in India.” The Indian economic journal April – June 1999-2000 page 101 to
111.
Emmanuel Anoruo & Sanjay Ram Chander
“current account and fiscal deficits evidence from India.”
Indian economic journal – Jaun – March – 1997 – 98 – page No. 66 to 75.
K.Shambhat, “Political economy of public expenditure and tax revenue in
India.” The Indian economic journal – July – September – 1996 – 97 Page No.
108 to 114.
Govind Rao M – 1981
“Political economy of tax and expenditure determine” A case study of for India
states.” Allied publishers private limited New Delhi.
Mihir Rakshit
“Restoring fiscal balance through legislative fiat the Indian experiment.” EPW
June 9 to 15 – 2001 page 2053 to 2061-
Ajit Karnik
“fiscal responsibility & budget management bill – offering credible
commitment.”
Coondoo–Majumadar–Mukharjee & Nilyogi – “Relative task performances
analysis for selected states in India.”
EPW October 6 to 12, 2001 page 3869 to 3871.
EPW Research foundation – “Finances of govt. of India” EPW April 13 to 19 –
2002.
Shikha Zha: “Strengthening local govt.’s rural fiscal decentralization in India.”
EPW June 29 to July 5, 2001 page No 2611 to 2622.
M.Govind rao, “State finances in India issues and changes”
EPW August 3 to 9 2002 page 3261 to 3271.
T.Ravikumar Murlidhar Vemury
73
‘Center states transfer of resources the population factor.”
EPW August 17 to 23, 2002 page No. 3406 – 3409.
B.P.R. Vithnal & J.V.M. Sharma,
S. Gurumurthy
“Twelth finance commission and states” debt burden.
E.P.W. Oct. 5 toll, 2002 page no. 4142.
Madhav God bole:
Law on fiscal responsibility and budget management – exercise into talkenism.
E.P.W. March 15 to 21, 2003 p. 1018.
E.P.W. research foundation
D. Budopadhyay
“Twelfth finance Commission and Panchyat finances” E.P.W. June 7 to 13
2003, p. 2243.
R. Kannan , S.M. Pillai, R. Kausaliya and Jay Chander.
Finance Commission award and fiscal stability in states.
E.P.W. January 31 to February 6- 2004 p. 479
Rajan Gopal
“Does higher fiscal deficit lend to rise in interest rates? an impirical
investigation”
E.P.W. May 21 to 28, 2004 p. 2128.
Acharya Sanker, “India’s macro economic management in the ninetees- Indian
council for research on international economic relations – New Delhi.
Brian Pinto & Farak Zahir
“Why fiscal adjustment now”, E.P.W. March 6- 2004, 1039 to 1046.
C. Rangrajam D. K. Shrivastav,
“Fiscal transfer in Canada Drawing comparison and lessons”
E.P.W. May 8 to 14, 2004, page 1897 to 1909.
Premchand

74
“Ethical dimensions of Public expenditure management”
EPW, Feb. 21-27, 2004. page 813 to 822
Bok derek
The trouble with govt., “Harward University Press, Cambridge 2001, page no.
384 – 390.
Rangrajan
“Issues before the twelfth finance commission” paper presented at the seminar
organized by NIPFP at Delhi published in EPW June 26, July 2- 2004 P.No.
2707-2717
RBI annual report – 200203 on Govt. Finances – P. 52.
International Momentary Fund (IMF) 2002 “Selected issues and Statistical
appendix for India” Country report 2/193/.
Raju Raman – Indira & H Mukhopadhyay – 2000.
“Sustainability of Public domestic debt in India” in fiscal federation in India
contemporary changes, D. K. Shrivastav (FD) Haranand Publications.
“Survey of state finances”, EPW research foundation.
Vivek Murthy
“India’s primary deficit and interest payments burden an assessment” EPW June
26 July 2 – 2004, p. 2711.
Abha Prasad – Rajan Goal, Anupam Prakash – “States debt and relief”
A paper presented at the seminar on “issues before the twelfth finance
commission organized at Delhi by NIPFP – represented organized at Delhi by
NIPFP represented in EPW June 26 – July 2, 2004, p. 2726.
Amresh Bagchi – Pinaki Chakraborty “Towards a rational system of center state
revenue transfers” A paper presented at the national seminar on issues before
the twelve finance commission – organized by NIPFP reprinted in EPW June 26
– July 2, 2004.

75
Tapas K. Sen Christo Trebesch
“Use of socio economic criteria for inter governmental transfers”
Bird and Tarasov 2002, Alm & Martinez 2002
Rao Goving M. 2002, “State level fiscal reforms in India”. Working paper.
Anupam Rastogi – restructuring public finance.
Paper presented at the national seminar on issues before the twelfth finance
commission organized by NIPFP. Reprinted in EPW June 26 to July 2, 2004, p.
2756.
Archana Dhodakiya
“Problems and prospects of fiscal balance in Gujarat” occasional paper No. 3
published by Dr. Lakdawala memorial trust GIDR Ahmedabad June 2000.
Archana Dhidakiya
Fiscal imbalance in Gujarat non tax revenue & subsidies EPW, August 26 to
Sep 2 , 2000, page 3217.
76
Chapter – 4
Fiscal Condition and Reforms
4.1 Indian experience at glance
Indian economy is a mixed economy. Fiscal policy in a country like India
plays crucial and multidimensional roll in trying to satisfy the twin objectives of
growth and social justice. The traditional keynsian approach for judicious use of
public spending and taxation attained greater significance in economic
operations of different countries. Indian economy was not an acceptation to that
phenomenon. The economy has under gone radical changes since July 1991.
These changes are mainly centered round the issues of both stabilization and
structural reforms, the poor health of our fiscal system, the inadequate resource
generation, increasing inefficiency of state owned enterprises, the adverse
capital output ratio both in public and private sector and the acute misery of
balance of payment, let us to take new and bold initiative for improving
efficiency and productivity to put the economy back on the path of self
sustained growth.
One can have the better understanding of the fiscal crisis by making a
distinction between macro economic stabilization and structural adjustment.
Stabilization basically refers to short term problems while structural adjustment
deals with obstacle to recent macro economic crisis has been closely linked
with the imbalances in the fiscal sector. The central govt. gross fiscal deficit
was equal to 8.4% of GDP at current prices during 1990-91 as against 6% in
beginning of 1980’s and 3 to 4% in mid 70’s. In 1997-98 it was 6.3% and as per
the budget estimate of 2003-04 it is again 5.6%. The fiscal deficit has resulted
in growing indebtedness. The internal and external debt constituted about 57%
of GDP in around 1993-94 external debt. Figures where Rs. 150760 crores in
77
1997-98 which increased to Rs. 230000 crores in the year 2002-03 the external
debt GDP ratio declined from 5.5% in 1990-91 to 3% in 2001-02 and was
estimated to decline further to 2.8 in 2002-03. The debt position of the state of
Govt. of India was also found deteriorating. The interest burden of the govt. of
India in 1980-81 was Rs. 3500 crores. It was Rs. 21500 crores in the year 1990-
91 and as per the estimate at 2003-04 it is Rs. 120 crores. RBI has correctly
observed in general that the continuous increase in govt. expenditure,
potentially on budgetary subsidy together with an inadequately elastic response
from the tax system ad continuous losses of the public sector has contributed to
the budgetary gap. It is because of the spill over of fiscal imbalances and
excessively protected and sheltered market. That it resulted in to adversely
affected efficiency, technological up gradation and export competitiveness.
Broadly considered fiscal adjustment program through the majors in the
area of direct taxes with simplification and rationalization of the structure and
widening its base has encouraged the competitiveness of the economy as
existing customer rates are now in line with those in competitive countries there
is reduction in terrify rate excise duty structure is rationalize.
The other important dimension of fiscal health of Govt. of India is in
respect of growing conflict and tension between the Indian union and the states
in the matter of finance. This conflict is often aggravated by political and
ideological differences between the different parties governing the center and
the states.
Attempts have been made in the last thirty years to have comprehensive
review of center states relation in general and center states financial relation in
particular. The J.K. Thavaraj Committee report of the taxation inquiry
committed Kerala govt. The Rajamannar Committeee on center state relation
appointed by the DMK govt. at Tamilnadu and the document on center state
78
relation (1978) adopted by the west Bengal cabinet. All these have the same
theme that is political and financial autonomy for the states and drastic
restriction of the popular and financial resource of the center.
One important thing is observe in respect of responsibility and resources
of the center and the states. It is found that as against the endowment of
resources the states do have more responsibility constitutionally financial
strange center and week states are found in common – The states in general
have pointed out that the center has not taken sufficient initiative to impose all
the taxes under article 269 whose proceed would go to the states. The states
have also opposed the exclusion of corporate tax. The states also represent the
fact that central excise duties have been expanded by way of inclusion of
growing numbers of items, previously taxed by the states.
In general in India there is too much dependence of the states on the
center in the form of grant-in-aid and loans. This has serious adverse
consequences. It has resulted in to humiliation of the states. It has resulted in to
uncertainty in the budgeting of the states. The states at large face difficulty in
fulfilling electoral promises and there is increasing tendency for unauthorized
over draft to finance plan projects of the states.
Under the reforms the states experience regional imbalances as a source
of conflict. Progressive states have experience center in different toward
resource allocation with the changing scenario there is an increase of planning
process in the form of responsibilities and commitment of the state how ever
there is not corresponding rise in the financial resources. The financial power of
the states are much limited in relation to their clearly define responsibilities.
There is growing demand by the states for strengthening the state through
greater degree of state autonomy. The fact is that all states currently do not hold
ideological harmony amongst them self. There are some states whose demand
79
for the autonomy is in different context. The ideology of DMK in Tamilnadu
Akalidal in Punjab regional parties in Nagaland and Assam are notable example
in this regard. The history proves that it was the presence of common political
ideology and supreme central authority, which held together the culturally
diverse autonomous states in the USSR. When that common political ideology
and the stranger central authority disappear, USSR disintegrated. It is a matter
of concern in this regard that state autonomy can be dangerous to national
integrity. The current status of political economy reveals the fact that in general
states do enjoy considerable autonomy. States have exclusive control over such
key sectors as agriculture, irrigation and power, administration, social welfare
law and order etc. but all the states have not performed these functions properly
in any appreciable degree. The advanced states have continued to march ahead
and the backward states have remained backward.
Under the reforms it is the argument put forward by the center to the
states to fully exploit the resources at the command. The states are still reluctant
to tax agricultural income but they are abolishing land levy. Center has
expressed a matter of concerned over state tax administration particularly in
some of the states where the administration is hopeless current inefficient. The
massive indebting of the state had led to a kind of creditor debtor relationship
between the center and the states bridging a sense of irresponsibility among the
borrowing states.
4.2 Venkat Raman’s study on fiscal responsibility index.
K. Venkat Raman a noted expert on public finance has made some
important observations in his analytical paper on fiscal responsibility index. He
has tried to highlight gross fiscal deficit as a % of total expenditure, primary

80
fiscal deficit as a % of NSDP, Revenue deficit as a % of aggregate expenditure,
interest payment a % of revenue receipts and debt of a % of NSDP.
He has covered 17 states in his study and figures for 1990-1995 and
1995-2000 are presented. He has categories 17 states in to four of the following
categories.
1. High income states – Gujarat, Hariana, Maharashtra and Punjab
2. Middle income states – Andhra, Karnataka, Kerala, Tamilnadu and
West Bengal.
3. Low income states – Bihar, Madhyapradesh, Orissa, Rajasthan and
Uttar Pradesh.
4. Special Category states – Assam, Himachal Pradesh, Jammu and
Kashmir
He has observed that in respect of Gross fiscal deficit as a % of total
expenditure in the first half Assam – Hariyana, Jammu and Kashmir,
Madhya Pradesh, Maharashtra and Tamilnadu where the states with lowest
% in average. While in the second half he observed that only
Madhyapradesh and Tamilnadu retain their position- Hariyana and
Maharashtra have slipped out, while Andhra and Karnataka entered the
group.
About the states with highest % in average it is observed that U.P.,
Orissa , W. Bengal and Kerala could not improve in the last decade. More
important the ratio is found to have increase over the years for all the states.
He examined the position of the states in accordance with % of premium
deficit to NSDP. This indicates budgetary flexibility. The lower the %, the
flexibility for discretionary spending. Jammu-Kashmir, Assam, Bihar,
Tamilnadu are the states found more flexible all through out the decade.
81
While Hariyana and Maharashtra were found more flexible in the first half
while Panjab and Tamilnadu were found more flexible in second half.
About the least flexible states. Himachal Pradesh, U.P. and Orissa are
found least flexible all through out the decade. Punjab Gujarat and
Tamilnadu were found least flexible in first half. Maharashtra, W. Bengal
and Kerala could not improve in the last decade. More important the ratio is
found to have increase over the years for all the states.
The third indicator of revenue deficit as % of gross fiscal deficit highlight
the fact that all states have revenue deficits and that has increased dramatically
in the second half. It is found from the table that the states like Tamilnadu,
W.Bengal and Panjab have continued to have a high revenue deficit syndron. It
is because of less scope for capital expenditure and the use of borrowing for
current consumption.
States own resources as a % of aggregate expenditure state that six states
are more self reliant they are Hariana, Haharashtra, Gujarat, Karnataka, Panjab
and Tamilnadu while the states like Jammu-Kashmir, Himachal pradesh,
Assam, Orissa, Bihar and UP fall in the category of least self reliant state.
About interest payments as a % of revenue resources Tamilnadu,
Karnataka, Maharastra and Madhya pradesh are the states found with lowest
burden all through out the decade. Andhra and Hariana had lowest burden in the
first half, but they sleeped out in the second half. While Jammu-Kashmir and
Assam entered in to the second half. The states like Bihar , Orrisa, UP
continued to have a high burden – J & K improved the position.
The percentage of debt to NSDP – state that Maharashtra, Tamilnadu
maintain the first and second rank respectively while Gujarat improved the
ranking from six in the first half to three in the second half – Madhya pradesh
also improved the rank from seven to five respectively while Andhra could not

82
maintain the performance and went down from four to six. Hariyana also met
with the some result and went down from five to seven.
Venkant Raman has in conclusion provided the aggregate score card
based on this six indicators – according to his analysis Gujarat was 8th in the
ranks with forty seven score average of 7.8 in the first half and in the second
half the state improved a position little with the score of 42 7th in the rank with
average of 7.0.
He has also analyzed that all through out the reform period total
development expenditure of states in general has decline from 1999-2000 there
has been little increase in the total development expenditure how ever after
2002-03 in the last two years it again shows declining trend.
Development expenditure if segregated it is reveled that the expenditure
has never crossed 1.9% of GDP on capital account and on revenue account it
was maximum in the year 1991-92 (0.1%) and minimum in the budget
estimates of 2003-04 (7.3%) thus, it is a matter of great concerned for all the
states as the development expenditure tends to have decline.
He has revealed revenue and capital expenditure of the states which if
examined in respect of percentage expresses the fact that all through out the
period of reform revenue expenditure is proportionately more than that of
capital expenditure. Right from 1995 to 2001-02 capital expenditure has
remained around 2.7% while during the same period revenue expenditure has
remained around 12.2 to 13.8%. Thus it is very clear that aggregate situation is
much alarming.
States fiscal deficit in aggregate was 3.3% of GDP in 1990-91 and it
decline to 2.7% in 1996-97. There after it again expressed a rising trend to
reach 4.7% of GDP in 1999-2000. It had declined a little near about 3.9% in
2000-01 and 2001-02. But it again shot up to 4.7% of GDP in 2002-03.
83
4.3 Fiscal position
Fiscal position of the central and states combined indicated the following
picture.
In the year 1999-2000 fiscal deficit as % of GDP was 10.4% it went up to
10.7% in 2000-01 again increased to 11.1 in the year 2001-02 as per the revised
estimates of 2002-03 it is 10.4% and budget estimates of 2003-04 mention a
little fall up 9.4%.
Revenue deficit in combined was 69% of GDP in 1999-2000. Which
increased to 7.3% in 2000-01 and again to 7.6% in 2001-02. Here also a little
declined is reported in the revised estimates of 2002-03 that is 7.5% and less in
the budget estimates of 2003-04 up to 5.9%.
Having a look at primary deficit it is found that the deficit was 3.4% of
GDP in 1999-2000 – 3.0% in 2000-01, 3.2% in 2001-02 revised estimates of
2002-03 indicated 2.5% and budget estimates of 2003-04 reflected 1.6% of
GDP.
A matter of concerned is found more in respect of public debt as % of
GDP it has continuously increased. It was 81.8% in 1999-2000, 87.6% in 2000-
01, 93.4% in 2001-02, as per the revised estimates of 2002-03 it is 100% and
revised estimates of 2003-04 indicates 102.2%.
In general it appears therefore that fiscal position in aggregate is not just
red, but it is the deepest red, central and state govt. finances are in complete
disarray.
As per the report of RBI out standing liabilities of states in aggregate as
% of GDP is indicating continuous rise from the year 1997-98. It was 18.5% in
1997-98 which increased to 19.6% in 1998-99, went high to 21.7% in 1999-
84
2000, 23.8% in 2000-01, 25.7% in 2001-2002 – 27.9% in revised estimates of
2002-03 and 28.7% in the budget estimates of 2003-04.
Combined receipts and disbursement of the central and state govt. also
provide a picture not healthy in conformity to the aggregate trend. Total receipts
as % of GDP was 26.8% in the year 1990-91. It was found 26.4% in the year
1998-99, 28.0% in 1999-2000, again 28.6% in 2000-01, 29.5% in 2001-02,
30.2% in the revised estimates of 2002-03 and 29.6% in the budget estimates of
2003-04. The disbursement as % of GDP was 28.8% in the year 1990-01,
26.6% in 1998-99, 28.2% in 1999-2000, 28.5% in 2000-01, 28.6% in 2001-02,
revised estimates of 2002-03 shows 30.4% and budget estimates of 2003-04
indicated 29.9%.
In other words the states of large tried to keep them self away from
taking in popular tax majors and to attribute their inefficiency and failure to the
center with the major recommendation of at the tenth finance commission being
accepted the issues of conflict between the center and the states is getting
disappear.
4.4 Review of recommendation of 12th finance commission
Review of recommendation of finance commission was constituted by
the presented on November 1, 2002 to give recommendations of specified
aspect center states financial relation during year 2005. The commission has
submitted its report covering all aspects of its Mandate on December 17, 2004.
This report is to come in implementation from April 7, 2005.
In the 11th finance commission it was recommended to devolve 29.5% of
the total central tax revenue to the states as against the 29% level prevailing
earlier in the 12th commissions report. It is recommended that 30.5% of the net
proceeds of sharable central takes may be distributed amongst all such states
85
where any such central tax is livable. The commission has allowed the states
to levy sales tax or VAT on textiles, tobacco and sugar.
The eleventh finance commission had provided 13.5% to be given as
grants in aids to all the states, the amount was 58587 crores rupees. The twelfth
finance commission has in total recommended 142639 crore rupees as grants in
aid. From this grants in aid non plan revenue deficit grants was of 35359 crore
rupees in the 11th finance commission this grant in 12th finance commission is
suggested to Rs. 56855-89 crores.
In the 11th finance commissions report. Maharastra, Tamilnadu, Gujarat,
Kerala, Andhra pradesh, Karnataka, Panjab, Hariyana, Rajsthan and Himachal
pradesh were the losers because of changing the criterion for development of
taxes and duties. While with certain changes in the criterion again Gujarat,
Panjab, Maharastra and Himachal pradesh are the major beneficiaries of the
recommendation of 12th finance commission. Their share in total transfers has
gone up as compared to their share in the five year period of 2000-05.
Talking about Gujarat the state is to receive the benefit of 10285 crore
rupees as part of the development in comparison with 11th finance commission
in respect of the grant the state is get benefit of Rs. 2324 crores rupees against
11th finance commissions award in total the state is to benefited of Rs. 13608-53
crore rupees.
The states, which are likely to get less than the average increase, include
Jammu and Kashmir and Sikkim, which are likely to be compensated through
other funding mechanism.
Against the 11th finance commission weighted of 10% for population, the
12th F.C. has increased the weight to 25% as it is the basic indicator of the need
for public, goods and services and as a certain an it ensures equal per capital
transfer cross states.

86
In respect of the use of area of a state as a criterion for deterring its share
the 12th F.C. has assigned a weight for 10% against 7.5% suggested by the 11th
F.C.
Per capita income distance was 62.5% under the 11th F.C., which has
been assigned a weight of 50% by 12th F.C.
The weighted for tax afford has been in increase to 7.5% from 5% under
the 11th F.C. as the need for fiscal consolidation has become more urgent while
the weighted for fiscal discipline has been retained at 7.5%
The center has accepted the 12th F.C. recommendations to increase the
resources of municipalities and panchayat through grants in aid of Rs. 25000
crores from the consolidate funds of states for the period 2005—10.
This amount may be divided in to a 80:20 ratio between panchayant and
municipalities panchayant was institutions will be given Rs. 20,000 crores and
municipalities will get Rs. 5000 crores, which are a substantial increased over
the level recommended by the previous commissions.
Important observations is made by 12th F.C. with regard to the short fall
in the release of grants of states due to under utilization of funds and the enable
of states or local bodies to raise matching contribution.
However the commission emphasis the important of states raising their
own resources but it has not imposed such conditionality. The commission has
category remarks that local bodies should not be deprived of funds by the
central govt. as this grants are in the nature of a correction of vertical imbalance
between the center and states.
In respect of the panchayant utter pradesh will get the highest allocation
of up to Rs. 2928 crores or 14.64% of total allocation, followed by Mahrashtra
with Rs 1983 crores or 9.91% of the total allocation during the period 2005-10.

87
The municipalities in Maharastra and Gujarat stand to gain the maximum
share of allocation with 15.2% or Rs 791 crores and 8.2% or Rs 414 crores
during 2005-10 respectively.
The commission has recommended that the scheme of fiscal reform
facility may be replaced by scheme of debt relief over the period 2005-10. In
this regard it is suggested that the rescheduling of all central loan contracted till
31st March, 2004 and outstanding as on 31st March, 2005 in to fresh loans for
twenty years carrying 75% interest from the year which a states enacts the fiscal
responsibility legislation.
In general 12th F.C. report is well come all over more importantly by the
states making honest efforts to mobilize resources. It is remarked that 12th
finance commission has taken in to consideration the strong filling of honest
states. Who were otherwise get punished for their honesty. The govt. has done
well to accept the recommendation that will pass on external assistance to states
on a back to back basis provided that all service costs and exchange rate
fluctuations are born by the state, this has been a major source of patronage in
the past as favored states have found it easier to negotiate world bank loan –
restricting the level of grants to states, and saying that this would be linked to
the absorption capacity of the state is another good move.
It is also well coming that the commission has asked all the states that the
salary bill of state should not exceed 35% of there revenue expenditure. It has
also recommended that states should reduce the size of their work force
decrease in the average salary per employee and increase the level of revenue
receipts without increasing the revenue deficit.
The 12th F.C. has projected a compounded annual growth rate of 14% in
the center gross tax revenue, while the central govt. spending is expected to
record to a compounded annual growth rate of around 10% over 2005-10.

88
The commission aspects the services tax to have a much higher rise than
projected by the central govt. because of the significant growth in the service
sector.
As per the commissions estimates the center tax GDP ratio is projected to
improve by 0.92% points by 2009-10 compared to 2004-05 level and 1.68%
points over the level in 2003-04. The commission has assumed a nominal
growth of 12% over its reference period.
However the center’s non-tax revenue as a % of GDP is not expected to
rise substantially and will reach 2.45% of the GDP in 2009-10 compared to
2.21% in 2004-05. The gross revenue receipts of the center is projected to rise
12.16% of the GDP in 2004-05 to 13.33% in the concluding year, while net
revenue receipts are projected to increase to 10.39% of the GDP from 9.55% of
GDP.
The commission has put a word of caution for greater discipline in the
area of that govt. public sector undertaking and said that govt. should ensured
higher dividend receipts from the states own company as some of than did not
follows govt. directors.
The fiscal deficit is estimated to reduced to 3% of GDP in line with the
projections from 2008-09 in line with the targets laid down in the fiscal
responsibility management act revenue deficit is assumed at zero, while primary
deficit is expected to touch of 0.15%.
About non-tax revenue it was 15.69% per year in the pre reform period,
which declined to 8.55% per year during the reform period.

89
4.4.1. What did the states get
Rs. Crore Devolution Grants Total Andhra Pradesh 28930.25 45138.68 2030.93 5214.58 31011.18 50353.26
Aruhachal .918.22 1767.34 1396.96 1758.22 2315.18 3525.56
Assam 12362.05 19850.69 918.81 4478.71 13280.86 24329.4Bihar 54934.9 67671.04 1 793 7975.79 56727.9 75646.83
Chhattisgarh 0 16285.76 0 1987.94 0 18273.7
Goa 775.22 1589.14 4634 135.39 821.56 172' 53Gujarat 10615.33 21900.47 1384.29 3708.28 12000.22 25608.75
Haryana 3552.44 6596.46 653.33 1445.98 420S.77 8042.44Himachal Pradesh
2570.25 3203.22 4890.18 11247.14 7460.43 14450.36
Jammu & Kashmir
4854.5 7441.71 11573.72 13438.57 10428.22 20880.28
Jharkhand 0 20624.02 0 3032.82 0 23656.84
Karnataka 18552. 18 27361.88 1139.5 4054.4 19691.98 31 416.28Kerala 11504.04 16353.21 812.68 3^54.51 12316.72 19607.72
Madhya Pradesh
33258.9a 41180:59 1739.4 5141.37 34998.38 46321.96
Maharashtra 17431.05 30663.19 1956.44 5531.06 9387.49 36194.25
Manipur 1377.32 2221^44 1838.59 4648.76 3215.91 6870.2Meghalaya 1287.01 2276.61 1674.4 2091.16 2961.41 4367.77
Mizoram : .745,11 1466.52 1790.16 3194.39 2535.27 4660.91Nagaland 827.9 1613.67 3621.86 5839.74 4449.76 7453.41
Orissa 19026.64 31669.47 1727.86 5273.3 20754.5 36942.77
Punjab 4316.37 7971 1112.16 4913.59 5428.53 12884.59Kajasthan 20595.88 34418.56 2992.75 4643.91 23588.63 39062.47
Sikkim 692.43 1392.94 941.49 436.2 1533^92 1829.14Tamil Nadu 20264.72 32552.74 1336.71 4135.39 21601.43 36688.13
Tripura 1832.67 2626.09 2528.37 5790.91 1361.04 8417
Uttar Pradesh 74501,56 118209.45 4007.74 15262 78509.3 133471.45Uttaranchal 0 5762.22 0 6432.12 0 12194.34
West Bengal 30540.09 43303.91 4679.76 7573.37 35219.85 50877.28TOTAL 376318.01 613112.02 58587.43 142639.6 434905.44 755751.62
Source : Business standard 26th Feb. 2005
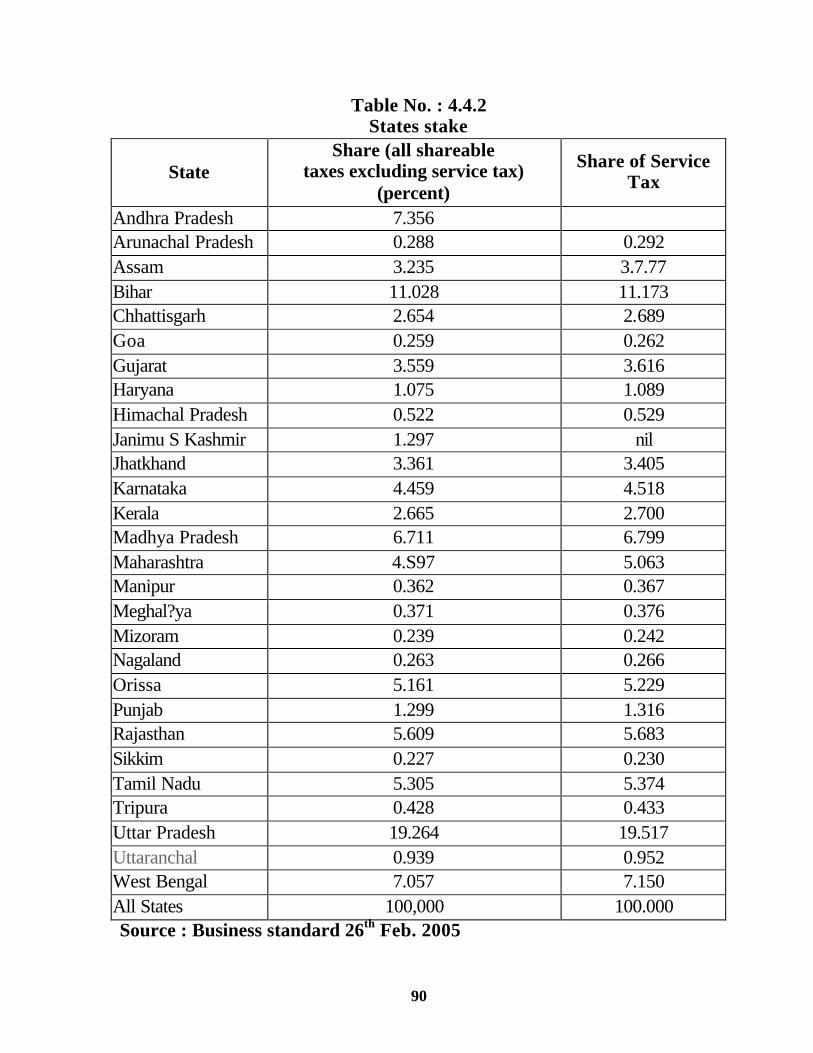
90
Table No. : 4.4.2 States stake
State Share (all shareable
taxes excluding service tax) (percent)
Share of Service Tax
Andhra Pradesh 7.356 Arunachal Pradesh 0.288 0.292 Assam 3.235 3.7.77 Bihar 11.028 11.173 Chhattisgarh 2.654 2.689 Goa 0.259 0.262 Gujarat 3.559 3.616 Haryana 1.075 1.089 Himachal Pradesh 0.522 0.529 Janimu S Kashmir 1.297 nil Jhatkhand 3.361 3.405 Karnataka 4.459 4.518 Kerala 2.665 2.700 Madhya Pradesh 6.711 6.799 Maharashtra 4.S97 5.063 Manipur 0.362 0.367 Meghal?ya 0.371 0.376 Mizoram 0.239 0.242 Nagaland 0.263 0.266 Orissa 5.161 5.229 Punjab 1.299 1.316 Rajasthan 5.609 5.683 Sikkim 0.227 0.230 Tamil Nadu 5.305 5.374 Tripura 0.428 0.433 Uttar Pradesh 19.264 19.517 Uttaranchal 0.939 0.952 West Bengal 7.057 7.150 All States 100,000 100.000 Source : Business standard 26th Feb. 2005
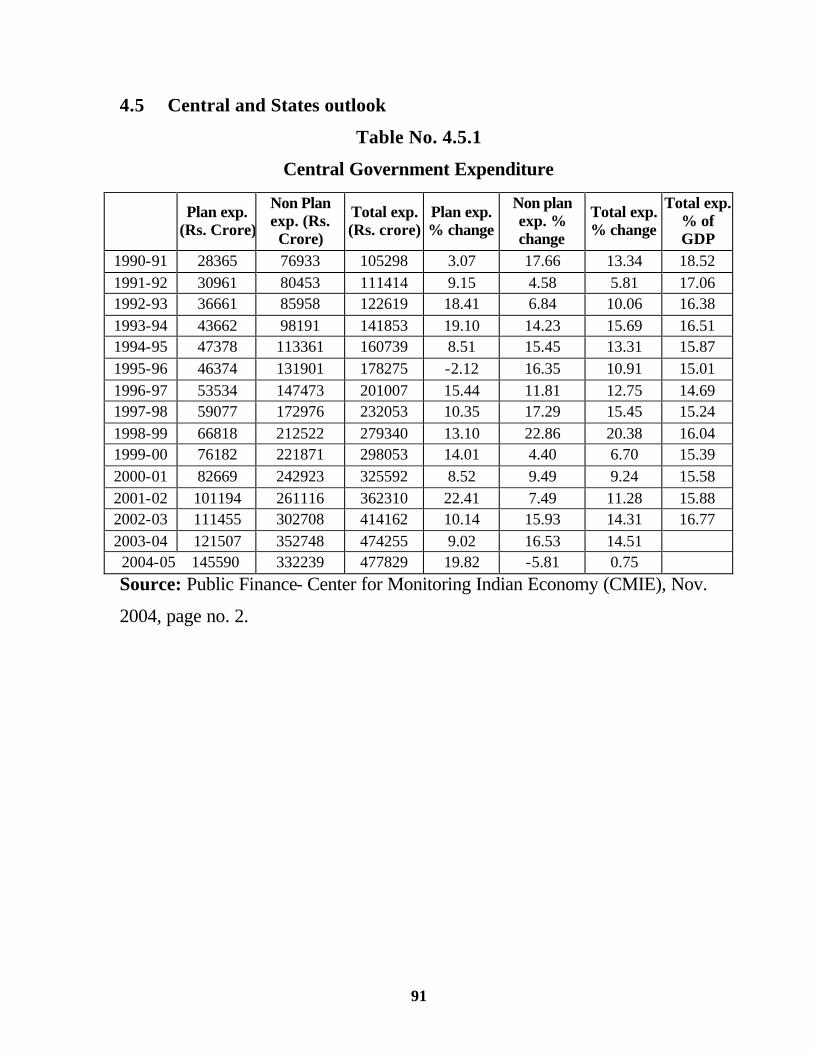
91
4.5 Central and States outlook
Table No. 4.5.1
Central Government Expenditure
Plan exp.
(Rs. Crore)
Non Plan exp. (Rs. Crore)
Total exp. (Rs. crore)
Plan exp. % change
Non plan exp. % change
Total exp. % change
Total exp. % of GDP
1990-91 28365 76933 105298 3.07 17.66 13.34 18.52
1991-92 30961 80453 111414 9.15 4.58 5.81 17.06 1992-93 36661 85958 122619 18.41 6.84 10.06 16.38
1993-94 43662 98191 141853 19.10 14.23 15.69 16.51 1994-95 47378 113361 160739 8.51 15.45 13.31 15.87
1995-96 46374 131901 178275 -2.12 16.35 10.91 15.01
1996-97 53534 147473 201007 15.44 11.81 12.75 14.69 1997-98 59077 172976 232053 10.35 17.29 15.45 15.24
1998-99 66818 212522 279340 13.10 22.86 20.38 16.04 1999-00 76182 221871 298053 14.01 4.40 6.70 15.39
2000-01 82669 242923 325592 8.52 9.49 9.24 15.58
2001-02 101194 261116 362310 22.41 7.49 11.28 15.88 2002-03 111455 302708 414162 10.14 15.93 14.31 16.77
2003-04 121507 352748 474255 9.02 16.53 14.51 2004-05 145590 332239 477829 19.82 -5.81 0.75
Source: Public Finance- Center for Monitoring Indian Economy (CMIE), Nov.
2004, page no. 2.

92
-9
-6
-3
0
3
6
9
12
15
18
21
24
27
1990-91
1991-92
1992-93
1993-94
1994-95
1995-96
1996-97
1997-98
1998-99
1999-00
2000-01
2001-02
2002-03
2003-04
2004-05
Plan exp. % change
Non plan exp. % change
Total exp. % change
Total exp. % of GDP

93
As presented in the table there has been sharp variations found in respect of
percentage change both of plan expenditure and non plan expenditure. It is observed
clearly that plan expenditure is found to have increased maximum in the year 2001-02
while non plan expenditure percentage change is found highest in the year 1998-99.
Negative percentage change in case of planned expenditure is observed in the year 1995-
96 while in case of non plan expenditure it is observed in the current financial year
budgets estimates.
Looking at the total expenditure % change is found in varying degree minimum is
reported in the year 2004-05 budget estimates while maximum is observed in the year
1998-99. It is also reflected that the year in which non plan expenditure in % is changed
maximum in the same year total expenditure in % has increased maximum.
The inter relationship between % change in plan and non plan expenditure if
examined states considerable gap between the two. The year in which planned
expenditure in % change is maximum (2001-02) in that year non plan expenditure is less
than that about 14.92% point. Similarly the budget estimate of the current financial year
indicates sizeable rise in plan expenditure % against which non plan expenditure %
change is found negative. The year in which planned expenditure % change is negative
(1995-96) the non plan expenditure % change is of 16.35.
Looking at the graph of total expenditure as % of GDP it is observed that right
from 1991-92 too the year 1996-97 i.e. during the period of 8th five year plan it has been
declining. While there after there are little fluctuations over the period.
In general looking at the segregation of total expenditure non plan expenditure
tends to be higher than planned expenditure in almost all years of study. Thus it reveals
the fact that central government has not been able to control the non plan expenditure.
Table No. : 4.5.2
Central & State Government Expenditure General Services
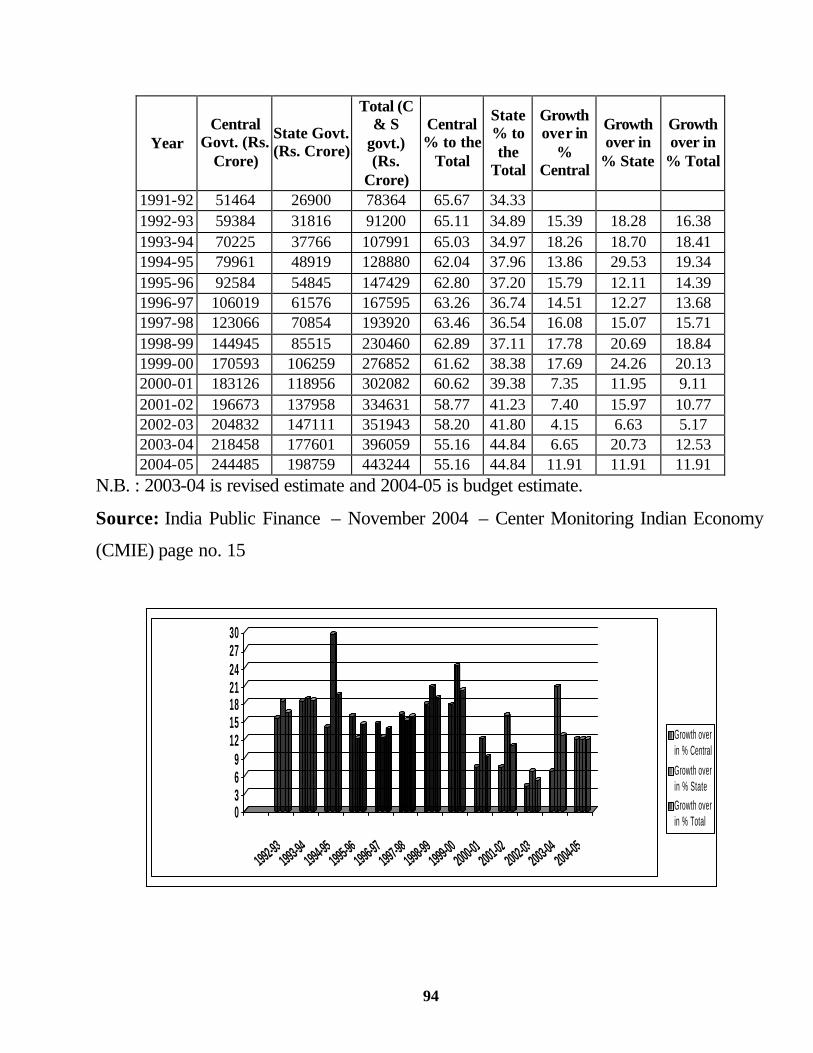
94
Year Central
Govt. (Rs. Crore)
State Govt. (Rs. Crore)
Total (C & S
govt.) (Rs.
Crore)
Central % to the
Total
State % to the
Total
Growth over in
% Central
Growth over in
% State
Growth over in
% Total
1991-92 51464 26900 78364 65.67 34.33 1992-93 59384 31816 91200 65.11 34.89 15.39 18.28 16.38 1993-94 70225 37766 107991 65.03 34.97 18.26 18.70 18.41 1994-95 79961 48919 128880 62.04 37.96 13.86 29.53 19.34 1995-96 92584 54845 147429 62.80 37.20 15.79 12.11 14.39 1996-97 106019 61576 167595 63.26 36.74 14.51 12.27 13.68 1997-98 123066 70854 193920 63.46 36.54 16.08 15.07 15.71 1998-99 144945 85515 230460 62.89 37.11 17.78 20.69 18.84 1999-00 170593 106259 276852 61.62 38.38 17.69 24.26 20.13 2000-01 183126 118956 302082 60.62 39.38 7.35 11.95 9.11 2001-02 196673 137958 334631 58.77 41.23 7.40 15.97 10.77 2002-03 204832 147111 351943 58.20 41.80 4.15 6.63 5.17 2003-04 218458 177601 396059 55.16 44.84 6.65 20.73 12.53 2004-05 244485 198759 443244 55.16 44.84 11.91 11.91 11.91
N.B. : 2003-04 is revised estimate and 2004-05 is budget estimate.
Source: India Public Finance – November 2004 – Center Monitoring Indian Economy
(CMIE) page no. 15
0369
12151821242730
1992-93
1993-94
1994-95
1995-96
1996-97
1997-98
1998-99
1999-00
2000-01
2001-02
2002-03
2003-04
2004-05
Growth overin % Central
Growth overin % State
Growth overin % Total
95
This table provides data on expenditure on general services of central government
all states and total expenditure. Looking at the total of revenue and capital expenditure
following picture is revealed. It is highlighted from the table that.
1. Central government expenditure on general services indicates declining trend
all through out the period of study. It is only during the years of 1995-96 to
1998 that there has been increase in the percentage point. On the other hand it is
evidently found that general expenditure of all states shows increasing trend
except the year 1996-97 and 1997-98.
2. Considering the percentage in comparison with 1991-92 the year 2004-05
expresses 10.51% point rise in the expenditure of states while it expresses –
10.51% point difference in the expenditure of central government.
3. Percentage growth over the year in respect of central government expenditure
indicates greater amount of change during the period of 1992-93 to 1999-2000.
After that it shows less amount of change over the previous years in percentage.
However the budget estimates of 2004-05 of central government indicates again
more change over revised of 03-04.
4. Coming about the trend of expenditures by the states again it is observed that
there have been fluctuating trends in respect of the percentage over the previous
years. In comparison with the period 8th five year plan fluctuations are found
less in degree during the period of 9th five year plan.
5. The aggregate expenditure on general services reflects sharp variations over the
previous years. It also expresses up and downs all throughout the period of
study.
6. Maximum percentage point change in respect of central government
expenditure is found in the year 1998-99 over the previous year. While
minimum change is reported in 2002-03.
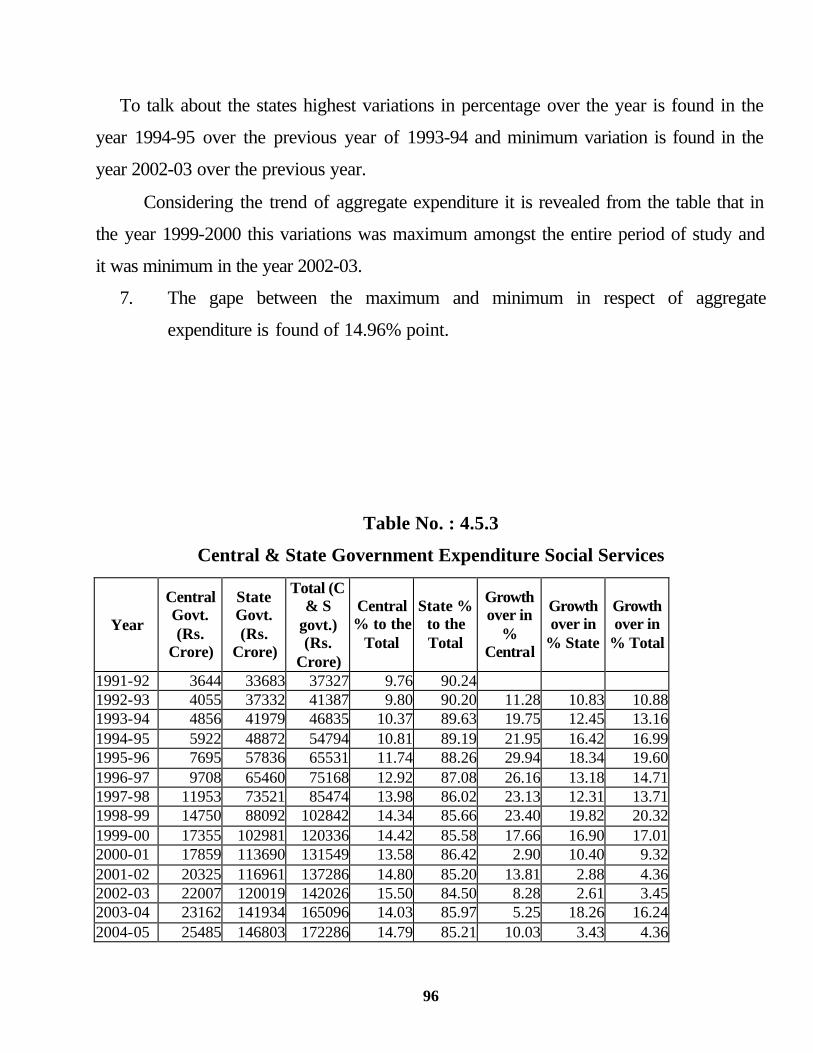
96
To talk about the states highest variations in percentage over the year is found in the
year 1994-95 over the previous year of 1993-94 and minimum variation is found in the
year 2002-03 over the previous year.
Considering the trend of aggregate expenditure it is revealed from the table that in
the year 1999-2000 this variations was maximum amongst the entire period of study and
it was minimum in the year 2002-03.
7. The gape between the maximum and minimum in respect of aggregate
expenditure is found of 14.96% point.
Table No. : 4.5.3
Central & State Government Expenditure Social Services
Year
Central Govt. (Rs.
Crore)
State Govt. (Rs.
Crore)
Total (C & S
govt.) (Rs.
Crore)
Central % to the
Total
State % to the Total
Growth over in
% Central
Growth over in
% State
Growth over in
% Total
1991-92 3644 33683 37327 9.76 90.24 1992-93 4055 37332 41387 9.80 90.20 11.28 10.83 10.881993-94 4856 41979 46835 10.37 89.63 19.75 12.45 13.161994-95 5922 48872 54794 10.81 89.19 21.95 16.42 16.991995-96 7695 57836 65531 11.74 88.26 29.94 18.34 19.601996-97 9708 65460 75168 12.92 87.08 26.16 13.18 14.711997-98 11953 73521 85474 13.98 86.02 23.13 12.31 13.711998-99 14750 88092 102842 14.34 85.66 23.40 19.82 20.321999-00 17355 102981 120336 14.42 85.58 17.66 16.90 17.012000-01 17859 113690 131549 13.58 86.42 2.90 10.40 9.322001-02 20325 116961 137286 14.80 85.20 13.81 2.88 4.362002-03 22007 120019 142026 15.50 84.50 8.28 2.61 3.452003-04 23162 141934 165096 14.03 85.97 5.25 18.26 16.242004-05 25485 146803 172286 14.79 85.21 10.03 3.43 4.36
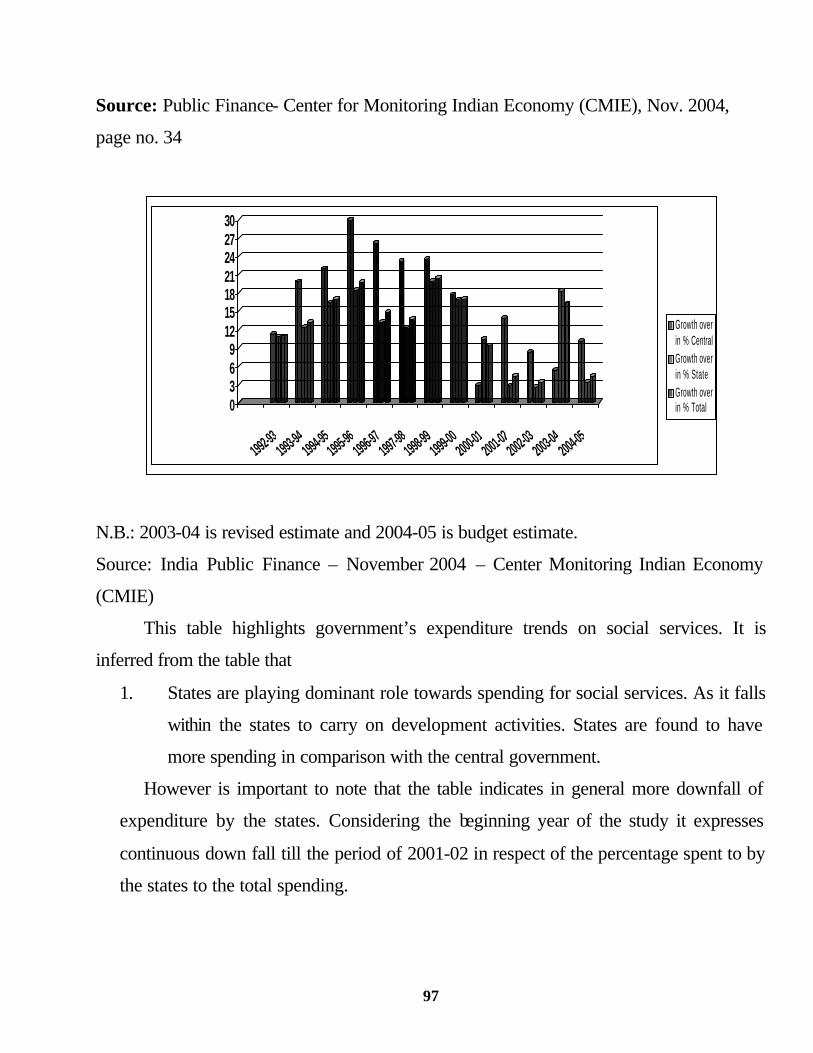
97
Source: Public Finance- Center for Monitoring Indian Economy (CMIE), Nov. 2004,
page no. 34
0369
12151821242730
1992-93
1993-94
1994-95
1995-96
1996-97
1997-98
1998-99
1999-00
2000-01
2001-02
2002-03
2003-04
2004-05
Growth overin % CentralGrowth overin % StateGrowth overin % Total
N.B.: 2003-04 is revised estimate and 2004-05 is budget estimate.
Source: India Public Finance – November 2004 – Center Monitoring Indian Economy
(CMIE)
This table highlights government’s expenditure trends on social services. It is
inferred from the table that
1. States are playing dominant role towards spending for social services. As it falls
within the states to carry on development activities. States are found to have
more spending in comparison with the central government.
However is important to note that the table indicates in general more downfall of
expenditure by the states. Considering the beginning year of the study it expresses
continuous down fall till the period of 2001-02 in respect of the percentage spent to by
the states to the total spending.

98
2. Growth over the previous year in percentage by the central government
expresses more variations during the second half of the decade in comparison
with the first half. In terms of planning period if the trend is examined it is
observed that rise in spending in percentage was more in 8th five year plan
period which declined during 9th five year plan period and in the beginning of
10th five year plan period.
3. To talk about the states tendency for spending towards social sector it is
expressed from the table that growth over in percentage for the previous years is
by enlarge found more in the first half of the reform, however in 9th five year
plan also there has been considerable growth in percentage. However the last 2
years of 9th five year plan period does not indicate much rise in respect of
growth in percentage. The revised estimates of 2003-04 are again indicating
brighter spot in relation to percentage growth.
4. Aggregate spending for social services clearly indicates greater amount of
growth in percentage from the period of 1992-93 to the year 1999-2000. While
it expresses declining growth in percentage over the previous years in the
ending of the 20th century.
5. Maximum percentage growth in aggregate spending is reported in the year
1999-2000 over the previous year and minimum growth is found in the year
2002-03 over the year of 2001-02. Gape between the maximum percentage
growth and minimum growth is of about 16.82% point.
6. In respect of all states the gape between the maximum and minimum is found of
16.94% point. While that in case of central government it happens to be of
25.30% point.
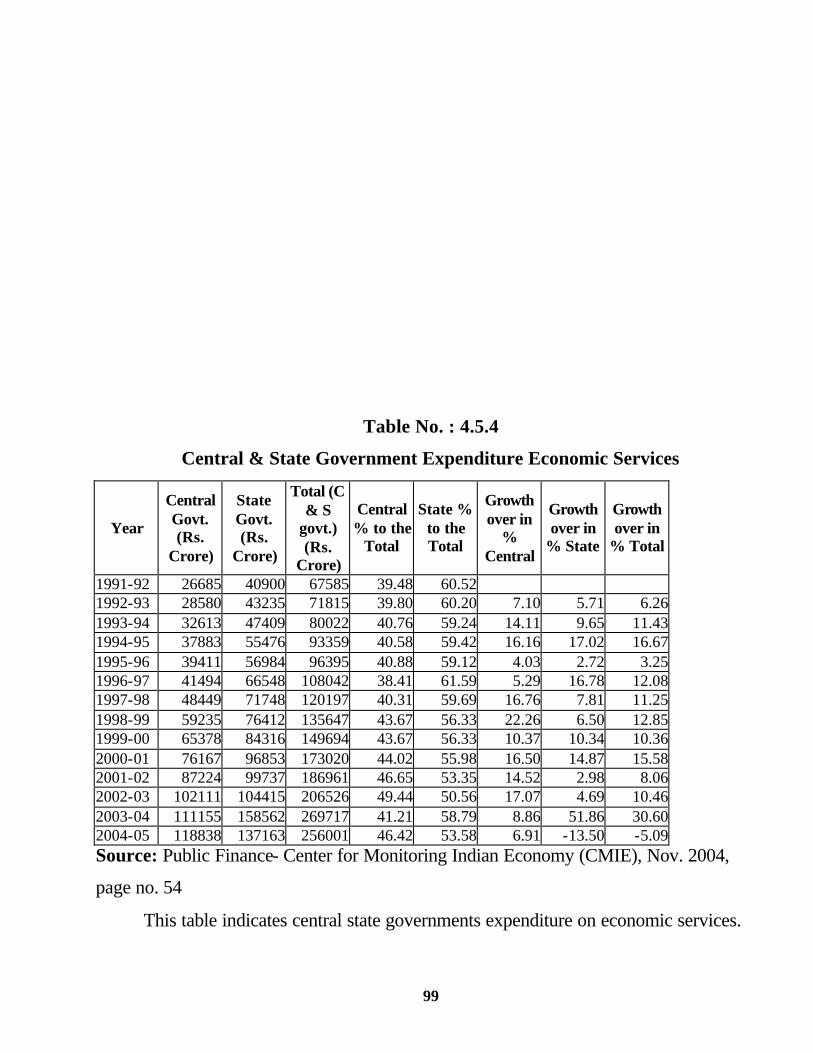
99
Table No. : 4.5.4
Central & State Government Expenditure Economic Services
Year
Central Govt. (Rs.
Crore)
State Govt. (Rs.
Crore)
Total (C & S
govt.) (Rs.
Crore)
Central % to the
Total
State % to the Total
Growth over in
% Central
Growth over in
% State
Growth over in
% Total
1991-92 26685 40900 67585 39.48 60.52 1992-93 28580 43235 71815 39.80 60.20 7.10 5.71 6.261993-94 32613 47409 80022 40.76 59.24 14.11 9.65 11.431994-95 37883 55476 93359 40.58 59.42 16.16 17.02 16.671995-96 39411 56984 96395 40.88 59.12 4.03 2.72 3.251996-97 41494 66548 108042 38.41 61.59 5.29 16.78 12.081997-98 48449 71748 120197 40.31 59.69 16.76 7.81 11.251998-99 59235 76412 135647 43.67 56.33 22.26 6.50 12.851999-00 65378 84316 149694 43.67 56.33 10.37 10.34 10.362000-01 76167 96853 173020 44.02 55.98 16.50 14.87 15.582001-02 87224 99737 186961 46.65 53.35 14.52 2.98 8.062002-03 102111 104415 206526 49.44 50.56 17.07 4.69 10.462003-04 111155 158562 269717 41.21 58.79 8.86 51.86 30.602004-05 118838 137163 256001 46.42 53.58 6.91 -13.50 -5.09Source: Public Finance- Center for Monitoring Indian Economy (CMIE), Nov. 2004,
page no. 54
This table indicates central state governments expenditure on economic services.

100
The table reveals the following facts.
1. The state center ratio in spending for economic services is very close in
comparison with social services. Central government spending for economic
services in percentage to the total spending indicates that in general there is
increasing trend. This percentage to the total spending is found declining only
in the year 1996-97 and the revised estimates of 2003-04. It is obvious there
fore that the trend for the same by the states expresses decline in general except
for the year 1996-97 and revised estimates of 2003-04.
2. The data in respect of percentage growth expresses more rise during the period
of 1996-97 to the year 2002-03 in case of central government spending.
However revised estimates and budget estimate respectively indicates declining
growth. To talk about the states spending percentage growth expresses sharp
variations over the previous years. Unlike the central government this trend
refers to more degree of fluctuations. It is only during the year of 1993-94,
1996-97, 2000-01 and 2003-04 that there has been considerable growth in
percentage over the previous years. Most shocking and surprising is the fact
found in respect of the year 2003-04 budget estimates which indicates negative
change in percentage growth.
3. Aggregate spending in economic services reveals that there was more growth in
percentage in the year 1993-94, 1999-02 and exceptional rise in the revised
estimate 2003-04 and in aggregate the budget estimates of 2004-05 shows
negative growth in percentage.
4. This last two years is a major turning point as the maximum gape between
highest percentage growths and lowest is reported in the last two years. The
same is reflected in case of states spending.
5. Taking into consideration the combined growth right from the period of 1991-
92 to 2004-05 it is found much more (345.33) in case of central government
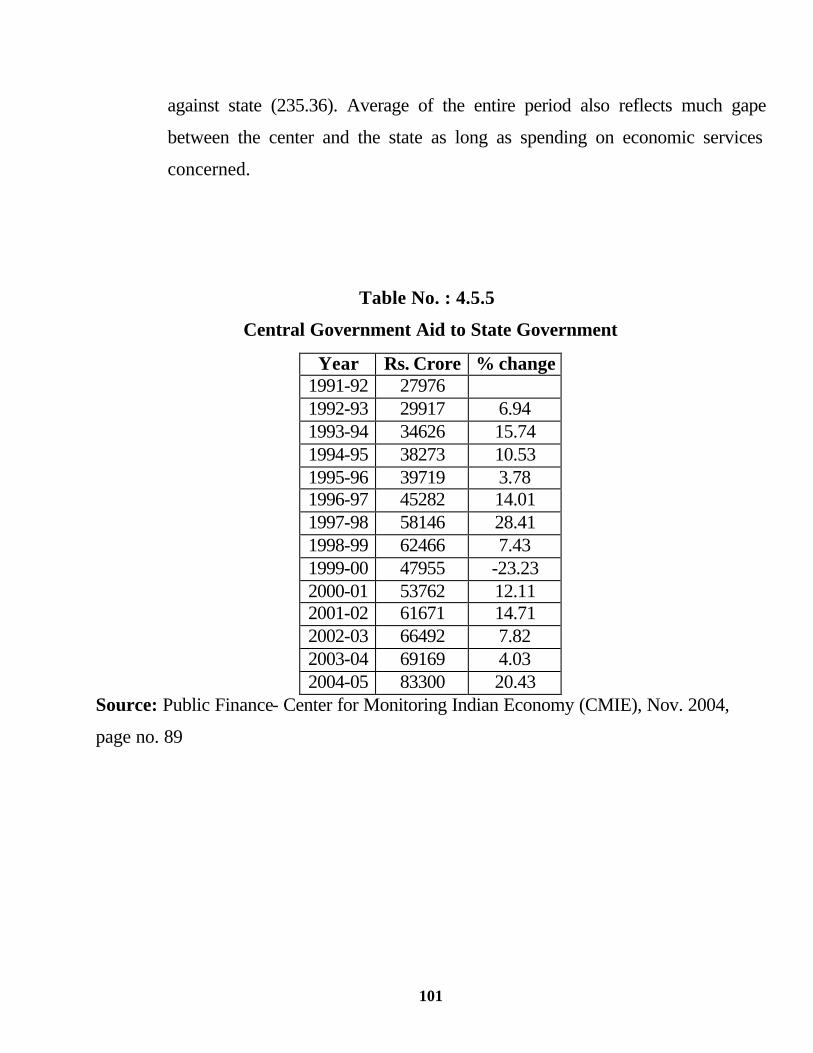
101
against state (235.36). Average of the entire period also reflects much gape
between the center and the state as long as spending on economic services
concerned.
Table No. : 4.5.5
Central Government Aid to State Government
Year Rs. Crore % change 1991-92 27976 1992-93 29917 6.94 1993-94 34626 15.74 1994-95 38273 10.53 1995-96 39719 3.78 1996-97 45282 14.01 1997-98 58146 28.41 1998-99 62466 7.43 1999-00 47955 -23.23 2000-01 53762 12.11 2001-02 61671 14.71 2002-03 66492 7.82 2003-04 69169 4.03 2004-05 83300 20.43
Source: Public Finance- Center for Monitoring Indian Economy (CMIE), Nov. 2004,
page no. 89
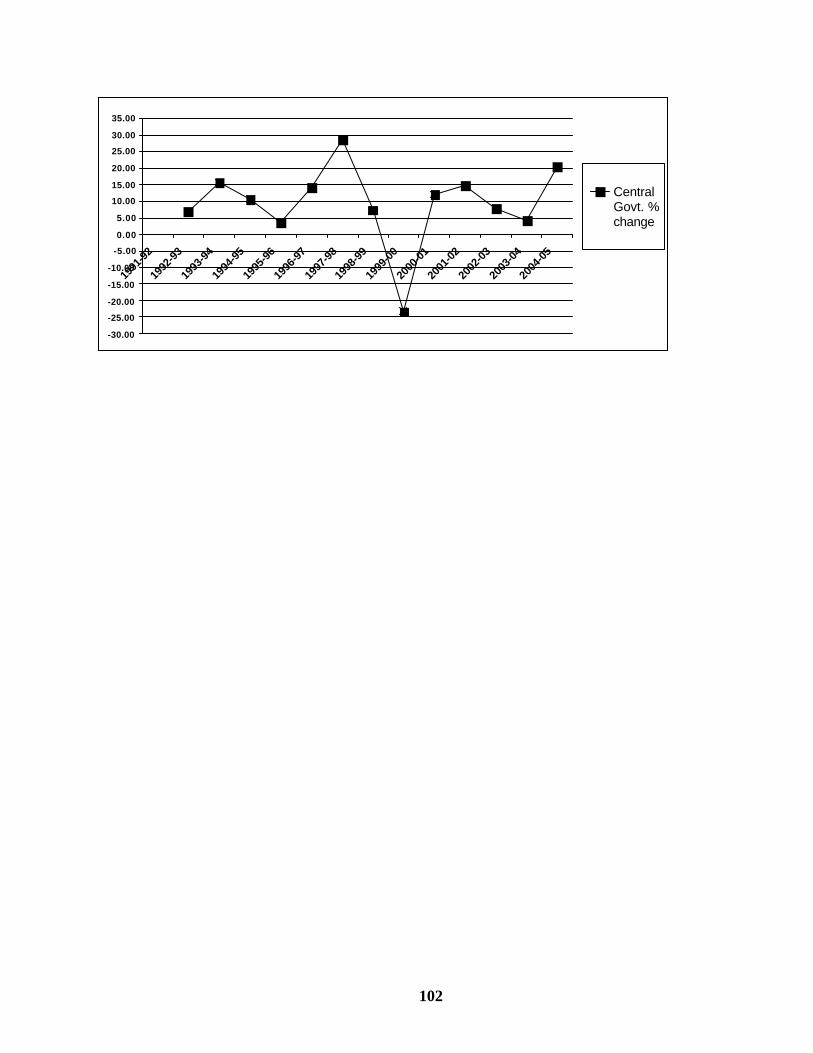
102
-30.00
-25.00
-20.00
-15.00
-10.00
-5.00
0.00
5.00
10.00
15.00
20.00
25.00
30.00
35.00
1991
-92
1992
-93
1993
-94
1994
-95
1995
-96
1996
-97
1997
-98
1998
-99
1999
-00
2000
-01
2001
-02
2002
-03
2003
-04
2004
-05
CentralGovt. %change
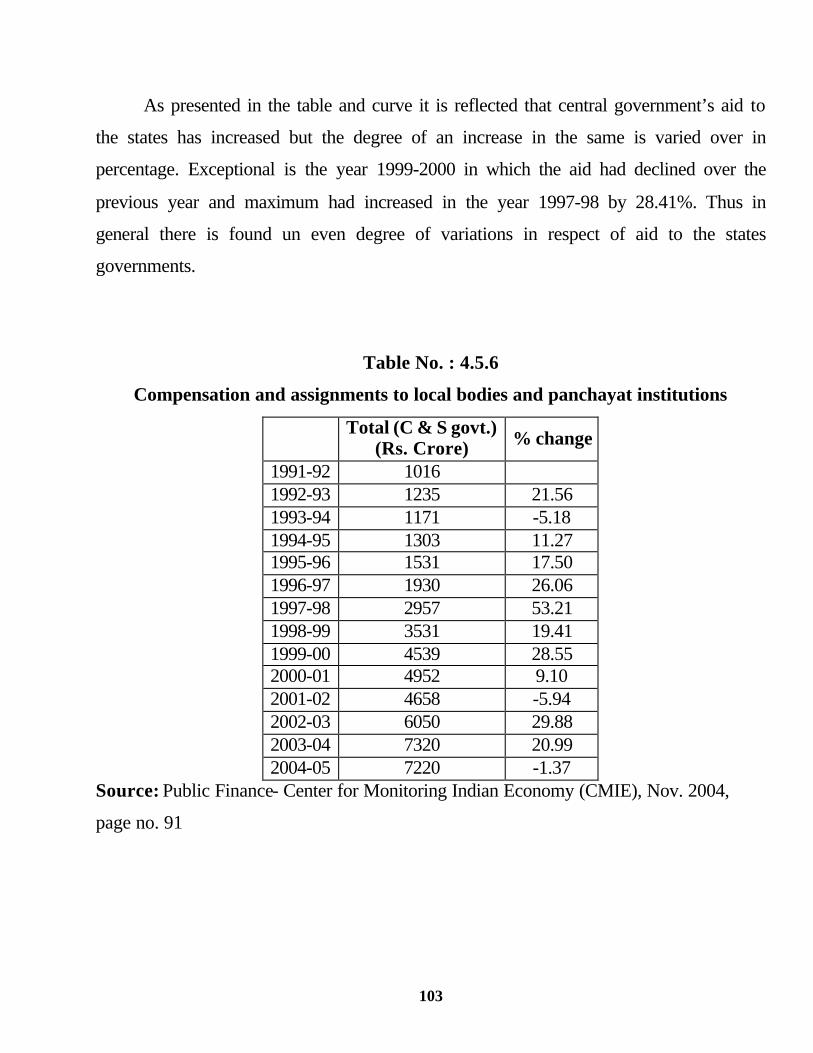
103
As presented in the table and curve it is reflected that central government’s aid to
the states has increased but the degree of an increase in the same is varied over in
percentage. Exceptional is the year 1999-2000 in which the aid had declined over the
previous year and maximum had increased in the year 1997-98 by 28.41%. Thus in
general there is found un even degree of variations in respect of aid to the states
governments.
Table No. : 4.5.6
Compensation and assignments to local bodies and panchayat institutions
Total (C & S govt.)
(Rs. Crore) % change
1991-92 1016 1992-93 1235 21.56 1993-94 1171 -5.18 1994-95 1303 11.27 1995-96 1531 17.50 1996-97 1930 26.06 1997-98 2957 53.21 1998-99 3531 19.41 1999-00 4539 28.55 2000-01 4952 9.10 2001-02 4658 -5.94 2002-03 6050 29.88 2003-04 7320 20.99 2004-05 7220 -1.37
Source: Public Finance- Center for Monitoring Indian Economy (CMIE), Nov. 2004,
page no. 91

104
-10.00-5.00
0.00
5.00
10.00
15.00
20.00
25.00
30.00
35.00
40.0045.00
50.00
55.0060.00
1991-92
1992-93
1993-94
1994-95
1995-96
1996-97
1997-98
1998-99
1999-00
2000-01
2001-02
2002-03
2003-04
2004-05
CentralGovt. %change
It is reflected from the table and graph that all state governments grand in aid to the
local government institutions is found changing over the period of time. Though in
general there is an increase at the different rate it is observed that there has been negative
trends found in this respect during the year 1993-94, 2001-02 and 2004-05. The highest
percentage change is observed in the year 1997-98.

105

113
Chapter-5
Gujarat State Finances
5.1 The state’s fiscal balance-basic over view.
Ordinarily the states fiscal prudence is judged on the basis of the
performance of certain standard indicators like revenue deficit, fiscal deficit, debt
GDP ratio etc. These indicators normally affect the states receipts from the center
by way of tax share and grants besides the states own collection efforts. The
present system of develation o resources does not indicate one-to-one
correspondence between the states contribution to the centre and in term receipt
from it. It is also found that a state performing well in context of collection efforts
may be pushed in to a situation of fiscal crises in our federal financial structure
developmental activities in democracy central Govt. also declares. These schemes
are also to be followed by the states thus the states are required to spire large sum
of finance and to add to real resources thus the states burden tends to increase.
In a country like India the States finances do not provide in general a dismal
picture but that also refers to large degree of differentiation between the states.
Gujarat is one of the most developed states of out country. Therefore there is
greater amount of at large for fulfillment of some social & economic commitment
over and above the minimum task because of higher degree of development the
process of urbanization also becomes faster these adds to the demand for
developed infrastructure because of persistent rise in the demand for civic
infrastructure. There appear to be the demand for large size of funds to meet the
requirement.
114
Against these situation of the state there limitations is that constitutionally
only two kind of taxes that is income tax and excise tax are shared by the centre,
corporate tax and custom duty which are more elastic in nature are not shared by
the centre at all in the tenth finance commission report it was clearly remarked that
revenue from the income tax and excise tax so less bunoyancy than the other two
central taxes like corporate tax and custom duties. Therefore the tenth finance
report it was clearly remarked that revenue from the income tax and excise tax so
less buoyancy than the other two central taxes like corporate tax and custom duties.
Therefore the tenth finance commission in its report in 1994 proposed to pull out
all the four taxes including corporate tax and custom duties. The idea was to enable
the state to share the aggregate buoyancy of all central taxes. Important point to
note here is that even the proportion of excise revenue to be shared with the states
is left at the discretion of the finance commission as a result fear many long years
the centre never shared more than 45% of the total excise revenue through finance
commission from the remaining 55% of the excise revenue some portion is
developed to the staes by way of grant which makes their devolution more
descreationary from the centre point of view and discriminatory from the state
point of view. This type of the policy is not conducive to the dynamic and trade
indencive state like Gujarat. One more suggestion of tenth finance commission to
club the additional excise duties in lieu of Sales tax (lavid by the centre) on sugar,
tobacco, and textile with the basic excise duties is also not favorable for a state like
Gujarat as state is producing all the three items in a relatively large quantity.
Change in criterian for devolution of resource by the finance commission
influence a lot to the fiscal trenth of the economy, in the earlier days the seventh
finance commission had aptly chosen to distribute the additional excise revenue to
the two of the thee items on the basis of the SDP only but the eigth finance
commission changed the distribution criteria and it was decided 50% weightage to
115
be given to population and 50% was given to SDP. This also did not favour the
interest of the large producers of these goods.
One more shocking fact was that both forty percent of excise and 85% of
income tax are develted are among the states largely on the basis of population as
well as the so cold socio-economic criteria. Planning commission largely favor to
provide weightage to “fiscal management” a tax effort for devolution of the plats
funds it leads to in difference and apathy towards the efficient state and over
sympathy to some others. Gujarat has suffered because of this there are certain
industries in Guorant performing well and are comparable with Asian tiger. These
industries have regularly contributed to the central treasury in large amount, it is
also found that the income of agriculture in Gujarat is continuously declining and it
has shifted to non agricultural sector in other word the state revenue to the central
treasury is found increasing.
Looking at the Gujarat State Finance it is found that the Centre’s transfers as
a percentage of total revenue receipts of the state decreases during 1978-1996.
Some peculiarity is that income tax and excise tax of which are shared are not
linked with the performance and the corporate tax and customs duty which are
more buoyant are not shared at all. The Sarkaria Commission, which submitted its
report in 1988 did recommend sharing of corporate tax revenue with the states but
the suggestion was ignorenace the tenth F.C. proposal changes vertical distribution
which required the constitutional amendment for its implementation is not made so
far. Amrash bagchi Gulati express the view that even of this is done the ultimate
out come is not goint to be subsentially different from the earlier.
Criterions for devolution by resources have also caused some chablengin
problems. It is true that in a federal structure regional balance and regional equity
should have an important place. But interestingly it is learnt that the planning
communication of the finance communication over played this objectives until

116
sixth finance commission. Popularty was given 80 to 90% weight age for inter
distribution of resources. The seventh finance commission for the first time
reduced the weightage of population to 25% and gave remaining 75% to socio
economic factors. The eight finance commission introduce the changes which
become very crucial for the state like Gujarat. Tiroty not only income tax but even
excise tax revenue which has been the major source of the revenue for the state
was to be devoted on the basis of 25:75 formula second very important was the
recommendation that the state having an estimation of surplus budgetary situation
like Gujarat. Maharashtra Tamilnadu were to provided little help from the centre
hence forth while on the other hand state like U.P., Bihar, Orissa, Rajasthan, M.P.
were identified as deficit states and hands received special treatment from the
centre as reported by Bagachi all sorts of grants were availed to them under
specific head to cover their non plan revenue gap, to pay the addition D.A. to Govt.
employee, to improve and upgrade the administrative and so on. These resulted in
to reactionary thinking, the logic of uplifting the so called poor and backward
states, created a lot of uncertainty, bitterness and financial crunch on the better
performance on one hand and encouraged them to become deficit state on the other
rational expectation certainly work in such causes and would aptly induce them to
cause deficit state in future, so as to get a favor from the center. The provision of
the tenth finance commission of giving debt relief proves that a state does not only
gets larger found from the centre but for such fiscal indiscipline it also gets a
premium in terms of debt relief.
The planning commission is also found equally responsible for the Current
fiscal problems of the states. The Gadgil formula gave 60% weightage to
population and later on it was introduced as modification, it resulted in to the rise
in the % share of resource transfer to the states with lower per capita income and
there by reduced the relative share available to the states with above average
117
income. Looking in the past it is found that remodification attempts were made by
late Prof. D. T. Lakdawala, Madhu Dandawate and Dr. Vaidyanathan to correct the
bouncer. But the members of the national development council for accepting the
remodification arrived at no consensus.
Having a look at the different approaches towards allocation of the resources
bon by the planning commission of finance commission, the common character is
that both are panelizing the efficient states and rewarding the inettecient once
through subjective approach of devolution. Vithal in 1995 aptly remain that the
element of Gamble is as much there in the democratic dynamics of NDC as there is
in the award by F.C. process. The differences that in one case there are 26
interested parties while in the other there are five parties. It is therefore strongly
felt that some objective norm should be set off for determination the devolution
formula for the states. Late Prof. Lakdawala had also suggested the some in 1993.
It is there fore clear that even today the degrees of freedom available with
states economics both with respect to revenue collection as well as expenditure are
quite less as compared to the centre, some times it is also found that under the
name of regional equity the efficiency factore are considerably sacrifice. Therefore
it would be better to examine truly the criterion adopted over a time.
In view of the above discretion the state level economy is found to have
experience certain upsound downs in case of major fiscal indicators. The past in
this regard has demonstrated the fact that Gujarat did not have much a problem
until 1984-85. This can be explained in terms of the following indicators.
Revenue deficit
Revenue receipts excided the revenue expenditure and surplus was
transformed to capital count a large part of which was usually cent for capital
formation – This is indicated table No. 5.1 & 2.

118
Table : 5.1.1
Aggregate Fiscal Receipts and Expenditure of Gujarat 1978-1996
(Rs. in Crore)
YEAR Revenue Receipts
Capital Receipts
Total Receipts
Revenue Expen diture
Capital Expen-diture
Total Expen-diture
NSDP Curp
1 2 3 2 + 3=4 5 6 5 + 6 = 8 ARR ACR TOTR AREX ACEX TOTEX NSDP
1978-79 674.39 191.49 865.88 603.36 333.20 936.56 5066 1979-80 836.55 194.36 1030.91 744.25 376.24 1 120.49 5794 1980-81 1024.99 382.11 1407.10 903.26 596.20 1499.46 6585 1981-82 1 159.46 439.26 1598.72 1039.15 648.33 1687.48 8200 1982-83 1349.29 591.27 1940.56 1283.03 754.91 2037.94 8626 1983-84 1565.14 711.86 2277.00 1426.1 1 1009.33 2435.44 11269 1984-85 1769.46 542.20 2311.66 1701.20 811.97 2513.17 11757 1985-86 1902.48 791.10 2693.58 1972.39 842.05 2814.44 12037 1986-87 2159.72 1 198.78 3358.50 2469.24 1331.98 3801.22 13883 1987-88 2806.47 1379.27 4185.74 3093.07 1392.19 4485.26 13667 1988-89 3235.69 1715.97 4951.66 3362.40 1741.1 1 5103.51 19283 1989 90 3601.24 1144.86 4746.10 3727.35 1251.38 4978.73 20910 1990-91 3379.27 1333.49 4712.76 4081.92 1630.92 5712.84 23316 1991-92 4662.55 2079.40 6741.95 5238.20 2547.28 7785.48 26359 1992-93 591 1.08 2322.03 8233.11 6210.90 2477.32 8688.22 32240 1993-94 7030.01 2227.90 9257.91 6933.79 2364.35 9298.14 34762 1994-95 7806.39 1456.74 9263.13 7544.22 2068.48 9612.70 39226 1995 96 8544.05 1822.90 10366.95 8766.90 2044.49 10811.39 47869
Original Source: Budget documents and Socio economic review – dirctorate of economics and statistics, Govt. of Gujarat, Gandhinagar. Derived from: Archana Dholakiya – Problems and prospects of fiscal balance in Gujarat – GIDR, GOTA – Dec. 2000.

119
Table : 5.1.2
Revenues and Receipts As percentage of Total Expenditure 1978-96
YEAR Revenue Receipts
Capital Receipts
Total Receipts
Revenue Expend).
Capital Expend!.
Total Expend!.
(ARR) (ACR) (TOTR) (AREX) (ACEX) (TOTEX)
1 2 3 2 + 3=4 5 6 5 + 6 = 7
1978-79 72.01 20.45 92.45 64.42 35.58 100.00
1979-80 74.66 17.35 92.01 66.42 33.58 100.00
1980-81 68.36 25.48 93.84 60.24 39.76 100.00
1981-82 68.71 26.03 94.74 61.58 38.42 100.00
1982-83 66.21 29.01 95.22 62.96 37.04 100.00
1983-84 64.27 29.23 93.49 58.56 41.44 100.00
1984-85 70.41 21.57 91.98 67.69 32.31 100.00
1985-86 67.60 28.11 95.71 70.08 29.92 100.00
1986-87 56.82 31.54 88.35 64.96 35.04 100.00
1987-88 62.57 30.75 93.32 68.96 31.04 100.00
1988-89 63.40 33.62 97.02 65.88 34.12 100.00
1989-90 72.33 23.00 95.33 74.87 25.13 100.00
1990-91 59.15 23.34 82.49 71.45 28.55 100.00
1991-92 59.89 26.71 86.60 67.28 32.72 100.00
1992-93 68.04 26.73 94.76 71.49 28.51 100.00
1993-94 75.61 23.96 99.57 74.57 25.43 100.00
1994-95 81.21 15.15 96.36 78.48 21.52 100.00
1995-96 79.03 16.86 95.90 81.09 18.91 100.00
Original Source: Budget documents and Socio economic review – dirctorate of economics and statistics, Govt. of Gujarat, Gandhinagar. Derived from : Archana Dholakiya – Problems and prospects of fiscal balance in Gujarat – GIDR, GOTA – Dec. 2000.
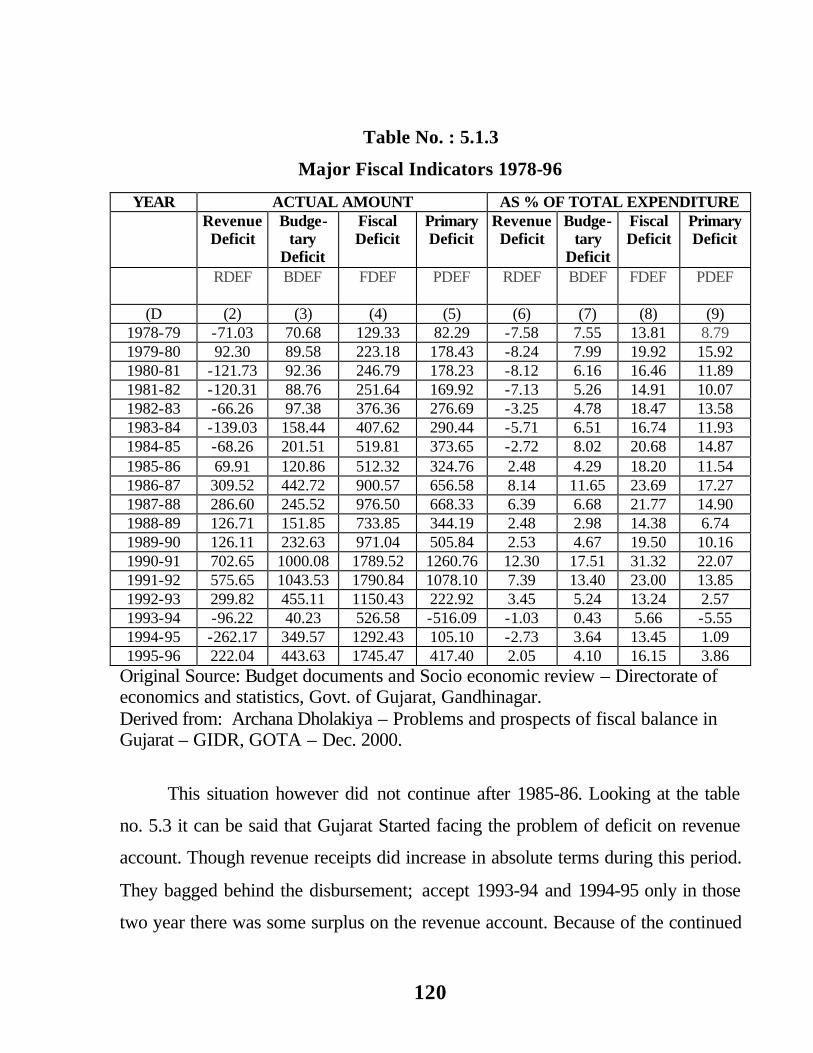
120
Table No. : 5.1.3
Major Fiscal Indicators 1978-96
YEAR ACTUAL AMOUNT AS % OF TOTAL EXPENDITURE
Revenue Deficit
Budge-tary
Deficit
Fiscal Deficit
Primary Deficit
Revenue Deficit
Budge-tary
Deficit
Fiscal Deficit
Primary Deficit
RDEF BDEF FDEF PDEF RDEF BDEF FDEF PDEF
(D (2) (3) (4) (5) (6) (7) (8) (9) 1978-79 -71.03 70.68 129.33 82.29 -7.58 7.55 13.81 8.79 1979-80 92.30 89.58 223.18 178.43 -8.24 7.99 19.92 15.92 1980-81 -121.73 92.36 246.79 178.23 -8.12 6.16 16.46 11.89 1981-82 -120.31 88.76 251.64 169.92 -7.13 5.26 14.91 10.07 1982-83 -66.26 97.38 376.36 276.69 -3.25 4.78 18.47 13.58 1983-84 -139.03 158.44 407.62 290.44 -5.71 6.51 16.74 11.93 1984-85 -68.26 201.51 519.81 373.65 -2.72 8.02 20.68 14.87 1985-86 69.91 120.86 512.32 324.76 2.48 4.29 18.20 11.54 1986-87 309.52 442.72 900.57 656.58 8.14 11.65 23.69 17.27 1987-88 286.60 245.52 976.50 668.33 6.39 6.68 21.77 14.90 1988-89 126.71 151.85 733.85 344.19 2.48 2.98 14.38 6.74 1989-90 126.11 232.63 971.04 505.84 2.53 4.67 19.50 10.16 1990-91 702.65 1000.08 1789.52 1260.76 12.30 17.51 31.32 22.07 1991-92 575.65 1043.53 1790.84 1078.10 7.39 13.40 23.00 13.85 1992-93 299.82 455.11 1150.43 222.92 3.45 5.24 13.24 2.57 1993-94 -96.22 40.23 526.58 -516.09 -1.03 0.43 5.66 -5.55 1994-95 -262.17 349.57 1292.43 105.10 -2.73 3.64 13.45 1.09 1995-96 222.04 443.63 1745.47 417.40 2.05 4.10 16.15 3.86
Original Source: Budget documents and Socio economic review – Directorate of economics and statistics, Govt. of Gujarat, Gandhinagar. Derived from: Archana Dholakiya – Problems and prospects of fiscal balance in Gujarat – GIDR, GOTA – Dec. 2000.
This situation however did not continue after 1985-86. Looking at the table
no. 5.3 it can be said that Gujarat Started facing the problem of deficit on revenue
account. Though revenue receipts did increase in absolute terms during this period.
They bagged behind the disbursement; accept 1993-94 and 1994-95 only in those
two year there was some surplus on the revenue account. Because of the continued

121
deficit in revenue account the state had to divert capital resources to meet
requirement of current consumption this enhanced the burden of interest and debt
payment along with reduction in Capital expenditure.
Incedentely like the centre the state also experienced the verst situation in
the year 1990-91. It was in this year that revenue deficit in nominal terms and as %
of NSDP was the highest during the last twenty years. The amount of Rs. 703
crores and in relation to NSDP it was 3% it was during the same period that
amount of central taxes transferred to the state fell from Rs. 429 crores in the year
1989-90 to Rs. 280 crores in 1990-91. Thus Gujarat high revenue deficit was
largely an out come of the centers reduction in transfers in the similar fashion it
can be argued that the surplus in revenue account during 1993-94 and 1994-95 was
because of adequate or enhanced transfers from the centre.
Budget deficit
A states financial picture can well be highlighted in respect of the difference
between the aggregate Govt. expenditure and aggregate receipts in other words it is
the budget deficit which provides the clear picture of the state economy looking to
the table No. 3 year-to-year functional are found very high in this regard. The year
1990-91 indicated budget deficit as the highest one i.e. 18% of total spending and
4.12% of NSDP incidentely this was also the year to fiscal crisis at the centre. It
also reflects the intern relationship between the instability at the central and the
state level. The table also provide the picture that accept in the year 1990-91 and
1991-92 in remaining all the years the states budget deficit was Moderate one, it is
true that budget deficit does not necessarily reveal all the time the debt finance
deficit, in ordinary course the gap between the revenue capacity and the revenue
requirement is at large field with the borrowing therefore the concept of fiscal
deficit holds more relevance in this regard.

122
Fiscal deficit
Fiscal deficit virtually reflects budget deficit, plans debt, finance deficit.
Generally the state is considered self-sufficient or the wise in relation to fiscal
deficit. Looking at Gujarat State, it is found from the table that the fiscal deficit has
increased in nominal terms from Rs. 129 crores to Rs. 745 crores during 1978 to
1996 in other word it grew at the compound average rate of 21% per year during
1978 to 1984 but this growth rate declined to around 5.2% per annum. If examined
in detail the statistical version indicates the fact that the year 1985-86 was turning
point in terms of enhancing the resource problem of the state, it is important to
note that volume alone of fiscal deficit is not sufficient. It is more important to
analyse the composition of fiscal deficit by purpose this could be known better
through primary deficit.
Primary deficit
Primary deficit is important to understand fiscal consolidation of the state.
Generally the state or the centre incurs fiscal deficit for meeting interest payment
and non-interest payment. When this is subtracted from the fiscal deficit this could
be positive or negative. If primary deficit is zero it means that the state is
borrowing only to meet its capital requirement plus interest liabilities and that
remaining the picture of Gujarat state in this regard indicates the fact that its
magnitude ranged between 2.57 to 7.37% of NSDP during the year 1993-94 it was
negative. Primary surplus on fiscal account implies that revenue receipt of the state
is enough to not only meet with the entire non-interest payment plus a part of
interest payment.

123
5.2 Temporal behavior of Govt. expenditure and income in Gujarat
Generally Govt. expenditure is viewed from two dimensions. One is
functional functional part of govt. expenditure. It is largely based on budget
documents. It is more important from accounting point of view. This refers to the
expenditures recorded under different purpose heads. The other is economic part of
govt. expenditure, the finance department of the state prepares this document to
make the data more meaningful from economic point of view, this largely refers to
the consumption investment capital formation and so on.
Functional part of expenditure is reflected by way of revenue expenditure
and capital expenditure. Economic dimension of govt. expenditure includes current
expenditure and capital expenditure all spending of the Govt. for payment of
interest, subsidy, transfers to household and so on is indicated under consumption
expenditure. It is current expenditure. When Govt. spent on gross capital formation
like expenditure on building machines and transfers to local bodies for capital
formation is reflected as capital expenditure. It is through the data of capital
expenditure that Govt. efforts for building of the physical capital can be known.
Though functional and economic aspect of expenditure may be found overlapping
sometimes both are categorically different.
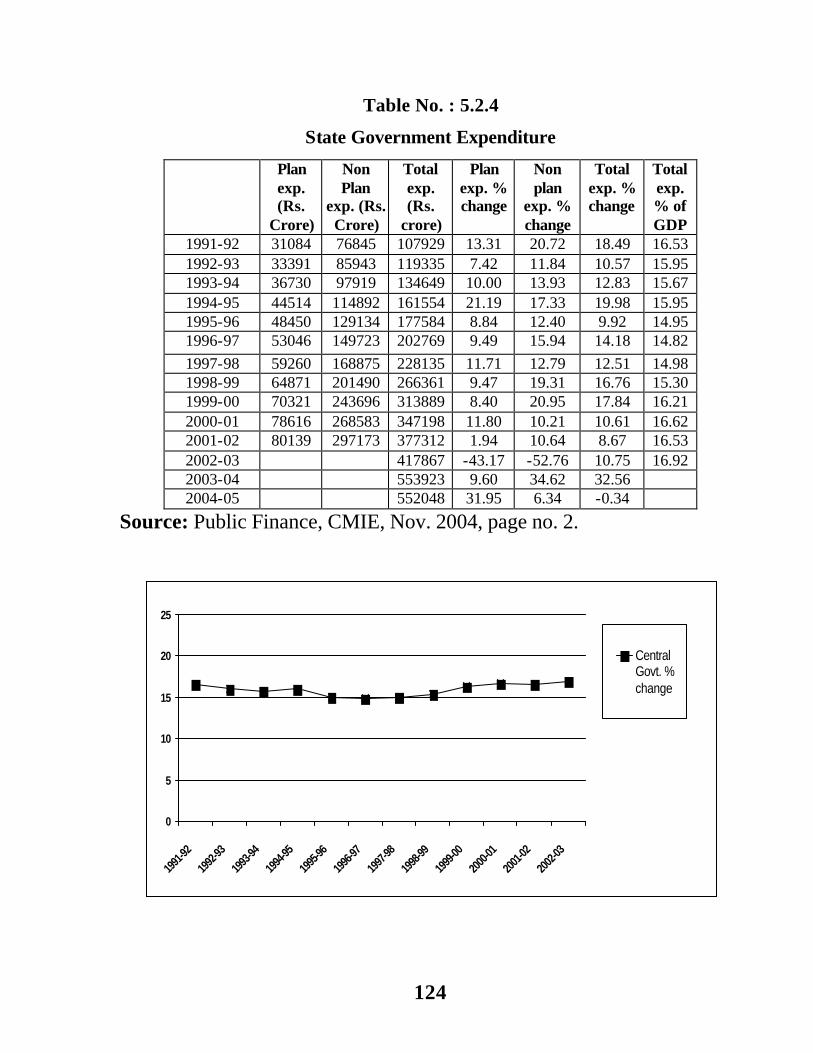
124
Table No. : 5.2.4
State Government Expenditure
Plan exp. (Rs.
Crore)
Non Plan
exp. (Rs. Crore)
Total exp. (Rs.
crore)
Plan exp. % change
Non plan
exp. % change
Total exp. % change
Total exp. % of GDP
1991-92 31084 76845 107929 13.31 20.72 18.49 16.53 1992-93 33391 85943 119335 7.42 11.84 10.57 15.95 1993-94 36730 97919 134649 10.00 13.93 12.83 15.67 1994-95 44514 114892 161554 21.19 17.33 19.98 15.95 1995-96 48450 129134 177584 8.84 12.40 9.92 14.95 1996-97 53046 149723 202769 9.49 15.94 14.18 14.82
1997-98 59260 168875 228135 11.71 12.79 12.51 14.98 1998-99 64871 201490 266361 9.47 19.31 16.76 15.30 1999-00 70321 243696 313889 8.40 20.95 17.84 16.21 2000-01 78616 268583 347198 11.80 10.21 10.61 16.62 2001-02 80139 297173 377312 1.94 10.64 8.67 16.53 2002-03 417867 -43.17 -52.76 10.75 16.92 2003-04 553923 9.60 34.62 32.56 2004-05 552048 31.95 6.34 -0.34
Source: Public Finance, CMIE, Nov. 2004, page no. 2.
0
5
10
15
20
25
1991
-92
1992
-93
1993
-94
1994
-95
1995
-96
1996
-97
1997
-98
1998
-99
1999
-00
2000
-01
2001
-02
2002
-03
CentralGovt. %change
125
This table highlights the total expenditure of all states inclusive of plan
expenditure and non-plan expenditure. It is reflected from the table that percentage
change in plan expenditure shows more unevenness in comparison with percentage
change in non-plan expenditure. Non-plan expenditure reflects positive trend but
the degree of variation is found relatively restricted. Year 2002-03 indicates
considerable downfall in the percentage change both of plan and non-plan
expenditure.
Total expenditure when examined in percentage clearly indicates positive
trend except in the year 2004-05 in which there is a negative trend. Percentage
change in total expenditure is found maximum in the year 2003-04 and minimum
in the year 2001-02. Gape between this two tends to be of 23.89% point.
Tabular presentation along with the graphical one states that total
expenditure as percentage of GDP does not show much deviation between the
references it is found maximum in the year 2002-03 and minimum in the year
1995-96 the gap between the two is of about 1.97% point. It is also clearly
observed that the first half of the reform period indicates less as total expenditure
as percentage of GDP while the same in the second half reflects and increase in
general.

126
Table No. : 5.2.5
Revenue Expenditure - All states Gujarat with Percentage change
over the year
1997-981998-991999-00 2000-012001-022002-032003-042004-05 Average Expenditure
All States 186634 220090 260998 291552 314863 329070 402124 416475 302725.75
33456 40908 30554 23311 14207 73054 14351 Growth over the year in number and percentage
17.93 18.59 11.71 8.00 4.51 22.20 3.57
Gujarat 12143 15606 17517 22041 22718 21440 23607 23786 19857.25
% to all State 6.51 7.09 6.71 7.56 7.22 6.52 5.87 5.71
3463 1911 4524 677 -1278 2167 179 Growth over the year in number and percentage
28.52 12.25 25.83 3.07 -5.63 10.11 0.76
Source: Public Finance, CMIE, Nov. 2004, page no. 96.
-10.00
-5.00
0.00
5.00
10.00
15.00
20.00
25.00
30.00
35.00
1998
-99
1999
-00
2000
-01
2001
-02
2002
-03
2003
-04
2004
-05
All StatesGujarat
Reflects revenue expenditure of Gujarat state ranging from the year 1997-98
to 2004-05. However 2003-04 is revised estimate and 2004-05 is budgetary
estimate. It is reflected from table No.1 that in the year 1997-98 the state revenue
expenditure to the all states revenue expenditure was 6.50% this percentage
increases a little in the next year to 7.09% revenue expenditure of the state in
relation to all states in percentage ratio declined in comparison with the preview
127
year and it was 6.71% in the year 1999-2000. This expenditure in 2000-01 again
went up in percentage ration to 7.55 in the year 2001-02 this ratio is found to have
declined again to 7.21% in 2000 to 2003. It further falls to 6.51%. As per the
revised estimate of 2003-04 this ratio was found still lower to 5.87% and last
budget estimate indicated the lowest ratio through out the study period i.e. 5.71%.
In other world it can be said that during the period of 9th five year plan revenue
expenditure of the state is found to have continuous rise in number of rupees.
However the some period reflected fluctuating trends in term of percentage ratio to
all states. Right from the very beginning of tenth five year plan period % ratio is
found continuously declining though in the last two years expenditure in numbers
is increasing.
Revenue expenditure if examined in terms of temporal different it is found
that in respect of number of rupees every year till 2000 indicated rise over the
previous year. However growth over the previous year in percentage is again found
fluctuating year-by-year. From amongst the study period growth over in revenue
expenditure is found minimum in the last budgetary year that is 2004-05 over the
previous year of 2003-04. It thus expresses the fact that the state has experienced
significant variation in respect of revenue expenditure in terms in physical amount
and percentage ratio.
Growth over the number and percentage in case all states expresses initially
incrasing in the second phase it is found continuously declining trend in increase.
However an exceptional rise is observed in the year 2003-04 (22.20%). However
the budget estimates of 2004-05 indicate falling rate of increase.
This growth over when compare with Gujarat. It is revealed that there is
found greater amount of variations in case of Gujarat as against the states.
Revenue expenditure is found less than the average amount in the year 1997-
98 to 2000-01. While it is found more than that after the year. Similarly in case of
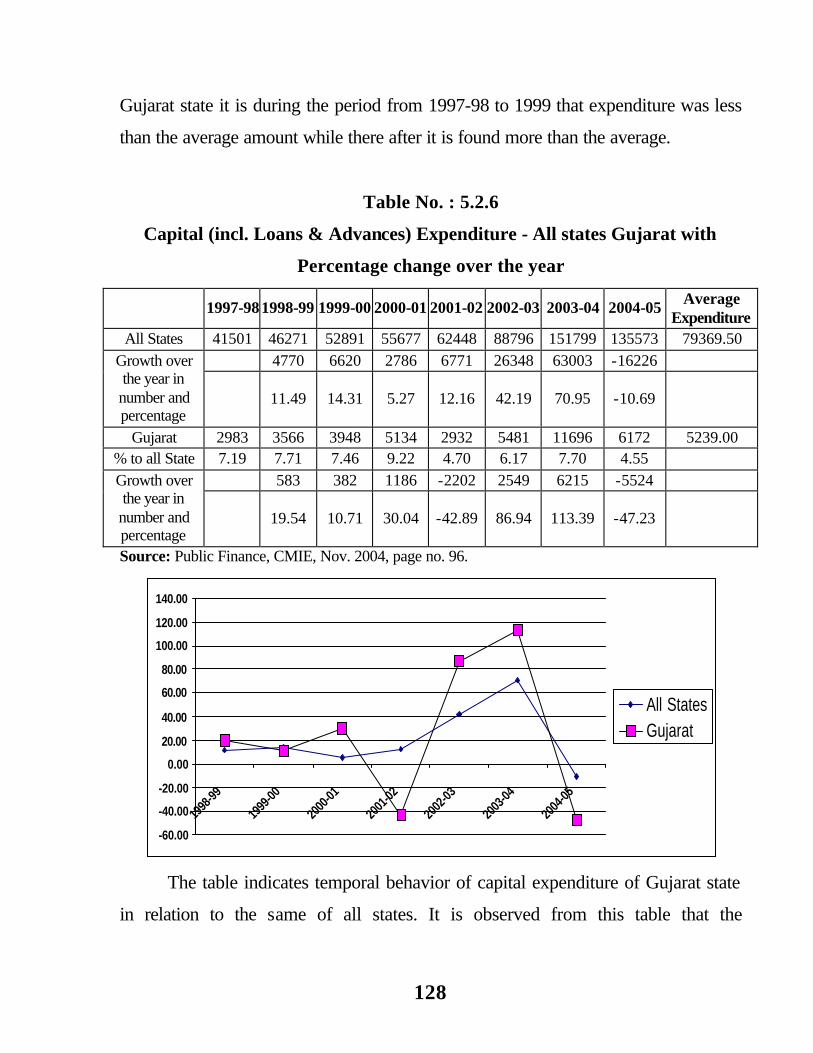
128
Gujarat state it is during the period from 1997-98 to 1999 that expenditure was less
than the average amount while there after it is found more than the average.
Table No. : 5.2.6
Capital (incl. Loans & Advances) Expenditure - All states Gujarat with
Percentage change over the year
1997-981998-99 1999-00 2000-01 2001-02 2002-03 2003-04 2004-05 Average Expenditure
All States 41501 46271 52891 55677 62448 88796 151799 135573 79369.50
4770 6620 2786 6771 26348 63003 -16226 Growth over the year in number and percentage
11.49 14.31 5.27 12.16 42.19 70.95 -10.69
Gujarat 2983 3566 3948 5134 2932 5481 11696 6172 5239.00 % to all State 7.19 7.71 7.46 9.22 4.70 6.17 7.70 4.55
583 382 1186 -2202 2549 6215 -5524 Growth over the year in number and percentage
19.54 10.71 30.04 -42.89 86.94 113.39 -47.23
Source: Public Finance, CMIE, Nov. 2004, page no. 96.
-60.00
-40.00
-20.00
0.00
20.00
40.00
60.00
80.00
100.00
120.00
140.00
1998
-99
1999
-00
2000
-01
2001
-02
2002
-03
2003
-04
2004
-05
All StatesGujarat
The table indicates temporal behavior of capital expenditure of Gujarat state
in relation to the same of all states. It is observed from this table that the
129
percentage ratio of Gujarat to total of all states from within the study period is
found minimum in the year 2001-02 – 4.89% budget estimates it taken in to
consideration than in the last completed financial year of 2004-05. It was minimum
by 4.55% this expenditure in % ratio was found maximum in the year 2000-01 –
9.22%.
Physical amount tends to have increased every year from 1997-98 to 2000-
01. It falls down in 2001-02 again it went up for the consecutive two years.
Capital expenditure growth rate over the previous years suggest that there
has been fluctuating trends in the beginning years of 9th five years plan the first two
year of 10th five year plan reflects rising rate and rising number of rupees. The
table expresses phenomenal rise in the revised estimate of 2003-04 over the
previous year of 2002-03. This trend is found again little falling in the amount
spent in numbers and in percentage.
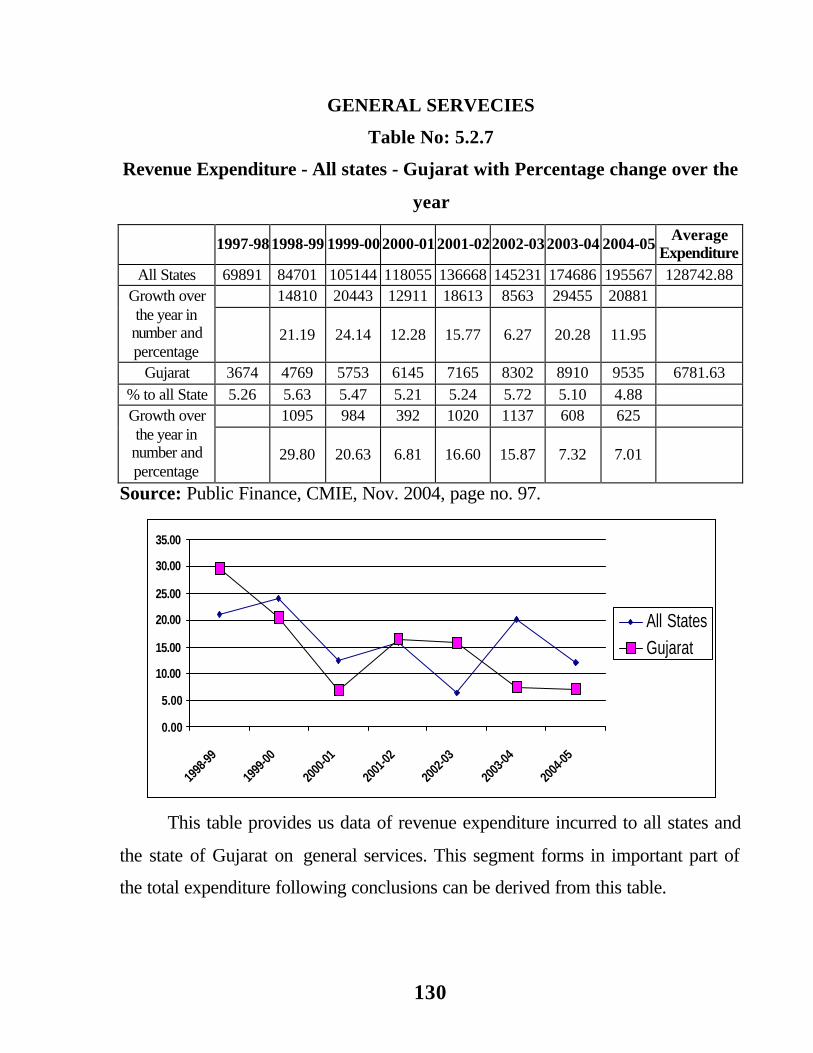
130
GENERAL SERVECIES
Table No: 5.2.7
Revenue Expenditure - All states - Gujarat with Percentage change over the
year
1997-981998-99 1999-002000-012001-022002-032003-04 2004-05 Average Expenditure
All States 69891 84701 105144 118055 136668 145231 174686 195567 128742.88 14810 20443 12911 18613 8563 29455 20881 Growth over
the year in number and percentage
21.19 24.14 12.28 15.77 6.27 20.28 11.95
Gujarat 3674 4769 5753 6145 7165 8302 8910 9535 6781.63
% to all State 5.26 5.63 5.47 5.21 5.24 5.72 5.10 4.88 1095 984 392 1020 1137 608 625 Growth over
the year in number and percentage
29.80 20.63 6.81 16.60 15.87 7.32 7.01
Source: Public Finance, CMIE, Nov. 2004, page no. 97.
0.00
5.00
10.00
15.00
20.00
25.00
30.00
35.00
1998
-99
1999
-00
2000
-01
2001
-02
2002
-03
2003
-04
2004
-05
All StatesGujarat
This table provides us data of revenue expenditure incurred to all states and
the state of Gujarat on general services. This segment forms in important part of
the total expenditure following conclusions can be derived from this table.
131
If temporal behavior of revenue expenditure on general services is
considered than it is reveled from the table that right from first year of the 9th five
year plan in Gujarat state there has been continuous rise in the amount spent for
this trend is similar to the trend of all states. However if percentage ratio of Gujarat
state expenditure in relation to all states is studied it is found that there has been
continuous fluctuations during the years of study fluctuations during the years of
study period percentage ratio of Gujarat to all the states further reveal the fact that
as against the 9th plan period it shows an increase in the same.
Revenue expenditure on general services it examined from the temporal
point of view suggest that there are fluctuating trend found in respect of numbers
of rupees – however this tendency to have rise in revenue expenditure fluctnation
but more importantly declining one right from 1998-99 to 2004-05. Thus revenue
expenditure on general services suggest that significant variations are found in
terms of growth over the pervious year.
Revenue expenditure for general services that of all the states as reflected in
respect of growth over suggests that growth in number is uneven. There is an
increase but that increase does not indicate even trend. In percentage too the some
is reflected pattern of growth over in case of Gujarat State is found more un even
when it is compared with all states.
First four year of all study period i.e. 1997 to 1998 to 2000-01 shows
revenue expenditure both of all the states and Gujarat show the amount less than
the average expenditure while in the last four years expenditure is found more than
the average.
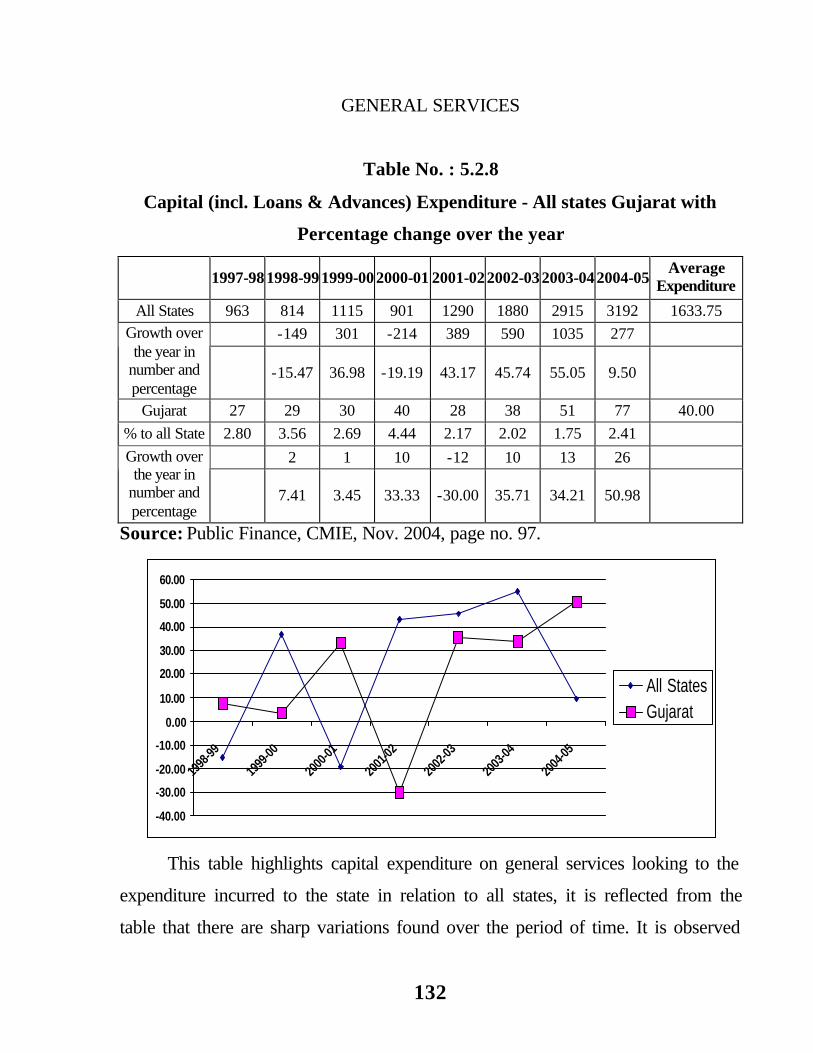
132
GENERAL SERVICES
Table No. : 5.2.8
Capital (incl. Loans & Advances) Expenditure - All states Gujarat with
Percentage change over the year
1997-981998-991999-002000-01 2001-022002-032003-042004-05Average
Expenditure
All States 963 814 1115 901 1290 1880 2915 3192 1633.75
-149 301 -214 389 590 1035 277 Growth over the year in
number and percentage
-15.47 36.98 -19.19 43.17 45.74 55.05 9.50
Gujarat 27 29 30 40 28 38 51 77 40.00
% to all State 2.80 3.56 2.69 4.44 2.17 2.02 1.75 2.41
2 1 10 -12 10 13 26 Growth over the year in
number and percentage
7.41 3.45 33.33 -30.00 35.71 34.21 50.98
Source: Public Finance, CMIE, Nov. 2004, page no. 97.
-40.00
-30.00
-20.00
-10.00
0.00
10.00
20.00
30.00
40.00
50.00
60.00
1998
-99
1999
-00
2000
-01
2001
-02
2002
-03
2003
-04
2004
-05
All StatesGujarat
This table highlights capital expenditure on general services looking to the
expenditure incurred to the state in relation to all states, it is reflected from the
table that there are sharp variations found over the period of time. It is observed

133
that the percentage ratio of expenditure to the total of all states. It found to have
slightly increasing in the beginning of 9th five-year plan period. However the last
year of 9th five-year plan, that is year 2001-02 indicates fall in percentage ration
along with fall in number of rupees. It is important to note that during the some
period expenditure of the all states has increased sizably as against fall in
expenditure incurred to the state. Percentage ratio is continuously found declining
in relation to the aggregate of all states.
From the temporal point of view it is found that growth over the previous
year in respect of capital expenditure is found increasing a little over the previous
year. This growth over in percentage was found maximum in the year 2000-01
33.33% and again in 2002-03. It increased about 35.77% budgetary estimates of
the current financial year 2004-05 indicates growth over the previous revised
estimates of about 50.98%. It is in the year 2001-02 that there is found exceptional
decline of about 30% in growth over the previous year.
Graphical presentation is indicates more negative trend in percentage change
in all states in comparison with Gujarat. Secondly percentage growth is also found
more in case of all states than Gujarat in all the years except 1998-99 and 2004-05.

134
SOCIAL SERVICES
Table No. : 5.2.9
Revenue Expenditure - All states - Gujarat with Percentage change
over the year
1997-981998-991999-002000-01 2001-022002-032003-042004-05 Average Expenditure
All States 68312 82021 96138 104505 107647 109913 128114 132034 103585.50 13709 14117 8367 3142 2266 18201 3920 Growth over
the year in number and percentage
20.07 17.21 8.70 3.01 2.11 16.56 3.06
Gujarat 4240 5437 6229 7716 7722 6539 7109 7011 6500.38 % to all State 6.21 6.63 6.48 7.38 7.17 5.95 5.55 5.31
1197 792 1487 6 -1183 570 -98 Growth over the year in
number and percentage
28.23 14.57 23.87 0.08 -15.32 8.72 -1.38
Source: Public Finance, CMIE, Nov. 2004, page no. 107.
-20.00
-15.00
-10.00
-5.00
0.00
5.00
10.00
15.00
20.00
25.00
30.00
35.00
1998
-99
1999
-00
2000
-01
2001
-02
2002
-03
2003
-04
2004
-05
All StatesGujarat
This table highlights capital expenditure on general services looking to the
expenditure incurred to the state in relation to all states, it is reflected from the
table that there are sharp variations found over the period of time. It is observed
that the percentage ratio of expenditure to the total of all states. It found to have
slightly increasing in the beginning of 9th five-year plan period. However the last

135
year of 9th five-year plan, that is year 2001-02 indicates fall in percentage ration
along with fall in number of rupees. It is important to note that during the some
period expenditure of the all states has increased sizably as against fall in
expenditure incurred to the state. Percentage ratio is continuously found declining
in relation to the aggregate of all states.
From the temporal point of view it is found that growth over the previous
year in respect of capital expenditure is found increasing a little over the previous
year. This growth over in percentage was found maximum in the year 2000-01
33.33% and again in 2002-03. It increased about 35.77% budgetary estimates of
the current financial year 2004-05 indicates growth over the previous revised
estimates of about 50.98%. It is in the year 2001-02 that there is found exceptional
decline of about 30% in growth over the previous year.
Growth over the year in number and percentage of capital expenditure for
general services for all states indicates mixed trends. Twice it is found falling and
in the remaining years it showed an increase and increase in gain found increasing
rate.
It is also found from the table that in the first year expenditure is less than
the average amount while it is found more than the average in the remaining years.
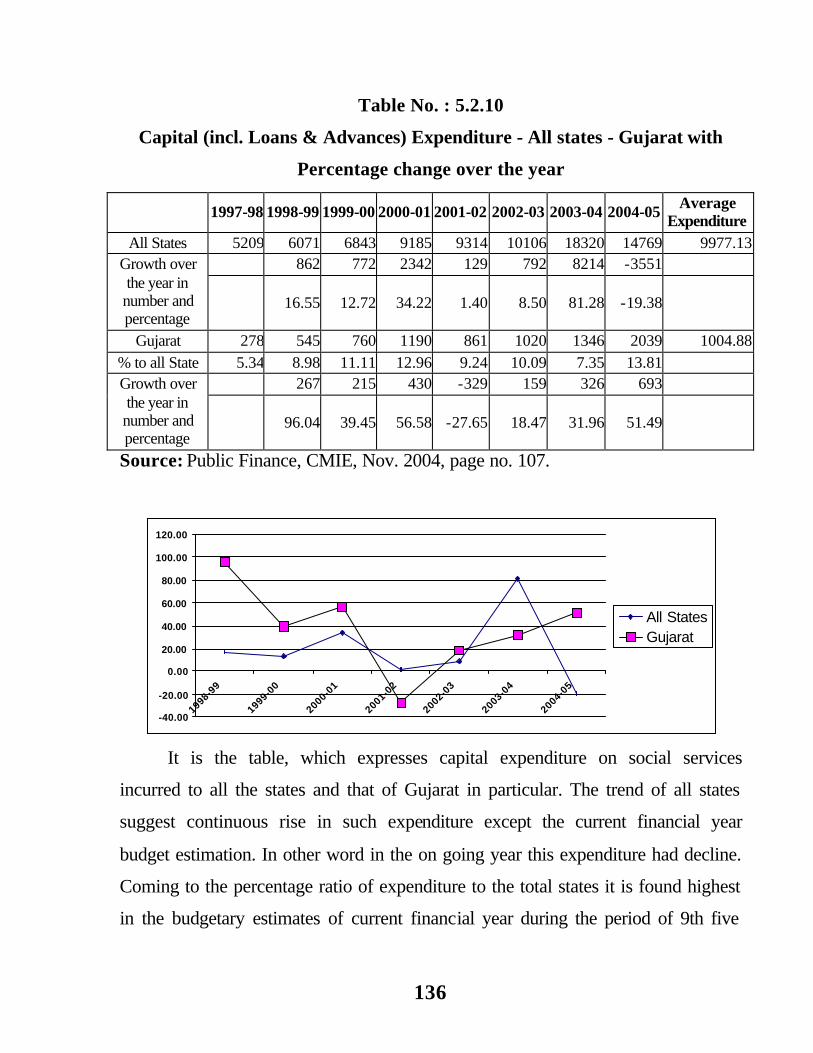
136
Table No. : 5.2.10
Capital (incl. Loans & Advances) Expenditure - All states - Gujarat with
Percentage change over the year
1997-98 1998-99 1999-00 2000-01 2001-02 2002-03 2003-04 2004-05 Average Expenditure
All States 5209 6071 6843 9185 9314 10106 18320 14769 9977.13 862 772 2342 129 792 8214 -3551 Growth over
the year in number and percentage
16.55 12.72 34.22 1.40 8.50 81.28 -19.38
Gujarat 278 545 760 1190 861 1020 1346 2039 1004.88
% to all State 5.34 8.98 11.11 12.96 9.24 10.09 7.35 13.81 267 215 430 -329 159 326 693 Growth over
the year in number and percentage
96.04 39.45 56.58 -27.65 18.47 31.96 51.49
Source: Public Finance, CMIE, Nov. 2004, page no. 107.
-40.00
-20.00
0.00
20.00
40.00
60.00
80.00
100.00
120.00
1998-99
1999-00
2000-01
2001-02
2002-03
2003-04
2004-05
All StatesGujarat
It is the table, which expresses capital expenditure on social services
incurred to all the states and that of Gujarat in particular. The trend of all states
suggest continuous rise in such expenditure except the current financial year
budget estimation. In other word in the on going year this expenditure had decline.
Coming to the percentage ratio of expenditure to the total states it is found highest
in the budgetary estimates of current financial year during the period of 9th five

137
year plan it is found from the table that percentage ratio was maximum during the
year 2000-01. In general it is evidently found that in Gujarat state this expenditure
is found the have constantly increasing.
Examining the time series perspective the year 1998-99 reflects highest
increase in percentage but in the year 2000-01 the expenditure in terms of Rupees
was found maximum it time series data is taken in to consideration at a straight till
this financial year that the physical amount is found to have highest expenditure. In
general time series data reveals uneven trend from the volume and percentage
point of view.
Curvature very clearly reflects that in comparison with all states, growth
over the year in percentage is more positive in case of Gujarat state. Curve below
the X-axis indicates negative trend that is precisely found in the year 2004-05 in
case of all states and in the year 2001-02 in case of Gujarat.
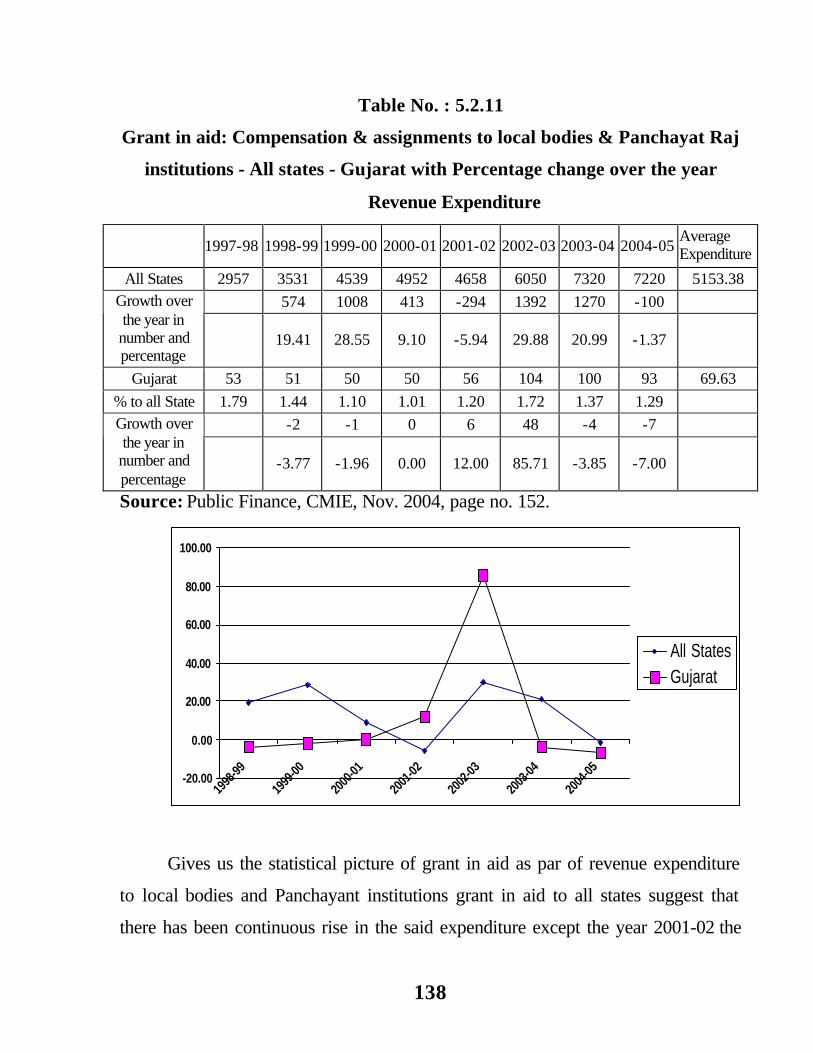
138
Table No. : 5.2.11
Grant in aid: Compensation & assignments to local bodies & Panchayat Raj
institutions - All states - Gujarat with Percentage change over the year
Revenue Expenditure
1997-98 1998-99 1999-00 2000-01 2001-02 2002-03 2003-04 2004-05 Average Expenditure
All States 2957 3531 4539 4952 4658 6050 7320 7220 5153.38
574 1008 413 -294 1392 1270 -100 Growth over the year in number and percentage
19.41 28.55 9.10 -5.94 29.88 20.99 -1.37
Gujarat 53 51 50 50 56 104 100 93 69.63
% to all State 1.79 1.44 1.10 1.01 1.20 1.72 1.37 1.29
-2 -1 0 6 48 -4 -7 Growth over the year in number and percentage
-3.77 -1.96 0.00 12.00 85.71 -3.85 -7.00
Source: Public Finance, CMIE, Nov. 2004, page no. 152.
-20.00
0.00
20.00
40.00
60.00
80.00
100.00
1998
-99
1999
-00
2000
-01
2001
-02
2002
-03
2003
-04
2004
-05
All StatesGujarat
Gives us the statistical picture of grant in aid as par of revenue expenditure
to local bodies and Panchayant institutions grant in aid to all states suggest that
there has been continuous rise in the said expenditure except the year 2001-02 the
139
budget estimates of current financial year also however expresses fall in the
volume against the revised estimates of the previous year.
Percentage ratio of Gujarat to the all states is by and large remained changed
in the restrictive phase all through out the period except in the year 1997-98 this
percentage ratio has remained within the range of 1.0 to 1.5 Volume of grants in
terms of revenue expenditure is found maximum in the year 2002-03 and it was
found minimum in the year 1999-2000 and year 2000-01.
Growth over in terms of revenue expenditure as grant in aid suggest that
there was an exceptional change during the year 2002-03 over the period of 2001-
02 however it is found that the year 2000-01 does not show any change in the
amount and percentage.
All states total in General trend to have rise in the growth over the year
except for the year 2001-02 and budget estimates of 2004-05. Growth over in
percentage for all states also reflects the same trend. This also shows quite contrary
the trend against that is observed in case of Gujarat state.
Graph regarding the granting aid to the local bodies demonstrate the very
fact that in comparison with all states the performance of Gujarat is very poor
except for the year 2002-03.
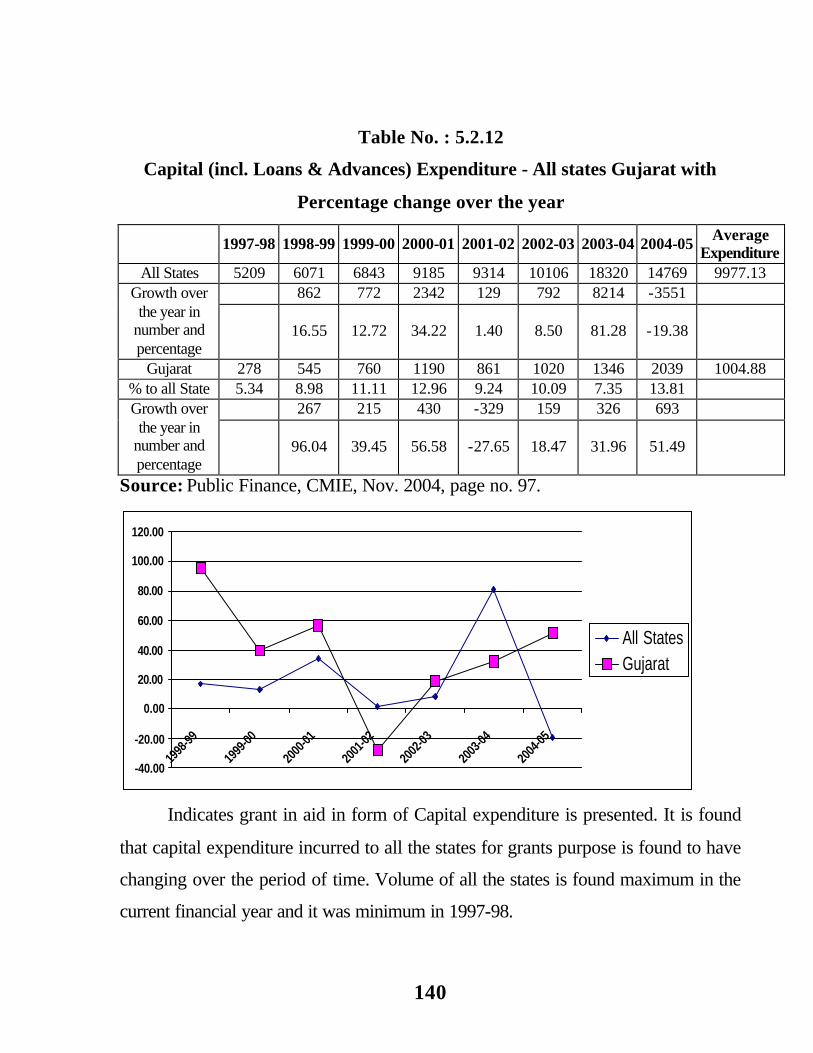
140
Table No. : 5.2.12
Capital (incl. Loans & Advances) Expenditure - All states Gujarat with
Percentage change over the year
1997-98 1998-99 1999-00 2000-01 2001-02 2002-03 2003-04 2004-05 Average Expenditure
All States 5209 6071 6843 9185 9314 10106 18320 14769 9977.13 862 772 2342 129 792 8214 -3551 Growth over
the year in number and percentage
16.55 12.72 34.22 1.40 8.50 81.28 -19.38
Gujarat 278 545 760 1190 861 1020 1346 2039 1004.88 % to all State 5.34 8.98 11.11 12.96 9.24 10.09 7.35 13.81
267 215 430 -329 159 326 693 Growth over the year in
number and percentage
96.04 39.45 56.58 -27.65 18.47 31.96 51.49
Source: Public Finance, CMIE, Nov. 2004, page no. 97.
-40.00
-20.00
0.00
20.00
40.00
60.00
80.00
100.00
120.00
1998
-99
1999
-00
2000
-01
2001
-02
2002
-03
2003
-04
2004
-05
All StatesGujarat
Indicates grant in aid in form of Capital expenditure is presented. It is found
that capital expenditure incurred to all the states for grants purpose is found to have
changing over the period of time. Volume of all the states is found maximum in the
current financial year and it was minimum in 1997-98.

141
For Gujarat the picture revealed from the table also expresses fluctuations.
However this trend is found linear right from the year 1998-99. Percentage ratio in
relation to all states was exceptionally high in the year 1997-98 that is 28.53% in
all the year that ratio is found very limited in comparison with the first year of
study.
The trends available from the temporal point of view declining one only in
the year 1998-99 were it has fallen sizably over the previous year. However the
trend there after suggests that there is an increase in growth over the previous year.
This growth over in percentage is however found uneven. It is the revised estimate
of 2003-04 that growth over in comparison with the other year is found more. This
table particularly the state part also expresses uneven rate of increase.
All states capital expenditure growth trend however reflects more growth in
physical amount but less growth in terms of percentage in comparison with Gujarat
state.
Graphical presentation clearly reflect more sound picture of the state in
comparison with all states and it also reflects better position of Gujarat to all states
unlike that of revenue part of Grant in aid.

142
Table No. : 5.2.13
Discharge of Internal Debt
Capital (incl. Loans & Advances) Expenditure - All states Gujarat with
Percentage change over the year
1997-98 1998-99 1999-00 2000-01 2001-02 2002-03 2003-04 2004-05 Average
Expenditure All States 1048 2567 2666 2246 4190 10546 14332 19056 7081.38
1519 99 -420 1944 6356 3786 4724 Growth over the year in number and percentage
144.94 3.86 -15.75 86.55 151.69 35.90 32.96
Gujarat 299 97 125 136 205 284 451 526 265.38
% to all State 28.53 3.78 4.69 6.06 4.89 2.69 3.15 2.76 -202 28 11 69 79 167 75 Growth over
the year in number and percentage
-67.56 28.87 8.80 50.74 38.54 58.80 16.63
Source: Public Finance, CMIE, Nov. 2004, page no. 153..
-100.00
-50.00
0.00
50.00
100.00
150.00
200.00
1998
-99
1999
-00
2000
-01
2001
-02
2002
-03
2003
-04
2004
-05
All StatesGujarat
Growth over in number and percentage of loans and advances for all the
states indicate sharp variations. Except the year 2000-01, it is found increasing but
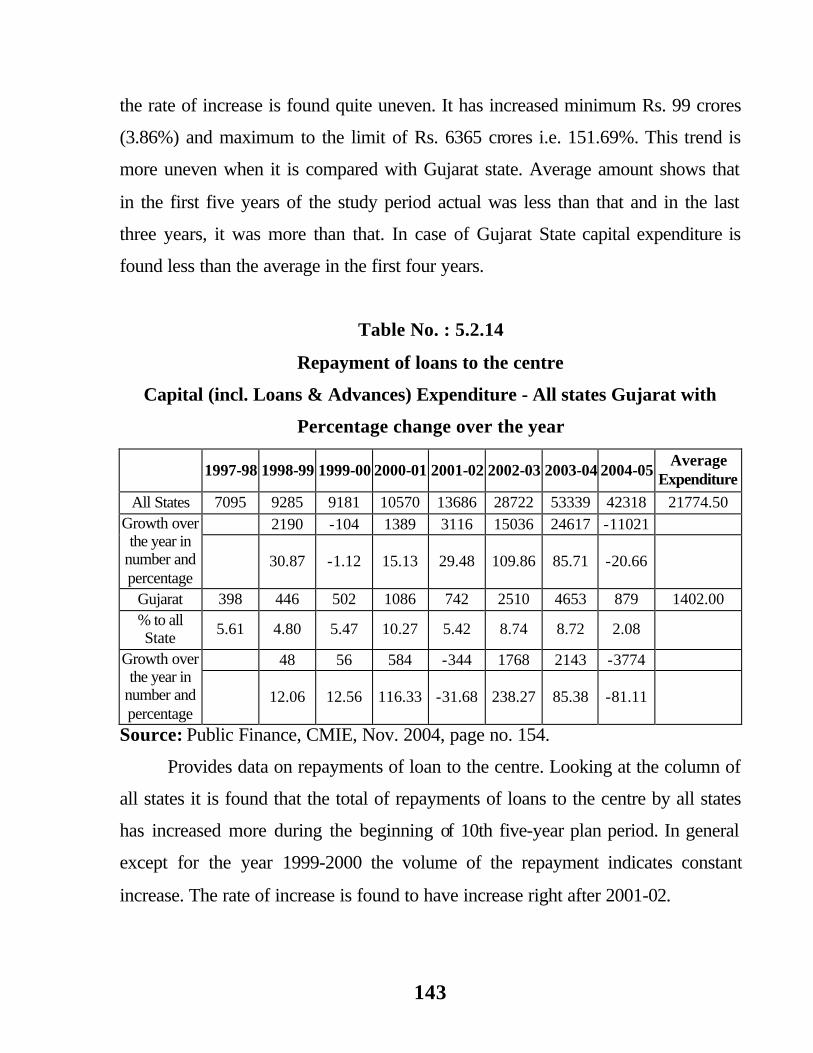
143
the rate of increase is found quite uneven. It has increased minimum Rs. 99 crores
(3.86%) and maximum to the limit of Rs. 6365 crores i.e. 151.69%. This trend is
more uneven when it is compared with Gujarat state. Average amount shows that
in the first five years of the study period actual was less than that and in the last
three years, it was more than that. In case of Gujarat State capital expenditure is
found less than the average in the first four years.
Table No. : 5.2.14
Repayment of loans to the centre
Capital (incl. Loans & Advances) Expenditure - All states Gujarat with
Percentage change over the year
1997-98 1998-99 1999-00 2000-01 2001-02 2002-03 2003-04 2004-05 Average
Expenditure All States 7095 9285 9181 10570 13686 28722 53339 42318 21774.50
2190 -104 1389 3116 15036 24617 -11021 Growth over the year in
number and percentage
30.87 -1.12 15.13 29.48 109.86 85.71 -20.66
Gujarat 398 446 502 1086 742 2510 4653 879 1402.00 % to all State
5.61 4.80 5.47 10.27 5.42 8.74 8.72 2.08
48 56 584 -344 1768 2143 -3774 Growth over the year in
number and percentage
12.06 12.56 116.33 -31.68 238.27 85.38 -81.11
Source: Public Finance, CMIE, Nov. 2004, page no. 154.
Provides data on repayments of loan to the centre. Looking at the column of
all states it is found that the total of repayments of loans to the centre by all states
has increased more during the beginning of 10th five-year plan period. In general
except for the year 1999-2000 the volume of the repayment indicates constant
increase. The rate of increase is found to have increase right after 2001-02.
144
Coming to Gujarat State, trend is found more or less similar except for the
year 2001. Percentage ratio of the repayment of loans to the total of all sates
express fluctuations over the years. From the percentage point of view it is found
highest in the year 2000-01 and budget estimate of the current financial year
indicates minimum percent ratio. In terms of physical amount the revenue estimate
of 2003-04 indicates maximum amount.
Looking at the state picture from the percentage growth over the years that
difference is found maximum in the year 2002-03 over the previous year of 2001-
02. While 2001-02 and budget estimate of the current financial year indicate minus
rate of percentage growth on the previous years thus regarding repayment of loans
to the centre it is revealed from the table that there is found significant amount of
variation over the period of time.
Repayment of loans to the center made by all the States indicates variations
in growth over the years. This variation shows more positive and negative only in
two years. Positive variation rate is found maximum in amount in the revised
estimate of 2003-04 i.e. Rs. 24617 crores and in percentage in 2002-03 109.86%.
This variation in growth is however found less in comparison with Gujarat state. It
is reflected from the table that in case of Gujarat maximum growth in amount is
found in 2003-04 revised estimate of Rs. 2143 crores but in percentage it is
observed 238.27% in the year 2002-03.
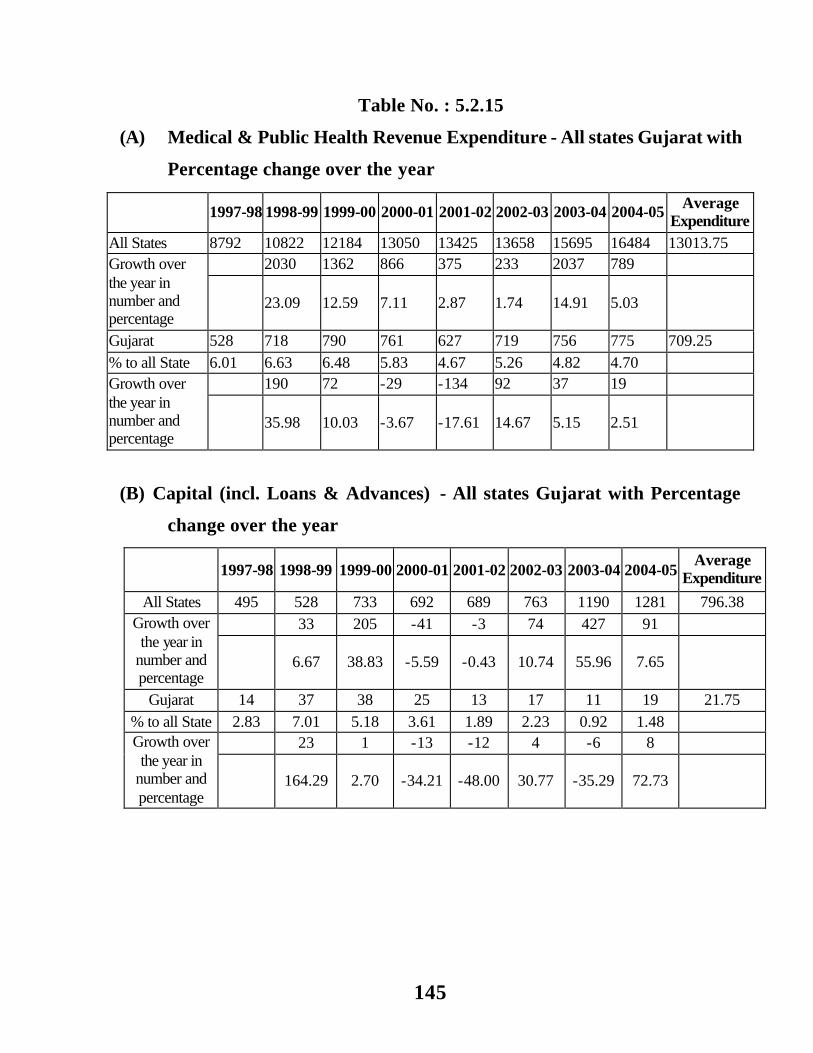
145
Table No. : 5.2.15
(A) Medical & Public Health Revenue Expenditure - All states Gujarat with
Percentage change over the year
1997-98 1998-99 1999-00 2000-01 2001-02 2002-03 2003-04 2004-05 Average Expenditure
All States 8792 10822 12184 13050 13425 13658 15695 16484 13013.75 2030 1362 866 375 233 2037 789 Growth over
the year in number and percentage
23.09 12.59 7.11 2.87 1.74 14.91 5.03
Gujarat 528 718 790 761 627 719 756 775 709.25
% to all State 6.01 6.63 6.48 5.83 4.67 5.26 4.82 4.70 190 72 -29 -134 92 37 19 Growth over
the year in number and percentage
35.98 10.03 -3.67 -17.61 14.67 5.15 2.51
(B) Capital (incl. Loans & Advances) - All states Gujarat with Percentage
change over the year
1997-98 1998-99 1999-00 2000-01 2001-02 2002-03 2003-04 2004-05 Average
Expenditure
All States 495 528 733 692 689 763 1190 1281 796.38
33 205 -41 -3 74 427 91 Growth over the year in
number and percentage
6.67 38.83 -5.59 -0.43 10.74 55.96 7.65
Gujarat 14 37 38 25 13 17 11 19 21.75
% to all State 2.83 7.01 5.18 3.61 1.89 2.23 0.92 1.48 23 1 -13 -12 4 -6 8 Growth over
the year in number and percentage
164.29 2.70 -34.21 -48.00 30.77 -35.29 72.73

146
(C) Total Expenditure medical and public health All states Gujarat with
percentage change over the year
1997-98 1998-99 1999-00 2000-01 2001-02 2002-03 2003-04 2004-05
Average Expenditure
All States 9287 11350 12917 13742 14114 14421 16885 17765 13810.13
2063 1567 825 372 307 2464 880 Growth over the year in number and percentage
22.21 13.81 6.39 2.71 2.18 17.09 5.21
Gujarat 542 755 828 786 640 736 767 794 731.00
% to all State 5.8361 6.652 6.4102 5.7197 4.5345 5.1037 4.5425 4.4695
213 73 -42 -146 96 31 27 Growth over the year in number and percentage
39.30 9.67 -5.07 -18.58 15.00 4.21 3.52
Source: Public Finance, CMIE, Nov. 2004, page no. 113.
-30.00
-20.00
-10.00
0.00
10.00
20.00
30.00
40.00
50.00
1998
-99
1999
-00
2000
-01
2001
-02
2002
-03
2003
-04
2004
-05
All StatesGujarat
It is evidently found that in respect of medical and public health much is
spent on revenue part and very little is spent on capital account. Gujarat state has
spent much less to the total of all states. This clearly reflected from the percentage
spent to all states as capital expenditure in relation to account expenditure.
Growth trend reflects sharp variations in terms of physical amount and in
percentage. This variation is found more on revenue part than on capital. Also it is
147
observed that in Gujarat State growth over the year is excessively more in case of
Revenue expenditure.
For all states revenue expenditure is more than the average in the last five
years while it is less than that in the first three years.
In case Gujarat too it is found in the year 2001-02 it was less than the
average that only in the year 1997-98 and total expenditure for health and medical
indicators that in all states minimum growth rate is reported in the year 2002-03
i.e. 2.18% and maximum in 1997-98 i.e. of 22.21%. While this in case of Gujarat
is found minimum in 2001-02 negative i.e. -18.58% and maximum in 1997-98 and
38.30%.
Looking to the average of total expenditure in respect of all states it is less
than average amount in the first four years while in Gujarat only first year (1997-
98) is the year in which it shows less than the average amount.
As reflected in the curvature the trend in respect of all state total expenditure
is found linier with variations in the degree, while in case of Gujarat state the
degree of variation is found more with indicating negative trend in the year 2000-
01 and 2001-02 respectively.
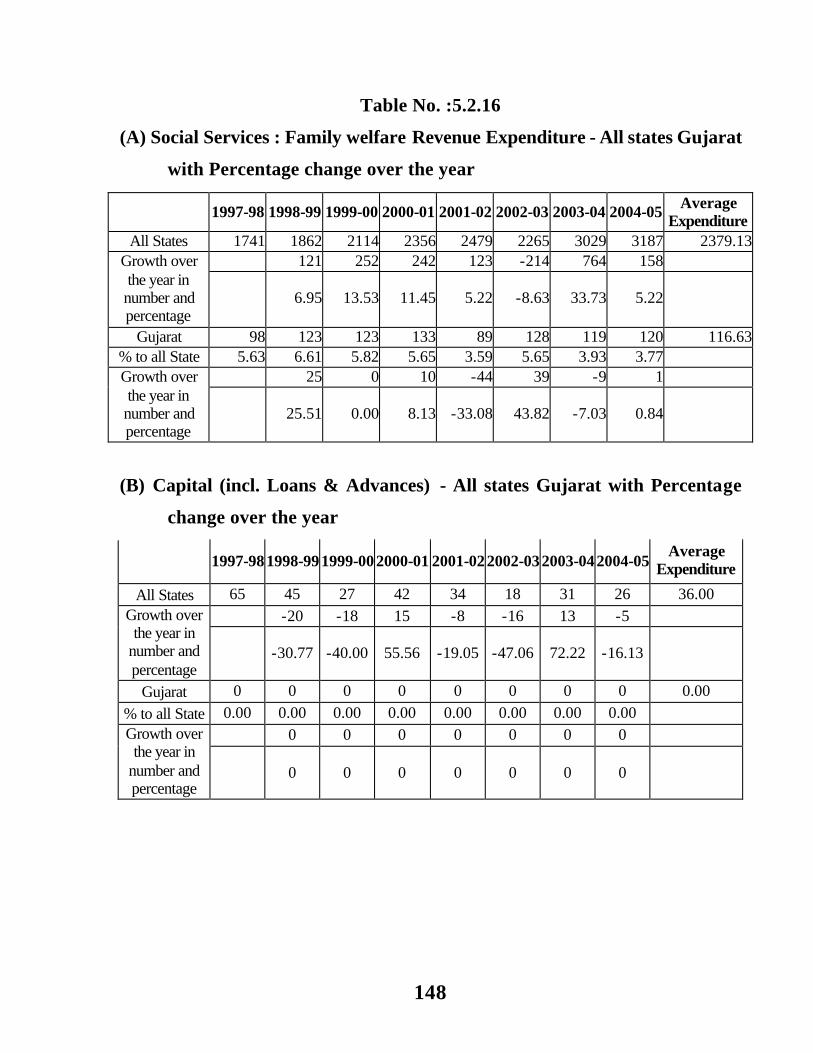
148
Table No. :5.2.16
(A) Social Services : Family welfare Revenue Expenditure - All states Gujarat
with Percentage change over the year
1997-98 1998-99 1999-00 2000-01 2001-02 2002-03 2003-04 2004-05 Average Expenditure
All States 1741 1862 2114 2356 2479 2265 3029 3187 2379.13 121 252 242 123 -214 764 158 Growth over
the year in number and percentage
6.95 13.53 11.45 5.22 -8.63 33.73 5.22
Gujarat 98 123 123 133 89 128 119 120 116.63% to all State 5.63 6.61 5.82 5.65 3.59 5.65 3.93 3.77
25 0 10 -44 39 -9 1 Growth over the year in number and percentage
25.51 0.00 8.13 -33.08 43.82 -7.03 0.84
(B) Capital (incl. Loans & Advances) - All states Gujarat with Percentage
change over the year
1997-981998-991999-002000-01 2001-022002-032003-042004-05
Average Expenditure
All States 65 45 27 42 34 18 31 26 36.00
-20 -18 15 -8 -16 13 -5 Growth over the year in
number and percentage
-30.77 -40.00 55.56 -19.05 -47.06 72.22 -16.13
Gujarat 0 0 0 0 0 0 0 0 0.00
% to all State 0.00 0.00 0.00 0.00 0.00 0.00 0.00 0.00
0 0 0 0 0 0 0 Growth over the year in
number and percentage
0 0 0 0 0 0 0

149
(C) Total Expenditure family welfare All states Gujarat with percentage
change over the year
1997-98 1998-99 1999-00 2000-01 2001-02 2002-03 2003-04 2004-05 Average Expenditure
All States 1806 1907 2141 2398 2513 2283 3060 3213 2415.13 101 234 257 115 -230 777 153 Growth over
the year in number and percentage
5.59 12.27 12.00 4.80 -9.15 34.03 5.00
Gujarat 98 123 123 133 89 128 119 120 116.63 % to all State 5.42636 6.44992 5.74498 5.54629 3.54158 5.60666 3.88889 3.73483
25 0 10 -44 39 -9 1 Growth over the year in
number and percentage
25.51 0.00 8.13 -33.08 43.82 -7.03 0.84
Source: Public Finance, CMIE, Nov. 2004, page no. 114.
This table highlights data on expenditure welfare revenue expenditure for
family welfare is found proportionately more than capital expenditure. In the last 8
years capital expenditure is not incurred to Gujarat state.
Revenue expenditure trend of all states show positive growth except for the
year 2002-03. The remaining years show rising trend through with variation in the
degree. Revenue expenditure increase to Gujarat State for family welfare does not
indicate more positive growth at least 4 times during the span.
Capital expenditure for all states show very little positive variations out of 8
years revenue expenditure at all states tend to shows more then the average for 3
years while in Gujarat growth over trend shows large decline.
Total expenditure family welfare suggest an increasing trend more in case of
all states than that in case of Gujarat.

150
Table No. : 5.2.17
Water supply and sanitation
(A) Revenue Expenditure - All states Gujarat with Percentage change over
the year
1997-981998-991999-002000-01 2001-022002-032003-042004-05 Average Expenditure
All States 4574 5278 5408 5463 5579 5473 6799 7303 5734.63
704 130 55 116 -106 1326 504 Growth over the year in
number and percentage
15.39 2.46 1.02 2.12 -1.90 24.23 7.41
Gujarat 160 193 194 187 135 185 225 206 185.63
% to all State 3.50 3.66 3.59 3.42 2.42 3.38 3.31 2.82
33 1 -7 -52 50 40 -19 Growth over the year in
number and percentage
20.63 0.52 -3.61 -27.81 37.04 21.62 -8.44
(B) Capital (incl. Loans & Advances) - All states Gujarat with Percentage
change over the year
1997-98 1998-99 1999-00 2000-01 2001-02 2002-03 2003-04 2004-05 Average
Expenditure All States 1117 1688 1822 3069 2686 4690 5098 5892 3257.75
571 134 1247 -383 2004 408 794 Growth over the year in number and percentage 51.12 7.94 68.44 -12.48 74.61 8.70 15.57
Gujarat 130 313 477 916 195 372 381 699 435.38 % to all State 11.64 18.54 26.18 29.85 7.26 7.93 7.47 11.86
183 164 439 -721 177 9 318 Growth over the year in number and percentage 140.77 52.40 92.03 -78.71 90.77 2.42 83.46

151
(C) Total Expenditure Water Supply and Sanitation All states Gujarat with
percengtage change over the year
1997-98 1998-99 1999-00 2000-01 2001-02 2002-03 2003-04 2004-05 Average Expenditure
All States 5691 6966 7230 8532 8265 10163 11897 13195 8992.38 1275 264 1302 -267 1898 1734 1298 Growth over
the year in number and percentage
22.40 3.79 18.01 -3.13 22.96 17.06 10.91
Gujarat 290 506 671 1103 330 557 606 905 621.00 % to all State
5.09577 7.26385 9.28077 12.9278 3.99274 5.48067 5.09372 6.85866
216 165 432 -773 227 49 299 Growth over the year in
number and percentage
74.48 32.61 64.38 -70.08 68.79 8.80 49.34
Source: Public Finance, CMIE, Nov. 2004, page no. 115.
-80.00
-60.00
-40.00
-20.00
0.00
20.00
40.00
60.00
80.00
100.00
1998
-99
1999
-00
2000
-01
2001
-02
2002
-03
2003
-04
2004
-05
All StatesGujarat
It is the sector where identically the expenditure is prop ornately found more
than other heads for capital account. Revenue expenditure incurred by all states
indicates little variations in the growth. Minimum being -1.92% in the year 2000-
01 and maximum in the revised estimates of 2003-04 the revised estimates of
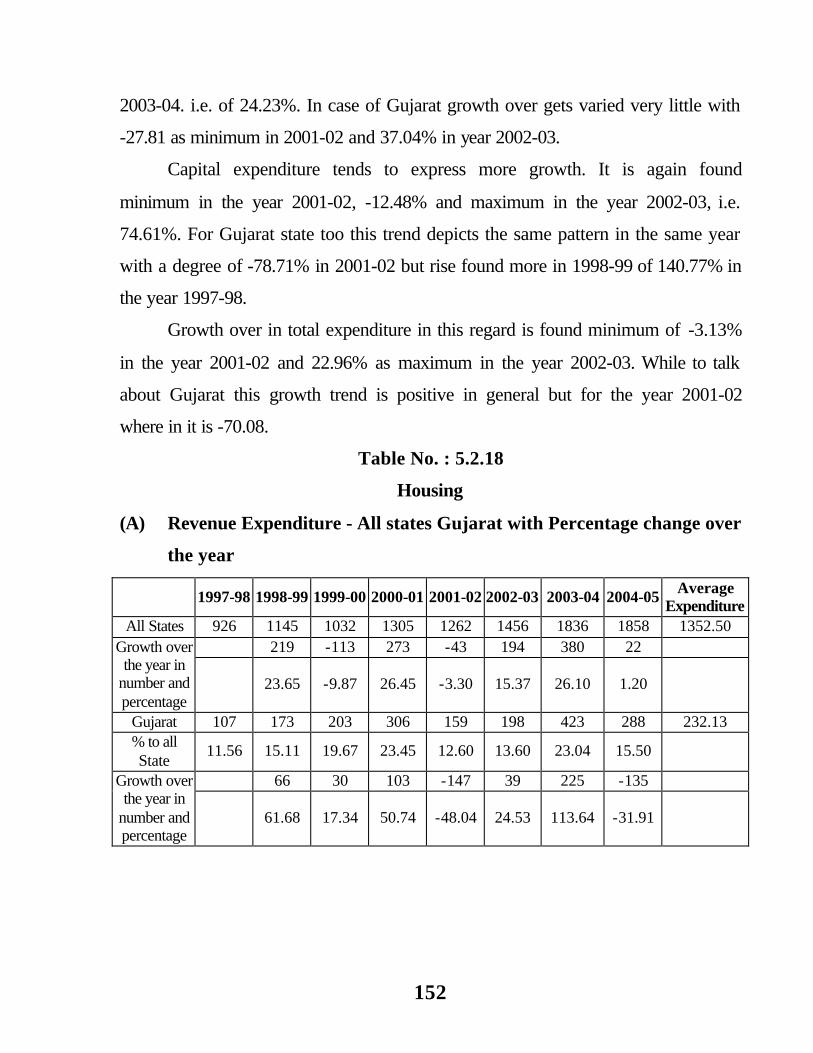
152
2003-04. i.e. of 24.23%. In case of Gujarat growth over gets varied very little with
-27.81 as minimum in 2001-02 and 37.04% in year 2002-03.
Capital expenditure tends to express more growth. It is again found
minimum in the year 2001-02, -12.48% and maximum in the year 2002-03, i.e.
74.61%. For Gujarat state too this trend depicts the same pattern in the same year
with a degree of -78.71% in 2001-02 but rise found more in 1998-99 of 140.77% in
the year 1997-98.
Growth over in total expenditure in this regard is found minimum of -3.13%
in the year 2001-02 and 22.96% as maximum in the year 2002-03. While to talk
about Gujarat this growth trend is positive in general but for the year 2001-02
where in it is -70.08.
Table No. : 5.2.18
Housing
(A) Revenue Expenditure - All states Gujarat with Percentage change over
the year
1997-98 1998-99 1999-00 2000-01 2001-02 2002-03 2003-04 2004-05 Average
Expenditure All States 926 1145 1032 1305 1262 1456 1836 1858 1352.50
219 -113 273 -43 194 380 22 Growth over the year in
number and percentage
23.65 -9.87 26.45 -3.30 15.37 26.10 1.20
Gujarat 107 173 203 306 159 198 423 288 232.13 % to all State
11.56 15.11 19.67 23.45 12.60 13.60 23.04 15.50
66 30 103 -147 39 225 -135 Growth over the year in
number and percentage
61.68 17.34 50.74 -48.04 24.53 113.64 -31.91
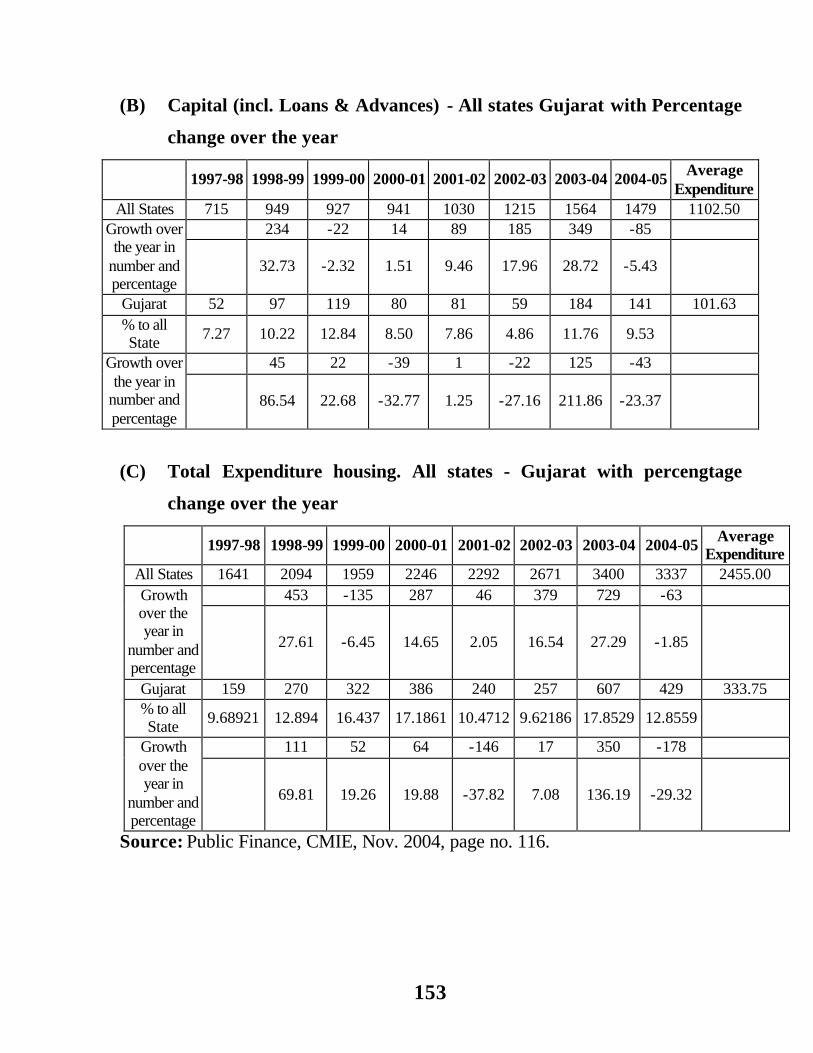
153
(B) Capital (incl. Loans & Advances) - All states Gujarat with Percentage
change over the year
1997-98 1998-99 1999-00 2000-01 2001-02 2002-03 2003-04 2004-05 Average Expenditure
All States 715 949 927 941 1030 1215 1564 1479 1102.50 234 -22 14 89 185 349 -85 Growth over
the year in number and percentage
32.73 -2.32 1.51 9.46 17.96 28.72 -5.43
Gujarat 52 97 119 80 81 59 184 141 101.63 % to all State
7.27 10.22 12.84 8.50 7.86 4.86 11.76 9.53
45 22 -39 1 -22 125 -43 Growth over the year in
number and percentage
86.54 22.68 -32.77 1.25 -27.16 211.86 -23.37
(C) Total Expenditure housing. All states - Gujarat with percengtage
change over the year
1997-98 1998-99 1999-00 2000-01 2001-02 2002-03 2003-04 2004-05 Average Expenditure
All States 1641 2094 1959 2246 2292 2671 3400 3337 2455.00 453 -135 287 46 379 729 -63 Growth
over the year in
number and percentage
27.61 -6.45 14.65 2.05 16.54 27.29 -1.85
Gujarat 159 270 322 386 240 257 607 429 333.75 % to all State
9.68921 12.894 16.437 17.1861 10.4712 9.62186 17.8529 12.8559
111 52 64 -146 17 350 -178 Growth over the year in
number and percentage
69.81 19.26 19.88 -37.82 7.08 136.19 -29.32
Source: Public Finance, CMIE, Nov. 2004, page no. 116.
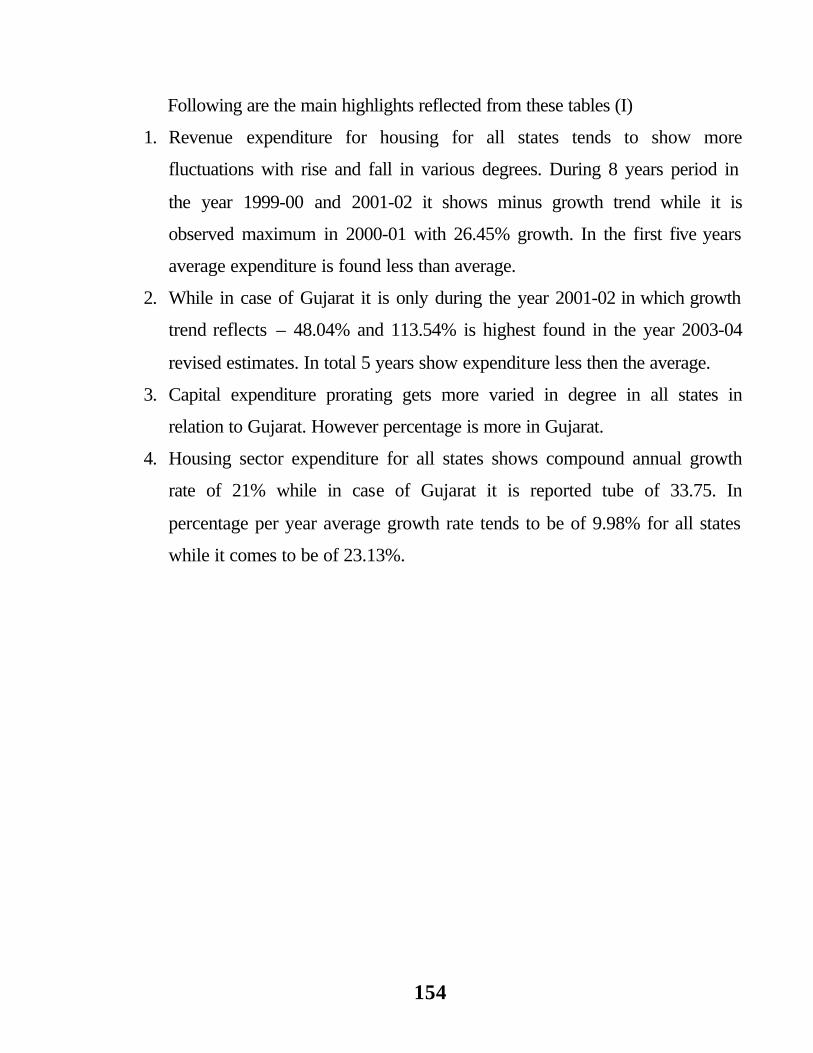
154
Following are the main highlights reflected from these tables (I)
1. Revenue expenditure for housing for all states tends to show more
fluctuations with rise and fall in various degrees. During 8 years period in
the year 1999-00 and 2001-02 it shows minus growth trend while it is
observed maximum in 2000-01 with 26.45% growth. In the first five years
average expenditure is found less than average.
2. While in case of Gujarat it is only during the year 2001-02 in which growth
trend reflects – 48.04% and 113.54% is highest found in the year 2003-04
revised estimates. In total 5 years show expenditure less then the average.
3. Capital expenditure prorating gets more varied in degree in all states in
relation to Gujarat. However percentage is more in Gujarat.
4. Housing sector expenditure for all states shows compound annual growth
rate of 21% while in case of Gujarat it is reported tube of 33.75. In
percentage per year average growth rate tends to be of 9.98% for all states
while it comes to be of 23.13%.

155
Table No. : 5.2.19
Urban development
(A) Revenue Expenditure - All states Gujarat with Percentage change over
the year
1997-98 1998-99 1999-00 2000-01 2001-02 2002-03 2003-04 2004-05 Average Expenditure
All States 2013 2515 3052 3078 3678 4054 5386 4845 3577.63 502 537 26 600 376 1332 -541 Growth over
the year in number and percentage
24.94 21.35 0.85 19.49 10.22 32.86 -10.04
Gujarat 129 178 233 207 213 317 399 348 253.00 % to all State 6.41 7.08 7.63 6.73 5.79 7.82 7.41 7.18
49 55 -26 6 104 82 -51 Growth over the year in number and percentage
37.98 30.90 -11.16 2.90 48.83 25.87 -12.78
(B) Capital (incl. Loans & Advances) - All states Gujarat with Percentage
change over the year
1997-
98 1998-99 1999-00 2000-01 2001-02 2002-03 2003-04 2004-05
Average Expenditure
All States 227 48 182 557 311 1279 2493 2263 920.00 -179 134 375 -246 968 1214 -230 Growth over
the year in number and percentage
-78.85 279.17 206.04 -44.17 311.25 94.92 -9.23
Gujarat -2 13 18 16 13 12 24 23 14.63 % to all State -0.88 27.08 9.89 2.87 4.18 0.94 0.96 1.02
15 5 -2 -3 -1 12 -1 Growth over the year in number and percentage
-750.00 38.46 -11.11 -18.75 -7.69 100.00 -4.17
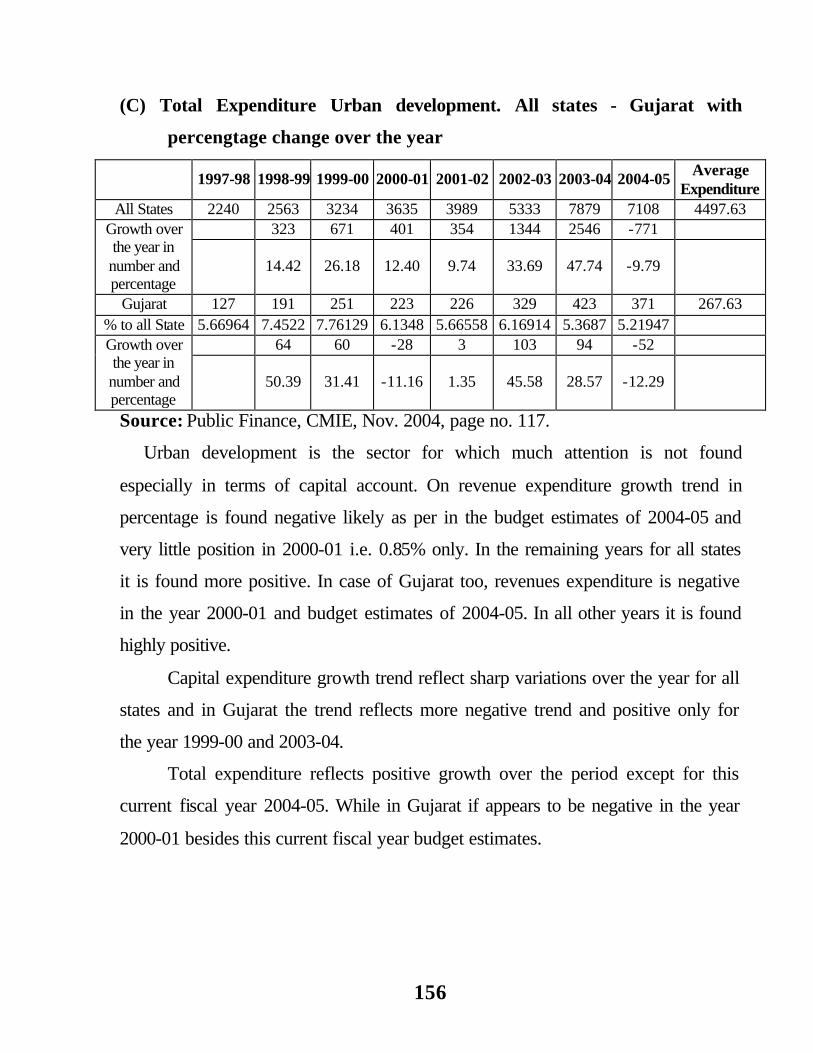
156
(C) Total Expenditure Urban development. All states - Gujarat with
percengtage change over the year
1997-98 1998-99 1999-00 2000-01 2001-02 2002-03 2003-04 2004-05 Average Expenditure
All States 2240 2563 3234 3635 3989 5333 7879 7108 4497.63 323 671 401 354 1344 2546 -771 Growth over
the year in number and percentage
14.42 26.18 12.40 9.74 33.69 47.74 -9.79
Gujarat 127 191 251 223 226 329 423 371 267.63 % to all State 5.66964 7.4522 7.76129 6.1348 5.66558 6.16914 5.3687 5.21947
64 60 -28 3 103 94 -52 Growth over the year in number and percentage
50.39 31.41 -11.16 1.35 45.58 28.57 -12.29
Source: Public Finance, CMIE, Nov. 2004, page no. 117.
Urban development is the sector for which much attention is not found
especially in terms of capital account. On revenue expenditure growth trend in
percentage is found negative likely as per in the budget estimates of 2004-05 and
very little position in 2000-01 i.e. 0.85% only. In the remaining years for all states
it is found more positive. In case of Gujarat too, revenues expenditure is negative
in the year 2000-01 and budget estimates of 2004-05. In all other years it is found
highly positive.
Capital expenditure growth trend reflect sharp variations over the year for all
states and in Gujarat the trend reflects more negative trend and positive only for
the year 1999-00 and 2003-04.
Total expenditure reflects positive growth over the period except for this
current fiscal year 2004-05. While in Gujarat if appears to be negative in the year
2000-01 besides this current fiscal year budget estimates.
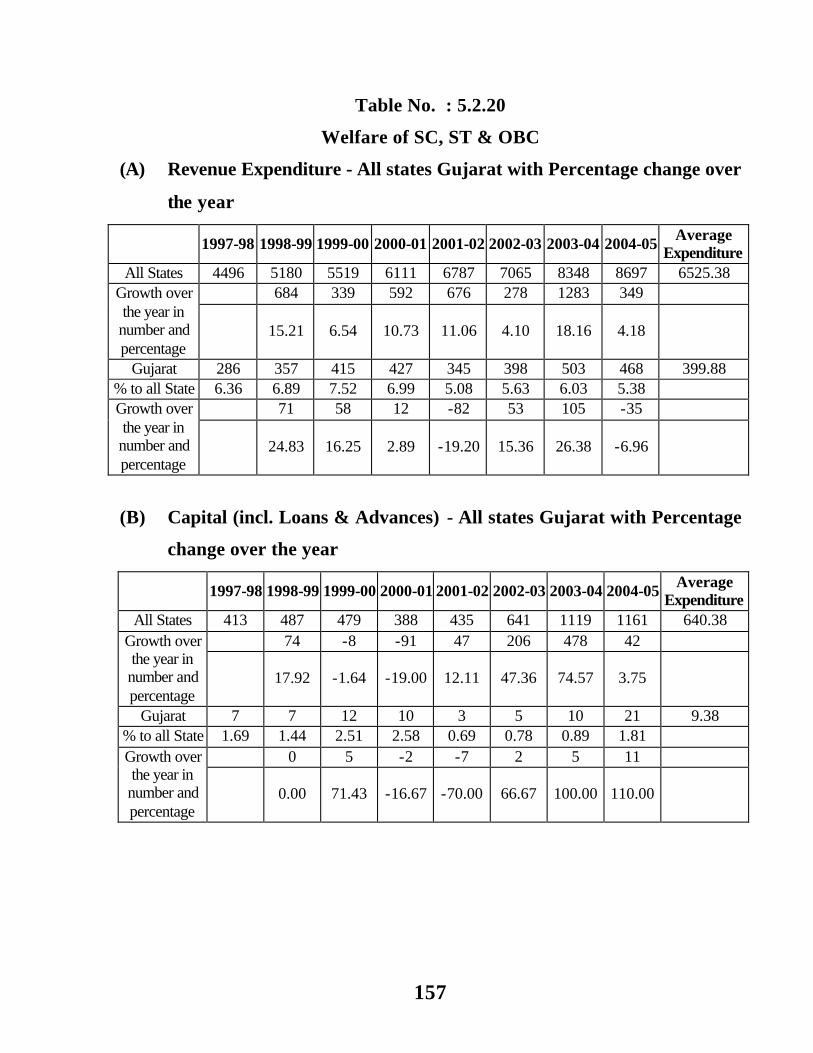
157
Table No. : 5.2.20
Welfare of SC, ST & OBC
(A) Revenue Expenditure - All states Gujarat with Percentage change over
the year
1997-98 1998-99 1999-00 2000-01 2001-02 2002-03 2003-04 2004-05 Average Expenditure
All States 4496 5180 5519 6111 6787 7065 8348 8697 6525.38 684 339 592 676 278 1283 349 Growth over
the year in number and percentage
15.21 6.54 10.73 11.06 4.10 18.16 4.18
Gujarat 286 357 415 427 345 398 503 468 399.88 % to all State 6.36 6.89 7.52 6.99 5.08 5.63 6.03 5.38
71 58 12 -82 53 105 -35 Growth over the year in number and percentage
24.83 16.25 2.89 -19.20 15.36 26.38 -6.96
(B) Capital (incl. Loans & Advances) - All states Gujarat with Percentage
change over the year
1997-98 1998-99 1999-00 2000-01 2001-02 2002-03 2003-04 2004-05 Average Expenditure
All States 413 487 479 388 435 641 1119 1161 640.38 74 -8 -91 47 206 478 42 Growth over
the year in number and percentage
17.92 -1.64 -19.00 12.11 47.36 74.57 3.75
Gujarat 7 7 12 10 3 5 10 21 9.38 % to all State 1.69 1.44 2.51 2.58 0.69 0.78 0.89 1.81
0 5 -2 -7 2 5 11 Growth over the year in number and percentage
0.00 71.43 -16.67 -70.00 66.67 100.00 110.00

158
(C) Total Expenditure Welfare of SC, ST & OBC. All states - Gujarat with
percengtage change over the year
1997-98 1998-99 1999-00 2000-01 2001-02 2002-03 2003-04 2004-05 Average Expenditure
All States 4909 5667 5998 6499 7222 7706 9467 9858 7165.75 758 331 501 723 484 1761 391 Growth over
the year in number and percentage
15.44 5.84 8.35 11.12 6.70 22.85 4.13
Gujarat 293 364 427 437 348 403 513 489 409.25 % to all State 5.96863 6.42315 7.11904 6.72411 4.81861 5.22969 5.41882 4.96044
71 63 10 -89 55 110 -24 Growth over the year in number and percentage
24.23 17.31 2.34 -20.37 15.80 27.30 -4.68
Source: Public Finance, CMIE, Nov. 2004, page no. 118.
-30.00
-20.00
-10.00
0.00
10.00
20.00
30.00
1998
-99
1999
-00
2000
-01
2001
-02
2002
-03
2003
-04
2004
-05
All StatesGujarat
One of the major indicators of balancing the development efforts is the
expenditure made by the states in respect of the development of SC/SC and OBC.
The tables in this regard demonstrate the fact that revenue expenditure is more
in this regard before by all states and Gujarat growth over trend in amount and
percentage also show clearly that except during the year 2001-02 to 2003-04 in the

159
remaining period revenue expenditure has proportionately grown more than capital
expenditure. Gujarat state has spent very little as part of capital expenditure.
Out of the period of 8 years total experience growth in percentage is found
more in case of all states in relation to Gujarat.
Capital expenditure of Gujarat in relation to total capital expenditure of all
states is also found very negligible in this regard.
Table No. : 5.2.21
Labour and employment
(A) Revenue Expenditure - All states Gujarat with Percentage change over
the year
1997-98 1998-99 1999-00 2000-01 2001-02 2002-03 2003-04 2004-05 Average Expenditure
All States 1031 1077 1230 1231 1160 1222 1507 1790 1281.00
46 153 1 -71 62 285 283 Growth over the year in number and percentage
4.46 14.21 0.08 -5.77 5.34 23.32 18.78
Gujarat 78 97 108 121 101 123 123 121 109.00 % to all State 7.57 9.01 8.78 9.83 8.71 10.07 8.16 6.76
19 11 13 -20 22 0 -2 Growth over the year in number and percentage
24.36 11.34 12.04 -16.53 21.78 0.00 -1.63

160
(B) Capital (incl. Loans & Advances) - All states Gujarat with Percentage
change over the year
1997-98 1998-99 1999-00 2000-01 2001-02 2002-03 2003-04 2004-05 Average Expenditure
All States 3080 3637 4137 4976 5137 6106 7651 7923 5330.88 557 500 839 161 969 1545 272 Growth over
the year in number and percentage
18.08 13.75 20.28 3.24 18.86 25.30 3.56
Gujarat 73 103 123 167 123 254 170 256 158.63 % to all State 2.37 2.83 2.97 3.36 2.39 4.16 2.22 3.23
30 20 44 -44 131 -84 86 Growth over the year in number and percentage
41.10 19.42 35.77 -26.35 106.50 -33.07 50.59
(C) Total Expenditure Labor and employment. All states - Gujarat with
percengtage change over the year
1997-98 1998-99 1999-00 2000-01 2001-02 2002-03 2003-04 2004-05 Average Expenditure
All States 4111 4714 5367 6207 6297 7328 9158 9713 6611.88 603 653 840 90 1031 1830 555 Growth over
the year in number and percentage
14.67 13.85 15.65 1.45 16.37 24.97 6.06
Gujarat 151 200 231 288 224 377 293 377 267.63 % to all State 3.67307 4.24268 4.30408 4.63992 3.55725 5.14465 3.19939 3.8814
49 31 57 -64 153 -84 84 Growth over the year in number and percentage
32.45 15.50 24.68 -22.22 68.30 -22.28 28.67
Source: Public Finance, CMIE, Nov. 2004, page no. 119.
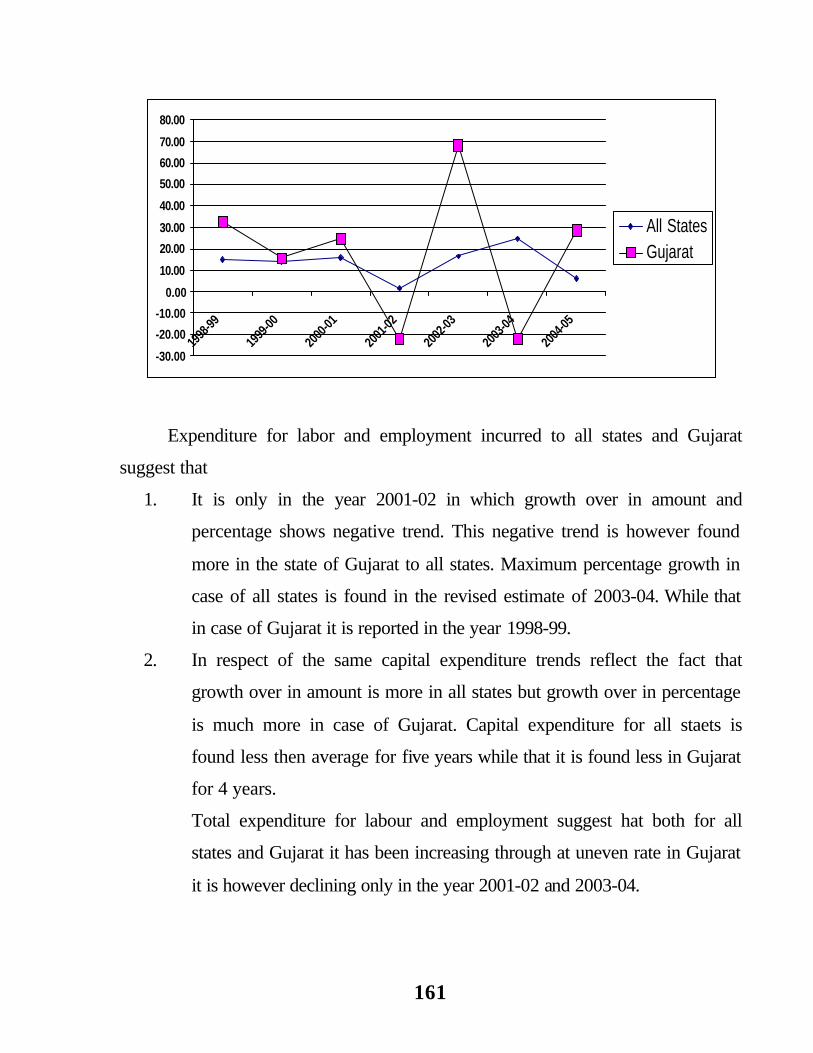
161
-30.00
-20.00
-10.00
0.00
10.00
20.00
30.00
40.00
50.00
60.00
70.00
80.00
1998
-99
1999
-00
2000
-01
2001
-02
2002
-03
2003
-04
2004
-05
All StatesGujarat
Expenditure for labor and employment incurred to all states and Gujarat
suggest that
1. It is only in the year 2001-02 in which growth over in amount and
percentage shows negative trend. This negative trend is however found
more in the state of Gujarat to all states. Maximum percentage growth in
case of all states is found in the revised estimate of 2003-04. While that
in case of Gujarat it is reported in the year 1998-99.
2. In respect of the same capital expenditure trends reflect the fact that
growth over in amount is more in all states but growth over in percentage
is much more in case of Gujarat. Capital expenditure for all staets is
found less then average for five years while that it is found less in Gujarat
for 4 years.
Total expenditure for labour and employment suggest hat both for all
states and Gujarat it has been increasing through at uneven rate in Gujarat
it is however declining only in the year 2001-02 and 2003-04.
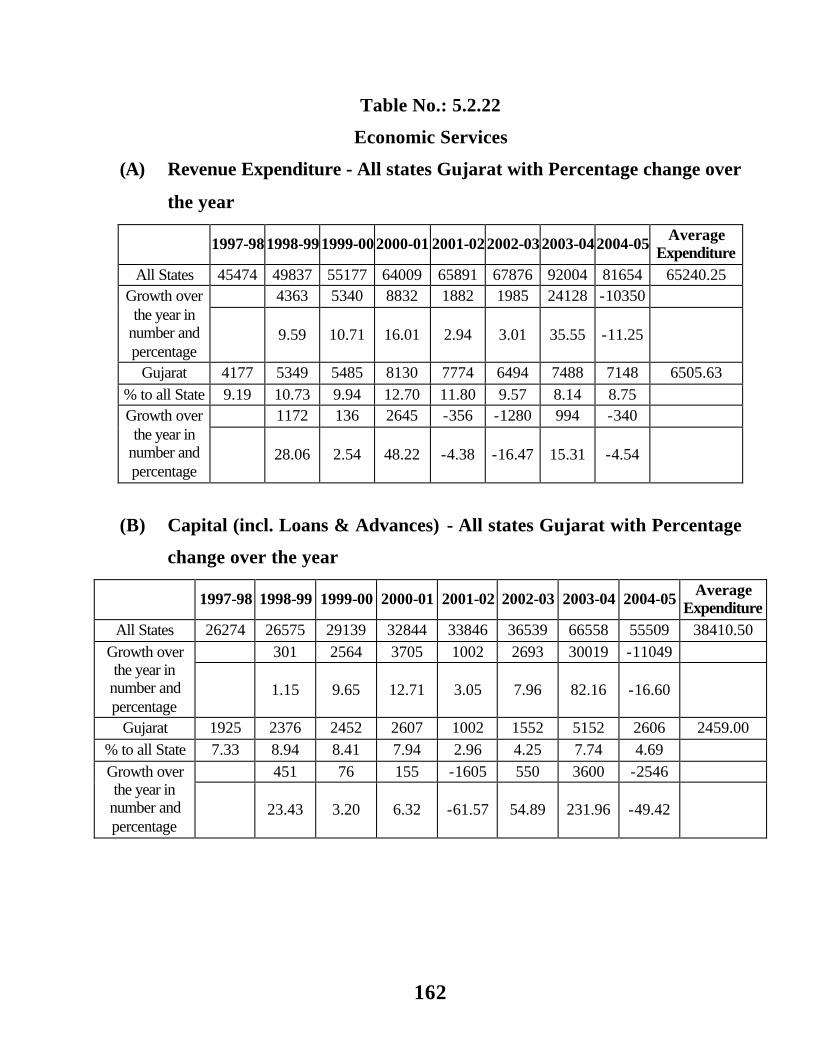
162
Table No.: 5.2.22
Economic Services
(A) Revenue Expenditure - All states Gujarat with Percentage change over
the year
1997-981998-991999-002000-01 2001-022002-032003-042004-05 Average Expenditure
All States 45474 49837 55177 64009 65891 67876 92004 81654 65240.25 4363 5340 8832 1882 1985 24128 -10350 Growth over
the year in number and percentage
9.59 10.71 16.01 2.94 3.01 35.55 -11.25
Gujarat 4177 5349 5485 8130 7774 6494 7488 7148 6505.63
% to all State 9.19 10.73 9.94 12.70 11.80 9.57 8.14 8.75 1172 136 2645 -356 -1280 994 -340 Growth over
the year in number and percentage
28.06 2.54 48.22 -4.38 -16.47 15.31 -4.54
(B) Capital (incl. Loans & Advances) - All states Gujarat with Percentage
change over the year
1997-98 1998-99 1999-00 2000-01 2001-02 2002-03 2003-04 2004-05 Average Expenditure
All States 26274 26575 29139 32844 33846 36539 66558 55509 38410.50
301 2564 3705 1002 2693 30019 -11049 Growth over the year in number and percentage
1.15 9.65 12.71 3.05 7.96 82.16 -16.60
Gujarat 1925 2376 2452 2607 1002 1552 5152 2606 2459.00
% to all State 7.33 8.94 8.41 7.94 2.96 4.25 7.74 4.69
451 76 155 -1605 550 3600 -2546 Growth over the year in number and percentage
23.43 3.20 6.32 -61.57 54.89 231.96 -49.42

163
(C) Total Expenditure Economic Services. All states - Gujarat with
percengtage change over the year
1997-98 1998-99 1999-00 2000-01 2001-02 2002-03 2003-04 2004-05 Average Expenditure
All States 71748 76412 84316 96853 99737 104415 158562 137163 103650.75 4664 7904 12537 2884 4678 54147 -21399 Growth over
the year in number and percentage
6.50 10.34 14.87 2.98 4.69 51.86 -13.50
Gujarat 6102 7725 7937 10737 8776 8046 12640 9754 8964.63 % to all State 8.50477 10.1097 9.4134 11.0859 8.79914 7.70579 7.97165 7.11125
1623 212 2800 -1961 -730 4594 -2886 Growth over the year in
number and percentage
26.60 2.74 35.28 -18.26 -8.32 57.10 -22.83
Source: Public Finance, CMIE, Nov. 2004, page no. 123.
-30.00
-20.00
-10.00
0.00
10.00
20.00
30.00
40.00
50.00
60.00
70.00
1998
-99
1999
-00
2000
-01
2001
-02
2002
-03
2003
-04
2004
-05
All StatesGujarat
It is evidently found from this table that expenditure for economic services
on revenue part has increased over the period of time for all state but in case of
Gujarat it is found increasing till 2000-01 there after for 2 years it has declined for
capital expenditure on economic services the same trend is reflected in for all states
and Gujarat. There is found sharp variations within the state from time perspective
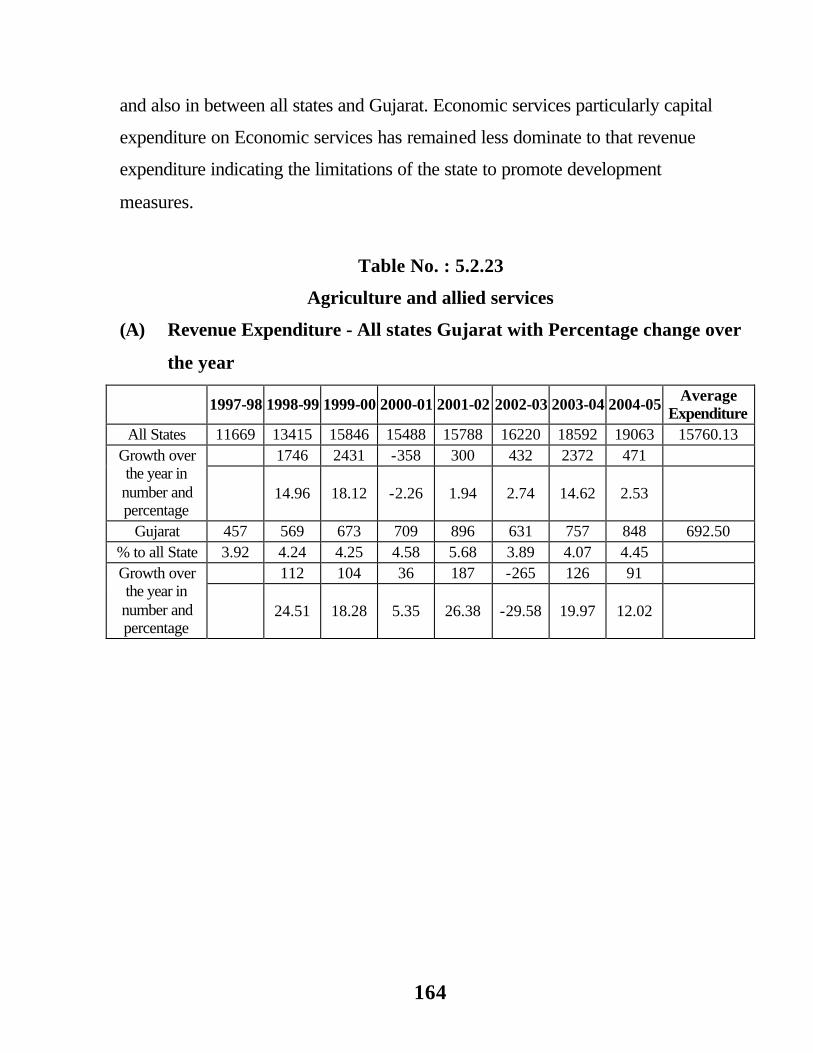
164
and also in between all states and Gujarat. Economic services particularly capital
expenditure on Economic services has remained less dominate to that revenue
expenditure indicating the limitations of the state to promote development
measures.
Table No. : 5.2.23
Agriculture and allied services
(A) Revenue Expenditure - All states Gujarat with Percentage change over
the year
1997-98 1998-99 1999-00 2000-01 2001-02 2002-03 2003-04 2004-05 Average Expenditure
All States 11669 13415 15846 15488 15788 16220 18592 19063 15760.13 1746 2431 -358 300 432 2372 471 Growth over
the year in number and percentage
14.96 18.12 -2.26 1.94 2.74 14.62 2.53
Gujarat 457 569 673 709 896 631 757 848 692.50 % to all State 3.92 4.24 4.25 4.58 5.68 3.89 4.07 4.45
112 104 36 187 -265 126 91 Growth over the year in number and percentage
24.51 18.28 5.35 26.38 -29.58 19.97 12.02

165
(B) Capital (incl. Loans & Advances) - All states Gujarat with Percentage
change over the year
1997-98 1998-99 1999-00 2000-01 2001-02 2002-03 2003-04 2004-05 Average
Expenditure All States 1773 2384 3387 3388 4493 2096 2295 2082 2737.25
611 1003 1 1105 -2397 199 -213 Growth over the year in
number and percentage 34.46 42.07 0.03 32.62 -53.35 9.49 -9.28
Gujarat 194 214 243 224 161 105 200 127 183.50% to all State 10.94 8.98 7.17 6.61 3.58 5.01 8.71 6.10
20 29 -19 -63 -56 95 -73 Growth over the year in
number and percentage 10.31 13.55 -7.82 -28.13 -34.78 90.48 -36.50
(C) Total Expenditure Agriculture and Allied services. All states Gujarat with
percengtage change over the year
1997-98 1998-99 1999-00 2000-01 2001-02 2002-03 2003-04 2004-05 Average Expenditure
All States 13442 15799 19233 18876 20281 18316 20887 21145 18497.38 2357 3434 -357 1405 -1965 2571 258 Growth over
the year in number and percentage
17.53 21.74 -1.86 7.44 -9.69 14.04 1.24
Gujarat 651 783 916 933 1057 736 957 975 876.00 % to all State 4.84303 4.95601 4.76265 4.94278 5.21177 4.01834 4.5818 4.61102
132 133 17 124 -321 221 18 Growth over the year in
number and percentage
20.28 16.99 1.86 13.29 -30.37 30.03 1.88
Source: Public Finance, CMIE, Nov. 2004, page no. 124.
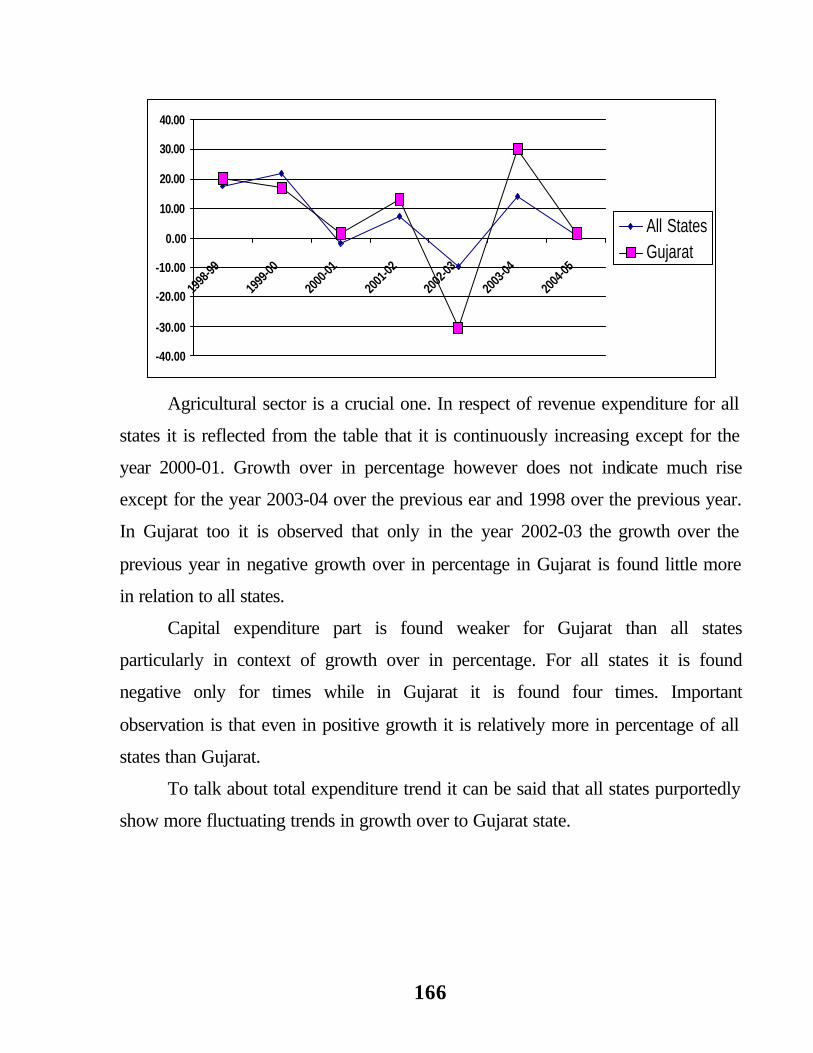
166
-40.00
-30.00
-20.00
-10.00
0.00
10.00
20.00
30.00
40.00
1998
-99
1999
-00
2000
-01
2001
-02
2002
-03
2003
-04
2004
-05
All StatesGujarat
Agricultural sector is a crucial one. In respect of revenue expenditure for all
states it is reflected from the table that it is continuously increasing except for the
year 2000-01. Growth over in percentage however does not indicate much rise
except for the year 2003-04 over the previous ear and 1998 over the previous year.
In Gujarat too it is observed that only in the year 2002-03 the growth over the
previous year in negative growth over in percentage in Gujarat is found little more
in relation to all states.
Capital expenditure part is found weaker for Gujarat than all states
particularly in context of growth over in percentage. For all states it is found
negative only for times while in Gujarat it is found four times. Important
observation is that even in positive growth it is relatively more in percentage of all
states than Gujarat.
To talk about total expenditure trend it can be said that all states purportedly
show more fluctuating trends in growth over to Gujarat state.

167
Table No. : 5.2.24
Rural Development
(A) Revenue Expenditure – All states Gujarat with Percentage change over
the year
1997-98 1998-99 1999-00 2000-01 2001-02 2002-03 2003-04 2004-05 Average Expenditure
All States 8371 10464 10509 10018 10196 11078 15782 16142 11570.00 2093 45 -491 178 882 4704 360 Growth over
the year in number and percentage
25.00 0.43 -4.67 1.78 8.65 42.46 2.28
Gujarat 426 613 565 761 379 579 626 783 591.50
% to all State
5.09 5.86 5.38 7.60 3.72 5.23 3.97 4.85
187 -48 196 -382 200 47 157 Growth over the year in
number and percentage
43.90 -7.83 34.69 -50.20 52.77 8.12 25.08
(B) Capital (incl. Loans & Advances) - All states Gujarat with Percentage
change over the year
1997-981998-991999-002000-01 2001-022002-032003-042004-05 Average Expenditure
All States 386 360 576 1303 2293 1718 3573 3136 1668.13 -26 216 727 990 -575 1855 -437 Growth over
the year in number and percentage
-6.74 60.00 126.22 75.98 -25.08 107.97 -12.23
Gujarat 0 0 0 0 0 0 0 0 0.00 % to all State 0.00 0.00 0.00 0.00 0.00 0.00 0.00 0.00
0 0 0 0 0 0 0 Growth over the year in
number and percentage
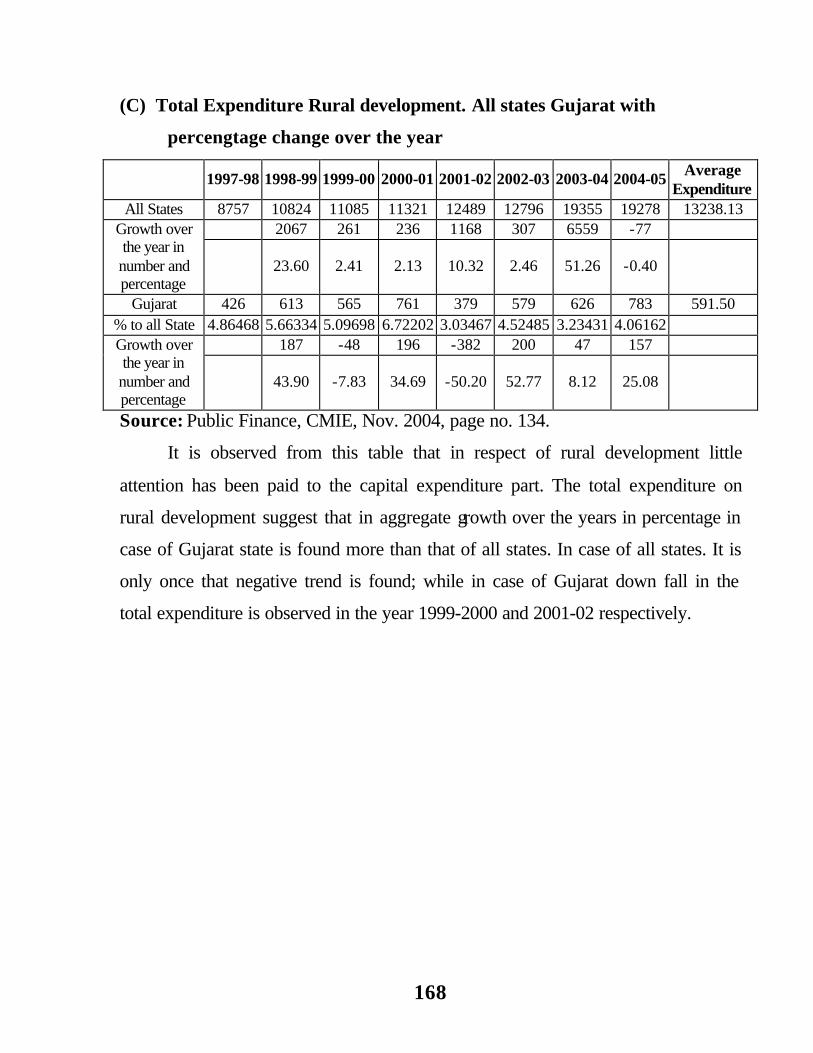
168
(C) Total Expenditure Rural development. All states Gujarat with
percengtage change over the year
1997-98 1998-99 1999-00 2000-01 2001-02 2002-03 2003-04 2004-05 Average Expenditure
All States 8757 10824 11085 11321 12489 12796 19355 19278 13238.13 2067 261 236 1168 307 6559 -77 Growth over
the year in number and percentage
23.60 2.41 2.13 10.32 2.46 51.26 -0.40
Gujarat 426 613 565 761 379 579 626 783 591.50 % to all State 4.86468 5.66334 5.09698 6.72202 3.03467 4.52485 3.23431 4.06162
187 -48 196 -382 200 47 157 Growth over the year in number and percentage
43.90 -7.83 34.69 -50.20 52.77 8.12 25.08
Source: Public Finance, CMIE, Nov. 2004, page no. 134.
It is observed from this table that in respect of rural development little
attention has been paid to the capital expenditure part. The total expenditure on
rural development suggest that in aggregate growth over the years in percentage in
case of Gujarat state is found more than that of all states. In case of all states. It is
only once that negative trend is found; while in case of Gujarat down fall in the
total expenditure is observed in the year 1999-2000 and 2001-02 respectively.

169
Table No. : 5.2.25
Energy
(A) Revenue Expenditure - All states Gujarat with Percentage change over
the year
1997-981998-991999-002000-01 2001-022002-032003-042004-05 Average Expenditure
All States 6162 5620 6793 13461 15295 14034 31211 18456 13879.00 -542 1173 6668 1834 -1261 17177 -12755 Growth over
the year in number and percentage
-8.80 20.87 98.16 13.62 -8.24 122.40 -40.87
Gujarat 1368 1647 1386 3548 3551 2219 2641 2016 2297.00 % to all State 22.20 29.31 20.40 26.36 23.22 15.81 8.46 10.92
279 -261 2162 3 -1332 422 -625 Growth over the year in
number and percentage
20.39 -15.85 155.99 0.08 -37.51 19.02 -23.67
(B) Capital (incl. Loans & Advances) - All states Gujarat with Percentage
change over the year
1997-98 1998-99 1999-00 2000-01 2001-02 2002-03 2003-04 2004-05 Average Expenditure
All States 8930 7712 7280 10374 8109 8879 23851 16620 11469.38 -1218 -432 3094 -2265 770 14972 -7231 Growth over
the year in number and percentage
-13.64 -5.60 42.50 -21.83 9.50 168.62 -30.32
Gujarat 224 370 331 607 24 120 1994 304 496.75 % to all State
2.51 4.80 4.55 5.85 0.30 1.35 8.36 1.83
146 -39 276 -583 96 1874 -1690 Growth over the year in number and percentage
65.18 -10.54 83.38 -96.05 400.00 1561.67 -84.75

170
(C) Total Expenditure Energy. All states-Gujarat with percengtage change over the year
1997-98 1998-99 1999-00 2000-01 2001-02 2002-03 2003-04 2004-05 Average Expenditure
All States 15092 13332 14073 23835 23404 22913 55062 35076 25348.38 -1760 741 9762 -431 -491 32149 -19986 Growth over
the year in number and percentage
-11.66 5.56 69.37 -1.81 -2.10 140.31 -36.30
Gujarat 1592 2017 1717 4155 3575 2339 4635 2320 2793.75 % to all State
10.5486 15.129 12.2007 17.4323 15.2752 10.2082 8.41778 6.61421
425 -300 2438 -580 -1236 2296 -2315 Growth over the year in
number and percentage
26.70 -14.87 141.99 -13.96 -34.57 98.16 -49.95
Source: Public Finance, CMIE, Nov. 2004, page no. 141.
-100.00
-50.00
0.00
50.00
100.00
150.00
200.00
1998
-99
1999
-00
2000
-01
2001
-02
2002
-03
2003
-04
2004
-05
All StatesGujarat
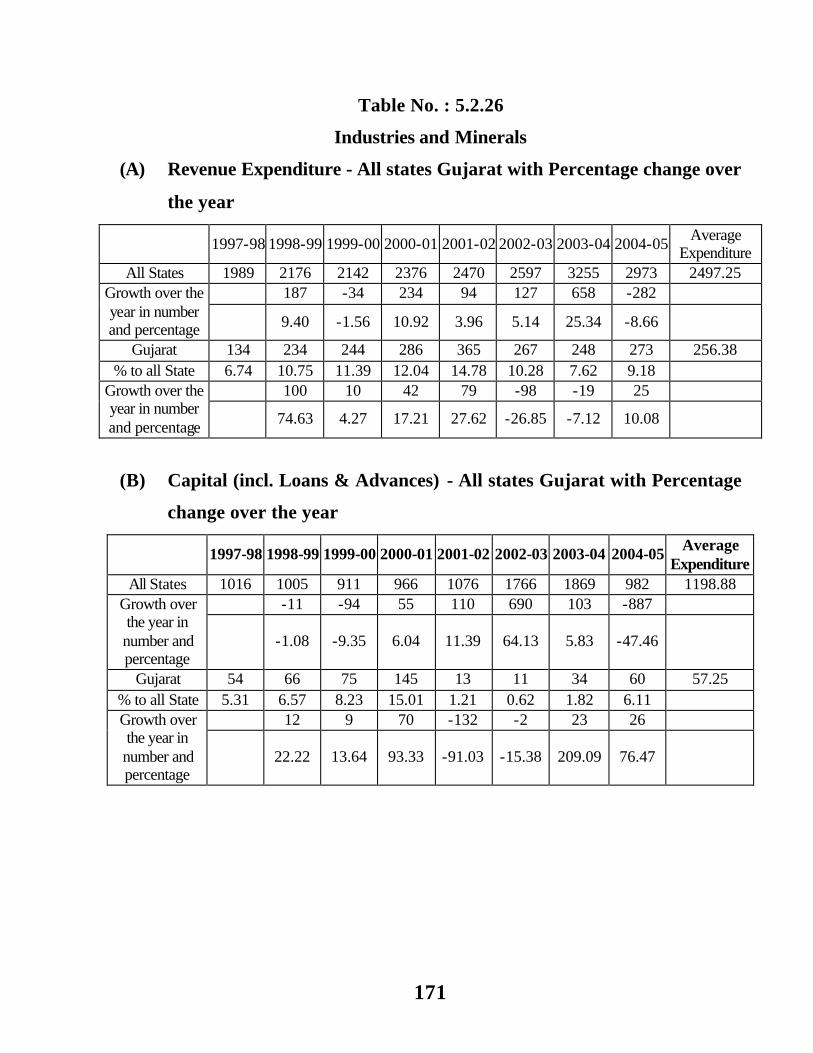
171
Table No. : 5.2.26
Industries and Minerals
(A) Revenue Expenditure - All states Gujarat with Percentage change over
the year
1997-98 1998-99 1999-00 2000-01 2001-02 2002-03 2003-04 2004-05 Average
Expenditure All States 1989 2176 2142 2376 2470 2597 3255 2973 2497.25
187 -34 234 94 127 658 -282 Growth over the year in number and percentage 9.40 -1.56 10.92 3.96 5.14 25.34 -8.66
Gujarat 134 234 244 286 365 267 248 273 256.38 % to all State 6.74 10.75 11.39 12.04 14.78 10.28 7.62 9.18
100 10 42 79 -98 -19 25 Growth over the year in number and percentage
74.63 4.27 17.21 27.62 -26.85 -7.12 10.08
(B) Capital (incl. Loans & Advances) - All states Gujarat with Percentage
change over the year
1997-98 1998-99 1999-00 2000-01 2001-02 2002-03 2003-04 2004-05 Average Expenditure
All States 1016 1005 911 966 1076 1766 1869 982 1198.88 -11 -94 55 110 690 103 -887 Growth over
the year in number and percentage
-1.08 -9.35 6.04 11.39 64.13 5.83 -47.46
Gujarat 54 66 75 145 13 11 34 60 57.25 % to all State 5.31 6.57 8.23 15.01 1.21 0.62 1.82 6.11
12 9 70 -132 -2 23 26 Growth over the year in number and percentage
22.22 13.64 93.33 -91.03 -15.38 209.09 76.47
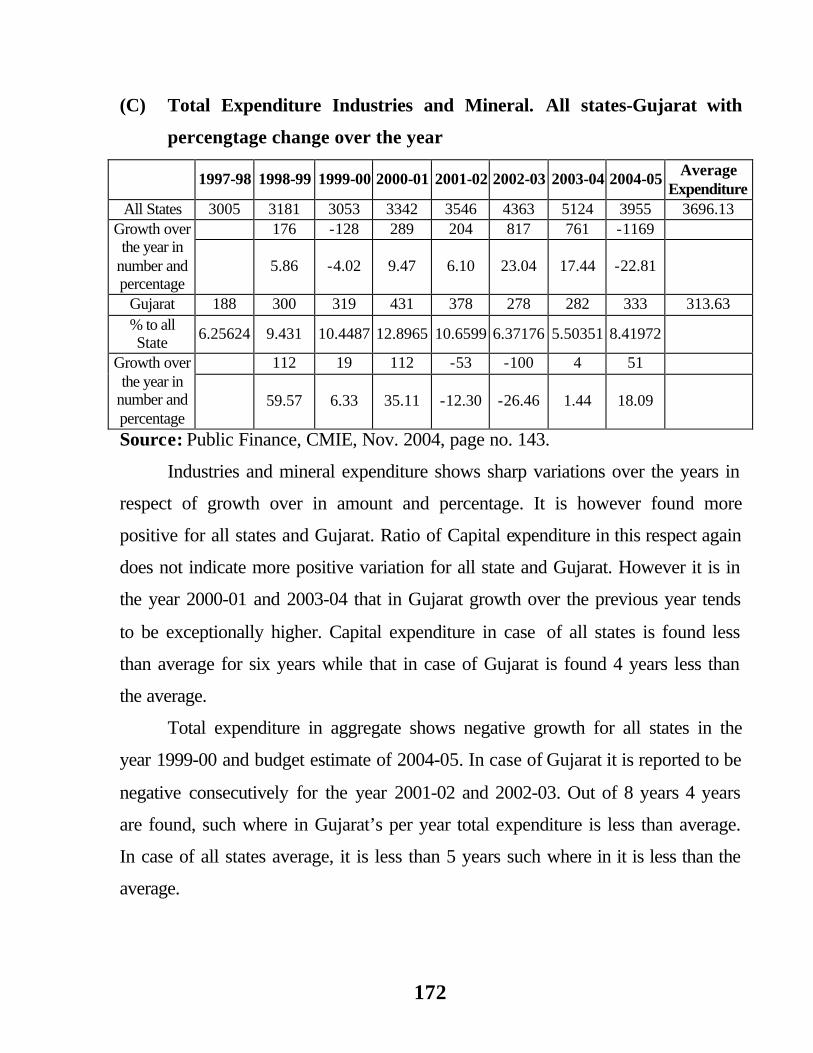
172
(C) Total Expenditure Industries and Mineral. All states-Gujarat with
percengtage change over the year
1997-98 1998-99 1999-00 2000-01 2001-02 2002-03 2003-04 2004-05 Average Expenditure
All States 3005 3181 3053 3342 3546 4363 5124 3955 3696.13 176 -128 289 204 817 761 -1169 Growth over
the year in number and percentage
5.86 -4.02 9.47 6.10 23.04 17.44 -22.81
Gujarat 188 300 319 431 378 278 282 333 313.63 % to all State
6.25624 9.431 10.4487 12.8965 10.6599 6.37176 5.50351 8.41972
112 19 112 -53 -100 4 51 Growth over the year in
number and percentage
59.57 6.33 35.11 -12.30 -26.46 1.44 18.09
Source: Public Finance, CMIE, Nov. 2004, page no. 143.
Industries and mineral expenditure shows sharp variations over the years in
respect of growth over in amount and percentage. It is however found more
positive for all states and Gujarat. Ratio of Capital expenditure in this respect again
does not indicate more positive variation for all state and Gujarat. However it is in
the year 2000-01 and 2003-04 that in Gujarat growth over the previous year tends
to be exceptionally higher. Capital expenditure in case of all states is found less
than average for six years while that in case of Gujarat is found 4 years less than
the average.
Total expenditure in aggregate shows negative growth for all states in the
year 1999-00 and budget estimate of 2004-05. In case of Gujarat it is reported to be
negative consecutively for the year 2001-02 and 2002-03. Out of 8 years 4 years
are found, such where in Gujarat’s per year total expenditure is less than average.
In case of all states average, it is less than 5 years such where in it is less than the
average.

173
Table No.: 5.2.27
Transport & Communication
(A) Revenue Expenditure - All states Gujarat with Percentage change over
the year
1997-98 1998-99 1999-00 2000-01 2001-02 2002-03 2003-04 2004-05 Average Expenditure
All States 5387 5113 5759 6097 6486 7844 7302 7725 6464.13 -274 646 338 389 1358 -542 423 Growth over
the year in number and percentage
-5.09 12.63 5.87 6.38 20.94 -6.91 5.79
Gujarat 500 602 592 607 591 658 623 643 602.00 % to all State 9.28 11.77 10.28 9.96 9.11 8.39 8.53 8.32
102 -10 15 -16 67 -35 20 Growth over the year in number and percentage
20.40 -1.66 2.53 -2.64 11.34 -5.32 3.21
(B) Capital (incl. Loans & Advances) - All states Gujarat with Percentage
change over the year
1997-98 1998-99 1999-00 2000-01 2001-02 2002-03 2003-04 2004-05 Average Expenditure
All States 3754 4757 5210 6000 6071 7955 11524 11657 7116.00 1003 453 790 71 1884 3569 133 Growth over
the year in number and percentage
26.72 9.52 15.16 1.18 31.03 44.86 1.15
Gujarat 155 248 332 399 247 427 770 731 413.63 % to all State
4.13 5.21 6.37 6.65 4.07 5.37 6.68 6.27
93 84 67 -152 180 343 -39 Growth over the year in
number and percentage
60.00 33.87 20.18 -38.10 72.87 80.33 -5.06
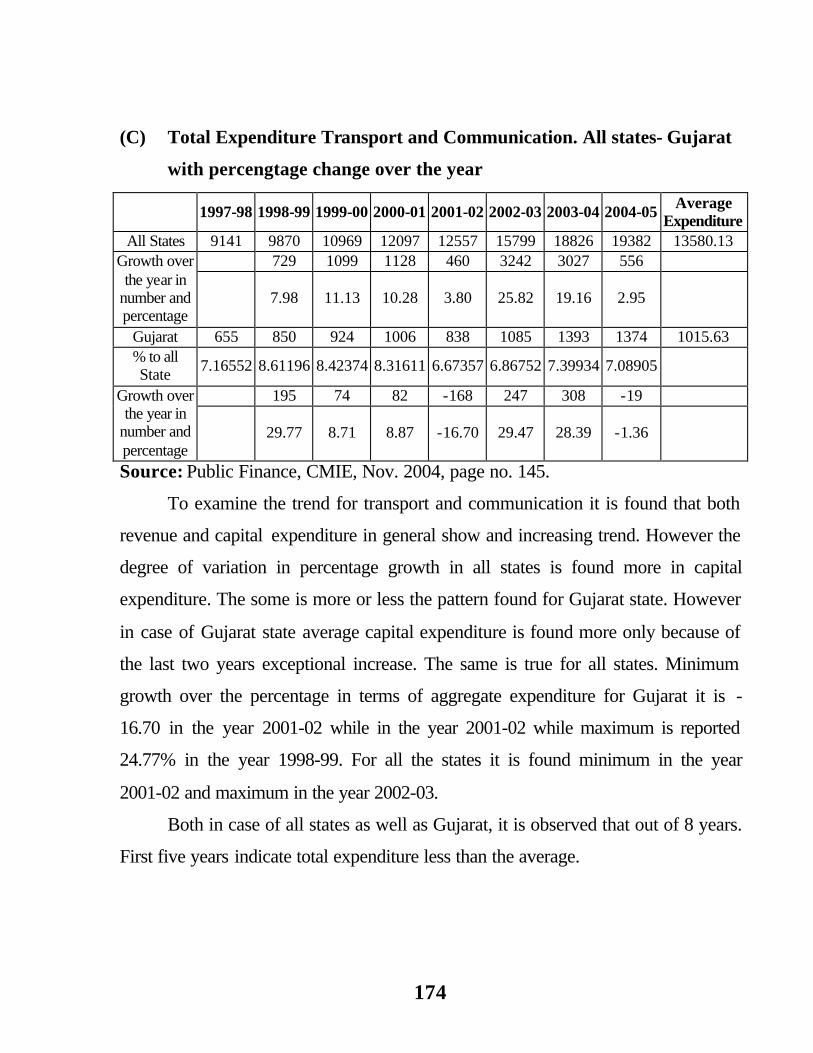
174
(C) Total Expenditure Transport and Communication. All states- Gujarat
with percengtage change over the year
1997-98 1998-99 1999-00 2000-01 2001-02 2002-03 2003-04 2004-05 Average Expenditure
All States 9141 9870 10969 12097 12557 15799 18826 19382 13580.13 729 1099 1128 460 3242 3027 556 Growth over
the year in number and percentage
7.98 11.13 10.28 3.80 25.82 19.16 2.95
Gujarat 655 850 924 1006 838 1085 1393 1374 1015.63 % to all State
7.16552 8.61196 8.42374 8.31611 6.67357 6.86752 7.39934 7.08905
195 74 82 -168 247 308 -19 Growth over the year in
number and percentage
29.77 8.71 8.87 -16.70 29.47 28.39 -1.36
Source: Public Finance, CMIE, Nov. 2004, page no. 145.
To examine the trend for transport and communication it is found that both
revenue and capital expenditure in general show and increasing trend. However the
degree of variation in percentage growth in all states is found more in capital
expenditure. The some is more or less the pattern found for Gujarat state. However
in case of Gujarat state average capital expenditure is found more only because of
the last two years exceptional increase. The same is true for all states. Minimum
growth over the percentage in terms of aggregate expenditure for Gujarat it is -
16.70 in the year 2001-02 while in the year 2001-02 while maximum is reported
24.77% in the year 1998-99. For all the states it is found minimum in the year
2001-02 and maximum in the year 2002-03.
Both in case of all states as well as Gujarat, it is observed that out of 8 years.
First five years indicate total expenditure less than the average.

175
Table No. : 5.2.28
Expenditure pattern under planning period [Percentage to total expenditure]
Sector
8th plan
period April
1992 to March 1997
9th plan
period April
1997 to March 2002
Percentage point
change
10th plan
outlay 2002 to
2007
Expenditure of First two
years
Agricultural and Allied 6.7 7.66 0.96 8.87 5.26
Rural Development 4.74 3.95 -0.79 3.4 4.2 Irrigation and Flood
Control 28.97 26.4 -2.57 22.02 25.31
Energy 21.69 14.67 -7.02 15.09 13.03 Industry Mineral 5.47 4.97 -0.5 5.17 2.3
Transport 6.81 7.56 0.75 4.62 9.65 Communication 0.04 0.07 0.03 0.08 0.19
Science and Technology
0.06 0.64 0.58 0.81 0.89
General Economic Services 2.42 3.02 0.6 2.09 4.25
Social Service 23.02 30.95 7.93 37.71 34.84 General Service 0.01 0.02 0.01 0.05 0.02 Boarder Area Development 0 0.1 0.1 0.09 -
Total Rupees 1175610 2707231 130.28 4700000 1298789 Source: Budget documents in brief and socio economic review 1992-93 to 2004-
05, Directorate of Economics and Statistics, Govt. of Gujarat, Gandhinagar.

176
-10
-7
-4
-1
2
5
8
11
14
17
20
Agricultural and AlliedRural Development
Irr igation and Flood Control
Energy
Industry MineralTranspor t
Communicat ion
Sc ience and Techno logy
General Economic Services
Social Service
General Service
Boarder Area Development
Series1
177
State expenditure of pattern of Gujarat State, covering 8th and 9th five-year
plan period and first 2 years of 10th five-year plan is presented in the table. It
provides percentage spend to the total for the respective sector during the planning
period. 8th and 9th plan expenditure in percentage is based on actual expenditure
during the period. Tenth plan original outlay is presented in percentage to total
outlay. However first two years actual expenditure in percentage is computed on
the basis of revised outlay for the first two years. Column 4 indicates the difference
in percentage point between 8th and 9th five-year plan.
Broad inferences can be derived as under.
1. Maximum amount in percentage was spent for flood control and
Imagination. This was followed by social services and true of far energy
sector respectively under this 8th plan minimum was spent for general
services.
2. In 9th plan social services shows maximum spending followed by Irrigation
flood control and true after energy.
Thus in respect prioritization is interchanged between the first two only. i.e.
Irrigation flood control and social services.
3. Examining the difference that is observed in percentage spending for the
sector between eight and ninth plans it is found that
a. Highest positive difference is found in case of social service sector.
There are others seven sectors for which positive trend is reflected.
But the degree of increase in social sector is pr`oportnately for more
than what it is found in other sector.
b. Highest degree negative degree of difference is observed in case of
energy sector.
c. Negative trend is found in irrigation and flood control.
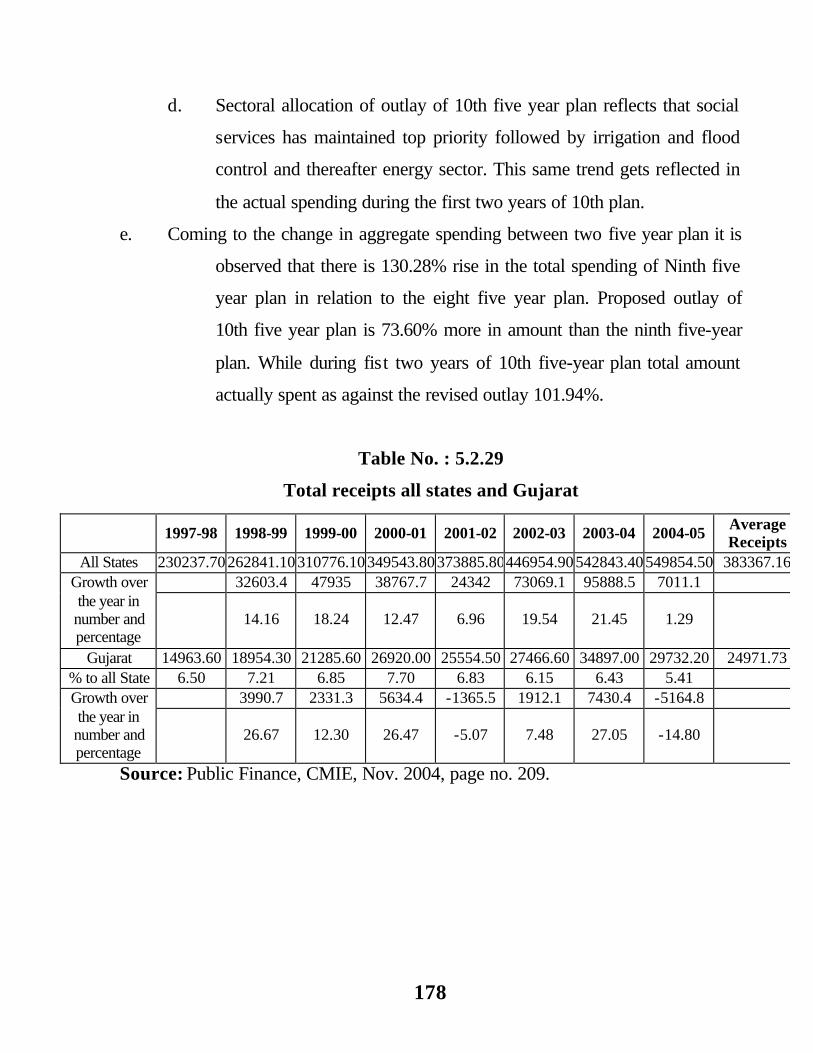
178
d. Sectoral allocation of outlay of 10th five year plan reflects that social
services has maintained top priority followed by irrigation and flood
control and thereafter energy sector. This same trend gets reflected in
the actual spending during the first two years of 10th plan.
e. Coming to the change in aggregate spending between two five year plan it is
observed that there is 130.28% rise in the total spending of Ninth five
year plan in relation to the eight five year plan. Proposed outlay of
10th five year plan is 73.60% more in amount than the ninth five-year
plan. While during fist two years of 10th five-year plan total amount
actually spent as against the revised outlay 101.94%.
Table No. : 5.2.29
Total receipts all states and Gujarat
1997-98 1998-99 1999-00 2000-01 2001-02 2002-03 2003-04 2004-05 Average Receipts
All States 230237.70262841.10310776.10349543.80373885.80446954.90542843.40549854.50 383367.16 32603.4 47935 38767.7 24342 73069.1 95888.5 7011.1 Growth over
the year in number and percentage
14.16 18.24 12.47 6.96 19.54 21.45 1.29
Gujarat 14963.60 18954.30 21285.60 26920.00 25554.50 27466.60 34897.00 29732.20 24971.73 % to all State 6.50 7.21 6.85 7.70 6.83 6.15 6.43 5.41
3990.7 2331.3 5634.4 -1365.5 1912.1 7430.4 -5164.8 Growth over the year in number and percentage
26.67 12.30 26.47 -5.07 7.48 27.05 -14.80
Source: Public Finance, CMIE, Nov. 2004, page no. 209.
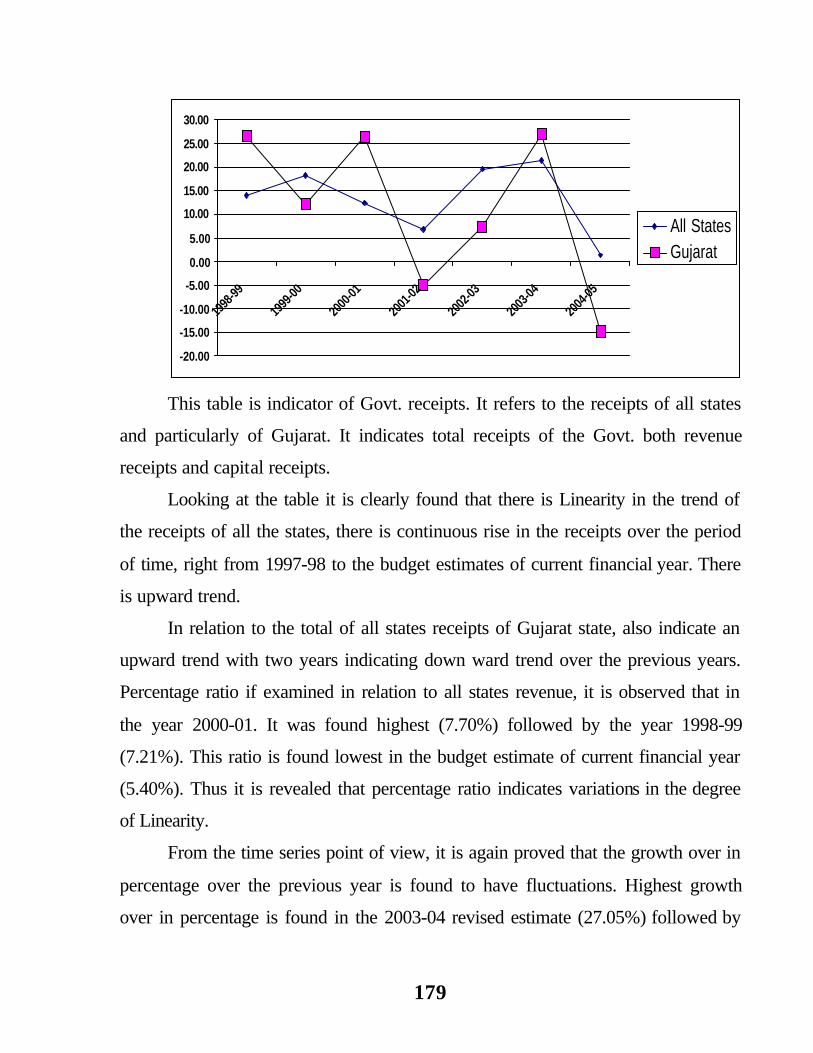
179
-20.00
-15.00
-10.00
-5.00
0.00
5.00
10.00
15.00
20.00
25.00
30.00
1998
-99
1999
-00
2000
-01
2001
-02
2002
-03
2003
-04
2004
-05
All StatesGujarat
This table is indicator of Govt. receipts. It refers to the receipts of all states
and particularly of Gujarat. It indicates total receipts of the Govt. both revenue
receipts and capital receipts.
Looking at the table it is clearly found that there is Linearity in the trend of
the receipts of all the states, there is continuous rise in the receipts over the period
of time, right from 1997-98 to the budget estimates of current financial year. There
is upward trend.
In relation to the total of all states receipts of Gujarat state, also indicate an
upward trend with two years indicating down ward trend over the previous years.
Percentage ratio if examined in relation to all states revenue, it is observed that in
the year 2000-01. It was found highest (7.70%) followed by the year 1998-99
(7.21%). This ratio is found lowest in the budget estimate of current financial year
(5.40%). Thus it is revealed that percentage ratio indicates variations in the degree
of Linearity.
From the time series point of view, it is again proved that the growth over in
percentage over the previous year is found to have fluctuations. Highest growth
over in percentage is found in the 2003-04 revised estimate (27.05%) followed by
180
the year 1998-99 (26.66%) this growth is also found declining in the year 2001-02
and the current financial year of 2004-05 in general in relation to all the states,
Gujarat indicates un even performance in respect of growth over time period.
All states indicate constant growth over the previous year both in amount
and percentage however there is found sharp variations in the growth trend. It is
found varied in amount minimum of Rs. 7011.1 and maximum up to 95888.5. In
percentage it is 1.29% to 21.45%. This degree of variation in growth is found more
positive in case of Gujarat except for the two years i.e. in 2001-02 and estimates of
2004-05, which shows negative trend. First five years indicate year wise amount
less than the average in all states while in case of Gujarat that is found less than
average for first three years.

181
Table No.: 5.2.30
Revenue Receipt - All states Gujarat with Percentage change over the year
1997-98 1998-99 1999-00 2000-01 2001-02 2002-03 2003-04 2004-05 Average Receipts
All States 107300.80 176447.70 207201.10 237952.90 255675.20 275175.80 329508.80 370587.10 244981.18 69146.9 30753.4 30751.8 17722.3 19500.6 54333 41078.3 Growth over
the year in number and percentage
64.44 17.43 14.84 7.45 7.63 19.74 12.47
Gujarat 11125.40 12742.70 13900.30 15738.60 15986.10 17875.30 20145.80 20813.70 16040.99 % to all State 10.37 7.22 6.71 6.61 6.25 6.50 6.11 5.62
1617.3 1157.6 1838.3 247.5 1889.2 2270.5 667.9 Growth over the year in
number and percentage
14.54 9.08 13.22 1.57 11.82 12.70 3.32
Source: Public Finance, CMIE, Nov. 2004, page no. 210.
Here the revenue receipts part of the total receipts is indicated revenue
receipts trend indicate constant increase from the amount point of view of all states
revenue receipts of all state is found maximum if the budget estimate of current
financial year is taken in to consideration however during the completed span of
9th five year plan. It was in the last year that is 2001-02 in which receipts of all
states was highest.
To talk about the Gujarat state, it is revealed from the table that percentage
ratio t the total of all states expresses unevenness. It is increasing but percentage
ratio does not indicate increase in comparison with the previous year. The budget
estimate of current financial year indicate that percentage ratio of Gujarat to the all
state found to be minimum from amongst the years of study, while it was
maximum in respect of percentage in the year 1997.
It is important to examine the difference in the physical amount and the
growth over in percentage to the previous year. Having a look at this it is observed
that during the last year of 2003-04 revised estimate indicate highest amount of
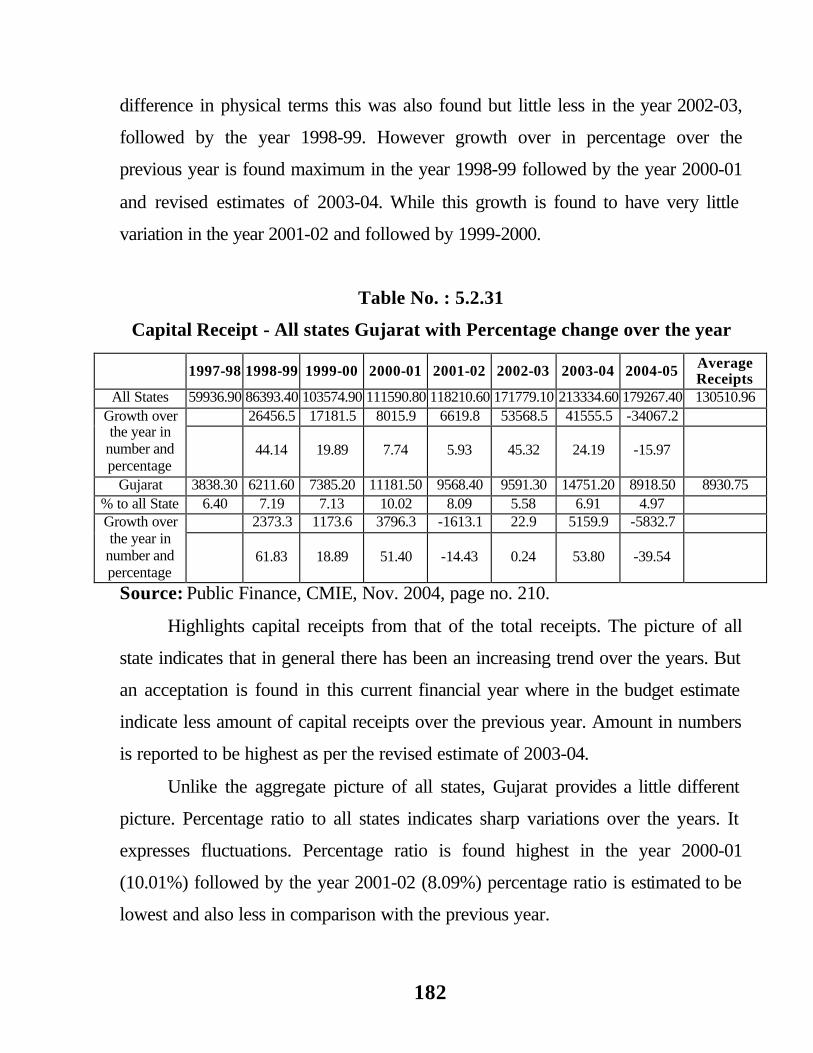
182
difference in physical terms this was also found but little less in the year 2002-03,
followed by the year 1998-99. However growth over in percentage over the
previous year is found maximum in the year 1998-99 followed by the year 2000-01
and revised estimates of 2003-04. While this growth is found to have very little
variation in the year 2001-02 and followed by 1999-2000.
Table No. : 5.2.31
Capital Receipt - All states Gujarat with Percentage change over the year
1997-98 1998-99 1999-00 2000-01 2001-02 2002-03 2003-04 2004-05 Average Receipts
All States 59936.90 86393.40 103574.90 111590.80 118210.60 171779.10 213334.60 179267.40 130510.96 26456.5 17181.5 8015.9 6619.8 53568.5 41555.5 -34067.2 Growth over
the year in number and percentage
44.14 19.89 7.74 5.93 45.32 24.19 -15.97
Gujarat 3838.30 6211.60 7385.20 11181.50 9568.40 9591.30 14751.20 8918.50 8930.75 % to all State 6.40 7.19 7.13 10.02 8.09 5.58 6.91 4.97
2373.3 1173.6 3796.3 -1613.1 22.9 5159.9 -5832.7 Growth over the year in
number and percentage
61.83 18.89 51.40 -14.43 0.24 53.80 -39.54
Source: Public Finance, CMIE, Nov. 2004, page no. 210.
Highlights capital receipts from that of the total receipts. The picture of all
state indicates that in general there has been an increasing trend over the years. But
an acceptation is found in this current financial year where in the budget estimate
indicate less amount of capital receipts over the previous year. Amount in numbers
is reported to be highest as per the revised estimate of 2003-04.
Unlike the aggregate picture of all states, Gujarat provides a little different
picture. Percentage ratio to all states indicates sharp variations over the years. It
expresses fluctuations. Percentage ratio is found highest in the year 2000-01
(10.01%) followed by the year 2001-02 (8.09%) percentage ratio is estimated to be
lowest and also less in comparison with the previous year.
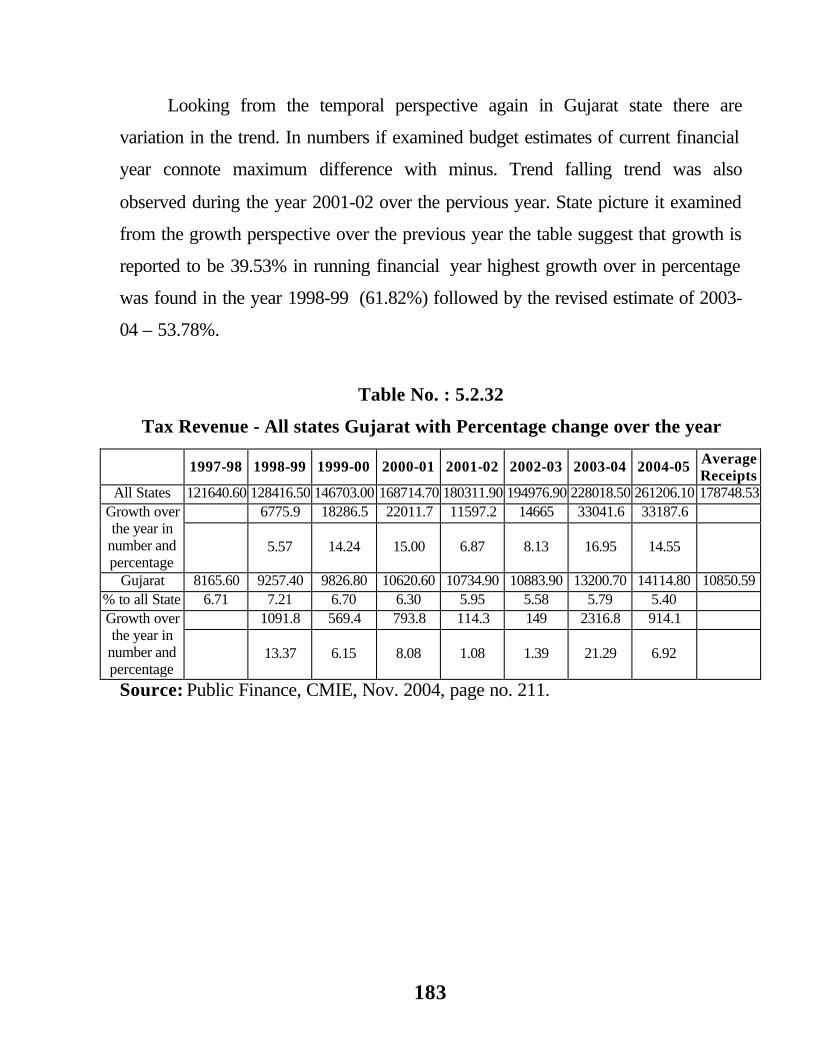
183
Looking from the temporal perspective again in Gujarat state there are
variation in the trend. In numbers if examined budget estimates of current financial
year connote maximum difference with minus. Trend falling trend was also
observed during the year 2001-02 over the pervious year. State picture it examined
from the growth perspective over the previous year the table suggest that growth is
reported to be 39.53% in running financial year highest growth over in percentage
was found in the year 1998-99 (61.82%) followed by the revised estimate of 2003-
04 – 53.78%.
Table No. : 5.2.32
Tax Revenue - All states Gujarat with Percentage change over the year
1997-98 1998-99 1999-00 2000-01 2001-02 2002-03 2003-04 2004-05 Average Receipts
All States 121640.60 128416.50 146703.00 168714.70 180311.90 194976.90 228018.50 261206.10 178748.53 6775.9 18286.5 22011.7 11597.2 14665 33041.6 33187.6 Growth over
the year in number and percentage
5.57 14.24 15.00 6.87 8.13 16.95 14.55
Gujarat 8165.60 9257.40 9826.80 10620.60 10734.90 10883.90 13200.70 14114.80 10850.59 % to all State 6.71 7.21 6.70 6.30 5.95 5.58 5.79 5.40
1091.8 569.4 793.8 114.3 149 2316.8 914.1 Growth over the year in
number and percentage
13.37 6.15 8.08 1.08 1.39 21.29 6.92
Source: Public Finance, CMIE, Nov. 2004, page no. 211.
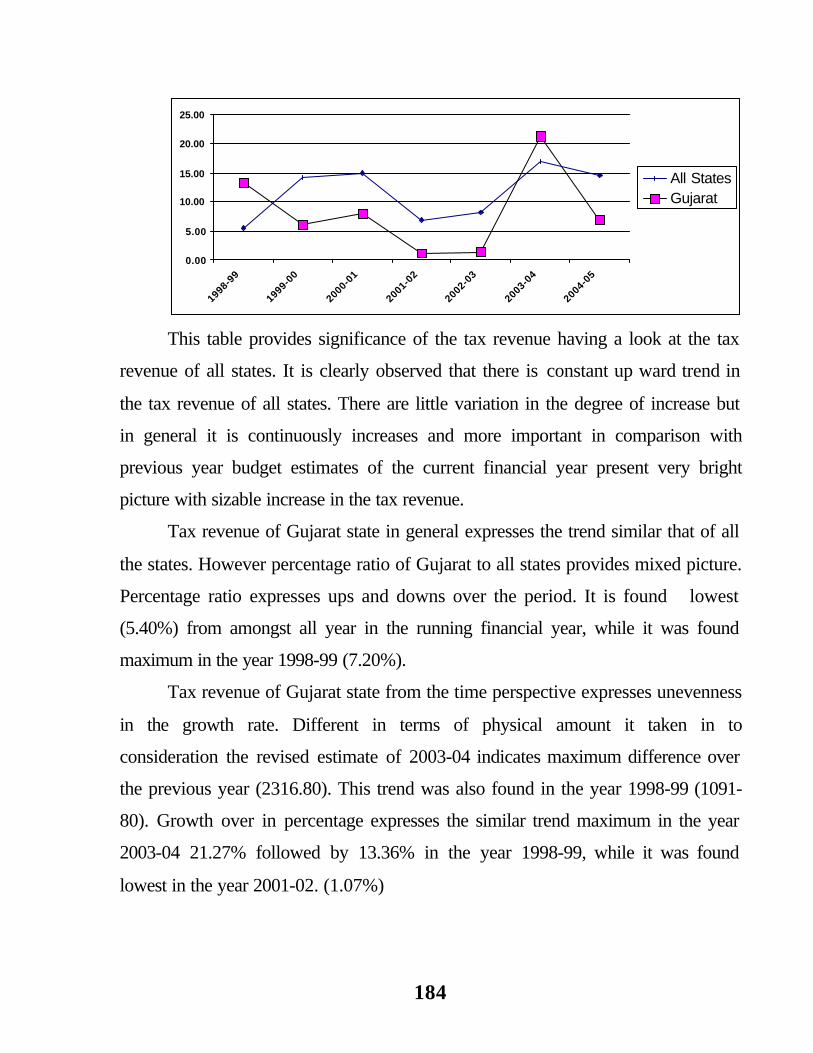
184
0.00
5.00
10.00
15.00
20.00
25.00
1998-99
1999-00
2000-01
2001-02
2002-03
2003-04
2004-05
All StatesGujarat
This table provides significance of the tax revenue having a look at the tax
revenue of all states. It is clearly observed that there is constant up ward trend in
the tax revenue of all states. There are little variation in the degree of increase but
in general it is continuously increases and more important in comparison with
previous year budget estimates of the current financial year present very bright
picture with sizable increase in the tax revenue.
Tax revenue of Gujarat state in general expresses the trend similar that of all
the states. However percentage ratio of Gujarat to all states provides mixed picture.
Percentage ratio expresses ups and downs over the period. It is found lowest
(5.40%) from amongst all year in the running financial year, while it was found
maximum in the year 1998-99 (7.20%).
Tax revenue of Gujarat state from the time perspective expresses unevenness
in the growth rate. Different in terms of physical amount it taken in to
consideration the revised estimate of 2003-04 indicates maximum difference over
the previous year (2316.80). This trend was also found in the year 1998-99 (1091-
80). Growth over in percentage expresses the similar trend maximum in the year
2003-04 21.27% followed by 13.36% in the year 1998-99, while it was found
lowest in the year 2001-02. (1.07%)

185
Table No. : 5.2.33
Non-Tax Revenue - All states Gujarat with Percentage change over the year
1997-98 1998-99 1999-00 2000-01 2001-02 2002-03 2003-04 2004-05 Average Receipts
All States 48660.20 48031.20 60498.10 69238.30 75363.20 80198.90 101490.30 109381.00 74107.65
-629 12466.9 8740.2 6124.9 4835.7 21291.4 7890.7 Growth over the year in number and percentage -1.29 25.96 14.45 8.85 6.42 26.55 7.77
Gujarat 2959.80 3485.40 4073.60 5118.00 5251.20 6991.50 6945.20 6698.90 5190.45
% to all State 6.08 7.26 6.73 7.39 6.97 8.72 6.84 6.12
525.6 588.2 1044.4 133.2 1740.3 -46.3 -246.3 Growth over the year in number and percentage 17.76 16.88 25.64 2.60 33.14 -0.66 -3.55
Source: Public Finance, CMIE, Nov. 2004, page no. 211.
This table refers to the efforts made by all the states and Gujarat in particular
to mobilized non-tax revenue. Here it is indicated that non-tax revenue generated
by all states has increase over the period of time except in the year 1998-99. This
amount is found to have collected maximum in the budget estimate of the current
financial year.
In relation to all states, non-tax revenue collected by Gujarat state indicates
an increase in terms of physical amount. The trend in general is found increasing
but for the current financial year.
In examined percentage ratio to all states there is unevenness found in the
trend. Percentage ratio is indicating regular up down and up trend. It is observed
highest in the year 2002-03 (8.71%) and lowest in the year 1997-98 (6.08%).
Coming about the time series analysis it is further revealed that there has
been fluctuations found over the period of time. The difference if worked in
amount tends to be highest in the year 2002-03 (1740.30) and in it is found
minimum 246.30 in budget estimates current financial year. Percentage growth
over the previous year it examined found maximum again in the year 2002-03
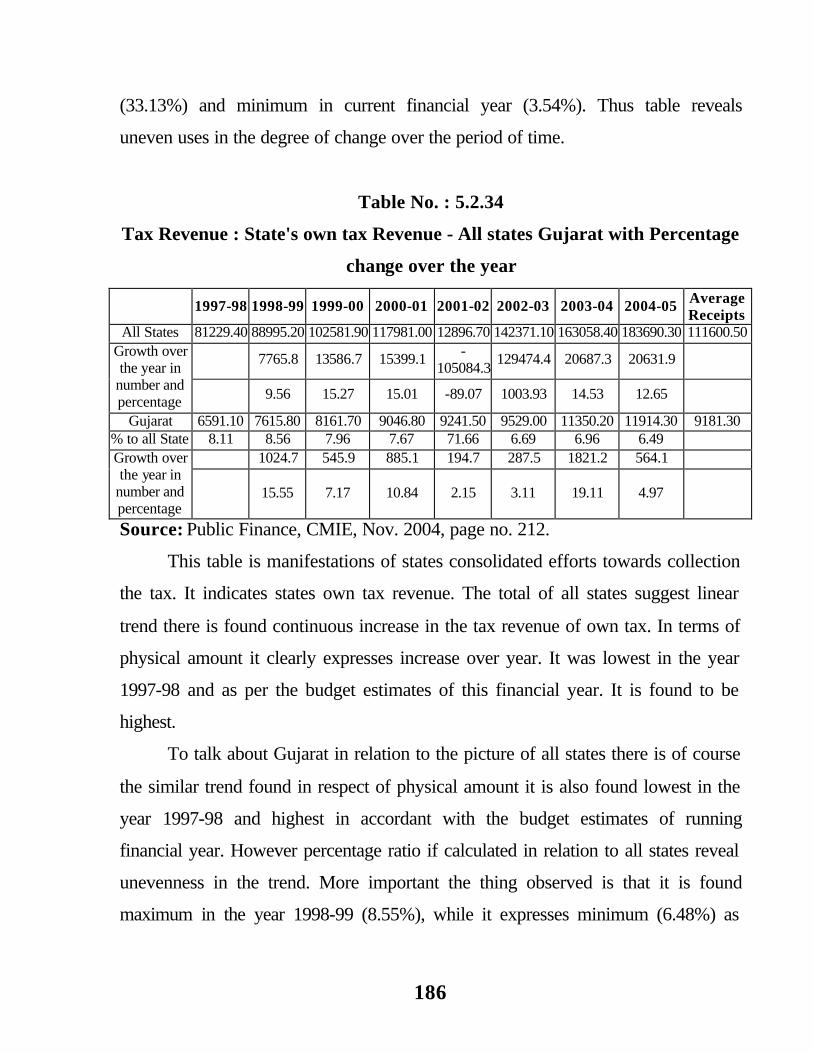
186
(33.13%) and minimum in current financial year (3.54%). Thus table reveals
uneven uses in the degree of change over the period of time.
Table No. : 5.2.34
Tax Revenue : State's own tax Revenue - All states Gujarat with Percentage
change over the year
1997-98 1998-99 1999-00 2000-01 2001-02 2002-03 2003-04 2004-05 Average Receipts
All States 81229.40 88995.20 102581.90 117981.00 12896.70 142371.10 163058.40 183690.30 111600.50
7765.8 13586.7 15399.1 -105084.3
129474.4 20687.3 20631.9 Growth over the year in
number and percentage 9.56 15.27 15.01 -89.07 1003.93 14.53 12.65
Gujarat 6591.10 7615.80 8161.70 9046.80 9241.50 9529.00 11350.20 11914.30 9181.30 % to all State 8.11 8.56 7.96 7.67 71.66 6.69 6.96 6.49
1024.7 545.9 885.1 194.7 287.5 1821.2 564.1 Growth over the year in
number and percentage
15.55 7.17 10.84 2.15 3.11 19.11 4.97
Source: Public Finance, CMIE, Nov. 2004, page no. 212.
This table is manifestations of states consolidated efforts towards collection
the tax. It indicates states own tax revenue. The total of all states suggest linear
trend there is found continuous increase in the tax revenue of own tax. In terms of
physical amount it clearly expresses increase over year. It was lowest in the year
1997-98 and as per the budget estimates of this financial year. It is found to be
highest.
To talk about Gujarat in relation to the picture of all states there is of course
the similar trend found in respect of physical amount it is also found lowest in the
year 1997-98 and highest in accordant with the budget estimates of running
financial year. However percentage ratio if calculated in relation to all states reveal
unevenness in the trend. More important the thing observed is that it is found
maximum in the year 1998-99 (8.55%), while it expresses minimum (6.48%) as

187
per the budget estimate of this year. Thus there is found non-linearity in respect of
the degree of variation.
The own tax revenue of Gujarat suggests that there is an increase in the
revenue collected during the particular year over the previous year. But it is
evidently found from the table that the differential amount does not indicate
constant increase. It expresses sharp variations in the degree of increase in the own
tax revenue. It is found from the table that the difference over the previous year
was minimum in the year 2001-02 (154-70) and it is maximum in the revised
estimate of 2003-04 (1821-20) growth over in percentage also reflect the some
trend that appears minimum in the year 2001-02 (1.70%) and maximum in the year
2003-04 (19.11%).
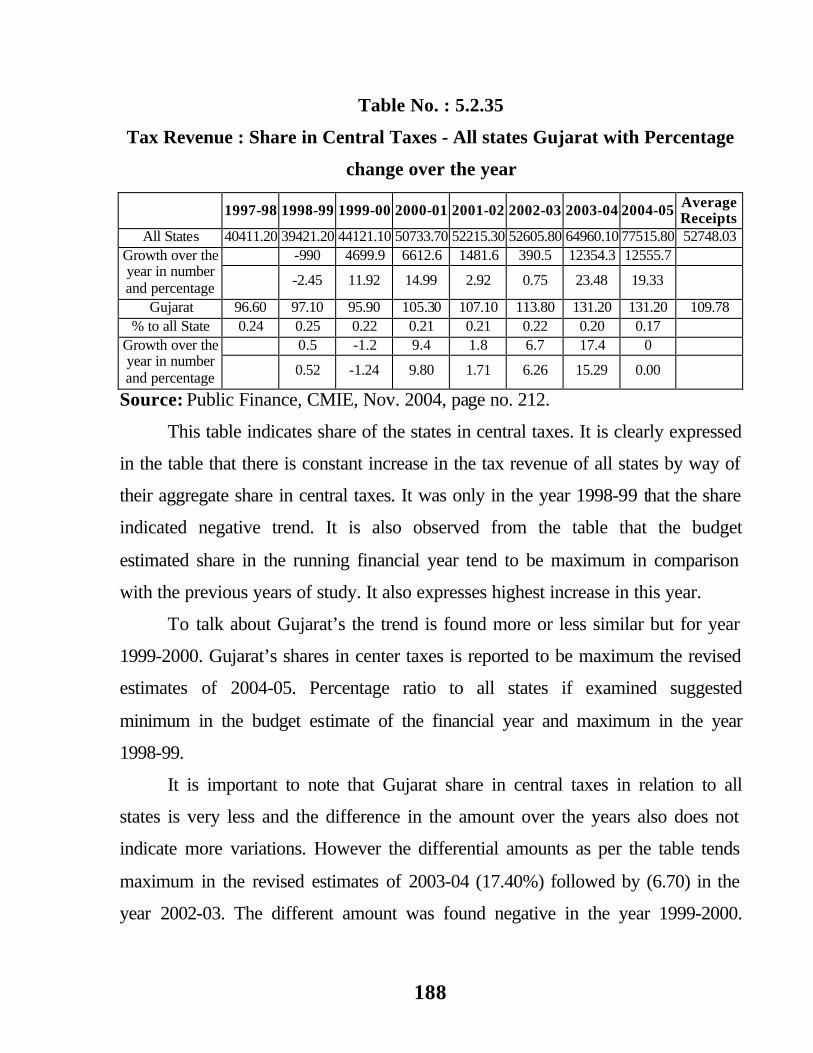
188
Table No. : 5.2.35
Tax Revenue : Share in Central Taxes - All states Gujarat with Percentage
change over the year
1997-98 1998-99 1999-00 2000-01 2001-02 2002-03 2003-04 2004-05 Average Receipts
All States 40411.20 39421.20 44121.10 50733.70 52215.30 52605.80 64960.10 77515.80 52748.03 -990 4699.9 6612.6 1481.6 390.5 12354.3 12555.7 Growth over the
year in number and percentage -2.45 11.92 14.99 2.92 0.75 23.48 19.33
Gujarat 96.60 97.10 95.90 105.30 107.10 113.80 131.20 131.20 109.78 % to all State 0.24 0.25 0.22 0.21 0.21 0.22 0.20 0.17
0.5 -1.2 9.4 1.8 6.7 17.4 0 Growth over the year in number and percentage 0.52 -1.24 9.80 1.71 6.26 15.29 0.00
Source: Public Finance, CMIE, Nov. 2004, page no. 212.
This table indicates share of the states in central taxes. It is clearly expressed
in the table that there is constant increase in the tax revenue of all states by way of
their aggregate share in central taxes. It was only in the year 1998-99 that the share
indicated negative trend. It is also observed from the table that the budget
estimated share in the running financial year tend to be maximum in comparison
with the previous years of study. It also expresses highest increase in this year.
To talk about Gujarat’s the trend is found more or less similar but for year
1999-2000. Gujarat’s shares in center taxes is reported to be maximum the revised
estimates of 2004-05. Percentage ratio to all states if examined suggested
minimum in the budget estimate of the financial year and maximum in the year
1998-99.
It is important to note that Gujarat share in central taxes in relation to all
states is very less and the difference in the amount over the years also does not
indicate more variations. However the differential amounts as per the table tends
maximum in the revised estimates of 2003-04 (17.40%) followed by (6.70) in the
year 2002-03. The different amount was found negative in the year 1999-2000.

189
Growth over in percentage indicates maximum growth in 2003-04 (14.94%)
followed by (9.38%) in the year 2000-01.
Table No. : 5.2.36
Tax Revenue : States Sales Tax - All states Gujarat with Percentage
change over the year
1997-98 1998-99 1999-00 2000-01 2001-02 2002-03 2003-042004-05 Average Receipts
All States 38713.60 42780.80 47683.80 58499.60 59797.30 NA NA NA 30934.39
4067.2 4903 10815.8 1297.7 -59797.3 0 0 Growth over the year in number and
percentage 10.51 11.46 22.68 2.22 -100.00
Gujarat 2713.40 3049.90 3090.70 3736.30 3661.70 3834.10 4295.00 4927.00 3663.51
% to all State 7.01 7.13 6.48 6.39 6.12 0.00 0.00 0.00
336.5 40.8 645.6 -74.6 172.4 460.9 632 Growth over the year in number and
percentage 12.40 1.34 20.89 -2.00 4.71 12.02 14.71
Source: Public Finance, CMIE, Nov. 2004, page no. 217.
This table provides us the data on sales tax revenue of the states. Revenue
data that of the all states in combined is available up to the period of 2001-02. It is
indicated that there is considerable variation found in the degree of sales tax
revenue of all states.
Gujarat state, if taken in to consideration, its percentage share to the total of
all states is found maximum in the year 1998-99 (7.12%) and minimum in the year
2001-02 (6.15%). Physical amount is found minimum in the year 1997-98 and
maximum in the budget estimates of 2004-05.
The difference if calculated over the pervious year is found minimum in the
year 1999-2000 (40.80%) and maximum in the year 2000-01 (645.60) over the
previous year. This growth over is considered in percentage it is minimum (1.29%)
in the year 1999-2000 and maximum (20.86%) in the year 2000-01. It is reflected
from the table that the state sales taxes all through the period of 9th five year plan
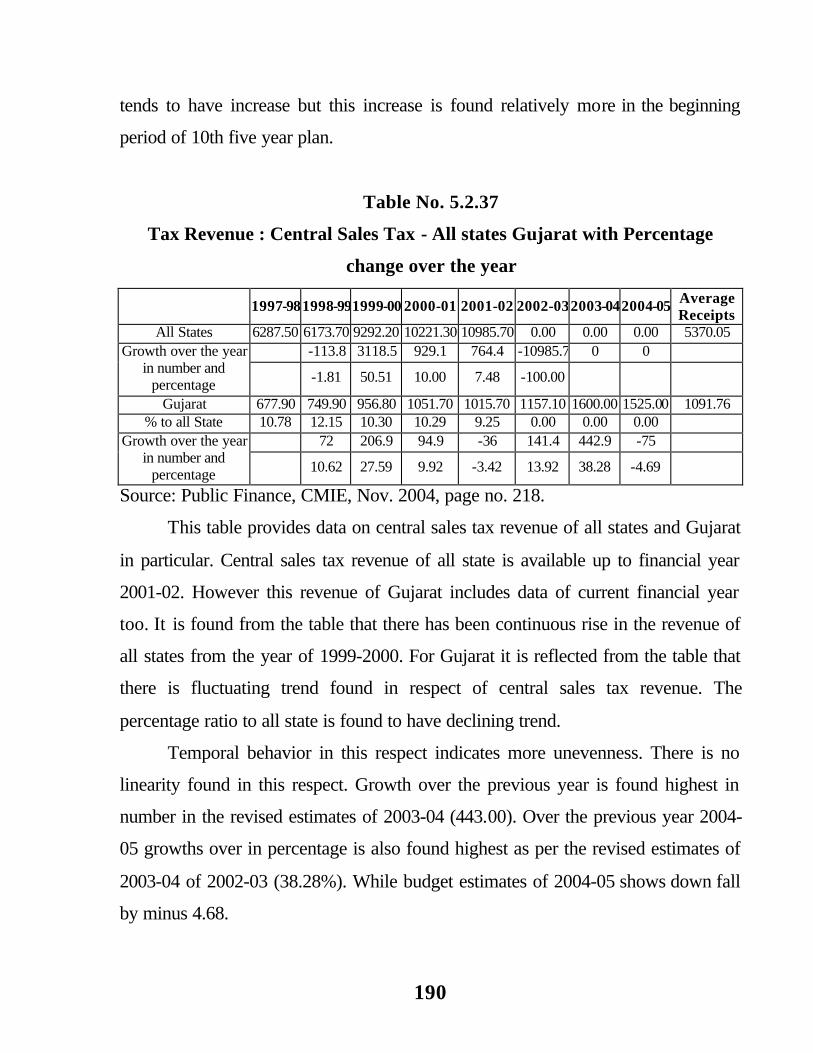
190
tends to have increase but this increase is found relatively more in the beginning
period of 10th five year plan.
Table No. 5.2.37
Tax Revenue : Central Sales Tax - All states Gujarat with Percentage
change over the year
1997-981998-991999-00 2000-01 2001-02 2002-032003-042004-05 Average Receipts
All States 6287.50 6173.70 9292.20 10221.30 10985.70 0.00 0.00 0.00 5370.05 -113.8 3118.5 929.1 764.4 -10985.7 0 0 Growth over the year
in number and percentage -1.81 50.51 10.00 7.48 -100.00
Gujarat 677.90 749.90 956.80 1051.70 1015.70 1157.10 1600.00 1525.00 1091.76 % to all State 10.78 12.15 10.30 10.29 9.25 0.00 0.00 0.00
72 206.9 94.9 -36 141.4 442.9 -75 Growth over the year in number and
percentage 10.62 27.59 9.92 -3.42 13.92 38.28 -4.69
Source: Public Finance, CMIE, Nov. 2004, page no. 218.
This table provides data on central sales tax revenue of all states and Gujarat
in particular. Central sales tax revenue of all state is available up to financial year
2001-02. However this revenue of Gujarat includes data of current financial year
too. It is found from the table that there has been continuous rise in the revenue of
all states from the year of 1999-2000. For Gujarat it is reflected from the table that
there is fluctuating trend found in respect of central sales tax revenue. The
percentage ratio to all state is found to have declining trend.
Temporal behavior in this respect indicates more unevenness. There is no
linearity found in this respect. Growth over the previous year is found highest in
number in the revised estimates of 2003-04 (443.00). Over the previous year 2004-
05 growths over in percentage is also found highest as per the revised estimates of
2003-04 of 2002-03 (38.28%). While budget estimates of 2004-05 shows down fall
by minus 4.68.
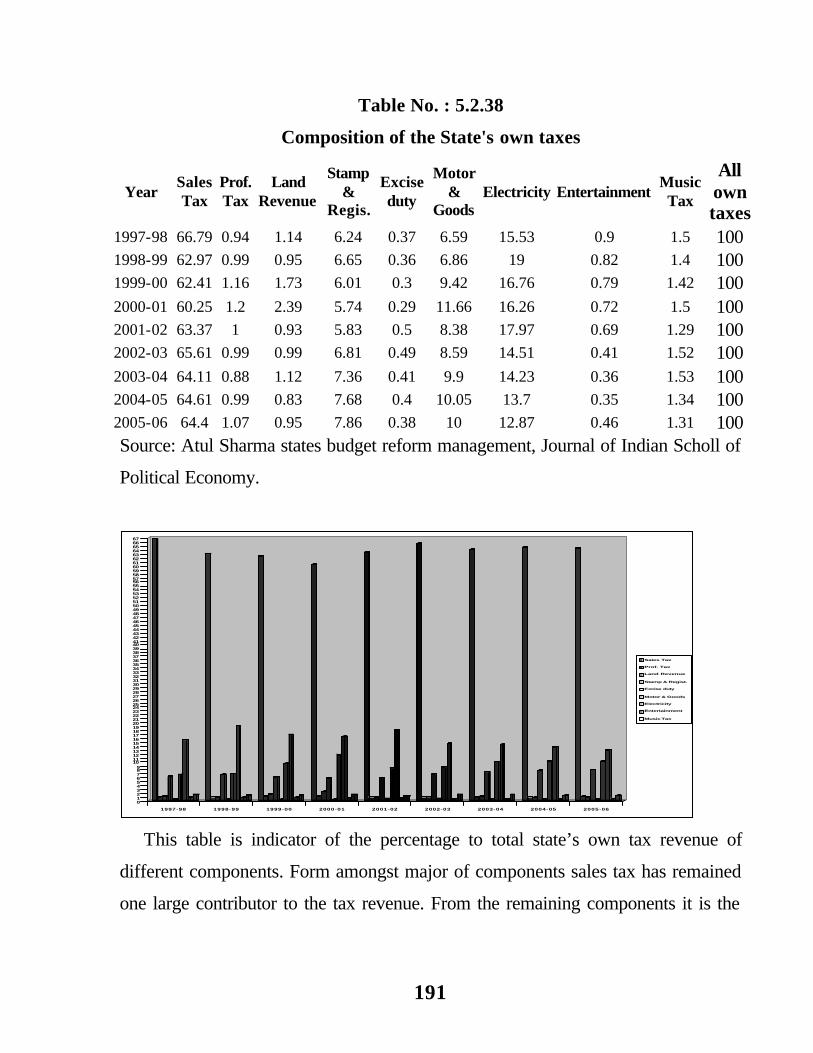
191
Table No. : 5.2.38
Composition of the State's own taxes
Year Sales Tax
Prof. Tax
Land Revenue
Stamp &
Regis.
Excise duty
Motor &
Goods Electricity Entertainment
Music Tax
All own taxes
1997-98 66.79 0.94 1.14 6.24 0.37 6.59 15.53 0.9 1.5 100 1998-99 62.97 0.99 0.95 6.65 0.36 6.86 19 0.82 1.4 100 1999-00 62.41 1.16 1.73 6.01 0.3 9.42 16.76 0.79 1.42 100 2000-01 60.25 1.2 2.39 5.74 0.29 11.66 16.26 0.72 1.5 100 2001-02 63.37 1 0.93 5.83 0.5 8.38 17.97 0.69 1.29 100 2002-03 65.61 0.99 0.99 6.81 0.49 8.59 14.51 0.41 1.52 100 2003-04 64.11 0.88 1.12 7.36 0.41 9.9 14.23 0.36 1.53 100 2004-05 64.61 0.99 0.83 7.68 0.4 10.05 13.7 0.35 1.34 100 2005-06 64.4 1.07 0.95 7.86 0.38 10 12.87 0.46 1.31 100 Source: Atul Sharma states budget reform management, Journal of Indian Scholl of
Political Economy.
0123456789
10111213141516171819202122232425262728293031323334353637383940414243444546474849505152535455565758596061626364656667
1997-98 1998-99 1999-00 2000-01 2001-02 2002-03 2003-04 2004-05 2005-06
Sales Tax
Prof. Tax
Land Revenue
Stamp & Regist.
Excise duty
Motor & Goods
Electricity
Entertainment
Music Tax
This table is indicator of the percentage to total state’s own tax revenue of
different components. Form amongst major of components sales tax has remained
one large contributor to the tax revenue. From the remaining components it is the
192
electricity motor vehicle goods and stamp registration which contributes a little in
order respectively.
A. It is found from this table that from amongst the difference years it was in
the year 1997-98 in which sales tax revenue was was highest in
comparison with other years. While sales tax revenue in percentage to
total was found minimum in the year 2000-01. Temporal trend in general
in respect of sales tax revenue reflects little variations over the years.
B. Electricity duty accrued to the state is found maximum in the year 1998-
99 and minimum is estimate in the coming financial year or other wise
actual amount accrued in percentage is found minimum in the revised
estimates of 2004-05.
Time series data in this respect reveals fluctuating trends over the period.
However it shows continuous declaiming trend right from the year 2002-
03 on words.
C. Duty on motor vehicles and goods generated revenue relatively more
than the other components from amongst different years it was found
maximum in percentage in the year 2000-01 while the revised estimates
shows 10.05% of revenue. In the year 1997-98 the percentage revenue is
found minimum. This component also shows ups and downs in
percentage over the year.
D. Stamp and Registration duty is a single component, which by and large
shows increasing in percentage revenue. Downfall was however observed
in the year 1999-00, 2000-01 and 2001-02 continuously. But if again
found increasing there on words.
Apart form these from component other do not add much to the revenue in
percentage ration. Total of four segments tend to be minimum in the year 2000-01

193
(93.12) and that revised estimate of 2004-05 reflected maximum in percentage
(96.04)
Thus in general remaining segments do not contribute. Even from amongst
these four. Sales tax is the sole contribution. This trend is the repetitive one since
the inception of the state.
Table No. : 5.2.39
Collection of own tax and non-tax revenue in Gujarat
Year Tax Rev. Non Tax Rev. Tax Rev. Non Tex Rev. 1991-92 2893 1135 11.08 4.35 1992-93 3457 1158 9.96 3.34 1993-94 3942 1399 10.05 3.57 1994-95 4743 1488 9.19 2.87 1995-96 5323 1601 9.2 2.77 1996-97 6066 1573 9.07 2.35 1997-98 6592 2221 8.75 3.67 1998-99 7616 2266 9.01 3.27 1999-00 8162 2919 8.84 3.16 2000-01 9047 3349 10.06 3.72 2001-02 9242 3761 9.19 3.74 2002-03 9529 3996 8.04 3.37 2003-04 11181 3272 7.84 2.29 2004-05 12537 2844
(R.E.) (R.E.) Source: Budget documents and socio economic review, directorate of economics
and statistics Govt. of Gujarat, Gandhinagar.
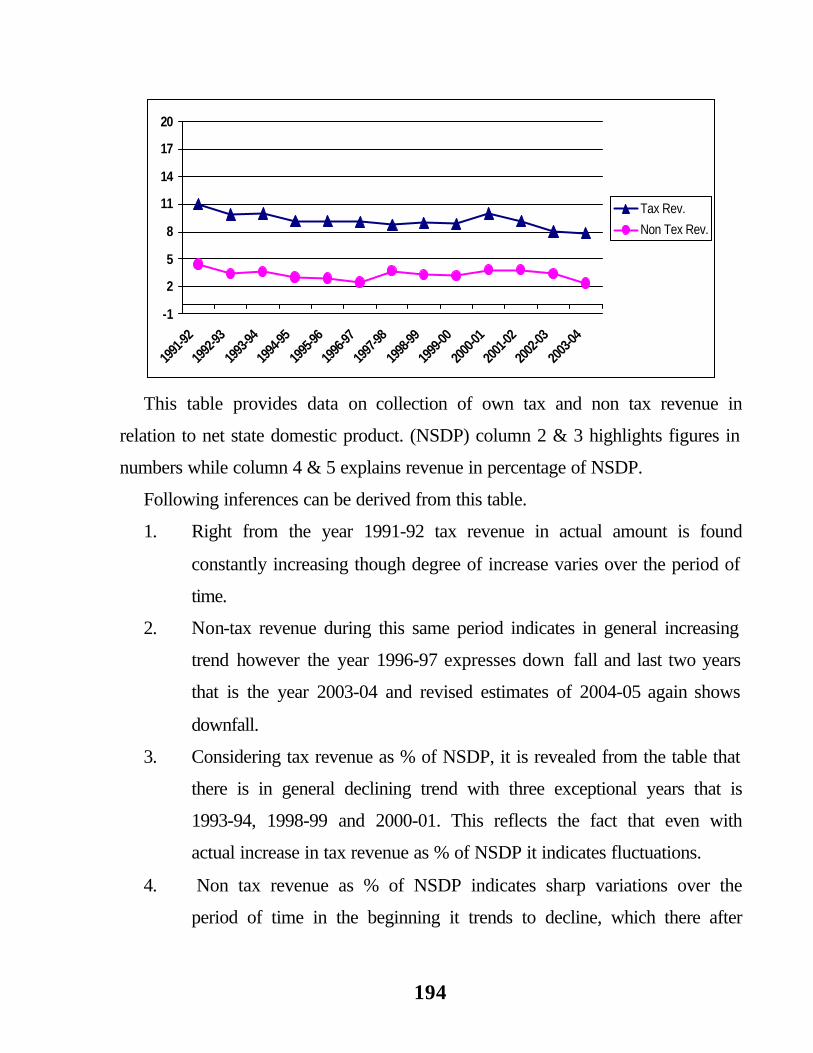
194
-1
2
5
8
11
14
17
20
1991
-92
1992
-93
1993
-94
1994
-95
1995
-96
1996
-97
1997
-98
1998
-99
1999
-00
2000
-01
2001
-02
2002
-03
2003
-04
Tax Rev.
Non Tex Rev.
This table provides data on collection of own tax and non tax revenue in
relation to net state domestic product. (NSDP) column 2 & 3 highlights figures in
numbers while column 4 & 5 explains revenue in percentage of NSDP.
Following inferences can be derived from this table.
1. Right from the year 1991-92 tax revenue in actual amount is found
constantly increasing though degree of increase varies over the period of
time.
2. Non-tax revenue during this same period indicates in general increasing
trend however the year 1996-97 expresses down fall and last two years
that is the year 2003-04 and revised estimates of 2004-05 again shows
downfall.
3. Considering tax revenue as % of NSDP, it is revealed from the table that
there is in general declining trend with three exceptional years that is
1993-94, 1998-99 and 2000-01. This reflects the fact that even with
actual increase in tax revenue as % of NSDP it indicates fluctuations.
4. Non tax revenue as % of NSDP indicates sharp variations over the
period of time in the beginning it trends to decline, which there after
195
showed slight increase again it went down a little and it tends to rise how
ever the last two years of 2002-03 and 2003-04 expresses declining over
the previous year.
5. Tax revenue as % of NSDP is found to have maximum increase in the
year 1991-92 (11.81%) and minimum rise is found in the year 2003-04
(7.84%) thus the gap between the maximum and minimum tends to be of
3.24% points.
In case of non-tax revenue the trend is found similar. It indicates maximum rise
in % of NSDP in the year 1991-92 that is 4.35% while in the year 2003-04 it tends
to be of minimum that is 2.29%. This indicates gap of about 2.06% point.
Tax revenue in rupees indicates the gap between the year 2004-05 and 1991-92
is of about rupees 9644 crores, while non tax revenue in rupees is found minimum
in 1991-92 and maximum in 2002-03, the gap between the two years is of about
rupees 2861 crores.
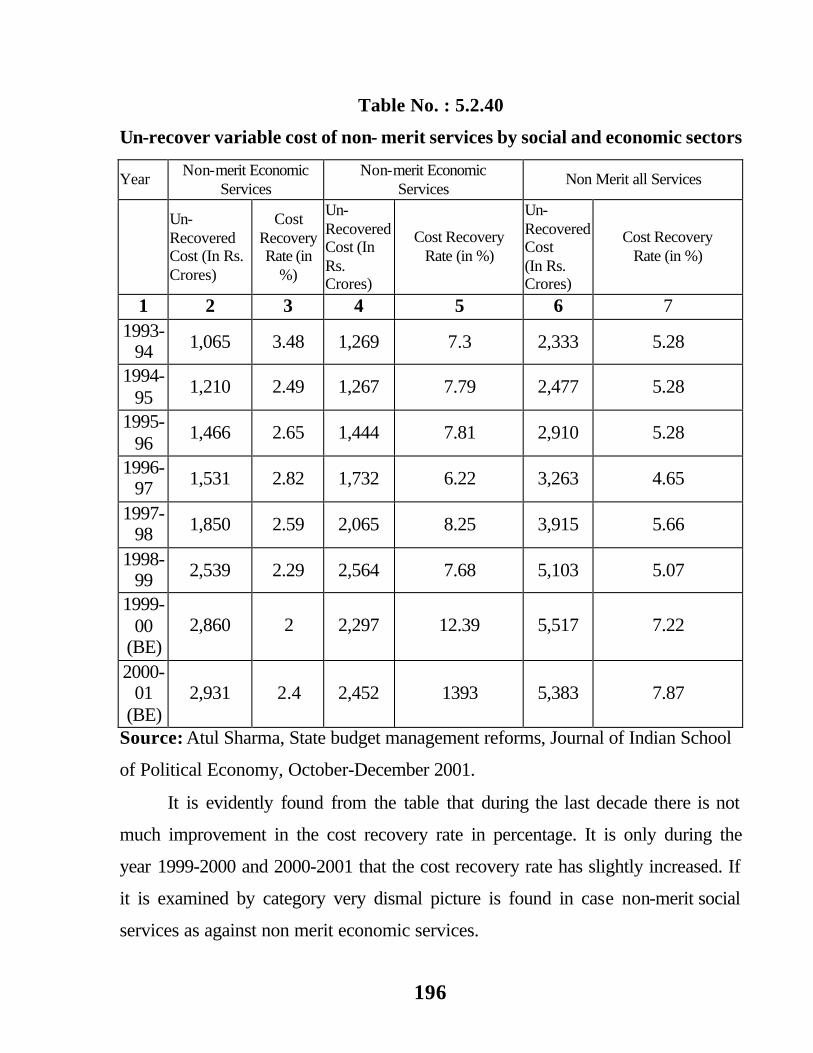
196
Table No. : 5.2.40
Un-recover variable cost of non- merit services by social and economic sectors
Year Non-merit Economic
Services Non-merit Economic
Services Non Merit all Services
Un-Recovered Cost (In Rs. Crores)
Cost Recovery Rate (in
%)
Un-Recovered Cost (In Rs. Crores)
Cost Recovery Rate (in %)
Un-Recovered Cost (In Rs. Crores)
Cost Recovery Rate (in %)
1 2 3 4 5 6 7 1993-
94 1,065 3.48 1,269 7.3 2,333 5.28
1994-95
1,210 2.49 1,267 7.79 2,477 5.28
1995-96
1,466 2.65 1,444 7.81 2,910 5.28
1996-97 1,531 2.82 1,732 6.22 3,263 4.65
1997-98 1,850 2.59 2,065 8.25 3,915 5.66
1998-99 2,539 2.29 2,564 7.68 5,103 5.07
1999-00
(BE) 2,860 2 2,297 12.39 5,517 7.22
2000-01
(BE) 2,931 2.4 2,452 1393 5,383 7.87
Source: Atul Sharma, State budget management reforms, Journal of Indian School
of Political Economy, October-December 2001.
It is evidently found from the table that during the last decade there is not
much improvement in the cost recovery rate in percentage. It is only during the
year 1999-2000 and 2000-2001 that the cost recovery rate has slightly increased. If
it is examined by category very dismal picture is found in case non-merit social
services as against non merit economic services.
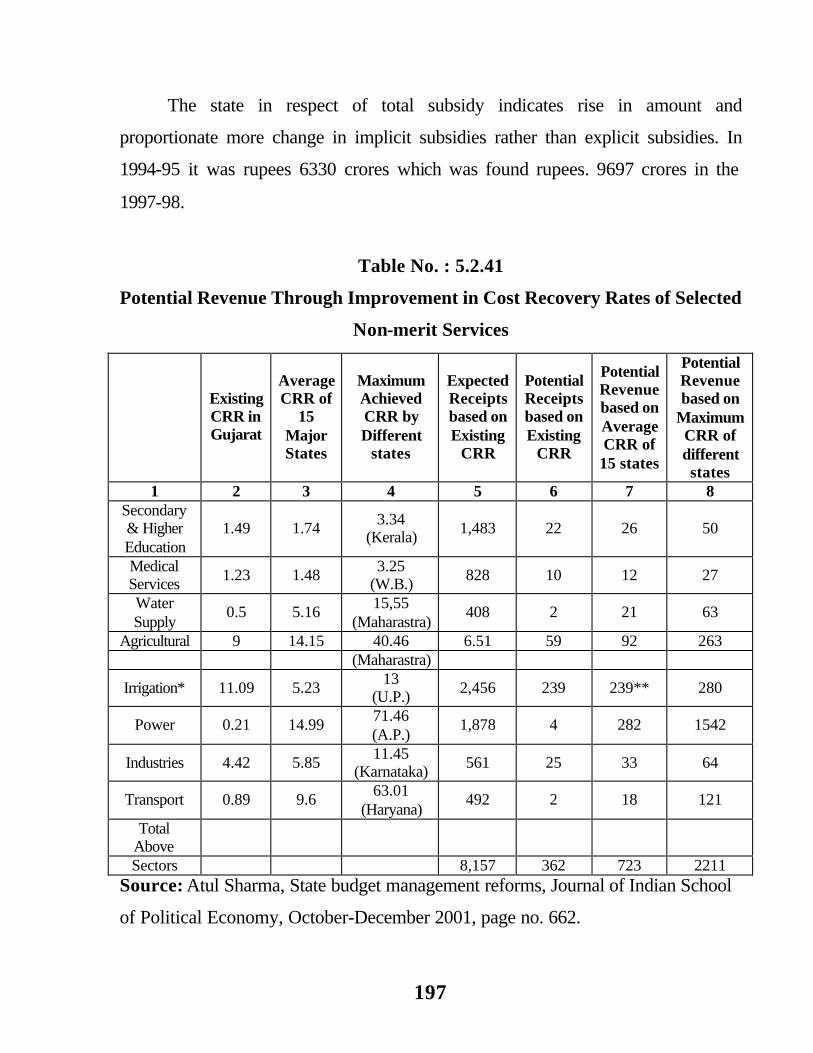
197
The state in respect of total subsidy indicates rise in amount and
proportionate more change in implicit subsidies rather than explicit subsidies. In
1994-95 it was rupees 6330 crores which was found rupees. 9697 crores in the
1997-98.
Table No. : 5.2.41
Potential Revenue Through Improvement in Cost Recovery Rates of Selected
Non-merit Services
Existing CRR in Gujarat
Average CRR of
15 Major States
Maximum Achieved CRR by Different
states
Expected Receipts based on Existing
CRR
Potential Receipts based on Existing
CRR
Potential Revenue based on Average CRR of 15 states
Potential Revenue based on
Maximum CRR of different states
1 2 3 4 5 6 7 8 Secondary & Higher Education
1.49 1.74 3.34
(Kerala) 1,483 22 26 50
Medical Services
1.23 1.48 3.25
(W.B.) 828 10 12 27
Water Supply
0.5 5.16 15,55
(Maharastra) 408 2 21 63
Agricultural 9 14.15 40.46 6.51 59 92 263 (Maharastra)
Irrigation* 11.09 5.23 13
(U.P.) 2,456 239 239** 280
Power 0.21 14.99 71.46 (A.P.)
1,878 4 282 1542
Industries 4.42 5.85 11.45
(Karnataka) 561 25 33 64
Transport 0.89 9.6 63.01
(Haryana) 492 2 18 121
Total Above
Sectors 8,157 362 723 2211 Source: Atul Sharma, State budget management reforms, Journal of Indian School
of Political Economy, October-December 2001, page no. 662.
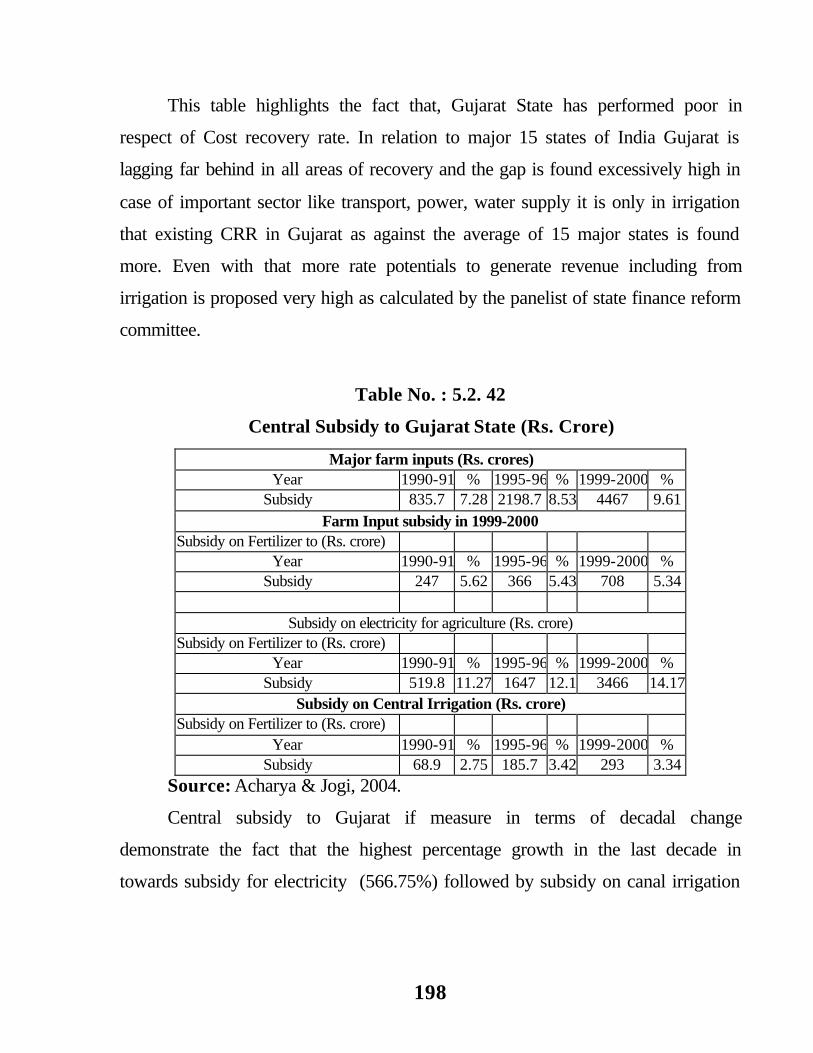
198
This table highlights the fact that, Gujarat State has performed poor in
respect of Cost recovery rate. In relation to major 15 states of India Gujarat is
lagging far behind in all areas of recovery and the gap is found excessively high in
case of important sector like transport, power, water supply it is only in irrigation
that existing CRR in Gujarat as against the average of 15 major states is found
more. Even with that more rate potentials to generate revenue including from
irrigation is proposed very high as calculated by the panelist of state finance reform
committee.
Table No. : 5.2. 42
Central Subsidy to Gujarat State (Rs. Crore)
Major farm inputs (Rs. crores) Year 1990-91 % 1995-96 % 1999-2000 %
Subsidy 835.7 7.28 2198.7 8.53 4467 9.61
Farm Input subsidy in 1999-2000 Subsidy on Fertilizer to (Rs. crore)
Year 1990-91 % 1995-96 % 1999-2000 % Subsidy 247 5.62 366 5.43 708 5.34
Subsidy on electricity for agriculture (Rs. crore) Subsidy on Fertilizer to (Rs. crore)
Year 1990-91 % 1995-96 % 1999-2000 % Subsidy 519.8 11.27 1647 12.1 3466 14.17
Subsidy on Central Irrigation (Rs. crore) Subsidy on Fertilizer to (Rs. crore)
Year 1990-91 % 1995-96 % 1999-2000 % Subsidy 68.9 2.75 185.7 3.42 293 3.34
Source: Acharya & Jogi, 2004.
Central subsidy to Gujarat if measure in terms of decadal change
demonstrate the fact that the highest percentage growth in the last decade in
towards subsidy for electricity (566.75%) followed by subsidy on canal irrigation

199
of 325.11% . Subsidy for fertilizer increased to 186.63% and for farm input it was
43.44%.
Table No. : 5.2.43
State Governments Liabilities (Total Debt.)
2000-01 2001-02 2002-03 2003-04 All States 498092 586687 688421 791400 Gujarat 29786 36938 46771 55318 % to all states 5 6 6 6 % to GSDP 27 30 33 33
Source: Budget documents and socio economic review, directorate of economics
and statistics Govt. of Gujarat, Gandhinagar.
0
5
10
15
20
25
30
35
2000-01 2001-02 2002-03 2003-04
% to GSDP
% to GSDP

200
Table No. : 5.2.44
Department wise Guarantee outstanding
Name of Department 1997-98 1998-99 1999-00 2000-01 2001-02 2002-03 2003-04 Agriculture & Co- operation Department
15253 165330 162083 154765 168149 158100 144706
(16.80) (14.77) (12.05) (8.95) (8.98) (8.32) (8.21) Industries and Mines Department
96369 92591 85415 103331 91280 89213 84824
(10.63) (8.27) (6.35) (5.97) (4.88) (4.70) (4.81) Panchayat & Rural Housing Department
11529 11699 11383 13513 13612 13716 14021
(1.27) (1.05) (0.85) (0.78) (0.73) (0.72) (0.80) Urban Development & Urban Housing Department
49146 49828 60278 76452 77895 78059 55689
(5.42) (4.45) (4.48) (4.42) (4.16) (4.11) (3.16) Ports & Fisheries Department
705 705 705 630 630 35 30
(0.08) (0.06) (0.05) (0.04) (0.03) - - N armada Water Resources Department
144681 324222 435787 524287 664587 687707 653583
(15.96) (28.95) (32.40) (30.31) (35.49) (36.19) (37.08) Home Department 4879 9959 44959 44765 64411 64411 64411 (0.54) (0.89) (3.35) (2.59) (3.44) (3.39) (3.65) Energy & Petro-chemical Department
442312 446258 533916 797300 723327 737711 718647
(48.78) (39.85) (39.70) (46.09) (38.63) (38.82) (40.78) Forest & Environment Department
820 820 820 820 820 820 820
(0.09) (0.07) (0.06) (0.05) (0.04) (0.04) (0.05) Food, Civil Supply & Customer Affairs Department
2920 10300 300 2800 300 - -
(0.32) (0.92) (0.02) (0.16) (0.02) - - Social Justice and Empowerment Department
7420 8648 10666 12676 15674 12709
(0.66) (0.64) (0.62) (0.68) (0.83) (0.72) Tribal Development Department
- - - - - 2492
- - - - (0.14)
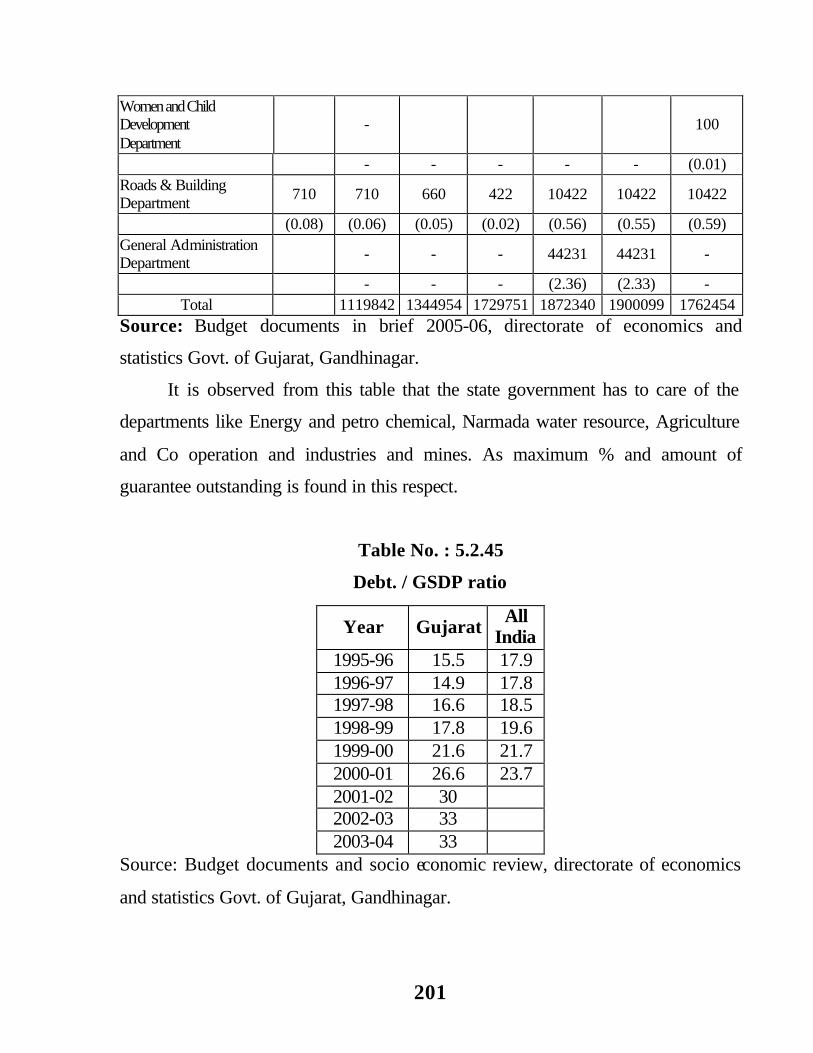
201
Women and Child Development Department
- 100
- - - - - (0.01) Roads & Building Department
710 710 660 422 10422 10422 10422
(0.08) (0.06) (0.05) (0.02) (0.56) (0.55) (0.59) General Administration Department
- - - 44231 44231 -
- - - (2.36) (2.33) - Total 1119842 1344954 1729751 1872340 1900099 1762454
Source: Budget documents in brief 2005-06, directorate of economics and
statistics Govt. of Gujarat, Gandhinagar.
It is observed from this table that the state government has to care of the
departments like Energy and petro chemical, Narmada water resource, Agriculture
and Co operation and industries and mines. As maximum % and amount of
guarantee outstanding is found in this respect.
Table No. : 5.2.45
Debt. / GSDP ratio
Year Gujarat All India
1995-96 15.5 17.9 1996-97 14.9 17.8 1997-98 16.6 18.5 1998-99 17.8 19.6 1999-00 21.6 21.7 2000-01 26.6 23.7 2001-02 30 2002-03 33 2003-04 33
Source: Budget documents and socio economic review, directorate of economics
and statistics Govt. of Gujarat, Gandhinagar.
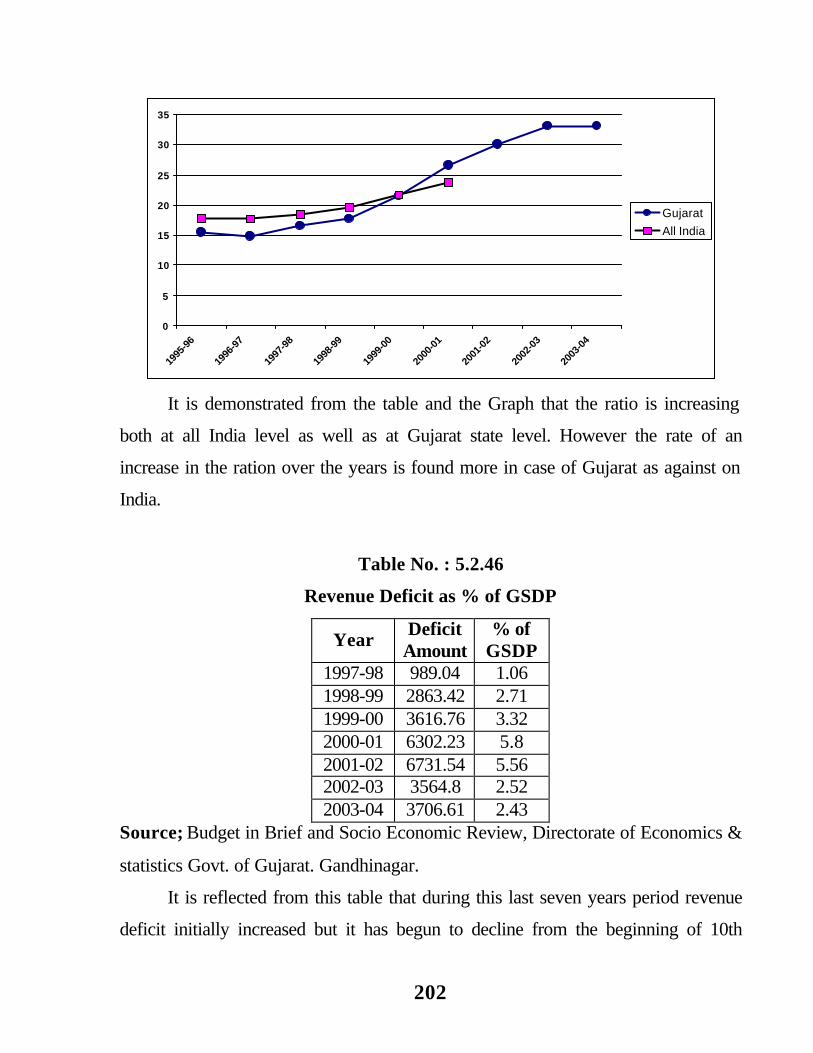
202
0
5
10
15
20
25
30
35
1995
-96
1996
-97
1997
-98
1998
-99
1999
-00
2000
-01
2001
-02
2002
-03
2003
-04
Gujarat
All India
It is demonstrated from the table and the Graph that the ratio is increasing
both at all India level as well as at Gujarat state level. However the rate of an
increase in the ration over the years is found more in case of Gujarat as against on
India.
Table No. : 5.2.46
Revenue Deficit as % of GSDP
Year Deficit Amount
% of GSDP
1997-98 989.04 1.06 1998-99 2863.42 2.71 1999-00 3616.76 3.32 2000-01 6302.23 5.8 2001-02 6731.54 5.56 2002-03 3564.8 2.52 2003-04 3706.61 2.43
Source; Budget in Brief and Socio Economic Review, Directorate of Economics &
statistics Govt. of Gujarat. Gandhinagar.
It is reflected from this table that during this last seven years period revenue
deficit initially increased but it has begun to decline from the beginning of 10th
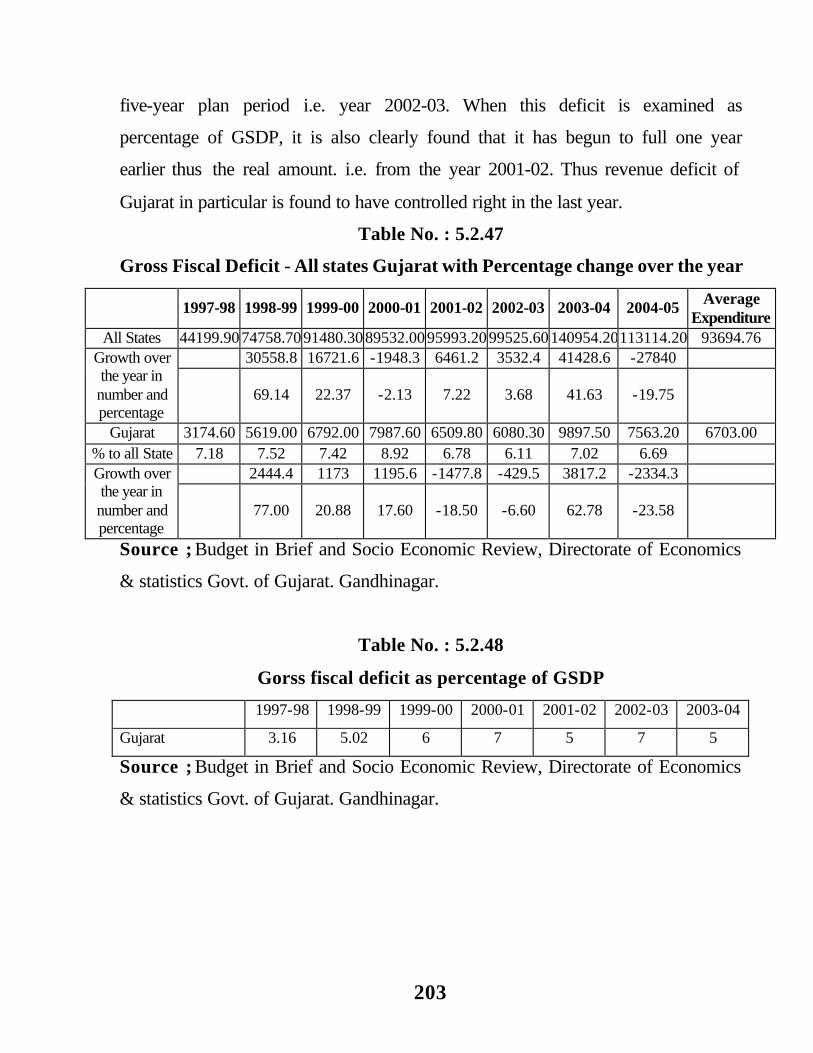
203
five-year plan period i.e. year 2002-03. When this deficit is examined as
percentage of GSDP, it is also clearly found that it has begun to full one year
earlier thus the real amount. i.e. from the year 2001-02. Thus revenue deficit of
Gujarat in particular is found to have controlled right in the last year.
Table No. : 5.2.47
Gross Fiscal Deficit - All states Gujarat with Percentage change over the year
1997-98 1998-99 1999-00 2000-01 2001-02 2002-03 2003-04 2004-05 Average Expenditure
All States 44199.9074758.7091480.3089532.0095993.2099525.60140954.20113114.20 93694.76 30558.8 16721.6 -1948.3 6461.2 3532.4 41428.6 -27840 Growth over
the year in number and percentage
69.14 22.37 -2.13 7.22 3.68 41.63 -19.75
Gujarat 3174.60 5619.00 6792.00 7987.60 6509.80 6080.30 9897.50 7563.20 6703.00 % to all State 7.18 7.52 7.42 8.92 6.78 6.11 7.02 6.69
2444.4 1173 1195.6 -1477.8 -429.5 3817.2 -2334.3 Growth over the year in number and percentage
77.00 20.88 17.60 -18.50 -6.60 62.78 -23.58
Source ; Budget in Brief and Socio Economic Review, Directorate of Economics
& statistics Govt. of Gujarat. Gandhinagar.
Table No. : 5.2.48
Gorss fiscal deficit as percentage of GSDP
1997-98 1998-99 1999-00 2000-01 2001-02 2002-03 2003-04
Gujarat 3.16 5.02 6 7 5 7 5
Source ; Budget in Brief and Socio Economic Review, Directorate of Economics
& statistics Govt. of Gujarat. Gandhinagar.
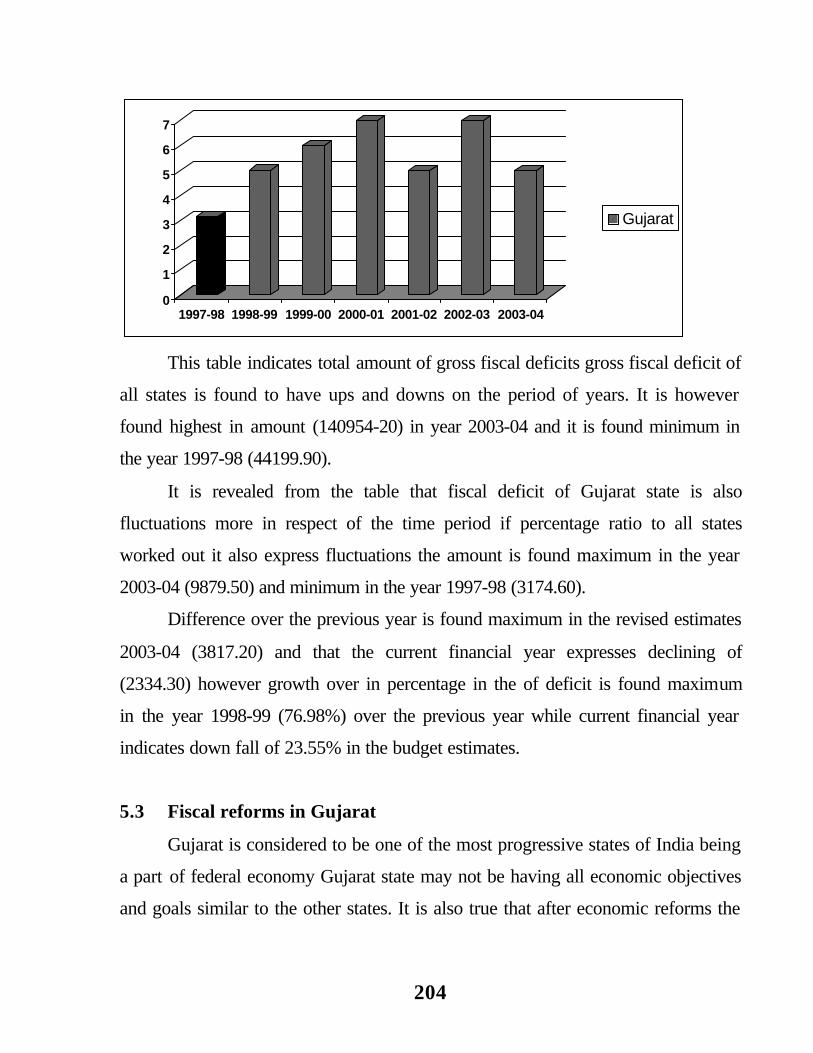
204
0
1
2
3
4
5
6
7
1997-98 1998-99 1999-00 2000-01 2001-02 2002-03 2003-04
Gujarat
This table indicates total amount of gross fiscal deficits gross fiscal deficit of
all states is found to have ups and downs on the period of years. It is however
found highest in amount (140954-20) in year 2003-04 and it is found minimum in
the year 1997-98 (44199.90).
It is revealed from the table that fiscal deficit of Gujarat state is also
fluctuations more in respect of the time period if percentage ratio to all states
worked out it also express fluctuations the amount is found maximum in the year
2003-04 (9879.50) and minimum in the year 1997-98 (3174.60).
Difference over the previous year is found maximum in the revised estimates
2003-04 (3817.20) and that the current financial year expresses declining of
(2334.30) however growth over in percentage in the of deficit is found maximum
in the year 1998-99 (76.98%) over the previous year while current financial year
indicates down fall of 23.55% in the budget estimates.
5.3 Fiscal reforms in Gujarat
Gujarat is considered to be one of the most progressive states of India being
a part of federal economy Gujarat state may not be having all economic objectives
and goals similar to the other states. It is also true that after economic reforms the
205
state in general tend to follow their own development strategy – necessarily in
coeternity the broad national objectives.
What is important for the state economy is the budgetary policy applied as
part of the planning process ?
Certain indicatory clearly indicate vergening fiscal state of much state in
India. It is clearly admitted even in the tenth finance commission report that the
states have passed through three phases of deterioration in the revenue account
balance. The first phase can be referred up to the period of 1986-87 in which the
non plan account surplus low larger that the plan deficit between 1986-87 and
1990-92 the plan deficit increased sharply and exceeded over the shrinking non
plan surplus. The third phase from 1991-92 marked the beginning of growing
deficit on non-plan revenue account.
This observation of finance commission however does not hold true in the
same respect in case of Gujarat state actually in Gujarat the plan revenue account
yielded deficit from 1985-86 there was however surplus on non-plan account
accept for 1990-91. But revenue expenditure exceeded over revenue receipts
continuous from 1985-86. The total fiscal health of the state is found worsening
both because of failure on the part of revenue general and failure on the part of
revenue general and failure in curtaining public expenditure as long as revenue part
is concerned it is clearly found that even after reforms tax, income, ratio is found
higher than the three state like Hariyana, Punjab and Maharastra these states are
above income scale aggregate revenue of the state grew almost at the rate of
14.47% per year in between 1978 to 1999. Some was the rate found during the first
seven years of reforms. However the state own tax revenue growth slumped from
15.66% per year in the previous period to 13.44% per year in the later period.
206
Taxation in general reveals the fact that government has not utilized the
instruments to mobilized resources. It is true that even with this the state is having
better performance over the other progession state but designing of the taxation is
not found up to the mark even after reforms the major draw back found regarding
the tax syatem are narrow tax base, accessive dependence on input taxation lenthi
administrative procedure – undue and un desirable incentives and axamptions. It is
because of these sorts coming that tax revenue has fail to grow with the state
income growth in the last two years. More attempts are made in this direction to
simplify the tax structure and to cationalise tax procedure.
One very important area demanding attention respect of revenue
mobilization is the receipts from state own enterprises and departmentely runs
schems. The state is having considerably low forest converse there for there is very
stille scope for ogmenting the receipts from forest in Gujarat. Mining is an
important area of revenue but royalty fixation is again the perview of union govt.
hance there are limitations. The state govt. has tried to short out some areas of
resource mobilization as water user charge is one of the area Vaidyanathan
committee has also make recommendation for water rate fixation how ever no
correct actions are follow in that direction.
The state has forty Govt. company inclusive of seven subsidiary. Six deemed
company and five statutory corporation. The state finance commission examvie
closely the working of state own enterprises and made important specific
recommendation for restructuring privatizati, murger dis investment. Frequent
discussion and delebration are made with concerned authority and as part of the
public sector restructuring programme as per the later Govt. resolution issued in
September 2004. The state Govt. has departed from the central Govt. present
policy for dis investment. As per the resolution issued by the finance department it
speaks about broadening the scope of restructuring PSU and joint sector

207
companies. The notification makes the finance department the model agency for
doing the job, which could include the merger of some of these companies.
The twelve PSU that have been identified for the restructuring process are
Gujarat State Fertilizer and Chemicals (GSFC), Gujarat Narmada Velley Fertilizer
Company (GNFC), Gujarat Industrial Power Company Limited (GIPCL) Gujarat
Alkalies and Chemical Limited (GACL), Gujarat Mineral Development
Corporation (GMDC), Gujarat Industrial Investment Corporation (GIIC), Gujarat
Industrial Development Corporation (GIDC), Gujarat State Ware Housing
Corporation, Gujarat State Petroleum Corporation (GSPC) and Gujarat
Corporation.
An attempt is made to work out transparent procedure, dis investment or
privatization will be done in consultation with the technical secretoriate after
preparing document and inviting expression of invest. The technical secretariat
after examining the viability of the PSU will decide about the merger or closure it
would necessarily include the issue of payment to employees who might have to be
offered a voluntary retirement scheme.
The most important blue cheap PSU. Which could be up for graps is SPC.
Whose net assets were worth Rs. 600 crores with a profit of Rs. 2500 crores in the
year 2002-03. GSPC is currently involved in large-scale oil exploration and
distribution. GMDc net worth Rs. 400 crore and GNFC have also been caring
profit for longe. GSFC and GACL two have lately begane to
show a turn around and could be lucrative for investors.
A similar fate is awaited for GIDC which has a net worth of Rs. 1400 crores.
Companies whose liabilities are more than assecten can face either closure or
merger. GIIC and GSFC (finance) are running in to loss. Plants did exist for their
murging of these twelve units six are listed company on the block while the
remaining six are not listed.

208
The state Govt. is experiencing the issue regarding the effectiveness of
expenditure, it is precisely more important because of rise in non-developmental
expenditure during 1990-1998 the non-developmental expenditure as % of total
revenue expenditure was 31%. Gujarat had allocated larger proportion more the
2/3 of the revenue expenditure for development activities during 1990-1998 except
Gujarat, Maharashtra was the only state having made highest provision for the
developmental activities. It examined from the sectoral point of view within
development expenditure economic service have an edge over social services in
revenue expenditure allocation but communication to capital expenditure, social
services received not only lesser share but that it was also shrinking over time. The
some tress is also found in respect of economic service share in capital expenditure
in relation to the state aggregate public expenditure. It is a matter of great
concerned for the state like Gujarat to have continuously in economic and social
public expenditure. If the trend continuous it is but likely that physical and social
infrastructure constrain would be obstacle in Gujarat growth at a higher rate.
Economist, Social Scientist have also expressed concerned over declining state
expenditure on education and health.
The most important element for which drastic reforms majors are sought for
is the expenditure in terms of interest liability and establishment. Interest liability
had grown at the rate of 12.15% per year during 1978-91 it however continued to
grow at the rate of 16.85% per year during 1991-98. Interest expenditure has
virtually affected the financing of revenue deficits.
Establishment expenditure is not debatable issue, it include wages and
salaries. International institutions have naturally asked to cut the establishment
expenditure to the maximum extent possible because of implementation of the fifth
pay commission the state Govt. incurred the charge of about Rs. 15 billion is ariars
of pay between January 1st 1996 and March 31st 1998 and there after annyly by
209
another Rs. 11 billion. The Sorry state of affairs is that the rise in establishment
expenditure, which has increased at the rate of 15.43% per year is not because of
growth in employment but because of rising emolument per employee.
State finance commission has examined the issue very closely it
recommended two proaged strategy to reduce the number of employees and
improve productivity. That includes a time bound comprehensive programme of
administrative reforms to be under taken at all levels of Govt. in order to stream
line procegeours and improve productivity. The second part of the strategy is
aimed at reducing the number of Govt. employee by hiving off organization and
activities not in relevance with the basic objective of the Govt. a matter still under
consideration for introducing a scheme of VRS (Voluntary Retirement Scheme)
with attractive package. Govt. of Gujarat precisely in the last two to three years has
under taken the task of conducting several programmes to add to the operational
efficiency of employees. It is however to early to be fully positive about the out
come of such courses but it has definitely served the purpose as long as awaited in
administration is concerned.
Another important freature twards reform is implementation of downsizing
the size of ministry. All the states and even central Govt. has become more vigilant
in the regard. It is recommended as a part of political economic reforms in fiscal
administration that no ruling party can frame the government (ministry) exceeding
the size of maximum 10 percentages to the total assembly members. Similarly it is
also expected from the states that only those corporations, which are most relevant
to the socio-economic needs of the society and that they remain beyond large
viable to sustain should be continued with. And extra political chairmanship at the
boards should be avoided.
This seems to be more problematic for the states from political point of
view. However Gujarat’s present chief minister has made bold initiavites in this
210
regard, size of ministry till date is restricted despite grumbling of dissidents.
Chairmanship is also not favoured to the ruling party members despite pressures.
This is a well coming move at least to save huge amount of Govt. funds, which
could have otherwise deviated to this purpose.
The state government has realized the seriousness of deteriorating
fiscal and monitory of the state. Therefore the state has largely adopted the
following policy measures.
1. 20% cut in establishment structure.
2. Necessary reform in the taxation structure.
3. To cut the size of non-productive expenditure.
4. Ban on recruitment.
5. In case of necessity new recruitment to be made strictly on new norms of
fixed pay system. Particularly in the field of education Vidya Sahayak
and in electricity board Vidyut Sahak.
6. To assimilate small sections into large one.
7. To cancel un viable and un necessary schemes.
The state government has already closed state own enterprises like State
Textiles Corporation, Dairy Development Corporation, Small Industries
Corporation, Housing Corporation, Fisheries Corporation, Film Development
Corporation, Slum Clearance Board and Communication and Electronics
limited.
60% equity of Gujarat Tractor Corporation is transferred to Mahindra and
Mahindra Ltd and 45.6% of the share is proposed to Adani Exports Ltd. by
Gujarat State Export Corporation.
Besides with the instruction of Govt. of India, Gujarat State Handicraft
Development Corporation is merged with Gujarat Handloom Development

211
Corporation and Gujarat State Lather Industries Development Corporation is
merged with Gujarat Rural Industries Market Corporation.
Recently State Electricity Board is bifurcated into 7 zones the transmission
and distribution and also bifurcated though full fledged reforms are to take
place from 1st April 2005 the approximate revenue figure that is generate in the
last 3 months is found to have increase over the previous time period.