Sasol Production and Sales Metrics September 2019 1...Sasol Limited Group Sasol Production and Sales...
10
Sasol Production and Sales Metrics September 2019 1
Transcript of Sasol Production and Sales Metrics September 2019 1...Sasol Limited Group Sasol Production and Sales...
Sasol Production and Sales Metrics September 2019 1

Sasol Limited Group
Sasol Production and Sales Metrics September 2019 2
Mining
Striving towards zero harm, improved productivity a key focusIn Q1 FY20, we experienced two tragic work-related fatalities at the Thubelisha colliery. We are extremely disheartened by these events, and we will continue to strive towards our goal of zero harm and eliminating these tragedies. These safety incidents negatively impacted our operational performance, resulting in productivity of 1 195 t/cm/s* for the quarter. This is despite an improved production performance for the first two months of the quarter, during which the productivity rate achieved was 5% higher than the prior year average.
Sales volumes for internal customers were higher than the comparative Q1 FY19 due to the extended total West factory shutdown at Secunda Synfuels Operations (SSO) in Q1 FY19. We continue to maintain inventory within target levels, and expect our full year external purchases to be in line with the prior year levels as we ramp up productivity.
For FY20, supported by our Business Improvement Programme (Siyenza), we are targeting productivity of approximately 1 295 t/cm/s.
% change YTD Sep YTD Sep Full year
2020 vs 2019 2020 2019 2019Production
Saleable production** mm tons – 9,5 9,5 36,1External purchases mm tons 36 1,5 1,1 5,2Internal sales
Energy mm tons 9 5,8 5,3 22,6Base Chemicals mm tons 19 3,2 2,7 13,5Performance Chemicals mm tons – 0,6 0,6 3,0
External salesInternational and other domestic mm tons 29 0,9 0,7 3,2
* Includes production outside of normal shifts** Saleable production represents total production adjusted for normal process discard arising from the coal beneficiation process at our export operations.
Q1 FY19 Q2 FY19 Q3 FY19 Q4 FY19 Q1 FY20 1100
1300
t/cm/shift
Mining productivity
Q1 FY19 Q2 FY19 Q3 FY19 Q4 FY19 Q1 FY20 0
4
8
12
Energy Base Chemicals Performance Chemicals External
Sales volumes (mm tons)

Sasol Limited Group
Sasol Production and Sales Metrics September 2019 3
Exploration and Production International
Consistent operational performance in MozambiqueMozambique production for the quarter is in line with the prior year. We expect gas production volumes from the Petroleum Production Agreement in Mozambique to be 114 - 118 bscf, despite expected lower internal consumption.
There were lower volumes in Gabon due to delayed drilling activities and a natural decline in the production wells. The delayed drilling activities and the natural decline in the production wells are expected to negatively impact production for the year compared to the prior year.
Canadian gas volumes were lower due to the natural decline. The liquid rich wells in Canada came online, which resulted in higher condensate volumes for the quarter. Despite the recently completed drilling activities in Canada, we expect production to be lower for the year due to the natural decline from the production wells.
% change YTD Sep YTD Sep Full year2020 vs 2019 2020 2019 2019
ProductionNatural gas - Mozambique (Sasol's 70% share) bscf – 29,8 29,8 114,0Condensate - Mozambique (Sasol's 70% share) m bbl (13) 58 66 249Crude oil Gabon (after royalties) m bbl (24) 241 316 1 158Natural gas - Canada bscf (9) 4,0 4,4 16,3Condensate - Canada m bbl 127 41 18 63
External salesNatural gas - Mozambique bscf 3 4,0 3,9 15,3Condensate - Mozambique m bbl (8) 56 61 247Crude oil Gabon (after royalties) m bbl (9) 248 272 1 042Natural gas - Canada bscf (9) 4,0 4,4 16,3Condensate - Canada m bbl 127 41 18 63
Internal sales - Natural gasMozambique to Energy bscf (6) 14,5 15,5 57,0Mozambique to Base Chemicals bscf 19 8,1 6,8 29,4Mozambique to Performance Chemicals bscf (14) 3,2 3,7 12,2
Q1 FY19 Q2 FY19 Q3 FY19 Q4 FY19 Q1 FY20 0
20
40
200
250
300
350
Natural gas - Mozambique Natural gas - Canada
Crude oil - Gabon
Production volumes
Nat
ural
gas
(bsc
f)
Cru
de o
il (m
bbl
)
Q1 FY19 Q2 FY19 Q3 FY19 Q4 FY19 Q1 FY20 0
10
20
30
Energy Base Chemicals Performance chemicals
Internal gas sales volumes (bscf)

Sasol Limited Group
Sasol Production and Sales Metrics September 2019 4
Energy
Strong liquid fuels volume performanceSSO total production volumes were 10% higher than prior year, mainly as a result of improved stability and the successful completion of a phase shutdown in FY20 compared to a total shutdown in FY19. The SSO full year production is forecasted to be 7,7 - 7,8 million tons. Natref maintained an optimal crude rate of 635m³/h in line with our production plan, despite 4% lower production volumes compared to Q1 FY19.
External white product purchases decreased by 31% compared to the prior year as a result of the continued strong performance from SSO and Natref. Liquid fuels sales increased by 2% mainly due to higher sales volumes in the wholesale channel driven by an increase in demand. We expect to achieve sales volumes of approximately 57 - 58 mm bbl for FY20. Natural gas sales volumes decreased by 2% due to lower market demand driven by the decline in the SA economy.
ORYX GTL achieved a utilisation rate of 99% for Q1 FY20. During the precautionary inspections indicated in our Q4 FY19 BPM release, an inspection of the cooling coils of both FT reactors revealed internal corrosion. Preventative maintenance and repair work required to restore coil integrity will be executed in an extended shutdown planned to begin in January 2020. As a result, we expect to achieve a utilisation rate of 55 - 60% for FY20.
EGTL production volumes were lower due to both trains being on a planned shutdown since August 2019. Both trains are expected to be back in operation by November 2019.
% change YTD Sep YTD Sep Full year2020 vs 2019 2020 2019 2019
ProductionSynfuels total refined product mm bbl 13 8,0 7,1 32,6Natref Crude oil (processed) mm bbl (3) 5,7 5,9 22,2 White product yield % 90,6 90,2 89,4 Total yield % 96,4 97,3 97,3 Production mm bbl (4) 5,5 5,7 21,6ORYX GTL Production mm bbl (6) 1,45 1,55 4,67 Utilisation rate of nameplate capacity % 99 106 81Escravos GTL (EGTL) Production (Sasol's 10% share) mm bbl (42) 0,07 0,12 0,69
External purchases (white product) mm bbl (31) 0,9 1,3 5,6
SalesLiquid fuels - white product mm bbl 3 14,1 13,7 57,5Liquid fuels - black product mm bbl (14) 0,6 0,7 2,5Natural gas bscf (2) 9,2 9,4 35,2Methane rich gas bscf – 5,6 5,6 21,8
Retail convenience centres (RCCs) number 411 396 410
Q1 FY19 Q2 FY19 Q3 FY19 Q4 FY19 Q1 FY20 0
4
8
12
16
20
Secunda Synfuels Natref
External Purchases Sales
Liquid fuels production and sales volumes
mm
bbl
Q1 FY19 Q2 FY19 Q3 FY19 Q4 FY19 Q1 FY20 0
4
8
12
16
Natural gas Methane rich gas
Gas sales volumes
bscf
Sasol Limited Group
Sasol Production and Sales Metrics September 2019 5
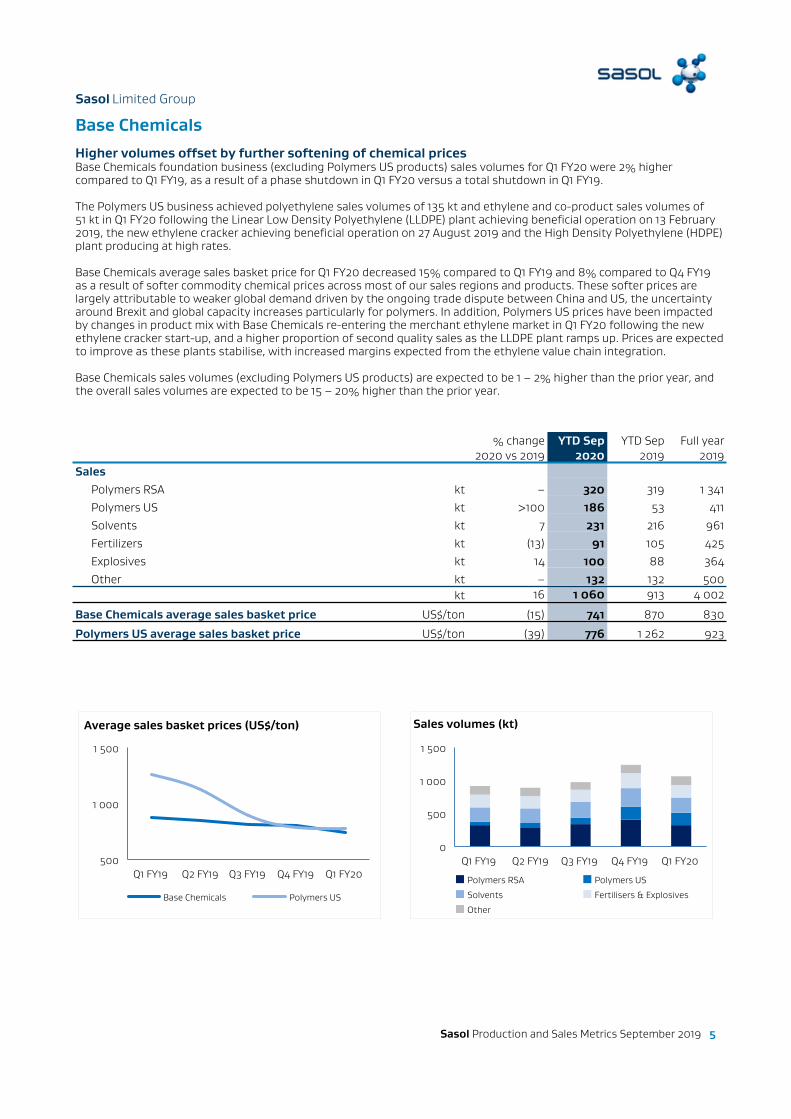
Base ChemicalsHigher volumes offset by further softening of chemical pricesBase Chemicals foundation business (excluding Polymers US products) sales volumes for Q1 FY20 were 2% higher compared to Q1 FY19, as a result of a phase shutdown in Q1 FY20 versus a total shutdown in Q1 FY19.
The Polymers US business achieved polyethylene sales volumes of 135 kt and ethylene and co-product sales volumes of 51 kt in Q1 FY20 following the Linear Low Density Polyethylene (LLDPE) plant achieving beneficial operation on 13 February 2019, the new ethylene cracker achieving beneficial operation on 27 August 2019 and the High Density Polyethylene (HDPE) plant producing at high rates.
Base Chemicals average sales basket price for Q1 FY20 decreased 15% compared to Q1 FY19 and 8% compared to Q4 FY19 as a result of softer commodity chemical prices across most of our sales regions and products. These softer prices are largely attributable to weaker global demand driven by the ongoing trade dispute between China and US, the uncertainty around Brexit and global capacity increases particularly for polymers. In addition, Polymers US prices have been impacted by changes in product mix with Base Chemicals re-entering the merchant ethylene market in Q1 FY20 following the new ethylene cracker start-up, and a higher proportion of second quality sales as the LLDPE plant ramps up. Prices are expected to improve as these plants stabilise, with increased margins expected from the ethylene value chain integration.
Base Chemicals sales volumes (excluding Polymers US products) are expected to be 1 – 2% higher than the prior year, and the overall sales volumes are expected to be 15 – 20% higher than the prior year.
% change YTD Sep YTD Sep Full year2020 vs 2019 2020 2019 2019
SalesPolymers RSA kt – 320 319 1 341Polymers US kt >100 186 53 411Solvents kt 7 231 216 961Fertilizers kt (13) 91 105 425Explosives kt 14 100 88 364Other kt – 132 132 500
kt 16 1 060 913 4 002
Base Chemicals average sales basket price US$/ton (15) 741 870 830
Polymers US average sales basket price US$/ton (39) 776 1 262 923
Q1 FY19 Q2 FY19 Q3 FY19 Q4 FY19 Q1 FY20 500
1 000
1 500
Base Chemicals Polymers US
Average sales basket prices (US$/ton)
Q1 FY19 Q2 FY19 Q3 FY19 Q4 FY19 Q1 FY20 0
500
1 000
1 500
Polymers RSA Polymers US
Solvents Fertilisers & Explosives
Other
Sales volumes (kt)
Sasol Limited Group
Sasol Production and Sales Metrics September 2019 6
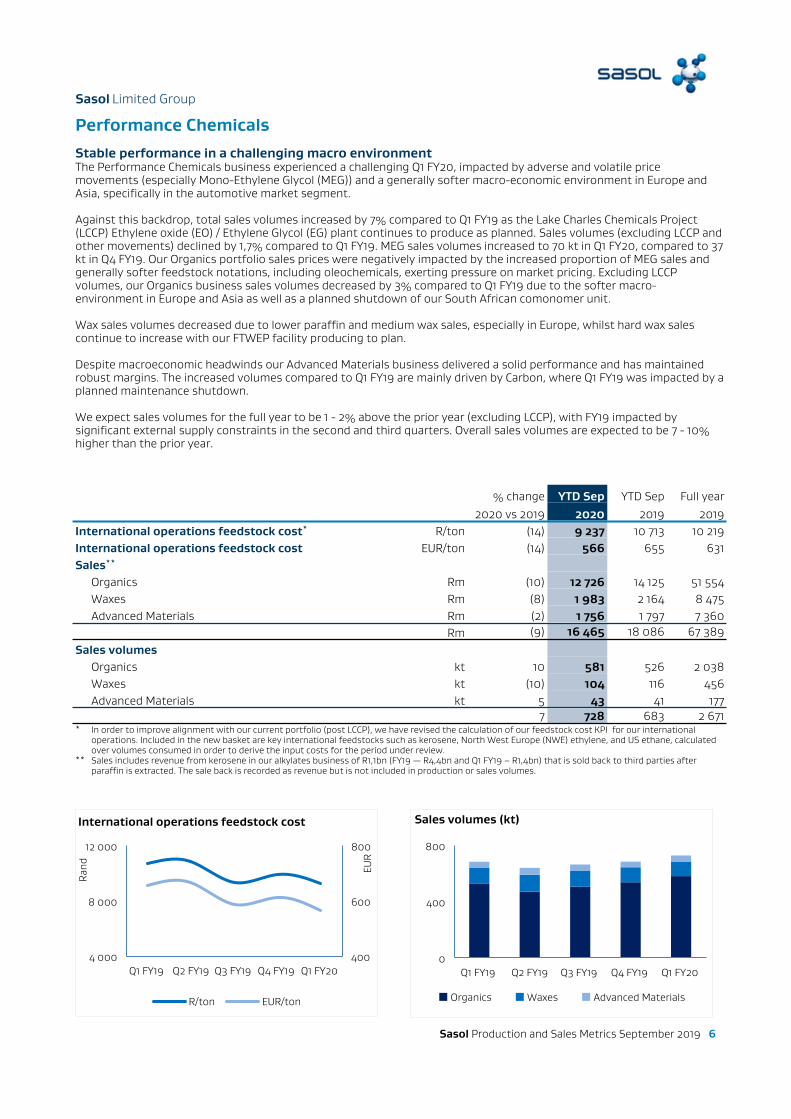
Performance ChemicalsStable performance in a challenging macro environmentThe Performance Chemicals business experienced a challenging Q1 FY20, impacted by adverse and volatile price movements (especially Mono-Ethylene Glycol (MEG)) and a generally softer macro-economic environment in Europe and Asia, specifically in the automotive market segment.
Against this backdrop, total sales volumes increased by 7% compared to Q1 FY19 as the Lake Charles Chemicals Project (LCCP) Ethylene oxide (EO) / Ethylene Glycol (EG) plant continues to produce as planned. Sales volumes (excluding LCCP and other movements) declined by 1,7% compared to Q1 FY19. MEG sales volumes increased to 70 kt in Q1 FY20, compared to 37 kt in Q4 FY19. Our Organics portfolio sales prices were negatively impacted by the increased proportion of MEG sales and generally softer feedstock notations, including oleochemicals, exerting pressure on market pricing. Excluding LCCP volumes, our Organics business sales volumes decreased by 3% compared to Q1 FY19 due to the softer macro-environment in Europe and Asia as well as a planned shutdown of our South African comonomer unit.
Wax sales volumes decreased due to lower paraffin and medium wax sales, especially in Europe, whilst hard wax sales continue to increase with our FTWEP facility producing to plan.
Despite macroeconomic headwinds our Advanced Materials business delivered a solid performance and has maintained robust margins. The increased volumes compared to Q1 FY19 are mainly driven by Carbon, where Q1 FY19 was impacted by a planned maintenance shutdown.
We expect sales volumes for the full year to be 1 - 2% above the prior year (excluding LCCP), with FY19 impacted by significant external supply constraints in the second and third quarters. Overall sales volumes are expected to be 7 - 10% higher than the prior year.
% change YTD Sep YTD Sep Full year2020 vs 2019 2020 2019 2019
International operations feedstock cost* R/ton (14) 9 237 10 713 10 219International operations feedstock cost EUR/ton (14) 566 655 631Sales**
Organics Rm (10) 12 726 14 125 51 554Waxes Rm (8) 1 983 2 164 8 475Advanced Materials Rm (2) 1 756 1 797 7 360
Rm (9) 16 465 18 086 67 389
Sales volumesOrganics kt 10 581 526 2 038Waxes kt (10) 104 116 456Advanced Materials kt 5 43 41 177
7 728 683 2 671* In order to improve alignment with our current portfolio (post LCCP), we have revised the calculation of our feedstock cost KPI for our international
operations. Included in the new basket are key international feedstocks such as kerosene, North West Europe (NWE) ethylene, and US ethane, calculated over volumes consumed in order to derive the input costs for the period under review.
** Sales includes revenue from kerosene in our alkylates business of R1,1bn (FY19 ‒ R4,4bn and Q1 FY19 – R1,4bn) that is sold back to third parties after paraffin is extracted. The sale back is recorded as revenue but is not included in production or sales volumes.
Q1 FY19 Q2 FY19 Q3 FY19 Q4 FY19 Q1 FY20 4 000
8 000
12 000
400
600
800
R/ton EUR/ton
International operations feedstock cost
Rand EU
R
Q1 FY19 Q2 FY19 Q3 FY19 Q4 FY19 Q1 FY20 0
400
800
Organics Waxes Advanced Materials
Sales volumes (kt)
Sasol Limited Group
Sasol Production and Sales Metrics September 2019 7
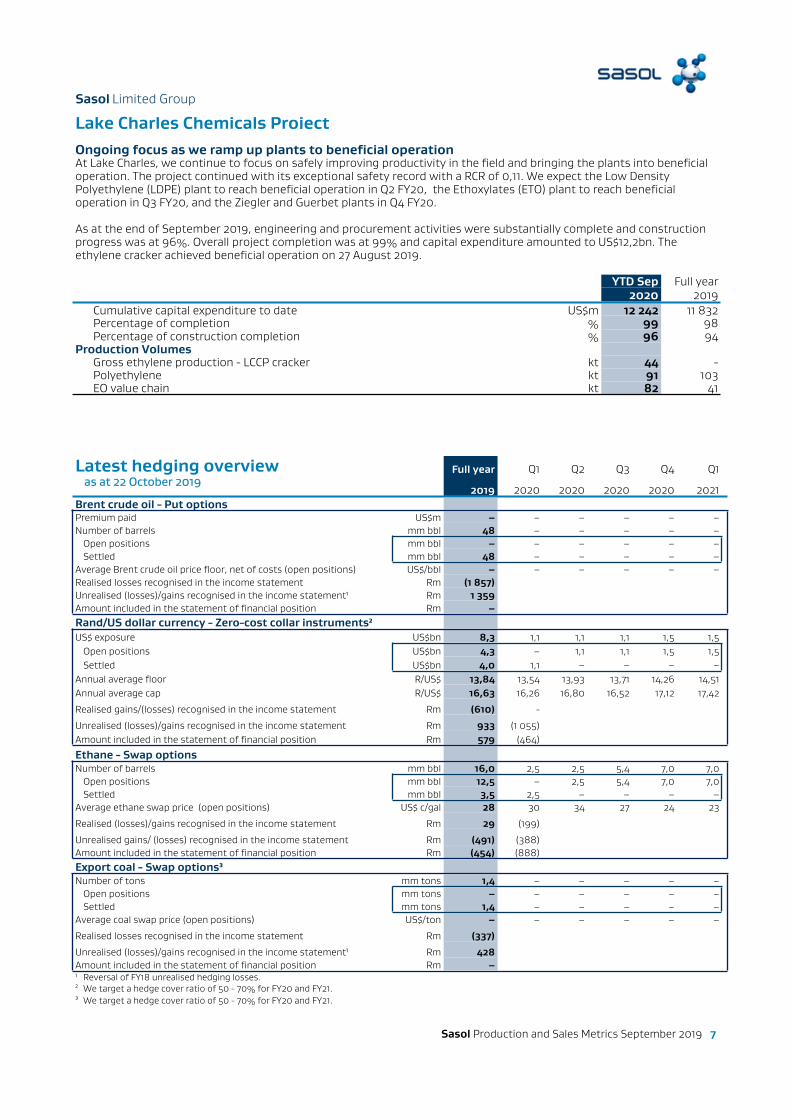
Lake Charles Chemicals ProjectOngoing focus as we ramp up plants to beneficial operationAt Lake Charles, we continue to focus on safely improving productivity in the field and bringing the plants into beneficial operation. The project continued with its exceptional safety record with a RCR of 0,11. We expect the Low Density Polyethylene (LDPE) plant to reach beneficial operation in Q2 FY20, the Ethoxylates (ETO) plant to reach beneficial operation in Q3 FY20, and the Ziegler and Guerbet plants in Q4 FY20.
As at the end of September 2019, engineering and procurement activities were substantially complete and construction progress was at 96%. Overall project completion was at 99% and capital expenditure amounted to US$12,2bn. The ethylene cracker achieved beneficial operation on 27 August 2019.
YTD Sep Full year2020 2019
Cumulative capital expenditure to date US$m 12 242 11 832Percentage of completion % 99 98Percentage of construction completion % 96 94
Production VolumesGross ethylene production - LCCP cracker kt 44 -Polyethylene kt 91 103EO value chain kt 82 41
Latest hedging overview Full year Q1 Q2 Q3 Q4 Q1as at 22 October 2019
2019 2020 2020 2020 2020 2021Brent crude oil - Put optionsPremium paid US$m – – – – – –Number of barrels mm bbl 48 – – – – –
Open positions mm bbl – – – – – –Settled mm bbl 48 – – – – –
Average Brent crude oil price floor, net of costs (open positions) US$/bbl – – – – – –Realised losses recognised in the income statement Rm (1 857)Unrealised (losses)/gains recognised in the income statement¹ Rm 1 359Amount included in the statement of financial position Rm –Rand/US dollar currency - Zero-cost collar instruments²US$ exposure US$bn 8,3 1,1 1,1 1,1 1,5 1,5
Open positions US$bn 4,3 – 1,1 1,1 1,5 1,5Settled US$bn 4,0 1,1 – – – –
Annual average floor R/US$ 13,84 13,54 13,93 13,71 14,26 14,51Annual average cap R/US$ 16,63 16,26 16,80 16,52 17,12 17,42
Realised gains/(losses) recognised in the income statement Rm (610) -
Unrealised (losses)/gains recognised in the income statement Rm 933 (1 055)Amount included in the statement of financial position Rm 579 (464)
Ethane - Swap optionsNumber of barrels mm bbl 16,0 2,5 2,5 5,4 7,0 7,0
Open positions mm bbl 12,5 – 2,5 5,4 7,0 7,0Settled mm bbl 3,5 2,5 – – – –
Average ethane swap price (open positions) US$ c/gal 28 30 34 27 24 23
Realised (losses)/gains recognised in the income statement Rm 29 (199)
Unrealised gains/ (losses) recognised in the income statement Rm (491) (388)Amount included in the statement of financial position Rm (454) (888)Export coal - Swap options³Number of tons mm tons 1,4 – – – – –
Open positions mm tons – – – – – –Settled mm tons 1,4 – – – – –
Average coal swap price (open positions) US$/ton – – – – – –
Realised losses recognised in the income statement Rm (337)
Unrealised (losses)/gains recognised in the income statement¹ Rm 428Amount included in the statement of financial position Rm –¹ Reversal of FY18 unrealised hedging losses.² We target a hedge cover ratio of 50 - 70% for FY20 and FY21.³ We target a hedge cover ratio of 50 - 70% for FY20 and FY21.

Sasol Limited Group
Sasol Production and Sales Metrics September 2019 8
Abbreviations
m bbl - thousand barrels kt - thousand tons
mm bbl - million barrels Rm - Rand millions
mm tons - million tons US$/ton - US dollar per ton
bscf - billion standard cubic feet R/ton - Rand per ton
EUR/ton - Euro per ton R/US$ - Rand/US dollar currency
US$/bbl - US dollar per barrel US$bn - US dollar billions
US$/ton - US dollar per ton US$m - US dollar millions
US$ c/gal - US dollar cent per gallon m³/h - cubic meter per hour
t/cm/s - tons per continuous miner per shift
The preliminary production and sales metrics for the period ended 30 September 2019 and forward looking statements on FY20 have not been reviewed and reported on by our external auditors.
Disclaimer - Forward-looking statementsSasol may, in this document, make certain statements that are not historical facts and relate to analyses and other information which are based on forecasts of future results and estimates of amounts not yet determinable. These statements may also relate to our future prospects, expectations, developments and business strategies. Examples of such forward-looking statements include, but are not limited to, statements regarding exchange rate fluctuations, volume growth, increases in market share, total shareholder return, executing our growth projects (including LCCP), oil and gas reserves, cost reductions, our Continuous Improvement (CI) initiative and business performance outlook. Words such as “believe”, “anticipate”, “expect”, “intend", “seek”, “will”, “plan”, “could”, “may”, “endeavour”, “target”, “forecast” and “project” and similar expressions are intended to identify such forward-looking statements, but are not the exclusive means of identifying such statements. By their very nature, forward-looking statements involve inherent risks and uncertainties, both general and specific, and there are risks that the predictions, forecasts, projections and other forward-looking statements will not be achieved. If one or more of these risks materialise, or should underlying assumptions prove incorrect, our actual results may differ materially from those anticipated. You should understand that a number of important factors could cause actual results to differ materially from the plans, objectives, expectations, estimates and intentions expressed in such forward-looking statements. These factors and others are discussed more fully in our most recent annual report on Form 20-F filed on or about 28 October 2019 and in other filings with the United States Securities and Exchange Commission. The list of factors discussed therein is not exhaustive; when relying on forward-looking statements to make investment decisions, you should carefully consider both these factors and other uncertainties and events. Forward-looking statements apply only as of the date on which they are made, and we do not undertake any obligation to update or revise any of them, whether as a result of new information, future events or otherwise.

Sasol Limited Group
Sasol Production and Sales Metrics September 2019 9
Sasol Production and Sales Metrics September 2019 1