
Saral Gyan Hidden Gem - May 2016
12
UNEXPLORED MULTIBAGGER SMALL CAP STOCKS EQUITY RESEARCH REPORT PRIMA PLASTICS LTD. BSE CODE: 530589 Industry: Plastic Products CMP: Rs. 152.30 (12/06/2016) Market Cap: 167.53 (INR in Crore) Target Price: Rs. 290 Date: June 12, 2016 Time Period: 12 – 24 months Saral Gyan Capital Services An Independent Equity Research Firm www.saralgyan.in | www.saralgyan.com
-
Upload
saralgyanteam -
Category
Economy & Finance
-
view
150 -
download
1
Transcript of Saral Gyan Hidden Gem - May 2016

UNEXPLORED MULTIBAGGER SMALL CAP STOCKS
EQUITY RESEARCH REPORT
PRIMA PLASTICS LTD.
BSE CODE: 530589
Industry: Plastic Products CMP: Rs. 152.30 (12/06/2016)
Market Cap: 167.53 (INR in Crore) Target Price: Rs. 290 Date: June 12, 2016 Time Period: 12 – 24 months
Saral Gyan Capital Services
An Independent Equity Research Firm www.saralgyan.in | www.saralgyan.com

HIDDEN GEMS – MAY 2016
- 2 - SARAL GYAN CAPITAL SERVICES
TABLE OF CONTENT
S.No Content Page No.
1. Company Background 03
2. Recent Developments 06
3. Financial Performance 07
4. Peer Group Comparison 09
5. Key Concerns / Risks 09
6. Saral Gyan Recommendation 10
7. Disclaimer 12

HIDDEN GEMS – MAY 2016
- 3 - SARAL GYAN CAPITAL SERVICES
1. Company Background Incorporated in 1993, Prima Plastic is one of the largest player in the Plastic Moulded Furniture (PMF) industry in India. Company designs and manufactures plastic moulded furniture from chairs, baby chairs, dinning
tables, stools and teapoys in a wide range of attractive colors. Prima Plastics has consistently increased its market share over the last few years and has consolidated its position as a brand leader in the garden & leisure furniture industry through careful product development and planned marketing. Company’s state of the art manufacturing process with virgin compounds made as per specifications ensures production of high quality and totally weather proof furniture. The company has received Top Exporter Awards by PLEXCONCIL India in the Moulded Furniture Category for many years in a row since 1996. Company exports to USA, Africa and the Middle East. Prima Plastics is the third largest player in the plastic furniture segment after Nilkamal and Wim Plast with a value market share of ~6%, it has a presence across India with network of 275 distributors and over 5000 dealers. The company sells its products in the northern and eastern markets through the outsourcing model.
Manufacturing plants of the company are in Daman and Kerala in India and in Cameroon, Africa. During FY06, the company formed a 50% Joint Venture - Prima Deelite Plastics in Cameroon (Africa), it manufactures PMF and HDPE Woven Sack Bags. The company started this JV with an investment of Rs 1 crore (Prima’s share) in 2006. Since then there has been no further investment. This JV is performing extremely well and registered healthy financial performance in both the businesses of Plastic Articles and Woven Sack Bags.
To continue growth momentum, Prima Plastics is expanding its capacity under ongoing expansion in India and Africa. Prima Plastics is setting up new capacity at Andhra Pradesh, which is expected to be operational by mid of this year. Moreover, ongoing expansion of African JV is also expected to get completed which will almost double its capacity.

HIDDEN GEMS – MAY 2016
- 4 - SARAL GYAN CAPITAL SERVICES
Plastic Consumption & Growth Outlook in India & African Countries Plastic industry is making significant contribution to the economic development and growth of various key sectors in the country such as: Automotive, Construction, Electronics, Healthcare, Textiles, FMCG, etc. It has expanded at 11% CAGR over the last five years to reach 12.2 million tonnes per annum in FY14. Since plastic products permeate the entire spectrum of daily use items and cover almost every sphere of life like clothing, housing, construction, furniture, automobiles, household items, agriculture, horticulture, irrigation, packaging, medical appliances, electronics and electrical etc.
Referring to report issued by Tata Strategic, India’s per capita consumption of plastic products is ~10 kg against 32 kg in Brazil, 45 kg in China, 65 kg in Europe and 109 kg in US. Current low per capita consumption level of plastic products in India as compared to developed countries indicates that India offers a huge opportunity over long term.
Additionally, rising thrust on 100 smart cities will further propel the growth of plastic industry. Considering the critical elements of any smart cities such as water management, infrastructure, waste management, etc. the usage of plastics can bring efficiency in all such fields and can therefore, make the smart cities more sustainable and cost effective. Packaging industry in India has seen a strong penetration of plastics as compared to global standards. However, agriculture sector still hasn't explored the benefits of plastics to a large extent. Global average for plastics demand in agriculture is 8% while India is substantially lower at only 2%. Plastics industry is one of the fastest growing industries in India. Compared to the overall plastic industry which is growing at 11%, the major thermoplastics like PE, PP, PVC, PS have grown at 8% per annum over the last five years to reach 8.7 MnTPA (million tonnes per annum) in FY14 from 6 MnTPA in FY09. Polyethylene (PE) is the most largely used plastic raw-material by Indian industry. Its demand has grown at 8% per annum in last 5 years to reach 3.6 MnTPA in FY14. Polyvinyl Chloride (PVC) is the second largest with the consumption growing from 1.4 MnTPA in FY09 to 2.6 MnTPA in FY14 at growth rate of 13% p.a.
HIDDEN GEMS – MAY 2016
- 5 - SARAL GYAN CAPITAL SERVICES
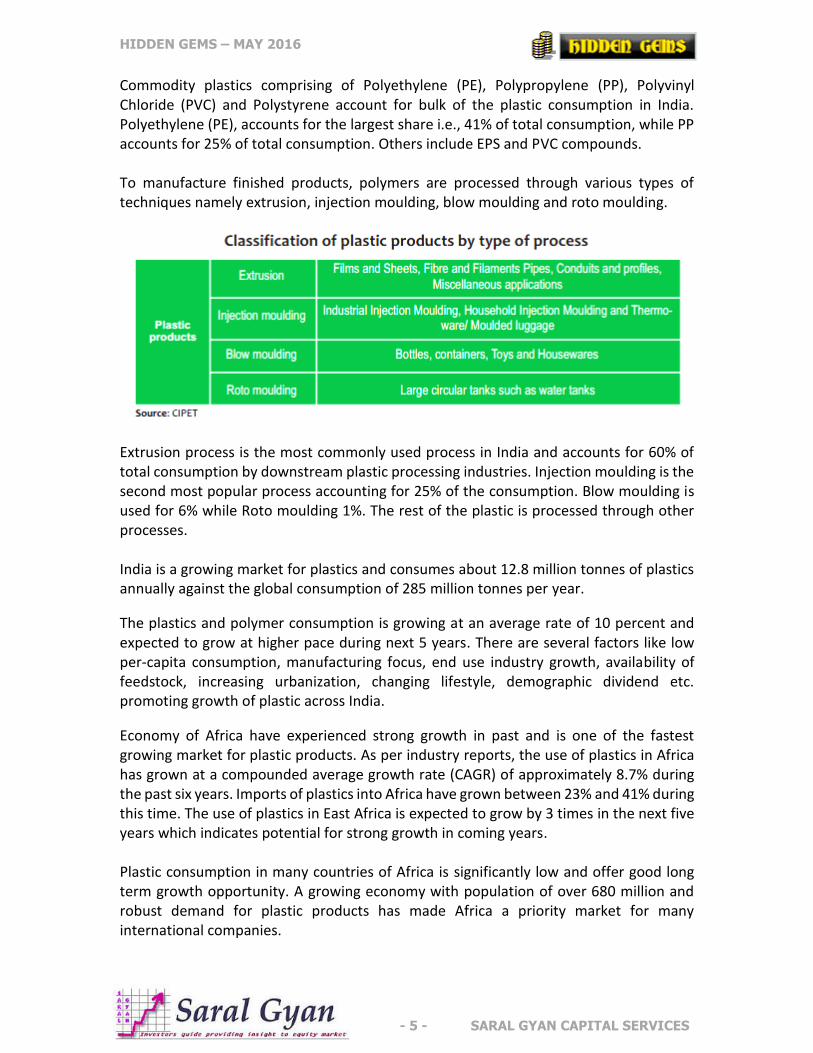
Commodity plastics comprising of Polyethylene (PE), Polypropylene (PP), Polyvinyl Chloride (PVC) and Polystyrene account for bulk of the plastic consumption in India. Polyethylene (PE), accounts for the largest share i.e., 41% of total consumption, while PP accounts for 25% of total consumption. Others include EPS and PVC compounds. To manufacture finished products, polymers are processed through various types of techniques namely extrusion, injection moulding, blow moulding and roto moulding.
Extrusion process is the most commonly used process in India and accounts for 60% of total consumption by downstream plastic processing industries. Injection moulding is the second most popular process accounting for 25% of the consumption. Blow moulding is used for 6% while Roto moulding 1%. The rest of the plastic is processed through other processes. India is a growing market for plastics and consumes about 12.8 million tonnes of plastics annually against the global consumption of 285 million tonnes per year.
The plastics and polymer consumption is growing at an average rate of 10 percent and expected to grow at higher pace during next 5 years. There are several factors like low per-capita consumption, manufacturing focus, end use industry growth, availability of feedstock, increasing urbanization, changing lifestyle, demographic dividend etc. promoting growth of plastic across India.
Economy of Africa have experienced strong growth in past and is one of the fastest growing market for plastic products. As per industry reports, the use of plastics in Africa has grown at a compounded average growth rate (CAGR) of approximately 8.7% during the past six years. Imports of plastics into Africa have grown between 23% and 41% during this time. The use of plastics in East Africa is expected to grow by 3 times in the next five years which indicates potential for strong growth in coming years. Plastic consumption in many countries of Africa is significantly low and offer good long term growth opportunity. A growing economy with population of over 680 million and robust demand for plastic products has made Africa a priority market for many international companies.
HIDDEN GEMS – MAY 2016
- 6 - SARAL GYAN CAPITAL SERVICES
2. Recent Developments i) Expanding Reach through Joint Venture in Other Countries - Jun 2016 With success of Cameroon JV and experience of exporting to other African and Central American nations, Prima plastics is exploring the opportunity to set up manufacturing unit in the Central American market via JV route to expand its geographic reach. The objective is to increase the presence in the neighboring countries by putting up manufacturing unit by end of current calendar year. As per the management, they are at the preliminary stage with local player to establish a new entity. The targeted capacity is likely to be 1500MT with an investment of Rs. 10-12 crores. The management seems positive on this development and plans to fund this expansion largely through internal accruals. The moulded plastic furniture industry is growing at a faster pace in the Central American market and offers good long term business opportunity for international players. ii) Capacity Expansion in India & Cameroon (Africa) JV – Jan 2016 Under ongoing expansion, company is putting up a 1500MT moulded furniture plant at Andhra Pradesh with a capex of Rs. 5-6 crores. The new plant will add 15% to Indian capacity with an additional revenue potential of Rs. 15 to 20 crores. As per management, new plant would be operational by July 2016. With additional capacity in place, the company is also increasing distributors in south to grab market share in southern market. Considering strong demand and robust growth outlook, Prima Plastics has also taken up capacity expansion at its Cameroon JV which will almost double its capacity. iii) Close down of ACP (Aluminium Composite Panel) Division – Jan 2015 Company diversified into manufacturing of high quality PVDF coating Aluminium Composite Panel with the brand name called “ALUMA” with annually installed capacity to produce 1.2 million sq. mts in various sizes. Aluminium composite panel (ACP) which are used in making building’s exteriors and interiors. The ACP division was started during construction boom to cater commercial real estate segment. However, ACP division faced severe challenges due to a slowdown in demand for aluminium panels and higher input cost, which caused the company to incur continuous losses in FY10-14. Later in Jan 2015, management decided to shut down its ACP division and sold off the core plant of ACP Division. The land, building & other machinery were retained to accommodate additional requirement of factory space of plastic division and also to expand plastic business.

HIDDEN GEMS – MAY 2016
- 7 - SARAL GYAN CAPITAL SERVICES
3. Financial Performance Prima Plastics standalone net profit rises 135.86% in the March 2016 quarter Net profit of Prima Plastics rose 135.86% to Rs 4.05 crore in the quarter ended March 2016 as against Rs 1.72 crore during the previous quarter ended March 2015. Sales rose 7.03% to Rs 27.41 crore in the quarter ended March 2016 as against Rs 25.72 crore during the previous quarter ended March 2015. On consolidated basis including Cameroon JV Operation, Prima Plastics has reported growth of 83.4% at Rs 12.3 crore in FY16, while its revenue has grown by 9.32% at Rs 129.2 crore. Its consolidated operating profit (EBITDA) has grown by 43.78% at Rs 19.84 crore along with operating profit margin expanding by 368 bps for FY16 at 15.36%.
Prima Plastics standalone net profit rises 328.17% in the December 2015 quarter Net profit of Prima Plastics rose 328.17% to Rs 3.04 crore in the quarter ended December 2015 as against Rs 0.71 crore during the previous quarter ended December 2014. Sales rose 39.60% to Rs 28.94 crore in the quarter ended December 2015 as against Rs 20.73 crore during the previous quarter ended December 2014.
1 2 3 4 5 6
Total Sales 20.73 25.72 19.11 18.57 28.94 27.41
Net Profit 0.71 1.72 1.03 1.51 3.04 4.05
20.73
25.72
19.11 18.57
28.9427.41
0.711.72 1.03 1.51
3.044.05
0
5
10
15
20
25
30
35
Rs in
Cro
res
Dec 14 Mar 15 Jun 15 Sep 15 Dec 15 Mar 16
Last 6 Quarters Net Sales & Profit
HIDDEN GEMS – MAY 2016
- 8 - SARAL GYAN CAPITAL SERVICES
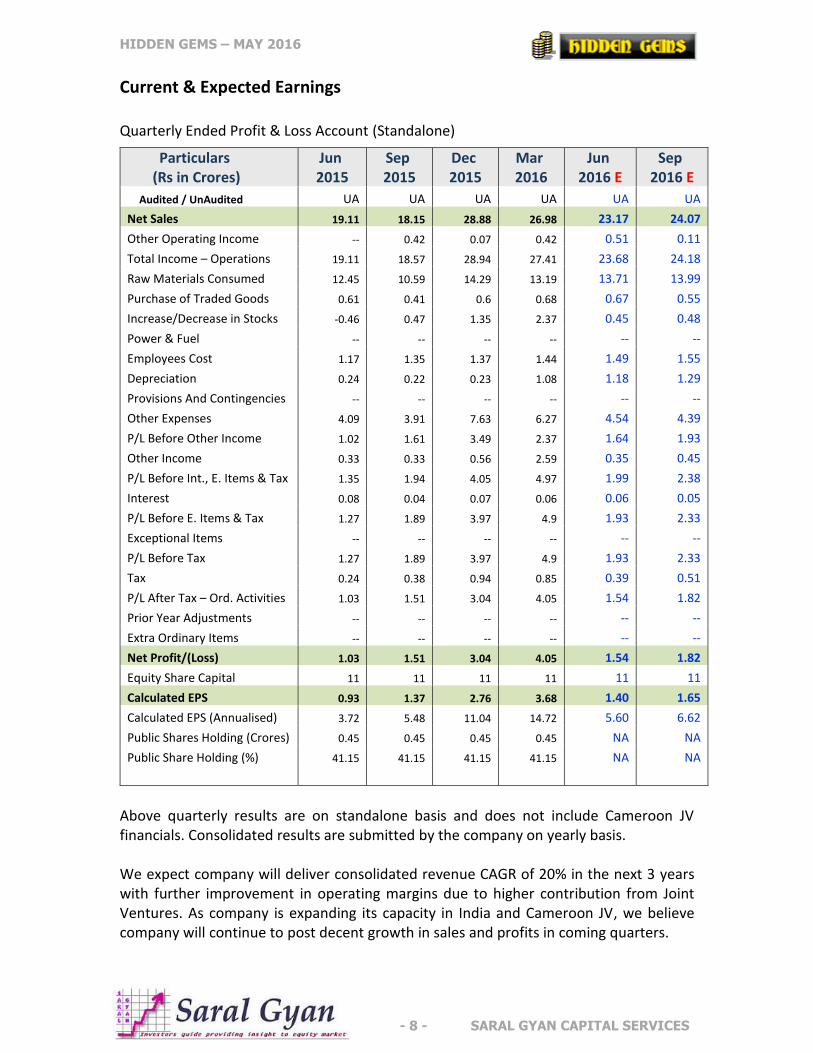
Current & Expected Earnings Quarterly Ended Profit & Loss Account (Standalone)
Above quarterly results are on standalone basis and does not include Cameroon JV financials. Consolidated results are submitted by the company on yearly basis. We expect company will deliver consolidated revenue CAGR of 20% in the next 3 years with further improvement in operating margins due to higher contribution from Joint Ventures. As company is expanding its capacity in India and Cameroon JV, we believe company will continue to post decent growth in sales and profits in coming quarters.
Particulars (Rs in Crores)
Jun 2015
Sep 2015
Dec 2015
Mar 2016
Jun 2016 E
Sep 2016 E
Audited / UnAudited UA UA UA UA UA UA
Net Sales 19.11 18.15 28.88 26.98 23.17 24.07
Other Operating Income -- 0.42 0.07 0.42 0.51 0.11
Total Income – Operations 19.11 18.57 28.94 27.41 23.68 24.18
Raw Materials Consumed 12.45 10.59 14.29 13.19 13.71 13.99
Purchase of Traded Goods 0.61 0.41 0.6 0.68 0.67 0.55
Increase/Decrease in Stocks -0.46 0.47 1.35 2.37 0.45 0.48
Power & Fuel -- -- -- -- -- --
Employees Cost 1.17 1.35 1.37 1.44 1.49 1.55
Depreciation 0.24 0.22 0.23 1.08 1.18 1.29
Provisions And Contingencies -- -- -- -- -- --
Other Expenses 4.09 3.91 7.63 6.27 4.54 4.39
P/L Before Other Income 1.02 1.61 3.49 2.37 1.64 1.93
Other Income 0.33 0.33 0.56 2.59 0.35 0.45
P/L Before Int., E. Items & Tax 1.35 1.94 4.05 4.97 1.99 2.38
Interest 0.08 0.04 0.07 0.06 0.06 0.05
P/L Before E. Items & Tax 1.27 1.89 3.97 4.9 1.93 2.33
Exceptional Items -- -- -- -- -- --
P/L Before Tax 1.27 1.89 3.97 4.9 1.93 2.33
Tax 0.24 0.38 0.94 0.85 0.39 0.51
P/L After Tax – Ord. Activities 1.03 1.51 3.04 4.05 1.54 1.82
Prior Year Adjustments -- -- -- -- -- --
Extra Ordinary Items -- -- -- -- -- --
Net Profit/(Loss) 1.03 1.51 3.04 4.05 1.54 1.82
Equity Share Capital 11 11 11 11 11 11
Calculated EPS 0.93 1.37 2.76 3.68 1.40 1.65
Calculated EPS (Annualised) 3.72 5.48 11.04 14.72 5.60 6.62
Public Shares Holding (Crores) 0.45 0.45 0.45 0.45 NA NA
Public Share Holding (%) 41.15 41.15 41.15 41.15 NA NA

HIDDEN GEMS – MAY 2016
- 9 - SARAL GYAN CAPITAL SERVICES
4. Peer Group Comparison
PEER GROUP PRIMA PLASTICS WIMPLAST NILKAMAL
CMP 152.30 1903.45 1192.05
52 W L/H 50.00/171.90 1551.00/2499.00 484.00/1561.95
Market Cap 167.54 1142.39 1778.84
Results (in Crores) Mar-16 Mar-16 Mar-16
Net Sales 26.98 99.65 500.00
PAT 4.05 15.89 32.65
Equity 11.00 6.00 14.92
EPS (TTM) 11.16 75.22 75.94
P/E 13.65 25.31 15.70
On valuation parameters, Prima Plastics is trading at significant discount compared to other listed players in the Industry. Moreover, important financials like OPM (operating profit margin) and ROE (return on equity) of Prima Plastics is much better compared to bigger player like Nilkamal Ltd.
5. Key Concerns / Risks i) Rise in Crude Oil Prices - The rise in prices of crude and similar impact on its bye products will remain a concern for the Moulded Furniture business being its major input material. ii) Competition from New Entrants – Plastic Moulded Furniture industry in past has witnessed many new entrants with low capital base to serve the local market. The new players are prune to un-ethical practices, such players will impact local market in their area by offering low quality products at cheap rates. ii) Delay in GST Implementation – The introduction of GST is expected in a short span and will integrate the country’s economy into one and provide level playing in every part of the country. This is expected to boost the growth of Prima Plastics business at pan India level. However, any delay in implementation of GST could impact Prima Plastics revenue growth at pan India level as it would be difficult for company to gain market share in domestic market.
HIDDEN GEMS – MAY 2016
- 10 - SARAL GYAN CAPITAL SERVICES
6. Saral Gyan Recommendation
The Per capita income of middle & lower middle class are rising in India and people living in rural India are also prospering due to higher value of their agriculture produce & agriculture lands. The per capita consumption of plastic is increasing in India but still very low when compared to western countries. Plastic moulded furniture is replacing conventional furniture made of woods and steel due to its various inherent advantages. Prima Plastics is well placed to take advantage of the sustained growth in PMF industry in India, the company is focusing to further penetrate in new territories of southern market with capacity expansion in Andhra Pradesh.
The company’s key markets for international business are Africa, Middle East and Latin America. The export products are well established in the international market, the growth in export is very impressive as the company continue to receive repeated orders from its existing clients. Also, the Joint Venture Company at Cameroon is performing reasonably well and registered higher sales and profitability in both the businesses of Plastic Articles and Woven sack Bags. With ongoing expansion in African JV and expected entry into Latin America market via JV route in near term, we expect company to register much higher sales and profitability during next couple of years.
As the company was unable to turn around its loss making ACP division, management
decided to close down its ACP business in FY14-15 which was incurring losses since last many years. Company sold off the core plant of ACP division in Jan 2015. However, the land, building & other machinery were retained to accommodate additional requirement of factory space of plastic division and also to expand plastic business. This was a good move as management decided to focus completely on its core business i.e. plastic division which is doing well rather than putting continuous efforts to revive its ACP division. Moreover, it helped the company to strengthen its balance sheet with better financial performance and cash flow generation.
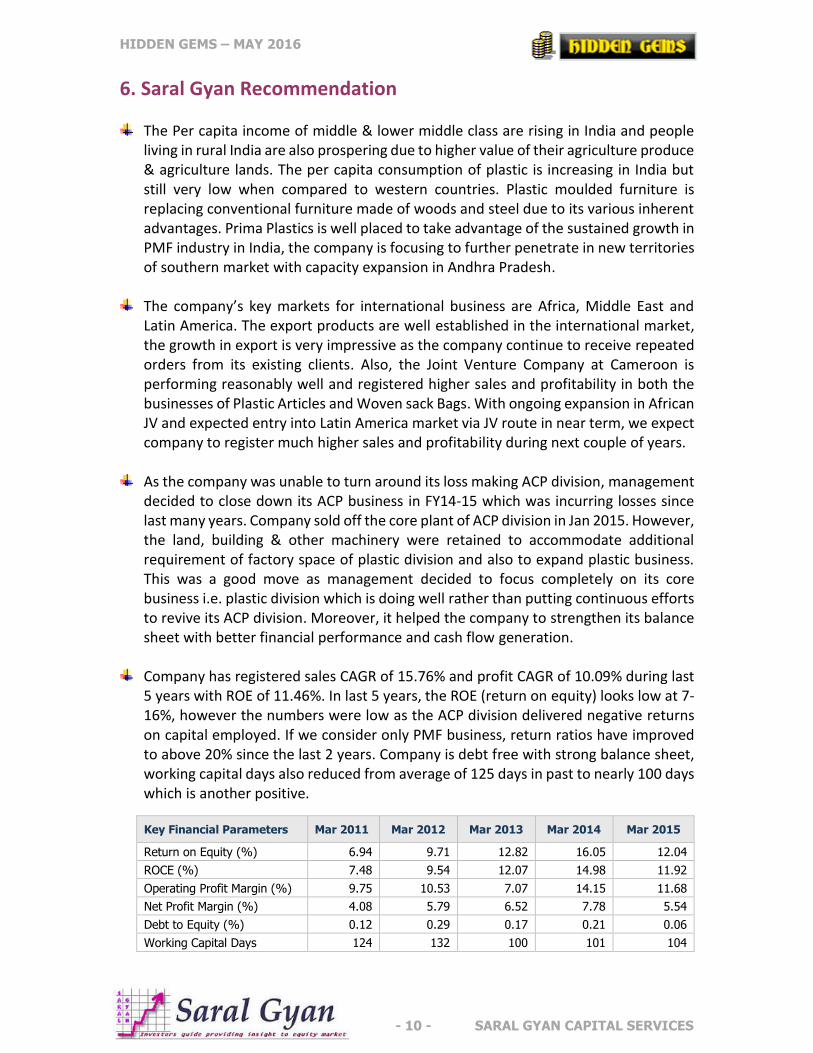
Company has registered sales CAGR of 15.76% and profit CAGR of 10.09% during last
5 years with ROE of 11.46%. In last 5 years, the ROE (return on equity) looks low at 7-16%, however the numbers were low as the ACP division delivered negative returns on capital employed. If we consider only PMF business, return ratios have improved to above 20% since the last 2 years. Company is debt free with strong balance sheet, working capital days also reduced from average of 125 days in past to nearly 100 days which is another positive.
Key Financial Parameters Mar 2011 Mar 2012 Mar 2013 Mar 2014 Mar 2015
Return on Equity (%) 6.94 9.71 12.82 16.05 12.04
ROCE (%) 7.48 9.54 12.07 14.98 11.92
Operating Profit Margin (%) 9.75 10.53 7.07 14.15 11.68
Net Profit Margin (%) 4.08 5.79 6.52 7.78 5.54
Debt to Equity (%) 0.12 0.29 0.17 0.21 0.06
Working Capital Days 124 132 100 101 104

HIDDEN GEMS – MAY 2016
- 11 - SARAL GYAN CAPITAL SERVICES
As of Mar’16, promoter’s shareholding in the company is at 58.85% which is constant without any changes since last 4 years without pledging any shares. Institution shareholding is negligible at 0.03%. Considering recent expansion, debt free status and robust demand outlook for PMF Industry, we expect company will continue to grow its sales and profitability, which can bring institutional investment and there could be re-rating in the valuations of the stock in long term.
Management has rewarded shareholders by paying regular dividend since last 8 years. The company paid dividend of Rs. 1 per share from FY10-14 and later increased the dividend to Rs. 1.50 per share in FY14-15 with increasing profitability. As the company is debt free and plans majority of capacity expansion through internal accruals, we find dividend policy suitable in terms of sharing profit with minority shareholders and retaining the balance for future growth.
YEAR Mar'11 Mar'12 Mar'13 Mar'14 Mar'15
EPS 2.60 3.41 4.62 6.91 6.09
Dividend / Share (In Rs) 1.00 1.00 1.00 1.00 1.50
As per our estimates, Prima Plastics can deliver PAT of 15.50 crores for full financial
year 2016-17, annualized EPS of Rs 14.1 with forward P/E ratio of 10.8X for FY16-17. Company’s valuation looks discounted compared to peer group companies on account of better financials. With ongoing expansion in India & Cameroon JV and robust demand outlook in domestic as well as African markets, we believe company will continue to deliver strong revenue growth and profitability going forward.
On equity of Rs. 11.00 crore, the estimated annualized EPS for FY 16-17 works out to Rs. 14.1 and the Book Value per share is Rs. 58.48. At current market price of Rs. 152.30, stock price to book value is 2.60.
Considering improvement in financials with better operating margins and debt free status post closure of ACP division, high earning visibility with capacity expansion in India and Cameroon JV with robust demand outlook for PMF products and expanding reach into Latin American market via JV route, Saral Gyan team recommends “Buy” on Prima Plastics Ltd at current market price of Rs. 152.30 for target of Rs. 290 over a period of 12 to 24 months. Buying Strategy:
80% at current market price of 152.30 20% at price range of 130 - 135 (in case of correction in stock price in near term)
Portfolio Allocation: 3% of your equity portfolio.

HIDDEN GEMS – MAY 2016
- 12 - SARAL GYAN CAPITAL SERVICES
7. Disclaimer Important Notice: Saral Gyan Capital Services is an Independent Equity Research Company.
© SARAL GYAN CAPITAL SERVICES
DISCLOSURE WITH REGARDS TO OWNERSHIP AND MATERIAL CONFLICTS OF INTEREST:
a. 'subject company' is a company on which a buy/sell/hold view or target price is given/changed in this Research Report b. Neither Saral Gyan, it's Associates, Research Analyst or his/her relative have any financial interest in the subject
company. c. Neither Saral Gyan, it's Associates, Research Analyst or his/her relative have actual/beneficial ownership of one percent
or more securities of the subject company d. Neither Saral Gyan, it's Associates, Research Analyst or his/her relative have any other material conflict of interest at
the time of publication of the research report.
DISCLOSURE WITH REGARDS TO RECEIPT OF COMPENSATION:
a. Neither Saral Gyan nor it's Associates have received any compensation from the subject company in the past twelve months.
b. Neither Saral Gyan nor it's Associates have managed or co-managed public offering of securities for the subject company in the past twelve months.
c. Neither Saral Gyan nor it's Associates have received any compensation for investment banking or merchant banking or brokerage services from the subject company in the past twelve months.
d. Neither Saral Gyan nor it's Associates have received any compensation for products or services from the subject company.
e. Neither Saral Gyan nor it's Associates have received any compensation or other benefits from the subject company or third party in connection with the research report.
GENERAL DISCLOSURES:
a. The Research Analyst has not served as an officer, director or employee of the subject company. b. Saral Gyan or the Research Analyst has not been engaged in market making activity for the subject company.
Definitions of Terms Used:
a. Buy recommendation: This means that the investor could consider buying the concerned stock at current market price keeping in mind the tenure and objective of the recommendation service.
b. Hold recommendation: This means that the investor could consider holding on to the shares of the company until further update and not buy more of the stock at current market price.
c. Buy at lower price: This means that the investor should wait for some correction in the market price so that the stock can be bought at more attractive valuations keeping in mind the tenure and the objective of the service.
d. Sell recommendation: This means that the investor could consider selling the stock at current market price keeping in mind the objective of the recommendation service.
LEGAL DISCLAIMER: Nothing published herein or on www.saralgyan.in / www.saralgyan.com should be considered as personalized investment advice. Although our employees may answer your general customer service questions, they are not licensed under laws to address your particular investment situation. No communication by our employees to you should be deemed as personalized investment advice. This document prepared by our research analysts does not constitute an offer or solicitation for the purchase or sale of any financial instrument or as an official confirmation of any transaction. It should be noted that the information contained herein is from publicly available data or other sources believed to be reliable. Neither Saral Gyan, nor any person connected with it accepts any liability arising from the use of this document. This document is prepared for assistance only and is not intended to be and must not be taken as the basis for any investment decision. The investment discussed or views expressed may not be suitable for all investors. The user assumes the entire risk of any use made of this information. The recipients of Saral Gyan material should rely on their own investigations and take their own professional advice. Each recipient of Saral Gyan should make such investigations as it deems necessary to arrive at an independent evaluation of an investment referred to in this document (including the merits and risks involved), and should consult its own advisers to determine the merits and risks of such an investment. Price and value of the investments referred to in this material may go up or down.