
SAP BusinessObjects Web Intelligence: The … · Reading Sample In this sample chapter, you‘l l...
62
Reading Sample In this sample chapter, you‘l l start in Chapter 2 by creating your first document and query in SAP BusinessObjects BI. In this process, we‘ll explore the query panel, SAP BEx queries, query filters, and data sources. Then, in Chapter 3, we‘ll walk through creating a report in Web Intelligence from start to finish! Ah-Soon, Brogden, Marks, Orthous, Sinkwitz SAP BusinessObjects Web Intelligence: The Comprehensive Guide 814 Pages, 4th, updated and revised edition, 2017, $79.95 ISBN 978-1-4932-1547-8 www.sap-press.com/4412 First-hand knowledge. “Creating New Documents and Queries” “Creating a Report in Web Intelligence” Contents Index The Authors
Transcript of SAP BusinessObjects Web Intelligence: The … · Reading Sample In this sample chapter, you‘l l...

Reading SampleIn this sample chapter, you‘l l start in Chapter 2 by creating your first document and query in SAP BusinessObjects BI. In this process, we‘ll explore the query panel, SAP BEx queries, query filters, and data sources. Then, in Chapter 3, we‘ll walk through creating a report in Web Intelligence from start to finish!
Ah-Soon, Brogden, Marks, Orthous, Sinkwitz
SAP BusinessObjects Web Intelligence:The Comprehensive Guide814 Pages, 4th, updated and revised edition, 2017, $79.95 ISBN 978-1-4932-1547-8
www.sap-press.com/4412
First-hand knowledge.
“Creating New Documents and Queries”
“Creating a Report in Web Intelligence”
Contents
Index
The Authors

45
2
Chapter 2
Creating New Documents and Queries
Create queries graphically with the highly intuitive and enhanced
Query Panel in Web Intelligence. Use the Result Objects pane and
Query Filters pane to access the data you need from universes, Excel or
text files, free-hand SQL, analysis views or web services, and then cre-
ate and share powerful analysis documents with business users.
This chapter takes you through the first steps of creating a Web Intelligence docu-
ment from within the BI Launch Pad portal. It describes a simple workflow starting
from a relational universe and describes how to create a query from it through the
Query Panel, and filter the retrieved dataset with filters and prompts.
All these steps are easily done through Web Intelligence Query Panel which provides
business users with an intuitive interface for retrieving and filtering data. Queries are
created graphically by selecting objects (database fields) to query or to filter. This col-
lection of objects is translated a generated SQL statement sent to the database.
Specific versions of this Query Panel are also available for other data sources: Excel
and text files, Free-Hand SQL, web service and analysis views. Query Panel’s advanced
capabilities, like accessing SAP data sources, multi-dimensional universes, query
stripping or multi-queries are covered in Chapter 12 to Chapter 14.
Whatever your data source, you can set some useful options to your document.
2.1 Creating a Web Intelligence Document from a Universe
The portal interface in SAP BusinessObjects BI 4.2 provides two ways to launch the
Web Intelligence query and analysis tool in the BI Launch Pad. After logging on to the
BI Launch Pad and going to the Home tab, you’ll notice a column on the right-hand

2 Creating New Documents and Queries
46
side of the page with six application shortcuts. These links are beneath the My Appli-
cations heading.
Figure 2.1 shows the shortcut icons for these six applications in the BI Launch Pad:
� Module
� Analysis Edition for OLAP
� Information Steward
� Crystal Reports for Enterprise
� BI Workspace
� Web Intelligence
Figure 2.1 Launching Web Intelligence from BI Launch Pad
An alternate method of launching Web Intelligence from within the BI Launch Pad is
by clicking on the Applications link located in the top menu of the page. Links to the
same six applications as previously described will appear but in a different order.
Figure 2.2 shows the result of clicking on the Applications menu link and selecting
Web Intelligence from the list provided.
Option 1: Click Applications and selectWeb Intelligence in the menu
Option 2: Click WebIntelligence icon
47
2.1 Creating a Web Intelligence Document from a Universe
2
Figure 2.2 Launching Web Intelligence from the Applications Menu Link
An alternate method of launching Web Intelligence is to click its icon in the bottom
of the pane in the right side.
If you have set Web Intelligence Java Applet as your preferred client (see Chapter 1,
Section 1.3.2), then it opens after the security warning and the splash screen. Other-
wise, if you have selected the Web Intelligence HTML client, then the HTML version
opens almost immediately.
In both cases, Web Intelligence displays to a blank screen with all of the shortcut
icons disabled except for two choices:
� Create a new document ([Ctrl]+[N])
� Open (retrieve) a document from the server ([Ctrl]+[O])
From the Web Intelligence tab itself, you have additional options to interact with the
document by clicking on one of three small icons located beside the document name.
This is where you can enlarge the screen by opening the document in a new window
or simply close the Web Intelligence application. There are three clickable icon
options on the Web Intelligence tab:
� Open in a new window
� Pin (or unpin) this tab
� Close
Figure 2.3 shows the options available after launching the Web Intelligence applica-
tion and before a document is created or opened.
Click on the Blank Document icon to create a new Web Intelligence document.

2 Creating New Documents and Queries
48
Figure 2.3 Options Available before Creating or Opening a Document
As shown in Figure 2.4, the Create a Document dialog box opens and proposes you to
create a blank document based on seven possible data sources:
� Universe
� Excel
� BEx
� SAP HANA
� SAP HANA Online
� Analysis View (this data source is not supported in Web Intelligence HTML)
� Free-hand SQL
The No data source option allows you to start creating a document without any data
source.
Figure 2.4 Selecting a Data Source for a New Document in Web Intelligence Java
Create a new document
Import an existingdocument
Open in new window Pin the document
49
2.1 Creating a Web Intelligence Document from a Universe
2
In addition of the data sources supported in HTML and Java Applet, two additional
data sources can be used to create Web Intelligence documents while working in the
Web Intelligence Rich Client (see Figure 2.5): Text and Web Services.
Figure 2.5 Data Source Types Available in Web Intelligence Rich Client
As this is the most common data source, to introduce you the Query Panel, we’ll first
describe the workflow to create a new document from a universe; other data sources
being presented in Section 2.6.
The patented SAP BusinessObjects semantic layer known as the universe remains the
primary method for connecting reporting documents to traditional data warehouses
and relational databases. Historically, universes were created in the tool named
Designer, renamed into Universe Design Tool in SAP BusinessObjects BI 4.0. SAP
BusinessObjects 4.0 also introduced the Information Design Tool, a new universe cre-
ation tool that creates a new universe format (UNX). This new universe format can be
created from multiple sources and from multidimensional sources.

2 Creating New Documents and Queries
50
The objects in your universes should be consistently named with business terms to
provide users with the simplest and most intuitive approach to retrieving the data
they need.
Additional Reference
For more details on universes, you can refer to Universe Design with SAP Business-
Objects BI: The Comprehensive Guide (SAP Press, 2014, www.sap-press.com/3412).
But little has changed from a user’s perspective when it comes to connecting to a uni-
verse to query a database. Database fields, known in the universe as objects, are used
in the Query Panel to retrieve data and to restrict the results to return only the infor-
mation needed.
After selecting Universe as the data source for a new document, you’re presented
with a list of available universes that you have permission to access. Click on a uni-
verse in the list, and click on Select to proceed. Figure 2.6 shows an example list of
available universes that can be used as a data source.
Figure 2.6 Universe Selection
51
2.2 The Query Panel in Web Intelligence
2
After you make your universe selection, the Web Intelligence tool will be launched
and opened to the Query Panel. Before you can begin analyzing information and cre-
ating reports, you need to retrieve information from your data source. The Query
Panel is your window for accessing that data.
2.2 The Query Panel in Web Intelligence
The Query Panel in Web Intelligence provides an intuitive interface for selecting
objects and retrieving results from universes.
Specific versions of this Query Panel are available to query other data sources and are
described in:
� Section 2.6 for Excel and text files, Free-Hand SQL, web services and analysis views.
� Chapter 12 for multidimensional data sources, text files and web services.
� Chapter 13 for SAP BW and SAP HANA data sources.
Figure 2.7 shows a glimpse of the full Query Panel at the beginning of the query-build-
ing process after you have selected a relational universe as the data source. Query
Panel advanced capabilities, including querying a multidimensional universe, are
described in Chapter 12.
Figure 2.7 Universe Query Panel
Drag and drop them in Result Objects pane to get
Drag and drop objects from Universe outlineto Query Filters section to add filters
Select objects from Universe outline
Click Refresh to get data preview

2 Creating New Documents and Queries
52
As seen in Figure 2.7, the Query Panel consists of five major panes; you can display/
hide four of them with the icons in the toolbar. These panes are:
� Universe outline (toggled with the icon)
Contains the objects available in the connected data source.
� Result Objects
Retrieves data from the database when you drag and drop objects from the
Universe outline pane to this pane to begin creating a query.
� Query Filters (toggled with the icon)
Restricts the results returned from the data source.
� Data Preview (toggled with the icon)
Displays a preview of the result set based on the objects included in the Result
Objects pane.
� Scope of Analysis (toggled with the icon)
Shows the hierarchy and drill path of the objects in the universe.
Note
The Scope of Analysis and Data Preview panes can’t be displayed at the same time.
Toggle between these sections by using the shortcut icons in the toolbar.
2.2.1 Creating the Query
The Universe outline pane is located on the left side of the document and shows you
the database fields or objects that can be retrieved or used to filter the query.
The purpose of the Universe outline pane is to provide the list of objects available in
the connected data source to be used as result objects or filters in the query. This pane
contains the classes and objects that were previously set up in the universe. The ter-
minology used for object aliasing in universe design begins to play an important role
in the Query Panel when deciding which objects to include in the query.
A relational universe contains the objects described in Table 2.1.
53
2.2 The Query Panel in Web Intelligence
2
Universe created with Information Design Tool (UNX file format) may contain views.
Views are defined as sub-set of the universe objects. If your universe contains a large
number of objects, you can display only this sub-set of objects and focus on them. As
shown in Figure 2.8, in the drop-down menu available on top of the Universe outline
pane, you can select:
� The universe master view, containing all objects of the universe, organized in their
folders
� A view among the ones that have been defined in the universe
� Display by Navigation Paths to display the objects by navigation path (see Chapter
14, Section 14.2.3)
Icon Object Description
Dimension A dimension is an object you want to query about in
your data source. It can be a product, a service, a cus-
tomer—any metadata for which you store data in your
data source.
Dimension Attribute
(also named detail)
A dimension attribute is always associated with a
dimension. It provides descriptive data about this
dimension. For example, a Customer dimension may
have an Address attribute.
Measure A measure is mainly a numeric data on which aggrega-
tion functions can be applied. A measure is aggregated
by the set of dimensions composing the query.
Measure Attribute
(also named detail)
An measure attribute is always associated with a mea-
sure. It provides descriptive data about this measure.
For example, a Sales measure may have a Sales Percen-
tage attribute.
Filter A filter is a condition object that limits the data
returned by the query.
Folder (also named class) A folder is a container intended to logically organize the
other objects. A folder can contain sub-folders.
Table 2.1 Objects in Relational Universe Outline

2 Creating New Documents and Queries
54
Figure 2.8 Selecting Views to Display in the Universe Outline
To define your query to your data source, select objects from the Universe outline
pane and drag and drop them into the Result Objects pane. You can also drag and
drop a folder; which will add all objects of the folder in the Result Objects pane, as
shown in Figure 2.9.
Figure 2.9 Selected Objects in the Query Panel
55
2.2 The Query Panel in Web Intelligence
2
In the Result Objects pane, you can organize your query:
� Select an object and drag and drop it to change its place in the query
� Select an object and click the Delete icon to remove it from the query
� Click the Delete All icons to remove all objects from the query
2.2.2 Setting Query Properties
Query properties are used to set properties for eight different categories in the cur-
rent query. You can access the properties by clicking on the Query Properties icon
located at the top of the Query Panel, which opens the Query Properties dialog box,
shown in Figure 2.10.
Figure 2.10 Query Properties
Let’s examine these properties:
� Name
This property allows you to revise the name of any query in the document or
Query Panel. This setting becomes very useful when multiple queries are added to
a single Web Intelligence document (see Chapter 14).

2 Creating New Documents and Queries
56
� Universe
This property is read only and displays the name of the current universe.
� Limits
You can apply the Max rows retrieved and Max retrieval time (s) settings to restrict
the result size and retrieval duration of the query (in seconds) by clicking on the
checkbox beside the desired setting and then revising the associated number to
your preference.
� Sample
Sampling enables you to retrieve a fixed or random sample of the data when que-
rying databases that support it. Random sampling is applied by default unless
Fixed is selected. Sampling is disabled if your database doesn’t support sampling.
� Data
This property provides the option to retrieve duplicate rows or unique rows when
refreshing. Both settings are unchecked by default. To optimize the query, you can
also select the Enable query stripping option (see Chapter 12, Section 12.6).
� Security
This section provides the option to allow other users to edit all queries and is
checked by default. If unchecked, only the report developer can make revisions to
the current document.
� Prompt Order
This section allows you to change the order of the prompts if multiple prompted
filter objects exist in the Query Filters pane.
� Context
This setting provides the option to reset contexts upon refreshing (unchecked by
default). A checkbox is provided to clear contexts before the next refresh.
Tip
Choosing to display the objects by hierarchies gives you an opportunity to see the
relationship of the dimension objects in the universe. This is useful when setting up
drillable report filters with cascading values.
Understanding the properties available in the Query Panel is important for effec-
tively producing queries with a desired outcome, such as limiting the number of
rows retrieved by a query or defining the order of prompted filters.
57
2.2 The Query Panel in Web Intelligence
2
2.2.3 Previewing Data
The Data Preview panel can be helpful because it lets you preview a sample of the
data based on the existing result objects and query filters before actually running a
query.
Previewing data allows you to control the content of your query on a small dataset,
preventing you to run the complete query that can take long and allowing you to do
some adjustment to the query while you’re still in the Query Panel.
To view a preview of the data, open the Data Preview panel, and click on the Refresh
icon located in the upper-right corner of the panel. A sample of the result data will be
displayed inside the panel, as shown in Figure 2.11.
Figure 2.11 Data Preview
Filter Preview Data
While reviewing data in the Data Preview panel, you have the option to further
restrict the result set by creating a query filter for a specific value. To do this, right-
click on a value in the panel and select Create simple filter. This selection will add the

2 Creating New Documents and Queries
58
object and value to the Query Filters panel. Click on Refresh in the Data Preview panel
again to preview the updated data set.
Figure 2.12 shows the Data Preview panel if you right-clicked on Los Angeles in the
City column. Select the Create simple filter: City equal to Los Angeles option to
dynamically create a custom filter object in the Query Filters panel.
Figure 2.12 Creating Simple Filters from the Data Preview Section
Using Search to Filter Data Preview Values
If you’re looking for a specific value in a data set but are unable to locate it in the Data
Preview panel, click in the search window located beneath the panel, and begin enter-
ing your term or phrase. The box will search through every row in the panel and
immediately filter the results. Searching begins when a single letter or number is
entered, and every column in each row is searched.
Figure 2.13 shows the letters “Trou” entered in the search bar with the Lines column
selected. The data in the Data Preview panel filters the results immediately, and the
rows with sweaters are easily located.
Figure 2.13 Dynamically Filtering Preview Data
59
2.2 The Query Panel in Web Intelligence
2
By previewing a sample of the data set, you can identify areas to improve the query
and further refine the information set to be retrieved from the data source.
2.2.4 Evaluating Generated SQL Script
After a query has been created, you have the opportunity to review script generated
by the Query Panel. You can view the SQL script generated from the query by clicking
on the View Script shortcut icon at the top of the Query Panel. Two options are avail-
able in the Query Script viewer to either view or edit the query script:
� Use the query script generated by your query.
� Use custom query script. The script becomes editable when you select the Use
custom query script option (see Chapter 12, Section 12.5).
Figure 2.14 shows the options available when viewing the script of the query. The
default selection is the Use the query script generated by your query radio button.
Figure 2.14 View Query Script Generated by the Query Panel

2 Creating New Documents and Queries
60
2.2.5 Running the Query
Once you have created your query, you have to run it to retrieve dataset. To do so,
click the Run Query button in the top right side of the Query Panel. The Query Panel
closes; a progress bar displays while the query is sent to the data source and the data-
set is fetched.
After a query has been refreshed in Web Intelligence, the data is stored in memory in
an unseen microcube. A microcube is a data storage structure in each report, used
store the query results behind the scenes. Users can present any combination of the
data with any type of data block or chart type, while keeping the ability to drill down
and apply report-level or block-level filters.
The microcube allows you to analyze data using different dimensions in separate
report tabs and report blocks, while revealing only the data that you request. This is
done by storing the result data of each document for the last query that was success-
fully executed. Until the data becomes visible in a report, it remains stored behind
the scenes in the microcube. The style, format, and presentation of the data is con-
trolled by the report designer, so they may most effectively display data to solve busi-
ness problems.
As described in next chapters, microcube can be used for complex calculations on the
data it stores. At this point, the data, ready to be formatted and presented in a report,
is displayed in the report as a simple table. You can then create your document with
all the powerful filtering and visualization features available in Web Intelligence.
The Report Panel is displayed after a query has been refreshed allowing you to orga-
nize and format your document, as described in next chapters. To return to editing
the query, you can in Design mode:
� Click on the Data Access tab, select the Data Providers tab, and then click on Edit
Query.
� Click the Edit button in the toolbar, as shown in Figure 2.15.
Figure 2.15 The Edit Icon
61
2.3 Query Filters
2
This reopens the Query Panel with the query you have created in the first place. You
can now add, remove or rearrange objects to and from the query, or add filters to
restrict the dataset fetched from the database, as described next.
2.3 Query Filters
Query filters are used to generate the Where clause for the SQL script that is submitted
to the data source. These objects work very closely with the Result Objects pane to
provide a simple and intuitive interface for retrieving and restricting data from the
data source. More details on query filters can be found in Chapter 10, Section 10.1 and
Chapter 12, Section 12.1.
Query filters allow you to minimize the amount of data returned from the query by
restricting the results to specific criteria. For example, you can add the Month dimen-
sion to the Query Filters pane and set it to July, and then add the Year dimension and
set it to 2014. Doing this will retrieve all the values for the objects included in the
Result Objects pane for July 2014. Query filters offer you the following benefits:
� Ability to return only the data you need to fulfill reporting requirements
� Ability to restrict confidential data from being displayed in reports or being
returned to the microcube
� Ability to retrieve manageable result sets that can be exported to Excel, exported
as a PDF, or printed
Filters are identified by two major categories: predefined filters (or conditions) and
custom filters.
2.3.1 Predefined Filters
Predefined filters are created by a developer or administrator and saved in the uni-
verse as conditions. These predefined conditions are easily recognizable in the Query
Panel because a yellow filter icon appears to the left of the condition name.
An example of a very simple predefined filter is the This Year condition predefined in
the demo eFashion universe. The following line of code was added to the Where sec-
tion in the properties of the condition to create the filter:
Calendar_year_lookup.Yr = '2006'

2 Creating New Documents and Queries
62
A more accurate and user-friendly name for this object would be Year 2006 rather
than This Year to minimize any potential confusion in the future.
Predefined filters are created in the universe and can contain a variety of complex
SQL formulas. By creating predefined filters, users can easily and intuitively con-
strain their queries to return specific data sets without having to create their own
filters.
Condition Segments
Universe developers can create conditions containing any of the following segments:
� Case statements
Provide If/Else/Then logic to a condition or object.
� And/or logic
Multiple filters can be applied within a single condition.
� In list
Allows a condition to be created for many items in a list.
To add a predefined filter into your query, you can:
� Select it from the Universe outline and drag and drop it into the Query Filters pane
� Double-click it
2.3.2 Custom Filters
Custom filters are conditions created by report developers. These types of filters are
created when dimension objects are dragged and dropped into the Query Filters
pane, an operator is chosen, and a value is entered or selected.
After a dimension object has been added to the Query Filters pane, you can choose
how to set up the filter. This includes modifying the operator and assignment type,
and configuring the filter properties.
A dimension object can be set up as a filter with one of the following five types:
� Constant
Manually enters a custom value.
� Value(s) from list
Provides a list of values for one or more selections.
63
2.3 Query Filters
2
� Prompt
Prompts the user to enter or select a value when the query is refreshed.
� Object from this query
Provides the capability to select a predefined object or variable as the dimension
value (although you can’t use the In list or Not in list operators).
� Result from another query
Allows filters to be created using a result object retrieved by a different query
within the same document.
The default operator when a dimension is added to the Query Filters pane is In list,
and the default assignment type is Constant.
Figure 2.16 Filter Operator Selection
As shown in Figure 2.16, the operators available when creating a condition are as fol-
lows:
� In list
Retrieves the data for one or more selected or entered values.
Example: City IN ('Austin','Boston','Chicago','Dallas')
� Not in list
Restricts the query from returning data for one or more selected or entered values.
Example: City NOT IN ('Austin','Boston','Chicago','Dallas')
� Equal to (=)
Obtains data equal to a selected or entered value.
Example: Lines = Sweaters

2 Creating New Documents and Queries
64
� Not equal to (<>)
Obtains data not equal to a selected or entered value.
Example: Lines <> Jackets
� Greater than (>)
Retrieves only the data greater than an entered value.
Example: Sales revenue > 1500
� Greater than or Equal to (>=)
Retrieves only the data greater than or equal to a selected or entered value.
Example: Sales revenue >= 1500
� Less than (<)
Retrieves only the data less than a selected or entered value.
Example: Sales revenue < 1500
� Less than or Equal to (<=)
Retrieves only the data less than or equal to a selected or entered value.
Example: Sales revenue <= 1500
� Between
Retrieves only the data between two values.
Example: Sales revenue Between 1500 and 2000
� Not Between
Retrieves only the data not between two values.
Example: Sales revenue Not Between 1500 and 2000
� Is null
Retrieves only the values that don’t have data (i.e., have a null value).
Example: Lines Is null
� Is not null
Retrieves only the values that have data.
Example: Lines Is not null
� Matches pattern
Retrieves the data that matches the pattern of a selected or entered value. This
operator is translated as Like when the SQL script is generated. In the example,
rows for all objects where the lines begin with S will be returned:
Example: Lines Matches pattern 'S%'
65
2.3 Query Filters
2Note
The wild card character (%) is used to represent an indefinite number of characters.
The underscore symbol (_) is used to represent a single character. An example of
using three underscore wild card characters is a formula written as City = 'Bos___'
used with the Matches pattern operator. The result returns Boston.
� Different from pattern
Retrieves the data that doesn’t match the pattern of a selected or entered value.
This operator is translated as Not Like when the SQL script is generated. The follow-
ing example returns all the rows where the value in the lines object does not begin
with S:
Example: Lines Different from pattern 'S%'
� Both
Retrieves data that corresponds to two values; if the Both filter is used with a
dimension object, an intersection is generated.
� Except
Retrieves the data for other values in the dimension while restricting a selected or
entered value; a minus query is generated when this operator is used.
2.3.3 Quick Filters
Quick filters are created when you select a dimensional object from the Result
Objects pane and click on the Filter icon located in the upper-right corner of the pane.
This procedure opens the Add Quick Filter dialog box, where you can quickly define
the new condition or filter.
Figure 2.17 shows the Add Quick Filter dialog box that opens when a quick filter is
added for the Lines object. The operator is set to Equal To if a single value is selected,
but if multiple values are selected from the displayed values, the operator will be set
to In List. You can modify the operator of the object after the new filter has been cre-
ated and added to the Query Filters pane.

2 Creating New Documents and Queries
66
Figure 2.17 Adding a Quick Filter to a Result Object
2.3.4 Nested Conditions
Query filter conditions can be grouped by using AND and OR to perform extended busi-
ness logic with conditions.
Figure 2.18 shows a Query Filters pane with filters and predefined filters organized
into nested conditions. These conditions are grouped to provide a more customized
filtering technique.
Figure 2.18 Nested Query Filter Conditions
67
2.4 Prompted Queries
2
You can group filters by following these steps:
1. Drop an object or predefined condition to the very bottom of the condition that
you want to group it with.
2. By default, the objects will appear in an AND group.
3. If OR is required, double-click on the new AND group operator, and the group oper-
ator will become OR.
The example in will return only the values associated with last year’s Christmas
period or the holiday period for this year.
Query filters minimize or completely eliminate returning unnecessary information.
You can apply a combination of custom and predefined filters that accurately
restricts information. You can also add prompted filters to documents that require
user input when opening or refreshing reports.
2.4 Prompted Queries
The filter described in previous section allows you to narrow down the scope of data
to analyze among your dataset. But in your everyday work, you may need to query
different side of your business activity. Instead of modifying the filters for each
analysis to run, Web Intelligence supports prompts that provide interactivity to your
documents.
As their name indicates, prompts (also called parameters in SAP system) allows you
to easily modify a filters values before running the query. Before being sent to the
data source, the query is updated with the values provided by the user when answer-
ing the prompts.
2.4.1 Creating a Prompted Filter
To create a prompted filter, follow these steps:
1. In the Query Panel, after you have added an object in the Query Filters pane, click
on the Properties button located to the right of the filter object to reveal five fil-
ter condition types, as shown in Figure 2.19.

2 Creating New Documents and Queries
68
Figure 2.19 Choosing Prompt as Filter Type
2. Select Prompt as the condition type. A default label is entered as the prompt ques-
tion: “Enter <object name>:”.
3. Click on the Prompt Properties button located immediately to the left to open
the Prompt Properties dialog box shown in Figure 2.20 where you can set up the
properties for the prompted condition.
Figure 2.20 Prompt Filter Properties
4. Modify the available prompt properties accordingly to how you want to display
the prompt at refresh time. For the moment, let’s simply modify the Prompt text
and add a different text than the default one. This prompt text lets you create cus-
tomized and appropriate messages for business users when they are prompted to
enter or select values.
69
2.4 Prompted Queries
2
5. Click OK to close the Prompt Properties dialog box and continue to add objects to
your query.
2.4.2 Running the Query
When you have completed your query, it is time to run it.
Because you have added a prompt to your query, the Prompts dialog box opens
before the query is sent to the data source. As shown in Figure 2.21, this dialog box
gathers all prompts defined in the query and that can be answered before running
the query.
Figure 2.21 Answering Prompts
The Prompts Summary displays the prompt text set when defining the prompt. To
answer the prompt, you can either:
� Double-click a city name in the list of values proposed to you. The selected city will
then be displayed in the Selected Value(s) text field.
� Type a city name in the Type a value text field and click the > button to move this
name in the Selected Value(s) text field. This is possible since when we have
defined the prompt, we have kept the Select only from list checkbox unselected.
However, typing another city name will likely return no result if the data source
contains no data for this city.

2 Creating New Documents and Queries
70
The OK button remains disabled until you have properly answered the required
prompts. When this is the case, you can click it to run the query. The query is updated
to take into consideration the value you have selected and filter the dataset with your
answer to the prompt.
More details on prompts can be found in Chapter 9.
2.4.3 Data Source Prompts
In addition to the prompts that can be created in the query, some prompts may exist
in your data sources. These prompts may require you to maintain several values
before the dataset can be retrieved from this data source. Let’s look at these prompts
now:
� Universe context
When querying a relational universe creating in Universe Design Tool or Informa-
tion Design Tool, the objects you have selected may return several possible
answers. The Universe context prompt will require you to resolve these differ-
ences.
Contexts are resolved in the Query Contexts dialog box as shown in Figure 2.22.
They are prompted to you before the universe or user-defined prompts.
Figure 2.22 Context Selection Prompt
� With more complex cases, you may have more than two contexts to resolve in the
Query Contexts dialog box. Here, select a context defined a path in the data
schema to answer the query. This path might also prompt you for other context
choices and impact the other prompts you need to answer for the query.
71
2.5 Saving Your Document in the BI Platform Repository
2
� Universe prompts
Universe prompts are also defined in the relational or multidimensional universe.
These prompts are created by your universe designer to ask you for a value that
will be used to filter the dataset. Such prompts are typically put in place to reduce
the size of the dataset, avoiding database stress. You answer them also in the same
Prompts dialog box, as described in Section 2.4.2.
� SAP variables and input parameters (SAP HANA, SAP BW)
SAP systems (SAP BW or SAP HANA) may also expose some specific prompts
named variables and input parameters. These prompts can modify the objects you
can query in the Query Panel. Chapter 13 describes how you answer them.
After you have created and refreshed your document, remember to save, so you
don’t have to recreate it next time you need to run the same query.
2.5 Saving Your Document in the BI Platform Repository
To avoid you to recreate your query and document, you can save your document into
the BI platform repository.
In the BI platform, you can save the document either in:
� The Public Folders folder or sub-folder, depending on the security rights your
administrator has set to you
� Your personal folder, that only you can access. When working in a production
environment, the best workflow is to save documents there first to make changes
to the query or one of the reports before saving them in the Public Folders folder
or one its sub-folder.
You can also save your document in your file system, and use it through the Web
Intelligence Rich Client (see Chapter 21, Section 21.3.2).
When saving your document in your BI platform repository, you can:
� Give it a name, a description and keywords. These are useful to easily identify and
find your document.
� Assign it some categories, public or private.
� Set some Web Intelligence settings:
– Refresh on open: Use this option to force the document to be refreshed when it
is opened (Section 2.5.3).

2 Creating New Documents and Queries
72
– Permanent regional formatting: Use this option to save the document locale in
the document, allowing it to be displayed in the same locale, when opened by
users from other regions.
– Save document with comments: This option is available only if you save an
existing document under another name and want to duplicate its comments as
well (see Chapter 18, Section 18.5).
The dialog box to save a document differs depending on the client you use: Web
Intelligence Applet or HTML.
2.5.1 Save Document Dialog Box in Applet
In Web Intelligence Applet, follow these steps to save your document:
1. If your document has already been saved in the BI platform repository, click the
Save icon located in the upper left corner of the report, in the File tab, to over-
write the existing version.
If your document has never been saved, or if you click the drop-down menu under
the Save icon (shown in Figure 2.23) to explicitly select the Save As... option, the
Save Document dialog box opens. This dialog box (shown in Figure 2.24) allows
you to enter the required details for saving this document.
2. Use the Folders tab to navigate in the folders structure and select the document
destination folder.
3. You may click the Categories tab to select the categories to assign to the docu-
ment.
4. Enter a name for this document in the Name text field.
5. Click the Advanced button to expand the Save Document dialog box and display
the Description, Keywords and save options, as shown in Figure 2.25. If needed, fill
these fields and modify the options.
Figure 2.23 Save Menu in Web Intelligence Applet
73
2.5 Saving Your Document in the BI Platform Repository
2
Figure 2.24 Save Document Dialog Box in Web Intelligence Applet
Figure 2.25 Save Document Dialog Box with Advanced Options in Applet
6. Click Save to save your document.

2 Creating New Documents and Queries
74
2.5.2 Save Dialog Box in HTML
In Web Intelligence HTML, you can save your document by clicking the downward
arrow beside the save icon located in the upper left corner of the report. This opens
the Save As dialog box, as shown in Figure 2.26.
Figure 2.26 Save Document Dialog Box in HTML
Then, to save the document, follow these steps:
1. In the tree list, you can navigate into the folder where the document will be saved.
This folder can be in your personal folders (click Favorites Folder tray) or corporate
(click Favorites Folder tray).
2. In the File Name text field, enter the name for the file.
3. To display more options, click the >> button beneath the Save As Type selection. As
shown in Figure 2.27, this extends the dialog box to display Description, Keywords
text fields and Assign Category tree and Refresh on open and Permanent regional
formatting options.
75
2.5 Saving Your Document in the BI Platform Repository
2
Figure 2.27 Save Document Dialog Box with Advanced Options in HTML
4. Enter the appropriate options and click Save to save your document.
Small Screen
If you have a small screen, when you extend the save dialog box, you may not see the
Save button anymore. Scroll down to the bottom of the window to access it.

2 Creating New Documents and Queries
76
2.5.3 Using Refresh on Open Option
You can force a document to be refreshed when it is opened by selecting the Refresh
on open checkbox when saving it. This option can be set for the following reasons:
� To make sure the reader has the most recent data.
� When security has been defined to be applied, this forces this security to be
applied to the current reader, preventing him to see data from a previous refresh
by another user.
� If you have defined filter prompts when defining the query (Section 2.4), then
before retrieving the dataset from the dataset, the Prompts dialog box pops up to
allow you to select values for these prompts.
This option can be set either when saving the document (Section 2.5) and is available
among the advanced options. Alternatively, you can also set the Refresh on open
option in the Document Summary dialog box (Section 2.7).
Administrator Setting
Through security rights (see Appendix B), your administrator can force documents to
be refreshed on open. This is the case to force data security to be applied at query
time and prevent users to disable it.
2.6 Other Data Sources
As described in Section 2.1, one of Web Intelligence’s strengths is to allow you to
query several data sources types, in addition to the ones supported through the uni-
verse. The next sections describe the workflows for these other data sources, except
SAP BW and SAP HANA, which are covered in Chapter 13.
2.6.1 Excel as a Data Source
Using Microsoft Excel, it is easy to quickly create a database and store data into
spreadsheets. But this approach has some drawbacks:
� Because of this flexibility, many Excel files can be created, without any control,
making them hard to maintain.
� The data they contain cannot be traceable.
77
2.6 Other Data Sources
2
By storing the Excel files in the BI platform repository, you can add controls on these
files, and then use them as data sources for Web Intelligence documents.
To create a Web Intelligence document on an Excel file, follow these steps:
1. Once you have opened Web Intelligence, create a new document, as described in
Section 2.1.
2. In the Create a Document dialog box (see Figure 2.4 or Figure 2.5), when you are
asked to select a data source, select Excel and click OK.
3. In the Open a document from server dialog box that opens (see Figure 2.28), navi-
gate in the BI platform repository folders to find the Excel file to use.
Figure 2.28 Selecting Excel File in BI Platform Repository
4. Select the Excel file to query and click Open.
5. In the Custom Data Provider – Excel window that opens (see Figure 2.29), you can
define how the Excel file will be fetched:
– In the Sheet Name drop down list, select the sheet name that contains the data.

2 Creating New Documents and Queries
78
– In the Field Selection radio-buttons, select the fields to query: all of them (All
Fields), by defining a range (Range Definition), or by selecting a range name
already defined in the spreadsheet (Range Name).
– Select the First row contains column names checkbox to accept the first row in
the spreadsheet as column names. These column names are by default used to
name the mapped objects.
Additionally, you can change the Excel file used as a source by clicking Browse and
selecting another file. Click OK to move to the Query Panel for Excel.
Figure 2.29 Options for Using an Excel File as a Data Source
6. As shown in Figure 2.30, this Query Panel has some differences with the universe
Query Panel. The columns coming from the Excel file are displayed as objects in
the Result Objects pane. The Data Samples pane shows you a preview of the data-
set to be retrieved. You can select an object and in the Object Properties, modify:
– Its name
– Its qualification (dimension, measure or attribute)
– Its type
– Its aggregation function, if you have defined it as a measure
– Its associated dimension, if you have defined it as an attribute
79
2.6 Other Data Sources
2
Figure 2.30 Excel Query Panel
7. In the Query Properties pane, you may:
– Modify the query name in the Name text field
– Modify the source Excel file by clicking the button beside the Source Path field
– Unselect the Refreshable checkbox to not refresh the query when the docu-
ment is refreshed.
8. In the Query Definition pane, you may click Edit settings to open the Custom Data
Provider – Excel dialog box and modify the sheet and field selection defined when
selecting the Excel file.
9. Click Run Query to close the Query Panel, get the dataset from the Excel file and
display them in the report.
Once the dataset is displayed in the report, you can continue to build your report as
defined in next chapters.
2.6.2 Free-Hand SQL as a Data Source
If your administrator has given you the right to do so, you can directly query a rela-
tional database by providing a SQL statement. This capability, named free-hand SQL,
gives some flexibility to query but requires to know the underlying schema table.
2 Creating New Documents and Queries
80
This capability supports the ANSI SQL 89/92/98. The SQL query you enter can con-
tain:
� Stored procedures
� @variable
� @prompt in the SQL; which allows you to parameter your query
However, the SQL is not run if it contains Data Definition Language (DDL) com-
mands—DROP, ALTER,...—that can modify the database.
If your SQL query is valid, you can define objects to map the returned columns and
use them in the Web Intelligence document, as if they were returned by any other
data source.
For each object, you can define the following properties:
� Its name
� Its qualification: dimension, attribute or measure
� Its type: string or numerical
� Its aggregate function, if you have defined it as a measure
� Its associated dimension, if you have defined it as an attribute
Creating a document from free-hand SQL can be done with Web Intelligence Rich
Client, HTML or Java applet. It must be based on a connection stored in the BI reposi-
tory, hence you must be connected to it.
To create a document with free-hand SQL, follow these steps:
1. From BI Launch Pad, select to create a new Web Intelligence document, or in Web
Intelligence Rich Client, connect to the BI platform, then select to create a new doc-
ument.
2. In the Create a Document dialog box (see Figure 2.4 or Figure 2.5), when you are
asked to select a data source, select Free-hand SQL and click OK.
3. In the Select a relational connection dialog box that opens, navigate in the BI
repository folders to select the connection to use. Select it and click OK.
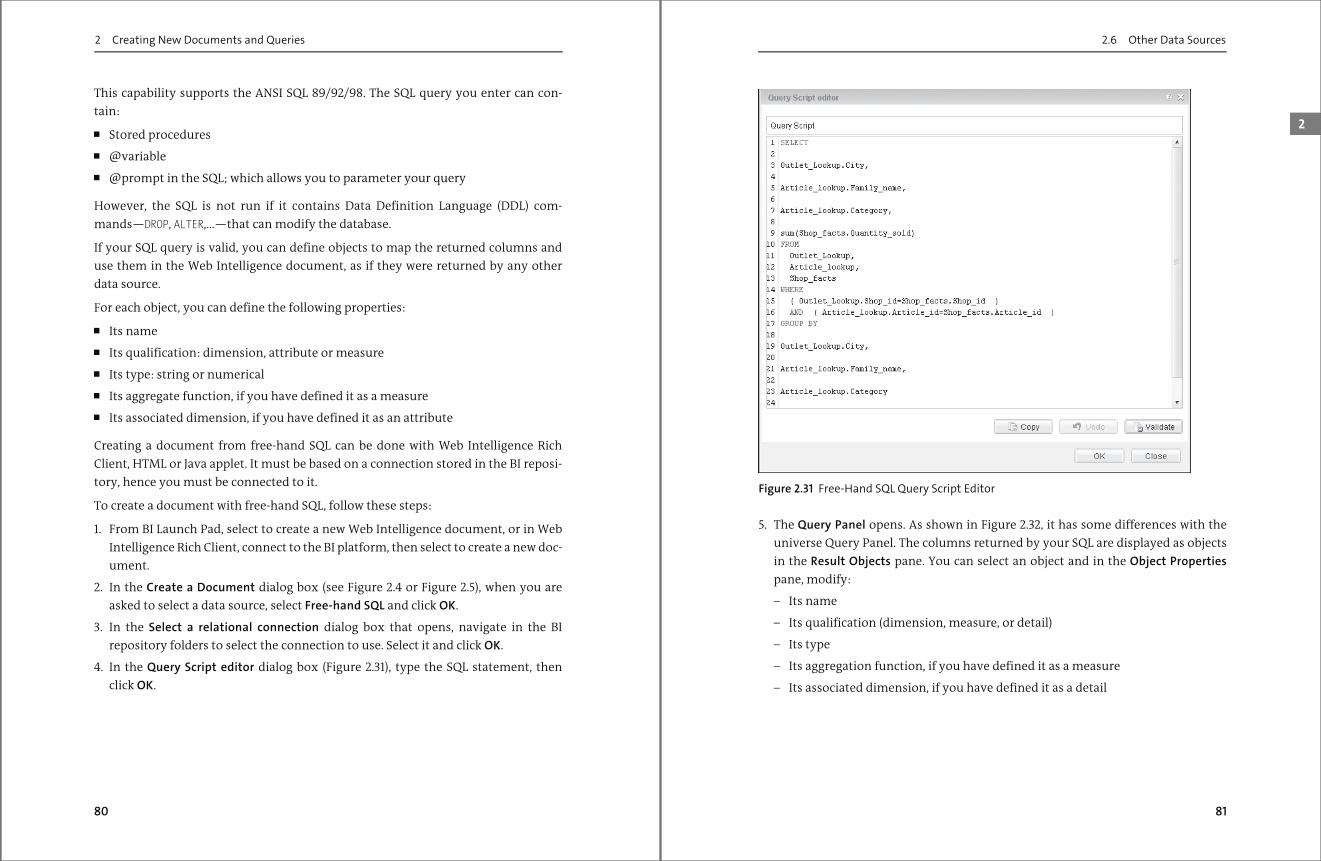
4. In the Query Script editor dialog box (Figure 2.31), type the SQL statement, then
click OK.
81
2.6 Other Data Sources
2
Figure 2.31 Free-Hand SQL Query Script Editor
5. The Query Panel opens. As shown in Figure 2.32, it has some differences with the
universe Query Panel. The columns returned by your SQL are displayed as objects
in the Result Objects pane. You can select an object and in the Object Properties
pane, modify:
– Its name
– Its qualification (dimension, measure, or detail)
– Its type
– Its aggregation function, if you have defined it as a measure
– Its associated dimension, if you have defined it as a detail

2 Creating New Documents and Queries
82
Figure 2.32 Free-Hand SQL Query Panel
6. In the Query Properties pane, you may:
– Modify the query name in the Name text field
– Modify the relational connection by clicking the button beside the Connection
field
– Select the Max Rows Retrieved checkbox and then enter a value in the text field
beside to limit the number of rows returned by the SQL query
– Select the Max Retrieval Times checkbox and then enter a value in the text field
beside to set the SQL query timeout (in seconds)
7. In the Query Definition pane, you may click Edit SQL... to open the Query Script edi-
tor dialog box and modify the SQL query.
8. Click Run Query to close the Query Panel, get the dataset from the SQL query and
display it in the report.
Once the dataset is displayed in the report, you can continue to build your report as
defined in next chapters.
83
2.6 Other Data Sources
2
2.6.3 Text Files as a Data Source
Using a text file as the data source can only be done from Web Intelligence Rich
Client. This option is not available in Web Intelligence HTML or Applet.
To create a document from a text file, follow these steps:
1. In Web Intelligence Rich Client, select to create a new document.
2. When you are proposed to select your data source, select Text.
3. The Open a document dialog box opens where you can navigate in your file system
to choose your text file to use as data source.
4. Once you have selected it, click Open to validate your choice. The Custom Data Pro-
vider – Text dialog box is launched (see Figure 2.33).
Figure 2.33 Custom Data Provider – Text Dialog Box
5. Select the options for the Data Separator and Text Delimiter of the source text file.
Other options include assigning the first row of the file as column names, and
selecting the Locale, Charset, and Date Format.
6. Click OK to close the Custom Data Provider – Text dialog box and opens the Query
Panel.
7. As shown in Figure 2.34, this Query Panel is very similar to the one for Excel.

2 Creating New Documents and Queries
84
8. The columns coming from the text file are displayed as objects in the Result
Objects pane. The Data Samples pane shows you a preview of the dataset to be
retrieved. You can select an object and in the Object Properties, modify its name,
qualification, type, its aggregation function (if you have defined it as a measure) or
its associated dimension (if you have defined it as an attribute).
Figure 2.34 Text File Query Panel
9. Click Run Query to close the Query Panel, get the dataset from the text file and dis-
play it in the report.
2.6.4 Web Services as a Data Source
In Web Intelligence Rich Client, you can also create Web Intelligence documents
using web services as the data source. These web services can be created from Query
as a Web Service Designer, data blocks published as web services from other Web
Intelligence documents, or generic web services.
1. In Web Intelligence Rich Client, select to create a new document.
2. When you are proposed to select your data source, select Web Services.
3. The Custom Data Provider – Web Services dialog box, as shown in Figure 2.35. In
the Source URL text field, enter your web service URL, then click Submit.
85
2.6 Other Data Sources
2
Figure 2.35 Custom Data Provider – Web Services Dialog Box
4. The dialog box is then extended to propose you more options, as shown in Figure
2.36.
– In the Service Name drop down menu, among the services exposed by the web
service, select the one to query.
– In the Port Name, select the port used by the web service.
– In the Operation Name, select the operation to query.
Figure 2.36 Web Service Details
5. The Message Details section is filled with the services details, as shown in Figure
2.37 a. You may click the SSO Enabled checkbox to use Single Sign-On for authen-
tication.

2 Creating New Documents and Queries
86
6. This tree list behind describes the web service’s Web Service Definition Language
(WSDL). This WSDL defines the web service contract. It allows you to set some val-
ues to pass to the web service when it is called.
Figure 2.37 Web Service Details
7. For example, go at the bottom of the tree and select login.
8. In the Enter Value text field, enter the username to authenticate, then click Apply.
9. Identically, select password and enter the password for this user then click Apply.
10. As shown in Figure 2.37 b, both branches are filled with the values you’ve entered.
Click OK to validate the web services definition.
11. The Custom Data Provider – Web Services closes and the Query Panel opens.
12. As seen in Figure 2.38, this Query Panel is very similar to the one for Excel and text
file and you can perform the same actions.
1
2
87
2.6 Other Data Sources
2
Figure 2.38 Web Service Query Panel
13. The columns coming from the web services are displayed as objects in the Result
Objects pane. The Data Samples pane shows you a preview of the dataset to be
retrieved. You can select an object and in the Object Properties, modify its name,
qualification, type, its aggregation function (if you have defined it as a measure)
or its associated dimension (if you have defined it as an attribute).
14. Click Run Query to close the Query Panel, get the dataset from the text file and dis-
play it in the report.
2.6.5 Analysis Views as a Data Source
Analysis views are created with SAP BusinessObjects Analysis for online analytical
processing. This reporting tool is also available from within the BI Launch Pad and
allows you to analyze multidimensional data source. Web Intelligence can use an
analysis view to access a subset of data derived from an analysis workspace and a
multidimensional data set, as shown in Figure 2.39. This capability provides a means
of accessing a specific arrangement of cube data within the Web Intelligence applica-
tion and outside of the analysis workspace.

2 Creating New Documents and Queries
88
Figure 2.39 Viewing a Cube in SAP BusinessObjects Analysis, OLAP Edition
You can take advantage of the rich feature set in Web Intelligence with the option to
create reports sourced from analysis views by doing the following:
1. From BI Launch Pad, select to create a new Web Intelligence document, or in Web
Intelligence Rich Client, connect to the BI platform, then select to create a new doc-
ument.
2. In the Create a Document dialog box (see Figure 2.4 or Figure 2.5), when you are
asked to select a data source, select Analysis View and click OK.
3. The Select an Analysis View dialog box opens where you can navigate in your BI
platform repository to choose the analysis view to use as data source.
4. Click OK.
5. The Query Panel opens displaying the objects exposed by the analysis view.
6. In the Data Preview, you may click Refresh to display data returned by the analysis
view, as shown in Figure 2.40.
7. Click Run Query to close the Query Panel, get the dataset from the analysis view
and display it in the report.
89
2.7 Document Options
2
Figure 2.40 Analysis View Query Panel
2.7 Document Options
The Document Summary dialog box contains a couple of very important property
settings to enhance the effectiveness of particular reports. The most commonly used
options include Refresh on open for prompted reports, Auto-merge dimensions for
queries with multiple data sources, and Enable query stripping to improve perfor-
mance.
To open this dialog box, in Design mode, select the Properties tab, then click
Document. The Document Summary dialog box opens, as shown in Figure 2.41. Mod-
ify your options, then click OK to validate them. Save your document so your new set-
tings are saved in the document.
Figure 2.41 shows the Document Summary options accessed through the Properties
tab in the Report Panel.

2 Creating New Documents and Queries
90
Figure 2.41 Document Summary Options
Let’s examine each of these Document Summary options:
� Refresh on open
This option forces the query to be refreshed when the report is opened. This fea-
ture is useful in prompted reports and when the data is restricted to the user
logged on to the BI Launch Pad. On SAP HANA Online mode (see Chapter 13, Sec-
tion 13.6), this option is renamed Update prompts on open.
� Permanent regional formatting
This option permanently sets the locale or regional formatting of the document.
91
2.7 Document Options
2
� Use query drill
This option modifies the underlying query when drilling down or drilling up in a
report. Dimensions are added or removed to the Result Objects section of the
query, and query filters are added dynamically based on the drill selection. The
scope of analysis is also modified dynamically. The query drill feature is most com-
monly used when reports contain aggregate measures calculated at the database
level.
� Update shared element(s) on open
When opening a document linked to shared elements, this option can be used to
automatically update them in the document if newer version of these shared ele-
ments have been published in the BI repository (see Chapter 19, Section 19.2).
� Enable query stripping
This feature allows queries to be generated with only the objects used in the
Report Panel, instead of all objects of the query. Retrieving only the needed objects
used in the document is intended to improve the query performance (see Chapter
12, Section 12.6).
� Hide warning icons in charts and tables
This feature hides general warnings that could potentially appear in the upper-left
corner of a chart (see Chapter 12, Section 12.7).
� Auto-merge dimensions
This option automatically merges dimensions when more than one query is
added to the document that contains objects with the same name, same data type,
and from the same universe (see Chapter 14, Section 14.3).
� Right to Left Content Alignment
Defines the default direction to display the document content if in BI Launch Pad
preferences, you have defined your preferred document orientation as “Default”.
� Extend merged dimension values
This selection shows all of the data in a report that contains synchronized or
merged dimension objects, not just the values relating to the merged objects (see
Chapter 14, Section 14.3).
� Merge prompts (BEx or HANA variables)
This selection is useful when multiple SAP BEx queries or SAP HANA are queried in
a single document. Identical prompts appearing in each query are synchronized
and only show the prompt a single time to the user. This option is supported to all
access to SAP BEx and SAP HANA (see Chapter 13), except SAP HANA Online mode:

2 Creating New Documents and Queries
92
– SAP BEx direct access
– Relational or multidimensional universe (UNX) to SAP BEx query
– Relational or multidimensional universe (UNX) to SAP HANA
– SAP HANA direct access (relational or multidimensional)
� Check for shared element update(s) on open
When opening documents linked to shared elements, this option can be used to
prevent Web Intelligence to look if new updates of the shared elements have been
published in the BI repository (see Chapter 19, Section 19.2).
� Default Style
In the Default Style section, you can import or export the style used by the docu-
ment.
� Comments
In the Comments section, you can define if the comment displayed in the com-
ment cell or tooltip if the first or last comment in the thread of discussion (see
Chapter 18, Section 18.5).
2.8 Summary
Several features make Web Intelligence the best-in-class query and analysis solution
for any data warehouse, data mart, or business intelligence reporting environment
and one of them is the Query Panel.
In an intuitive web-based report development interface, using the drag-and-drop
interface of the Query Panel, you can create queries to graphically transform prebuilt
universe objects into analytical reports. The objects added to the Result Objects pane
and Query Filter pane generate script to access data sources without having to write a
single line of code; which makes Web Intelligence ideal for self-service data analysis
and reporting.
Precise results are returned by constraining values at the database level with a rich
set of operators for query filtering. You can group your conditions in nested pairings
with the AND and OR operators for more complex filtering. You can learn to control
your row counts by limiting the maximum number of rows retrieved by a query.
Your DBAs will appreciate the reduced stress on the database when you set a maxi-
mum retrieval time on your queries.
93
2.8 Summary
2
Historically, Web Intelligence queries are based on universes, and all the data sources
they support. But through variant versions of the Query Panel, you can also directly
use Excel files, text files, free-hand SQL, web services or analysis views as Web Intelli-
gence data sources.
Document properties can also be set to define various behaviors for this document.
Once the dataset is retrieved and stored in the document microcube, you can start
designing and formatting your report, as described in the next chapter.

95
3
Chapter 3
Creating a Report in Web Intelligence
Use Web Intelligence reports to analyze, present, and interact with
highly formatted data for accurate and more informed decisions. You
can use drill filters, input controls, charts, tables, block filters, and a
lengthy set of report functions to produce highly customized reports.
Additionally, with a powerful charting engine, Web Intelligence users
are able to consume rich graphical reports.
Reports are your window to a business’s performance results and scorecards for
tracking metrics from detailed granular data to summarized aggregate reports. A
user’s role in an organization will dictate how they use Web Intelligence reports. This
can vary from viewing and analyzing data to designing and editing existing reports.
Reports can also be shared with other users in a secure, customized, and web-based
delivery format. Behind the scenes, Web Intelligence reports are saved to the file
repository server and delivered to the end user using the BI Launch Pad, the SAP Busi-
nessObjects BI portal.
Web Intelligence enables you to present company data in your reports by adding
data tables and charts to the Report Panel via several provided report templates.
You’ll then be able to group data by adding multiple sections and breaks to produce
analytical documents by including sorts and drill filters.
After creating a Web Intelligence reporting document, users can quickly share their
findings with other users across the enterprise by saving reports in the folder struc-
ture storage area accessed with BI Launch Pad. Depending on permissions, users are
either granted or denied access to view, schedule, or even edit documents while
working within the BI Launch Pad.
The application also enables users to identify significant values by including
conditional formatting in reports. Conditional formatting can be applied to rows and
columns in a report, assigned to every column or row in a table, or applied to single
columns and headers of table reporting elements.

3 Creating a Report in Web Intelligence
96
Web Intelligence also allows users to create precisely designed reports by defining
the formatting and object placement relationships of objects on the report canvas by
assigning relative position attributes to report elements This feature is accessed by
going to the Layout properties of a chart or table after it has been added to a report.
Due in part to the broad set of features available in the Web Intelligence Report Panel,
report developers can create free-form presentations for displaying data in the most
ideal way for their unique business need rather than having to force data into a tem-
plate.
3.1 Adding Data to Report Elements
Data is added to reports by adding result objects or variables to any of the report ele-
ments such as a table, chart, map, or cell.
Follow these steps to add a report element to the canvas of a Web Intelligence report
after your query has been refreshed:
1. Click on Design. All document editing must be done in design mode rather than
reading mode.
2. Select the Report Elements tab from the ribbon toolbar. (Note: If you’re using the
Applet viewer then the tab is labeled Report Element; in the HTML viewer it’s
labeled Report Elements.)
3. Select the Table (or Tables depending on viewer) subtab and then select the data
table to be added.
4. Choose a location on the report canvas and click to insert the data table type
selected, as shown in Figure 3.1.
Figure 3.1 Selecting a Location on the Report Canvas to Insert the Selected Element
97
3.1 Adding Data to Report Elements
3
Note
You can build the report elements without actually seeing the data by viewing the
structure of the document pane, which is very useful when working with large sets
of data. You can toggle between Structure only and With Data by using shortcut keys
[Ctrl]+[2] and [Ctrl]+[3].
3.1.1 Populating a Cross Table
Table objects are the basic elements in reports; the following steps guide you through
adding a cross table (crosstab) to a report. There are two methods for assigning
objects to a report element.
Dragging and Dropping Objects onto a Table
The first method is accomplished by dragging one or more result objects from the
Available Objects tab in the side panel and then dropping them into the appropriate
sections in an already inserted cross table.
Figure 3.2 shows the [Sales revenue] measure object being added to a cross table.
Figure 3.2 Drag and Drop a Sales Revenue Measure Object to a Crosstab

3 Creating a Report in Web Intelligence
98
Assigning Data to Report Elements
The second method for assigning objects to a data table or chart is by right-clicking
on a report element and selecting Assign Data.... Figure 3.3 shows the menu pre-
sented when right-clicking on a crosstab.
Figure 3.3 Right-Clicking on a Crosstab to Assign Data
Note
The Assign Data... option for connecting result objects and variables to report ele-
ments is available for both charts and data tables. Figure 3.4 shows the Assign Data...
window for connecting data to a crosstab.
Figure 3.4 Assign Data Window When Adding Objects to a Crosstab
99
3.2 Sections and Breaks
3
3.1.2 Populating a Chart
Charts can be populated with data objects very similarly to the way data tables are
created. To get started with the editing and chart building process, be sure that you’re
in design mode. The easiest method of assigning dimensions and measures to a chart
is by dragging and dropping objects from the Available Objects tab on the side panel
onto the chart. Objects can be dropped anywhere on the chart; the charting engine
will know where to assign dimension and measure objects.
You will instantly see charted values after at least one dimension and one measure
has been dropped onto the chart. If you’re in Design structure only mode, return to
Design with data to see the data populated in the charts and tables.
Note
A chart must include at least one dimension object and one measure object, while a
data table can contain a single object.
The next section discusses how you can use sections and breaks to enhance the read-
ability and functionality of a report.
3.2 Sections and Breaks
Grouping data is accomplished by creating sections for dimension objects or apply-
ing breaks to columns displayed in tables. Sections are used to group data into visu-
ally separated segments while breaks provide the ability to create subtotals within
the same segment. Now in SAP BusinessObjects BI 4.2 SP 3, you’ll see a new Section
tab located within the primary Result Objects tab. Clicking on the Section tab will
reveal the Insert Section button. Both are displayed in Figure 3.5.
Figure 3.5 Inserting a Section with the Section Tab
After clicking Insert Section, you’ll have the chance to select a location on the report
canvas to place the section. A standard click will insert in the location that you’ve
chosen. Figure 3.6 shows the message that you’ll see when using the Applet viewer.

3 Creating a Report in Web Intelligence
100
Figure 3.6 Choosing a Location to Insert a Section
After adding a section to a report, you’ll need to select a dimensional object from the
list of available objects.
You can add multiple sections to a single report with each subsequent section
becoming a subsection of the original. One restriction of a section is that it can’t be a
measure object.
3.2.1 Setting a Section
Figure 3.7 shows the City object in a vertical table being set as a section using the tra-
ditional method of right-clicking on the object and selecting Set as Section.
Figure 3.7 Transforming a Column in a Table to a Section
101
3.2 Sections and Breaks
3
To add a section to a report, follow these steps:
1. Use an existing data table on a report that already has at least a one dimension
object assigned to it. Identify the object to be used as the section.
2. Right-click on the object and select Set as Section. This will split the rows into
groups based on the values of the dimension defined as the section.
After you’ve set an object as a section, it will be removed from the table and added as
a table group (or section) header. The remaining values in the table will be grouped by
the values of the section.
Figure 3.8 shows the outcome of setting the City result object column in the data
table to a section. The City object has been added as a block header, and the object is
no longer a column in the table.
Figure 3.8 Setting the City Object as a Section
After you’ve added the section you can also add report elements to that section. The
values in any additional elements are grouped by the same values in the section
heading.
To view the size of a section and identify the elements in it, switch to Design structure
only mode. You can do this by clicking the downward arrow beside Design and select-
ing Structure only. This view of the report is also accessible by using shortcut keys
(Ctrl)+(3). Viewing the report structure allows you to resize the height of the section
with regard to the objects and elements that will be presented inside it.

3 Creating a Report in Web Intelligence
102
Figure 3.9 shows the structure view of the report that contains the section added in
the previous step.
Figure 3.9 Structure Only View of a Report
Formatting Sections
To apply formatting to a section in a report, right-click anywhere in the section while
in Design with data mode and select Format Section from the list of options. From
the Format Section window, you can apply various settings, including the following
in the General category:
� Bookmark section
� Hide section when the following are empty
� Hide always
� Hide when empty
� Hide when the following formula is true
The Appearance and Layout categories provide the following options:
� Background colors and images
� Vertical properties:
– Start on a new page
– Repeat on every page
– Avoid page break
Note
An important setting that is often difficult to locate is the Minimum Top Offset sec-
tion setting. For a report that contains at least two pages and a section, this setting
should always be changed manually to 0.00, or the first page of your report will have
a gap above the first sectioned value.
103
3.2 Sections and Breaks
3
Accessing the Minimum Top Offset Setting
To access the Minimum Top Offset setting, follow these steps:
1. Right-click on a section.
2. Select Format Section.
3. Select the Layout category.
4. Update the Minimum Top Offset function to 0.00.
This setting is pictured in Figure 3.10.
Figure 3.10 Locating the Minimum Top Offset Section Setting
3.2.2 Grouping Data with Breaks
Another way of grouping table data in a Web Intelligence report is by using breaks.
Breaks are similar to sections, except that when you add them, they don’t include
block headings. When you add a break, a new set of break properties becomes avail-
able for customization.
Add a break by selecting an existing object in a table, right-clicking on the object, and
then in the contextual menu, select Break � Add Break. Adding a break to a data table
is useful for calculating subtotals. Breaks will appear as a subset of section values and
the dimensional object selected as a break will remain visible within the report table,
unlike when a section is added.
A Second Way to Add a Break
Another way of adding a break is by using the Break function in the ribbon toolbar.
Begin by selecting an object in a table to create the break for, and then click the Break
button located in the Analysis tab and Display subtab. This function is pictured in
Figure 3.11.

3 Creating a Report in Web Intelligence
104
Figure 3.11 Adding a Break Using the Ribbon Toolbar
Editing Breaks
To edit the properties of a break, click anywhere inside the table containing the break
and then click the downward arrow beside Break in the Analysis tab and Display sub-
tab. Next, select Manage Breaks. From this window, you’ll be able to apply break set-
tings to all breaks within the selected report element.
Figure 3.12 shows the break properties available when designing a report.
Figure 3.12 Managing Break Properties
After a section or break has been created on a table, you can unfold and fold a data
table to toggle between viewing detailed and aggregated data.
3.2.3 Adding Custom Groups
Custom groups allow for more flexibility when grouping data on a report. This rela-
tively new feature allows report designers to create if-then-else logic graphically
with a window for easy selecting.
105
3.3 Outline Navigation
3
Like creating breaks, begin by selecting an object from an existing data table in a
report. Next, click the Group button located in the Analysis tab and Display subtab.
This is pictured in Figure 3.13
Figure 3.13 Adding a Custom Group
We talk more about adding custom groups in Chapter 11.
3.3 Outline Navigation
The outline feature provides the ability for users to navigate a report by collapsing
and expanding data tables based on break or section values to view details or totals.
This method of analysis can be a real time-saver by adding interactivity to reports
that provide users with the ability to jump right to the level of aggregation needed.
Even when a table doesn’t have a break or section, the Outline Fold feature allows you
to see the totals with two clicks. Outline, pictured in Figure 3.14, is one of the few tool-
bar choices available to users in Reading mode and is enabled/disabled with a stan-
dard click.
Enabling Outline will allow users to fold/unfold data blocks based on existing breaks
to show all of the data available or to only show subtotals. It’s worth noting that mul-
tiple tables can exist on a single report page with breaks added at different levels and
the Fold/Unfold feature functions independently on each table.
Figure 3.14 Locating Outline in the Reading Toolbar
When viewing a report in Reading mode, the Fold/Unfold feature is turned off by
default, even when the Outline button has been toggled on. Figure 3.15 shows part of

3 Creating a Report in Web Intelligence
106
a report containing four breaks and Outline enabled. The only noticeable difference
is a thick gray border above and to the left of the report.
Figure 3.15 Outline Enabled on a Report with Breaks
3.3.1 Putting Outline into Action
To begin folding data in a table, you need to click anywhere in the table to see how
many levels of aggregations are available to be collapsed or expanded. Figure 3.16
shows the same table pictured in Figure 3.15 except that the Sales Revenue column
heading was clicked. Folding and unfolding takes place when an individual arrow is
clicked. This will either collapse all of the details within that break value or expand all.
Note
When the arrows are pointing down, the break is unfolded or expanded to its maxi-
mum size. When the arrow or arrows are pointing to the right, then folding has taken
place.
Since a single report tab can contain multiple data tables with varying dimensions,
breaks, and levels of aggregation, the table must be clicked to engage the folding fea-
tures.
Even if a table doesn’t contain a break or section, when Outline is enabled, you can
still click in the table to fold it and show column totals.
107
3.3 Outline Navigation
3
Figure 3.16 Enabling the Fold/Unfold Options in Outline Mode
Figure 3.17 shows the report from the previous tab when fold 4 is clicked. Hover over
the fold column numbers to see the name of the dimension used to create the break.
Notice how all of the details below the Week level have been hidden because the
totals for each week are now being displayed.
Figure 3.17 Folding Enabled on the Fourth Break to Show Totals by Week

3 Creating a Report in Web Intelligence
108
Also note that the arrows are now pointing to the right in the fourth break column.
This tells the user that all values in the break are now showing totals within the hier-
archies above it.
If you click one of the fold numbers like pictured in the lower-left corner of Figure
3.17, all breaks and folds beneath it will be hidden. Figure 3.18 shows how the report
will look when fold 1 is clicked.
Figure 3.18 Folding at a Higher Level
3.3.2 Folding at Different Levels
Once you get the hang of how to fold and unfold breaks, you’ll be able to create cus-
tom views of data that show a combination of totals, subtotals, and details. This is
especially useful when hiding less essential line items without completely removing
them and to also compare values and percentages at different levels.
Figure 3.19 shows varying levels of folding applied to the same table as the previous
examples.
Note
If it’s important to design a report for your audience to view data at very specific
mixed levels, this can be achieved by following the example in Figure 3.21 and then
toggling Outline mode to off.
Once Outline has been turned off, folding and unfolding will be disabled and the
report can be used merely as an analytical document and to utilize other valuable
109
3.4 Enhanced Sorting and Ranking
3
features in Web Intelligence, without the need to reconfigure the folds and breaks to
recreate a style or view of the data. The folds previously configured will remain in
place with all future refreshes of the data.
Figure 3.19 Varying Levels of Folding
The following section describes how to insert sorting and ranking into a report.
3.4 Enhanced Sorting and Ranking
Sorting and ranking are two simple techniques that increase report readability by dis-
playing the most significant information to report consumers in the shortest
amount of time. In just a couple of clicks, columns can be sorted, or the rows in a table
can be ranked to display the top 10 sales revenues by the dimension of your choice.
Both functions are available to report consumers in design mode. Let’s begin by
examining sorting.

3 Creating a Report in Web Intelligence
110
3.4.1 Sorting
Sorting can be applied to tables or charts in a report and to either dimension objects
or measures. Sorting is also always applied in breaks and sections. Figure 3.20 shows
the Sort options available in the toolbar menu under the Analysis/Display tabs.
Figure 3.20 Sort from the Toolbar Menu under Analysis/Display
Four sort types are available to you while viewing a report in BI Launch Pad or when
editing a Web Intelligence document:
� None
Natural sorting occurs based on the type of data in the columns.
� Ascending
Sorting begins with the smallest value at the top (e.g., A, B, C, or 2, 4, 6).
� Descending
Sorting ends with the smallest value at the top (e.g., C, B, A, or 6, 4, 2).
� Custom
Sorting is defined by the user; it often applies to character names but doesn’t apply
to measures. It is accessible via Manage Sorts in the menu options.
Sorting data in charts or tables allows users to quickly access data points in alphabet-
ical or numerical order.
Applying Sorting
To apply sorting within a table, follow these steps:
1. Select the column or result object to be sorted.
2. Select the Sort option in the Analysis/Display tabs.
3. Select the sort type.
4. Select None to remove applied sorting and return to default.
111
3.4 Enhanced Sorting and Ranking
3
To apply sorting within a chart, follow these steps:
1. Click on Design/Structure only located on the main toolbar to switch from data
view to structure only view.
2. Click on the object in the chart to be sorted.
3. Select the Sort option on the Analysis/Display tabs.
4. Select the sort type.
5. Click on Design/With data to return to see the sort selected.
6. Return to the structure view, and add, remove, or edit an existing sort.
7. Click on the Sort icon again to remove the sort.
Custom Sorting
Custom sorting is available only for dimension objects and while editing a document
in the Report Panel.
When you select custom sorting, the dimension values of the object will be displayed
in natural or ascending order. You can re-sort the item values by selecting values
individually and clicking on the up or down arrows until the values are in the order
that you prefer.
An example of custom sorting is when a month name object sorts alphabetically
rather than chronologically, as shown in Figure 3.21. For months to appear in chrono-
logical order, you need to create a custom sort to reorder the values. If you have data
only through June, then July through December values won’t appear in the list.
Figure 3.21 Default or Natural Sorting Applied to the Month Abbreviation

3 Creating a Report in Web Intelligence
112
This is when you need to include temporary values. Enter the month names from July
to December, add them to the existing list, and then order them chronologically
rather than alphabetically. This will keep the month data sorted correctly for all
future refreshes.
The only way to sort the months correctly is to apply a custom sort.
Custom Sort Dialog Box
Figure 3.22 shows the Custom Sort dialog box used to sort the month name values.
Click on the values in the provided list box and then use the arrows to the right to
move them up or down the list.
Figure 3.22 Custom Sorting
The left side of the Custom Sort screen allows you to add temporary values for items
that don’t currently appear within the list of values.
Note
Before a custom sort can be applied, the column has to already have a sort. After add-
ing a sort to a column, view the advanced sort options to modify the custom sort
order.
113
3.4 Enhanced Sorting and Ranking
3
Custom Sorting Options
To create a custom sort, click on the small downward arrow to the right of the Sort
function, and then select the advanced option. This menu provides additional
options for customizing sorts on the selected chart. The following options are avail-
able in the Manage Sorts window:
� Revise the priority of sorts if more than one sort has been added.
� Modify the direction or order of a chart between ascending or descending.
� Add a new object to be sorted, or remove an existing sort.
� Define a custom order to sort an object.
� Reset an existing custom sort object back to ascending or descending.
Remove Custom Sort Value
If a custom sort has been added but needs to be removed, view the sort by accessing
the advanced menu and then click reset located just beneath the values button under
custom order.
Figure 3.23 shows sorting being set on a measure within a data table.
Figure 3.23 Sorting Sales Revenue in Descending Order
Note
Notice that custom sorting isn’t an option when sorting on a measure object. Cus-
tom sorting is only available for dimension objects.

3 Creating a Report in Web Intelligence
114
Enhanced Sorting
Sorting in charts and data tables is a very common requirement when analyzing data
in reports. Now in SAP BusinessObjects BI 4.2, chart sorting has been enhanced to
provide users with even more flexibility when displaying data visually in reports.
Sorting can become a necessary function when displaying data from two or more
measures or dimensional objects. The Region Color feature, available when assigning
data to charts, provides this capability by allowing charts to be created that display
two-dimensional values for a single measure. Depending on the values being
charted, this combination of measures and dimensions can be difficult to interpret.
To ease the complexity of displaying and analyzing this type information, the sort
feature now allows you to sort by dimension, measure, or by the dimensional value
selected in the Region Color section. Figure 3.24 shows the Sort menu with a column
chart selected that contains two dimension objects and a single measure object.
Figure 3.24 Sorting by Group
Note that in order to get the option of sorting a chart on two different groups, you’ll
need to add a second dimension to the Region Color selection when assigning data to
the chart. By default, Region Color is optional. Adding a dimension object to this area
will further breakout the results of the dimension used in the Category Axis.
Figure 3.25 shows the Year dimension being added to the chart to see the Quantity
sold values by City and broken out by the year. With this feature, you can apply sorts
to dimensions in both groups and also to any measure object in the chart.
Figure 3.26 shows a chart sorted by two dimensions: City and Year.
115
3.4 Enhanced Sorting and Ranking
3
Figure 3.25 Adding a Second Optional Dimension with the Region Color Entry
Figure 3.26 Sorting a Chart by a Dimension and Measure
Multigroup charting displays information in a compound format and is ideal when
the number of values in both dimension objects is relatively small.
Sorting in a Cross Table (Crosstab)
Compound sorting isn’t reserved for charts only. Cross table report elements can also
contain multiple sorts applied to the dimension objects in both the columns and
rows in the table.

3 Creating a Report in Web Intelligence
116
Figure 3.27 shows the sort selections applied in a cross table. The State object has been
assigned to the vertical axis, and the Year object to the horizontal axis. To apply sort-
ing to objects in the Columns and Rows sections, use the Advanced Sort option to set
up custom sorting on either object. You can also simply select the data in the table
and then select the sort direction in the toolbar.
Figure 3.27 Applying Sorts to a Crosstab
Ranking also helps report consumers access significant information quickly.
3.4.2 Ranking
Ranking is used to display the top or bottom number of objects within a block. Values
are ranked by dimensions and are based on measures of several different types and
calculation modes:
� Top/Bottom
Select Top, Bottom, or both, and then use the up and down arrows or text box to set
number of values.
� Based on
Select a measure to use for ranking.
� Ranked by (optional)
This selected dimension object is used by the ranking to create the top or bottom
values.
� Calculation mode:
– Count: This mode returns the top or bottom n records of the Based on selection.
117
3.4 Enhanced Sorting and Ranking
3
– Percentage: This mode returns the top or bottom n% of records of the total
number of records and the Based on selection.
– Cumulative sum: This mode returns the top or bottom records for the cumula-
tive sum of the measure selected and (optionally) the Based on selection;
doesn’t exceed n.
– Cumulative percentage: This mode returns the top or bottom records for the
cumulative sum of the measure selected and (optionally) the Based on selec-
tion; doesn’t exceed n%.
Ranking takes precedence over any sorts previously set up in a report block.
Note
Web Intelligence includes tied rankings, which means that if you want to display the
top 10 values, and 3 records have the same value, 13 records will appear in the top 10
list.
To add a ranking, follow these steps:
1. Modify your Web Intelligence document. (Ranking can be applied only in Design
mode.)
2. Select a table or chart to be ranked.
3. Click on the Ranking button located on the reporting toolbar on the Analysis tab
and Filters subtab.
4. Select the Ranking properties in the Ranking dialog box.
Two options—Edit Ranking and Remove Ranking—will be available if a ranking has
already been added to a report element, because only one ranking can be added to a
report element.
Figure 3.28 shows the Ranking dialog box opened when Add Ranking or Edit Ranking
is selected. This dialog box allows you to configure the ranking properties by check-
ing the Top, Bottom, or both ranking property types, followed by selecting the Based
on, Ranked by, or Calculation mode to create or edit a ranking.
The next section discusses conditional formatting rules and how they can be used to
alert report consumers about important conditional elements in Web Intelligence
reports.

3 Creating a Report in Web Intelligence
118
Figure 3.28 Ranking Dialog Box for a Crosstab
3.5 Conditional Formatting
Web Intelligence reports use conditional formatting rules (previously known as alert-
ers) to highlight values that meet a specified set of criteria. When a set of criteria has
been met, values can be displayed with customized formatting. This includes the
capability to modify the following areas:
� Text
Font, type, size, color, underline, strikethrough
� Background
Color, skin, image from URL, image from file
� Border
One or more sides, border size, color
Note
Because of the capability to add a background image in a conditional formatting rule,
reports can be designed to function as scorecards and display trend icon images
based on a value’s relation to a target value or threshold.
Figure 3.29 shows the New Rule... button for conditional formatting on the ribbon
toolbar while using the HTML viewer.
119
3.5 Conditional Formatting
3
Figure 3.29 New Conditional Rule Button on the Ribbon Toolbar
Clicking the New Rule... button will launch the Formatting Rule Editor window, which
is shown in Figure 3.30. From this window, modify the following settings to set up the
criteria for the new conditional formatting rule:
� Name
Give the conditional rule a descriptive and unique name; this is important if you
have many rules. The default value in this field is Conditional Format.
� Description
Enter a clear description of what each conditional rule will perform.
� Filtered object or cell
Select the field or result object to be evaluated.
� Operator
Select the operator to be used (e.g., Equal to, Greater than, etc.).
Figure 3.30 Formatting Rule Editor

3 Creating a Report in Web Intelligence
120
� Operands
Enter a value to represent the target or threshold to trigger the conditional format.
After configuring these five settings, click on the Format button to launch the
Formatting Rules Display window used to define the visual attributes of the new rule
(see Figure 3.31).
Figure 3.31 Formatting Rules Display
From this window, revise the following items to create the criteria for the conditional
display:
� Display
Can be used to write a formula or apply a specific number format to a data element
when a specific condition is met.
� Text
Change the default font size and font color. The default color is already selected to
red, but you can choose another color by clicking on the down arrow and selecting
from the color palette.
121
3.5 Conditional Formatting
3
� Background
Choose colors, patterns, or images to apply to the cell background.
� Border
Choose any style for the cell border to accentuate the cell.
Note
Use the Preview area in the Text section of the Formatting Rules Display window to
see how a rule will show the text, background, or borders configured in the rule.
After you’ve created a new conditional formatting rule, select a column or table head-
ing, and then click on the Formatting Rules icon on the ribbon toolbar under the
Analysis/Conditional tabs. All available conditional formatting will have an open
checkbox located to the left of the conditional formatting name.
Check the rule that you want to apply to the selected column and click on OK. Figure
3.32 shows a conditional formatting rule being applied with these three steps:
1. Select the column to apply the conditional formatting to.
2. Click on the Formatting Rules icon.
3. Select the conditional settings to be applied to the selected column(s).
Figure 3.32 Conditional Formatting Rules Applied to a Column in a Table
Figure 3.33 shows the Formatting Rule Editor window with a basic condition in place
to highlight any cell to light yellow and bold text when the value is greater than
15000.
The next section explains how to modify report headers and footers and describes
the method for including background images in reports.

3 Creating a Report in Web Intelligence
122
Figure 3.33 Basic Conditional Format Setup in the Formatting Rule Editor
3.6 Headers, Footers, and Background Images
To access headers and footers property window, click anywhere inside a header or
footer, right-click, and then select either Format header or Format footer, depending
on which you’re working on. The Format header window opens, as shown in Figure
3.34.
Both property windows allow you to apply the following formats:
� Border
– Style
– Thickness
� Appearance
– Color
– Pattern: Can include a color, skin, or image
� Layout
– Show header (or footer)
– Header (or footer) Height
123
3.6 Headers, Footers, and Background Images
3
Figure 3.34 Format Header Window
The header and footer sections can be hidden or displayed depending on your prefer-
ence or business requirements.
To toggle the header on or off, begin by entering Design mode, and then click the pri-
mary Page Setup tab. Next, select either the Header or Footer subtabs. Notice that the
Show button will either be on or off. Figure 3.35 shows the Show Header icon with the
header enabled and the header height at 0.55 inches.
Figure 3.35 Report Header Set as Visible in a Report
If the page header and footer have both been removed from a report, and you need to
add them back in, follow these steps:
1. Click on the Page Setup � Header tab on the ribbon toolbar.
2. Click on the Show button to turn the header on. You can also set the height of the
header in this step.

3 Creating a Report in Web Intelligence
124
3. Click on the Page Setup � Footer tab on the ribbon toolbar.
4. Click on the Show button to turn the footer on. You can also set the height of the
footer in this step.
Quite often, report developers need to include background images or company logos
in Web Intelligence reporting documents. You can easily do this by following just a
few steps:
1. Go to the Report Elements � Cell tab on the ribbon toolbar. Place the Blank icon
onto the report canvas at your desired location.
2. After the blank cell has been added, right-click on the it, select Format Cell, and
choose Appearance in the Format Cell window. You can also click on the
Appearance icon under Format/Style on the ribbon toolbar. Figure 3.36 shows the
properties available for the blank cell under Appearance.
Figure 3.36 Format Cell Appearance
The Background dialog box opens to provide four options under Pattern (see Figure
3.37):
� None
Default selection
� Skin
Shows five predefined photos
125
3.6 Headers, Footers, and Background Images
3
� Image from address
Opens a dialog box for manual URL entry
� Image from File
Enables browsing to locate and select a local image
You can create background images with the following file types: PNG, BMP, GIF, JPG,
or JPEG.
Images are presented with five different display types:
� Normal
� Stretch
� Tile
� Horizontal Tile
� Vertical Tile
The position of the images can be displayed in any of these combinations:
� Top, Center, Bottom
� Left, Center, Right
Figure 3.37 Display Image Options for Formatting a Cell

3 Creating a Report in Web Intelligence
126
Note
When images are selected as background images in a Blank Cell element, the recom-
mended display selection should be set as the Stretch setting. This selection will
resize the image to scale when the cell size is either increased or decreased.
Headers, footers, and background images can be used to add context to Web Intelli-
gence reports. Report headers and footers can contain document names, company
logos, dates, page numbers, and even custom messages such as confidentiality state-
ments. Images can be useful because they can aid in illustrating concepts, add brand-
ing, or adding style to a report. Choosing the right placement for images and creating
a consistent look and feel is imperative in achieving strong usability for report con-
sumers.
3.7 Summary
Web Intelligence documents are created for viewing, analyzing, and sharing com-
pany data in a secure, customized, and drillable web-based delivery format. You can
create reports by using the result objects and report elements, and by setting proper-
ties in the tabs provided in the side panel. Reports are physically presented in the
document pane and easily enhanced with the extensive list of shortcut icons in five
provided toolbars.
Web Intelligence allows you to present multiple reports within a single reporting
document that contains a variety of data visualization component types. You also
have the ability to create drillable and highly formatted reports that include sections,
breaks, sorting, ranking, and report filters to produce effective analytical documents.
Changes in report data can be easily identified when detailed conditional formatting
has been created.
SAP BusinessObjects provides a full spectrum of reporting components for display-
ing data. These include Available Objects tables, freehand cells, scorecarding capabil-
ities through the use of conditional formatting, and 34 different types of charts.
The Report Panel provides a highly intuitive development canvas that allows busi-
ness users to create, edit, and share reports with ease.
127
3.7 Summary
3
Chapter 4 describes how to navigate the Web Intelligence reporting interface and
explains its ribbon-based toolbar. This is important because the Web Intelligence
interface has changed from its previous releases. A bit of familiarization is necessary
to get used to all the icons and their placements; however, you’ll find that the group-
ing of icons is much more intuitive because it’s based on their functional areas.
7
Contents
1 Introduction to SAP BusinessObjects Web Intelligence 25
1.1 Features of Web Intelligence 4.2 .................................................................................. 26
1.1.1 Core Product Functionality ................................................................................ 27
1.1.2 Reading Mode versus Design Mode ............................................................... 30
1.2 Web Intelligence Clients ................................................................................................... 32
1.2.1 Web Intelligence HTML ...................................................................................... 33
1.2.2 Web Intelligence Java Applet ........................................................................... 34
1.2.3 Web Intelligence Rich Client ............................................................................. 34
1.2.4 Web Intelligence Interactive Viewer .............................................................. 35
1.3 Web Intelligence Preferences ........................................................................................ 36
1.3.1 Setting the View and Modify Selection Types ............................................ 38
1.3.2 Locale When Viewing a Document ................................................................ 39
1.3.3 Drill Option Preferences ..................................................................................... 40
1.3.4 Saving to Microsoft Excel Priority ................................................................... 41
1.3.5 Document Orientation Setting ........................................................................ 41
1.4 What’s New in Web Intelligence 4.2 SP 3 and SP 4 .............................................. 41
1.5 Summary ................................................................................................................................. 43
2 Creating New Documents and Queries 45
2.1 Creating a Web Intelligence Document from a Universe .................................. 45
2.2 The Query Panel in Web Intelligence ......................................................................... 51
2.2.1 Creating the Query ............................................................................................... 52
2.2.2 Setting Query Properties .................................................................................... 55
2.2.3 Previewing Data .................................................................................................... 57
2.2.4 Evaluating Generated SQL Script .................................................................... 59
2.2.5 Running the Query ............................................................................................... 60

Contents
8
2.3 Query Filters .......................................................................................................................... 61
2.3.1 Predefined Filters ................................................................................................. 61
2.3.2 Custom Filters ....................................................................................................... 62
2.3.3 Quick Filters ........................................................................................................... 65
2.3.4 Nested Conditions ............................................................................................... 66
2.4 Prompted Queries ............................................................................................................... 67
2.4.1 Creating a Prompted Filter ................................................................................ 67
2.4.2 Running the Query .............................................................................................. 69
2.4.3 Data Source Prompts .......................................................................................... 70
2.5 Saving Your Document in the BI Platform Repository ....................................... 71
2.5.1 Save Document Dialog Box in Applet ........................................................... 72
2.5.2 Save Dialog Box in HTML ................................................................................... 74
2.5.3 Using Refresh on Open Option ........................................................................ 76
2.6 Other Data Sources ............................................................................................................ 76
2.6.1 Excel as a Data Source ........................................................................................ 76
2.6.2 Free-Hand SQL as a Data Source ..................................................................... 79
2.6.3 Text Files as a Data Source ............................................................................... 83
2.6.4 Web Services as a Data Source ........................................................................ 84
2.6.5 Analysis Views as a Data Source ..................................................................... 87
2.7 Document Options ............................................................................................................. 89
2.8 Summary ................................................................................................................................. 92
3 Creating a Report in Web Intelligence 95
3.1 Adding Data to Report Elements ................................................................................. 96
3.1.1 Populating a Cross Table ................................................................................... 97
3.1.2 Populating a Chart ............................................................................................... 99
3.2 Sections and Breaks ........................................................................................................... 99
3.2.1 Setting a Section .................................................................................................. 100
3.2.2 Grouping Data with Breaks .............................................................................. 103
3.2.3 Adding Custom Groups ...................................................................................... 104
3.3 Outline Navigation ............................................................................................................. 105
3.3.1 Putting Outline into Action .............................................................................. 106
3.3.2 Folding at Different Levels ................................................................................ 108
9
Contents
3.4 Enhanced Sorting and Ranking ..................................................................................... 109
3.4.1 Sorting ...................................................................................................................... 110
3.4.2 Ranking .................................................................................................................... 116
3.5 Conditional Formatting .................................................................................................... 118
3.6 Headers, Footers, and Background Images ............................................................. 122
3.7 Summary ................................................................................................................................. 126
4 The Web Intelligence Report Panel 129
4.1 The Web Intelligence Reporting Interface ............................................................... 129
4.2 Reporting Toolbars .............................................................................................................. 132
4.2.1 Overview of the Function Tabs in Design Mode ........................................ 133
4.2.2 Report Property Tab: File .................................................................................... 134
4.2.3 Report Property Tab: Properties ...................................................................... 135
4.2.4 Report Element Tab ............................................................................................. 137
4.2.5 Format (or Formatting) Tab .............................................................................. 139
4.2.6 Data Access Tab .................................................................................................... 140
4.2.7 Analysis Tab ............................................................................................................ 141
4.2.8 Page Setup Tab ...................................................................................................... 142
4.3 The Side Panel ....................................................................................................................... 143
4.4 Report Panel ........................................................................................................................... 147
4.4.1 Working with Report Tabs ................................................................................. 147
4.4.2 Formula Bar ............................................................................................................ 148
4.4.3 Page Features ......................................................................................................... 149
4.4.4 Status Bar ................................................................................................................ 150
4.5 Report Property Categories ............................................................................................. 151
4.5.1 Report Elements .................................................................................................... 152
4.5.2 Relative Position and Object Alignment ....................................................... 153
4.5.3 Formatting .............................................................................................................. 155
4.5.4 Data Access ............................................................................................................. 156
4.5.5 Analysis .................................................................................................................... 157
4.5.6 Page Setup and Layouts ..................................................................................... 158
4.6 Summary ................................................................................................................................. 159

Contents
10
5 Displaying Data with Tables 161
5.1 Using Tables .......................................................................................................................... 164
5.1.1 Adding Report Elements While Designing Reports .................................. 165
5.1.2 Manage Table Properties ................................................................................... 167
5.1.3 Grouping ................................................................................................................. 171
5.1.4 Freeze Header Rows and Columns ................................................................. 178
5.2 Table Types ............................................................................................................................ 180
5.2.1 Horizontal Table ................................................................................................... 180
5.2.2 Vertical Table ......................................................................................................... 181
5.2.3 Cross Table ............................................................................................................. 181
5.2.4 Form Table .............................................................................................................. 182
5.3 Converting Table Formats and Types ......................................................................... 183
5.4 Blank Cells, Predefined Cells, and Comment Cells ............................................... 185
5.4.1 Blank Cells .............................................................................................................. 185
5.4.2 Predefined Cells .................................................................................................... 186
5.4.3 Comment Cells ..................................................................................................... 188
5.5 Summary ................................................................................................................................. 188
6 Displaying Data with Charts 191
6.1 Adding Charts to a Report ............................................................................................... 192
6.1.1 Converting Chart Types ..................................................................................... 195
6.1.2 Modifying an Existing Chart ............................................................................. 196
6.2 Chart Types ............................................................................................................................ 198
6.2.1 Column Charts ...................................................................................................... 198
6.2.2 Line Charts .............................................................................................................. 203
6.2.3 Pie Charts ................................................................................................................ 206
6.2.4 Bar Charts ............................................................................................................... 208
6.2.5 Point Charts ........................................................................................................... 209
6.2.6 Geographic Charts ............................................................................................... 213
6.2.7 Box Plots .................................................................................................................. 215
6.2.8 Radar Charts .......................................................................................................... 216
11
Contents
6.2.9 Map Charts ............................................................................................................. 217
6.2.10 Tag Cloud ................................................................................................................. 219
6.2.11 Waterfall .................................................................................................................. 219
6.2.12 Gauge ....................................................................................................................... 222
6.2.13 Tile ............................................................................................................................. 223
6.3 Chart Properties ................................................................................................................... 225
6.3.1 Customizing Charts ............................................................................................. 225
6.3.2 Useful Chart Properties ...................................................................................... 228
6.4 Zone Formatting .................................................................................................................. 229
6.5 Custom Elements ................................................................................................................. 230
6.5.1 Using a Custom Element ................................................................................... 231
6.5.2 Custom Element Properties .............................................................................. 233
6.6 Summary ................................................................................................................................. 234
7 Making an Impact with Charts 237
7.1 Properties That Enhance the Display of Data ......................................................... 238
7.1.1 Modifying Chart Properties ............................................................................... 239
7.1.2 Global Configurable Options ............................................................................ 239
7.1.3 Title Category Options ........................................................................................ 241
7.1.4 Legend Category Options .................................................................................. 242
7.1.5 Category Axis Options ........................................................................................ 242
7.1.6 Value Axis Options ............................................................................................... 243
7.1.7 Plot Area Options .................................................................................................. 244
7.2 Hierarchical Charting with Relational Data ............................................................. 244
7.3 Reports Functioning as Dashboards ............................................................................ 246
7.4 Formatting Tips .................................................................................................................... 248
7.4.1 Measure Formatting ............................................................................................ 248
7.4.2 Region Color and Value Axis Stacking ........................................................... 249
7.5 Custom Color Enhancements ......................................................................................... 252
7.6 Summary ................................................................................................................................. 258

Contents
12
8 Report Properties, Tools, and Formatting 259
8.1 Formatting Report Properties ....................................................................................... 259
8.2 Document Summary .......................................................................................................... 261
8.3 Navigation (Report) Map ................................................................................................. 265
8.4 Input Controls ....................................................................................................................... 266
8.4.1 Document Input Controls ................................................................................. 270
8.4.2 Grouping Input Controls: Cascading Filters ................................................ 271
8.5 Web Services Publisher .................................................................................................... 274
8.6 Available Objects (Design Mode Only) ...................................................................... 277
8.7 Document Structures and Filters ................................................................................. 279
8.8 Data ........................................................................................................................................... 280
8.9 Style Sheet Modification ................................................................................................. 282
8.10 High Precision Numbers ................................................................................................... 287
8.11 Geolocalizing a Dimension ............................................................................................. 288
8.11.1 Geolocalize by Name .......................................................................................... 288
8.11.2 Geolocalize by Latitude and Longitude ........................................................ 293
8.12 Summary ................................................................................................................................. 295
9 Filtering Data in the Query Panel and Report Panel 297
9.1 Filtering in the Query Panel ............................................................................................ 298
9.1.1 Predefined Filters ................................................................................................. 298
9.1.2 User-Defined Filters ............................................................................................ 301
9.1.3 Filtering with Wild Cards ................................................................................... 304
9.1.4 Nested Query Filters ............................................................................................ 305
9.1.5 Value(s) from List ................................................................................................. 308
9.1.6 Prompted Filters ................................................................................................... 308
9.2 Complex Filtering Options .............................................................................................. 310
9.2.1 Database Ranking ................................................................................................ 310
13
Contents
9.2.2 Subqueries .............................................................................................................. 313
9.2.3 Dynamic Default Value for UNX Prompts .................................................... 314
9.2.4 Filtering through BI Sets ..................................................................................... 317
9.3 Filtering in the Report Panel ........................................................................................... 323
9.3.1 Simple Filtering with the Filter Bar ................................................................. 324
9.3.2 Report Element Filters ........................................................................................ 325
9.3.3 Filtering with Input Controls ............................................................................ 327
9.3.4 Input Control Groups .......................................................................................... 339
9.4 Conditionally Hiding Report Elements ...................................................................... 342
9.5 Element Linking .................................................................................................................... 344
9.5.1 Adding Element Linking ..................................................................................... 344
9.5.2 The Impact of Element Linking ........................................................................ 346
9.6 Summary ................................................................................................................................. 350
10 Scope of Analysis and Drill Functionality 351
10.1 Setting the Scope of Analysis in the Query Panel ................................................. 352
10.2 Drill-Down Setup in the Report Panel ........................................................................ 359
10.3 Drilling on Tables ................................................................................................................. 360
10.3.1 Drilling on Dimensions ....................................................................................... 361
10.3.2 Drilling on Measures ........................................................................................... 365
10.4 Drilling on Charts ................................................................................................................. 366
10.4.1 Dimensions on Chart Axis ................................................................................. 366
10.4.2 Dimensions on Legends ..................................................................................... 368
10.4.3 Measures on Chart Bars and Markers ........................................................... 368
10.5 Taking a Snapshot ............................................................................................................... 370
10.6 Drill Options ........................................................................................................................... 371
10.6.1 Document Settings for Drill Functionality ................................................... 371
10.6.2 User Settings for Drill Functionality ............................................................... 373
10.7 Summary ................................................................................................................................. 374

Contents
14
11 Using Formulas and Variables 375
11.1 Formulas and Variables .................................................................................................... 376
11.1.1 Converting In-Place Objects into Formulas ................................................. 376
11.1.2 Exploring the Formula Editor ........................................................................... 378
11.1.3 Creating Variables ............................................................................................... 381
11.2 Custom Grouping ................................................................................................................ 383
11.3 Reporting Functions and Operators ........................................................................... 386
11.3.1 Newest Functions ................................................................................................ 387
11.3.2 Aggregate Functions ........................................................................................... 388
11.3.3 Character Functions ............................................................................................ 390
11.3.4 Date and Time Functions .................................................................................. 391
11.3.5 Document Functions .......................................................................................... 392
11.3.6 Data Provider Functions .................................................................................... 393
11.3.7 Miscellaneous Functions ................................................................................... 395
11.3.8 Logical Functions .................................................................................................. 397
11.3.9 Numeric Functions .............................................................................................. 397
11.3.10 Set Functions ......................................................................................................... 399
11.3.11 Operators ................................................................................................................ 400
11.4 Formula Syntax .................................................................................................................... 404
11.4.1 Primary Formula Syntax Rules ......................................................................... 404
11.4.2 If/Then/Else Syntax ............................................................................................. 405
11.4.3 Saving a Variable .................................................................................................. 406
11.4.4 Modifying a Variable ........................................................................................... 406
11.5 Input, Output, and Calculation Contexts ................................................................. 407
11.5.1 Aggregates in Context Formulas .................................................................... 409
11.5.2 Report Structure Operator and Keyword Combinations ........................ 412
11.5.3 Context Operators ............................................................................................... 412
11.6 References .............................................................................................................................. 414
11.6.1 Creating a Reference ........................................................................................... 415
11.6.2 Using a Reference ................................................................................................ 416
11.6.3 Reference Error Code .......................................................................................... 417
11.7 Summary ................................................................................................................................. 417
15
Contents
12 Advanced Query Panel Functionalities 419
12.1 Cascading and Optional Prompts ................................................................................. 420
12.1.1 Defining a Cascading List of Values in the Universe Design Tool ........ 420
12.1.2 Using a Cascading List of Values as a Prompted Filter ............................ 421
12.1.3 Refreshing a Report with a Prompted List of Values ................................ 423
12.1.4 Optional Prompts ................................................................................................. 424
12.2 Saving Prompts Answers in BI Variants ..................................................................... 424
12.2.1 Creating a BI Variant ........................................................................................... 425
12.2.2 Using BI Variants .................................................................................................. 426
12.2.3 Managing BI Variants .......................................................................................... 427
12.3 Querying Multidimensional Data Sources ............................................................... 427
12.3.1 Multidimensional Metadata ............................................................................ 428
12.3.2 Member Selector .................................................................................................. 430
12.3.3 Member Selector: Members Tab ..................................................................... 432
12.3.4 Member Selector: Metadata Tab .................................................................... 436
12.3.5 Member Selector: Prompt Tab ......................................................................... 437
12.3.6 Member Selector: Summary Pane .................................................................. 438
12.3.7 Displaying Hierarchies ........................................................................................ 439
12.4 Editing Auto-Generated SQL Scripts ........................................................................... 440
12.5 Support of Query Stripping ............................................................................................. 442
12.6 Partial Results, Purged Data, and Cancelled Queries .......................................... 444
12.6.1 Retrieving Partial Results ................................................................................... 444
12.6.2 Purging Data .......................................................................................................... 446
12.6.3 Cancelling a Query ............................................................................................... 446
12.7 Summary ................................................................................................................................. 447
13 Access to SAP BW and SAP HANA 449
13.1 SAP BW and SAP HANA Access Overview ................................................................. 449
13.1.1 SAP HANA and SAP BW ....................................................................................... 449
13.1.2 SAP HANA as a Platform ..................................................................................... 451
Contents
16
13.2 SAP BEx Query through Direct Access ........................................................................ 452
13.2.1 Creating a Document in SAP BEx Direct Access ......................................... 453
13.2.2 Answering SAP BEx Query Variables ............................................................. 456
13.3 SAP BEx Query through Multidimensional Universe .......................................... 459
13.3.1 Multidimensional Universe .............................................................................. 460
13.3.2 Creating a Document from Multidimensional Universes ...................... 460
13.3.3 Answering SAP BEx Query Variables ............................................................. 462
13.4 SAP BW through Relational Universe ........................................................................ 462
13.4.1 Relational Universe in the Information Design Tool (UNX) ................... 463
13.4.2 Relational Universe in the Universe Design Tool (UNV) ......................... 463
13.4.3 Creating a Document from a Relational Universe .................................... 464
13.5 SAP HANA Direct Access ................................................................................................... 464
13.5.1 Creating a Document in SAP HANA Direct Access .................................... 465
13.5.2 Answering SAP HANA Input Parameters and Variables ......................... 468
13.6 SAP HANA Online Mode ................................................................................................... 471
13.6.1 Creating a Document in Online Mode .......................................................... 472
13.6.2 Answering SAP HANA Variables and Input Parameters ......................... 474
13.6.3 Partial Result .......................................................................................................... 475
13.6.4 Switching to SAP HANA Direct Access .......................................................... 476
13.7 SAP HANA View through Relational Universe ....................................................... 477
13.7.1 Relational Universe ............................................................................................. 477
13.7.2 Answering SAP HANA Variables ...................................................................... 478
13.8 SAP HANA through Free-Hand SQL ............................................................................. 479
13.9 Summary ................................................................................................................................. 479
14 Using Multiple Queries and Data Sources 481
14.1 Setting Up a Combined Query ....................................................................................... 481
14.1.1 Union ........................................................................................................................ 482
14.1.2 Intersection ............................................................................................................ 483
14.1.3 Minus ....................................................................................................................... 484
14.1.4 Remove a Combined Query .............................................................................. 484
17
Contents
14.2 Adding a New Query .......................................................................................................... 484
14.2.1 Adding Queries and New Data Providers ..................................................... 484
14.2.2 Including New Result Data ................................................................................ 488
14.2.3 Options to Display Available Objects ............................................................. 488
14.2.4 Adding New Data Source in SAP HANA Online Mode .............................. 490
14.3 Managing Queries ............................................................................................................... 491
14.4 Running Multiple Queries ................................................................................................ 492
14.4.1 Refreshing Documents Containing Multiple Queries .............................. 492
14.4.2 Prompts .................................................................................................................... 493
14.4.3 Multiple Queries Parallel Refresh .................................................................... 494
14.5 Merging Dimensions .......................................................................................................... 494
14.5.1 Creating a Merged Dimension ......................................................................... 495
14.5.2 Merging Geo-Localized Dimensions .............................................................. 500
14.5.3 Additional Options for Merged Dimensions ............................................... 501
14.5.4 Modifying Merged Dimensions ....................................................................... 504
14.6 Merging Variables ............................................................................................................... 506
14.6.1 How to Merge Variables ..................................................................................... 506
14.6.2 Merging Geo-Localized Variable ...................................................................... 507
14.7 Changing Source .................................................................................................................. 507
14.7.1 Change Source Strategies .................................................................................. 508
14.7.2 Change Source Workflow .................................................................................. 509
14.7.3 Bulk Change Source ............................................................................................. 513
14.7.4 Change Source Excel, Text, and Free-Hand SQL ......................................... 514
14.8 Summary ................................................................................................................................. 515
15 Adding Hyperlinks in Web Intelligence Documents 517
15.1 Linking to Document with the HTML Client ............................................................ 518
15.1.1 Adding a Hyperlink to a Web Intelligence Document .............................. 518
15.1.2 Setting Hyperlink Properties ............................................................................. 521
15.1.3 Adding a Hyperlink to Prompted Documents ............................................. 524

Contents
18
15.2 Linking to the Web Page URL ......................................................................................... 527
15.2.1 Adding Hyperlinks to Web Pages .................................................................... 527
15.2.2 Adding a Hyperlink to a Web Intelligence Document
Using Its URL .......................................................................................................... 531
15.2.3 Getting Document OpenDocument URL ..................................................... 534
15.2.4 Adding Hyperlinks to the SAP BusinessObjects Dashboard .................. 535
15.3 OpenDocument Syntax .................................................................................................... 536
15.3.1 Document Identifier Parameters .................................................................... 536
15.3.2 Input Parameters ................................................................................................. 537
15.3.3 Output Parameters .............................................................................................. 538
15.4 Summary ................................................................................................................................. 540
16 Working in the BI Launch Pad 541
16.1 Navigating in BI Launch Pad .......................................................................................... 541
16.1.1 Header Panel ......................................................................................................... 542
16.1.2 List Panel ................................................................................................................. 549
16.1.3 Tabs .......................................................................................................................... 550
16.2 Setting BI Launch Pad Preferences .............................................................................. 550
16.2.1 General Preferences ............................................................................................ 550
16.2.2 Locales and Time Zone Preferences ............................................................... 552
16.2.3 Changing Your Password .................................................................................. 553
16.3 Organizing in Folders and Categories ........................................................................ 553
16.3.1 Folders ..................................................................................................................... 554
16.3.2 Categories ............................................................................................................... 554
16.3.3 Organizing Objects .............................................................................................. 555
16.4 Deleting Documents and the Recycle Bin ................................................................ 557
16.5 Viewing, Printing, and Saving Objects in BI Launch Pad ................................... 558
16.5.1 Web Intelligence Viewer Toolbar ................................................................... 559
16.5.2 Additional Menu Options .................................................................................. 561
16.6 Summary ................................................................................................................................. 561
19
Contents
17 Using Web Intelligence with SAP BusinessObjects BI Workspaces 563
17.1 Introducing BI Workspaces ............................................................................................. 563
17.1.1 BI Workspaces Toolbar ........................................................................................ 564
17.1.2 BI Workspaces Module Library ......................................................................... 567
17.1.3 Setting BI Workspaces Preferences in the BI Launch Pad ....................... 571
17.1.4 Setting Web Intelligence Preferences in the BI Launch Pad ................... 572
17.2 Working with Modules ..................................................................................................... 572
17.2.1 Text Modules ......................................................................................................... 572
17.2.2 Compound Modules ............................................................................................ 574
17.3 Working with Web Intelligence Report Parts ......................................................... 574
17.4 Using a BI Workspace as the Default Home Tab ................................................... 581
17.5 Printing BI Workspaces ..................................................................................................... 583
17.6 Content Linking .................................................................................................................... 584
17.7 Summary ................................................................................................................................. 589
18 Interaction from a User’s Perspective 591
18.1 Creating Shortcuts and Hyperlinks .............................................................................. 591
18.1.1 Shortcuts ................................................................................................................. 591
18.1.2 Hyperlinks ............................................................................................................... 592
18.2 Searching within the BI Launch Pad ............................................................................ 593
18.2.1 Running the Search .............................................................................................. 593
18.2.2 Searchable Object Types .................................................................................... 596
18.2.3 Search Techniques ............................................................................................... 597
18.3 Sorting and Filtering Content ........................................................................................ 598
18.4 Creating Discussions .......................................................................................................... 600
18.4.1 Notes ......................................................................................................................... 600
18.4.2 Discussion Threads .............................................................................................. 601
18.5 Commenting Documents ................................................................................................. 601
18.5.1 Adding Comments ............................................................................................... 603

Contents
20
18.5.2 Managing Comments ......................................................................................... 605
18.5.3 Comments Function ........................................................................................... 605
18.6 Tracking Data Changes ..................................................................................................... 607
18.6.1 Setting Reference Data ...................................................................................... 608
18.6.2 Formatting Changed Data ................................................................................ 610
18.6.3 Displaying Tracked Data .................................................................................... 614
18.6.4 Advanced Tracking Techniques ....................................................................... 614
18.7 Summary ................................................................................................................................. 615
19 Sharing Web Intelligence Content 617
19.1 Sharing Document Content through Shared Elements ..................................... 617
19.1.1 Creating Shared Elements ................................................................................ 618
19.1.2 Using Shared Elements in Web Intelligence Documents ....................... 620
19.1.3 Identifying Document Shared Elements ...................................................... 621
19.1.4 Updating and Unlinking Shared Elements .................................................. 621
19.1.5 Managing Shared Elements ............................................................................. 624
19.2 Using the Send Feature in BI Launch Pad ................................................................. 626
19.2.1 BI Platform Inbox ................................................................................................. 626
19.2.2 Email ......................................................................................................................... 628
19.2.3 FTP Location ........................................................................................................... 629
19.2.4 File Location ........................................................................................................... 630
19.2.5 Using Placeholders .............................................................................................. 631
19.3 Exporting a Web Intelligence Report ......................................................................... 632
19.3.1 Exporting Document Data or Query Data ................................................... 633
19.3.2 Exporting in Web Intelligence Applet or Rich Client ................................ 634
19.3.3 Exporting in Web Intelligence HTML ............................................................. 635
19.4 Scheduling a Web Intelligence Report ...................................................................... 636
19.4.1 Scheduling in BI Launch Pad ............................................................................. 637
19.4.2 Viewing Latest Instance ..................................................................................... 642
19.4.3 Viewing History .................................................................................................... 642
19.5 Summary ................................................................................................................................. 643
21
Contents
20 Report Scheduling and Distribution with Publications 645
20.1 Publication Roles ................................................................................................................. 646
20.1.1 The SAP BusinessObjects Administrator ...................................................... 647
20.1.2 The Web Intelligence Report Designer .......................................................... 647
20.1.3 The Publication Designer ................................................................................... 648
20.1.4 The Publication Recipient .................................................................................. 648
20.2 Creating a Publication ....................................................................................................... 648
20.2.1 Naming the Publication ..................................................................................... 649
20.2.2 Choosing the Source Documents .................................................................... 649
20.2.3 Choosing Enterprise Recipients ....................................................................... 651
20.2.4 Choosing Dynamic Recipients .......................................................................... 653
20.2.5 Setting Publication Properties ......................................................................... 655
20.2.6 Testing the Publication ....................................................................................... 660
20.3 Mobile Publications ............................................................................................................ 661
20.4 Summary ................................................................................................................................. 662
21 Web Intelligence Rich Client 665
21.1 How Web Intelligence Rich Client Is Different ....................................................... 665
21.1.1 Working in Offline Mode ................................................................................... 668
21.1.2 Working in Connected Mode ............................................................................ 669
21.1.3 Working in Standalone Mode .......................................................................... 669
21.2 Data Provider Options ....................................................................................................... 670
21.2.1 Import a Universe from the Repository ........................................................ 671
21.2.2 Query Panel in Web Intelligence Rich Client ............................................... 672
21.3 Working with Web Intelligence Reports ................................................................... 672
21.3.1 Opening Documents from the Repository ................................................... 672
21.3.2 Saving Reports Locally ......................................................................................... 673
21.3.3 Exporting Reports to Repository ...................................................................... 676
21.3.4 Printing from Web Intelligence Rich Client ................................................. 677
21.3.5 Sending Reports as Email Attachments ........................................................ 678

Contents
22
21.4 Setting Preferences in Web Intelligence Rich Client ........................................... 679
21.5 Summary ................................................................................................................................. 680
22 Web Intelligence Interactive Viewer 681
22.1 New BI Launch Pad and Web Intelligence Interactive Viewer Overview ... 681
22.2 Navigating in the New BI Launch Pad ........................................................................ 682
22.2.1 BI Launch Pad Interface ...................................................................................... 683
22.2.2 Document Contextual Menu ........................................................................... 684
22.3 Viewing a Document ......................................................................................................... 685
22.3.1 Web Intelligence Interactive Viewer Interface .......................................... 686
22.3.2 The Fading Toolbar .............................................................................................. 687
22.3.3 Navigating in a Document ................................................................................ 688
22.3.4 Expanding and Collapsing Hierarchies ......................................................... 689
22.3.5 Comments .............................................................................................................. 689
22.3.6 Listing Document Properties ............................................................................ 690
22.4 Refreshing a Document .................................................................................................... 690
22.4.1 Prompts ................................................................................................................... 690
22.4.2 BI Variants .............................................................................................................. 692
22.5 Filtering a Report ................................................................................................................. 693
22.5.1 Listing Prompts Values ....................................................................................... 693
22.5.2 Document and Report Input Controls .......................................................... 694
22.5.3 Drill Filters .............................................................................................................. 695
22.5.4 Element Linking .................................................................................................... 696
22.6 Sorting or Ranking Data in a Report ........................................................................... 697
22.7 Scheduling a Document ................................................................................................... 700
22.8 Saving and Exporting to XLS and to PDF .................................................................. 703
22.9 Setting Web Intelligence Preferences ........................................................................ 703
22.10 Logging Out ........................................................................................................................... 704
22.11 Summary ................................................................................................................................. 704
23
Contents
23 Connecting SAP BusinessObjects Live Office to Web Intelligence and Universes 705
23.1 Introduction to SAP BusinessObjects Live Office .................................................. 705
23.1.1 Integration with Web Intelligence Documents ......................................... 706
23.1.2 Live Office Ribbon Menu .................................................................................... 707
23.1.3 Accessing the Live Office Insert Wizard ........................................................ 709
23.2 Creating Queries from Universes ................................................................................. 709
23.2.1 Selecting the Universe ........................................................................................ 710
23.2.2 Creating the Query ............................................................................................... 711
23.2.3 Running the Query ............................................................................................... 712
23.2.4 Displaying the Summary .................................................................................... 713
23.3 Retrieving Web Intelligence Content ......................................................................... 713
23.3.1 Selecting the Web Intelligence Document .................................................. 713
23.3.2 Selecting Document Content ........................................................................... 714
23.3.3 Displaying the Summary .................................................................................... 717
23.4 Editing Added Content ...................................................................................................... 718
23.5 Setting Preferences ............................................................................................................. 719
23.5.1 Application Options ............................................................................................. 719
23.5.2 Data Refresh Options .......................................................................................... 723
23.5.3 Object Properties .................................................................................................. 724
23.6 Summary ................................................................................................................................. 725
24 Mobile Business Intelligence 727
24.1 Introducing SAP BusinessObjects Mobile ................................................................. 727
24.2 Designing Reports for Mobile Viewing ...................................................................... 728
24.2.1 Mobile Categories ................................................................................................ 731
24.2.2 Mobile versus MobileDesigned ....................................................................... 733
24.3 Mobile-Only Analytic Types ............................................................................................ 742
24.3.1 Query and Formula Design ................................................................................ 742
24.3.2 Creating Sparklines .............................................................................................. 745
24.3.3 Creating Bullet Graphs ....................................................................................... 748

Contents
24
24.3.4 Creating Micro Bar Charts ................................................................................. 750
24.3.5 Creating Scorecards ............................................................................................ 751
24.4 Report Linking ...................................................................................................................... 754
24.5 Input Controls ....................................................................................................................... 756
24.6 Mobile Thumbnails ............................................................................................................ 758
24.7 Summary ................................................................................................................................. 759
Appendices 761
A Converting Desktop Intelligence Reports to Web Intelligence
Documents ............................................................................................................................. 763
B Web Intelligence Security Rights ................................................................................. 777
C The Authors ........................................................................................................................... 797
Index ........................................................................................................................................................ 801

801
Index
3D look ............................................................. 228, 238
A
ABAP ........................................................................... 451
ABAP for Eclipse ..................................................... 451
Access level .............................................................. 777
Administrator ......................................................... 647
Adobe Acrobat ........................................................ 655
Alert ............................................................................ 683
Alerter ........................................................................ 118
Align ............................................................................ 238
All values ................................................................... 332
Allow External Access to the Query ............... 452
Analysis ....................................................................... 28
dimension ............................................................ 428
view .......................................................................... 48
views, data source .............................................. 87
workspaces ............................................................ 87
AND/OR operations ............................................... 66
Android ...................................................................... 727
ANSI SQL ..................................................................... 80
Applet viewer ............................................................ 32
Java Runtime Environment ............................ 34
Application options .............................................. 708
Arranged by alphabetic order .......................... 473
Arranged by data source .................................... 473
Arranged by navigation paths ......................... 473
Ascending or descending chart ....................... 113
Assign data ..................................................... 244, 248
ASUG ........................................................................... 769
Attribute ...................................................................... 53
Authentication mode ...................... 669, 709, 722
Auto-merge dimensions ...................................... 91
Available objects tab ............................................ 277
B
Background Image ................................................ 122
add .......................................................................... 124
color ....................................................................... 168
pattern ........................................................ 124, 168
Bar charts
horizontal grouped ......................................... 198
vertical bar and line ........................................ 199
vertical grouped ............................................... 198
Bar display effects ........................................ 228, 240
BI Inbox ................................................. 626, 628, 655
BI Launch Pad ....... 31, 32, 45, 149, 541, 651, 681
additional menu options .............................. 561
application icons ................................................. 46
categories ................................................... 548, 554
details ................................................................... 549
document link ................................................... 548
documents tab .................................................. 544
documents toolbar .......................................... 546
folders ................................................................... 554
general preferences ......................................... 550
header panel ...................................................... 542
header panel menus ....................................... 543
history ................................................................... 548
locales and time zone preferences ............ 552
modify .................................................................. 548
modules ...................................................... 567, 568
more actions menu ......................................... 548
navigation .......................................................... 541
new menu ............................................................ 547
objects .......................................................... 558, 598
organize menu .................................................. 547
organizing objects ........................................... 555
page navigation ............................................... 549
preference options ........................................... 551
preferences .......................................................... 550
refresh ................................................................... 549
schedule ............................................................... 548
scheduling ........................................................... 637
searching ............................................................. 593
send ....................................................................... 626
send menu ........................................................... 547
setting preferences .......................................... 572
start page ............................................................ 550
tables ..................................................................... 729
tabs ........................................................................ 550
toolbar ......................................................... 541, 592

Index
802
BI Launch Pad (Cont.)
view menu ........................................................... 546
BI set ........................................................................... 317
static ...................................................................... 317
temporal .............................................................. 317
BI variant ........................................................ 424, 692
BI workspaces ......................................................... 563
Module Library ........................................ 564, 570
toolbar .................................................................. 564
BIAR ............................................................................ 795
BICS ............................................................................. 450
Blank cells ................................................................. 185
Block comment ...................................................... 602
Block heading ......................................................... 103
Break properties .................................................... 103
Breaks .................................................................. 99, 103
Bulk Change Source ............................................. 513
Bullet graph ............................................................. 748
design .................................................................... 748
Business layer, View ................................... 460, 463
Business security profile .................................... 463
C
Calculated measure .............................................. 429
Calculated member .................................... 429, 436
Calculation context .............................................. 407
Calendar .................................................................... 701
Cancel ......................................................................... 378
Cancel query ......................................... 446, 471, 476
Cascading input control ..................................... 339
Categories
moving .................................................................. 555
new ......................................................................... 555
organizing ........................................................... 553
Category ....................................... 619, 682, 685, 714
Category axis ................................................ 227, 242
CDS view ................................................................... 451
Cell ............................................................................... 717
Cell comment ......................................................... 602
Central Management Console
(CMC) .................................................. 441, 646, 647
Change default style ............................................ 283
Change source ..................................... 451, 471, 507
Change source strategies ................................... 508
closest object name ......................................... 509
Change source strategies (Cont.)
remove the object ............................................. 509
same object ID ................................................... 508
same object path .............................................. 509
same object technical name ........................ 509
Changed data .......................................................... 612
Charts .............................................. 99, 191, 237, 717
angular gauge .................................................... 223
area chart ............................................................ 205
bar chart ..................................................... 138, 208
box plot chart ..................................................... 215
bubble chart ........................................................ 211
business reports ................................................ 208
chloropleth .......................................................... 214
column chart ............................................ 198, 202
converting ........................................................... 195
donut chart ......................................................... 206
donut chart 2D ................................................... 206
dual value axes .................................................. 201
filter ........................................................................ 327
format ................................................................... 225
geo bubble ........................................................... 214
geo pie ................................................................... 215
geographical ....................................................... 288
globally stacked chart .................................... 250
heat map chart .................................................. 218
hierarchical charting ...................................... 244
line chart .............................................................. 138
line charts ............................................................ 203
linear gauge ........................................................ 222
multigroup charting ....................................... 115
pie chart ...................................................... 138, 206
pie chart 2D ......................................................... 206
pie chart 3D ......................................................... 207
point chart ........................................................... 209
polar chart ........................................................... 212
properties ......................................... 225, 238, 239
radar chart ................................................ 138, 216
scatter chart ........................................................ 210
speedometer ....................................................... 222
stacking ...................................................... 201, 250
tile ........................................................................... 224
tree map chart ................................................... 217
types ....................................................................... 198
view results ............................................................ 99
zones ...................................................................... 230
803
Index
Class .............................................................................. 53
Classic desktop reporting tool ......................... 763
Clear filter ................................................................. 600
Client-server mode ............................................... 669
CMC ............................. 231, 450, 494, 600, 601, 777
CMS security ............................................................ 669
Collaboration .......................................................... 591
Collapse ..................................................................... 689
Color palette ............................................................ 252
Column ...................................................................... 718
Column layout ........................................................ 566
Combined query .................................................... 481
query union ......................................................... 482
remove .................................................................. 484
Comment ....................................... 92, 601, 605, 689
Comment cells ........................................................ 188
Compound module .............................................. 572
Conditional formatting ..................... 95, 118, 247
rules ........................................................................ 121
settings .................................................................. 119
Conditions .................................................................. 61
AND/OR operations ........................................... 62
case statement ..................................................... 62
in list segment ...................................................... 62
segments ................................................................ 62
Confidential ............................................................. 731
Connected mode ................................................... 669
Connection, server ................................................ 669
Content linking ...................................................... 584
Context ....................................................... 56, 70, 714
Conversion ..................................................... 763, 766
checklist ................................................................ 764
single-pass report conversion ............ 766, 767
staged report conversion ..................... 766, 767
Copying objects ...................................................... 556
Create variable ........................................................ 377
CSS ............................................................................... 282
file ........................................................................... 285
CSV .................................................................... 632, 666
export .................................................................... 633
save as ................................................................... 676
Current members .................................................. 320
Cursor ......................................................................... 716
Custom BI workspace .......................................... 581
Custom color enhancements ........................... 252
Custom colors
CMYK .................................................................... 257
HSL ......................................................................... 256
HSV ........................................................................ 255
RGB ........................................................................ 257
swatches .............................................................. 255
Custom element .................................................... 230
Custom group ............................................... 104, 471
Custom sort
dialog box ........................................................... 112
remove .................................................................. 113
temporary values ............................................. 112
D
Dashboards ............................................................. 246
Dashports ................................................................. 239
Data analysis ........................................................... 248
Data definition language ...................................... 80
Data display ............................................................ 238
Data format ................................................................ 39
Data label displaying mode .............................. 239
Data mode ...................................................... 146, 260
Data preview ....................................................... 52, 57
filter .......................................................................... 57
Data provider ......................................................... 670
custom .................................................................. 671
new ......................................................................... 484
options ................................................................. 670
Data security profile ............................................ 463
Data source
analysis views ....................................................... 87
Excel ......................................................................... 76
free-hand SQL ....................................................... 79
text files .................................................................. 83
universes ................................................................. 51
web services ........................................................... 84
Data synchronization ......................................... 495
automatically synchronized ....................... 502
extend merged dimension values ............. 502
ForceMerge() formula .................................... 503
Data tab .............................................................. 97, 280
Data tracking .......................................................... 607
advanced techniques ...................................... 614
breaks ................................................................... 613
charts .................................................................... 613

Index
804
Data tracking (Cont.)
decreased data .................................................. 607
display ................................................................... 614
display data in blocks ..................................... 611
incompatible ...................................................... 608
Increased data ................................................... 607
inserted data ...................................................... 607
merged dimensions ......................................... 614
modified data .................................................... 607
options .................................................................. 610
reference data .................................................... 607
removed data ..................................................... 607
sections ................................................................. 613
Data type ........................................................ 495, 496
Data values, assigning ......................................... 194
Database ranking .................................................. 310
adding ................................................................... 311
enabling ............................................................... 312
parameters .......................................................... 312
Default enterprise location ............................... 655
Deleting objects ..................................................... 556
Design mode ................................................. 145, 260
toolbar .................................................................. 132
Design time ................................................... 456, 468
Desktop Intelligence .................................. 645, 763
Desktop Intelligence Compatibility
Pack .............................................................. 661, 774
Destination .............................................................. 702
Detail ............................................................................ 53
Dimensions ............................................................... 53
Discussions .............................................................. 600
delete ..................................................................... 600
drawer ................................................................... 600
notes ...................................................................... 600
post ........................................................................ 601
threads .................................................................. 601
Display
data ........................................................................ 191
effects .................................................................... 228
types ...................................................................... 125
Document
comment .............................................................. 602
Explorer ...................................................... 567, 571
locale ..................................................................... 703
pane ....................................................................... 148
properties ............................................................ 197
Document (Cont.)
summary ........................................................89, 261
viewing .................................................................. 552
Document prompt
build formula ..................................................... 525
dynamically passing values to filter ......... 524
enter a constant ................................................ 525
prompt user ........................................................ 525
select object ......................................................... 525
Document Structures and Filters tab ............ 279
Drill ...................................... 141, 202, 246, 351, 695
bars and markers .............................................. 368
chart axis ............................................................. 366
charts ..................................................................... 366
dimensions .......................................................... 361
drill by ......................................................... 362, 368
drill down settings ............................................ 373
drill down setup ................................................ 359
drill up ................................................................... 362
enabling ................................................................ 359
end user ................................................................ 359
filter .......................................................... 29, 40, 695
legends .................................................................. 368
measure ................................................................ 369
measures .............................................................. 365
options .................................................................. 373
prompts ................................................................ 373
session ..................................................................... 41
setup ...................................................................... 359
snapshot ............................................................... 370
start session ........................................................ 374
synchronize ......................................................... 373
toolbar .................................................................. 374
Drill options
preferences ............................................................ 40
Web Intelligence preferences ......................... 40
DSAG ........................................................................... 769
Dynamic recipient ................................................ 653
E
Element link filters ................................................. 31
Element linking .................................. 246, 344, 696
Email ................................................................. 628, 655
report attachments .......................................... 678
805
Index
Enterprise recipient .............................................. 651
personalization ................................................. 652
Event ........................................................................... 702
custom .................................................................. 658
file ........................................................................... 658
schedule ................................................................ 658
Excel ..................... 48, 539, 632, 646, 666, 703, 705
export .......................................................... 231, 633
plug-in ................................................................... 705
save as ................................................................... 675
Excel 2007, save as ................................................ 675
Expand ....................................................................... 689
Export report, HTML ............................................ 763
Export, style ............................................................. 283
F
Facets .......................................................................... 595
Fading Toolbar ........................................................ 687
Favorite ...................................................................... 685
File system ............................................................... 655
File Transfer Protocol (FTP) ..................... 629, 655
Filter ................................................. 53, 304, 598, 693
add .......................................................................... 326
assignment type ................................................ 302
bar ........................................................................... 324
block ....................................................................... 325
complex ................................................................ 310
content .................................................................. 598
custom filter .......................................................... 62
data ........................................................................ 297
description ........................................................... 300
group filter ............................................................ 67
input control ....................................................... 327
object ..................................................................... 299
objects ................................................................... 711
operators .............................................................. 301
predefined ..................................................... 61, 298
quick filter .............................................................. 65
remove objects ................................................... 303
report panel ........................................................ 323
simple .................................................................... 324
types ....................................................................... 298
user-defined ........................................................ 301
Folders ................................................................. 53, 714
moving .................................................................. 555
Folders (Cont.)
new ......................................................................... 555
organizing ........................................................... 553
universe ................................................................... 53
Footer ........................................................................ 122
add ......................................................................... 123
Format .............................................................. 619, 701
Format number ..................................................... 248
Formatting
changed data ..................................................... 610
functional sections .......................................... 285
measure ............................................................... 248
report properties .............................................. 259
sections ................................................................ 102
tips ......................................................................... 248
toolbar .................................................................. 132
Formula .................................................................... 163
bar .......................................................................... 148
context formula ................................................ 409
create .................................................................... 376
definition ............................................................. 376
editor ..................................................................... 378
editor functions ................................................ 379
syntax ................................................................... 404
text cell ................................................................. 137
toolbar .................................................................. 375
variables .............................................................. 375
Freeform layout .................................................... 567
Free-hand SQL ............ 48, 79, 450, 451, 479, 508,
778, 784
Freeze
columns ............................................................... 179
enabling freeze .................................................. 178
header rows ........................................................ 179
headers ................................................................. 178
FTP, location ........................................................... 629
Functions ................................................................. 378
aggregate ................................................... 380, 388
categories ............................................................ 386
character .................................................... 380, 390
data provider ............................................ 380, 393
date and time ........................................... 380, 391
document ................................................... 380, 392
logical .......................................................... 380, 397
miscellaneous ........................................... 380, 395

Index
806
Functions (Cont.)
numeric ...................................................... 380, 397
set ............................................................................ 399
G
General settings ....................................................... 37
Geo map .................................................................... 471
Geolocalization ...................................................... 288
by latitude and longitude ............................. 293
by name ................................................................ 288
Global configurable options ............................. 239
Global property category ................................... 227
Grid and background ........................................... 228
Group Input Control ............................................ 694
Group List ................................................................. 627
Grouping .................................................................. 171
custom .................................................................. 173
custom values .................................................... 177
data ........................................................................ 103
options .................................................................. 174
H
Header ....................................................................... 122
add .......................................................................... 123
panel ...................................................................... 542
Help ............................................................................ 708
Hide ............................................................................ 246
Hide Changes/Show Changes button ........... 614
Hierarchical navigation data ............................ 439
Hierarchy ............................................... 429, 436, 689
High Precision Numbers .................................... 287
History ....................................................................... 703
Horizontal table
layout properties .............................................. 170
HTML ................................................................ 231, 539
saving ...................................................................... 74
HTML client � Web Intelligence HTML
Hyperlink ........................... 517, 530, 591, 592, 628
adding ................................................................... 518
complete URL Path .......................................... 522
link to document instance ............................ 522
options .................................................................. 607
prompted reports ............................................. 524
properties .................................................. 521, 524
Hyperlink (Cont.)
refresh on open .................................................. 522
target area within the document ............... 522
I
iDocID ........................................................................ 536
If-Then-Else syntax ............................................... 405
Import style ............................................................. 283
Inbox ................................................................ 682, 685
Information Design Tool ........ 53, 314, 317, 420,
443, 462, 477, 479, 494, 706, 709
InfoView .................................................................... 541
Input control .............................. 247, 266, 694, 756
assign dependency ........................................... 337
edit or remove .................................................... 338
group ..................................................................... 339
interacting ........................................................... 338
map view .............................................................. 266
type ............................................................... 268, 331
Input parameters ........................................ 468, 537
Instance ........................................ 683, 685, 701, 723
Instance title ............................................................ 637
Integrate ...................................................................... 30
Intersection ................................................... 482, 483
iOS ................................................................................ 727
J
Java ....................................................................... 33, 532
Java Applet � Web Intelligence Java Applet
L
Language formula ................................................. 614
Latitude ........................................................... 290, 293
Legend category options .................................... 242
Legend property category .................................. 227
Level .................................................................. 429, 436
Level-based hierarchy .......................................... 429
Light and shadow effects ................ 228, 238, 240
Light power .............................................................. 240
Limits ............................................................................ 56
Line charts, vertical mixed ................................ 204
Linking ....................................................................... 517
List of actions .......................................................... 148
807
Index
List of values ............................... 308, 433, 790, 791
cascading ............................................................. 420
List Panel ................................................................... 549
Live Office ................................................................. 705
Live Office Insert Wizard .................................... 709
Live Office toolbar ................................................. 719
Local data source ................................................... 666
Local documents ................................................... 669
Local universe ......................................................... 669
Locale ................................................................... 39, 703
document ............................................................... 39
Login parameters ........................................ 709, 721
Logout ........................................................................ 704
Longitude ........................................................ 290, 293
M
Manage servers ...................................................... 274
Mandatory variable .............................................. 474
Matches pattern ..................................................... 305
MDX .................................................................. 450, 791
Measure ....................................................................... 53
Measure by dimension ....................................... 220
Member selector ... 428, 430, 432, 436–438, 455
Members for period ............................................. 320
Members who joined ........................................... 320
Members who left ................................................. 320
Merge Prompts (BEx/HANA Variables) ........ 470
Merged dimensions ............................ 91, 471, 494
existing merge ................................................... 499
hierarchies ........................................................... 500
remove from merge ......................................... 505
Merged variable ..................................................... 471
MHTML ...................................................................... 655
Micro bar chart ....................................................... 750
design .................................................................... 750
Microcube ............................................................ 60, 61
Microsoft Excel ....................................................... 655
files ......................................................................... 481
Priority .................................................................... 41
Microsoft Office ..................................................... 705
Microsoft SQL Server Analysis Services ....... 436
Minimum Top Offset ........................................... 103
Minus ............................................................... 482, 484
Mobile .............................................................. 731, 735
analytic types ..................................................... 742
Mobile (Cont.)
business intelligence ....................................... 727
categories ............................................................ 731
query and formula design ............................ 742
thumbnails ......................................................... 758
versus MobileDesigned .................................. 733
viewing ................................................................. 728
Mobile Web Intelligence
input controls .................................................... 756
report linking ..................................................... 754
MobileDesigned ................................. 731, 736, 741
Modify Object ......................................................... 707
Module ...................................................................... 572
compound modules ........................................ 574
group ..................................................................... 567
module templates ............................................ 567
My Alerts ............................................................. 568
My Applications ............................................... 568
My Inbox ............................................................. 568
My Recently Run Documents ...................... 568
My Recently Viewed Documents ............... 568
navigation list ................................................... 567
private modules ....................................... 567, 569
public modules ......................................... 567, 569
text module ........................................................ 567
viewer .................................................................... 568
web page module ............................................. 568
Multidimensional data source ........................ 689
Multidimensional universe � Universe,
multidimensional
Multiple operator ................................................. 457
Multiple range interval variable ..................... 457
My Documents drawer ....................................... 626
N
NAII ............................................................................. 538
Named set ....................................................... 429, 436
Navigation path ........................................................ 53
Nested conditions ................................................... 66
Nesting
filters ..................................................................... 306
group ..................................................................... 307
query filters ........................................................ 305
remove .................................................................. 308
Netezza ...................................................................... 317

Index
808
New chart engine .................................................. 247
NULL_VALUE .......................................................... 333
O
Objects ....................................................................... 558
alignment ............................................................ 153
copying ................................................................. 556
deleting ................................................................. 556
printing ................................................................. 558
Properties ............................................................ 708
properties .................................................. 557, 558
saving .................................................................... 558
sorting ................................................................... 556
viewing ................................................................. 558
Offline ........................................................................ 666
mode ............................................................ 624, 668
OpenDocument ............... 517, 531, 532, 632, 723
syntax ................................................................... 536
Operators ........................................ 63, 378, 386, 400
AND/OR ................................................................ 306
Between .................................................................. 64
Both .......................................................................... 65
conditional .......................................................... 401
context .................................................................. 412
Different from pattern ..................................... 65
Equal to .................................................................. 63
Except ...................................................................... 65
extended syntax ............................................... 403
ForAll ..................................................................... 414
ForEach ................................................................. 413
function-specific ............................................... 402
Greater than ......................................................... 64
Greater than or Equal to ................................. 64
hierarchical ......................................................... 403
In list ........................................................................ 63
Is not null ............................................................... 64
Is null ....................................................................... 64
Less than ................................................................ 64
Less than or Equal to ......................................... 64
logical .................................................................... 401
Matches pattern ................................................. 64
mathematical .................................................... 401
Not Between ......................................................... 64
Not equal to .......................................................... 64
Not in list ............................................................... 63
Operators (Cont.)
report structure ................................................. 412
Outliers ...................................................................... 216
Outline navigation ............................................... 105
Outlook ...................................................................... 705
Output parameters ............................................... 538
P
Page
features ................................................................. 149
layout .................................................................... 158
margins ................................................................. 158
mode .................................................. 149, 151, 717
Palette and style ........................................... 228, 238
Parameter
input ....................................................................... 537
lsC ............................................................................ 537
lsM .......................................................................... 537
lsR ............................................................................ 537
lsS ............................................................................ 537
sDocName ........................................................... 536
sIDType ................................................................. 536
sOutputFormat .................................................. 539
sRefresh ................................................................. 538
sReportName ...................................................... 538
sReportPart ......................................................... 538
sWindow ............................................................... 539
Parent-child hierarchy ........................................ 429
Partial refresh ..................................... 151, 444, 657
Partial result ............................................................ 475
Password ................................................................... 553
PDF ................................................. 539, 632, 646, 655
export .......................................................... 231, 633
save as ................................................................... 675
Performance ............................................................ 467
Permanent regional formatting ........................ 90
Personal data provider ........................................ 670
Pie chart .................................................................... 729
Placeholder .................................................... 628, 631
Plot area ..................................................................... 228
options .................................................................. 244
Post-conversion analysis and
validation ................................................... 764, 768
PowerPoint .............................................................. 705
809
Index
Predefined cells ...................................................... 186
comment cells .................................................... 188
document name ................................................ 186
drill filter ............................................................... 186
last refresh date ................................................. 186
page number ...................................................... 187
page number/total pages ............................. 187
prompts ................................................................ 187
query summary ................................................. 187
report filter summary ..................................... 187
total number of pages .................................... 187
Preferences ........................................... 667, 679, 703
groups ..................................................................... 37
Preferred viewing locale .................... 39, 553, 703
Printing, BI workspaces ....................................... 583
Product locale .................................................. 39, 552
Prompt ................................ 437, 690, 693, 714, 718
cascading ............................................................. 420
cascading filters ................................................ 423
document ............................................................. 524
filter ................................................ 67, 69, 308, 524
filter properties .................................................. 309
optional ...................................................... 420, 424
order ......................................................................... 56
select ...................................................................... 525
text .......................................................................... 421
Prompted report .................................................... 525
Properties ................................................................. 690
Publications ............................................................. 645
advanced options ............................................. 658
delivery rules ...................................................... 656
designer ................................................................ 648
destinations ........................................................ 655
dynamic recipient ................................... 645, 653
dynamic recipient list ..................................... 653
enterprise recipients ........................................ 651
events .................................................................... 658
formats ................................................................. 655
global profile personalization ..................... 651
local profile personalization .............. 652, 654
mobile .................................................................... 661
naming .................................................................. 649
personalization ................................................. 659
profile resolution .............................................. 659
prompts ................................................................ 656
properties ............................................................. 655
Publications (Cont.)
recurrence ........................................................... 657
report bursting .................................................. 645
report bursting method ........................ 659, 660
roles ....................................................................... 646
server groups ..................................................... 658
single pass report bursting .......................... 646
summary screen ............................................... 660
test mode ............................................................. 660
Publisher .................................................................. 647
Purging data ............................................................ 446
Q
Query ............................................................................ 27
adding ................................................................... 484
combined query ................................................ 481
drill ............................................................................ 91
filter ......................................................... 52, 61, 297
filter benefits ......................................................... 61
filter pane ..................................................... 61, 301
new ......................................................................... 485
panel .................. 45, 51, 298, 419, 454, 672, 711
properties ............................................................... 55
refreshing ............................................................ 492
run .......................................................................... 424
script viewer .......................................................... 59
stripping ....................................................... 91, 442
time ............................................................... 459, 470
Query as a Web Service ...................................... 597
designer ................................................................... 84
Quick display mode .......................... 149, 151, 717
R
Ranking ......................................... 109, 116, 697, 711
add ......................................................................... 117
edit ......................................................................... 117
properties ............................................................ 116
remove .................................................................. 117
steps ....................................................................... 117
Reading mode ..................................... 143, 260, 338
toolbar .................................................................. 132
Real lighting and complex shadows .... 228, 240
Recipient ......................................................... 647, 648
Recurrence ............................................................... 701

Index
810
Recycle Bin ............................................................... 683
#REF_CELLNOTFOUND ...................................... 417
#REF_DATANOTFOUND .................................... 417
Reference .................................................................. 414
Reference data ..................................... 607, 608, 612
setting ................................................................... 608
Refresh ............................................................. 151, 690
all objects ............................................................. 707
object ..................................................................... 707
options .................................................................. 708
Refresh on open ............................. 76, 90, 309, 714
Region color .................................................. 114, 249
Relational universe � Universe
Relative positioning ............................ 96, 153, 168
Reply to Group option ........................................ 601
Reply to Sender option ....................................... 601
Report .......................................................................... 28
adding charts ..................................................... 192
assigning data ..................................................... 98
bar .......................................................................... 324
body ....................................................................... 147
consolidate .......................................................... 766
create/edit ........................................................... 104
designer ................................................................ 647
designing ............................................................. 728
distribution with publications .................... 645
element ....................................... 96, 165, 194, 325
eliminate .............................................................. 766
exporting ............................................................. 632
exporting to CMS .............................................. 676
file location ......................................................... 630
filter ..................................................... 326, 646, 648
footer ..................................................................... 147
functions .............................................................. 386
header ................................................................... 147
hide elements ..................................................... 342
interface ............................................................... 129
linking ................................................................... 754
locally saved ....................................................... 765
manually unconverted ................................... 768
map ........................................................................ 265
page mode ........................................................... 149
panel ................................ 129, 147, 161, 164, 376
part ......................................................................... 522
prioritize ............................................................... 766
quick display mode .......................................... 149
Report (Cont.)
saving locally ..................................................... 673
scheduling ........................................................... 636
scheduling with publications ...................... 645
title ......................................................................... 162
value ...................................................................... 764
Report Conversion Tool ............................ 646, 764
Report property
analysis tab ............................................... 141, 157
categories ............................................................ 151
data access tab ........................................ 140, 156
file tab ................................................................... 134
formatting tab ......................................... 139, 155
function tabs ...................................................... 133
page layout ......................................................... 158
properties tab ..................................................... 135
report element tab ................................. 137, 152
Reporting toolbars ................................................ 132
Repository, publish .............................................. 676
Reset standard default style .............................. 283
REST Web Services ................................................ 231
Result objects ............................... 52, 146, 161, 711
Ribbon toolbar ........................................................ 133
Rich Internet Application ........................... 34, 527
Right to left ................................................................ 91
Rights
add object to the folder .................................. 793
copy objects to another folder .................... 793
create and edit queries based on
this universe ................................................... 792
data
enable data tracking .................................. 779
enable formatting of changed data ..... 779
data access .......................................................... 792
desktop interface
enable local data providers ..................... 780
enable web intelligence desktop ............ 780
export documents ....................................... 780
import documents ....................................... 780
install from bi launch pad ........................ 781
print documents ........................................... 781
remove document security ...................... 781
save document for all users ..................... 781
save documents locally ............................. 782
send by mail ................................................... 782
811
Index
Rights (Cont.)
disable export to bi on demand for
this user ........................................................... 782
disable import from bi on demand for
this user ........................................................... 782
documents
disable automatic refresh on open ....... 782
enable auto-save .......................................... 783
enable creation ................................... 783, 792
edit objects ................................................ 789, 794
edit query ............................................................. 789
export the report's data ................................. 789
general
edit 'my preferences' ................................... 783
enable right-click menus .......................... 783
interfaces
enable rich internet application ............ 783
enable web viewing interface ................. 784
left pane
enable document structure and
filters ............................................................ 784
enable document summary .................... 784
log on to ... and view this object in
the cmc ............................................................. 792
query script
enable editing (sql, mdx, ...) ..................... 784
enable viewing (sql, mdx, ...) .................... 785
refresh list of values ......................................... 790
refresh the report's data ................................. 790
reporting
create and edit breaks ................................ 785
create and edit conditional
formatting rules ...................................... 785
create and edit input controls ................ 786
create and edit predefined
calculations ............................................... 786
create and edit report filters and
consume input controls ....................... 786
create and edit sorts ................................... 787
create formulas and variables ............... 787
enable formatting ............................. 787, 792
enable merged dimensions ...................... 788
insert and remove reports, tables,
charts, and cells ....................................... 788
save as CSV .......................................................... 790
save as Excel ....................................................... 791
Rights (Cont.)
sharing
insert shared elements .............................. 788
publish shared elements ................. 788, 790
use lists of values ............................................. 791
view objects ........................................................ 792
view sql ................................................................. 791
Roadmap and conversion plan ....................... 766
Row ............................................................................. 718
S
Same-level break ................................................... 767
Sample ................................................................ 56, 795
SAP Analysis for Office ....................................... 682
SAP App Center ............................................. 150, 231
SAP BEx query ....................... 48, 91, 443, 452, 481
data source ......................................................... 453
member prompting ................................ 455, 461
SAP BEx Query Designer .................................... 453
SAP Business Suite ............................................... 451
SAP Business Warehouse .................................. 449
SAP BusinessObjects administrator .... 647, 651
SAP BusinessObjects Analysis,
OLAP edition ............................................... 87, 597
SAP BusinessObjects BI 4.2 SP 4 ...................... 681
SAP BusinessObjects Dashboards ................. 276,
342, 727
SAP BusinessObjects Desktop
Intelligence ......................................................... 763
SAP BusinessObjects Enterprise XI ................ 645
SAP BusinessObjects Explorer ................ 708, 727
SAP BusinessObjects Live Office ..................... 705
enterprise options ............................................ 721
general options ................................................. 720
integration .......................................................... 706
object properties .............................................. 724
preferences .......................................................... 719
refresh ................................................................... 723
search .................................................................... 710
toolbar .................................................................. 707
view options ....................................................... 721
SAP BusinessObjects Mobile ............................ 684
features ................................................................ 727
tables ..................................................................... 729
SAP BusinessObjects Mobile 6.2 for
Android ................................................................ 727

Index
812
SAP BusinessObjects Mobile 6.5 for iOS ...... 727
SAP BusinessObjects Mobile BI ....................... 661
SAP BusinessObjects Mobile for iOS ............. 728
SAP BW ...................................................................... 449
InfoProvider ........................................................ 463
SAP BW/4HANA ..................................................... 451
SAP Community Network (SCN) ..................... 769
SAP Crystal Reports 653, 659, 682, 706, 707, 727
SAP Crystal Reports for Enterprise ................ 706
SAP Direct Access ........................................ 785, 794
SAP Fiori .................................................................... 681
SAP HANA ............................... 48, 91, 317, 443, 449
analytic view ............................................ 465, 477
attribute view .......................................... 465, 477
calculation view ...................................... 465, 477
direct access ..................................... 151, 451, 464
input parameter ..................................... 474, 478
online mode .................... 48, 151, 451, 471, 618
table ............................................................. 465, 479
variable ....................................................... 474, 478
view .............................................................. 479, 481
SAP Lumira .............................................................. 727
SAP S/4HANA ......................................................... 451
Save ................................................................... 559, 708
Save as ........................................................................ 559
New to Repository ............................................ 708
Scale to page ............................................................ 246
Schedule ....................................... 683, 684, 700, 723
Scheduling ............................................................... 636
1st Monday of month ...................................... 639
caching ................................................................. 641
calendar ............................................................... 640
daily ....................................................................... 638
destinations ........................................................ 640
events .................................................................... 641
formats ................................................................. 640
history ................................................................... 642
Hourly ................................................................... 638
instance ...................................................... 637, 642
last day of month ............................................. 640
monthly ................................................................ 639
now ........................................................................ 637
nth of month ...................................................... 639
once ........................................................................ 637
recurrence ............................................................ 637
server group ........................................................ 642
Scheduling (Cont.)
weekly .................................................................... 638
x Day of nth week of the month ................. 640
Scheduling destination
BI Inbox ................................................................ 647
email ...................................................................... 647
file system ............................................................ 647
FTP .......................................................................... 647
Scope of analysis ................................... 52, 351, 353
Scorecard .................................................................. 751
design .................................................................... 751
Search ..................................................... 627, 682, 714
object types ......................................................... 596
techniques ........................................................... 597
Sections ....................................................................... 99
Sections and breaks .............................................. 198
Security Model ....................................................... 777
Security Reports ..................................................... 795
Selection types ......................................................... 38
Send ............................................................................ 626
Send To ............................................................ 626, 627
Server architecture ............................................... 766
Server group .................................................. 642, 702
Set analysis ............................................................... 317
Set as section ........................................................... 100
Shared element .................... 91, 92, 151, 471, 617
check for updates .............................................. 622
create ..................................................................... 618
find ......................................................................... 625
insert ............................................................ 620, 626
manage ................................................................. 624
modify ................................................................... 619
unlink .................................................................... 623
update ................................................................... 623
Sharing ................................................................ 29, 617
Shortcut ........................................................... 556, 591
copy ........................................................................ 592
My Favorites ....................................................... 592
Side panel ................................................ 97, 143, 166
Single Sign-On .......................................................... 85
Snapshot ................................................................... 708
Sort .................................................................... 697, 711
custom sort ......................................................... 699
Sorting ............................................................. 109, 598
by dimensions .................................................... 114
content .................................................................. 598
813
Index
Sorting (Cont.)
cross table ............................................................ 115
custom ........................................................ 111, 113
enhanced .............................................................. 114
manage sorts ...................................................... 113
objects ................................................................... 556
temporary values ............................................. 112
type ......................................................................... 110
Sparkline ................................................................... 745
formula area ....................................................... 746
mobile device display ...................................... 747
SQL ........................................... 79, 305, 440, 450, 791
free-hand .............................................................. 767
generated ............................................................... 59
script ........................................................................ 59
validate ................................................................. 441
SQL Server ................................................................ 317
SQL view .................................................................... 451
Stacking ..................................................................... 250
Standalone mode ........................................ 666, 669
Status bar ........................................................ 150, 231
Stored procedure ..................................................... 80
Style sheet modification .................................... 282
Sub-query ....................................................... 313, 711
Switch to SAP HANA direct access .................. 476
T
Table .................................................................. 137, 717
appearance property ....................................... 168
border property ................................................. 168
converting ........................................................... 183
cross table ................................. 97, 137, 180, 181
data table ............................................................. 184
displaying data .................................................. 161
drag and drop objects ....................................... 97
form table ........................................ 137, 180, 182
general property ............................................... 168
horizontal table ....................................... 137, 180
layout .................................................................... 139
layout property ................................................. 170
properties ............................................................. 167
types ............................................................. 161, 180
using ...................................................................... 164
vertical table ................ 100, 137, 167, 180, 181
Target window ........................................................ 530
property ................................................................ 534
Templates ................................................................ 567
layout .................................................................... 566
Text modules .......................................................... 572
Thumbnail ............................................................... 758
Time zone ......................................................... 39, 553
Title category options ......................................... 241
Title property category ....................................... 227
Tool tip ............................................................. 530, 534
Toolbars .................................................................... 564
Track data changes ............................................... 151
Turn Into ............................................... 183, 184, 195
U
Union ................................................................ 482, 483
Unique identifier .................................................. 631
Universe ............ 48, 300, 451, 459, 462, 477, 707
multidimensional ..................................... 92, 451
objects ...................................................................... 50
outline ..................................................................... 52
parameters ......................................................... 445
relational ................................... 92, 317, 706, 711
view ........................................................................... 53
Universe Design Tool ..... 49, 443, 462, 494, 508,
706, 709
Unmerging dimension ....................................... 505
Unstacked ................................................................ 250
URL ............................................................................. 231
User education .............................................. 764, 769
User List .................................................................... 627
USF .............................................................................. 769
V
Validate ..................................................................... 378
Value axis ................................................................. 228
options ................................................................. 243
stacking ................................................................ 249
Value-based break ................................................ 767
Variable .................................................. 456, 468, 471
create ........................................................... 378, 381
editor ..................................................................... 375
modify .................................................................. 406
save ........................................................................ 406
slice depth ........................................................... 207
syntax ................................................................... 405
Variance calculation ............................................ 767

Index
814
VBA ................................................................... 763, 767
Venn diagram ......................................................... 317
Vertical table, layout properties ..................... 170
View Latest Instance option ............................. 642
View Object in Browser ....................................... 708
View structure .............................................. 101, 131
VNSG .......................................................................... 770
Volume effects ....................................................... 228
W
Web Intelligence ...................................................... 25
capabilities ............................................................ 28
features ................................................................... 26
functions ................................................................ 27
offline mode ......................................................... 35
preferences ............................................................ 36
report designer .................................................. 647
report parts ......................................................... 574
settings ................................................................... 38
Web Intelligence 4.1
core functionality ............................................... 27
Query Panel .......................................................... 51
Web Intelligence HTML ......................... 33, 47, 74,
518, 539, 635
Web Intelligence Interactive Viewer ...... 35, 681
Web Intelligence Java Applet .............. 34, 47, 634
Web Intelligence Rich Client ... 34, 49, 634, 647,
665, 779
access .................................................................... 667
connected mode ............................................... 669
data provider ..................................................... 670
Web Intelligence Rich Client (Cont.)
data sources ........................................................ 670
differences ........................................................... 665
document security ........................................... 674
import ................................................................... 672
import a universe ............................................. 671
install ........................................................... 665, 667
launch .................................................................... 667
offline mode ........................................................ 668
preferences .......................................................... 679
printing ................................................................. 677
query panel ......................................................... 672
reports ................................................................... 672
save ........................................................................ 673
save for all users ................................................ 674
standalone mode .............................................. 669
Web Intelligence viewer toolbar ..................... 559
Web Service Definition Language (WSDL) .... 274
Web services ................................. 84, 666, 709, 722
publisher tab ....................................................... 274
WebI .............................................................................. 26
Wild card ................................................................... 304
character ................................................................ 65
Windows Task Scheduler ................................... 775
Word ........................................................................... 705
Workspace panel .................................................... 637
Z
Zone formatting .................................................... 229
Zoom ...................................................... 151, 687, 716

First-hand knowledge.
Ah-Soon, Brogden, Marks, Orthous, Sinkwitz
SAP BusinessObjects Web Intelligence:The Comprehensive Guide814 Pages, 4th, updated and revised edition, 2017, $79.95 ISBN 978-1-4932-1547-8
www.sap-press.com/4412
We hope you have enjoyed this reading sample. You may recommend or pass it on to others, but only in its entirety, including all pages. This reading sample and all its parts are protected by copyright law. All usa-ge and exploitation rights are reserved by the author and the publisher.
Christian Ah-Soon has worked for SAP BusinessObjects for 15 years as a program manager on transversal areas like administra-tion, security, internationalization, semantic layers, and SDKs. He co-authored SAP BusinessObjects BI Security and Universe Design with SAP BusinessObjects BI: The Comprehensive Guide.
Gabriel Orthous is a population health management and he-althcare analytics expert, and a senior consultant to Wellcentive. He has more than 15 years of business analytics managerial and software engineering experience with extensive expertise around business intelligence, financial reporting, and decision analytics.
Jim Brogden is an award-winning technical author, dashboard designer, and Senior Data Warehouse Developer for Interconti-nental Exchange (ICE) in Atlanta, Georgia. He combines a master’s degree in Information Technology with nearly ten years of busi-ness intelligence consulting experience.
Heather Sinkwitz is a certified SAP BusinessObjects instructor with over 10 years of business intelligence consulting experience. She gained her expertise while working as a business intelligence consultant, specializing as a certified SAP BusinessObjects instruc-tor and solution provider.
Dallas Marks is a principal technical architect and trainer for EV Technologies and an SAP Certified Application Associate for SAP BusinessObjects Web Intelligence and the Business Intelligence platform. He has worked with SAP BusinessObjects BI tools since 2003 and has implemented solutions for a number of industries.