
SANrA I-E Figures from A... · SANrA I-E *\, KATIONAL FOREST- - - \ \ Fe and eque SAN ILDEFONSO RIO...
61
SANrA I-E * \ , KATIONAL FOREST- - - \ \ Fe and eque SAN ILDEFONSO RIO ARRIRA C0L.N Figure 1. Location of the Los Alamos National Laboratory and Study Area (Source: LANL 1998a).
Transcript of SANrA I-E Figures from A... · SANrA I-E *\, KATIONAL FOREST- - - \ \ Fe and eque SAN ILDEFONSO RIO...

S A N r A I-E * \ ,
K A T I O N A L F O R E S T - - -
\ \
Fe and eque
S A N I L D E F O N S O
RIO ARRIRA C0L.N
Figure 1. Location of the Los Alamos National Laboratory and Study Area (Source: LANL 1998a).

Figure 2. General Location of Several Physiographic Features of the East Jemez Mountains (Source: modified from Ferenbaugh et al. 1994).
180

36 oc
4!
3t 3t
1 I 1
E X P L A N A T I O N
El Bosolts of Cerros del Rio ond Scnta
An0 Meso
m Keres Group
Is3 Ej . . . . a
Teuo Group Polwdera Group
edo Coldero 2 Volles Colder0 Ring f rac ture * - * * * * Coldero wall
Figure 3. Surface Geology and Location of the Pajarito Plateau. (Copyright by the New Mexico Geological Society; Kudo 1974).
181

Figure 4. Depiction of Plant Communities of the Pajarito Plateau (Source: Travis 1992).
182


Figure 8. Depiction of Cage Locations and Habitat Evaluation Reaches in the Los
Figure 9. Depiction of Cage Locations and Habitat Evaluation Reaches in the Sandia Canyon Stream Segment.
186

Canyon Stream Segment.
Figure 11. Depiction of Cage Locations and Habitat Evaluation Reaches in the Valle Canyon Stream Segment.
187

Figure 12. Example of a Suitability Index for Substrate (at right), and Habitat Variables (below) that are Components of the Brook Trout Habitat Suitability Index Model (Raleigh 1982).
I - - - - I - - - -
5 10 cm
Habl t a t v a r l a b 1 e a M o d e l c o m o o n e n t s
A v e r a g e t h a l w e g depth (V.)
% p o o l s <V,O)
P o o l c l a s s (V,.)
% l n s t r e a m c o v e r (VsJ)--
% P o o l s C V X O )
Pool c l a s s <v,.>-
% s u b s t r a t e site (V.)
% p o o l s CV..) H S I
% r i f f l e f i n e s (V..,)
A v e . max . t e m p . C V x )
A v e . m i n . DO (V,)
A v e . s u b s t r a t e s l z e (V,)
% t l f f l e f i n e r (V,.,)
A v e . max. t e m p e r a t u r e ( V , )
A v e . m l n . DO (V,)
D o m l n a t e s u b s t r a t e type (V.)
A v e . % v e g e t a t i o n (V,,)
% r i f f l e f i n e s CV,.,)
X m l d d a y s h a d e (V,,)
' V a t l a b l e r t h a t a f f e c t a l l l l f e s t a g e s .
188

Figure 13. Habitat Variables That Are Components of the Longnose Dace Habitat Suitability Index Model (Edwards et u2. 1983).
Hab i ta t va r iab les L i f e r e q u i s i t e
Average cu r ren t v e l o c i t y (V,)
Maximum depth o f r i f f l e (V,)
Percent r l f f l e s (V,)
Substrate type (V,)
Average maximum temperature dur ing
Reproduction ’ HSI
spr ing and summer (V,)
Percent cover (V,)
F igure 1. 1 ongnose dace.
Hab i ta t var iab les inc luded i n the r i v e r i n e model, f o r
Hab i ta t va r iab les L i f e r e q u i s i t e
Maximum depth o f nearshore areas (V,)
Substrate type (V,) Reproduction . HSI
Average maximum temperature dur ing spr lng and summer (V,)
Percent cover (v,)
189

Figure 14. Stream Channel Geomorphological Classification Developed by Rosgen (1 996) Used to Evaluate the Long-term Stability of a Stream.
CONTROLS, PROCESS MATERIALS INFLUENCE +-D LITHOLOGY -.. r?
LIFE ZONES
BASIN RELIEF - LANDFORMS - VALLEY MORPHOLOGY - 1 1 WATERSHED >
T CHANNEL SLOPE
Valley Slope I Sinuosity
CHANNEL SHAPE Narrow - Deep Wide - Shallow
DRAINAGE NETWORK ) -_ *- -
ENTRENCH ME^ wno WIDTWDEPTH !%Ill6
SINUOSITY
GEOMORPHIC CHARACTERIZATION ..I--$[ LEVEL I )
Stream Types 'A' through 'G'
. I
RIPARIAN VEGETATlON
DEBRIS OCCURRENF
.. SEDIMENT SUPPLY
. . BED STABILITY
.. W/D RAT0 ' S T A T
. ,
.. .
CHANNEL PATTERNS Single Thread
Multiple Thread \. Anastomosed
Sinuosity Meander Width Ratio
::[
r I'
\ -_
' VALIDATION LEVEL
; -3 - 8
Copyright by Wildland Hydrology, Rosgen 1996
190

J 191

Figure 16. Rosgen (1996) Level I11 Stream Channel Classification.
s t i o n
CHANNEL STABILITY (PFANKUCH) EVALUATION A N D STREAM CWSIFICATlON SUMMARY (LEVEL III)
Reach Location Date Observers
ami andpoolfilling. S&L Cuts 12-24' high. Root mat over Moder. deposition of new gravel and course &$?n old and some new bars.
- - and sloughing evident
stream 'Isrpe CateROrY
14 Scouring and Deposition
15 Aquatic Vegetation
UPPER 1 LandformSlope BANKS ZMaSSWaMlng
3 Debris]amPotentiaI . 4 Vegetative Bank Protectlor LOWER 5 awndcapadty BANKS 6 BankRodrConrent
7 ObscruaionstoFlow 8 maing 9 Deposition
3040% Deposits B saw at obstrubions. constrictions, and bends. Some m u g of pools. Present but spotty, mostly in backwater. Seasonal algae gr owth makes rocks slick.
WITOM 1OROdFAngularlty 11 Brightness 12 Consolidation of Parrides 13 Bottom Size Distribution 14 Scouring and Deposition 15 AquatlcVegetation
uppw 1 Landformslope BANKS 2 Masswasting
LdwER 5 ChannelCapadty BANRS 6 BankRuckContent
3 Debris Jam Potential 4 Vegetative Bank Rotedoi
7 obstrudiomtoFlow
8 Cutting 9 Deposition
11 Brightness 12 Consolidation of pattides 13 Boaom Size Distribution 14 Scouring and Deposition
BVITOM lORockAnsularlty
15 AquaticVegeeation
EXCELLENT Bank Slope Gradient 40% No evidence of past or future mass mu absent from immediate =area. 90%+ plant density. Vigor and variety suggest a deep dense son binding root mass. Ample for present plus some increases. Peak flows contained. WID ratio c7. 65% with large angular boulders. 12"+ common. Fbcks and logs firmly imbedded. Flow paaemwithoutcuuingor deposition. Stable bed W e or none. Infreq. raw banks less than 6". Little or no enlargement of channel or DL bars. Sharp edges and corners. plane surfaces rough. Surfaces duD. dark or stained. Gen. not bright. Assorted sizes tightly packed or overlapping. No size change evident. Stable mater. 80-100% 6% of boaom affeaed by scour or deposition. Abundant ~ r 0 ~ t . h mosslike+ dark green perennial. in swllt wakr too.
GOOD TOTAL
Bank Slope Gradient 3040% Infrequent. Mostly healed over. Low future potential. Resent, but mostly small twigs and limbs. 70-90% density. Fewer species or less vigor suggest less dense or deep root mass. Adequate. Bank ovdows rare. WfD ratio 8-15 4045%. Mostly small boulders to cobbles 6-12" Some present causing erosive cross currents and minor pool. filling. Obstructions newer and less h. Some, intermittenqV at outcu~es and constridions Raw banks may be up to 12" Some new bar increase, mostly hm coarse gravel. Rounded corners and edges, surfaces smooth. flat. Mostty dull, but may have <35% bright surfacps. Moderatety packed with some overlap ing. Distribution shift l i r Stable mated)50-80%. 530% affected. Sam at constrictions and where grades steepen. Some deposition in pools. Common. Algae forms in low velodty and pool areas. Moss here tao.
UPPER 1 mdfomslope BANKS 2MassWastlng
3 DebrisJamPotential . 4 VegetatheBankRotection
UlWeR 5 ChannelCapadty BANKS 6 BankRockContent
7 0bseuctionstoFlow
Bankslope & e n t W % R uent orEge. causing sediment n w year long. M L t e to heavy amounts, m o w larger stzes. <50-70% density. Lower vigor and fewer species from a shallow,
Bar& contains present peaks. Occasional overbank floods. WID ratb 15 to 25. 2040% with most in the 3-6" diameter dass. Moder. fresuent, unstable obstrudions move with high Bows causing bank
BURQM IORodrAngUlarity 11 Brightness 12 Consolidation of Parrides 13 Bottom Size Distribution
Comers and edges well rounded in two dimensions. Mixhw dull and bright ie 35-65% mlxture range. Mostly loose assortment with no apparent overlap. Moder. change in sizes. Stable mate&-& 2 0 - m
2 3 2 3 1 2 2 4 4
-
1 1 2 4 6
i -
4 6 4 6 2 4 4
6 8 2 2 4 8
12
-
-
5 -
6 9 6 9
3 6 6
12 12 3 5 6
12 18
-
-
192

Figure 16. Rosgen (1 996) Level I11 Stream Channel Classification - Continued.
CHANNEL STABILITY (PFANKUCH) EVALUATION AND STREAM CLASSIFICATION SUMMARY (LEVEL III)
Cateporv POOR ~~ ~
UPPER 1 Landfomslope BANKS 2 MaSSWaSting
3 DebrisJamPotential 4 VegefafiveBankprotedlor
BO'ITOM 10 RodrAngulatity 11 Brightness 12 Consolidation of Particles 13 Boaom Size Distribution 14 Scouring and Deposition 15 AsuaClfVegetation
Bank Slope Gradient 60% F M 2 e r . to heavy amounrs, predom. larger sizes. 40% density. fewer discontinuous and s h z root mass.
~ 2 0 % rock fragments of gravel sizes, 1-3" or less. Sediment traps full, channel migration occurrhg. Almost continuous cuts, some over 24" high. Failure of overhangs frequent. Extensive dewsits of red om. fine Dantdes. A&erated bar develooment
uent or large causing sediment neady yeat bng or imminent danger of same.
es and less vigor indicate poor,
Inadequate. overbank flows common wm ratio >25
Well rounded in all dimensions, surfaces smooth. Predom. bright, 65% exposed or scoured surfaces. No packing evident. Loose assoment Marked distribution change. Stable m a 2 ?-?E. More than 50% of the bottom in a state of flux or change nearly year long. Perennial types scarce or absent. Yenow-green. short term bloom may be present.
4 8
16 24
4 TOTAL I I
193

30 I I _ _
25
20
15
10
5
0 Weight Length
Figure 17. Mean Weight and Length of Trout Captured in Los Alamos Canyon During October 1997.
3 25 E W
0
Figure 18. Mean Weight and Length of Trout Captured in Los Alamos Canyon during December 1998.
194

60
50
40
30
20
10
0 Wetted Width Mean Depth % Stream Cover % Bank Cover % Total Cover
I Habitat in Aug-97 Fish Use in Oct-97 0 Fish Use in Dec-98 I Figure 19. Comparative Values for Various Habitat Parameters Corresponding to Locations
Where Fish were Captured (October 1997 and December 1998) Versus Randomized Habitat Quantification (August 1997) in Los Alamos Canyon.
70
60
50
40 30
20
10
0 August 6, 1997 October 8, 1997 December 17, 1998
Figure 20. Comparative Habitat Type Percentages Corresponding to Locations Where Fish Were Captured (October 1997 and December 1998)Versus Randomized Habitat Quantification (August 1997) in Los Alamos Canyon.
195

Figure 21. August Floods Affecting In Situ, Caged-Fish Bioassays in Sandia Canyon.
100
80
60
40
20
0 Los Alamos Sandia Paj arito Valle
Figure 22. Percent Mortality During the 96-Hour, Caged-Fish Bioassay and Corrected for Mortality Attributed to Floods or Escaped Fish.
196
100
a * .y 60
40 0
0
I I
Los Alamos Sandia Paj arito Valle
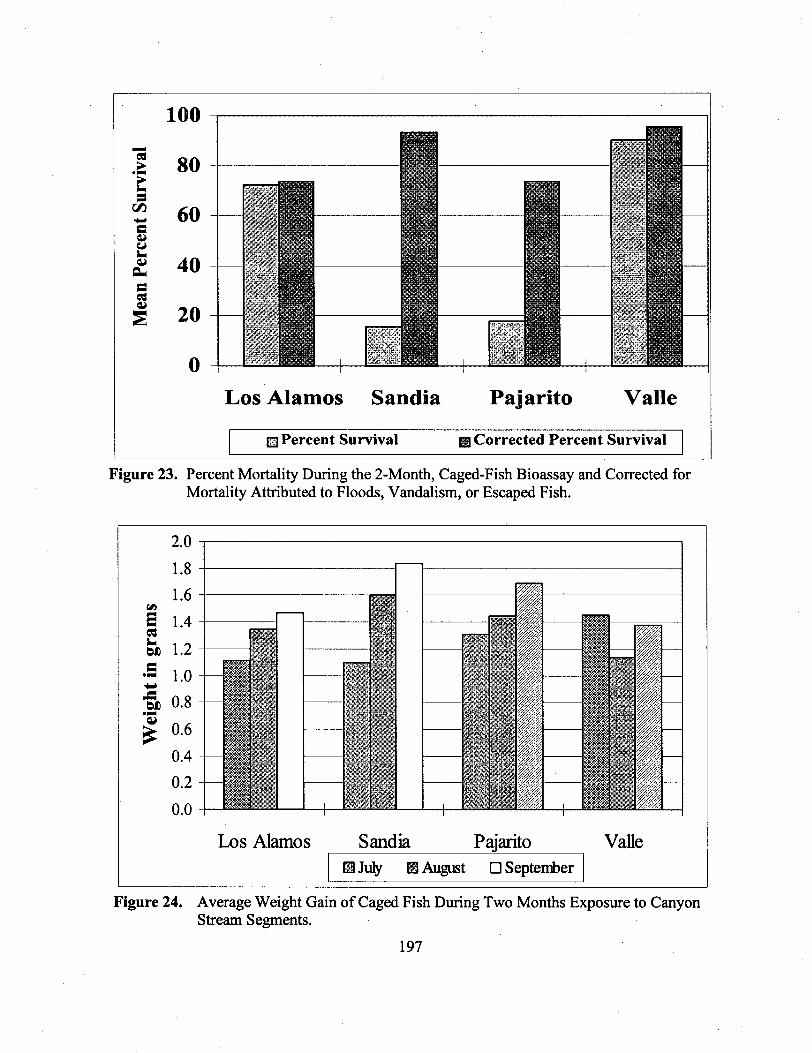
Figure 23. Percent Mortality During the 2-Month, Caged-Fish Bioassay and Corrected for Mortality Attributed to Floods, Vandalism, or Escaped Fish.
1.8
1.6
1.4
1.2 1 .o 0.8 0.6 0.4
0.2 0.0
Los Alamos Sandia Paiarito Valle August OSeptember I
Figure 24. Average Weight Gain of Caged Fish During Two Months Exposure to Canyon Stream Segments.
197

2 1.8 1.6 1.4 1.2
1 0.8 0.6 0.4 0.2
0 T l T2 T3 T4 T5 T6 T7 T8 T9
Cage Number
Figure 25. Average Weight Gain of Caged Fish, in Each Cage, During 2-Month Exposure to the Valle Canyon Stream Segment.
198

Figure 26. Water Temperature (“C) in the Los Alamos Canyon Stream Segment, 1996- 1997.
25 - 1 ~ __I__
$9’ 719’ 119’ 619’ ,9196 \$ 3\\96 \\+49’ ?\\19’ 313\19’ h\3Q19’ 513Q19’ 6\2919’ ’$919’ 913 $12 \\I%
Figure 27. Water Temperature (“C) in the Sandia Canyon Stream Segment, 1996-1997.
199

16
14
12
10
8
6
4
2
0 I I I I I I I I I I
Figure 28. Water Temperature (“C) in the Pajarito Canyon Stream Segment, 1996- 1997.
25
20
15
10
5
0 t t
Figure 29. Water Temperature (“C) in the Valle Canyon Stream Segment, 1996-1997.
200

16
14
p 12
g k 0 ‘ 0 z 2 P - 8 a
16
14
2
0
8
6
Figure 31. Dissolved Oxygen (mg/L) in the Sandia Canyon Stream Segment, 1996.1997.
20 1

16
14
SI 12
6 10
E t“ Q
3 2 “ 8 a
h
* II
6
4

0.14
0.12
b 5 0.1
3 .I 0.08
B E a2
E I
0 0.06 .L,
a
.I
Y u
0.04
s 0.02
0
2.5
2
1.5
1
0.5
0
,$,I96 ,%\496 ,\49’ 3\,\9’ 3\3\\9’ ,\+\9’ ,\49’ 6p9\9’ @9\9’ $1ps\9’ 9p 1\9’ ,Qp’\9’ ,&6\9’
Figure 35. Conductivity (mS/cm) in the Sandia Canyon Stream Segment, 1996-1 997.
203

0.4
0.35
0.3
8 & 0.25
8 4 0.2 3 1
h
0 0.15 .I
f .o 0.1
3 13
0.05
0
0.3
E 0.25 0 b 8 a $ 0.2 E a ‘g 0.15
.CI 0
.2 2 0.1
3 s
8 .CI v1
c)
0.05
0
204
9
8.5
8
7.5
7
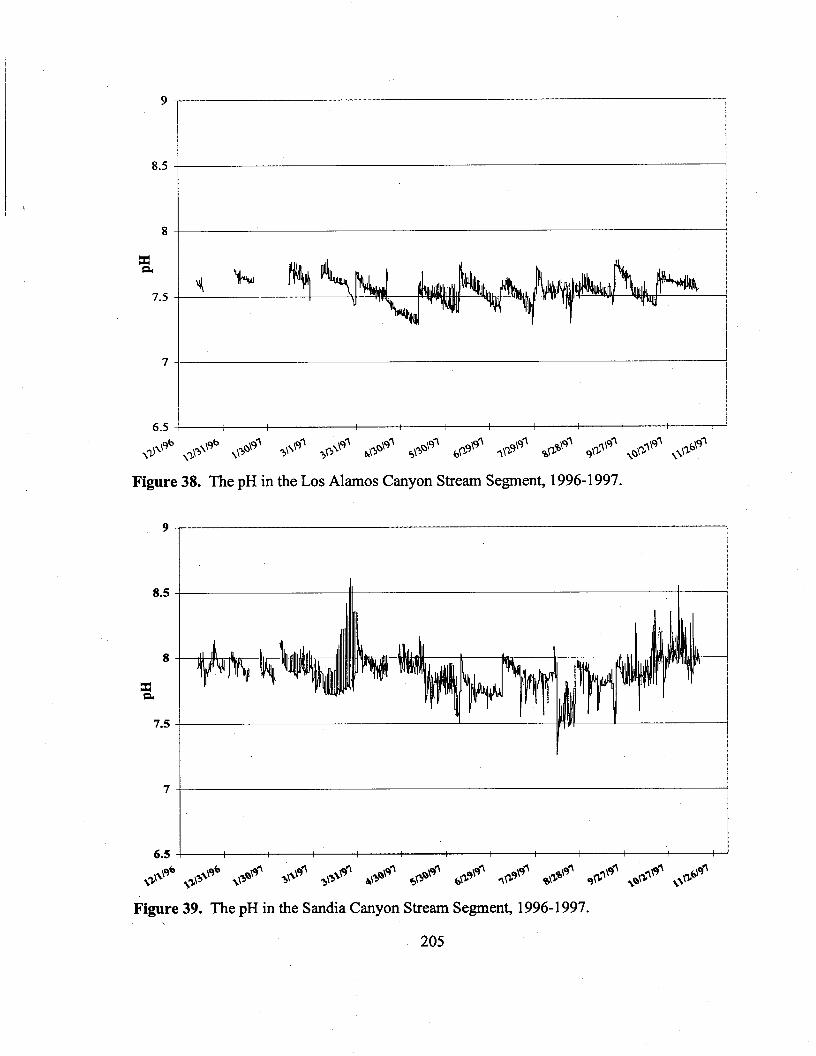
Figure 38. The pH in the Los Alamos Canyon Stream Segment, 1996-1 997.
9
8.5
8
z 7.5
7
Figure 39. The pH in the Sandia Canyon Stream Segment, 1996-1997.
205

9
8.5
8
z 7.5
7
6.5
I ‘ I
9
8.5
8
z 7.5
7
6.5
0 \.-\96 +\&96 ,,,Q\9’ ,\.e’ -;49’ ,\,Q\9’ 5\,Q\9’ 6,,9\9’ ,\>9\9’ %\.%\9’ 9p’\9’ ,Q\.’\9’ #6\’
Figure 41. The pH in the Valle Canyon Stream Segment, 1996-1997.
206

207


209

210

Ber
ylliu
m, m
g/L
diss
olve
d in
wat
er,
mgk
g dr
y w
eigh
t in
sedi
men
t and
tiss
ues
loga
rithm
ic sc
ale
5

..
..
..
.
..
..
..
.
..
..
..
.
..
..
..
.
..
..
..
.
..
..
..
.
..
..
.
..
..
..
.
..
..
..
.
..
..
.
..
..
..
.
..
..
..
.
..
..
.
..
..
..
.
..
..
.
..
..
..
.
..
..
.
..
..
..
.
..
..
.
..
..
..
.
..
..
.
..
..
..
.
..
..
.
..
.
..
.
..
..
..
.
..
.
..
..
..
.
..
..
..
.
..
.
..
..
..
.
..
..
..
.
..
.
..
.
..
..
..
.
..
..
.
..
..
..
..........................................
..
..
..
.
..
..
.
..
..
.
..
..
..
..
..
.
..
..
..
.
..
..
..
.
..
..
..
.
.................................... ..... .....................
,.
_I
__
,
..
..
..
.

til
w c
Figure 48. Cadmium in Environmental Samples.
0.900 0.700
0.500
0.300
0.100 0.080 0.060
0.040
0.020
0.009 0.007
0.005
0.003
0.00 1
. . . . . .
. . . . . .
. . . . . . . . . . . . . . . . . . . . . . . . . . . . . . . . . . . .
L S P V Water
Canyon: L = Los Alamos S = Sandia P = Pajarito V = Valle
I Max Min 0 75%
25% + Median
L S P V L S P V L S P V L S P V Porewater Sediment Invertebrates Fish

h)
P c
Figure 49. Chromium in Environmental Samples.
100.000 80.000 60.000 40.000
20.000
9.000 7.000 5.000
3.000
1 .ooo 0.800 0.600 0.400
0.200
0.090 0.070 0.050
0.030
0.010 0.008 0.006 0.004
0.002
. . . . . . . . . . . .
. . . . . . . . . . . .
. . . . . . . . . . . . . . . . . . . . . . . . . . .
L S P V L S P V L S P V L S P V L S P V Water Porewater Sediment Invertebrates Fish
Canyon: L = Los Alamos S = Sandia P = Pajarito V = Valle
I Max Min 0 75%
25% Median

Figure 50. Copper in Environmental Samples. 90.000 60.000
30.000
10.000 7.000
4.000
1.000 0.800
0.500
0.200
0.090 0.060
0.030
0.01 0 0.007
0.004
0.001
m] ....... ....... , \ . . . . . . . . . . . . . _ _ _ I ....... .................... ........ ......._............
....... I ........................
....... I .......,........ .......
............................. .............................
....... i ........ j ....... 11 .....
............................. . . . . . . . ............................................................................ ...................... . . ; i t i i . . . ; I t i i I . . . . . . . . . .
1 ::::::: i ....... ; ........ ; ....... 4 :::::: j ....... : ........ i ....... , ........................ ,................ I .......
. . . . . . ............... ,. ...................... . . . p l l ....................................... .......................................
. . . . . . . . . . . . . . . . . . . . . . . . . .
................................ . . . . . . . . .
. . . . . . . . . . . . . . . . . .
L S P V L S P V L S P V
Sediment Invertebrates Fish
Canyon: L = Los Alamos S = Sandia P = Pajarito V = Valle
0 .r(
I Max Min 0 75%
25% + Median

Figure 51. Iron in Environmental Samples Los Alamos National Laboratory Use Study - 1996- 1997
. . . .......
0.003 ...... ........ ....... ....... ...._.............__. ~ .......
0.001
........................ .. ....... . . .
. . . ........ . . . . . .
...... ....................... . . .
. . .
...... ~ ............. ...-....... ...... - ........................ . . . p i \ [ " ' ................................................................ : ; ; I ...... - ........................ . . . . . . . . . . . . . . . . . . . . . . . . . .
1 . . . ... .......... ..._.............. 1 .................................. ................................. . . . . . .
. . . . . . I 1 ................................ . . . ...... - ........................ . . . . . . . . . . . . . . . . . . . . .
. . .
. . . ...................................... ........................ .. ...... ........ : ....... ; ....... ......,...... .................. ; . . . ... ..._.............. . . . ........................................ ] [ I I I . . . . . . . . j 1 . . . . . . t i l . . . . ...... ....................... ...... ....................... . . . . . . . . ........................................................
. . . .. - .......
. . . ................ I. ............... . . . . . . . . . ................................. . . .
. . . ........................ ,. ...... . . . . . . . . . . . .
...... ............... . . . . . . . . . . . . _ .___
L S P V L S P V Water Porewater
L S P V L S P V L S P V Sediment Invertebrates Fish
Canyon: L = Los Alamos S = Sandia P = Pajarito V = Valle
I Max Min 0 75%
25% + Median


. . . . . . . . . . . . . . . . . . . . .
. . . - ..... ........ ..... . . .
500.0 ..... ... ...... ....
300.0 ....... ........ ..... .....
. . .........
. . . 100.0 .... ..+. ..... 1. ...... .; ..... ...... - ...................... 80.0 1 . ; . . . . . . + . . . . . . . I . . . .... +. .... . . . ...... ......................
. . . . . . ......................... , ..... . . . . . .
. . . . . . . . . . . . . . . . . . . . . . . . . . . . . . .........
20.0 1 ....... i ........ i ........ ; .... . . . . . .
9.0 7.0 5.0
3 .O
. . . . . . . . . ...... L... .... I. ...... .$. ... . . . . . . ............................. ...... - ..................... ~ ~ ~ ~ . * .....................
...... I ................... . . . .......... : ..... . . . . . . . . .
............................... . . . . ! .y . . . . . . . . .
1.0 ' : '
L S P V
. . . . . . . . . .. .__-_. ........... . . . . . . . . . . . . . . . . . . . . . . . . . . . .
. . .
. . . . . . . . . . . . . . . . . . . . . .
. . . . . . . . . . . . . ..........................
. . . . . . . . . . . . . . . . . . . . . . . . . . . . .
L S P V Water Porewater
. . . . . . . . . . . . . . . ....... - ......................
...... ̂ . ..................... . . . . . . ......- ............... .-..... . . .
L
L S P V L S P V L S P V Sediment Invertebrates Fish
Canyon: L = Los Alamos S = Sandia P = Pajarito V = Valle
I Max Min 0 75%
25% ++ Median


> ”+
.r(
..
..
. .
..
..
. .
rn
k
..... I ..I.
.. ..... . . a
220

22 1
- 0 0 000 0 0
ml-m
m
o
w\o
T
f cv
000 0
-000 0
000 0
000 0 0
000 0
0000 0
000 0
0000 0
QI
PW
m
000 0
000 0
000 0
%?
?$
??o?z
2 888 8
88
gs
8
888 8 8
222

Figure 58. Strontium in Environmental Samples.
m Q) 7 m m .r( c,
a !d c,
.r( 8 a
d 2 .r(
8 .r(
5
Q)
3 2 a
E
100.000 80.000 60.000
40.000
20.000
9.000 7.000 5.000
3.000
1 .ooo 0.800 0.600
0.400
0.200
0.090 0.070 0.050
0.030
0.010 L S P V L S P V
Water Porewater L S P V L S P V L S P V
Sediment Invertebrates Fish
Canyon: L = Los Alamos S = Sandia P = Pajarito V = Valle
I Max Min 0 75%
25% Median

h, h, P
Figure 59. Vanadium in Environmental Samples.
I
0
Max Min 75% 25% Median

Figure 60. Zinc in Environmental Samples. 1000.000 800.000 600.000 400.000
200.000
100.000 80.000 60.000 40.000
20.000
10.000 8.000 6.000 4.000
2.000
1.000 0.800 0.600 0.400
0.200
0.100 0.080 0.060 0.040
0.020
0.010 0.008 0.006 0.004
0.002
. . . . . .
....................... .........................
. . . . . . ................................. . . . . . . . . . . . .
. . . . . . . . . . . . . . . ................................................................ p i ; ] / : ; : . . . . . .
. . . . . .
. . . . . . L.......,....... ......... . . . . . . . . .
L S P V L S P V
Water Porewater
. . . .................... ... . . . . . . . . . ................ 2 ................. . . . . . . . . . . . . . . . . . . . . .
. . . ................ 8 ................ . . . . . . . . . . . . ...... .- ........................ . . . . . .
. . . ........ . . . . . . . . . . . . ........................ ., ....... . . . L S P V L S P V L S P V
Sediment Invertebrates Fish
Canyon: L = Los Alamos S = Sandia P = Pajarito V = Valle
I Max Min 0 75%
25% + Median
I i I 6.0
Chlorides
Sulfate
1 .o 3
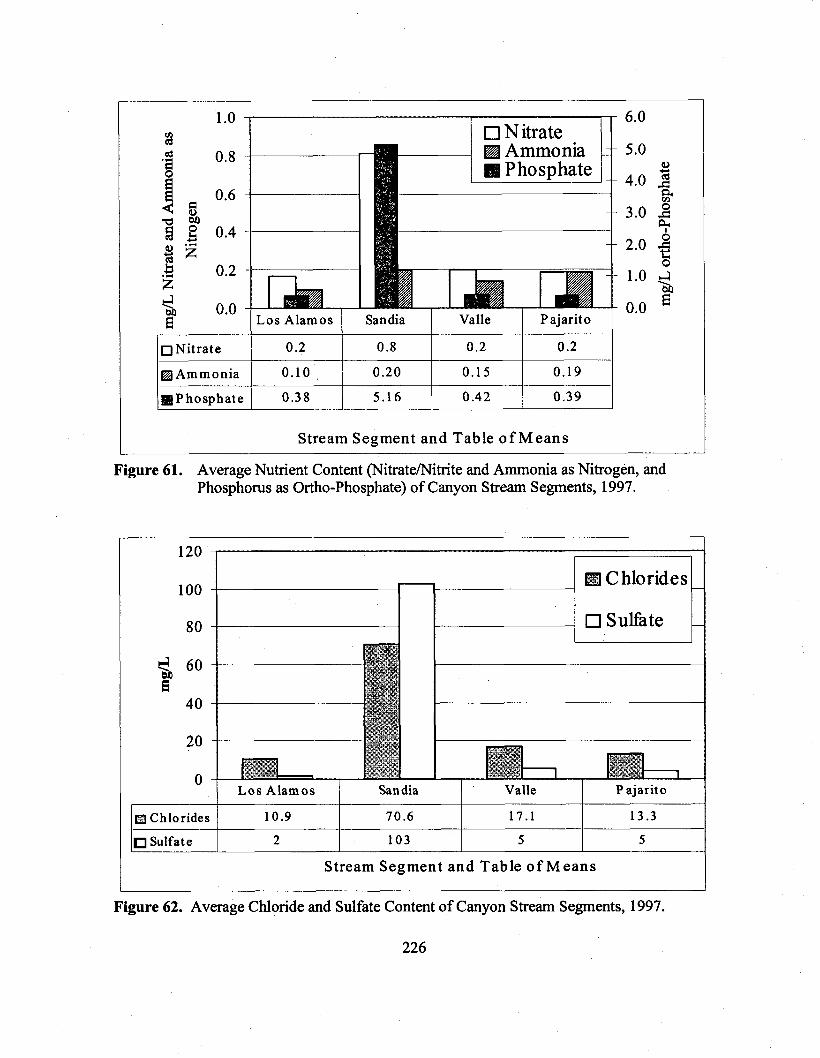
10.9 70.6 17.1 13.3
2 103 5 5
0.8
4 0.6
0.4
b 0.2
5!il
3 2 E % 0.0 B 10 Nitrate I 1~ Ammonia
I 1 P h o sp h at e
L o s A l a m o s I
5.0
4.0
3 .O
2.0
1 .o 0.0
0.2 1 0.8 I 0.2 I 0.2 I 0.10 I 0.20 I 0.15 I 0.19 I 0.38 I 5.16 1 0.42 1 0.39 1
Stream Segment and Table o f Means
Figure 61. Average Nutrient Content (Nitraternitrite and Ammonia as Nitrogen, and Phosphorus as Ortho-Phosphate) of Canyon Stream Segments, 1997.
~~ -
120
100
80
S I 6o 6
40
20
0 Valle I Pajarito 1 L o s A l a m o s 1 Sandia I
Figure 62. Average Chloride and Sulfate Content of Canyon Stream Segments, 1997.
226

160.0 , I I
Turbidity 23.7 11.8 16.7 57.6
140.0
120.0
100.0
80.0
60.0
40.0
20.0
0 .o
8 d
SI
u
3
E
I Los Alamos I Sandia I Valle I Pajarito
Stream Segment and Table of Means
Figure 63. Average Alkalinity and Hardness (mg/L as CaCO,) of Stream Segments, 1997.
I 70 I
60 h 50
1- H Total Solids I
-I-
I .,
Sandia 1 Valle 1 Pajarito
1 1 Total Solids I 62 19 28 40
227

1,600 I
Figure 65. PCB congeners in Sediment and Caged Fish Collected for the Use Study Compared with Thresholds of Concern.

1 997 Weather Summary Los Alamos, New Mexico - TA-6 Station, Elevation 7424 it
1 1997 Wues 0 (Normal Values] 1961 -1 990
Average Temperature Range 901 ' ' ' ' ' ' ' ' ' ' '
1UI I I I n n I I I L 0 a J J F M A M J J A S O N D
I " " " " " " 1 Precipitation - Monthly Totals
6 - r (3 r 4
f P
0 2 2 L
0
Annual Averages (deg F) Maxlmum 58.1 F9.81 Minimum 34.8 [36.0] Average 46.5 p7.91
Annual Total (In.) 25.50 [18.73]
Source: LANL 1998a, and Snowfall - Monthly Totals
- 2 0 c E
Annual Total (in.) 95.9 p9.l]
E v)
Los Alamoa National Lebaratory 0 Md?owIolal Mornlkdng Pawraps
(505) 667-7079
Figure 66. Summary of Precipitation and Air Temperature ("F) in 1997 at Technical Area 6 of the Los Alamos National Laboratory. (This Weather Station was near to the Stream Segments Evaluated During the Use Study).
229

0.8
BR = Below the Los Alamos Reservoir
Figure 67. Average Stream Flow, Average Flow in Riffle Habitats, and Average Flow in Pool Habitats, Measured for Each Stream Reach in 1997.
2.50 I , 1 0.07
2 .oo
1 S O
1 .oo
0 S O
0 .oo
0.06 P
0.05 aJ v)
0.04 a
0.03 6 Y
ti" 0.02 " a a 0.01 0
0.00
Figure 68. Average Stream Discharge (in cubic feet per second [cfs] and cubic meters per second [m3/s]) Measured for Each Stream Reach in 1997.
230

4 0 1
35
30
'@5 W
P $1 5
10
05
00
BR =Below th Los Alamos Reservoir
Figure 69. Average Wetted Width and Average Bankfbll Width for Each Stream Reach.
n
0 E W
+d & a
25 MaxDepth I
20
15
10
5
0
-I
Figure 70. Mean, Maximum, and Thalweg Depth of Each Stream Reach Measured in 1997.
23 1

100
90
80
70
60
5 0
40
30
20
10
0
Figure 71. Percentage of Pools, Glides, and Riffles (expressed as a percentage of total wetted stream area) for Each Stream Reach Measured in 1997.
4 0 ' r
3 0
2 0
1 0
0
Figure 72. Percentage of Instream Cover, Bank Cover, and Total Cover (expressed as a percentage of the total wetted stream area) for Each Stream Reach in 1997.
232
I O 0
9 0
8 0
7 0
6 0
s o 4 0
3 0
2 0
I O 0
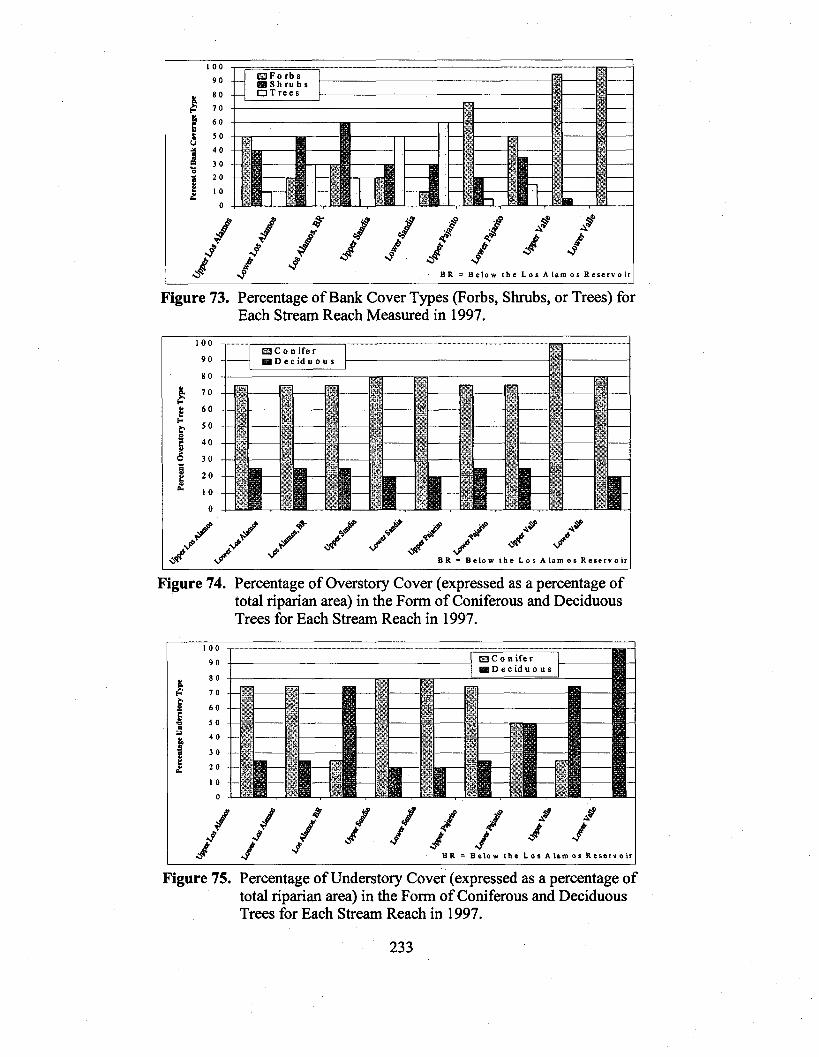
Figure 73. Percentage of Bank Cover Types (Forbs, Shrubs, or Trees) for Each Stream Reach Measured in 1997.
1 0 0
9 0
8 0
7 0
6 0
5 0
4 0
3 0
2 0
IO
0
Figure 74. Percentage of Overstory Cover (expressed as a percentage of total riparian area) in the Form of Coniferous and Deciduous Trees for Each Stream Reach in 1997.
1 0 0
9 0
8 0
7 0
6 0
5 0
4 0
30
2 0
1 0
0
mC o n ifer D e c idu o u s
B R = B e l o w t h e L o s A l a m o r R e s e r v o i r
Figure 75. Percentage of Understory Cover (expressed as a percentage of total riparian area) in the Form of Coniferous and Deciduous Trees for Each Stream Reach in 1997.
233

n 0 0 W
.B m
500 450 400 350 300 250 200 150 100 50
0
Figure 76. Stream Substrate Size Characteristics in Riffles, in Pools, and the 50* Percentile Distribution of Substrate Sizes for each Stream Reach Measured in 1997.
70
6 0
5 0
40
30
20
10
0
BR = Below the Los Alamos Reservoir
Figure 77. Stream Substrate Characteristics Expressed as Large and Fine Substrates as well as Percent Embeddedness of Large Substrates by Fines for Each Stream Reach.
234

Figure 78. Mean Habitat Suitability Index (HSI) Scores for Each Stream Segment for Adult, Juvenile, Fry, and Eggs of Brook Trout. For Illustrative Purposes, Adult and Juvenile Graphs Include Two Sets of Bars. Closed Bars Reflect the HSI Scores Before Water Depth and/or Pool Quality were Considered. Open Bars are the Final HSI Scores.
K 4 0.9 9 0.8 0 0.7 J n.6
BROOK TROUT- ADULT 1(! 1.0 I I
.
0.8 0.7 0.6 0.5 0.4 0.3 0.2 0.1 0.0
BR = Below the Los Alamos Reservoir. DE = During electrofishing.
BROOK TROUT- FRY bd 1.0 I 1
0.9 0.8 0.7 0.6 0.5 0.4 0.3 0.2 0.1 0.0
BR = Below the Los Alamos Reservoir. DE = During electrofrsbing.
BROOK TROUT- JUVENILE % 1.0 I I I
0.9 0.8 0.7 0.6 0.5 0.4 0.3 0.2 0.1 0.0
;L; I I
_ _
BR = Below the Los Alamos Reservoir. DE = During electrofishing
--- O S 0.4 0.3 0.2 0.1 0.0 r -
. ,o . &' %*\
BR = Below the Los Alamos Reservoir. DE = During electrofishing.

.;a
9
5'
W
SI Sc
ore
I I
T
I,
,,
,
> 4
e c (D
E)
(D e. I
4
c1 0
e X
v) I
236
SI S
core
0000
ob
bk
nb
or

0.9 4 0.8
-2 d 0.6 2 c, 0.5 3 0.4
K
a 0.7 -
m S 0.3
0.1 0
.c1 2 0.2
BR = Below t h e Los Alamos Reservoir. DE = During electrofishing.
Figure 80. Overall Longnose Dace Habitat Suitability Index for Canyon Streams in 1997.
1
0.9
0.8 0.7
0 m w 0.6 4 U 0.5 h
a 3 0.4
+ e 0.3 .- r z 0.2
0.1
0 Riffle Flow Riffle Depth % Riffles % Large Summer High
Substrates Temperature
Figure 81. Mean Individual Habitat Parameter Scores for the Longnose Dace Suitability Index Model for Each Stream Reach Measured in 1997.
237

80 70
.= 60 5 0 1 40
f 30 O n
p Y 20 g $ 1 0
e
0
* S o m e single reach measurements were used from both reaches. **Insufficient data for HQI calculation o f Los A l a m o s Canyon, below the reservoir.
Figure 82. Predicted Trout Biomass (Le., Standing Crop Density) using the Habitat Quality Index (HQI) for Each Stream Reach.
i 8 0 1 7 0 1 6 0 1 5 0 1 4 0 1 3 0 1 2 0 1 1 0 1 0 0
B R = B e l o w t h e L o s A l a m o s R e s e r v o i r
Figure 83. Rapid Bioassessment Protocol (RBP) Scores of Invertebrate Habitat Suitability for Each Stream Reach in 1997.

x a, 2 0 cn E m zi cn 0 J 0 CI
a, > m .- c, - 2
100
80
60
40
20
n v
70 WQI=70
VaIle
% Relative Biological Integrity
% Relative Physical Impact
80 WQI=78
. . . .. . .. .
63
Pajarito
WQ1=70
. . .
o\ m Pi
Sandia
% Relative Chemical Impact
Summary Water Quality Index
Figure 84. Relative Biological Integrity, the Percent Chemical and Physical Impact, and the Water Quality Index (WQI) for Valle, Pajarito, and Sandia Canyon Stream Segments Compared to Los Alamos Canyon Stream Segment as a Reference Site.


![TH flRI HRflO - arkleycc.hitssports.com Herald May 1… · we may ha to la-j oux home unday nd ichiee H ;an1e; 13a:-t P:1ayin ())Ut 0 ll h c to 5 Iho nol’T g.c:. is n]y not as:et::’eque](https://static.fdocuments.in/doc/165x107/60fee4c0b5dfcb61b465c3f8/th-flri-hrflo-herald-may-1-we-may-ha-to-la-j-oux-home-unday-nd-ichiee-h-an1e.jpg)


