Sandvine 2010 Annual Report - Morningstar, Inc.
82
2010 Annual Report
Transcript of Sandvine 2010 Annual Report - Morningstar, Inc.

2010 Annual Report

Contents
• LettertoShareholders
• FinancialHighlights
• SolutionsandMarkets
• Management’sDiscussionandAnalysis
• FinancialStatements
• CorporateDirectory
CAUTIONREGARDINGFORWARDLOOKINGINFORMATION
CertainstatementsinthisAnnualReportwhicharenothistoricalfactsconstituteforward-lookingstatementsorforward-lookinginformationwithinthemeaningofapplicablesecuritieslaws(“forward-lookingstatements”).StatementsrelatedtoSandvine’sprojectedrevenues,earnings,growthrates,revenuemixandproductplansareforward-lookingstatementsasareanystatementsrelatingtofutureevents,conditionsorcircumstances.Theuseoftermssuchas“anticipated”,“expected”,“projected”,“targeting”,“estimate”,“intend”andsimilartermsareintendedtoassistinidentificationoftheseforward-lookingstatements.Readersarecautionednottoplaceunduerelianceuponanysuchforward-lookingstatements.Suchforward-lookingstatementsarenotpromisesorguaranteesoffutureperformanceandinvolvebothknownandunknownrisksanduncertaintiesthatmaycausetheactualresults,performanceorachievementsofSandvinetodiffermateriallyfromtheresults,performance,achievementsordevelopmentsexpressedorimpliedbysuchforward-lookingstatements.Forward-lookingstatementsarebasedonmanagement’scurrentplans,estimates,projections,beliefsand opinions, and Sandvine does not undertake any obligation to update forward-looking statements should assumptions related to these plans,estimates, projections, beliefs andopinions change.Additional risks anduncertainties that relate to an investment in the securities of SandvinearediscussedinManagement’sDiscussionandAnalysisdatedJanuary13,2011,includedaspartofthisreportandinSandvine’smostrecentAnnualInformationForm,whichisavailableonSEDARatwww.sedar.com.
SandvineisfocusedonprotectingandimprovingthequalityofexperienceontheInternetwith its network policy control solutions. Our award-winning network equipment andsolutions help fixed line and mobile broadband network operators better serve theirsubscribers;understandnetworktrends;offernewservices;mitigatemalicioustraffic;manage network congestion; and deliver QoS-prioritized multimedia services. Withbroadbandserviceprovidercustomersinover80countriesservinghundredsofmillionsoffixedandmobilesubscribers,SandvineisenhancingtheInternetexperienceworldwide.www.sandvine.com

LettertoShareholdersDearSandvineshareholder,
Sandvinereportedrecordrevenuein2010andfourconsecutivequartersofprofitability,asongoinginvestmentsinourtechnologyandsalesandmarketingeffortspaidoff.Wehaveanincreasinglydiversifiedbusiness–whetheranalyzedbyaccesstechnologymarket,salesregion,orsaleschannel–supportedbyabroadersetofNetworkPolicyControlsolutionsthatimprovetheInternetexperienceforsubscribersandthatmakeourcustomers’networkssmarter,moreefficientandmoreprofitable.
FINANCIALRESULTSDuring2010Sandvinegrewrevenuesto$94million,up36%from2009,andournon-GAAP1profitwasmorethan10%ofourrevenue.Wearepleasedwiththeseresults.Ouryearwashighlightedbystronggrowthin:
• TheDSLandmobilemarkets;• TheAsiaPacificsalesregion;andin• Resellerrevenue.
Whilethemobilemarketgetsmostoftheattention-andwegrewrevenueinthatmarketbyapproximately30%in2010-wehadanexceptionalyearintheDSLmarket,whererevenuealmostdoubled.Themobilemarketpresentsasignificantopportunityforusinyearstocome,butourresultsthisyearhighlightthatfixedlinebroadbandprovidersstillhaveaverystrongandgrowingneedforoursolutions.
During2010wegrewrevenueineverysalesregion.AsiaPacrevenuegrewby160%intheyearandrepresentedoveraquarterofourrevenue.WhilerevenuefromtheNorthAmericanregioncontinuedtogrow,itwasthefirstyearinwhichweearnedmostofourrevenueoutsideofNorthAmerica.Forthefirsttime,ourresellerpartnerscontributedhalfofourrevenueforanentireyear.Wealsohadseveralsuccesseswithoursolutionecosystempartnersduringtheyear,includingcompletionofinteroperabilitytestingofoursolutionswithcertainpartnersinthepolicyvaluechain.
Wecontinuetohaveastrongbalancesheet.Wehavenodebtandendedfiscal2010with$90millionincashandshortterminvestments–astrongbalancethatprovidescomforttoourcustomersandenablesustocontinuetoexecuteourstrategy.
CUSTOMERSWehaveover200serviceprovidercustomersinmorethan80countries.Combined,theseserviceprovidersrepresentover100millionfixedlinebroadbandsubscribers,andover200millionmobilevoicesubscribers,arapidlygrowingnumberofwhichusetheirmobiledevicesfordataconsumption.
PenetrationofSandvine’ssolutionsacrossourmarketsisstillinearlystages,sowecontinuetofocusonwinningnewcustomers.During2010,weadded26newserviceprovidercustomersandansweredarecordnumberofRequestsforProposal,InformationorQuotation.Thisongoingtractionwithnewcustomersandsignificantfollow-onbusinessfromourinstalledbasehasonceagainledInfoneticsResearchtonameSandvineasthemarketshareleader.AccordingtoInfonetics,wegrewoursharebythreepercentagepointsandrepresented28%ofthemarketin2009.HeavyReading,anotherkeyindustryanalystgroup,hasalsonamedSandvineasthemarketleaderinoursolutionsspace.
1 Foradefinitionofnon-GAAP,seepage4ofManagement’sDiscussionandAnalysisherein.

SOLUTIONSThebestwaytomaintainourmarketleadistocontinuetoextendourtechnologicallead.During2010,welaunchedfournewproducts.OurNetworkAnalyticssolutiongivesserviceprovidersunprecedentedbusinessintelligencethroughthemergingofnetworktraffictrendsandotherbusinessdatatohighlightnewopportunitiesandthreats.Wealreadyhavenewcustomersforthissolutionwithseveralmoretrialsunderway.OurintroductionoftwoUsageManagementmodulesduringtheyearsupportsfixedandmobileserviceprovidersintheirdevelopmentofnewdifferentiatedservicessuchaspre-andpost-paiddataplansbasedonsubscriberusage,whetherintotal,byapplication,bytimeofday,bydeviceorotherparameters.TheseUsageManagementproductsformpartofourServiceCreationportfolioandarealreadyhavingameaningfulimpactonourbusiness.Finally,Fairshare3.2,ourflagshiptrafficoptimizationsolution,waslaunchedwithenhancedpolicyandreportingoptionsandinteroperabilitywithDOCSIS3.0cablenetworks.
InFebruary2011welaunchedthePolicyTrafficSwitch22000formobileandfixednetworks.ThePTS22000isidealforserviceedgeandaggregationlayerdeploymentswithupto20Gbpsperformanceinacost-effectivetwo-rack-unitformfactor.MultiplePTS22000unitscanbedeployedinavirtualswitchclustertodeliverupto80Gbpsthroughputandcansupportuptofivemillionsubscribersand32millionconcurrentflows,whichisoptimalfor3GandLTEmobilenetworks.
2010
Acoupleofyearsagoitwouldhavebeendifficulttofindasingleindustryanalystreportingonourmarketspace;todaythereareatleastahalf-dozenwritingresearchonitandtheyuniformlypredictexcitingprospectsforourmarket.
For2011,Sandvineexpectsanotheryearofrevenuegrowthandoursuccessshouldcontinuetobebolsteredbyseveralpositivemarkettrends,mostnotably:
• Therapidemergenceofusage-basedservicetiers;• Ongoingnetworkcongestion,astime-sensitive,bandwidth-intensivevideoandotherreal-timeentertainment
trafficdominatebothfixedandmobileaccessnetworks;and• Finally,theneedforgreaternetworkintelligenceasapplicationusagecontinuestobehighlydynamic.
Ilookforwardtoanexcitingyear.
Sincerely,
DaveCaputo PresidentandChiefExecutiveOfficer

FinancialHighlightsIn2010,Sandvine’stotalrevenuegrew36%over2009andreflectedmoreofthediversificationwehavebeenaimingtoachieve.In2010,significantrevenuecamefromeachofthecable,DSLandmobilebroadbandmarketsandoverhalfofourrevenuecamefromserviceprovidersoutsideNorthAmerica.PartofoursuccessoutsideNorthAmericaresultsfromtractionwithourresellerpartners,whichgenerated50%ofour2010revenue.
Revenue:$93.8million Gross Margin:74% Net Income:$5.6million,or$0.04perdilutedshare Non-GAAP Income1:10.1million,or$0.07perdilutedshare Cash:$90.3million
1 ForadefinitionofNon-GAAP,seepage4ofManagement’sDiscussionandAnalysisherein
51.1
68.8
93.8
-13.7 -10.5
10.1
-20
0
20
40
60
80
100
2008 2009 2010
Revenue Non-GAAP Income1
$0
$10
$20
$30
$40
$50
$60
$70
$80
$90
$100
2007 2008 2009 2010
Revenue by Market
Cable DSL Wireless and Other
52%
37%
11%
31%92%
8%
36%
33%
23%
47%
30%
$0
$10
$20
$30
$40
$50
$60
$70
$80
$90
$100
2007 2008 2009 2010
Revenue by Geography
North America EMEA APAC CALA
61%
22%
6%11%
89%
8%3%
52%
26%
14%
8%27%
9%
22%
42%
$0
$10
$20
$30
$40
$50
$60
$70
$80
$90
$100
2007 2008 2009 2010
Revenue by Sales Channel
Direct Partners
29%
71%
94%
6%
35%
65%
50%
50%
RevenuebyMarket RevenuebyGeography RevenuebySalesChannel
C$Millions
AllfiguresinC$Millions

SolutionsandMarketsSandvine’saward-winningnetworkpolicycontrolsolutionshelpInternetserviceprovidersbetterservetheirsubscribers,understandnetworktrends,managenetworkcongestion,offernewservices,mitigatemalicioustrafficanddeliverQoS-prioritizedmultimediaservices.
• TrafficOptimization:Withouttrafficoptimization,latency-andjitter-sensitiveapplicationssuchasonlinegamingandVoIPlosethecompetitionforfinitenetworkresourcestohigh-bandwidthbulkdataapplications.Sandvine’sTrafficOptimizationsolutionsofferthewidestrangeofsubscriber-friendlymeanstoimprovesubscriberquality-of-experiencewhilecarefullymanagingbandwidthconsumption.
• Service Creation:Networkoperatorsareseekingsolutionstomaintainorenhancesubscriber’squality-of-experienceandimprovenetworkefficiencyinacompetitivemarketplacethatdemandsconstantinnovationandnewpersonalizedservices.Inthischallengingenvironment,Sandvine’sServiceCreationsolutionshelpserviceprovidersincreasetheaveragerevenueperuserbydeliveringpersonalizedservices,encouragingefficientuseofthenetwork,andofferinginnovativebillingmodels.
• OperationsManagement:Inordertoaddressnetworkissuesbeforetheyaffectsubscribers,networkoperatorsneedtomindtheirnetworksforqualitytrends,malicioustraffic,andregulatorycompliancepurposes.Sandvine’sOperationsManagementsolutionscanidentifyqualityissuesbeforesubscribersdo,mitigatemaliciousnetworktraffic,includingoutbounde-mailspam,andsimplifyregulatoryfilteringcompliance.
• Network Business Intelligence:Inordertoaccuratelymodelnetworkoperationatabusinesslevel,serviceprovidersneedtocombineapplication-andsubscriber-awarenetworkstatisticswithdatafrombillingandotheroperationalsystems.Withuniqueinsightandadvancedanalysiscapabilitiessuchastrending,predictivemodellingandstatisticaloperations,Sandvine’sNetworkBusinessIntelligencesolutionsenableconfidentbusinessdecisionsregardingserviceplans,trafficmanagementpoliciesandcapitalinvestments.
Sandvinebelievesthatthereareanumberoffactorsthatwillcontinuetocreatestrongdemandforthecompany’sproductsacrossallaccesstechnologies:
• Therapidemergenceofusage-basedservicetiers,replacingflatrateall-you-can-eatplans;
• Increasingnetworkcongestion,astime-sensitive,bandwidth-intensivevideoandotherreal-timeentertainmenttrafficdominatebothfixedandmobileaccessnetworks;
• Thepopularityofover-the-topapplications,likeNetflix,arechallengingtraditionalvideoandvoicerevenuemodelsforserviceproviders;
• Trendsinapplicationusagearehighlydynamic,creatinganeedforadeepunderstandingofnetworkusagetrends;and
• Overallgrowthinbroadbandusersglobally,particularlyindevelopingcountries
IndustryanalystsareoptimisticaboutSandvine’smarketandtheCompany’splaceinit.InaDecember2010report,InfoneticsResearchforecastedSandvine’smarkettogrowto$1.5billionby2014,fromabaseofapproximately$250millionin2009.InfoneticsalsoidentifiedSandvineasthemarketleaderwith28%share–upthreepercentagepointsfromtheirJanuary2010report.Similarly,inaFebruary2011reportindustryanalystHeavyReadingidentifiedSandvineasmarketshareleader.HeavyReadingalsopredictsthatSandvine’smarkethasanopportunitytogrowbeyond$1billion.
PTS22000PolicyTrafficSwitch

1
MANAGEMENT’S DISCUSSION AND ANALYSIS Dated: January 13, 2011
This Management's Discussion and Analysis ("MD&A") for the three months and year ended November 30,
2010 provides detailed information on the operating activities, performance and financial position of Sandvine
Corporation (“Sandvine” or the “Company”). This discussion should be read in conjunction with the
Company’s audited consolidated financial statements and accompanying notes for the year ended November 30,
2010. The financial statements have been prepared in accordance with Canadian generally accepted
accounting principles (“GAAP”) and are reported in Canadian dollars. The information contained herein is
dated as of January 13, 2011, and is current to that date, unless otherwise stated.
The Company’s fiscal year commences December 1st of each year and ends on November 30
th of the following
year. The Company’s most recent fiscal year, which ended on November 30, 2010, is referred to as the “current
fiscal year,” “fiscal 2010”, “2010”, “FY-10” or using similar words. The previous fiscal year, which ended on
November 30, 2009, is referred to as “previous fiscal year,” “fiscal 2009,” “2009”, “FY-09” or using similar
words.
In this document, “we”, “us”, “our”, “Company” and “Sandvine” all refer to Sandvine Corporation
collectively with its subsidiaries. The content of this MD&A has been approved by the Board of Directors, on
the recommendation of its Audit Committee.
Additional information relating to the Company is available on SEDAR at www.sedar.com, and on the
Company’s web-site at www.sandvine.com.
2
CAUTION REGARDING FORWARD LOOKING INFORMATION
Certain statements in this MD&A which are not historical facts constitute forward-looking statements or forward-looking information within the meaning of applicable securities laws ("forward-looking statements"). Statements related to Sandvine’s projected revenues, earnings, growth rates, targets, revenue mix and product plans are forward looking statements as are any statements relating to future events, conditions or circumstances. The use of terms such as “may”, “anticipated”, “expected”, “projected”, “targeting”, “estimate”, “intend” and similar terms are intended to assist in the identification of these forward-looking statements. Readers are cautioned not to place undue reliance upon any such forward-looking statements. Such forward-looking statements are not promises or guarantees of future performance and involve both known and unknown risks and uncertainties that may cause the actual results, performance, achievements or developments of the Company to differ materially from the results, performance, achievements or developments expressed or implied by such forward-looking statements. Forward-looking statements are based on management’s current plans, estimates, projections, beliefs and opinions.
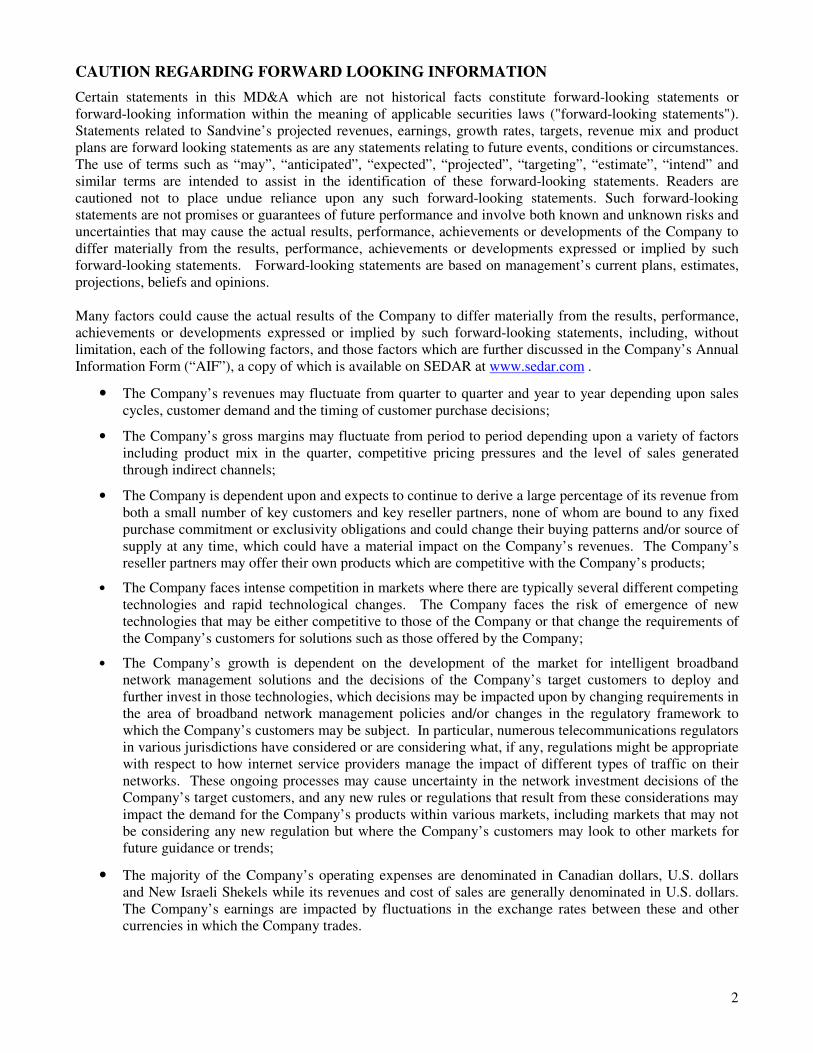
Many factors could cause the actual results of the Company to differ materially from the results, performance, achievements or developments expressed or implied by such forward-looking statements, including, without limitation, each of the following factors, and those factors which are further discussed in the Company’s Annual Information Form (“AIF”), a copy of which is available on SEDAR at www.sedar.com .
• The Company’s revenues may fluctuate from quarter to quarter and year to year depending upon sales cycles, customer demand and the timing of customer purchase decisions;
• The Company’s gross margins may fluctuate from period to period depending upon a variety of factors including product mix in the quarter, competitive pricing pressures and the level of sales generated through indirect channels;
• The Company is dependent upon and expects to continue to derive a large percentage of its revenue from both a small number of key customers and key reseller partners, none of whom are bound to any fixed purchase commitment or exclusivity obligations and could change their buying patterns and/or source of supply at any time, which could have a material impact on the Company’s revenues. The Company’s reseller partners may offer their own products which are competitive with the Company’s products;
• The Company faces intense competition in markets where there are typically several different competing technologies and rapid technological changes. The Company faces the risk of emergence of new technologies that may be either competitive to those of the Company or that change the requirements of the Company’s customers for solutions such as those offered by the Company;
• The Company’s growth is dependent on the development of the market for intelligent broadband network management solutions and the decisions of the Company’s target customers to deploy and further invest in those technologies, which decisions may be impacted upon by changing requirements in the area of broadband network management policies and/or changes in the regulatory framework to which the Company’s customers may be subject. In particular, numerous telecommunications regulators in various jurisdictions have considered or are considering what, if any, regulations might be appropriate with respect to how internet service providers manage the impact of different types of traffic on their networks. These ongoing processes may cause uncertainty in the network investment decisions of the Company’s target customers, and any new rules or regulations that result from these considerations may impact the demand for the Company’s products within various markets, including markets that may not be considering any new regulation but where the Company’s customers may look to other markets for future guidance or trends;
• The majority of the Company’s operating expenses are denominated in Canadian dollars, U.S. dollars and New Israeli Shekels while its revenues and cost of sales are generally denominated in U.S. dollars. The Company’s earnings are impacted by fluctuations in the exchange rates between these and other currencies in which the Company trades.
3
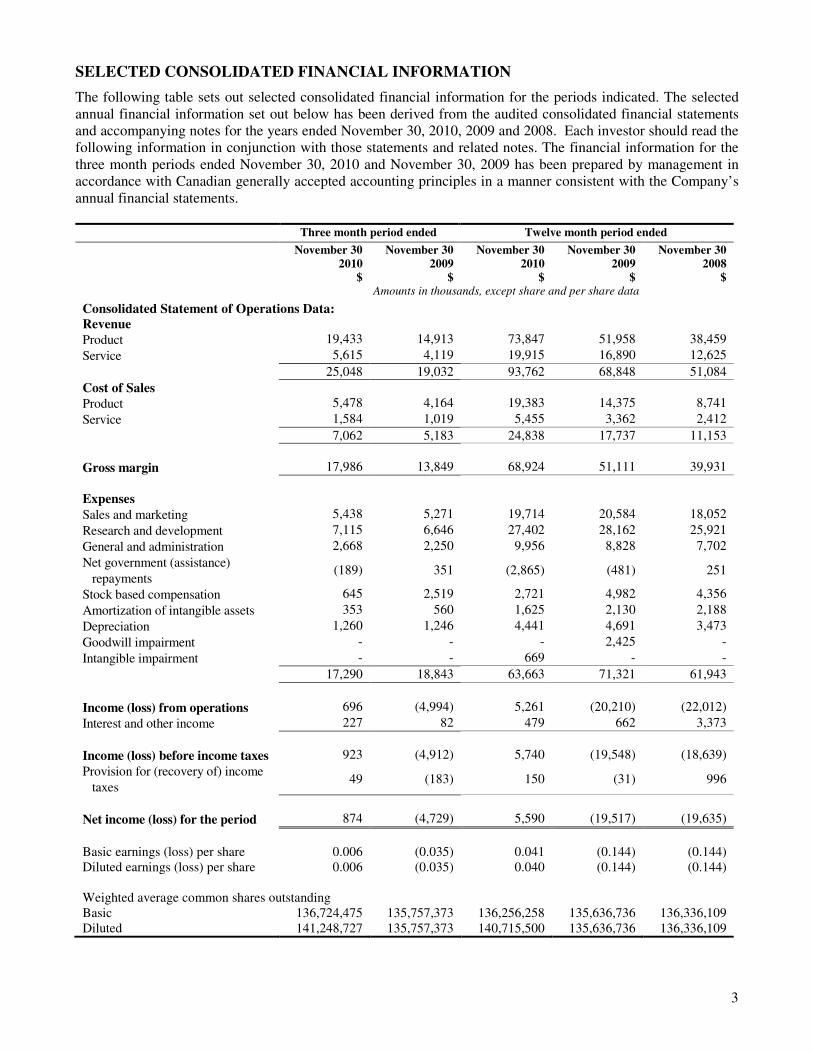
SELECTED CONSOLIDATED FINANCIAL INFORMATION
The following table sets out selected consolidated financial information for the periods indicated. The selected annual financial information set out below has been derived from the audited consolidated financial statements and accompanying notes for the years ended November 30, 2010, 2009 and 2008. Each investor should read the following information in conjunction with those statements and related notes. The financial information for the three month periods ended November 30, 2010 and November 30, 2009 has been prepared by management in accordance with Canadian generally accepted accounting principles in a manner consistent with the Company’s annual financial statements.
Three month period ended Twelve month period ended
November 30 2010
$
November 30 2009
$
November 30 2010
$
November 30 2009
$
November 30 2008
$
Amounts in thousands, except share and per share data
Consolidated Statement of Operations Data: Revenue
Product 19,433 14,913 73,847 51,958 38,459
Service 5,615 4,119 19,915 16,890 12,625
25,048 19,032 93,762 68,848 51,084
Cost of Sales
Product 5,478 4,164 19,383 14,375 8,741
Service 1,584 1,019 5,455 3,362 2,412
7,062 5,183 24,838 17,737 11,153
Gross margin 17,986 13,849 68,924 51,111 39,931
Expenses
Sales and marketing 5,438 5,271 19,714 20,584 18,052
Research and development 7,115 6,646 27,402 28,162 25,921
General and administration 2,668 2,250 9,956 8,828 7,702
Net government (assistance)
repayments (189) 351 (2,865) (481) 251
Stock based compensation 645 2,519 2,721 4,982 4,356
Amortization of intangible assets 353 560 1,625 2,130 2,188
Depreciation 1,260 1,246 4,441 4,691 3,473
Goodwill impairment - - - 2,425 -
Intangible impairment - - 669 - -
17,290 18,843 63,663 71,321 61,943
Income (loss) from operations 696 (4,994) 5,261 (20,210) (22,012)
Interest and other income 227 82 479 662 3,373
Income (loss) before income taxes 923 (4,912) 5,740 (19,548) (18,639)
Provision for (recovery of) income
taxes 49 (183) 150 (31) 996
Net income (loss) for the period 874 (4,729) 5,590 (19,517) (19,635)
Basic earnings (loss) per share 0.006 (0.035) 0.041 (0.144) (0.144) Diluted earnings (loss) per share 0.006 (0.035) 0.040 (0.144) (0.144) Weighted average common shares outstanding Basic 136,724,475 135,757,373 136,256,258 135,636,736 136,336,109 Diluted 141,248,727 135,757,373 140,715,500 135,636,736 136,336,109

4
As at November 30 2010
As at November 30 2009
As at November 30 2008
Consolidated Balance Sheet Data: Cash and cash equivalents 90,287 2,341 3,872 Marketable securities - 83,423 88,676 Total assets 149,759 136,269 150,052 Total liabilities 23,576 19,035 18,274 Shareholders’ equity 126,183 117,234 131,778
Non-GAAP Financial Measures
The following table provides a reconciliation of GAAP net income (loss) and related per share amounts to non-GAAP net income (loss) and the related per share amounts for the periods indicated. These non-GAAP financial measures which are used internally by management to evaluate the Company’s ongoing performance exclude the impact of stock based compensation, amortization of intangible assets acquired through business acquisitions and goodwill and intangible impairment expenses (collectively referred to as “Excluded Expenses”). The Company provides these non-GAAP financial measures as it is the Company’s view that the Excluded Expenses are either (i) not part of its normal day-to-day operations and/or (ii) represent a “non-cash” accounting charge that does not deplete its cash resources. Accordingly, the Company believes that such financial measures may also be useful to investors in enhancing their understanding of the Company’s operating performance. Non-GAAP net income (loss) is not recognized under Canadian GAAP and does not have a standardized meaning prescribed by Canadian GAAP. Therefore it is unlikely to be comparable to similarly titled measures reported by other issuers. Non-GAAP financial measures should be considered in the context of the Company’s GAAP results.
Three month period ended Twelve month period ended
November 30 2010
$
August 31 2010
$
November 30 2009
$
November 30 2010
$
November 30 2009
$
Amounts in thousands
Net income (loss) 874 2,200 (4,729) 5,590 (19,517)
Excluded Expenses
Stock based compensation expense 645 666 2,519 2,721 4,982
Amortization of intangible assets
acquired through business
acquisitions
191 192 400 1,113 1,600
Goodwill impairment - - - - 2,425
Intangible impairment - - - 669 -
Net income (loss) excluding the
impact of Excluded Expenses 1,710 3,058 (1,810) 10,093 (10,510)
Three month period ended Twelve month period ended
November 30 2010
$
August 31 2010
$
November 30 2009
$
November 30 2010
$
November 30 2009
$
Diluted earnings (loss) per share 0.006 0.016 (0.035) 0.040 (0.144)
Impact on diluted earnings (loss)
per share of Excluded Expenses 0.006 0.006 0.022 0.032 0.067
Diluted earnings (loss) per share
excluding the impact of
Excluded Expenses
0.012 0.022 (0.013) 0.072 (0.077)

5
OVERVIEW Our Company
Sandvine develops and markets Network Policy Control solutions for high-speed, or “broadband”, Internet service providers. The Company’s solutions provide the tools to help service providers better understand their networks and apply specific network policies that will improve the quality of service for their subscribers, support the creation of new revenue-generating services, mitigate malicious traffic and/or more efficiently manage network traffic. Sandvine began initial commercial deployments of its products in 2002 and has experienced growth in its number of customers and deployments since then. At the end of November 2010, Sandvine had over 200 Internet service provider customers in over 80 countries who serve over 90 million fixed line broadband Internet subscribers and a rapidly growing number of mobile Internet subscribers.
The Market
Sandvine’s target market is broadband Internet service providers worldwide, including DSL, cable, fixed wireless, mobile and FTTx. Within the fixed line component (DSL, cable and FTTx) of the market, Sandvine primarily targets the top 250 operators around the world, by subscriber count, which hold more than 80% of the global subscriber base. Industry analyst reports estimate that there were between 500 and 600 million fixed line broadband subscribers globally at the end of 2010. In the mobile data market (fixed wireless and mobile), Sandvine primarily targets the top 350 service providers in the world. According to industry analysts there were just over five billion total mobile subscribers worldwide at the end of 2010. Industry analysts also estimate there are over 400 million mobile broadband users – the mobile subscriber of interest for Sandvine’s solutions. This figure is expected to grow to billions of users over the next few years, so while this segment of Sandvine’s market is still in early stages, it is expected to grow rapidly.
Products and solutions
Sandvine’s Network Policy Control solutions comprise a hardware platform and proprietary software modules that are typically bundled together to provide a system for broadband Internet service providers to identify specific types of traffic across their networks (for example, VoIP, online gaming or video streams). These solutions also provide the tools to help service providers apply specific network policies that will improve the quality of service for their subscribers, support the creation of new revenue-generating services, mitigate malicious traffic and/or more efficiently manage network traffic. Traffic Optimization In times of congestion, a relatively small number of users and applications can consume the majority of network resources. Sandvine’s Traffic Optimization solutions mitigate network congestion and ensure fairness through the optimal use of network resources. Service Creation Subscribers use the Internet in different ways and to different extents. Sandvine’s Service Creation solutions help service providers create new service plans that differentiate their businesses and let subscribers choose a plan that suits them the best. Operations Management In order to address network issues before they affect subscribers, network operators need to mind their networks for quality trends, malicious traffic, and regulatory compliance purposes. Sandvine’s Operations Management solutions can identify quality issues before subscribers do, mitigate malicious network traffic, including outbound e-mail spam, and simplify regulatory filtering compliance.

6
Network Business Intelligence
In order to accurately model network operation at a business level, service providers need to combine application- and subscriber-aware network statistics with data from billing and other operational systems. With unique insight and advanced analysis capabilities such as trending, predictive modelling and statistical operations, Sandvine’s Network Business Intelligence solutions enable confident business decisions regarding service plans, traffic management policies and capital investments.
Sales and distribution
Sandvine distributes its products and services through a combination of direct and indirect sales channels. The direct sales channel is organized geographically across: (i) North America; (ii) Europe, the Middle East and Africa; (iii) Asia-Pacific; and (iv) the Caribbean and Latin America, and is based out of various jurisdictions throughout the world. The direct sales channel comprises sales where the ultimate end customer purchases products directly from the Company. The indirect sales channel utilizes global third party network equipment vendors and regional value-added resellers to market and sell Sandvine’s products, and includes both channel-initiated sales (sales initiated and serviced by third party resellers) and channel-fulfilled sales (sales initiated by the Company and serviced by third party resellers). The indirect sales channel includes sales where a third party equipment vendor purchases the Company’s product for the purpose of reselling it to the ultimate end customer. This sales and distribution strategy permits Sandvine to obtain global coverage while at the same time retaining direct contact with the customer base.
Growth strategy
The Company believes that it is at the forefront of an emerging market, and that investing in research and development, and sales and marketing is critical to maximizing the long term success of the Company. Incremental investments during 2011 in research and development will support further product development to continue to broaden and expand the Company’s suite of products. Incremental investments in sales and marketing efforts will continue to develop the direct sales force throughout the world and to grow and mature its relationships with both its regional and global resellers. Investors should be aware that operating expenses for any given quarter could fluctuate depending on the activities for that period, including, but not limited to, revenue levels (which impact variable compensation and government repayments) and foreign exchange impacts. The Company anticipates that throughout fiscal 2011 it will continue to selectively assess acquisition opportunities to strengthen its market position and augment its growth. The evaluation of potential acquisitions will include whether the target company has technology that will extend Sandvine’s core technology, has a complementary customer base, has prospective growth rates commensurate with those of the Company, and has a compatible culture. Target Business Model
Historically, the Company has communicated that in broad terms, excluding the impact of stock based compensation and non-cash acquisition related costs, the Company is working towards a target business model (outlined below) that includes a gross margin at or above 70%, and an operating margin between 10% and 20%. The target business model provides readers an opportunity to assess the Company’s targeted operating margin goals over the mid to long term and the relative breakdown of the major components impacting upon that targeted operating margin. Readers are cautioned that this information is provided solely as a means to communicate the relative weightings of revenue and expenses within the Company’s business that management believes are achievable as the Company’s business matures, subject to the various assumptions relied upon in making such projections, including those set out below and the various risk factors contained in this MD&A. Readers are cautioned that use of the information reflected in this target business model may not be appropriate for any other purpose.

7
The Company continues to invest in its business and incur expenses at levels above those contemplated by this target business model on the basis and belief that this investment level will result in greater long term success as its market matures. As a result, the Company does not anticipate achieving this target business model on sustained basis until such time as this level of investment yields a sustainable increase in revenues or until such time as the Company revises its assessment of the market opportunity.
Mid to Long Term Target Business Model
Percentage of revenue Product revenue 85% - 90% Service revenue 10% - 15% Percentage of total revenue Gross margin 70+% Research and development 20% - 25% Selling, general and administrative 30% - 35% Operating margin 10% - 20%
In arriving at this target business model, and in providing any other forward looking statements contained in this MD&A, management has relied on a number of assumptions, including, but not limited to each of the following:
• The Company’s projected investments in the areas of research and development and sales and marketing will result in growth in the Company’s revenue at targeted rates;
• The Company’s existing customers, including its historically largest end customers and reseller partners will continue to make significant purchases of the Company’s products and services;
• The Company will be able to maintain its target pricing models for its products and services and obtain its supply of components at pricing that permits the Company to achieve its target gross margins;
• Any increase in sales through the Company’s indirect channel can be managed without significantly impacting the Company’s blended gross margin;
• The regulatory environment applicable to the use of technology of the type marketed by the Company will continue to permit service providers to use the Company’s solutions and its full breadth of applications;
• The Company will be able to continue to attract and retain personnel and third party contractors at compensation levels consistent with the Company’s historical practices;
Again, readers are cautioned that a variety of factors could cause the Company’s future results, and its ability to achieve this targeted business model, to materially differ from that projected in any forward looking information in this MD&A including, but not limited to those risk factors outlined in the Company’s most recently filed Annual Information Form (“AIF”) (a copy of which can be obtained on www.sedar.com) as well as those risk factors outlined earlier in this document under the heading “Caution Regarding Forward Looking Information”.
CRITICAL ACCOUNTING ESTIMATES
The preparation of the consolidated financial statements requires management to make estimates and assumptions that affect the reported amounts of assets, liabilities, revenues and expenses and the disclosure of contingent assets and liabilities. These estimates and assumptions are affected by management’s application of accounting policies and historical experience, and are believed by management to be reasonable under the circumstances. Such estimates and assumptions are evaluated on an ongoing basis and form the basis for making judgments about the carrying values of assets and liabilities that are not readily apparent from other sources. Actual results could differ significantly from these estimates. Estimates are deemed critical when a different estimate could have reasonably been used or where changes in the estimates are reasonably likely to occur from period to period and would materially impact the Company’s financial condition or results of operation.

8
Revenue recognition
The Company recognizes revenue primarily from the sale of networking equipment (including embedded software), application software, consulting services and post contract support. In recognizing revenue, the Company makes estimates and assumptions on factors such as the probability of collection of the revenue from the customer, whether the sales price is fixed or determinable, the methodology used to determine estimated selling price and the amount of revenue to allocate to individual elements in a multiple element arrangement, the determination of whether deliverables constitute a separate unit of accounting, project effort estimations and assessment of technical feasibility and other matters. The Company makes these estimates and assumptions using past experience, taking into account any other current information that may be relevant. These estimates and assumptions may differ from the actual outcome for a given arrangement which could impact operating results in a future period.
Valuation of inventory
The Company’s policy for the valuation of inventory, including the determination of obsolete or excess inventory, requires the estimate of future demand for the Company’s products. Inventory purchases and purchase commitments are based upon forecasts of future demand. The business environment in which the Company operates is subject to long lead-time order requirements for certain components and rapid changes in technology and customer demand. The Company performs a detailed assessment of inventory each reporting period, which includes a review of, among other factors, anticipated demand requirements, current inventory levels, component part purchase commitments and usage. If customer demand differs from the Company’s forecasts, actual requirements for inventory write-offs could differ from the Company’s estimates. If the Company determines that forecasted demand does not allow the Company to sell inventories above cost or at all, such inventory is written down to net realizable value or is written off. Valuation of long-lived assets
The Company reviews long-lived assets for impairment whenever events or changes in circumstances indicate that the carrying amount may not be recoverable. If the total of the expected undiscounted future cash flows is less than the carrying amount of the asset, a loss is recognized for the excess of the carrying amount over the fair value of the asset. The Company’s impairment analysis will contain estimates due to the inherently speculative nature of forecasting long term estimated cash flows and determining the ultimate useful lives of assets. Actual results will differ, which could materially impact the Company’s impairment assessment. In the case of goodwill, the impairment test requires the identification of reporting units and a comparison of the estimated fair value of each reporting unit to the carrying value recorded on the Company’s consolidated financial statements, including goodwill. Application of the goodwill impairment test requires judgment, including the identification of reporting units, estimation of control premium and determining the fair value of each reporting unit. Changes in these estimates and assumptions could materially affect the determination of fair value and/or goodwill impairment. During the first quarter of fiscal 2009, the Company recorded a non-cash goodwill impairment charge of $2.4 million. See “Current period operating results section” for further discussion. Valuation allowance related to future tax assets
The ultimate realization of future tax assets is dependent upon future taxable income during the years in which these assets are deductible. In assessing the value of the future tax assets, management considers whether it is more likely than not that some portion or all of the future tax assets will be realized. The Company records a valuation allowance to reduce future income tax assets to the amount that is more likely than not to be realized. The Company regularly assesses all negative and positive evidence to evaluate the recoverability of its future tax assets including an evaluation of the nature and the amount of significant tax assets and their carry-forward period, the Company’s recent earnings history, the Company’s cumulative profit or loss in recent years and the Company’s ability to reasonably forecast sufficient future earnings.

9
ACCOUNTING CHANGES AND IMPACT OF RECENTLY ISSUED ACCOUNTING PRONOUNCEMENTS
Business combinations
In January 2009, the CICA issued Section 1582, Business Combinations, replacing Section 1581, Business
Combinations. This section establishes the standards for the accounting of business combinations, and states that all assets and liabilities of an acquired business will be recorded at fair value at the acquisition date. The standard also states that acquisition-related costs will be expensed as incurred and that restructuring charges will be expensed in the periods after the acquisition date. This new Section will be applicable to financial statements relating to fiscal years beginning on or after January 1, 2011. Earlier adoption is permitted. The Company is evaluating the impact of adopting this new standard in connection with its conversion to International Financial Reporting Standards (“IFRS”).
Consolidated financial statements
In January 2009, the CICA issued Section 1601, Consolidated Financial Statements, which replaces the existing standards. This section establishes the standards for preparing consolidated financial statements and is effective for fiscal years beginning on or after January 1, 2011. Earlier adoption is permitted. The Company is evaluating the impact of adopting this new standard in connection with its conversion to IFRS.
Multiple deliverable revenue arrangements
Effective December 1, 2009, the Company adopted EIC 175, Multiple Deliverable Revenue Arrangements, (“New Accounting Standard”) replacing EIC 142, Revenue Arrangements with Multiple Deliverables (“Old Accounting Standard”). This abstract was amended to (1) provide updated guidance on whether multiple deliverables exist, how the deliverables in an arrangement should be separated, and the manner in which consideration should be allocated to each deliverable; (2) provide that in situations where a vendor does not have vendor-specific objective evidence (“VSOE”) or third-party evidence of selling price, require that the entity allocate revenue in an arrangement using estimated selling prices of deliverables; (3) eliminate the use of the residual method and require an entity to allocate revenue using the relative selling price method; and (4) require expanded qualitative and quantitative disclosures regarding significant judgments made in applying this guidance. The Company has elected to early adopt this abstract prospectively to revenue arrangements with multiple deliverables entered into or materially modified on or after December 1, 2009. Arrangements that were entered into prior to December 1, 2009 will continue to be accounted for under the Old Accounting Standard. Under Old Accounting Standards, the Company was typically unable to establish objective and reliable evidence of fair value for its network equipment, application software and consulting service deliverables. In situations when the Company was not able to establish objective and reliable evidence of fair value for all deliverables of the arrangement, but was able to establish fair value for all undelivered elements, revenue was allocated using the residual method. Under the residual method, the amount of revenue allocated to delivered elements equals the total arrangement consideration less the aggregate fair value of any undelivered elements. Generally, the only undelivered element in the Company’s arrangements was post contract support (often referred to as support and maintenance services). As the Company had established objective and reliable evidence of fair value for its support and maintenance services, revenue related to the network equipment and application software deliverables would be recognized once they had been delivered and all other revenue recognition criteria had been met. When hardware or software elements were undelivered in a revenue arrangement, all of the revenue was typically deferred until these products or services had been delivered. The entire value of an arrangement which included consulting services were generally deferred until the consulting services were delivered as the Company had concluded that objective and reliable evidence of fair value was not available for its consulting services nor was the company able to reliably estimate effort required. Under the New Accounting Standard, each deliverable within a multiple deliverable revenue arrangement is accounted as a separate unit of accounting if both of the following criteria are met: (1) the delivered item has value to the customer on a stand-alone basis and (2) if the arrangement includes a general right of return relative

10
to the delivered element, delivery or performance of the undelivered item is considered probable and substantially in the control of the vendor. The Company’s customers typically purchase a combination of network equipment and at least one application software license. The combination of network equipment and a single application software license will generally form one unit of accounting when a specific order includes both elements. However, as both the network equipment and application software licenses are typically delivered concurrently, this assessment will generally not impact the timing of revenue recognition. In addition, if consulting services are included in the arrangement and are considered to be critical to the functionality of the delivered product within that arrangement, the particular product revenue and the related consulting services are considered to be one unit of accounting. The Company’s revenue arrangements generally do not include a general right of return relative to delivered products. Furthermore, the Company is now required to allocate arrangement consideration to all units of accounting based on their relative selling price. The New Accounting Standard establishes a hierarchy for determining the estimated selling price for a deliverable which includes (1) VSOE, if available, (2) third-party evidence (“TPE”) of selling price, if VSOE is unavailable, and (3) best estimate of the selling price (“BESP”) if neither VSOE nor TPE is available. VSOE is generally limited to the price charged when the same or similar product is sold separately. If a product or service is seldom sold separately, it is unlikely the Company can determine VSOE. TPE is determined based on competitor prices for similar deliverables when sold separately. As the Company is either unable to identify similar competitor products and services, or what the competitors’ selling prices are on a stand-alone basis, the Company did not have sufficient information to substantiate TPE. Since neither VSOE nor TPE can be established for its hardware, application software and consulting services, the Company is required to use its best estimate of the selling price (“BESP”) for those deliverables. The Company determines BESP for a product or service by considering multiple factors including, but not limited to, ongoing pricing strategy and policies, market conditions and historical pricing practices. In general, the impact of the New Accounting Standard will be to accelerate recognition of revenue in arrangements with undelivered network equipment, application software and consulting services when the delivered hardware and application software are separate units of accounting. The following table shows revenues as reported and pro forma revenues that would have been reported during the three month period and year ended November 30, 2010, if the transactions entered into or materially modified on or after December 1, 2009 were subject to the Old Accounting Standard.
Three months ended Twelve months ended
November 30 2010
$
November 30 2010
$
November 30 2010
$
November 30 2010
$
As reported
Pro-forma
based on previous
accounting standards As reported
Pro-forma
based on previous
accounting standards
Revenue Product 19,433 18,209 73,847 71,511 Service 5,615 4,896 19,915 18,530
25,048 23,105 93,762 90,041

11
Transition to International Financial Reporting Standards
In January 2006, the Accounting Standards Board (the “AcSB”) announced its decision to require all publicly accountable enterprises to report under International Financial Reporting Standards (“IFRS”) for years beginning on or after January 1, 2011. On February 13, 2008, the AcSB confirmed that publicly accountable enterprises will be required to use IFRS, as issued by the International Accounting Standards Board, unless modifications or additions to the requirements of IFRS are issued by the AcSB. For the Company, these new standards will be effective for the interim and annual financial statements commencing on December 1, 2011, with retrospective presentation of the comparative fiscal 2011 results. The Company’s first financial statements to be reported under IFRS will be for the three month period ending February 28, 2012, with restatement of comparative periods. The Company has established a project team that is led by finance management, and includes representatives from various areas of the organization to plan for and achieve an effective transition to IFRS. The Audit Committee of the Board of Directors regularly receives progress reporting on the status of the IFRS implementation project. The Company has continued to make progress on its IFRS conversion project. The project was designed with three primary phases as follows:
1. Scoping and diagnostic phase - This phase involves a high-level assessment to identify key areas that may be impacted by the transition to IFRS, and ranking these as high, medium or low priority, as well as the creation of a formalized project plan including key milestones and timelines, resources required, education and training requirements.
2. Impact analysis, evaluation and design phase – In this phase, each area identified from the scoping and diagnostic phase will be addressed by performing an in depth analysis of Canadian GAAP/IFRS differences, evaluation and selection of available accounting policies, quantification of impacts and development of draft IFRS financial statement contents. This phase also includes the identification of operational impacts such as information technology, process and internal control changes.
3. Implementation and review phase - This phase will integrate the Company’s new accounting policies and resulting operational impacts into the Company’s underlying information systems, business processes and internal controls.
The Company has now completed phase two of the project excluding: the quantification of impacts that will be present in the transition balance sheet of December 1, 2010 and the formal selection of accounting policies by the Board of Directors. The following table provides guidance on the expected timing of these activities. The Company is currently in phase three of the project, with areas of impact being addressed with consideration to complexity and scope of operational impact and the potential magnitude of impact. The Company anticipates the completion of phase three of the project during the first quarter of fiscal 2012.
12
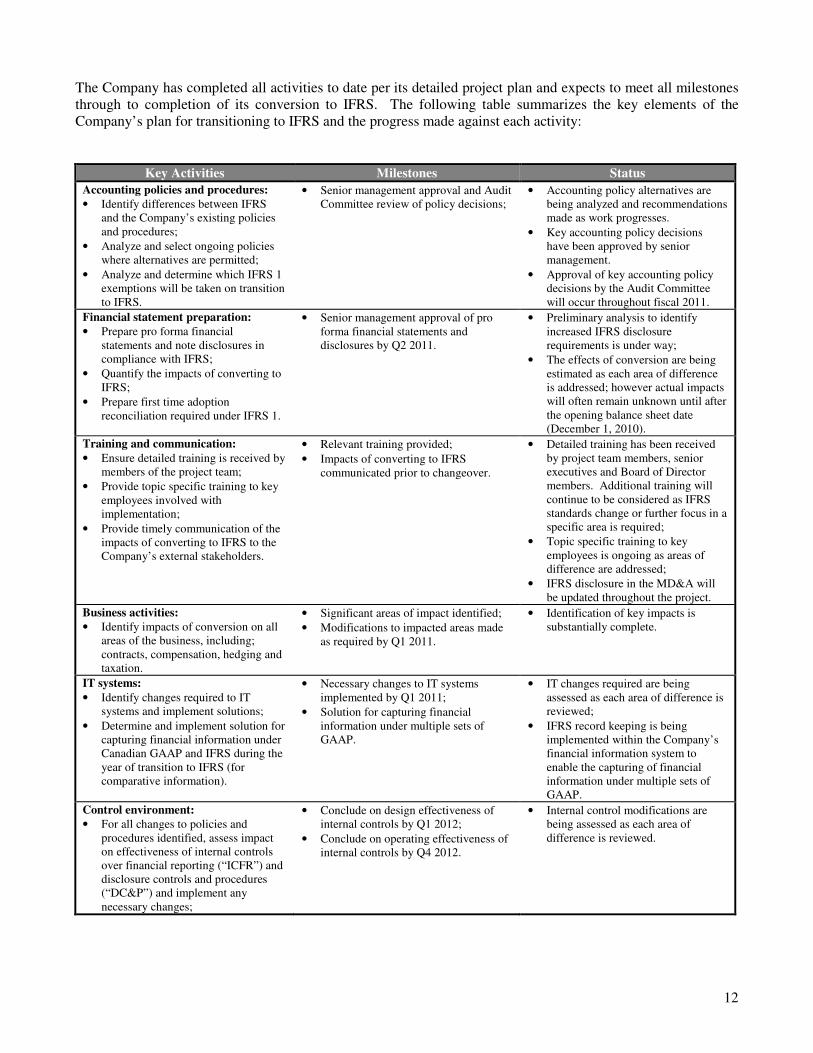
The Company has completed all activities to date per its detailed project plan and expects to meet all milestones through to completion of its conversion to IFRS. The following table summarizes the key elements of the Company’s plan for transitioning to IFRS and the progress made against each activity:
Key Activities Milestones Status
Accounting policies and procedures: • Identify differences between IFRS
and the Company’s existing policies and procedures;
• Analyze and select ongoing policies where alternatives are permitted;
• Analyze and determine which IFRS 1 exemptions will be taken on transition to IFRS.
• Senior management approval and Audit Committee review of policy decisions;
• Accounting policy alternatives are being analyzed and recommendations made as work progresses.
• Key accounting policy decisions have been approved by senior management.
• Approval of key accounting policy decisions by the Audit Committee will occur throughout fiscal 2011.
Financial statement preparation: • Prepare pro forma financial
statements and note disclosures in compliance with IFRS;
• Quantify the impacts of converting to IFRS;
• Prepare first time adoption reconciliation required under IFRS 1.
• Senior management approval of pro forma financial statements and disclosures by Q2 2011.
• Preliminary analysis to identify increased IFRS disclosure requirements is under way;
• The effects of conversion are being estimated as each area of difference is addressed; however actual impacts will often remain unknown until after the opening balance sheet date (December 1, 2010).
Training and communication:
• Ensure detailed training is received by members of the project team;
• Provide topic specific training to key employees involved with implementation;
• Provide timely communication of the impacts of converting to IFRS to the Company’s external stakeholders.
• Relevant training provided;
• Impacts of converting to IFRS communicated prior to changeover.
• Detailed training has been received by project team members, senior executives and Board of Director members. Additional training will continue to be considered as IFRS standards change or further focus in a specific area is required;
• Topic specific training to key employees is ongoing as areas of difference are addressed;
• IFRS disclosure in the MD&A will be updated throughout the project.
Business activities: • Identify impacts of conversion on all
areas of the business, including; contracts, compensation, hedging and taxation.
• Significant areas of impact identified;
• Modifications to impacted areas made as required by Q1 2011.
• Identification of key impacts is substantially complete.
IT systems:
• Identify changes required to IT systems and implement solutions;
• Determine and implement solution for capturing financial information under Canadian GAAP and IFRS during the year of transition to IFRS (for comparative information).
• Necessary changes to IT systems implemented by Q1 2011;
• Solution for capturing financial information under multiple sets of GAAP.
• IT changes required are being assessed as each area of difference is reviewed;
• IFRS record keeping is being implemented within the Company’s financial information system to enable the capturing of financial information under multiple sets of GAAP.
Control environment: • For all changes to policies and
procedures identified, assess impact on effectiveness of internal controls over financial reporting (“ICFR”) and disclosure controls and procedures (“DC&P”) and implement any necessary changes;
• Conclude on design effectiveness of internal controls by Q1 2012;
• Conclude on operating effectiveness of internal controls by Q4 2012.
• Internal control modifications are being assessed as each area of difference is reviewed.

13
Management is in the process of evaluating the expected material differences between IFRS and the current accounting treatment under Canadian GAAP. Based on IFRS standards in effect as of November 30, 2010 and exposure drafts published by the International Accounting Standards Board (“IASB”), and the work performed to date, the key areas being assessed for their potential impact on the Company’s consolidated financial statements are as follows:
Accounting Area Difference and Potential Impact to the Company
Revenue (IAS 18)
On December 1, 2009, the Company early adopted EIC 175, Multiple Deliverable
Revenue Arrangements. EIC 175 is largely aligned with current IFRS revenue recognition for multiple element accounting. As a result, the Company does not believe that significant differences exist between its revenue recognition policies under Canadian GAAP and current IFRS standards. However, on June 24, 2010, the International Accounting Standards Board (IASB) published the exposure draft ED 2010/6, Revenue
from contracts with customers. The exposure draft addresses several matters which could impact the timing of revenue recognition, such as the allocation of transaction price to elements in a multiple element arrangement, the ability to recognize revenue based on percentage of completion, and other matters. The Company is currently evaluating the potential impact of this exposure draft and will consider early adoption of this standard if it is available when the final standard is released.
Government grants (IAS 20)
The Company has received government assistance related to certain research and development projects. In conjunction with selected agreements, the Company is obligated to pay royalties related to the sales of its products. Under Canadian GAAP, the Company accrues a royalty obligation at the time of sale. Under IFRS, repayable royalty arrangements with the government should be recognized as financial liabilities. The obligation to repay royalties is recorded when the contribution is received, and is estimated based on future projections. Subsequent re-measurement of these obligations will be recognized in earnings. As a result, on transition the Company will recognize the discounted value of the projected future royalty payments as a liability.
Foreign currency (IAS 21)
Under Canadian GAAP, functional currency for a reporting entity is determined based on a number of criteria including: 1) currency which determines sales prices; 2) denomination of labour, materials and other costs; and 3) funding of the entities operations. Historically, based on facts and circumstances the Company’s had determined its functional currency under Canadian GAAP to be the Canadian dollar. The Company has re-assessed its functional currency under Canadian GAAP as a result of the continuing shift that the Company has experienced in the proportion of revenues, expenses, assets and liabilities which are denominated in U.S. dollars, and its expectation that this shift will continue in future periods. Based on these facts and circumstances, the Company has concluded that the U.S. dollar will become the Company’s functional currency for Canadian GAAP, effective December 1, 2010. Under IFRS, each entity must determine its functional currency of the primary economic environment in which the entity operates. This assessment is made by first evaluating primary indicators, which include: 1) currency which mainly influences sales prices; and 2) currency which mainly influences labour material and other costs. If these indicators are mixed, and the functional currency is not obvious, secondary indicators are evaluated to determine the functional currency. Based on the assessment of facts and circumstances, the Company has concluded that the U.S. dollar will become the Company’s functional currency, effective December 1, 2010. As a result, the Company does not expect significant differences between Canadian GAAP and IFRS with respect to foreign currency.
Share based payments (IFRS 2)
Under Canadian GAAP the fair value of share based awards with graded vesting and service only conditions may be treated as one grant by the Company, accordingly the resulting expense is recognized on a straight line basis over the vesting period. Under IFRS, each tranche of a share based award with graded vesting is considered a separate grant for the calculation of fair value, and the related expense is attributed to the vesting period of each tranche of the award. As a result, recognition of share based payment expense is accelerated.
Property, plant and equipment (IAS 16)
The transition from Canadian GAAP to IFRS requires a comparison of the current stratification of plant and equipment for depreciation purposes to that required in IAS 16, and may result in more depreciation categories. This could result in an acceleration/deceleration of depreciation as compared to Canadian GAAP.

14
Accounting Area Difference and Potential Impact to the Company
First time adoption of IFRS (IFRS 1)
IFRS 1 provides the framework for the first time adoption of IFRS. Certain one-time, optional and mandatory exemptions from full retrospective application of IFRS standards exist and are outlined within the standard. The IFRS 1 optional exemptions that are most relevant to the Company are as follows:
• Share based payment transactions – For equity-settled share based payment transactions , IFRS 1 provides for exemption to retrospective application of IFRS 2 Share based payments for previously issued equity instruments that are fully vested prior to the date of transition. The Company expects to utilize this exemption.
• Business combinations – Under IFRS 1, there is the option available to not apply the full requirements of IFRS 3 Business combinations to business combinations prior to the date of transition. The Company expects to utilize this exemption.
Leases (ED 2010/9)
On August 17, 2010 the IASB published ED 2010/9, Leases. Under the exposure draft, a lessee would be required to recognize a right-to-use asset and a lease obligation for all leases, including those that would be considered to be an operating lease under Canadian GAAP. For leases currently classified as “operating leases” under Canadian GAAP, rent expense would be replaced by amortization expense relating to the right-to-use asset and interest expense. Currently, the Company only has leases which are classified as operating leases under Canadian GAAP. These proposed changes could result in the Company capitalizing its facility leases, and accelerate the recognition pattern of the associated expense. The Company will consider early adoption of this standard if it is available when the final standard is released.
Income taxes Under Canadian GAAP, income taxes are recognized in a manner consistent with the underlying transaction when the transaction occurs in the same period as the income tax effects recognized. However, when the income taxes are being recognized or re-measured in a subsequent period, they are required to be charged to the income statement, even if the initial recognition was related to an equity or other comprehensive income. Under IFRS, tax consequences of a transaction recorded in equity or other comprehensive income in a previous period must be recorded in other comprehensive income or directly in equity (i.e. backward tracing). The Company is currently evaluating the impact of this difference on transition.
This may not be an exhaustive list of all the significant impacts that could occur during the conversion to IFRS. The Company continues to monitor and assess the impact of evolving differences between Canadian GAAP and IFRS, since the IASB is expected to continue issuing new accounting standards during the transition period. As a result, the final impact of IFRS on the Company’s consolidated financial statements can only be determined once all the applicable IFRS standards as at November 30, 2012 (the Company’s first annual IFRS reporting date) are known.
CHANGE IN FUNCTIONAL AND REPORTING CURRENCY
Effective December 1, 2010 (the “Conversion Date”), the Company has adopted the U.S. dollar (“USD”) as its functional and reporting currency. This is the result of the continuing shift that the Company has experienced in the proportion of its revenues, expenses, assets and liabilities which are denominated in USD, and its expectation that this shift will continue in future periods. Prior to the Conversion Date, the Company’s operations continue to be measured and reported in Canadian dollars (“CAD”). Refer to the end of this MD&A for tables reflecting certain historical financial results prior to the Conversion Date assuming that the USD had been the Company’s reporting currency at the time. These USD denominated results are provided for information purposes only to assist readers in comparing such results with results to be reported after the Conversion Date. As at November 30, 2010 the majority of the Company’s cash and cash equivalents were held in CAD. On December 1, 2010, the majority of the Company’s cash and cash equivalents were converted to USD. During the fourth quarter of fiscal 2010, the Company took steps to protect itself from incurring an economic loss relating to its Canadian dollar denominated cash and cash equivalents as a result of an appreciation in the USD against the CAD prior to the Conversion Date. The Company employed a “tunnel” hedging strategy, by purchasing a CAD call option, and selling a CAD put option, both with a notional value of $72 million CAD.

15
This strategy had the effect of ensuring the Company would receive a CAD/USD conversion rate between 1.023:1 and 1.064:1 as of the Conversion Date. This hedging strategy did not have a significant impact on the Company’s annual or fourth quarter financial statements as the spot rate at November 30, 2010 was between 1.023 and 1.064. Subsequent to December 1, 2010 the Company’s exposure to foreign exchange fluctuations relates to operating expenses which are not denominated in USD, primarily employee compensation costs denominated in Canadian dollars and New Israeli Shekels (“ILS”). The Company plans to minimize fluctuations in its operating expenses associated with changes in USD/CAD/ILS exchange rates through the use of forward foreign exchange contracts.
COMPOSITION OF REVENUES AND EXPENSES
The Company’s product revenue consists of revenues derived from the sale of its hardware products and the license of its software products. The Company’s service revenue consists of revenues from post contract support (generally referred to as support and maintenance services) as well as various professional services including training and installation that is provided to its customers. The vast majority of the Company’s revenues are denominated in U.S. dollars. The majority of the Company’s operating expenses are denominated in Canadian dollars, U.S. dollars and New Israeli Shekels while its cost of sales are generally denominated in U.S. dollars. The Company’s earnings are impacted by fluctuations in the exchange rates between these and other currencies in which the Company trades. In an attempt to minimize the earnings impact of foreign currency gains and losses associated with foreign exchange rate fluctuations, the Company enters into forward foreign exchange contracts for a portion of this exposure. Product cost of sales consists of the cost of direct materials, plus direct labour and an allocation of overhead applied to the product. Service cost of sales includes certain overhead costs, warranty costs, the costs of salaries and other personnel costs for staff dedicated to providing professional and customer support services. Sales and marketing expenses consist primarily of salaries, variable compensation costs and other personnel costs, travel, advertising, trade analyst research, trial material costs as well as trade show and conference costs. Research and development expenses consist primarily of salaries and other personnel costs, off-shore development costs, certification and material costs (including prototype costs) associated with new product introduction. General and administrative expenses consist primarily of personnel costs, occupancy costs, professional costs associated with tax, accounting and legal advice, public company costs (including compliance costs), information system and software maintenance costs as well as foreign currency gains and losses. Sales and marketing, research and development, and general and administrative expenses are presented on the Company’s consolidated financial statements including the benefit of government assistance received, as well as repayments of such assistance. Effective fiscal 2006, the Company commenced the repayment of funding received through the Technology Partnerships Canada (“TPC”) program. The agreement requires the contribution to be repaid in the form of royalties to a maximum of $16 million. Royalties are charged at 2.5% of the Company’s gross revenues. The obligation to pay royalties expires on November 30, 2013. Any repayments accrued or paid have been included in the consolidated financial statements as part of the Company’s research and development expenses.

16
A subsidiary of the Company has participated in programs sponsored by a foreign government body’s Chief Scientist Office (“CSO”) for the support of certain research and development activities. The subsidiary is obligated to pay royalties, amounting to 3% - 3.5% on sales and other related revenues generated from the subsidiary’s products up to the amount granted plus interest. The subsidiary’s obligation to pay these royalties is contingent on actual sales of its products which incorporate the technology related to the grant, and in the absence of such sales, no payment is required. Any repayments accrued or paid have been included in the consolidated financial statements as part of the Company’s research and development expenses. The Company has entered into an agreement with the Province of Ontario relating to the Next Generation of Jobs Fund program. This program will provide funding relating to one of the Company’s projects. Under the agreement, the Company will be eligible to receive funding equal to 11% of eligible project expenditures from February 24, 2009 to February 24, 2014 to a maximum of $18.7 million (the “Initial Grant”). Payments made in respect of the Initial Grant can become conditionally repayable if certain cumulative job targets are not met. In addition, at the end of the agreement, the Company may be entitled to receive up to an additional 4% of eligible project expenditures (to a maximum of $6.8 million) if certain incremental targets for new Ontario-based jobs have been met. Interest and other income consists primarily of interest income (net of related expenses) earned on the Company’s cash, cash equivalents and marketable securities. The current income tax provision predominantly relates to current taxes owing (recoverable) by the Company’s foreign subsidiaries.

17
CURRENT PERIOD OPERATING RESULTS
Overview
The Company’s total revenues for the current quarter were $25.0 million, an increase of $0.6 million from the $24.4 million recognized during the third quarter of 2010. The increase primarily resulted from a $2.5 million increase in revenue from the DSL market, most notably from customers in the Asia Pacific (APAC) sales region. The increase was partially offset by a $1.9 million decrease in wireless and cable market revenues, largely attributable to customers in the North American sales region. The Company expects to continue to see significant quarterly fluctuations in the revenues generated from the Company’s various access technology markets and sales regions due to variability associated with the timing of significant customer purchase decisions. During the fourth quarter, the Company received initial purchase orders from five new customers and recognized revenue from five new customers, comprising three DSL service provider, one wireless operator and one cable service provider. The value of orders received from customers during the fourth quarter was below total revenue recognized during the fourth quarter.
The Company’s GAAP net income for the current quarter was $0.9 million, as compared to a GAAP net income of $2.2 million in the third quarter of 2010. The Company’s non-GAAP income for the current quarter was $1.7 million, compared to a non-GAAP income of $3.1 million in the third quarter of 2010. The current quarter decrease in non-GAAP net income compared to the third quarter of 2010 is primarily the result of higher revenue in the current quarter being offset by a lower blended gross margin and higher operating expenses. Revenue increased by $0.6 million but the blended gross margin rate declined compared to the third quarter, such that the gross margin in absolute dollars remained relatively constant between quarters. The lower gross margin rate in the fourth quarter was largely as a result of a higher proportion of business going through the indirect sales channel and a lower gross margin on certain professional services engagements in the quarter. Exclusive of “Excluded Expenses” (as defined on page 4 of this document), operating expenses in the fourth quarter increased by $1.4 million compared to the third quarter of 2010. The increase in operating expenses was primarily the result of higher:
• sales and marketing ($0.6 million) expenses, primarily related to higher compensation costs and higher tradeshow expenses;
• research and development ($0.4 million) expenses, primarily related to higher prototype costs, personnel costs and outsourced development;
• and foreign exchange ($0.4 million) expenses;
• all partially offset by higher government assistance in the current quarter ($0.3 million).
4.1 3.1 5.3 5.9 5.6
14.9 18.8
17.1 18.5 19.4
Q4 09 Q1 10 Q2 10 Q3 10 Q4 10
Revenue$CAD, in Millions
Product Service
22.421.9
19.0
25.024.4

18
Revenue
Three month period ended Twelve month period ended
November 30 2010
$
August 31 2010
$
November 30 2009
$
November 30 2010
$
November 30 2009
$
Amounts in thousands
Product 19,433 18,527 14,913 73,847 51,958
Service
Support and maintenance 4,175 3,968 3,278 14,684 13,837 Professional services 1,013 1,504 317 3,744 1,387 Training, installation and other 427 448 524 1,487 1,666
5,615 5,920 4,119 19,915 16,890
Total 25,048 24,447 19,032 93,762 68,848
Q4 2010 compared to Q3 2010
The Company’s total revenues for the current quarter were $25.0 million, an increase of $0.6 million from the $24.4 million recognized during the third quarter of 2010. The increase primarily resulted from a $2.5 million increase in revenue from the DSL market, most notably from customers in the Asia Pacific (APAC) sales region. The increase was partially offset by a $1.9 million decrease in wireless and cable market revenues, largely attributable to customers in the North American sales region. The Company expects to continue to see significant quarterly fluctuations in the revenues generated from the Company’s various access technology markets and sales regions due to variability associated with the timing of significant customer purchase decisions. An element of the Company’s growth strategy has been, and continues to be, investment in sales and marketing activities. As a result of these investments, the Company is continuing to realize a diversification in its revenue, both geographically and by access technology market. Revenues generated from sales regions outside of North America comprised 71.6% or $17.9 million of total revenues in the current quarter, as compared to 62.1% or $15.2 million in the third quarter of 2010. Non-cable access technology markets accounted for 81.7% or $20.5 million of total revenues in the current quarter as compared to 79.6% or $19.5 million in the third quarter of 2010. The Company continues to generate a significant portion of its revenues from its reseller partners, also referred to as its “indirect channel”. During the fourth quarter of 2010, the Company realized 63.9% or $16.0 million of its revenue through its indirect channel, compared to 53.2% or $13.0 million during the third quarter of 2010. This was only the second quarter in Sandvine’s history where resellers have generated the majority of revenue. Revenue generated through reseller partners is subject to quarterly fluctuation due to the variability associated with the timing of significant customer purchase decisions. Service revenue decreased by $0.3 million to $5.6 million, as compared to $5.9 million recognized during the third quarter of 2010, largely due to a $0.5 million decrease in professional services revenue in the period, which can vary period to period based on the nature of customer engagements. Support and maintenance revenue recognized during the current quarter increased by $0.2 million to $4.2 million, as compared to $4.0 million in the prior quarter.

19
Q4 2010 compared to Q4 2009
Revenues recognized during the fourth quarter of 2010 increased by $6.0 million to $25.0 million, as compared to $19.0 million during the same period last year. Current quarter revenue attributable to the DSL market was $6.9 million higher than the same period last year, while revenues associated with the cable, wireless and other access technology markets decreased a combined $0.9 million over the period. Service revenue increased by $1.5 million to $5.6 million, as compared to $4.1 million recognized during the fourth quarter of 2009. The increase in service revenue is primarily related to an increase in support and maintenance revenue ($0.9 million) and professional service engagements ($0.7 million). The higher support and maintenance revenue largely relates to incremental support and maintenance revenue earned on incremental product sales since the comparative period, partially offset by customers who have decommissioned older hardware products as, generally, they begin to transition to a newer hardware platform or upgrade their network. The increase in professional services revenue is consistent with the growth in business related to the Company’s non-traffic-optimization solutions, which often require consulting services for integration to adjacent business systems. The majority of the Company’s revenues are denominated in USD. The USD has depreciated significantly against the CAD over the past year. The depreciation of the USD from Q4 2009 to Q4 2010 negatively impacted the Company’s Q4 2010 revenue by approximately $0.7 million. 2010 compared to 2009
The Company’s total revenues for the year ended November 30, 2010 have increased by $24.9 million to $93.8 million, as compared to $68.8 million recognized during the same period last year. The current period increase relates to a $21.3 million increase in revenue being derived from the DSL access technology market and a $6.6 million increase attributable to the wireless access market, which are partially offset by a $3.0 million reduction in revenue generated from cable and other access technology markets. Revenue in 2010 increased in all sales regions, most notably in APAC, where revenues were $15.5 million higher than in 2009. Consistent with this growth, revenue generated through the Company’s indirect channel (which focuses on markets outside North America) increased by $23.2 million to $47.3 million in 2010, as compared to $24.1 million last year. Service revenue in 2010 increased by $3.0 million to $19.9 million, as compared to $16.9 million in 2009. The increase primarily related to increases in professional service engagements ($2.4 million) and in support and maintenance revenue ($0.8 million). The increase in professional services is consistent with the growth in business related to the Company’s non-traffic-optimization solutions, which require greater integration to adjacent business systems. The higher support and maintenance revenue largely relates to incremental support and maintenance revenue earned on incremental product sales since the comparative period, partially offset by customers who have decommissioned older hardware products as, generally, they begin to transition to a newer hardware platform or upgrade their network, and by depreciation in the USD against the CAD. The majority of the Company’s revenues are denominated in USD. The USD has depreciated significantly against the CAD over the past year on a comparative basis. On a comparative basis, the depreciation of the USD negatively impacted the Company’s 2010 revenue by approximately $6.8 million as compared to 2009. Effective December 1, 2009, the Company adopted EIC 175, Multiple Deliverable Revenue Arrangements. The new revenue guidance was applied only to revenue arrangements entered into on or after December 1, 2009. In general, the impact of EIC 175 will be to accelerate recognition of revenue in the event that an order has been partially delivered at the end of a reporting period. For the year ended November 30, 2010, reported revenue was $3.7 million higher than it would have been under previous accounting standards.

20
Revenue by access technology
The breakdown of total revenue generated by customer access technology is outlined in the following table.
Three month period ended Twelve month period ended
November 30 2010
%
August 31 2010
%
November 30 2009
%
November 30 2010
%
November 30 2009
%
Cable 18.3 20.4 26.6 23.4 35.7 DSL 59.6 50.8 42.2 47.2 33.3 Fixed Wireless/Mobile/FTTx 22.0 28.6 31.0 29.3 30.3 Other* 0.1 0.2 0.2 0.1 0.7
Total 100.0 100.0 100.0 100.0 100.0
* The other category is primarily comprised of sales to partners (including resellers and solutions partners) who have purchased the product for their own internal use e.g. for interoperability testing.
In situations where a reseller or partner of the Company has purchased products for resale to an end customer, the Company has allocated such revenue based on the access technology of the end customer. Revenue by sales channel The Company continues to invest in the development of its indirect sales channel to utilize global third party network equipment vendors, regional value-added resellers and systems integrators to help market and sell its products. The breakdown of revenue by the direct and indirect sales channel is as follows:
Three month period ended Twelve month period ended
November 30 2010
%
August 31 2010
%
November 30 2009
%
November 30 2010
%
November 30 2009
%
Direct 36.1 46.8 63.2 49.5 65.0 Indirect 63.9 53.2 36.8 50.5 35.0
Total 100.0 100.0 100.0 100.0 100.0
Revenue by geographic region
The Company evaluates its revenue performance based on four geographic regions. The proportion of total revenue attributable to each is outlined in the following table. In situations where a reseller has purchased equipment for resale to an end customer, the location of the end customer is used in allocating revenue to the various geographic regions.
Three month period ended Twelve month period ended
November 30 2010
%
August 31 2010
%
November 30 2009
%
November 30 2010
%
November 30 2009
%
North America 28.4 37.9 45.8 41.8 52.3
Caribbean and Latin America 11.6 8.6 12.2 8.9 8.4
Europe, Middle East and Africa 17.3 27.5 23.7 22.6 25.5
Asia Pacific 42.7 26.0 18.3 26.7 13.8
Total 100.0 100.0 100.0 100.0 100.0

21
Revenue derived from major customers
“Major Customers” are customers who represent more than 10% of total revenues in a given period. Currently, the Company’s quarterly revenues can be significantly impacted by the buying patterns of any individual large customer, which can also impact the Company’s revenue split by region, sales channel and/or access technology. The Company continues to expand its number of customers and the identity of the individual service providers or resellers who are Major Customers often changes between quarters.
The following summarizes revenue from Major Customers on a quarterly basis.
Three month period ended
November 30 2010
%
August 31 2010
%
May 31 2010
%
February 28 2010
%
November 30 2009
%
Percentage of revenue Major Customers 53.9 51.0 54.4 54.3 45.6
Other customers 46.1 49.0 45.6 45.7 54.4
Total 100.0 100.0 100.0 100.0 100.0
The following chart outlines the revenue generated from Major Customers during the fourth quarter of 2010, and their respective percentages from the previous four quarters.
Three month period ended
November 30 2010
August 31 2010
%
May 31 2010
%
February 28 2010
%
November 30 2009
%
Huawei Technologies 12.0 21.6 7.4 21.6 20.3 Alcatel Lucent 13.1 14.9 0.1 0.2 0.2 Mitsubishi 28.8 9.1 15.5 7.7 12.2
Total 53.9 45.6 23.0 29.5 32.7
Huawei Technologies and Alcatel Lucent are global resellers of the Company’s solutions and Mitsubishi resells the Company’s solutions in Japan. In situations where a particular customer is a reseller who has purchased equipment for resale to an end user customer, the Company has aggregated all of the sales to that reseller in determining whether they represent more than 10% of the Company’s revenue for a particular period.
10.3 10.0 10.212.0 11.5
8.711.9 12.2
12.4 13.5
Q4 09 Q1 10 Q2 10 Q3 10 Q4 10
Revenue from Major Customers - Quarterly$CAD, in Millions
10% plus customers All other customers
3 customers
3 customers3 customers
3 customers 3 customers
31.3
58.349.9
19.8
10.5
43.9
FY 08 FY 09 FY 10
Revenue from Major Customers - Annual$CAD, in Millions
10% plus customers All other customers
2 customers
1 customer
3 customers

22
For the year ended November 30, 2010 three Major Customers represented 46.8% of total revenue respectively (2009 – one Major Customer, 15.3%):
2010
% 2009
%
Huawei Technologies 15.7 15.3 Mitsubishi 15.6 8.8 Customer A* 15.5 7.1
46.8 31.2
* it should be noted that the delineation of customer A does not necessarily correspond to such delineation in a previous MD&A. For example, “Customer A” in the current quarter is not necessarily the same customer as the one referenced as “Customer A” in any previous MD&A.
Deferred revenue
The Company enters into complex arrangements that may involve meeting customer–based specifications or multiple deliverable revenue arrangements. This may result in the deferral of revenue if the Company has not completed the customer-based specification requirements, or has not established that the delivered elements of a multiple deliverable revenue arrangement represent a separate unit(s) of accounting. Where the Company has sold post contract support, the resulting revenue is deferred and recognized rateably over the service period, which is typically one to three years. The Company does not recognize any revenue or deferred revenue related to initial support and maintenance or support and maintenance renewals until evidence of such an arrangement exists or cash in respect of such renewal is received. The breakdown of deferred revenue is as follows:
November 30 2010
$
August 31 2010
$
November 30 2009
$
In thousands of dollars
Deferred revenue: Service 8,471 9,014 6,126 Product 2,781 1,516 2,177
Total 11,252 10,530 8,303
Reported as: Current 10,530 10,069 7,513 Non-current 722 461 790
Total 11,252 10,530 8,303
Fluctuations in deferred service revenue are primarily related to the timing of significant support and maintenance renewals. Service deferred revenue decreased from August 31, 2010 levels as fewer annual support and maintenance renewals were received in the current quarter. Product deferred revenue increased from August 31, 2010 levels, primarily due to several arrangements containing customer-based specifications and/or delivered elements that do not represent a separate unit of accounting for revenue recognition purposes. The Company’s characterization of deferred revenue between current and non-current is based on management’s best estimate of when it expects to meet the criteria required to permit revenue recognition.

23
Gross margin
The following table outlines the Company’s gross margin levels for the revenue categories indicated.
Three month period ended Twelve month period ended
November 30 2010
%
August 31 2010
%
November 30 2009
%
November 30 2010
%
November 30 2009
%
Product 71.8 73.7 72.1 73.8 72.3 Service 71.8 73.8 75.3 72.6 80.1 Blended 71.8 73.8 72.8 73.5 74.2
Q4 2010 compared to Q3 2010
The blended gross margin realized in the current quarter was two percentage points lower than in the third quarter of 2010, resulting from lower product and service gross margins. Product gross margin was 71.8% in the current quarter compared to 73.7% for the third quarter of 2010. The decrease was primarily due to a higher proportion of revenue being earned through the Company’s indirect sales channel and a product mix that resulted in a lower gross margin, partially offset by a lower inventory provision. Service gross margin was 71.8% in the current quarter compared to 73.8% in the third quarter of 2010. The decrease related to certain lower-margin professional service contract engagements, partially offset by a higher gross margin on support and maintenance revenue. Q4 2010 compared to Q4 2009
The blended gross margin realized in the current quarter was one percentage point lower than in the fourth quarter of 2009, primarily resulting from a lower service gross margin. The current quarter service gross margin was 3.5 percentage points lower than for the same period in 2009. The decrease was primarily the result of an increase in professional services revenue, which typically has lower gross margins than other services, partially offset by a higher gross margin on support and maintenance revenue. 2010 compared to 2009 For the year ended November 30, 2010 the blended gross margins was 0.7 percentage points lower than last year. The decrease was the result a 7.5 percentage point decrease in service margins, primarily due to an increase in professional services revenue, which typically has lower gross margins than other services. This decrease was somewhat offset by a 1.5 percentage point increase in product gross margins, primarily due to a lower inventory provision during 2010.
72.8%74.6% 74.1% 73.8%
71.8%
Q4 09 Q1 10 Q2 10 Q3 10 Q4 10
Gross Margin, blended
3.1 2.1 3.9 4.4 4.0
10.7 14.2
12.7 13.6 14.0
Q4 09 Q1 10 Q2 10 Q3 10 Q4 10
Gross Margin$CAD, in Millions
Service Product
13.8
16.3 16.618.0 18.0
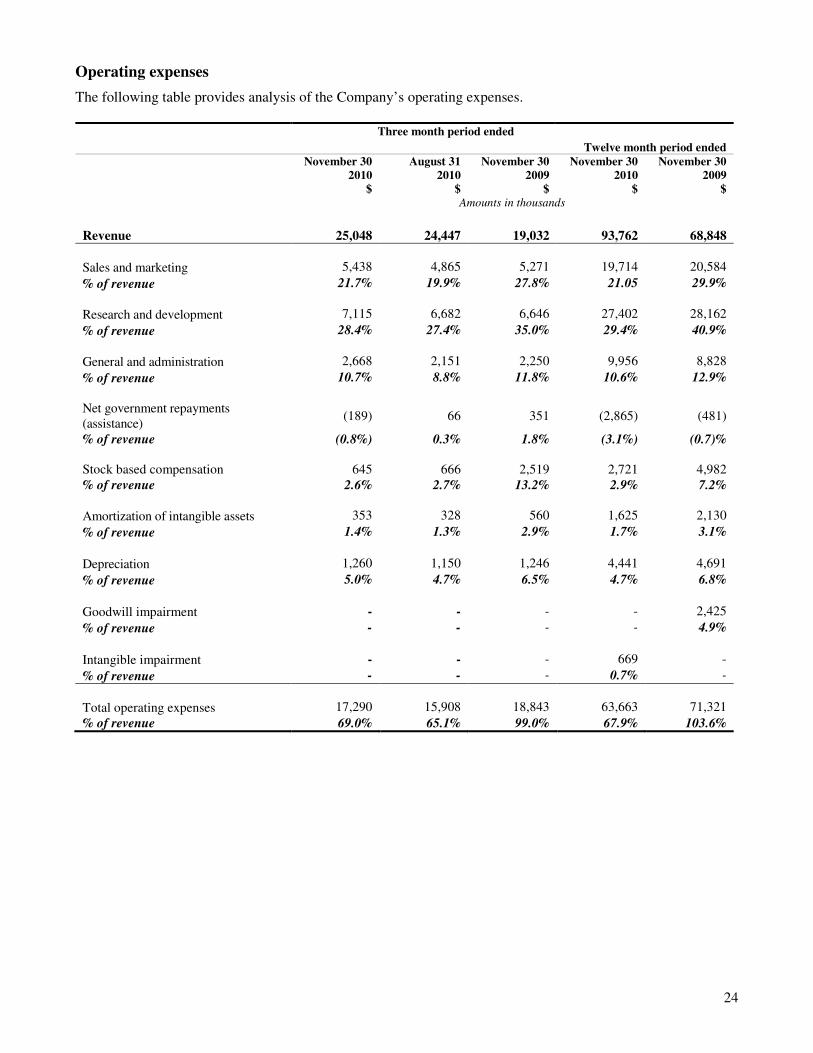
24
Operating expenses
The following table provides analysis of the Company’s operating expenses.
Three month period ended
Twelve month period ended
November 30 2010
$
August 31 2010
$
November 30 2009
$
November 30 2010
$
November 30 2009
$
Amounts in thousands
Revenue 25,048 24,447 19,032 93,762 68,848
Sales and marketing 5,438 4,865 5,271 19,714 20,584
% of revenue 21.7% 19.9% 27.8% 21.05 29.9%
Research and development 7,115 6,682 6,646 27,402 28,162
% of revenue 28.4% 27.4% 35.0% 29.4% 40.9%
General and administration 2,668 2,151 2,250 9,956 8,828
% of revenue 10.7% 8.8% 11.8% 10.6% 12.9%
Net government repayments (assistance)
(189) 66 351 (2,865) (481)
% of revenue (0.8%) 0.3% 1.8% (3.1%) (0.7)% Stock based compensation 645 666 2,519 2,721 4,982 % of revenue 2.6% 2.7% 13.2% 2.9% 7.2%
Amortization of intangible assets 353 328 560 1,625 2,130
% of revenue 1.4% 1.3% 2.9% 1.7% 3.1%
Depreciation 1,260 1,150 1,246 4,441 4,691
% of revenue 5.0% 4.7% 6.5% 4.7% 6.8%
Goodwill impairment - - - - 2,425
% of revenue - - - - 4.9%
Intangible impairment - - - 669 -
% of revenue - - - 0.7% -
Total operating expenses 17,290 15,908 18,843 63,663 71,321
% of revenue 69.0% 65.1% 99.0% 67.9% 103.6%
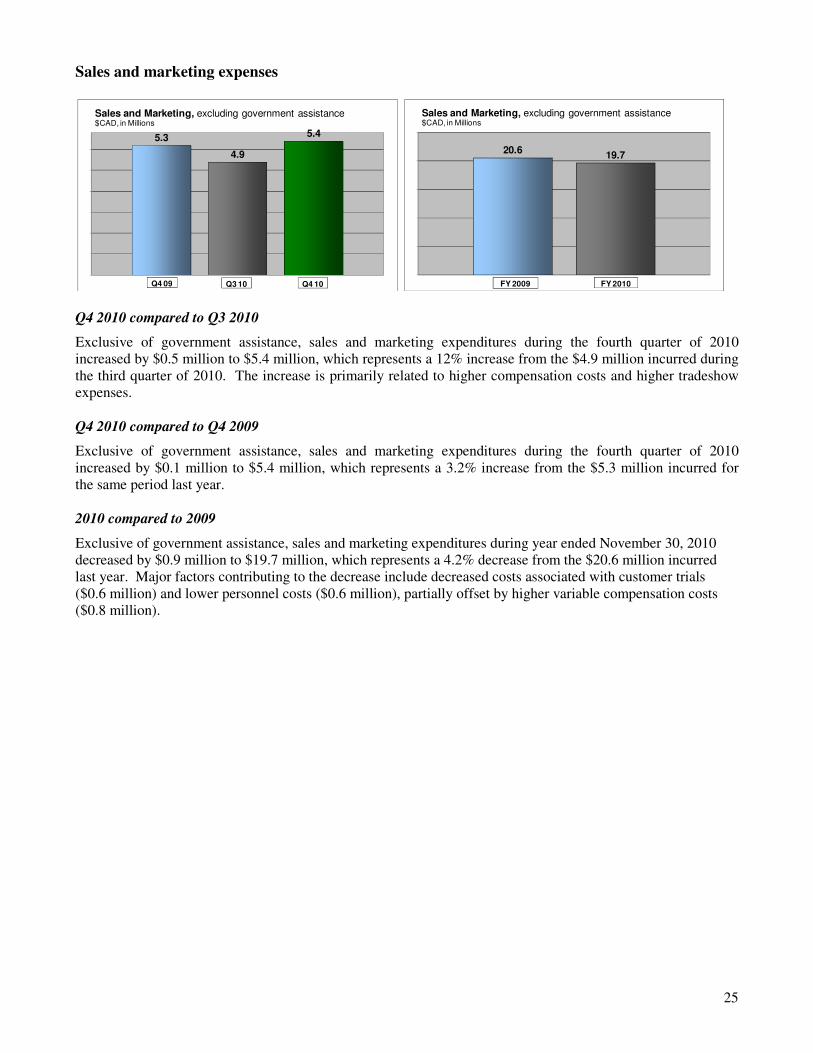
25
Sales and marketing expenses
Q4 2010 compared to Q3 2010
Exclusive of government assistance, sales and marketing expenditures during the fourth quarter of 2010 increased by $0.5 million to $5.4 million, which represents a 12% increase from the $4.9 million incurred during the third quarter of 2010. The increase is primarily related to higher compensation costs and higher tradeshow expenses. Q4 2010 compared to Q4 2009
Exclusive of government assistance, sales and marketing expenditures during the fourth quarter of 2010 increased by $0.1 million to $5.4 million, which represents a 3.2% increase from the $5.3 million incurred for the same period last year. 2010 compared to 2009
Exclusive of government assistance, sales and marketing expenditures during year ended November 30, 2010 decreased by $0.9 million to $19.7 million, which represents a 4.2% decrease from the $20.6 million incurred last year. Major factors contributing to the decrease include decreased costs associated with customer trials ($0.6 million) and lower personnel costs ($0.6 million), partially offset by higher variable compensation costs ($0.8 million).
5.3
4.9
5.4
Sales and Marketing, excluding government assistance$CAD, in Millions
Q4 09 Q3 10 Q4 10
20.619.7
Sales and Marketing, excluding government assistance$CAD, in Millions
FY 2009 FY 2010

26
Research and development expenses
Q4 2010 compared to Q3 2010
Exclusive of government assistance and repayments, research and development expenses increased by $0.4 million to $7.1 million, which represents a 6.5% increase from the $6.7 million incurred during the third quarter of 2010. Major factors contributing to the increase include higher: prototype costs ($0.2 million), personnel costs ($0.1 million) and outsourced development ($0.1 million). Q4 2010 compared to Q4 2009
Exclusive of government assistance and repayments, research and development expenses increased by $0.5 million to $7.1 million, which represents a 7.1% increase from the $6.6 million incurred during the fourth quarter of 2009. Major factors contributing to the increase include higher: prototype costs ($0.3 million) and outsourced development ($0.3 million), partially offset by lower personnel costs ($0.3 million) related to increased utilization of engineers working on revenue generating services. 2010 compared to 2009
For the year ended November 30, 2010, research and development expenses decreased by $0.8 million to $27.4 million, which represents a 2.7% decrease from the $28.2 million incurred last year. Major factors contributing to this decrease include lower personnel costs ($1.2 million) related to increased utilization of engineers working on revenue generating services and lower prototype costs ($0.5 million). These decreases were partially offset by increased certification costs relating to the PTS 24000, as well as increases in travel costs, outsourced development and embedded software maintenance.
6.6 6.7
7.1
R&D, excluding government assistance / repayments$CAD, in Millions
Q4 09 Q3 10 Q4 10
28.2 27.4
R&D, excluding government assistance / repayments$CAD, in Millions
FY 2009 FY 2010

27
General and administrative
Q4 2010 compared to Q3 2010
Exclusive of government assistance and foreign exchange gains/losses (Q4 2010: $0.2 million loss, Q3 2010: $0.2 million gain) general and administrative expenditures during the current quarter were $2.4 million, level with the prior quarter. Q4 2010 compared to Q4 2009
For the fourth quarter of fiscal 2010 general and administrative expenditures, exclusive of foreign exchange gains/losses (Q4 2010: $0.2 million loss, Q4 2009: $0.1 million loss), increased by $0.3 million to $2.4 million, which represents a 15.7% increase from the $2.1 million incurred during the fourth quarter of 2009. The increase relates to a number of small increases to several different expense categories. 2010 compared to 2009
Exclusive of government assistance and foreign exchange losses (2010: $0.5 million loss, 2009: $0.3 million loss) general and administrative expenditures increased by $1.0 million to $9.5 million, which represents an 11.2% increase from the $8.5 million incurred last year. The increase predominantly relates to personnel costs and a number of small increases to a several different expense categories.
2.1
2.4 2.4
G&A, exclusive of FX and government assistance$CAD, in Millions
Q4 09 Q3 10 Q4 10
8.5
9.5
G&A, exclusive of FX and government assistance$CAD, in Millions
FY 2009 FY 2010

28
Impact of foreign exchange on operating expenses
During the fourth quarter and year ended November 30, 2010, the Company recorded a $0.2 million loss and a $0.5 million loss respectively relating to foreign exchange (“FX”) (2009 - $0.1 million loss; $0.3 million loss). These losses are reported within the Company’s general and administrative expenses and relate primarily to realized and unrealized FX on the Company’s foreign denominated cash, accounts receivable and accounts payable. The Company also has a significant percentage of its operating expenses denominated in currencies other than Canadian dollars, including U.S. dollars and New Israeli Shekels. Changes in foreign exchange rates can cause fluctuations in the Company’s operating expenditures from period to period, and are reflected in the individual operating expense line item. A summary of these impacts is as follows: Q4 2010 compared to Q3 2010
Fluctuations in foreign exchange did not have a material impact on operating expenses when comparing the current quarter with the prior quarter. Q4 2010 compared to Q4 2009
Fluctuations in foreign exchange resulted in current quarter operating expenses being $0.3 million lower than the same quarter last year.
2010 compared to 2009
During the year ended November 30, 2010, fluctuations in foreign exchange resulted in operating expenses being $1.9 million lower than the same period last year. Government assistance and repayments Operating expenses are presented on the Company’s consolidated financial statements including the benefit of government assistance received, as well as the expense associated with recording the repayment of such assistance. The following table provides details regarding government assistance and repayments.
Three month period ended Twelve month period ended
November 30 2010
$
August 31 2010
$
November 30 2009
$
November 30 2010
$
November 30 2009
$
Amounts in thousands Assistance
Repayable - - - (792) (885)
Non-repayable (873) (598) (125) (4,670) (1,318)
(873) (598) (125) (5,462) (2,203)
Repayments 684 664 476 2,596 1,722
Net government repayments
(assistance) (189) 66 351 (2,866) (481)
During the second quarter of fiscal 2010, the Company entered into an agreement with the Province of Ontario relating to the Next Generation of Jobs Fund program. During the fourth quarter of fiscal 2010, the Company recorded $0.7 million of funding against operating expenses related to this program.

29
Amortization of intangible assets
Q4 2010 compared to Q3 2010
In connection with an acquisition completed during fiscal 2007, the Company is amortizing certain acquired intangible assets. During the fourth quarter of 2010 the Company recorded $0.2 million in amortization related to these acquired intangible assets, as compared to $0.2 million during the prior quarter. See discussion below under “Intangible impairment” for further details. Also included within current quarter amortization of intangible assets is $0.2 million of amortization related to computer software assets, compared to 0.1 million last quarter. Q4 2010 compared to Q4 2009
During the fourth quarter fiscal 2010, the Company recorded $0.2 million of amortization related to acquired intangible assets, as compared to $0.4 million during the same period last year. See discussion below under “Intangible impairment” for further details. During the current quarter, computer software amortization of $0.2 million was recorded, consistent with the same period last year. 2010 compared to 2009
During the year ended November 30, 2010, the Company recorded $1.1 million of amortization related to acquired intangible assets, as compared to $1.6 million last year. During the year ended November 30, 2010, computer software amortization of $0.5 million was recorded, consistent with last year.
Goodwill impairment
Goodwill represents the excess, at the date of acquisition, of the cost of an acquired business over the fair value of the identifiable assets acquired and liabilities assumed. Goodwill is not amortized but is subject to an annual impairment test, or more frequently if events or circumstances indicate that the fair value of a reporting unit is below its carrying amount. The impairment test requires the identification of reporting units and a comparison of the estimated fair value of each reporting unit to the carrying value recorded on the Company’s consolidated financial statements, including goodwill. Based on the Company’s review, only one reporting unit has been identified for the purpose of performing the annual impairment test. If the carrying value of the Company exceeds its fair value, the Company performs the second step of the goodwill impairment test to determine the amount of the impairment loss. The second step of the impairment test involves comparing the implied fair value of the Company's goodwill with its carrying amount to measure the amount of impairment loss, if any. The implied fair value of goodwill is determined in the same manner as the amount of goodwill recognized in a business combination. During the three months ended February 28, 2009, in connection with a sustained, significant decline of the Company’s market capitalization, as reflected by its publicly traded share price, at a level lower than the net book value of the Company, the Company concluded that an indicator of impairment was present. As a result, the Company tested goodwill for impairment in the first quarter of 2009. Under step one, the Company’s estimate of fair value is principally determined by reference to its publicly traded share price over a reasonable period of time prior to performing the impairment test. Based on the first step of the analysis, the Company determined that the carrying value of the reporting unit was in excess of its fair value. As a result, the Company performed the second step of the goodwill impairment test and determined that the fair value of the Company, including both recognized and unrecognized intangible assets, did not support the carrying amount of goodwill. Accordingly the Company recorded a non-cash goodwill impairment charge of $2.4 million during the three months ended February 28, 2009.

30
Intangible impairment
The Company’s capitalized intangible assets include acquired non-patented technology assets, which are amortized over their useful lives. Finite life intangible assets are required to be tested for recoverability whenever events or changes in circumstances indicate that their carrying amount may not be recoverable. Recoverability of a long-lived asset is estimated based on undiscounted future cash flows directly associated with its use and eventual disposition. If the results of the recovery test indicate that the asset is impaired, it is written down to its fair value. During the three months ended May 31, 2010, certain external factors resulted in changes to cash flow projections associated with a non-patented technology asset. As a result, the Company concluded that an indicator of impairment was present which required the Company to perform a recoverability test. The results of the recoverability test indicated that the non-patented technology asset (the “Asset”) was not fully recoverable. The Company used a present value technique to discount a series of expected future cash flows in order to estimate the fair value of the Asset. Accordingly the Company recorded a non-cash impairment charge of $0.7 million during the three months ended May 31, 2010. Effective July 1, 2010, the Company entered into an asset purchase agreement to sell the Asset. Under the terms of the agreement, the Company received the following non-cash consideration: preferred shares of the acquirer, the right to ongoing royalties associated with future revenues of the acquirer, and a perpetual license allowing the restricted use of the intellectual property associated with the Asset. The Company has determined that the fair value of the assets received is approximately equal to the carrying amount of the Asset, and accordingly no material gain or loss on disposal was recognized during fiscal 2010. The Company does not expect a significant change to its revenues or operating costs as a result of this transaction.
Interest and other income
Q4 2010 compared to Q3 2010
For the fourth quarter of 2010, interest and other income was $0.2 million, up from $0.1 million last quarter, primarily due to a higher investment yield, partially offset by a lower investment balance over the period. During the current quarter the annualized yield earned on the Company's investment portfolio was approximately 1.3% compared to 1.0% during the third quarter of 2010. Q4 2010 compared to Q4 2009
For the fourth quarter of 2010, interest and other income was $0.2 million, up from $0.1 million in the same period last year due to a higher investment yield, partially offset by a lower investment balance over the period. During the current quarter the annualized yield earned on the Company's investment portfolio was approximately 1.3% compared to 0.5% for the same period in 2009. 2010 compared to 2009
For the year ended November 30, 2010, interest and other income decreased by $0.2 million to $0.5 million as compared to $0.7 million last year. The decrease primarily relates to a lower investment balance over the period. During the year ended November 30, 2010, the annualized yield earned on the Company's investment portfolio was approximately 0.84%, compared to 0.85% during 2009.

31
LIQUIDITY AND CAPITAL
The Company has financed its operations and met its capital expenditure requirements primarily through the sale of equity securities.
November 30 2010
November 30 2009
Key Balance Sheet Amounts and Ratios: Thousands of dollars, except balance sheet
ratios and metrics
Cash, cash equivalents and marketable securities 90,287 85,764
Working capital 108,450 99,777
Working capital ratio 5.7:1 6.5:1
Days sales outstanding in accounts receivable 91 days 90 days
Pro forma days sales outstanding in accounts receivable 76 days 68 days
Inventory turnover 1.8 times
1.7 times
Pro forma inventory turnover 2.3 times 2.4 times
The Company uses working capital, working capital ratio, days sales outstanding in accounts receivable, pro forma days sales outstanding in accounts receivable, inventory turnover and pro forma inventory turnover as measures to enhance comparisons between periods. These terms do not have a standardized meaning under GAAP and are unlikely to be comparable to similarly titled measures reported by other issuers. The calculation of each of these items is more fully described below.
Days sales outstanding (“DSO”) - The Company has calculated DSO’s based on the most recent three months annualized revenue and the average of the beginning and ending accounts receivable balance for such three-month period. Pro forma days sales outstanding - The Company has calculated pro forma days sales outstanding in the same manner as DSO. However, the beginning and ending accounts receivable balances have been reduced for amounts which are also included in the Company’s deferred revenue balance (November 30, 2010 - $4.2 million; August 31, 2010 - $3.8 million; November 30, 2009 - $5.0 million; August 31, 2009 - $4.4 million). Inventory turnover - The Company has calculated its inventory turnover using the annualized most recent three months product cost of sales and the average of the beginning and ending inventory balance for such three month period. Pro forma inventory turnover - The Company has calculated its pro forma inventory turnover using the annualized most recent three months product cost of sales and the average of the beginning and ending inventory balances excluding demonstration inventory and deferred cost of sales inventory for such three month period (demonstration inventory: November 30, 2010 - $1.9 million; August 31, 2010 - $2.2 million; November 30, 2009 - $2.4 million; August 31, 2009 - $2.3 million) (deferred cost of sales: November 30, 2010 - $0.6 million; August 31, 2010 - $0.1 million; November 30, 2009 - $0.8 million; August 31, 2009 - $0.5 million).
Cash and cash equivalents and marketable securities
Cash and cash equivalents include cash on hand, balances with banks and short term investments that are readily convertible to known amounts of cash and are subject to an insignificant risk of change in value. Marketable securities include debt securities maturing within twelve months of the balance sheet date. Marketable securities are measured at fair value, with the changes in fair value being recognized in other comprehensive income during the period.
Investments in cash equivalents and marketable securities are governed by the Company’s investment policy guidelines as approved by the Board of Directors. The policy stipulates that investments will at all times be based on the requirements for safety, liquidity and yield in that order of importance.

32
At November 30, 2010, the Company had $90.3 million of cash on hand. The Company’s short-term investment portfolio was nil.
At November 30, 2010, the Company had $90.3 million of cash and cash equivalents, compared to $89.4 million of cash, cash equivalents and marketable securities at August 31, 2010, an increase of $0.9 million. The increase in the Company’s cash, cash equivalents and marketable securities is primarily due to $3.2 million provided by operating activities, partially offset by the use of $2.5 million for capital asset and intangible software asset acquisitions during the period.
Working capital
Working capital represents the Company’s current assets less its current liabilities. The Company’s working capital balance increased to $108.5 million at November 30, 2010 compared to $99.8 million at the end of fiscal 2009. This increase primarily relates to increases in cash, accounts receivable and inventory, which was somewhat offset by an increase in accounts payable and accrued liabilities and deferred revenue. The Company’s working capital ratio (which is its current assets divided by its current liabilities) decreased to 5.7:1 compared to 6.5:1 at November 30, 2009. The Company’s DSO’s stayed relatively consistent at 91 days, compared to 90 days reported at the end of fiscal 2009. The Company’s pro-forma DSO’s were 76 days at November 30, 2010, compared to 68 days at the end of fiscal 2009. The Company expects that pro forma DSO’s will typically be in the range of 60 – 75 days.
The Company’s inventory turnover for the current quarter was 1.8 times per year, compared to 1.7 times per year for the fourth quarter of 2009. The Company also assesses its inventory turnover on a pro forma basis, which excludes demonstration inventory and deferred cost of sales inventory. The Company’s pro forma inventory turnover was 2.3 times per year for the current quarter, compared to 2.4 times per year for the fourth quarter of 2009. The Company has historically carried relatively high levels of inventory as a result of variability in product mix, the need to secure supply of long lead time parts and a strategic decision to maintain inventory levels that permit the Company to minimize customer delivery times.
85.8
88.4
91.6 89.4 90.3
Q4 09 Q1 10 Q2 10 Q3 10 Q4 10
Cash, cash equivalents and marketable securities$CAD, in Millions

33
Cash flow
Three month period ended Twelve month period ended
November 30 2010
$
August 31 2010
$
November 30 2009
$
November 30 2010
$
November 30 2009
$
Amounts in thousands
Cash inflows and (outflows) by
activity:
Operating activities 3,175 (239) (449) 11,420 (1,105)
Investing activities 81,794 (2,359) 59 75,853 (553)
Financing activities 228 212 63 673 127
Net (decrease) in cash 85,197 (2,386) (327) 87,946 (1,531)
Cash provided by operating activities
Q4 2010 compared to Q3 2010
During the current quarter the Company generated $3.2 million of cash from operating activities as compared to using $0.2 million in the third quarter of 2010. The increase in cash flow from operations pertains primarily to the impact of changes in working capital, which can fluctuate significantly from quarter to quarter. During the current quarter, the Company had net income, adjusted for items not affecting cash, of $3.4 million (Q3 2010: $4.2 million) and used $0.2 million (Q3 2010: used $4.4 million) from changes in working capital balances. Q4 2010 compared to Q4 2009
During the current quarter the Company generated $3.2 million of cash from operating activities as compared to a use of cash of $0.5 million for the fourth quarter of 2009. During the current quarter, the Company had net income, adjusted for items not affecting cash, of $3.4 million (Q4 2009: net loss, adjusted for items not affecting cash, of $0.5 million) and used $0.2 million (Q4 2009: immaterial amount) from changes in working capital balances.
(0.5) (0.2)
3.2
Cash flow from operations$CAD, in Millions
Q4 09 Q3 10 Q4 10

34
Purchase of capital and intangible software assets
Exclusive of government assistance (Q4 2010: $0.1 million, Q4 2009: $nil), additions to capital and intangible software assets were $2.6 million during the fourth quarter of fiscal 2010, as compared to $1.4 million for the same period last year. The current quarter additions primarily relate to costs incurred to date for a new enterprise resource planning (“ERP”) system ($1.6 million). The remainder of the current period acquisitions were primarily related to continued investment in hardware equipment to support the Company’s research and development activities. Exclusive of government assistance (2010: $0.7 million, 2009: $nil), for the year ended November 30, 2010, capital and intangible software asset additions were $8.3 million, as compared to $5.8 million for the same period last year. The increase in additions primarily relate to costs incurred in 2010 for a new enterprise resource planning (“ERP”) system ($2.8 million), which include $0.4 million of internal personnel costs (2009: $nil).
During the fourth quarter of fiscal 2010, the Company capitalized $0.2 million of internally manufactured assets, as compared to $0.4 million for the same period last year. These additions predominantly relate to continued investment in hardware equipment to support the Company’s research and development activities. For the year ended November 30, 2010, capitalized internally manufactured assets totaled $2.0 million , as compared to $1.9 million for the same period last year.
Liquidity and capital resource requirements
Given the items outlined above and the Company’s performance expectations, the Company believes that it has sufficient working capital to fund its current operating and working capital requirements for at least 12 months.
Contractual obligations
The following table summarizes the Company’s contractual commitments as of November 30, 2010 and the effect those commitments are expected to have on liquidity and cash resources.
Contractual Obligations (000’s) Total Less than 1 year 1 – 3 years 4 – 5 years Beyond 5
years
Operating leases 1,062 728 334 - - Purchase obligations 630 630 - - -
Total 1,692 1,358 334 - -
The Company is required to pay royalties on its revenue streams relating to the repayment of certain government assistance. A detailed discussion of these royalty obligations is included in Note 17 of the November 30, 2010 consolidated financial statements, a copy of which can be found at www.sedar.com.
FINANCIAL INSTRUMENTS
Management of foreign exchange currency exposure is governed by the Company’s foreign exchange policy as approved by its Board of Directors. As at November 30, 2010 the majority of the Company’s cash and cash equivalents were held in CAD. On December 1, 2010, the majority of the Company’s cash and cash equivalents were converted to USD. During the fourth quarter of fiscal 2010, the Company took steps to protect itself from incurring an economic loss relating to its Canadian dollar denominated cash and cash equivalents as a result of an appreciation in the USD against the CAD prior to the Conversion Date. The Company employed a “tunnel” hedging strategy, by purchasing a CAD call option, and selling a CAD put option, both with a notional value of $72 million CAD. This strategy had the effect of ensuring the Company would receive a CAD/USD conversion rate between 1.023:1 and 1.064:1 as of the Conversion Date. This hedging strategy did not have a significant impact on the Company’s annual or fourth quarter financial statements as the spot rate at November 30, 2010 was between 1.023 and 1.064.

35
The following table summarizes the Company’s commitments to buy and sell foreign currencies under foreign exchange contracts, all of which have a maturity date of less than one year, as at November 30, 2010:
Designation Currency
Sold Currency
Bought Notional Amount
Sold Weighted Average
Rate
2010 Held for trading Call option (short) CAD USD 72,000 0.975 Put option (long) CAD USD 72,000 0.940 2009 Held for trading USD CAD 9,580 1.0581 Held for trading; cash flow hedges CAD ILS 2,566 3.4175
Management estimates that there would not be a significant impact realized if these foreign exchange contracts were terminated on November 30, 2010. The fair value of accounts receivable, other receivables, accounts payable and accrued liabilities approximates their carrying value due to the immediate or short-term maturity of these financial instruments. At November 30, 2010, the Company had a significant concentration of credit risk with three customers representing 56.5% (22.4%, 20.1 and 14.0%) of the Company’s accounts receivable (November 30, 2009; three customers representing 41.3% (17.3%, 13.3% and 10.7%)).
OUTSTANDING SHARE DATA
The Company has one class of shares consisting of an unlimited number of common shares. As of January 13, 2011, the Company has issued 136,993,123 common shares, one common share purchase warrant which entitles the holder to acquire 619,280 common shares and 10,325,425 common share options under the Company’s stock option plan (as further described in note 13 of its November 30, 2009 consolidated financial statements).
OFF BALANCE SHEET ARRANGEMENTS
The Company has entered into forward currency contracts (disclosed under “Financial Instruments” above), and letters of credit (disclosed under note 14 of the November 30, 2010 consolidated financial statements) which are considered “off-balance sheet” arrangements as that term is described in National Instrument 51-102F.
DISCLOSURE CONTROLS AND PROCEDURES
The Company’s Chief Executive Officer (“CEO”) and Chief Financial Officer (“CFO”) are responsible for establishing and maintaining disclosure controls and procedures for the Company. As such, the Company maintains a set of disclosure controls and procedures designed to ensure that information required to be disclosed in filings is recorded, processed, summarized and reported within the time periods specified in the Canadian Securities Administrators rules and forms. An evaluation of the design of and operating effectiveness of the Company’s disclosure controls and procedures was conducted as of November 30, 2010 under the supervision of the CEO and CFO as required by CSA Multilateral Instrument 52-109, Certification of Disclosure in Issuers’
Annual and Interim Filings. The evaluation included documentation, review, enquiries and other procedures considered appropriate in the circumstances. Based on that evaluation, the CEO and the CFO have concluded that such disclosure controls and procedures are effective.
INTERNAL CONTROLS AND PROCEDURES
The CEO and CFO are responsible for establishing and maintaining adequate internal control over financial reporting to provide reasonable assurance regarding the reliability of financial reporting and the preparation of financial statements for external purposes in accordance with GAAP. The Company’s management, under the supervision of the CEO and CFO have evaluated whether there were changes to the Company’s internal control over financial reporting during the interim period ended November 30, 2010 that have materially affected, or are
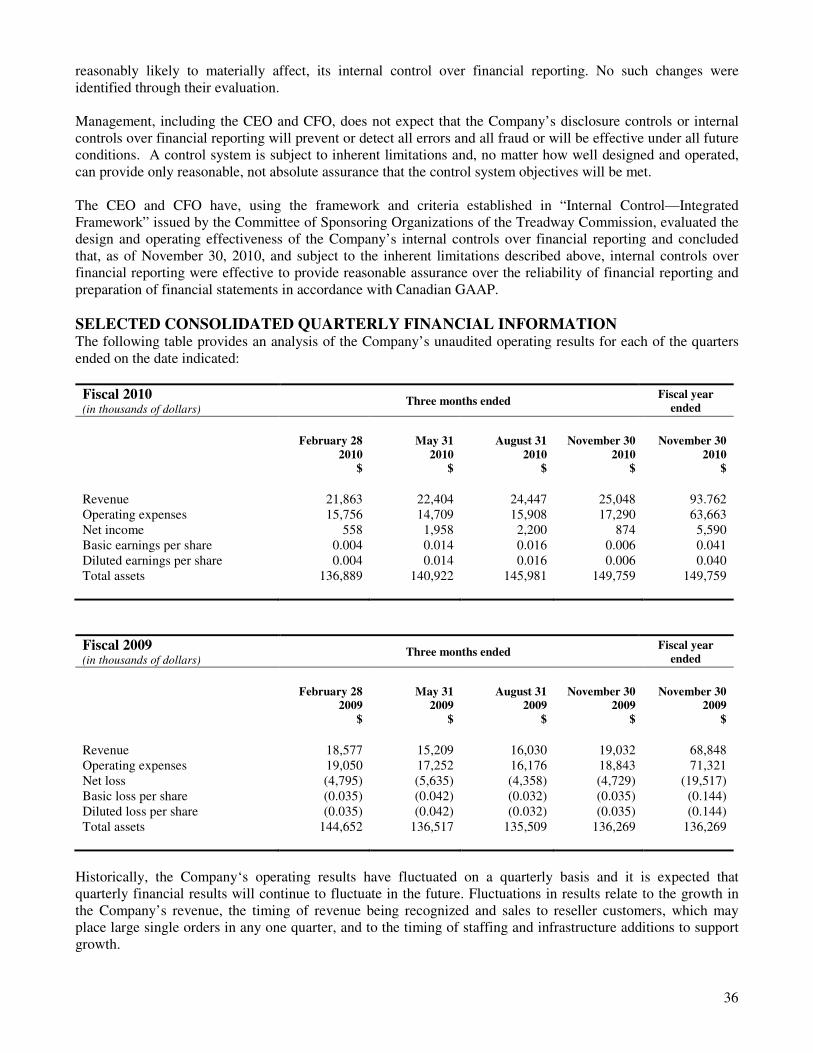
36
reasonably likely to materially affect, its internal control over financial reporting. No such changes were identified through their evaluation. Management, including the CEO and CFO, does not expect that the Company’s disclosure controls or internal controls over financial reporting will prevent or detect all errors and all fraud or will be effective under all future conditions. A control system is subject to inherent limitations and, no matter how well designed and operated, can provide only reasonable, not absolute assurance that the control system objectives will be met. The CEO and CFO have, using the framework and criteria established in “Internal Control—Integrated Framework” issued by the Committee of Sponsoring Organizations of the Treadway Commission, evaluated the design and operating effectiveness of the Company’s internal controls over financial reporting and concluded that, as of November 30, 2010, and subject to the inherent limitations described above, internal controls over financial reporting were effective to provide reasonable assurance over the reliability of financial reporting and preparation of financial statements in accordance with Canadian GAAP.
SELECTED CONSOLIDATED QUARTERLY FINANCIAL INFORMATION The following table provides an analysis of the Company’s unaudited operating results for each of the quarters ended on the date indicated:
Fiscal 2010 (in thousands of dollars)
Three months ended Fiscal year ended
February 28
2010 $
May 31 2010
$
August 31 2010
$
November 30 2010
$
November 30 2010
$
Revenue 21,863 22,404 24,447 25,048 93.762 Operating expenses 15,756 14,709 15,908 17,290 63,663 Net income 558 1,958 2,200 874 5,590 Basic earnings per share 0.004 0.014 0.016 0.006 0.041 Diluted earnings per share 0.004 0.014 0.016 0.006 0.040 Total assets 136,889 140,922 145,981 149,759 149,759
Fiscal 2009 (in thousands of dollars)
Three months ended Fiscal year ended
February 28
2009 $
May 31 2009
$
August 31 2009
$
November 30 2009
$
November 30 2009
$
Revenue 18,577 15,209 16,030 19,032 68,848 Operating expenses 19,050 17,252 16,176 18,843 71,321 Net loss (4,795) (5,635) (4,358) (4,729) (19,517) Basic loss per share (0.035) (0.042) (0.032) (0.035) (0.144) Diluted loss per share (0.035) (0.042) (0.032) (0.035) (0.144) Total assets 144,652 136,517 135,509 136,269 136,269
Historically, the Company‘s operating results have fluctuated on a quarterly basis and it is expected that quarterly financial results will continue to fluctuate in the future. Fluctuations in results relate to the growth in the Company’s revenue, the timing of revenue being recognized and sales to reseller customers, which may place large single orders in any one quarter, and to the timing of staffing and infrastructure additions to support growth.

37
HISTORICAL U.S. DOLLAR DENOMINATED FINANCIAL RESULTS As noted earlier, the Company adopted the US dollar as its functional and reporting currency effective December 1, 2010. In conjunction with adopting the US dollar as the Company’s reporting currency, historical financial statements were restated into US dollars using the current rate method. Under this method, assets and liabilities are translated at the closing rate in effect at the end of the periods reported. Revenues, expenses and cash flows are translated at the average rates in effect throughout the period, or the rates in effect at the date of the transaction for significant transactions. Any exchange differences resulting from the translation are included in Accumulated Other Comprehensive Income presented in Shareholders’ equity. The unaudited USD reporting currency supplementary information has been provided for informational purposes only to assist readers in comparing such results with results to be reported after the Conversion Date.
Sandvine Corporation
Consolidated Balance Sheets
Expressed in USD, amounts in thousands
Unaudited
As at November 30
2010 2009
Assets
Current assets
Cash and Cash Equivalents 87,949 2,218
Marketable Securities - 79,027
Accounts Receivable 25,485 19,648
Inventory 11,268 9,230
Other 3,201 1,680
127,903 111,803
Non current assets
Plant and Equipment 12,341 12,340
Intangible Assets 5,125 4,946
Goodwill - -
Other 511 -
17,977 17,286
145,880 129,089
Liabilities
Current Liabilities
Accounts Payable and Accrued Liabilities 12,005 10,166
Current Portion of Deferred Revenue 10,257 7,117
22,262 17,283
Non current liabilities
Deferred Revenue 703 748
703 748
22,965 18,031
Sahreholders' equity
Share capital 119,570 118,714
Contributed Surplus 10,007 7,680
Accumulated other comprehensive income 20,218 16,257
Deficit (26,880) (31,593)
122,915 111,058
Total Liabilities & Equity 145,880 129,089

38
Sandvine Corporation
Consolidated Statements of Operations
Expressed in USD, amounts in thousands
Unaudited
Year ended
Feb 28,
2010
May 31,
2010
Aug 31,
2010
Nov 30,
2010
Nov 30,
2010
Revenue
Product 17,797 16,380 17,607 18,658 70,442
Service 2,895 5,162 5,660 5,500 19,217
20,692 21,542 23,267 24,158 89,659
Cost of sales
Product 4,390 4,234 4,628 5,274 18,526
Service 878 1,356 1,490 1,549 5,273
5,268 5,590 6,118 6,823 23,799
Gross margin 15,424 15,952 17,149 17,335 65,860
Expenses
Sales and marketing 4,377 4,392 4,628 5,285 18,682
Research and development 6,210 5,155 6,695 7,033 25,093
General and administrative 2,349 1,938 1,893 2,380 8,560
Stock based compensation 634 727 639 631 2,631
Amortization of intangible assets 477 426 315 345 1,563
Depreciation 926 1,033 1,104 1,232 4,295
Intangible impairment - 643 - - 643
Goodwill impairment - - - - -
14,973 14,314 15,274 16,906 61,467
Income (loss) from operations 451 1,638 1,875 429 4,393
Interest and other income 47 84 112 222 465
Income (loss) before provision for
income taxes 498 1,722 1,987 651 4,858
Provision for (recovery of) income
taxes
Current 34 25 38 48 145
Future - - - - -
34 25 38 48 145
Net income (loss) 464 1,697 1,949 603 4,713
Earnings (loss) per share
Basic 0.003 0.012 0.014 0.004 0.035
Diluted 0.003 0.012 0.014 0.004 0.033
Basic weighted average number of
shares outstanding 135,830 136,006 136,466 136,724 136,256
Diluted weighted average number of
shares outstanding 139,592 141,154 140,729 141,249 140,716
Three months ended

39
Sandvine Corporation
Consolidated Statements of Operations
Expressed in USD, amounts in thousands
Unaudited
Feb 28,
2009
May 31,
2009
Aug 31,
2009
Nov 30,
2009
Nov 30,
2009
Revenue
Product 12,184 9,061 10,872 13,977 46,094
Service 3,027 4,159 3,629 3,843 14,658
15,211 13,220 14,501 17,820 60,752
Cost of sales
Product 3,097 2,637 3,125 3,903 12,762
Service 613 590 784 956 2,943
3,710 3,227 3,909 4,859 15,705
Gross margin 11,501 9,993 10,592 12,961 45,047
Expenses
Sales and marketing 4,253 4,443 4,209 4,946 17,851
Research and development 5,749 5,690 6,020 6,566 24,025
General and administrative 1,549 2,014 2,003 2,111 7,677
Stock based compensation 661 681 740 2,364 4,446
Amortization of intangible assets 403 442 483 526 1,854
Depreciation 850 979 1,088 1,169 4,086
Intangible impairment - - - - -
Goodwill impairment 1,964 - - - 1,964
15,429 14,249 14,543 17,682 61,903
Income (loss) from operations (3,928) (4,256) (3,951) (4,721) (16,856)
Interest and other income 269 111 102 77 559
Income (loss) before provision for
income taxes (3,659) (4,145) (3,849) (4,644) (16,297)
Provision for (recovery of) income
taxes
Current 38 17 24 66 145
Future 55 12 (22) (237) (192)
93 29 2 (171) (47)
Net income (loss) (3,752) (4,174) (3,851) (4,473) (16,250)
Earnings (loss) per share
Basic (0.028) (0.031) (0.028) (0.033) (0.120)
Diluted (0.028) (0.031) (0.028) (0.033) (0.120)
Basic weighted average number of
shares outstanding 135,554 135,585 135,654 135,757 135,637
Diluted weighted average number of
shares outstanding 135,554 135,585 135,654 135,757 135,637
Three months ended

40
Sandvine Corporation
Consolidated Statements of Cash Flows
Expressed in USD, amounts in thousands
Unaudited
Year ended Year ended
Nov 30,
2010
Nov 30,
2009
Cash provided by (used in)
Operating activities
Net income (loss) for the period 4,713 (16,250)
Add (deduct) non-cash items - -
Amortization 1,563 1,854
Depreciation 4,615 4,183
Foreign exchange loss (gain) 280 120
Stock-based compensation 2,631 4,446
Future income tax recovery (193)
Goodwill impairment 1,964
Intangible impairment 643 -
14,445 (3,876)
Changes in non-current balances (45) 598
Change in non-cash working capital (3,630) 2,360
10,770 (918)
-
Investing activities -
Purchase of capital and intangible software assets (7,313) (5,027)
Purchase of Marketable Securities (79,871) (408,458)
Sale of Marketable Securities 161,326 413,004
74,142 (481)
Financing activites
Proceeds from the issuance of share capital 652 115
652 115
- Effect of foreign exchange gain(loss) on cash and
cash equivalents 167 371
-
Net increase (decrease) in cash during the period 85,731 (912)
Cash and cash equivalents - beginning of the period 2,218 3,130
Cash and cash equivalents - end of period 87,949 2,218

Sandvine Corporation Consolidated Financial Statements November 30, 2010

PricewaterhouseCoopers LLP Chartered Accountants PO Box 82 Royal Trust Tower, Suite 3000 Toronto Dominion Centre Toronto, Ontario Canada M5K 1G8 Telephone +1 416 863 1133 Facsimile +1 416 365 8215 www.pwc.com/ca
“PricewaterhouseCoopers” refers to PricewaterhouseCoopers LLP, an Ontario limited liability partnership, or, as the context requires, the PricewaterhouseCoopers global network or other member firms of the network, each of which is a separate and independent legal entity.
January 12, 2011 Auditors’ Report To the Shareholders of Sandvine Corporation We have audited the consolidated balance sheets of Sandvine Corporation as at November 30, 2010 and November 30, 2009 and the consolidated statements of operations, changes in shareholders’ equity and comprehensive loss and cash flows for the years then ended. These financial statements are the responsibility of the Company’s management. Our responsibility is to express an opinion on these financial statements based on our audits. We conducted our audits in accordance with Canadian generally accepted auditing standards. Those standards require that we plan and perform an audit to obtain reasonable assurance whether the financial statements are free of material misstatement. An audit includes examining, on a test basis, evidence supporting the amounts and disclosures in the financial statements. An audit also includes assessing the accounting principles used and significant estimates made by management, as well as evaluating the overall financial statement presentation. In our opinion, these consolidated financial statements present fairly, in all material respects, the financial position of the Company as at November 30, 2010 and November 30, 2009 and the results of its operations and its cash flows for the years then ended in accordance with Canadian generally accepted accounting principles. Chartered Accountants, Licensed Public Accountants

Sandvine Corporation Consolidated Balance Sheets As at November 30, 2010 (in Canadian dollars, amounts in thousands)
2010
$ 2009
$ Assets Current assets Cash and cash equivalents 90,287 2,341 Marketable securities (note 5) - 83,423 Accounts receivable (note 9) 26,163 20,741 Inventory (note 6) 11,568 9,744 Other (note 9) 3,286 1,773
131,304 118,022
Non current assets Plant and equipment (note 7) 12,669 13,026 Intangible assets (note 8) 5,261 5,221 Other assets 525 -
18,455 18,247
149,759 136,269
Liabilities Current liabilities Accounts payable and accrued liabilities (note 9) 12,324 10,732 Current portion of deferred revenue 10,530 7,513
22,854 18,245
Non current liabilities Deferred revenue 722 790
23,576 19,035
Shareholders’ equity Share capital (note 12) 147,707 146,820 Contributed surplus 11,382 9,000 Accumulated other comprehensive loss (note 16) - (90) Deficit (32,906) (38,496)
126,183 117,234
149,759 136,269
On behalf of the Board: Roger Maggs Dave Caputo Director Director See accompanying notes to the consolidated financial statements
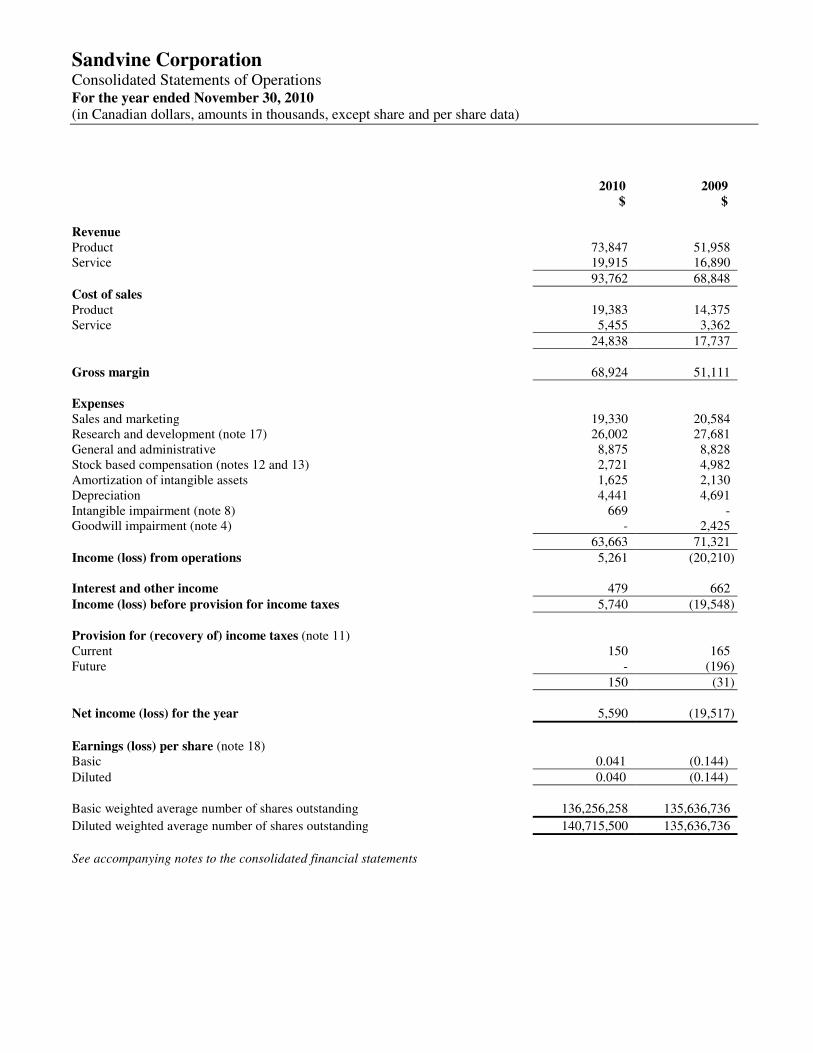
Sandvine Corporation Consolidated Statements of Operations For the year ended November 30, 2010 (in Canadian dollars, amounts in thousands, except share and per share data)
2010
$ 2009
$ Revenue Product 73,847 51,958 Service 19,915 16,890
93,762 68,848
Cost of sales Product 19,383 14,375 Service 5,455 3,362
24,838 17,737
Gross margin 68,924 51,111
Expenses Sales and marketing 19,330 20,584 Research and development (note 17) 26,002 27,681 General and administrative 8,875 8,828 Stock based compensation (notes 12 and 13) 2,721 4,982 Amortization of intangible assets 1,625 2,130 Depreciation 4,441 4,691 Intangible impairment (note 8) 669 - Goodwill impairment (note 4) - 2,425
63,663 71,321
Income (loss) from operations 5,261 (20,210) Interest and other income 479 662
Income (loss) before provision for income taxes 5,740 (19,548)
Provision for (recovery of) income taxes (note 11) Current 150 165 Future - (196)
150 (31)
Net income (loss) for the year 5,590 (19,517)
Earnings (loss) per share (note 18) Basic 0.041 (0.144)
Diluted 0.040 (0.144)
Basic weighted average number of shares outstanding 136,256,258 135,636,736
Diluted weighted average number of shares outstanding 140,715,500 135,636,736
See accompanying notes to the consolidated financial statements

Sandvine Corporation Consolidated Statements of Changes in Shareholders’ Equity and Comprehensive (Income) Loss For the year ended November 30, 2010 (in Canadian dollars, amounts in thousands)
Stated share capital
$
Contributed surplus
$ Deficit
$
Accumulated other
comprehensive income (loss)
$ Total
$ Balance, November 30, 2008 145,103 5,608 (18,979) 46 131,778
Comprehensive loss: Net loss - - (19,517) - (19,517)
Net unrealized losses on available for sale financial assets - - - (17) (17)
Net unrealized loss on derivative financial instruments designated as cash flow hedges - - - (266) (266)
Amount transferred to net loss for derivatives designated as cash flow hedges - - - 147 147
Total comprehensive loss (19,653) Stock based compensation (notes 12 and 13) 1,457 3,392 4,849 Issued as compensation on business
acquisition (note 12) 260 - - - 260
Balance, November 30, 2009 146,820 9,000 (38,496) (90) 117,234
Comprehensive loss: Net income - - 5,590 - 5,590
Net unrealized losses on available for sale financial assets - - - (29)
(29)
Net unrealized gain on derivative financial instruments designated as cash flow hedges - - - 61 61
Amount transferred to net income for derivatives designated as cash flow hedges - - - 58 58
Total comprehensive income 5,680 Stock based compensation (notes 12 and 13) 898 2,345 - - 3,243 Employee share purchase plan (note 12) (125) 37 - - (88) Issued as compensation on business
acquisition (note 12) 114 - - - 114
Balance, November 30, 2010 147,707 11,382 (32,906) - 126,183
As at November 30, 2010, the total of deficit and accumulated other comprehensive loss was $(32,906) (November 30, 2009 $(38,586)).
See accompanying notes to the consolidated financial statements

Sandvine Corporation Consolidated Statements of Cash Flows For the year ended November 30, 2010 (in Canadian dollars, amounts in thousands)
2010 $
2009 $
Cash provided by (used in) Operating activities Net income (loss) for the year 5,590 (19,517) Items not affecting cash Amortization of intangible assets 1,625 2,130 Depreciation 4,771 4,818 Foreign exchange loss 93 127 Stock-based compensation (notes 12 and 13) 2,721 4,982 Goodwill impairment (note 4) - 2,425 Future income tax recovery (note 11) - (196) Intangible impairment 669 -
15,469 (5,231) Changes in non-current balances (68) 605 Changes in non-cash working capital balances (3,981) 3,521
11,420 (1,105)
Investing activities Purchase of plant, equipment and intangible software assets (7,541) (5,789) Purchase of marketable securities (82,897) (470,411) Sale of marketable securities 166,291 475,647
75,853 (553)
Financing activities Proceeds from the issuance of share capital (note 12) 673 127
Net increase (decrease) in cash during year 87,946 (1,531) Cash and cash equivalents – beginning of year 2,341 3,872
Cash and cash equivalents – end of year 90,287 2,341
Cash and cash equivalents are represented by Balances with banks 9,582 2,099 Cash equivalents 80,705 242 See accompanying notes to the consolidated financial statements

Sandvine Corporation Notes to the Consolidated Financial Statements November 30, 2010 (in Canadian dollars, amounts in thousands, except share and per share data)
1
1 Basis of presentation
Sandvine Corporation and its subsidiary companies (collectively “the Company”) develops and markets Network
Policy Control solutions for high-speed, or “broadband”, Internet service providers. The Company’s solutions help
identify network traffic and trends and apply network policies, with the aim of enhancing the subscriber’s quality of
experience and improving the profitability of service providers.
These consolidated financial statements have been prepared by management in accordance with Canadian generally
accepted accounting principles. The significant accounting policies used in the preparation of these consolidated
financial statements are summarized below.
2 Summary of the significant accounting policies
Basis of consolidation
The consolidated financial statements include the accounts of the Company and its wholly owned subsidiaries. All
intercompany transactions and balances have been eliminated. The Company has a trust vehicle to facilitate its
employee share ownership program and hold unvested shares of the Company allocated to individual employees. This
trust is considered to be a variable interest entity and has been consolidated by the Company.
a) Business Combinations
The Company allocates the purchase price of a business acquisition to tangible assets, intangible assets and liabilities
based on their estimated fair values at the date of acquisition with the excess of purchase price amount over these fair
values being allocated to goodwill.
Contingent consideration associated with any business acquisition is reviewed to determine if it should be accounted
for as an adjustment of the purchase price or as compensation for services rendered subsequent to the acquisition.
When the contingent consideration is related to an adjustment of purchase price and the amount of any contingent
consideration can be reasonably estimated at the date of acquisition and the outcome of the contingency can be
determined beyond reasonable doubt, the contingent consideration is recognized at that date as part of the cost of the
purchase. When the contingent consideration is related to compensation for services, the additional consideration is
recognized as compensation expense based on management’s best estimate of the outcome of the performance
condition related to the payment of the contingent consideration.
Sandvine Corporation Notes to the Consolidated Financial Statements November 30, 2010 (in Canadian dollars, amounts in thousands, except share and per share data)
2
b) Cash and cash equivalents
Cash and cash equivalents include cash on hand, balances with banks and short-term investments that have maturity
dates of less than 90 days at acquisition and that are readily convertible to cash. All cash and cash equivalents are
classified as held for trading. These instruments are accounted for at fair value.
c) Marketable securities
Marketable securities include interest bearing securities with original maturities of greater than three months and
remaining maturities of less than one year. All marketable securities are classified as available-for-sale and are
initially measured at settlement date. The marketable securities are recorded at fair value. Subsequent changes in fair
value are accounted for through accumulated other comprehensive income until such investments mature or are sold.
Related interest income is included in “Interest and other income” on the consolidated statement of operations.
The Company assesses declines in the value of individual investments for impairment to determine whether the
decline is other-than temporary. The Company makes this assessment by considering available objective evidence,
including changes in specific industry and individual company data, the length of time and the extent to which the fair
value has been less than cost, the financial condition and the near-term prospects of the individual investment. In the
event that a decline in the fair value of an investment occurs and the decline in value is considered to be other than
temporary, an impairment charge is recorded in the consolidated statement of operations and a new cost basis in the
investment is established.
d) Inventory
Raw materials, work-in-process, deferred cost of sales and demonstration systems are stated at the lower of cost and
net realizable value. Net realizable value is the estimated selling price less applicable selling costs and estimated costs
of completion. The cost of raw materials is determined using the first-in, first-out method. The cost of work in
progress, deferred cost of sales and demonstration systems are assigned by specific identification of their individual
costs. Cost includes all costs of purchase, costs of conversion and other costs incurred in bringing the inventories to
their present location and condition. The allocation of fixed production overheads is based on the normal production
capacity of the production facilities.
e) Investments
Investments in companies where the Company has less than a 20% ownership interest and does not exercise significant
influence are accounted for by the cost method. The Company regularly reviews the carrying value of its investments to
determine whether a decline other than temporary in nature has occurred. When such declines have occurred, investments
are written down to reflect the impairment.
f) Income taxes
The Company follows the liability method of tax allocation to account for income taxes. Under this method, future
tax assets and liabilities are determined based upon the difference between the financial reporting and tax basis of
assets and liabilities, and measured using the substantively enacted tax rates and laws that will be in effect when the
differences are expected to reverse. A valuation allowance is recorded against any future income tax assets if it is

Sandvine Corporation Notes to the Consolidated Financial Statements November 30, 2010 (in Canadian dollars, amounts in thousands, except share and per share data)
3
more likely than not that the asset will not be realized. The Company does not provide for income taxes on
undistributed earnings of foreign subsidiaries that are not expected to be repatriated in the foreseeable future.
g) Plant and equipment
Plant and equipment are recorded at cost less accumulated depreciation. Depreciation is provided using the following
rates and methods:
Computer hardware 30- 50% declining balance
Furniture and fixtures 20% declining balance
Leasehold improvements Straight-line basis over relevant lease term
h) Intangible Assets
Intangible assets are comprised of computer software, as well as acquired non-patented technology purchased through
the Company’s business acquisitions.
Computer software is recorded at cost less accumulated amortization. Computer software assets are amortized on a
declining balance basis using rates of 30 – 50%.
Acquired non-patented technology assets are initially recorded at fair value based on the estimated net present value of
future cash flow streams associated with these technologies, and are amortized on a straight line basis over their
estimated useful life of three to five years.
i) Impairment of long-lived assets
The Company reviews long-lived assets for impairment whenever events or changes in circumstances indicate that the
carrying amount may not be recoverable. If the total of the expected undiscounted future cash flows is less than the
carrying amount of the asset, a loss is recognized for the excess of the carrying amount over the fair value of the asset.
j) Research and development
The Company is engaged in research and development activities. Research and development costs, other than plant
and equipment acquisitions, are charged as an operating expense of the Company as incurred, unless they meet
generally accepted accounting criteria for capitalization. To date, no development costs have met the criteria for
capitalization.
k) Revenue Recognition
Revenue is derived primarily from the sales of network equipment (including embedded software), application software,
consulting services and support and maintenance contracts for its network policy control solutions.

Sandvine Corporation Notes to the Consolidated Financial Statements November 30, 2010 (in Canadian dollars, amounts in thousands, except share and per share data)
4
The Company recognizes revenue when persuasive evidence of an arrangement exists, delivery has occurred, the fee is
fixed or determinable, and collectability is reasonably assured. Generally, where final acceptance of the product, system,
or solution is specified by the customer, revenue is deferred until all acceptance criteria have been met unless the
Company can reliably demonstrate its ability to meet the customer specified acceptance criteria. The Company typically
does not provide for a right of return to its customers.
Revenue for network equipment is generally recognized when the product is shipped and all other revenue recognition
criteria, as described above, have been satisfied. Certain software is licensed to customers on a perpetual or per-use basis.
Revenue from perpetually licensed software is recognized at the inception of the license term if all other revenue
recognition criteria, as described above, have been satisfied. Revenues for software licenses which are paid for on a per-
use basis are recognized at the time a reliable estimate can be made of actual revenues generated from usage. Support and
maintenance revenue is deferred and recognized ratably over the period during which the services are to be performed,
which is typically one year. Revenue from consulting services is recognized as services are delivered, for time and
material contracts, and using the percentage of completion method for fixed price contracts. If there is a significant
uncertainty about the project completion, receipt of payment or required effort, revenue is deferred until the uncertainty is
resolved. The Company estimates the percentage of completion on contracts with fixed fees using hours incurred as a
percentage of total estimated hours to complete the consulting service. When total cost estimates exceed estimated
revenues, the Company will accrue for the estimated losses immediately.
Revenue recognition for arrangements with multiple units of accounting (note 3)
The Company enters into revenue arrangements that may consist of multiple deliverables of network equipment,
application software, consulting services and support and maintenance. Typically the Company’s network equipment and
application software are delivered together with support and maintenance being provided over subsequent reporting
periods. In arrangements including consulting services, these services are generally concluded in a subsequent reporting
period.
Each deliverable within a multiple deliverable revenue arrangement is accounted for as a separate unit of accounting if
both of the following criteria are met: (1) the delivered item has value to the customer on a stand-alone basis, and (2) if
the arrangement includes a general right of return relative to the delivered element, and delivery or performance of the
undelivered item is considered probable and substantially in the control of the Company. The Company’s customers
typically purchase a combination of network equipment and at least one application software license. The combination of
network equipment and a single application software license will generally form one unit of accounting when a specific
order includes both elements. However, as both the network equipment and application software licenses are typically
delivered concurrently, this assessment will generally not impact the timing of revenue recognition. In addition, if
consulting services are considered to be critical to the functionality of the delivered product in a specific revenue
arrangement, the product revenue and the related consulting services are considered to be one unit of accounting.
Arrangement consideration is allocated to all units of accounting based on their relative selling price, except support
and maintenance revenues which are recognized based on the customer’s stated renewal rate. Since neither vendor-
specific objective evidence (“VSOE”) nor third-party evidence (“TPE”) can be established for its hardware,
application software and consulting services, the Company is required to use best estimate of the selling price
(“BESP”) for those deliverables. The Company determines BESP for a product or service by considering multiple
factors including, but not limited to, ongoing pricing strategy and policies, market conditions and historical pricing

Sandvine Corporation Notes to the Consolidated Financial Statements November 30, 2010 (in Canadian dollars, amounts in thousands, except share and per share data)
5
practices. BESP will be reassessed annually unless required by changes in business practices or new product
introductions.
l) Earnings (loss) per share
Basic earnings (loss) per share is computed by dividing net earnings (loss) by the weighted average number of
common shares and common share warrants outstanding during the year. Diluted earnings (loss) per share represents
the amount of earnings available or loss attributable to each common share and each potential common share, if
dilutive, outstanding during the year and is calculated using the treasury stock method.
m) Stock-based compensation plans
The Company has a stock-based compensation plan, which is described in note 13. In accordance with CICA
Handbook Section 3870, Stock-based Compensation and Other Stock-based Payments, awards granted on or after
December 1, 2003 are accounted for using the fair value method of accounting, whereby the Company recognizes
compensation expense equal to the fair value of the award over its vesting period. The fair value of awards is
determined using the Black-Scholes option pricing model. On the exercise of stock options, the consideration paid
and any related compensation expense recorded through contributed surplus, is credited to share capital.
The Company has an employee share ownership program which allows employees to voluntarily participate in a share
purchase plan. Under the terms of the plan, the employees can contribute up to a specified percentage of their salary.
Subject to certain conditions the Company will match a percentage of the employee’s contributions. All contributions
are used by the plan’s trustee to purchase common shares in the open market. The Company’s contributions are
recognized over the vesting period for the underlying shares.
n) Government assistance
Government assistance towards research and development expenditures received in the form of investment tax credits
on account of eligible expenditures is recorded when there is reasonable assurance that the Company will realize the
assistance. Investment tax credits related to the acquisition of plant and equipment used for research and development
is credited against the related plant and equipment, while other investment tax credits are credited against related
expenses as incurred.
The Company participates in other government programs which include both non-repayable and repayable
government assistance (fully described in note 17). Assistance related to these programs is recorded in the same
method as investment tax credits, as described above. For repayable government programs, repayments are based on
certain revenue streams. Repayments are charged to income when the related sale is recorded.

Sandvine Corporation Notes to the Consolidated Financial Statements November 30, 2010 (in Canadian dollars, amounts in thousands, except share and per share data)
6
o) Use of estimates
The preparation of these consolidated financial statements, in conformity with Canadian generally accepted
accounting principles, requires management to make estimates and assumptions that affect the amounts reported in the
consolidated financial statements and accompanying notes. In particular, significant estimates include those related to
revenue recognition, the valuation of inventory, income taxes, valuation allowance related to future income taxes,
investment tax credits, impairment of long lived and intangible assets, fair value of reporting units, determination of
estimated useful lives of intangible assets and plant and equipment, allowances for accounts receivable and valuation
assumptions related to stock based compensation. Actual results could differ from these estimates.
p) Financial instruments
The Company classifies its financial instruments as held for trading, available for sale, loans and receivables or other
financial liabilities. Financial assets that are purchased and acquired with the intention of generating profits in the
near term are classified as held for trading. These instruments are accounted for at fair value with the change in fair
value recognized in net income. Financial assets classified as available for sale are carried at fair value with the
changes in fair value recorded in other comprehensive income until such investments mature, are sold, or an
impairment charge has been recognized. Loans and receivables and other financial liabilities are accounted for at
amortized cost.
q) Hedges
The Company may enter into forward contracts to reduce its exposure to fluctuations in foreign exchange rates. The
Company does not use any derivative financial instrument for speculative purposes. Designation as a hedge is only
allowed if, both at the inception of the hedge and throughout the hedge period, the changes in the fair value of the
derivative financial instruments are expected to substantially offset the changes in the fair value of the hedged item
attributable to the underlying risk exposure. The Company has elected to apply hedge accounting for certain forward
foreign exchange contracts used to manage foreign currency exposure on anticipated operational expenditures and has
designated these as cash flow hedges.
For cash flow hedges which meet the criteria for hedge accounting, the effective portion of the change in fair value of
the derivative are initially recorded in other comprehensive income and are reclassified to the consolidated statements
of operations in the same period that the hedged anticipated transaction affects earnings. Any ineffective portion of
the gain or loss on the derivative is recognized in income immediately. Hedge accounting is discontinued
prospectively when it is determined that the hedging relationship is no longer effective, the derivative is terminated or
sold, or the Company terminates its designation of the hedging relationship.
The Company formally documents all relationships between the hedging instruments and hedged items. This process
includes linking all derivatives to forecasted foreign currency cash flows or to a specific asset or liability. The
Company also formally documents and assesses, both at the hedge’s inception and on an ongoing basis, whether the
derivative financial instruments that are used in the hedging transactions are highly effective in offsetting the changes
in the cash flows of the hedged items.

Sandvine Corporation Notes to the Consolidated Financial Statements November 30, 2010 (in Canadian dollars, amounts in thousands, except share and per share data)
7
The fair value of these derivatives is included in “Other” when in an asset position and in “Accounts payable and
accrued liabilities” when in a liability position. Gains or losses arising from hedging activities are reported in the same
caption on the consolidated statements of operations as the hedged item.
r) Embedded derivatives
Embedded derivatives are treated as separate derivatives when their economic characteristics and risks are not clearly
and closely related to those of the host instrument, the terms of the embedded derivative are the same as those of a
stand-alone derivative, and the combined contract is not held for trading or designated at fair value. These embedded
derivatives are initially measured at fair value with subsequent changes in fair value recognized in earnings.
s) Foreign currency translation
The parent Company maintains its accounts in Canadian dollars. The accounts of the Company’s foreign subsidiaries
are maintained in the local currency where the subsidiary is incorporated. The Company’s foreign subsidiaries are
considered to be integrated operations. Accordingly, the foreign operations are translated to Canadian dollars using
the temporal method. As such, monetary assets and liabilities are translated using the exchange rates in effect at the
consolidated balance sheet date and non-monetary assets and liabilities at historical exchange rates. Revenue and
expense items have been translated using the average exchange rate prevailing during the year. The gains and losses
resulting from changes in exchange rates are recognized in the consolidated statement of operations.
t) Recently issued accounting standards
In January 2009, the CICA issued Section 1582, Business Combinations, replacing Section 1581, Business
Combinations. This section establishes the standards for the accounting of business combinations, and states that all
assets and liabilities of an acquired business will be recorded at fair value at the acquisition date. The standard also
states that acquisition-related costs will be expensed as incurred and that restructuring charges will be expensed in the
periods after the acquisition date. This new Section will be applicable to financial statements relating to fiscal years
beginning on or after January 1, 2011. Earlier adoption is permitted. The Company is evaluating the impact of
adopting this new standard in connection with its conversion to International Financial Reporting Standards (“IFRS”).
In January 2009, the CICA issued Section 1601, Consolidated Financial Statements, which replaces the existing
standards. This section establishes the standards for preparing consolidated financial statements and is effective for
fiscal years beginning on or after January 1, 2011. Earlier adoption is permitted. The Company is evaluating the
impact of adopting this new standard in connection with its conversion to International Financial Reporting Standards
(“IFRS”).

Sandvine Corporation Notes to the Consolidated Financial Statements November 30, 2010 (in Canadian dollars, amounts in thousands, except share and per share data)
8
3 Changes in accounting policies
Multiple deliverable revenue arrangements
Effective December 1, 2009, the Company adopted EIC 175, Multiple Deliverable Revenue Arrangements, (“New
Accounting Standard”) replacing EIC 142, Revenue Arrangements with Multiple Deliverables (“Old Accounting
Standard”). This abstract was amended to (1) provide updated guidance on whether multiple deliverables exist, how
the deliverables in an arrangement should be separated, and the manner in which consideration should be allocated to
each deliverable; (2) provide that in situations where a vendor does not have vendor-specific objective evidence
(“VSOE”) or third-party evidence (“TPE”) of selling price, require that the entity allocate revenue in an arrangement
using estimated selling prices of deliverables; (3) eliminate the use of the residual method and require an entity to
allocate revenue using the relative selling price method; and (4) require expanded qualitative and quantitative
disclosures regarding significant judgments made in applying this guidance. The Company has elected to early adopt
this abstract prospectively to revenue arrangements with multiple deliverables entered into or materially modified on
or after December 1, 2009. Arrangements that were entered into prior to December 1, 2009 will continue to be
accounted for under the Old Accounting Standard.
Under Old Accounting Standards, the Company was typically unable to establish objective and reliable evidence of
fair value for its network equipment, application software and consulting service deliverables. In situations when the
Company was not able to establish objective and reliable evidence of fair value for all deliverables of the
arrangement, but was able to establish fair value for all undelivered elements, revenue was allocated using the residual
method. Under the residual method, the amount of revenue allocated to delivered elements equals the total
arrangement consideration less the aggregate fair value of any undelivered elements. Generally, the only undelivered
element in the Company’s arrangements was post contract support (often referred to as support and maintenance
services). As the Company had established objective and reliable evidence of fair value for its support and
maintenance services, revenue related to the network equipment and application software deliverables would be
recognized once they had been delivered and all other revenue recognition criteria had been met. When hardware or
software elements were undelivered in a revenue arrangement, all of the revenue was typically deferred until these
products or services had been delivered. The entire value of an arrangement which included consulting services were
generally deferred until the consulting services were delivered as the Company had concluded that objective and
reliable evidence of fair value was not available for its consulting services nor was the company able to reliably
estimate effort required.
Under the New Accounting Standard, each deliverable within a multiple deliverable revenue arrangement is
accounted as a separate unit of accounting if both of the following criteria are met: (1) the delivered item has value to
the customer on a stand-alone basis and (2) if the arrangement includes a general right of return relative to the
delivered element, delivery or performance of the undelivered item is considered probable and substantially in the
control of the vendor. The Company’s customers typically purchase a combination of network equipment and at least
one application software license. The combination of network equipment and a single application software license will
generally form one unit of accounting when a specific order includes both elements. However, as both the network
equipment and application software licenses are typically delivered concurrently, this assessment will generally not
impact the timing of revenue recognition. In addition, if consulting services are included in the arrangement and are
considered to be critical to the functionality of the delivered product within that arrangement, the particular product
revenue and the related consulting services are considered to be one unit of accounting. The Company’s revenue
arrangements generally do not include a general right of return relative to delivered products.

Sandvine Corporation Notes to the Consolidated Financial Statements November 30, 2010 (in Canadian dollars, amounts in thousands, except share and per share data)
9
Furthermore, the Company is now required to allocate arrangement consideration to all units of accounting based on
their relative selling price. The New Accounting Standard establishes a hierarchy for determining the estimated
selling price for a deliverable which includes (1) VSOE, if available, (2) TPE of selling price, if VSOE is unavailable,
and (3) best estimate of the selling price (“BESP”) if neither VSOE nor TPE is available. VSOE is generally limited
to the price charged when the same or similar product is sold separately. If a product or service is seldom sold
separately, it is unlikely the Company can determine VSOE. TPE is determined based on competitor prices for
similar deliverables when sold separately. As the Company is either unable to identify similar competitor products
and services, or what the competitors’ selling prices are on a stand-alone basis, the Company did not have sufficient
information to substantiate TPE. Since neither VSOE nor TPE can be established for its hardware, application
software and consulting services, the Company is required to use its best estimate of the selling price (“BESP”) for
those deliverables.
In general, the impact of the New Accounting Standard will be to accelerate recognition of revenue in arrangements
with undelivered network equipment, application software and consulting services when the delivered hardware and
application software are separate units of accounting.
The following table shows revenues as reported and pro forma revenues that would have been reported during the year
ended November 30, 2010, if the transactions entered into or materially modified on or after December 1, 2009 were
subject the Old Accounting Standards.
2010
$ 2010
$
As reported
Pro-forma
based on previous
accounting standards
Revenue Product 73,847 71,511 Service 19,915 18,530
93,762 90,041

Sandvine Corporation Notes to the Consolidated Financial Statements November 30, 2010 (in Canadian dollars, amounts in thousands, except share and per share data)
10
4 Goodwill
Goodwill represents the excess, at the date of acquisition, of the cost of an acquired business over the fair value of the
identifiable assets acquired and liabilities assumed. Goodwill is not amortized but is subject to an annual impairment
test or more frequently if events or circumstances indicate that the fair value of a reporting unit is below its carrying
amount. The impairment test requires the identification of reporting units and a comparison of the estimated fair value
of each reporting unit to the carrying value recorded on the Company’s consolidated financial statements, including
goodwill. Based on the Company’s review, only one reporting unit has been identified for the purpose of performing
the annual impairment test. If the carrying value of the Company exceeds its fair value, the Company performs the
second step of the goodwill impairment test to determine the amount of the impairment loss. The second step of the
impairment test involves comparing the implied fair value of the Company's goodwill with its carrying amount to
measure the amount of impairment loss, if any. The implied fair value of goodwill is determined in the same manner as
the amount of goodwill recognized in a business combination.
During the first quarter of fiscal 2009, in connection with a sustained, significant decline of the Company’s market
capitalization at a level lower than its net book value, the Company concluded that an indicator of impairment was
present. As a result, the Company tested goodwill for impairment in the first quarter of 2009. Under step one, the
Company’s estimate of fair value was principally determined by reference to its externally traded share price over a
reasonable period of time prior to performing the impairment test. Based on the first step of the analysis, the Company
determined that the carrying value of the reporting unit was in excess of its fair value. As a result, the Company
performed the second step of the goodwill impairment test and determined that the fair value of the Company, including
both recognized and unrecognized intangible assets, did not support the carrying amount of goodwill. Accordingly the
Company recorded a non-cash goodwill impairment charge of $2,425 during the year ended November 30, 2009.
5 Marketable securities
Marketable securities include the following:
2010
$ 2009
$
Canadian dollar bonds, debentures and interest bearing securities - 83,423
- 83,423
As at November 30, 2010, net unrealized cumulative gains/losses of $nil have been recorded in accumulated other
comprehensive income for bonds, debentures and interest bearing securities (2009 - $29).

Sandvine Corporation Notes to the Consolidated Financial Statements November 30, 2010 (in Canadian dollars, amounts in thousands, except share and per share data)
11
6 Inventory
Inventory includes the following:
2010
$ 2009
$
Raw materials 7,092 5,820 Work-in-process 1,995 712 Deferred cost of sales 552 818 Demonstration systems 1,929 2,394
11,568 9,744
During the year ended November 30, 2010, the amount of inventory recognized as an expense and included in product
cost of sales was $19,033 (2009 - $14,101). During the year ended November 30, 2010, the Company recognized an
inventory write down of $1,083 relating to its inventory balances (2009 - $2,234), and reversed previously recognized
write downs of $513 (2009 - $51) relating to sales volumes in excess of forecasts used when the inventory write down
occurred.
7 Plant and equipment
Cost
$
Accumulated Depreciation
$ 2010
$
Computer hardware 27,634 16,600 11,034 Furniture and fixtures 1,136 621 515 Leasehold improvements 1,690 570 1,120
30,460 17,791 12,669
Cost
$
Accumulated Depreciation
$ 2009
$
Computer hardware 23,602 12,291 11,311 Furniture and fixtures 1,062 501 561 Leasehold improvements 1,501 347 1,154
26,165 13,139 13,026

Sandvine Corporation Notes to the Consolidated Financial Statements November 30, 2010 (in Canadian dollars, amounts in thousands, except share and per share data)
12
8 Intangible assets
Cost
$
Accumulated Amortization
$ 2010
$
Computer software 6,597 2,869 3,728 Non-patented technology assets 4,229 2,696 1,533
10,826 5,565 5,261
Cost
$
Accumulated Amortization
$ 2009
$
Computer software 3,664 2,543 1,121 Non-patented technology assets 7,967 3,867 4,100
11,631 6,410 5,221
During the second quarter of fiscal 2010, certain external factors resulted in changes to cash flow projections associated
with a non-patented technology asset (the “Technology Asset”). As a result, the Company concluded that an indicator
of impairment was present which required the Company to perform a recoverability test. The results of the
recoverability test indicated that the Technology Asset was not fully recoverable. The Company used a present value
technique to discount a series of expected future cash flows in order to estimate the fair value of the Technology Asset.
Accordingly the Company recorded a non-cash impairment charge of $669 during the year ended November 30, 2010.
On July 1, 2010, the Company entered into an asset purchase agreement to sell the Technology Asset, which had a
carrying value of $1,105. Under the terms of the agreement, the Company received the following non-cash
consideration: preferred shares of the acquirer, the right to ongoing royalties associated with future revenues of the
acquirer, and a perpetual license allowing the restricted use of the intellectual property associated with the Technology
Asset. The Company determined that the fair value of the assets received was approximately equal to the carrying
amount of the Technology Asset, and accordingly no material gain or loss was recognized on disposal.
During the year ended November 30, 2010, the Company capitalized $2,827 (2009 – nil) relating to the ongoing
implementation of a new Enterprise Resource Planning (“ERP”) system. Of this amount, $399 relates to internally
capitalized costs. As at November 30, 2010, no amortization had been recorded relating to the ERP asset as it is not ready
for use.

Sandvine Corporation Notes to the Consolidated Financial Statements November 30, 2010 (in Canadian dollars, amounts in thousands, except share and per share data)
13
9 Financial Instruments
a) Categories of financial assets and liabilities
Under Canadian generally accepted accounting principles, financial instruments are classified into one of the following
categories: held for trading, held-to-maturity, available-for-sale, loans and receivables and other financial liabilities.
The following table summarizes information regarding the carrying values of the Company’s financial instruments:
2010 $
2009 $
Held for trading Cash and cash equivalents 90,287 2,341 Derivatives designated as held for trading – gain / (loss) * (20) 6 Derivatives designated as cash flow hedges – gain / (loss) * - (119) Available-for-sale Marketable securities - 83,423 Loans and receivables Accounts receivable 25,705 20,741 Other receivables 2,359 776 Other financial liabilities Accounts payable and accrued liabilities 12,324 10,487 (*) Derivative financial instruments have been included in other current assets or accounts payable and accrued liabilities on the Company’s consolidated balance sheet.
b) Fair value
The estimated fair values of accounts receivable, other receivables, accounts payable and accrued liabilities
approximate their respective carrying values due to the short period to maturity. For fair value estimates relating to
cash & cash equivalents, derivatives and marketable securities (described below), the Company classifies its fair value
measurements within a fair value hierarchy, which reflects the significance of the inputs used in making the
measurements as defined in CICA Handbook section 3862 – Financial Instruments – Disclosures.
Level 1 - Unadjusted quoted prices at the measurement date for identical assets or liabilities in active markets.
Level 2 - Observable inputs other than quoted prices included in Level 1, such as quoted prices for similar assets and
liabilities in active markets; quoted prices for identical or similar assets and liabilities in markets that are not active; or
other inputs that are observable or can be corroborated by observable market data.
Level 3 - Significant unobservable inputs which are supported by little or no market activity.

Sandvine Corporation Notes to the Consolidated Financial Statements November 30, 2010 (in Canadian dollars, amounts in thousands, except share and per share data)
14
The fair value hierarchy also requires an entity to maximize the use of observable inputs and minimize the use of
unobservable inputs when measuring fair value.
The Company’s cash and cash equivalents are classified within Level 1 because they are based on unadjusted quoted
prices of identical assets in active markets.
The Company’s derivative financial instruments typically include foreign exchange forward contracts, embedded
derivatives. The fair values of currency forward contracts and embedded derivatives are based upon the difference
between the forward exchange rate and the contract rate. At November 30, 2010 the Company’s derivatives also
included foreign currency call and put options. The Company’s foreign exchange forward contracts, embedded
derivatives and call/put options are classified within Level 2 because they are based on foreign currency rates quoted by
banks and other public data sources.
The fair value of marketable securities are classified within Level 2 because they are based on quoted prices for similar
assets in active markets, and/or observable inputs such as interest rates. No net unrealized cumulative gains were
recorded in accumulated other comprehensive income as at November 30, 2010 as no marketable securities were held
(November 30, 2009 - $29). During the current period, no material realized gains or losses have been recognized in the
consolidated statement of operations on the Company’s marketable securities.
c) Risks arising from financial instruments and risk management
The Company is exposed to financial risks that may potentially impact its operating results including market risks
(foreign exchange rate and interest rate risks), credit risk and liquidity risk. The Company’s overall risk management
program focuses on the unpredictability of financial markets and seeks to minimize potential adverse effects on the
Company’s financial performance.
Foreign currency risk
The Company’s financial results are reported in Canadian dollars. The Company transacts business in multiple
currencies, the most significant of which are the Canadian dollar, the U.S. dollar, the Euro, the Great British Pound and
the New Israeli Shekel. As a result, the Company has foreign currency exposure with respect to items denominated in
foreign currencies. The Company’s objective with regard to its foreign currency risk is to minimize the impact of
foreign exchange movements on the Company’s consolidated financial statements.
The Company generates the majority of its revenues in major foreign currencies, primarily the U.S. dollar, which
exceed the natural hedge provided by expenditures in those currencies. In order to manage this net foreign currency
exposure the Company enters into forward foreign exchange contracts. The timing and amount of these forward
foreign exchange contracts are estimated based on customer contracts on hand and expected future cash outflows. The
Company does not account for these forward contracts using hedge accounting. As a result these instruments are
measured at fair value with changes in fair value recognized in earnings.
The Company incurs costs in New Israeli Shekels which exceed the natural hedge provided by inflows in this currency.
During fiscal 2009, the Company initiated a hedging program to manage this net foreign currency using forward
foreign exchange contracts. The timing and amount of these forward foreign exchange contracts is based on expected
future cash outflows. The Company applies hedge accounting to these forward contracts. As a result these instruments
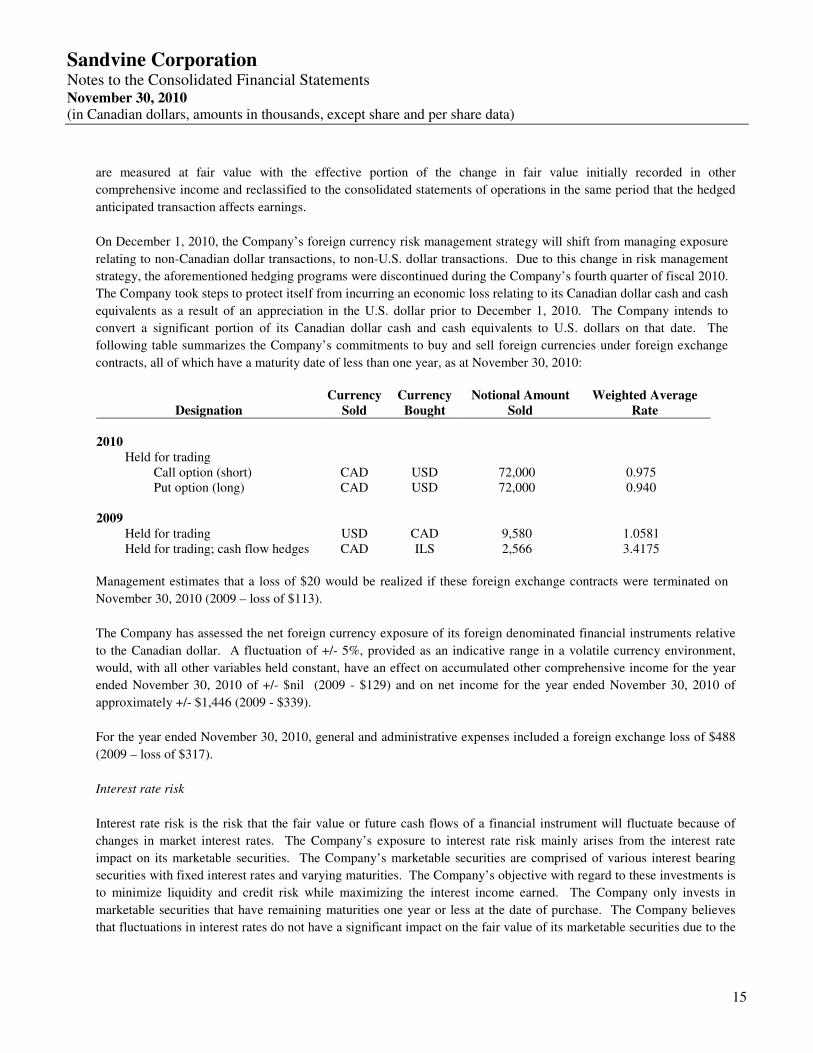
Sandvine Corporation Notes to the Consolidated Financial Statements November 30, 2010 (in Canadian dollars, amounts in thousands, except share and per share data)
15
are measured at fair value with the effective portion of the change in fair value initially recorded in other
comprehensive income and reclassified to the consolidated statements of operations in the same period that the hedged
anticipated transaction affects earnings.
On December 1, 2010, the Company’s foreign currency risk management strategy will shift from managing exposure
relating to non-Canadian dollar transactions, to non-U.S. dollar transactions. Due to this change in risk management
strategy, the aforementioned hedging programs were discontinued during the Company’s fourth quarter of fiscal 2010.
The Company took steps to protect itself from incurring an economic loss relating to its Canadian dollar cash and cash
equivalents as a result of an appreciation in the U.S. dollar prior to December 1, 2010. The Company intends to
convert a significant portion of its Canadian dollar cash and cash equivalents to U.S. dollars on that date. The
following table summarizes the Company’s commitments to buy and sell foreign currencies under foreign exchange
contracts, all of which have a maturity date of less than one year, as at November 30, 2010:
Designation Currency
Sold Currency
Bought Notional Amount
Sold Weighted Average
Rate
2010 Held for trading Call option (short) CAD USD 72,000 0.975 Put option (long) CAD USD 72,000 0.940 2009 Held for trading USD CAD 9,580 1.0581 Held for trading; cash flow hedges CAD ILS 2,566 3.4175
Management estimates that a loss of $20 would be realized if these foreign exchange contracts were terminated on
November 30, 2010 (2009 – loss of $113).
The Company has assessed the net foreign currency exposure of its foreign denominated financial instruments relative
to the Canadian dollar. A fluctuation of +/- 5%, provided as an indicative range in a volatile currency environment,
would, with all other variables held constant, have an effect on accumulated other comprehensive income for the year
ended November 30, 2010 of +/- $nil (2009 - $129) and on net income for the year ended November 30, 2010 of
approximately +/- $1,446 (2009 - $339).
For the year ended November 30, 2010, general and administrative expenses included a foreign exchange loss of $488
(2009 – loss of $317).
Interest rate risk
Interest rate risk is the risk that the fair value or future cash flows of a financial instrument will fluctuate because of
changes in market interest rates. The Company’s exposure to interest rate risk mainly arises from the interest rate
impact on its marketable securities. The Company’s marketable securities are comprised of various interest bearing
securities with fixed interest rates and varying maturities. The Company’s objective with regard to these investments is
to minimize liquidity and credit risk while maximizing the interest income earned. The Company only invests in
marketable securities that have remaining maturities one year or less at the date of purchase. The Company believes
that fluctuations in interest rates do not have a significant impact on the fair value of its marketable securities due to the

Sandvine Corporation Notes to the Consolidated Financial Statements November 30, 2010 (in Canadian dollars, amounts in thousands, except share and per share data)
16
short term maturity of its marketable securities. The Company does not use financial instruments to mitigate this
interest rate risk. During 2010, there were no significant changes to the Company’s exposure to interest rate risk, or its
objectives and policies to manage these risks. Recognized interest income for the Company’s marketable securities for
the year ended November 30, 2010 was $575 (2009 - $639).
At November 30, 2010, a change in interest rates of +/- 50 basis points, which is indicative of the change in the prime
lending rate over the preceding twelve month period, with all other variables held constant, net income for the period
ending November 30, 2010 would not have been impacted by changes to forward rates used to value foreign currency
forward contracts (2009 - $26). Other comprehensive income would not have been impacted, as the Company did not
hold financial assets classified as available for sale on November 30, 2010 (2009 - $298).
Credit risk
Credit risk is the risk that a counterparty will not meet its obligations under a financial instrument or customer contract,
leading to a financial loss being incurred by the Company. The Company is exposed to credit risk in its cash and cash
equivalents, marketable securities, accounts receivable, other current assets and to the credit risk of its derivative
financial instrument counterparties if they do not meet their obligations. The Company’s objective with regard to credit
risk in its investing activities is to limit its short term investments to those that meet or exceed specific credit ratings.
The Company’s objective with regard to credit risk in its operating activities is to reduce its exposure to losses.
Immediately preceding the Company’s November 30, 2010 year end, the Company sold all of its marketable securities
and held the proceeds in cash in order to facilitate the conversion to U.S. dollars on December 1, 2010. As at
November 30, 2010 approximately $72 million was held at a Schedule 1 bank or its affiliate in Canada. Other than the
aforementioned transaction, during 2010, there were no significant changes to the Company’s exposure to credit risk, or
its objectives and policies to manage these risks. As the Company does not utilize credit derivatives or similar
instruments, the maximum exposure to credit risk is the full carrying value of the financial instrument asset or face
value of open derivative financial instruments. The Company minimizes the credit risk of balances with banks and
currency forward contracts by depositing with or transacting with Schedule 1 banks in Canada and reputable financial
institutions in other countries and monitoring the credit risk, including counterparty credit risk, of these financial
institutions. Significant levels of cash are not held in financial institutions outside of Canada. The Company believes
its counterparty credit risk is not significant. The Company minimizes its credit risk of cash equivalents and marketable
securities by only investing in securities that meet minimum credit ratings as stipulated by the Company’s investment
policy and limiting exposure to any one issuing entity. The Company minimizes its credit risk of its accounts
receivable and other receivables by performing credit reviews for each of its customers, routinely reviewing the status
of individual accounts receivable balances and contacting customers who have overdue balances.

Sandvine Corporation Notes to the Consolidated Financial Statements November 30, 2010 (in Canadian dollars, amounts in thousands, except share and per share data)
17
As at November 30, 2010, three companies, with greater than ten percent concentration in accounts receivable,
accounted for 56.5% of the Company’s total accounts receivable (2009 – three; 41.3%). The Company’s allowance for
doubtful accounts is not significant. Of the Company’s accounts receivable, $8,338 was past due as of November 30,
2010 (2009 - $3,670). The definition of items that are past due is determined by reference to terms agreed with
individual customers. Of the overdue balances at November 30, 2010, $6,311 has been subsequently collected. As at
January 12, 2011, the remaining overdue balances are as follows:
2010
$ 2009
$
0 – 30 days past due 963 421 31 – 60 days past due 149 - 61 – 90 days past due 495 146 Greater than 91 days past due 420 15
2,027 582
No material amounts outstanding have been challenged by the respective customer(s) and the Company continues to
conduct business with them on an ongoing basis. Accordingly, management has no reason to believe that these
balances are not fully collectible in the future.
The Company’s accounts receivable could be sensitive to changing market risk conditions in particular geographic
regions. Accounts receivable is attributed to geographic regions based on the location of the reseller, when applicable.
The geographic allocation of the Company’s accounts receivables is as follows:
2010
% 2009
%
United States 14.5 33.0 Japan 20.1 10.7 China 10.7 8.3 Other 54.7 48.0
100.0 100.0
Liquidity risk
Liquidity risk is the risk that the Company will encounter difficulty in meeting its obligations associated with financial
liabilities that are settled by delivering cash or another financial asset. The Company currently settles its financial
obligations out of cash and cash equivalents. The ability to do this relies on the Company collecting its accounts
receivables in a timely manner and by maintaining sufficient cash and cash equivalents in excess of anticipated needs.
The Company invests in marketable securities which are highly liquid, which enables their use to meet financial

Sandvine Corporation Notes to the Consolidated Financial Statements November 30, 2010 (in Canadian dollars, amounts in thousands, except share and per share data)
18
obligations if necessary. During 2010, there were no significant changes to the Company’s exposure to liquidity risk,
or its objectives and policies to manage these risks. A summary of the Company’s other financial liabilities at
November 30, 2010 are as follows:
2010
$ 2009
$
Due within 1 month 8,405 6,875 Due later than 1 month and not later than 3 months 3,312 2,966 Due later than 3 months and not later than 1 year 607 646
12,324 10,487
10 Capital Management
In the management of capital, the Company considers shareholder’s equity, excluding accumulated other
comprehensive income and the balance of purchase price or earn out obligations of its acquisitions (note 12) to be
capital. The Company manages its capital to ensure that financial flexibility is present to increase shareholder value
through organic growth and selective acquisitions as well as to allow the Company to respond to changes in economic
and/or marketplace conditions. In order to maintain or adjust its capital structure the Company may issue new shares,
purchase shares for cancellation or raise debt. At this time the Company has not utilized debt facilities as part of its
capital management program nor paid dividends to its shareholders. The Company is not subject to any externally
imposed capital requirements. There were no changes in the Company’s approach to capital management during the
period.
11 Income taxes
The provision for (recovery of) income taxes consists of the following:
2010
$ 2009
$
Current Canadian - - Foreign 150 165
150 165
Future Canadian - - Foreign - (196)
- (196)
150 (31)

Sandvine Corporation Notes to the Consolidated Financial Statements November 30, 2010 (in Canadian dollars, amounts in thousands, except share and per share data)
19
The current provision primarily relates to taxes owing by the Company’s foreign subsidiaries. The difference between the amount of the provision for (recovery of) income taxes and the amount computed by multiplying income before income taxes by the statutory Canadian rate is reconciled as follows:
2010
$ 2009
$
Combined federal and provincial tax rate 29.24% 31.04% Expected tax provision (recovery) 1,678 (6,068) Foreign tax rate differences 772 2,544 Enacted tax rate changes 62 1,353 Goodwill impairment - 753 Book to return differences (833) 1,000 Stock based compensation and other differences 667 1,248 Decrease in valuation allowance (2,196) (861)
150 (31)
The tax effects of significant temporary differences are as follows:
2010
$ 2009
$ Assets Share issuance costs 194 587 Research and development incentives 4,360 7,354 Tax losses 1,480 1,518 Deferred revenue 1,461 1,012
7,495 10,471 Less: Valuation allowance 4,969 7,166
2,526 3,305 Liabilities Plant and equipment 2,526 2,356 Intangible assets - 949
Net carrying value - -
In assessing the value of the future tax assets, management considers whether it is more likely than not that some portion
or all of the future tax assets will be realized. The ultimate realization of future tax assets is dependent upon future
taxable income. Management considers the likelihood of future profitability, the character of the tax assets and any
applicable tax planning strategies to make this assessment. To the extent that management believes that the realization
of future tax assets do not meet the more likely than not criterion, a valuation allowance is provided against the future
tax assets.

Sandvine Corporation Notes to the Consolidated Financial Statements November 30, 2010 (in Canadian dollars, amounts in thousands, except share and per share data)
20
The Company will continue to evaluate and examine the valuation allowance on a regular basis, and as future events
unfold the valuation allowance may be adjusted.
The Company has non refundable investment tax credits, tax loss carry forwards and undeducted scientific research and
experimental development deductions (“SR&ED”) which expire as follows:
Investment tax credits
$
Tax loss carry forwards
$
Undeducted SR&ED
$
2022 247 - - 2023 628 - - 2024 140 - - 2025 513 - - 2026 1,299 - - 2027 2,497 - - 2028 3,429 284 - 2029 4,111 228 - 2030 3,219 69 - Unlimited - - 12,035
16,083 581 12,035
Effective with the tax year ending November 30, 2009, all provincial tax balances have been converted to federal tax
balances. As the Company’s provincial tax balances exceed the federal tax balances, the difference has generated a
non-refundable provincial harmonization tax credit that can be applied against Ontario provincial corporate taxes over
the subsequent five year period. The Company has a provincial tax harmonization credit at November 30, 2010 of
$1,686 which has not been recognized.
One of the Company’s subsidiaries has foreign net operating loss carry forwards of US$3,416 (CDN$3,501) of which
US$2,945 (CDN$3,018) are subject to a cumulative limitation of US$189 (CDN$193) per annum. As at November 30,
2010, the Company has not recognized the benefit related to these losses.
In addition, the Company has net operating loss carry forwards of NIS 44,284 (CDN$12,410) in a foreign jurisdiction
in which the Company has been granted a 10 year tax holiday. The Company expects that during the period these tax
losses are utilized, its income will be subject to a nil tax rate and the earnings will not be repatriated. Accordingly, the
Company has not recognized the tax benefit associated with these losses.
The Company has not provided for Canadian future income taxes or foreign withholding taxes that would apply on the
distribution of the earnings of its non-Canadian subsidiaries, as these earnings are intended to be reinvested indefinitely.

Sandvine Corporation Notes to the Consolidated Financial Statements November 30, 2010 (in Canadian dollars, amounts in thousands, except share and per share data)
21
12 Share capital
Share capital consists of the following:
Common Shares Common share
warrant Total # $ # $ $
Balance, November 30, 2008 135,381,698 144,713 1 390 145,103
Issued under the employee stock option plan 230,423 127 - - 127
Transfer from contributed surplus 256,523 1,330 - - 1,330 Issued as compensation on business
acquisition - 260 - - 260
Cancelled from the key employee escrow (5,913) - - - -
Balance, November 30, 2009 135,862,731 146,430 1 390 146,820
Issued under the employee stock option plan 1,118,245 673 - - 673
Transfer from contributed surplus - 225 - - 225 Issued as compensation on business
acquisition - 114 - - 114
Unvested shares held by trust (71,246) (125) - - (125)
Balance, November 30, 2010 136,909,730 147,317 1 390 147,707
The Company has authorized an unlimited number of common shares.
The Company has one outstanding and authorized common share purchase warrant which entitles the holder to acquire
619,280 common shares for $0.00001 at any time prior to March 31, 2023. The issuance of this warrant was a non-cash
transaction. The Company determined that the fair value of the warrant was $390 at the time of issue.

Sandvine Corporation Notes to the Consolidated Financial Statements November 30, 2010 (in Canadian dollars, amounts in thousands, except share and per share data)
22
On June 30, 2007, the Company acquired all of the outstanding shares of Simplicita Software, Inc. (“Simplicita”), a
provider of subscriber mediation software for IP networks, for consideration of 643,395 common shares of the
Company valued at approximately $3,423. In addition to the purchase consideration, common shares were issued and
allocated to a key employee escrow to be released over time contingent on the continued employment of certain
individuals over a three year period. Net of share cancellations, 163,192 shares were issued and allocated to the key
employee escrow. During the year ended November 30, 2010, the Company released 29,681 shares. As of November
30, 2010, there are no shares remaining in escrow. During the year ended November 30, 2010 the Company recognized
$114 as compensation expense relating to this key employee escrow (2009 - $260). The Company recognized a total of
$825 as non-cash compensation expense over the three year period in which the services were rendered. As at
November 30, 2010 there is no further non-cash compensation to be recognized.
During the year ended November 30, 2009, the Company issued 256,523 common shares relating to additional
contingent consideration available to specified Simplicita employees on the achievement of certain performance targets,
and who continued their employment with the Company through to November 30, 2008. The Company recorded
$1,298 of non cash compensation cost (representing 256,523 common shares) related to this contingent consideration
during the year ended November 30, 2008.
During the year, the Company issued 1,118,245 common shares for cash proceeds of $673 as a result of option holders
exercising their options (2009 – 230,423 common shares for net proceeds of $127).
The Company has a trust vehicle to facilitate its employee share ownership program and hold shares of the Company
allocated to individual employees. This trust is considered to be a variable interest entity and has been consolidated by
the Company. Included in the outstanding common shares of the Company as of November 30, 2010 are 71,246
unvested common shares which are held by the trust (2009 – 12,010).

Sandvine Corporation Notes to the Consolidated Financial Statements November 30, 2010 (in Canadian dollars, amounts in thousands, except share and per share data)
23
13 Stock options
Stock option plan
The Company has adopted a stock option plan for employees and directors. Options granted prior to March 21, 2006
typically vest over a four year and six month term. Options granted subsequent to this date typically vest over a 5 year
term. All options have a contractual life of 10 years and allow for the purchase of one common share per option. The
exercise price of the options is the volume weighted average share price of the Company’s common shares for the five
days prior to the date of grant. As at November 30, 2010, there were 3,606,585 options available for future grants
under the stock option plan. A summary of the stock option activity is presented below:
Options
Number
Weighted average
price $
Options outstanding, November 30, 2008 9,667,528 2.22
Option activity for the year Granted 2,377,250 0.97 Forfeited (636,255) 2.45 Cancelled (780,000) 5.74 Exercised (230,423) 0.55
Options outstanding, November 30, 2009 10,398,100 1.69
Option activity for the year Granted 2,291,250 1.66 Forfeited (1,173,868) 2.88 Exercised (1,118,245) 0.60
Options outstanding, November 30, 2010 10,397,237 1.67

Sandvine Corporation Notes to the Consolidated Financial Statements November 30, 2010 (in Canadian dollars, amounts in thousands, except share and per share data)
24
Stock based compensation
Stock based compensation (related to the Company’s stock option plan) recognized for the year ended November 30,
2010 was $2,570 with a corresponding credit to contributed surplus (2009 - $4,722). Previously recognized
compensation expense of $225 relating to options exercised during the year has been transferred from contributed
surplus to share capital (2009 - $32).
2010 2009
Number of options granted 2,291,250 2,377,250 Weighted average Black-Scholes value of each option $1.64 $0.84 Assumptions Risk free interest rate 2.99% 2.82% Expected life in years 7.42 . 8.48 Expected dividend yield 0% 0% Volatility 90.13% 99.76%
The following table summarizes information regarding stock options outstanding at November 30, 2010:
Options Outstanding Options Exercisable
Range of exercise
price $
Number outstanding
Weighted average contractual life
(years)
Weighted average exercise price
$ Number
outstanding
Weighted average exercise price
$
0.40 - 0.82 2,951,291 4.45 0.65 2,390,121 0.61
1.05 - 2.53 6,302,915 8.04 1.53 1,748,638 1.86
4.11 - 5.50 817,947 6.83 4.38 515,554 4.41
6.59 - 6.95 325,084 6.70 6.71 215,260 6.70
0.40 - 6.95 10,397,237 6.89 1.67 4,869,573 1.73

Sandvine Corporation Notes to the Consolidated Financial Statements November 30, 2010 (in Canadian dollars, amounts in thousands, except share and per share data)
25
14 Credit facility
The Company has a demand credit facility with a major Canadian chartered bank. Under the terms of the facility, the
Company has available to it a $1,000 operating line to provide letters of credit and a $2,500 contingency line to permit
the Company to enter into foreign currency forward contracts. Borrowings made from the facility attract interest at the
bank’s prime rate of interest plus 0.5%. Marketable securities with a carrying value and fair value of $3,500 are
pledged as security for the credit facility. The assets pledged as security can be called by the lender upon default of the
facility or insolvency of the Company. The facility and the related security will remain in effect until the facility,
which has no term, is terminated.
As of November 30, 2010 the Company had issued three letters of credit under its operating line. The individual letters
of credit were; US$292 (CDN$299) expiring July 15, 2011, US$16 (CDN$16) expiring July 24, 2011 and US$79
(CDN$81) expiring August 31, 2011. As of November 30, 2010, the Company had not utilized any of its $2,500
contingency line relating to foreign currency forward contracts.
15 Lease commitments
Future minimum operating lease payments for premises over the next three years and thereafter are as follows:
$
2011 728 2012 327 2013 7 Thereafter -
1,062
16 Accumulated other comprehensive loss
2010 2009
$ $
Accumulated net unrealized gains on available for sale financial assets - 29 Accumulated unrealized net loss on derivative financial instruments
designated as cash flow hedges - (119)
Total accumulated other comprehensive loss - (90)

Sandvine Corporation Notes to the Consolidated Financial Statements November 30, 2010 (in Canadian dollars, amounts in thousands, except share and per share data)
26
17 Government assistance
Government assistance and repayments, together with investment tax credits, have been applied to research and
development expense as follows:
2010
$ 2009
$
Research and development 27,402 28,162 Government repayments 2,596 1,722 Investment tax credits / government assistance (3,996) (2,203)
26,002 27,681
The Company has an agreement with Technology Partnership Canada (“TPC”) who provided partial funding towards
one of the Company’s research and development projects. The Company received $9,500 over a twenty-two month
period which ended during fiscal 2005. The agreement requires the contribution to be repaid in the form of royalties to
a maximum of $16,000. Royalties are charged at 2.5% of the Company’s gross revenues. The obligation to pay
royalties expires on November 30, 2013. During the year ended November 30, 2010, the Company recognized $2,345
(2009 - $1,722) as royalty expense which has been recorded as an increase to research and development expenses.
Cumulatively, the Company has accrued or paid total royalties of $6,703 under the agreement.
A subsidiary of the Company participates in programs sponsored by a foreign government for the support of research
and development activities. The subsidiary is obligated to pay royalties, amounting to 3% - 3.5% on sales and other
related revenues generated from the subsidiary’s products up to the amount granted plus interest. The subsidiary’s
obligation to pay these royalties is contingent on actual sales of its products, and in the absence of such sales, no
payment is required. During the year ended November 30, 2010, the subsidiary received additional funding of $734
USD ($774 CAD) under these programs (2009 - $723 USD ($885 CAD)). As of November 30, 2010, the subsidiary
has received cumulative grants of $2,326 USD ($2,527 CAD). During the year ended November 30, 2010, the
Company recognized $251 (2009 - $nil) as royalty expense which has been recorded as an increase to research and
development expenses. Cumulatively, the Company has accrued or paid total royalties of $540 USD ($581 CAD)
under the agreement.
Non repayable government assistance recorded during the year of $137 (2009 - $1,000) relates to funding received
through a Canadian government program in respect of certain research and development activities undertaken by the
Company. The Company has been approved to receive up to $250 (in total) under the program.
The Company has entered into an agreement with the Province of Ontario relating to the Next Generation of Jobs Fund,
which will provide funding relating to one of the Company’s projects. Under the agreement, the Company will be
eligible to receive funding equal to 11% of eligible project expenditures from February 24, 2009 to February 24, 2014
to a maximum of $18,700 (the “Initial Grant”). Payments made in respect of the Initial Grant can become conditionally
repayable if certain cumulative job targets are not met. In addition, at the end of the agreement, the Company may be
entitled to receive up to an additional 4% of eligible project expenditures (to a maximum of $6,800) if certain Ontario-
based job targets have been met. During the year ended November 30, 2010, the Company recorded $4,523 of funding
eligible from the program. The amount of funding received in respect of eligible expenses is as follows:

Sandvine Corporation Notes to the Consolidated Financial Statements November 30, 2010 (in Canadian dollars, amounts in thousands, except share and per share data)
27
2010
$ 2009
$
Sales and marketing 384 - Research and development 3,058 - General and administrative 1,081 -
4,523 -
Purchase of plant, equipment and intangible software assets 721 -
5,244 -
18 Earnings (loss) per share
2010
$ 2009
$
Numerator for basic and diluted earnings (loss)
per share available to common shareholders 5,590 (19,517)
Denominator for earnings (loss) per share,
weighted average number of shares outstanding
Basic 136,256,258 135,636,736
Effect of warrant outstanding 619,280 -
Effect of stock options issued 3,830,193 -
Effect of contingently returnable shares 9,769 -
Diluted 140,715,500 135,636,736
Earnings (loss) per share: Basic 0.041 (0.144)
Diluted 0.040 (0.144)
In periods where the Company incurred losses attributable to common shares, options granted under the Company’s stock
option plan, contingently returnable shares and the common share purchase warrant have been excluded in the diluted loss
per share calculation as their inclusion would have been anti-dilutive.

Sandvine Corporation Notes to the Consolidated Financial Statements November 30, 2010 (in Canadian dollars, amounts in thousands, except share and per share data)
28
19 Segment disclosures
The Company has one reportable segment. The Company’s operations are substantially all related to the research,
design, manufacturing and sales of network management equipment and solutions for broadband service providers.
Selected financial information is as follows:
2010
$ 2009
$
Sales Canada 1,578 4,589 United States 37,595 31,437 Caribbean and Latin America 8,382 5,776 Europe, Middle East and Africa 21,209 17,562 Asia Pacific 24,998 9,484
93,762 68,848
2010
% 2009
%
Sales Canada 1.7 6.6 United States 40.1 45.7 Caribbean and Latin America 8.9 8.4 Europe, Middle East and Africa 22.6 25.5 Asia Pacific 26.7 13.8
100.0 100.0
In situations where a sale is made through a reseller, revenue associated with that sale is attributed to the geographic
location of the end customer. Revenue from individually significant countries contained within these geographic
regions included Japan, which represented 15.6% of revenue for the year ended November 30, 2010 (2009 – 8.8%).
Major customers are customers which represent more than 10% of total revenues for a given period. For the year ended
November 30, 2010 three major customers represented 46.8% of total revenue respectively (2009 – one, 15.3%). The
breakdown of major customers for the year ended November 30, 2010 is as follows:
2010
% 2009
%
Customer A 15.7 15.3 Customer B 15.6 8.8 Customer C 15.5 7.1
46.8 31.2

Sandvine Corporation Notes to the Consolidated Financial Statements November 30, 2010 (in Canadian dollars, amounts in thousands, except share and per share data)
29
2010
$ 2009
$
Plant and equipment, intangibles and goodwill Canada 16,097 13,535 United States 92 2,232 Europe, Middle East and Africa 1,741 2,480
17,930 18,247
Total assets Canada 147,128 130,728 United States 268 2,377 Europe, Middle East and Africa 2,363 3,164
149,759 136,269
20 Supplemental cash flow information
For the year ended November 30, 2010 the Company paid $202 for income tax in cash (2009 - $107). The Company
did not pay any interest in cash during the year ended November 30, 2010 (2009 - $nil).
During the year ended November 30, 2010, the Company recorded $721 (2009 – nil) of government assistance relating
to plant, equipment and intangible software asset acquisitions. This government assistance has been netted against
plant, equipment and intangible software asset purchases as disclosed in the consolidated statement of cash flows.
Exclusive of government assistance, purchases of plant, equipment and intangible software were $8,262 for the year
ended November 30, 2010 (2009 – $5,798).
21 Comparative figures
Certain of the comparative figures have been reclassified to conform to the current year presentation.

COMMONSHARES
Sandvine’scommonsharesarelistedonthefollowingmarkets:
TSX:SVC AIM:SAND
DIRECTORS
Roger Maggs,Chairman Founder,SeniorPartner CelticHouse
John Keating FormerChiefExecutiveOfficer COMDEVInternational,Ltd.
Mark Guibert VicePresident,CorporateMarketing ResearchinMotion
Kenneth James Taylor ChiefFinancialOfficer MarchNetworksCorporation
Steve McCartney PresidentandChiefExecutiveOfficer BeringMedia
DaveCaputo Co-founder,PresidentandChiefExecutiveOfficer SandvineIncorporatedULC
Scott Hamilton ChiefFinancialOfficer SandvineIncorporatedULC
AUDITORS
PricewaterhouseCoopersLLP CharteredAccountants Kitchener,Ontario,Canada
TRANSFERAGENTSANDREGISTRARS
ComputershareInvestorServicesInc. Toronto,Ontario,Canada
CONTACT
408AlbertStreet Waterloo,Ontario CanadaN2L3V3 Tel:519-880-2600 Fax:519-884-9892
INVESTORINQUIRIES
CORPORATEINQUIRIES
[email protected] www.sandvine.com
SandvineisanISO14001andISO9001certifiedcompany,reflectingourcommitmentstoqualityandtheenvironment. Copyright©2011SandvineIncorporatedULC.SandvineandtheSandvinelogoareregisteredtrademarksofSandvineIncorporatedULC.Allrightsreserved.