First State - Morningstar, Inc.
138
2008 Semi-Annual Report First State Global Umbrella Fund plc
Transcript of First State - Morningstar, Inc.

2008 Semi-Annual Report
First StateGlobal Umbrella Fund plc
JOBNAME: 08081916 PAGE: 1 SESS: 26 OUTPUT: Mon Aug 18 12:43:17 2008
INVESTMENT MANAGERS’ REPORT AND SCHEDULES OF INVESTMENT:
First State Asian Growth Fund .................................................................................................. 1First State China Growth Fund .................................................................................................. 4First State Global 100 Fund ....................................................................................................... 7First State Hong Kong Growth Fund ....................................................................................... 11First State Indian Subcontinent Fund ...................................................................................... 15First State Global Bond Fund .................................................................................................... 19First State High Quality Bond Fund ......................................................................................... 23First State Long Term Bond Fund ............................................................................................. 27First State Greater China Growth Fund .................................................................................... 30First State Singapore and Malaysia Growth Fund ................................................................... 33First State Asia Innovation and Technology Fund ................................................................... 36First State Asian Equity Plus Fund ........................................................................................... 39First State Asian Bond Fund ...................................................................................................... 43First State Asian Quality Bond Fund ........................................................................................ 46First State Hong Kong Dollar Bond Fund ................................................................................ 50First State Global Emerging Markets Debt Fund..................................................................... 54First State Global Emerging Markets Leaders Fund ............................................................... 57First State Global Resources Fund ............................................................................................ 61First State Global Property Securities Fund............................................................................. 65First State Asian Property Securities Fund............................................................................... 69First State China Focus Fund..................................................................................................... 72First State Global Listed Infrastructure Fund .......................................................................... 74
BALANCE SHEET (UNAUDITED) ...................................................................................................... 75
INCOME STATEMENT (UNAUDITED) .............................................................................................. 83
STATEMENT OF CHANGES IN NET ASSETS ATTRIBUTABLE TO REDEEMABLE
PARTICIPATING SHAREHOLDERS (UNAUDITED)....................................................................... 91
DISTRIBUTION STATEMENT (UNAUDITED) .................................................................................... 99
NOTES FORMING PART OF THE FINANCIAL STATEMENTS ......................................................... 103
DIRECTORY ......................................................................................................................................... 135
This semi-annual report shall not constitute an offer to sell or a solicitation of an offer to buy sharesin any of the sub-funds of First State Global Umbrella Fund p.l.c. (the “Company”). Subscriptionsare to be made only on the basis of the information contained in the Company’s prospectus, assupplemented by the latest semi-annual and annual reports.
FIRST STATE GLOBAL UMBRELLA FUND P.L.C.
TABLE OF CONTENTS

JOBNAME: 08081916 PAGE: 2 SESS: 26 OUTPUT: Mon Aug 18 12:43:17 2008
PERFORMANCE^
01/01/07To
30/06/07
01/01/08To
30/06/08
First State Asian Growth Fund “The Fund”– Class I 18.36% -14.16%– Class II 18.11% -14.35%– Class III 19.12% -13.59%– Class I – Dist 18.35% -14.16%
MSCI A/C Asia ExJapan Free Index(Total Return) 17.31% -21.10%
^ Performance calculation is base on official dealingNAV.
The Asia ex-Japan markets underperformedsignificantly over the six months to 30 June 2008.The MSCI Asia ex-Japan Index declined by 21.1%in US dollar terms, while the MSCI World Indexwas down by 10.2%.
The region was negatively influenced by weakglobal equity markets which declined on lingeringconcerns about the impact of the credit crunch onthe global economy and rising inflationarypressures as the oil price reached new highs above$140 per barrel. Inflation also rose within theregion and a number of central banks were forcedto tighten monetary policy. China and India fellvery significantly on concerns about rising rates asinflation increased strongly, while Taiwan was asignificant outperformer following a long period ofunderperformance as the presidential election resultwas taken positively by the market.
Performance was positively impacted by anumber of positions in Taiwan. Chunghwa Telecom,Taiwan Semiconductor and Chinatrust Financial alloutperformed as investors anticipated that thepresidential election victory by the KMT would bepositive for relations with Mainland China and thuseconomic growth in Taiwan.
On the negative side, stocks exposed to HongKong property underperformed. Both Cheung Kongand Swire Pacific lagged on concerns that globalinflationary pressures could result in higher USinterest rates and therefore rises in Hong Kongrates. China Resources Enterprise (ConsumerDiscretionary) also lagged on fears that risinginflationary pressures in Mainland China wouldundermine consumer confidence.
Over the period we established a new positionin President Chain Store (Taiwan: ConsumerStaples) because of its attractive growth profile andthe positive outlook following its recent award ofShanghai’s 7-11 franchise. We also bought LihirGold (Australia: Materials), a beneficiary of a highgold price, and Taiwanese IT company Mediatek(Taiwan: Information Technology) which wasattractively valued due to poor sentiment towardstechnology stocks.
We sold Sembcorp Industries (Singapore:Industrials) on worries about whether the companycan execute its growth strategy successfully and wetook profits in Asustek Computer (Taiwan:Information Technology). We also sold Gamuda(Malaysia: Industrials) after the CEO sold a majorstake in the firm.
The fund is defensively positioned and we aremaintaining a strong focus on sustainable cashflows. We are beginning to see some evidence thatgrowth is slowing in the region. While earningsreports remain in line with expectations, weanticipate some negative surprises as the yearprogresses. While we are cautious on the short-termglobal prospects and are fearful of stagflation, weare as convinced as ever that careful stock selectionin the region will prove very rewarding in thelong-term. Following market weakness, someinteresting buying opportunities are emerging,noticeably in India.
FIRST STATE ASIAN GROWTH FUND
INVESTMENT MANAGER’S REPORT (UNAUDITED)
1

JOBNAME: 08081916 PAGE: 3 SESS: 26 OUTPUT: Mon Aug 18 12:43:17 2008
Numberof shares
FairValue
US$
% ofNet
Assets
Financial Assets at Fair Value Through Profit or Loss*
China 11,823,617 6.84China Merchants .......... 218,000 842,924 0.49China Oilfield Services . 548,000 979,688 0.57China Resources........... 1,724,000 4,919,397 2.84China Telecom ............ 6,144,000 3,333,007 1.93CNOOC ..................... 1,016,000 1,748,601 1.01
Hong Kong 38,079,493 22.04Cheung Kong .............. 596,000 8,033,293 4.65CLP Holdings ............. 119,500 1,022,972 0.59Esprit.......................... 135,800 1,409,812 0.82Hang Lung Group ........ 1,073,000 4,768,124 2.76Hong Kong & ChinaGas ........................... 3,750,120 8,916,605 5.16
Kerry Properties .......... 215,060 1,119,774 0.65Li & Fung .................. 723,400 2,180,173 1.26Swire Pacific “A” ......... 865,000 8,846,906 5.12Wing Hang Bank ......... 134,500 1,781,834 1.03
India 11,257,740 6.51Cipla ......................... 191,122 933,995 0.54HDFC Bank ................ 56,909 1,325,652 0.77Hindustan Unilever ...... 1,193,373 5,718,037 3.31Infosys Technologies .... 43,691 1,751,829 1.01Mahindra & Mahindra .. 137,387 1,528,227 0.88
Malaysia 17,706,409 10.25Bumiputra-CommerceHoldings ................... 654,200 1,592,434 0.92
Genting ...................... 1,575,100 2,700,723 1.56IOI ............................ 3,626,450 8,272,214 4.79Tenaga Nasional .......... 2,060,200 5,141,038 2.98
Papua N. Guinea 11,455,111 6.63Lihir Gold .................. 3,617,964 11,455,111 6.63
Philippines 4,112,288 2.38Ayala .......................... 286,570 1,609,586 0.93Philippine LongDistance Telephone .... 47,253 2,502,702 1.45
Singapore 18,314,909 10.60Fraser & Neave ........... 627,500 2,092,745 1.21Great Eastern Holdings . 167,000 2,070,441 1.20Keppel ....................... 534,000 4,332,386 2.51Overseas ChineseBanking .................... 760,318 4,573,215 2.65
SingaporeTelecommunications ... 1,274,000 3,395,332 1.96
StarHub ...................... 882,080 1,850,790 1.07
Numberof shares
FairValue
US$
% ofNet
Assets
Financial Assets at Fair Value Through Profit or Loss*
South Korea 19,916,969 11.52LG ............................ 12,950 839,398 0.48S1 ............................. 17,020 1,018,597 0.59Samsung Electronics .... 12,804 7,650,574 4.43Samsung Fire & MarineInsurance .................. 15,944 3,330,558 1.93
Shinsegae .................... 8,521 4,586,351 2.65Yuhan ........................ 11,900 2,491,491 1.44
Taiwan 28,577,089 16.54Chunghwa Telecom ...... 2,273,483 5,879,762 3.40Delta Electronics ......... 1,369,557 3,790,162 2.19E.Sun FinancialHolding .................... 1,447,600 784,536 0.46
MediaTek ................... 206,000 2,351,629 1.36Powertech Technology .. 799,252 2,791,181 1.62President Chain Store ... 492,000 1,629,032 0.94Taiwan SemiconductorManufacturing ............ 4,528,593 9,682,920 5.60
Uni-PresidentEnterprises................. 1,386,980 1,667,867 0.97
Thailand 7,395,167 4.28Advanced Info Service .. 805,100 2,215,982 1.28Kasikornbank .............. 979,500 2,095,266 1.21PTT............................ 343,600 3,083,919 1.79
Total Financial Asset at Fair Valuethrough Profit or Loss ..................... 168,638,792 97.59
Cash and other net assets ................... 4,170,605 2.41
Total Net Assets Attributable ToRedeemable ParticipatingShareholders .................................. 172,809,397 100.00
Total Cost of Financial Asset atFair Value through Profit or Loss ...... 141,251,622
*Traded on regulated exchanges or markets.
FIRST STATE ASIAN GROWTH FUND
SCHEDULE OF INVESTMENTS
AS OF 30 JUNE 2008
2

JOBNAME: 08081916 PAGE: 4 SESS: 26 OUTPUT: Mon Aug 18 12:43:17 2008
Purchased Sold
Financial Assets at Fair ValueThrough Profit or Loss*
Numberof shares
Numberof shares
Advanced Information ............. 463,600 –Asustek Computer ................... – 796,550Ayala..................................... 124,841 –Bharti Airtel ........................... – 71,866Bumiputra – Commerce
Holdings............................. 100,700 –Cheung Kong Holdings ........... 124,000 –China Merchants Bank ............ 156,000 156,000China Merchants .................... 76,000 –China Oilfield Services ........... 134,000 –China Resources ..................... 264,000 –China Shenhua Energy ............ – 151,500China Telecom ....................... 1,436,000 484,000Chinatrust Financial ............... 404,000 2,242,000Chunghwa Telecom ................. 1,030,000 124,349Cipla .................................... 52,692 –CLP Holdings ........................ 119,500 –CNOOC................................. – 682,000Delta Electronics..................... 356,000 –Doosan Heavy Industries ......... 2,042 5,902Formosa Plastics .................... – 289,000Fraser & Neave ...................... 112,000 –Gamuda ................................ – 1,569,200Genting ................................ 148,300 –Hang Lung Group .................. 122,000 268,000Hindustan Unilever ................. 380,912 –Hong Kong & China Gas ......... 340,920 –Hutchison
Telecommunications ............. 183,000 1,438,000
Purchased Sold
Financial Assets at Fair ValueThrough Profit or Loss*
Numberof shares
Numberof shares
Infosys Technologies ............... 28,938 –IOI ....................................... 319,500 –Kasikorn Bank........................ 291,400 –Keppel................................... 85,000 95,000Li & Fung ............................. – 112,000Lihir Gold ............................. 3,617,964 –Mahindra & Mahindra ............. 137,387 –Mediatek ............................... 206,000 –MTR .................................... – 270,500Overseas Chinese Banking ....... 62,000 –Powertech Technology ............. 66,000 –President Chain Store ............. 492,000 –PTT ...................................... 42,300 –Samsung Electronics................ 1,181 720Samsung Fire & Marine
Insurance ........................... 2,930 –Sembcorp Industries ............... – 654,000Shinhan Finance...................... 11,470 40,180Shinsegae .............................. 1,584 –Singapore
Telecommunications ............ 225,000 –Starhub.................................. 501,000 –Swire Pacific “A”.................... 309,500 –Taiwan Semiconductor
Manufacturing .................... 1,143,000 –Tata Power ............................ – 37,618Tenaga Nasional...................... 224,700 –Uni-President Enterprises ......... – 97,000Wing Hang Bank .................... – 22,000
*Traded on regulated exchanges or markets.
FIRST STATE ASIAN GROWTH FUND
PORTFOLIO CHANGES (UNAUDITED)
3
JOBNAME: 08081916 PAGE: 5 SESS: 26 OUTPUT: Mon Aug 18 12:43:17 2008
PERFORMANCE^
01/01/07To
30/06/07
01/01/08To
30/06/08
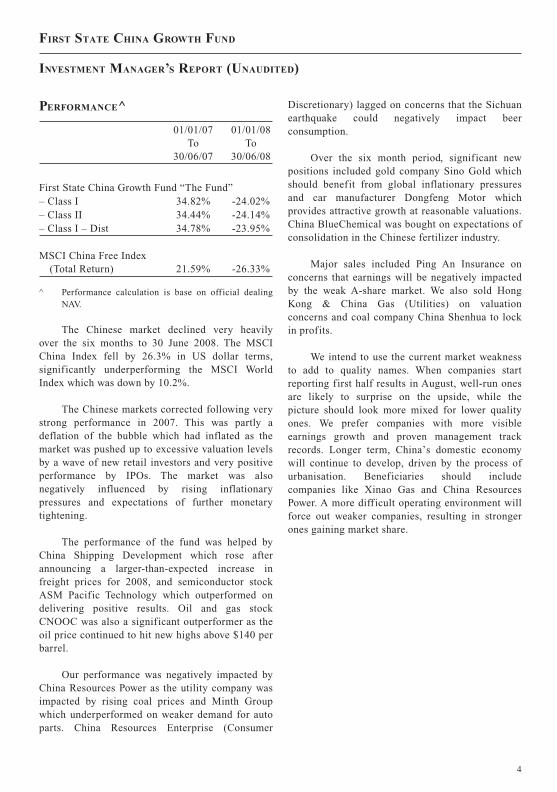
First State China Growth Fund “The Fund”– Class I 34.82% -24.02%– Class II 34.44% -24.14%– Class I – Dist 34.78% -23.95%
MSCI China Free Index(Total Return) 21.59% -26.33%
^ Performance calculation is base on official dealingNAV.
The Chinese market declined very heavilyover the six months to 30 June 2008. The MSCIChina Index fell by 26.3% in US dollar terms,significantly underperforming the MSCI WorldIndex which was down by 10.2%.
The Chinese markets corrected following verystrong performance in 2007. This was partly adeflation of the bubble which had inflated as themarket was pushed up to excessive valuation levelsby a wave of new retail investors and very positiveperformance by IPOs. The market was alsonegatively influenced by rising inflationarypressures and expectations of further monetarytightening.
The performance of the fund was helped byChina Shipping Development which rose afterannouncing a larger-than-expected increase infreight prices for 2008, and semiconductor stockASM Pacific Technology which outperformed ondelivering positive results. Oil and gas stockCNOOC was also a significant outperformer as theoil price continued to hit new highs above $140 perbarrel.
Our performance was negatively impacted byChina Resources Power as the utility company wasimpacted by rising coal prices and Minth Groupwhich underperformed on weaker demand for autoparts. China Resources Enterprise (Consumer
Discretionary) lagged on concerns that the Sichuanearthquake could negatively impact beerconsumption.
Over the six month period, significant newpositions included gold company Sino Gold whichshould benefit from global inflationary pressuresand car manufacturer Dongfeng Motor whichprovides attractive growth at reasonable valuations.China BlueChemical was bought on expectations ofconsolidation in the Chinese fertilizer industry.
Major sales included Ping An Insurance onconcerns that earnings will be negatively impactedby the weak A-share market. We also sold HongKong & China Gas (Utilities) on valuationconcerns and coal company China Shenhua to lockin profits.
We intend to use the current market weaknessto add to quality names. When companies startreporting first half results in August, well-run onesare likely to surprise on the upside, while thepicture should look more mixed for lower qualityones. We prefer companies with more visibleearnings growth and proven management trackrecords. Longer term, China’s domestic economywill continue to develop, driven by the process ofurbanisation. Beneficiaries should includecompanies like Xinao Gas and China ResourcesPower. A more difficult operating environment willforce out weaker companies, resulting in strongerones gaining market share.
FIRST STATE CHINA GROWTH FUND
INVESTMENT MANAGER’S REPORT (UNAUDITED)
4

JOBNAME: 08081916 PAGE: 6 SESS: 26 OUTPUT: Mon Aug 18 12:43:17 2008
Numberof shares
FairValue
US$
% ofNet
Assets
Financial Assets at Fair Value Through Profit or Loss*
Australia 52,513,171 2.31Sino Gold Mining .. . . . . . . . . . 9,520,422 52,513,171 2.31
China 1,454,557,047 63.98Anhui Conch Cement .. . . . . 1,866,000 12,443,988 0.55Anhui Expressway ... . . . . . . . 38,842,000 27,397,371 1.21Belle International
Holdings .. . . . . . . . . . . . . . . . . . . 32,989,000 29,615,005 1.30BYD Electronic
International .. . . . . . . . . . . . . . 15,705,000 9,325,316 0.41Changan Minsheng APLL
Logistics .. . . . . . . . . . . . . . . . . . . 5,673,000 2,029,839 0.09China BlueChemical .. . . . . . 18,964,000 13,133,132 0.58China Communications
Services .. . . . . . . . . . . . . . . . . . . . 102,412,275 74,601,055 3.28China Dongxiang Group... 68,684,000 27,746,662 1.23China International
Marine Containers .. . . . . . . 19,040,720 22,660,838 0.99China Mengniu Dairy .. . . . 47,404,000 133,746,457 5.88China Merchants Bank ... . 24,221,500 76,104,745 3.35China Merchants Holdings
International .. . . . . . . . . . . . . . 11,782,000 45,556,563 2.00China Metal International . 30,822,000 6,364,017 0.28China Oilfield
Services .. . . . . . . . . . . . . . . . . . . . 61,098,000 109,228,101 4.80China Resources
Enterprise .. . . . . . . . . . . . . . . . . . 36,104,900 103,024,562 4.54China Shipping
Development.. . . . . . . . . . . . . . . 30,199,200 90,626,647 3.99China Telecom ... . . . . . . . . . . . . 106,074,000 57,543,190 2.52China Vanke .. . . . . . . . . . . . . . . . 63,398,133 80,492,660 3.53CNOOC ... . . . . . . . . . . . . . . . . . . . 60,689,500 104,450,541 4.59Dongfeng Motor Group ... 35,076,000 14,034,898 0.62Fosun International .. . . . . . . . 19,869,000 14,447,865 0.64Foxconn International .. . . . . 18,520,083 17,955,989 0.79Haitian International .. . . . . . 36,381,000 15,863,469 0.70Lenovo... . . . . . . . . . . . . . . . . . . . . . . 115,834,000 78,287,295 3.44Little Sheep Group ... . . . . . . 17,215,000 6,358,346 0.28Pacific Textile
Holdings .. . . . . . . . . . . . . . . . . . . 21,475,000 3,883,264 0.17Parkson Retail Group ... . . . 2,408,500 17,544,444 0.77Shandong Molong
Petroleum... . . . . . . . . . . . . . . . . . 16,002,000 1,600,713 0.07Shandong Weigao Group .. 3,552,000 5,111,054 0.22Tencent Holdings .. . . . . . . . . . 5,101,400 39,450,391 1.74Times .. . . . . . . . . . . . . . . . . . . . . . . . 50,076,000 19,266,175 0.85Tingyi (Cayman) Holding 23,658,000 29,035,853 1.28Tong Ren Tang
Technologies .. . . . . . . . . . . . . . 3,077,000 4,143,443 0.18Vinda International
Holdings .. . . . . . . . . . . . . . . . . . . 46,459,000 13,763,423 0.61Xinao Gas Holdings .. . . . . . 36,478,000 61,751,792 2.72Yantai Changyu Pioneer
Wine .. . . . . . . . . . . . . . . . . . . . . . . . . 13,818,492 85,967,944 3.78
Numberof shares
FairValue
US$
% ofNet
Assets
Financial Assets at Fair Value Through Profit or Loss*
Hong Kong 634,359,178 27.90Alco Holdings .. . . . . . . . . . . . . . 8,187,000 2,288,895 0.10ASM Pacific Technology . 4,608,600 34,782,444 1.53Beijing Enterprises
Holdings .. . . . . . . . . . . . . . . . . . . 4,476,000 14,580,366 0.64Chen Hsong Holdings .. . . . . 30,106,000 12,741,238 0.56China Resources Land ... . 11,278,000 15,533,917 0.68China Resources Power
Holdings .. . . . . . . . . . . . . . . . . . . 33,261,000 80,961,049 3.56Denway Motors .. . . . . . . . . . . . 42,550,000 16,425,200 0.72Enric Energy Equipment
Holdings .. . . . . . . . . . . . . . . . . . . 32,170,000 21,866,111 0.96Glorious Sun Enterprises . 15,661,500 7,632,408 0.34GZI Real Estate
Investment Trust . . . . . . . . . . . 40,345,000 14,487,464 0.64Hengan International
Group ... . . . . . . . . . . . . . . . . . . . . . 25,466,000 74,243,299 3.27Hong Kong Aircraft. . . . . . . . . 653,200 10,060,830 0.44Hopewell Highway
Infrastructure .. . . . . . . . . . . . . 75,369,100 56,448,290 2.48Hung Hing Printing .. . . . . . . 18,989,107 5,041,033 0.22IDS Group ... . . . . . . . . . . . . . . . . 12,138,000 17,309,979 0.76Kingboard Chemical
Holdings .. . . . . . . . . . . . . . . . . . . 14,874,330 68,672,764 3.02Li & Fung ... . . . . . . . . . . . . . . . . . 16,880,800 50,875,127 2.24Luk Fook Holdings
International .. . . . . . . . . . . . . . 22,402,000 11,980,294 0.53Lung Kee (Bermuda)
Holdings .. . . . . . . . . . . . . . . . . . . . 10,613,250 4,831,938 0.21Minth Group ... . . . . . . . . . . . . . . 58,628,000 41,203,134 1.81Ports Design .. . . . . . . . . . . . . . . . 13,507,000 38,022,270 1.67Pou Sheng International
Holdings .. . . . . . . . . . . . . . . . . . . 61,242 18,614 0.01Shangri-La Asia .. . . . . . . . . . . 8,196,000 19,130,131 0.84Yue Yuen Industrial
Holdings .. . . . . . . . . . . . . . . . . . . 6,409,100 15,222,383 0.67
Singapore 7,950,909 0.35Guocoland ... . . . . . . . . . . . . . . . . 4,954,000 7,950,909 0.35
Total Financial Assets at Fair ValueThrough Profit or Loss.. . . . . . . . . . . . . . . . . . . . . . 2,149,380,305 94.54
Cash and other net assets .. . . . . . . . . . . . . . . . . . . . 124,030,496 5.46
Total Net Assets Attributableto Redeemable ParticipatingShareholders .. . . . . . . . . . . . . . . . . . . . . . . . . . . . . . . . . . 2,273,410,801 100.00
Total Cost of Financial Assets atFair Value Through Profit or Loss .. . . . . . . . 2,084,108,655
*Traded on regulated exchanges or markets.
FIRST STATE CHINA GROWTH FUND
SCHEDULE OF INVESTMENTS
AS OF 30 JUNE 2008
5
JOBNAME: 08081916 PAGE: 7 SESS: 26 OUTPUT: Mon Aug 18 12:43:17 2008
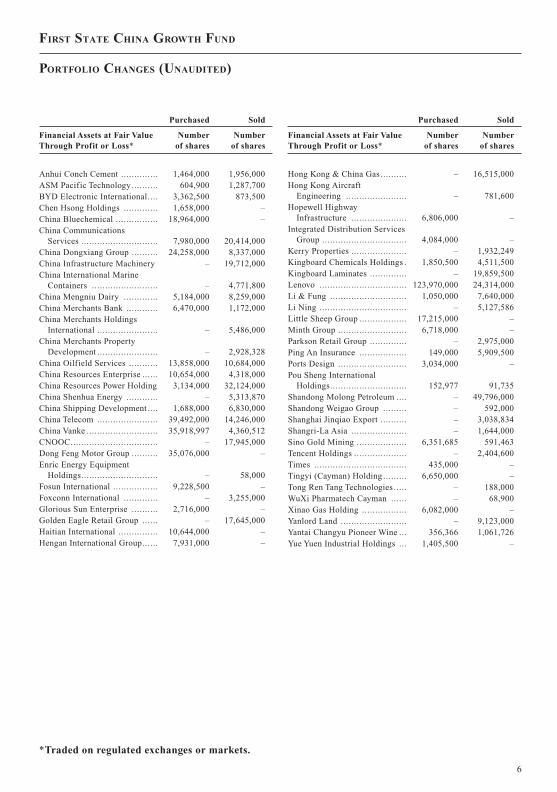
Purchased Sold
Financial Assets at Fair ValueThrough Profit or Loss*
Numberof shares
Numberof shares
Anhui Conch Cement .............. 1,464,000 1,956,000ASM Pacific Technology .......... 604,900 1,287,700BYD Electronic International.... 3,362,500 873,500Chen Hsong Holdings ............. 1,658,000 –China Bluechemical ................ 18,964,000 –China Communications
Services ............................. 7,980,000 20,414,000China Dongxiang Group .......... 24,258,000 8,337,000China Infrastructure Machinery – 19,712,000China International Marine
Containers ......................... – 4,771,800China Mengniu Dairy ............. 5,184,000 8,259,000China Merchants Bank ............ 6,470,000 1,172,000China Merchants Holdings
International ....................... – 5,486,000China Merchants Property
Development ....................... – 2,928,328China Oilfield Services ........... 13,858,000 10,684,000China Resources Enterprise ...... 10,654,000 4,318,000China Resources Power Holding 3,134,000 32,124,000China Shenhua Energy ............ – 5,313,870China Shipping Development .... 1,688,000 6,830,000China Telecom ....................... 39,492,000 14,246,000China Vanke ........................... 35,918,997 4,360,512CNOOC................................. – 17,945,000Dong Feng Motor Group .......... 35,076,000 –Enric Energy Equipment
Holdings............................. – 58,000Fosun International ................. 9,228,500 –Foxconn International ............. – 3,255,000Glorious Sun Enterprise .......... 2,716,000 –Golden Eagle Retail Group ...... – 17,645,000Haitian International ............... 10,644,000 –Hengan International Group...... 7,931,000 –
Purchased Sold
Financial Assets at Fair ValueThrough Profit or Loss*
Numberof shares
Numberof shares
Hong Kong & China Gas .......... – 16,515,000Hong Kong Aircraft
Engineering ....................... – 781,600Hopewell Highway
Infrastructure ..................... 6,806,000 –Integrated Distribution Services
Group ................................ 4,084,000 –Kerry Properties ..................... – 1,932,249Kingboard Chemicals Holdings . 1,850,500 4,511,500Kingboard Laminates .............. – 19,859,500Lenovo ................................. 123,970,000 24,314,000Li & Fung ............................. 1,050,000 7,640,000Li Ning ................................. – 5,127,586Little Sheep Group .................. 17,215,000 –Minth Group .......................... 6,718,000 –Parkson Retail Group .............. – 2,975,000Ping An Insurance .................. 149,000 5,909,500Ports Design .......................... 3,034,000 –Pou Sheng International
Holdings............................. 152,977 91,735Shandong Molong Petroleum .... – 49,796,000Shandong Weigao Group ......... – 592,000Shanghai Jinqiao Export .......... – 3,038,834Shangri-La Asia ..................... – 1,644,000Sino Gold Mining ................... 6,351,685 591,463Tencent Holdings .................... – 2,404,600Times ................................... 435,000 –Tingyi (Cayman) Holding ......... 6,650,000 –Tong Ren Tang Technologies ..... – 188,000WuXi Pharmatech Cayman ...... – 68,900Xinao Gas Holding ................. 6,082,000 –Yanlord Land ......................... – 9,123,000Yantai Changyu Pioneer Wine ... 356,366 1,061,726Yue Yuen Industrial Holdings ... 1,405,500 –
*Traded on regulated exchanges or markets.
FIRST STATE CHINA GROWTH FUND
PORTFOLIO CHANGES (UNAUDITED)
6

JOBNAME: 08081916 PAGE: 8 SESS: 26 OUTPUT: Mon Aug 18 12:43:17 2008
PERFORMANCE^
01/01/07To
30/06/07
01/01/08To
30/06/08
First State Global 100 Fund “The Fund”– Class I 11.04% -10.53%– Class III 11.81% -9.90%
MSCI World Index(Total Return) 9.48% -10.25%
^ Performance calculation is base on official dealingNAV.
Global equity markets declined over the firsthalf of 2008 with the MSCI World Index falling by10.3% in US dollar terms.
Markets fell heavily in the first quarter onrising concerns about the impact of the creditcrunch on the global economy. However, action bycentral banks eased liquidity conditions andmarkets rallied strongly following the takeover ofBear Stearns by JP Morgan. They continued to risein April and May as risk appetite retuned, but fellvery substantially in June on concerns aboutinflationary pressures as the oil price continued torise above $140 per barrel.
Performance was positively impacted by BHPBilliton (UK: Materials) which rose strongly asinvestors became less concerned about the impactof the credit crunch on the global economy.Occidental Petroleum (US: Energy) outperformedas the oil price continued to reach new highs andSankyo (Japan: Consumer Discretionary) added toperformance as the stock held up in decliningmarkets on a positive earnings outlook.
On the negative side, Crocs (ConsumerDiscretionary) lagged as the market questioned thesustainability of its growth against a backdrop ofslowing consumption. In the Financials sector Bankof America and Lehman Brothers underperformedon continuing concerns about the US financialsystem.
Over the six month period significant newpurchases included Conagra Food (US: ConsumerStaples) which was trading at an attractivevaluation and offers defensive earnings in aninflationary environment. We also bought Microsoft(US: Information Technology) as it was trading ona very low multiple relative to its history and webelieve that the full potential of Vista is not beingrecognised by the market. We also purchaseddiversified mining company BHP Billiton whichwas attractively valued given recent weakness.
We sold European car companies Peugeot andDaimlerChrysler as the outlook has deteriorated ondemand weakness and rising raw material prices.Nokia (Europe: Information Technology) was alsosold as the company have an ageing portfolio ofhandsets in the short-term and new models are notexpected until later in the year.
While there is clear evidence of slowingeconomic activity driven principally by decliningUS consumer spending, the global economycontinues to expand thanks to investment spendingand demand for commodities. Inflationarypressures are a growing concern as oil and othercommodity prices continue to rise. However, at themoment this remains balanced by muted wage costsacross the OECD. We maintain our bottom-upapproach focused on finding companies withgrowth opportunities which have not beenrecognised by the market or which are undergoingstrategic change.
FIRST STATE GLOBAL 100 FUND
INVESTMENT MANAGER’S REPORT (UNAUDITED)
7

JOBNAME: 08081916 PAGE: 9 SESS: 26 OUTPUT: Mon Aug 18 12:43:17 2008
Numberof shares
FairValue
US$
% ofNet
Assets
Financial Assets at Fair Value Through Profit or Loss*
Bermuda 474,375 0.85Accenture ................... 11,500 474,375 0.85
Britain 1,344,771 2.42Vedanta Resources ....... 9,881 429,823 0.77Vodafone Group .......... 316,116 914,948 1.65
Denmark 969,227 1.74Vestas Wind Systems .... 7,400 969,227 1.74
France 4,175,933 7.52AXA........................... 24,844 732,646 1.31BNP Paribas ................ 13,984 1,254,733 2.26Electricite de France ..... 5,490 511,604 0.92Pernod-Ricard ............. 6,903 694,348 1.25Total .......................... 11,626 982,602 1.78
Germany 3,990,130 7.18BASF ......................... 17,644 1,214,683 2.19Deutsche Boerse .......... 4,857 539,377 0.97E.ON ......................... 6,381 1,271,479 2.29Epcos ......................... 27,970 441,266 0.79Fresenius Medical Care 9,579 523,325 0.94
Greece 705,004 1.27EFG EurobankErgasias .................... 30,012 705,004 1.27
Hong Kong 1,463,105 2.63Esprit Holdings ........... 94,800 984,169 1.77Henderson LandDevelopment ............. 77,000 478,936 0.86
Ireland 272,870 0.49Ishares ........................ 21,367 272,870 0.49
Israel 307,360 0.55Teva Pharmaceutical ..... 6,800 307,360 0.55
Japan 4,281,434 7.71East Japan Railway ...... 113 929,003 1.68Nintendo .................... 2,100 1,195,552 2.15Sankyo ....................... 16,200 1,065,475 1.92Sumitomo MitsuiFinancial Group ......... 88 668,270 1.20
Sumitomo Trust &Banking..................... 60,000 423,134 0.76
Numberof shares
FairValue
US$
% ofNet
Assets
Financial Assets at Fair Value Through Profit or Loss*
Norway 2,325,462 4.19DnB ........................... 32,000 411,675 0.74ODIN Sverige II ........... 34,824 1,323,055 2.38Telenor ....................... 31,400 590,732 1.07
South Africa 460,328 0.83Barloworld .................. 16,155 460,328 0.83
Spain 753,440 1.36Banco Santander .......... 41,230 753,440 1.36
Switzerland 4,969,460 8.95Addax Petroleum ......... 14,738 704,378 1.27Credit Suisse Group ..... 12,105 550,184 0.99Nestle ........................ 24,650 1,112,114 2.00Roche Holding ............ 4,458 779,140 1.40Syngenta .................... 3,473 1,111,387 2.00Xstrata ....................... 8,917 712,257 1.29
United Kingdom 732,900 1.32British AmericanTobacco .................... 21,429 732,900 1.32
United States 27,987,542 50.37Abercrombie & Fitch ... 15,258 977,580 1.76Apache ...................... 10,364 1,418,106 2.56Arrow Electronics ........ 36,355 1,101,920 1.98Assurant ..................... 19,931 1,342,951 2.42Autozone .................... 7,255 871,471 1.57Bank of America ......... 26,932 662,258 1.19Baxter International ..... 11,741 737,570 1.33Chevron ...................... 9,035 883,533 1.59ConAgra Foods ........... 63,667 1,250,420 2.25Exelon ....................... 11,712 1,017,656 1.83Gilead Sciences ........... 17,874 945,892 1.70Great Atlantic & PacificTea .......................... 41,883 961,634 1.73
Hess .......................... 5,407 685,878 1.24Hewlett-Packard .......... 22,669 1,009,677 1.82Honeywell International 11,908 586,112 1.05Johnson & Johnson ....... 14,137 897,275 1.61Joy Global .................. 9,714 744,189 1.34JPMorgan Chase .......... 44,915 1,573,822 2.84Marathon Oil .............. 15,833 810,966 1.46McDonalds ................. 18,725 1,055,715 1.90MetLife ...................... 9,497 510,844 0.92Microsoft ................... 40,626 1,124,934 2.02
*Traded on regulated exchanges or markets.
FIRST STATE GLOBAL 100 FUND
SCHEDULE OF INVESTMENTS
AS OF 30 JUNE 2008
8
JOBNAME: 08081916 PAGE: 10 SESS: 26 OUTPUT: Mon Aug 18 12:43:17 2008
Numberof shares
FairValue
US$
% ofNet
Assets
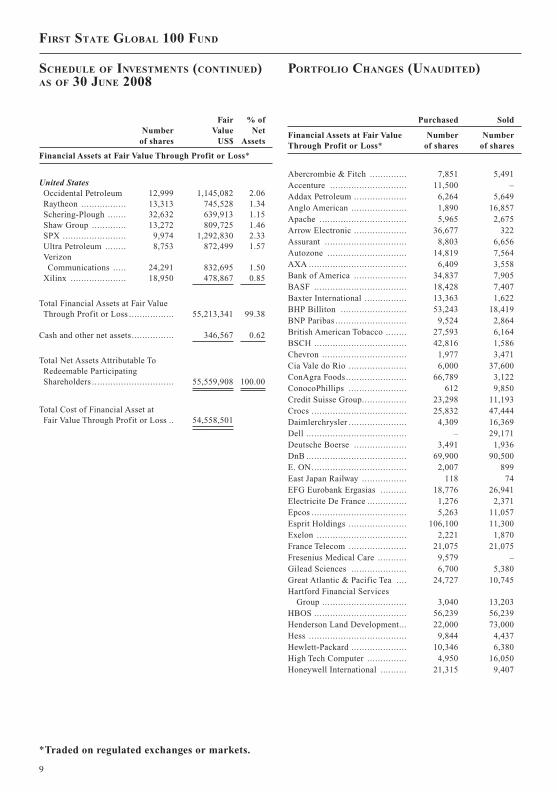
Financial Assets at Fair Value Through Profit or Loss*
United StatesOccidental Petroleum 12,999 1,145,082 2.06Raytheon ................. 13,313 745,528 1.34Schering-Plough ....... 32,632 639,913 1.15Shaw Group ............. 13,272 809,725 1.46SPX ........................ 9,974 1,292,830 2.33Ultra Petroleum ........ 8,753 872,499 1.57VerizonCommunications ..... 24,291 832,695 1.50
Xilinx ..................... 18,950 478,867 0.85
Total Financial Assets at Fair ValueThrough Profit or Loss ................. 55,213,341 99.38
Cash and other net assets ................ 346,567 0.62
Total Net Assets Attributable ToRedeemable ParticipatingShareholders ............................... 55,559,908 100.00
Total Cost of Financial Asset atFair Value Through Profit or Loss .. 54,558,501
Purchased Sold
Financial Assets at Fair ValueThrough Profit or Loss*
Numberof shares
Numberof shares
Abercrombie & Fitch .............. 7,851 5,491Accenture ............................. 11,500 –Addax Petroleum .................... 6,264 5,649Anglo American ..................... 1,890 16,857Apache ................................. 5,965 2,675Arrow Electronic .................... 36,677 322Assurant ............................... 8,803 6,656Autozone .............................. 14,819 7,564AXA ..................................... 6,409 3,558Bank of America .................... 34,837 7,905BASF ................................... 18,428 7,407Baxter International ................ 13,363 1,622BHP Billiton ......................... 53,243 18,419BNP Paribas ........................... 9,524 2,864British American Tobacco ........ 27,593 6,164BSCH ................................... 42,816 1,586Chevron ................................ 1,977 3,471Cia Vale do Rio ...................... 6,000 37,600ConAgra Foods ....................... 66,789 3,122ConocoPhillips ...................... 612 9,850Credit Suisse Group................. 23,298 11,193Crocs .................................... 25,832 47,444Daimlerchrysler ...................... 4,309 16,369Dell ...................................... – 29,171Deutsche Boerse .................... 3,491 1,936DnB ...................................... 69,900 90,500E. ON.................................... 2,007 899East Japan Railway ................. 118 74EFG Eurobank Ergasias .......... 18,776 26,941Electricite De France ............... 1,276 2,371Epcos .................................... 5,263 11,057Esprit Holdings ...................... 106,100 11,300Exelon .................................. 2,221 1,870France Telecom ...................... 21,075 21,075Fresenius Medical Care ........... 9,579 –Gilead Sciences ..................... 6,700 5,380Great Atlantic & Pacific Tea .... 24,727 10,745Hartford Financial Services
Group ................................ 3,040 13,203HBOS ................................... 56,239 56,239Henderson Land Development... 22,000 73,000Hess ..................................... 9,844 4,437Hewlett-Packard ..................... 10,346 6,380High Tech Computer ............... 4,950 16,050Honeywell International .......... 21,315 9,407
*Traded on regulated exchanges or markets.
FIRST STATE GLOBAL 100 FUND
SCHEDULE OF INVESTMENTS (CONTINUED)AS OF 30 JUNE 2008
PORTFOLIO CHANGES (UNAUDITED)
9
JOBNAME: 08081916 PAGE: 11 SESS: 26 OUTPUT: Mon Aug 18 12:43:17 2008
Purchased Sold
Financial Assets at Fair ValueThrough Profit or Loss*
Numberof shares
Numberof shares
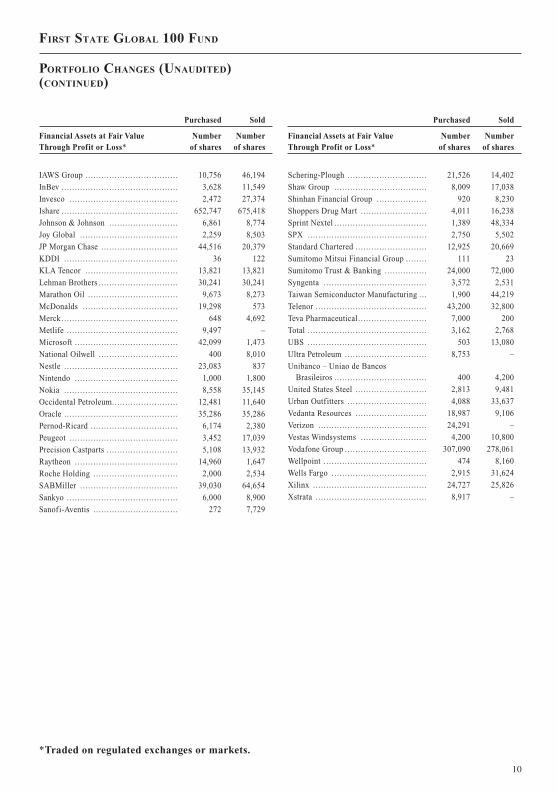
IAWS Group ... . . . . . . . . . . . . . . . . . . . . . . . . . . . . . . . . 10,756 46,194InBev ... . . . . . . . . . . . . . . . . . . . . . . . . . . . . . . . . . . . . . . . . . 3,628 11,549Invesco .. . . . . . . . . . . . . . . . . . . . . . . . . . . . . . . . . . . . . . . . 2,472 27,374Ishare .. . . . . . . . . . . . . . . . . . . . . . . . . . . . . . . . . . . . . . . . . . . 652,747 675,418Johnson & Johnson ... . . . . . . . . . . . . . . . . . . . . . . . 6,861 8,774Joy Global .. . . . . . . . . . . . . . . . . . . . . . . . . . . . . . . . . . . . 2,259 8,503JP Morgan Chase .. . . . . . . . . . . . . . . . . . . . . . . . . . . . 44,516 20,379KDDI ... . . . . . . . . . . . . . . . . . . . . . . . . . . . . . . . . . . . . . . . . 36 122KLA Tencor .. . . . . . . . . . . . . . . . . . . . . . . . . . . . . . . . . . 13,821 13,821Lehman Brothers .. . . . . . . . . . . . . . . . . . . . . . . . . . . . . 30,241 30,241Marathon Oil . . . . . . . . . . . . . . . . . . . . . . . . . . . . . . . . . . 9,673 8,273McDonalds .. . . . . . . . . . . . . . . . . . . . . . . . . . . . . . . . . . . 19,298 573Merck .. . . . . . . . . . . . . . . . . . . . . . . . . . . . . . . . . . . . . . . . . . . 648 4,692Metlife .. . . . . . . . . . . . . . . . . . . . . . . . . . . . . . . . . . . . . . . . . 9,497 –Microsoft . . . . . . . . . . . . . . . . . . . . . . . . . . . . . . . . . . . . . . . 42,099 1,473National Oilwell . . . . . . . . . . . . . . . . . . . . . . . . . . . . . . 400 8,010Nestle .. . . . . . . . . . . . . . . . . . . . . . . . . . . . . . . . . . . . . . . . . . 23,083 837Nintendo ... . . . . . . . . . . . . . . . . . . . . . . . . . . . . . . . . . . . . 1,000 1,800Nokia .. . . . . . . . . . . . . . . . . . . . . . . . . . . . . . . . . . . . . . . . . . 8,558 35,145Occidental Petroleum... . . . . . . . . . . . . . . . . . . . . . . 12,481 11,640Oracle .. . . . . . . . . . . . . . . . . . . . . . . . . . . . . . . . . . . . . . . . . . 35,286 35,286Pernod-Ricard .. . . . . . . . . . . . . . . . . . . . . . . . . . . . . . . . 6,174 2,380Peugeot .. . . . . . . . . . . . . . . . . . . . . . . . . . . . . . . . . . . . . . . . 3,452 17,039Precision Castparts . . . . . . . . . . . . . . . . . . . . . . . . . . . 5,108 13,932Raytheon ... . . . . . . . . . . . . . . . . . . . . . . . . . . . . . . . . . . . . 14,960 1,647Roche Holding .. . . . . . . . . . . . . . . . . . . . . . . . . . . . . . . 2,000 2,534SABMiller .. . . . . . . . . . . . . . . . . . . . . . . . . . . . . . . . . . . . 39,030 64,654Sankyo ... . . . . . . . . . . . . . . . . . . . . . . . . . . . . . . . . . . . . . . . 6,000 8,900Sanofi-Aventis . . . . . . . . . . . . . . . . . . . . . . . . . . . . . . . . 272 7,729
Purchased Sold
Financial Assets at Fair ValueThrough Profit or Loss*
Numberof shares
Numberof shares
Schering-Plough ... . . . . . . . . . . . . . . . . . . . . . . . . . . . 21,526 14,402Shaw Group ... . . . . . . . . . . . . . . . . . . . . . . . . . . . . . . . . 8,009 17,038Shinhan Financial Group ... . . . . . . . . . . . . . . . . 920 8,230Shoppers Drug Mart .. . . . . . . . . . . . . . . . . . . . . . . . 4,011 16,238Sprint Nextel . . . . . . . . . . . . . . . . . . . . . . . . . . . . . . . . . . . 1,389 48,334SPX ... . . . . . . . . . . . . . . . . . . . . . . . . . . . . . . . . . . . . . . . . . . 2,750 5,502Standard Chartered .. . . . . . . . . . . . . . . . . . . . . . . . . . 12,925 20,669Sumitomo Mitsui Financial Group ... . . . . . 111 23Sumitomo Trust & Banking .. . . . . . . . . . . . . . . 24,000 72,000Syngenta .. . . . . . . . . . . . . . . . . . . . . . . . . . . . . . . . . . . . . . 3,572 2,531Taiwan Semiconductor Manufacturing .. . 1,900 44,219Telenor .. . . . . . . . . . . . . . . . . . . . . . . . . . . . . . . . . . . . . . . . . 43,200 32,800Teva Pharmaceutical . . . . . . . . . . . . . . . . . . . . . . . . . . 7,000 200Total . . . . . . . . . . . . . . . . . . . . . . . . . . . . . . . . . . . . . . . . . . . . . 3,162 2,768UBS ... . . . . . . . . . . . . . . . . . . . . . . . . . . . . . . . . . . . . . . . . . . 503 13,080Ultra Petroleum ... . . . . . . . . . . . . . . . . . . . . . . . . . . . . 8,753 –Unibanco – Uniao de Bancos
Brasileiros .. . . . . . . . . . . . . . . . . . . . . . . . . . . . . . . . . . 400 4,200United States Steel . . . . . . . . . . . . . . . . . . . . . . . . . . . 2,813 9,481Urban Outfitters .. . . . . . . . . . . . . . . . . . . . . . . . . . . . . 4,088 33,637Vedanta Resources .. . . . . . . . . . . . . . . . . . . . . . . . . . 18,987 9,106Verizon ... . . . . . . . . . . . . . . . . . . . . . . . . . . . . . . . . . . . . . . 24,291 –Vestas Windsystems ... . . . . . . . . . . . . . . . . . . . . . . 4,200 10,800Vodafone Group ... . . . . . . . . . . . . . . . . . . . . . . . . . . . . 307,090 278,061Wellpoint . . . . . . . . . . . . . . . . . . . . . . . . . . . . . . . . . . . . . . . 474 8,160Wells Fargo .. . . . . . . . . . . . . . . . . . . . . . . . . . . . . . . . . . . 2,915 31,624Xilinx .. . . . . . . . . . . . . . . . . . . . . . . . . . . . . . . . . . . . . . . . . . 24,727 25,826Xstrata .. . . . . . . . . . . . . . . . . . . . . . . . . . . . . . . . . . . . . . . . . 8,917 –
*Traded on regulated exchanges or markets.
FIRST STATE GLOBAL 100 FUND
PORTFOLIO CHANGES (UNAUDITED)(CONTINUED)
10

JOBNAME: 08081916 PAGE: 12 SESS: 26 OUTPUT: Mon Aug 18 12:43:17 2008
PERFORMANCE^
01/01/07To
30/06/07
01/01/08To
30/06/08
First State Hong Kong Growth Fund “The Fund”– Class I 24.01% -18.79%– Class III 24.85% -18.27%
MSCI Hong Kong Index(Total Return) 6.34% -22.08%
^ Performance calculation is base on official dealingNAV.
The Hong Kong market fell heavily in the firsthalf of 2008. The MSCI Hong Kong Index declinedby 22.1% in US dollar terms, significantlyunderperforming the MSCI World Index which wasdown 10.2%.
Hong Kong weakness was driven by fallingglobal equity markets and concerns about theChinese Mainland. Rising worries about globalinflationary pressures and the end of interest ratecuts in the US negatively impacted Hong Kong.Inflation was also an issue in China where concernsremain about further monetary tightening. TheMainland Chinese stock markets correctedsignificantly following the bubble conditions of2007 which undermined investor confidence inHong Kong.
Fund performance was positively impacted byconglomerate Jardine Matheson whichoutperformed on delivering positive results. CLP(Utilities) and MTR, which operates the masstransit railway system, both outperformed asinvestors sought greater earnings security in anuncertain environment.
Property developers Cheung Kong and SwirePacific both underperformed over the six monthson concerns that global inflationary pressureswould result in higher US and Hong Kong interestrates. Minth Group underperformed on weakerdemand for auto parts.
Significant purchases over the period includedCLP for its strong defensive qualities in the currentuncertain climate and Hutchison Whampoa as manyof the conglomerate’s businesses in ports, energyand retail have improving prospects. We alsobought financial company Dah Sing Financial forthe positive outlook for its insurance business.
In the Financials sectors we sold KerryProperties, Hang Seng Bank and Sun Hung KaiProperties as we believe that earnings arevulnerable to rising interest rates. HutchisonTelecommunications was sold as there are betteropportunities elsewhere and MTR as it reached ourvaluation target.
We intend to use the current market weaknessto add to quality names. We still like the assetreflation story in Hong Kong, although risingmortgage rates and a global slowdown are obviousheadwinds. We favour developers with strongerbalance sheets and robust pipelines, such asCheung Kong. Longer term, Hong Kong companieswill continue to benefit from rising Chinesedemand and urbanisation. Examples include HongKong & China Gas and Hang Lung Group. Whilethe weakening US economy is a concern, valuationsfor manufacturers like Kingboard Chemical andYue Yuen are not high. A more difficult operatingenvironment will force out weaker companies,resulting in stronger ones gaining market share.
FIRST STATE HONG KONG GROWTH FUND
INVESTMENT MANAGER’S REPORT (UNAUDITED)
11

JOBNAME: 08081916 PAGE: 13 SESS: 26 OUTPUT: Mon Aug 18 12:43:17 2008
Numberof shares
FairValue
US$
% ofNet
Assets
Financial Assets at Fair Value Through Profit or Loss*
Autos & Trucks 1,395,740 1.11Minth Group ............... 1,986,000 1,395,740 1.11
Banks 9,983,360 7.94China Merchants Bank . 199,500 626,836 0.50Chong Hing Bank ........ 358,000 851,211 0.68Dah Sing Banking ........ 1,299,708 2,306,888 1.83Dah Sing FinancialHoldings ................... 224,800 1,813,391 1.44
Wing Hang Bank ......... 331,000 4,385,034 3.49
Basic Materials 1,243,170 0.99Sino Gold Mining ........ 222,586 1,243,170 0.99
Brewery 827,204 0.66Vitasoy InternationalHoldings ................... 1,748,000 827,204 0.66
Commercial Services 626,877 0.50Hong Kong AircraftEngineerg ................. 40,700 626,877 0.50
Computer Software 3,263,856 2.60Lenovo ....................... 2,128,000 1,438,225 1.14SinoCom SoftwareGroup ....................... 5,510,000 911,561 0.73
Tencent Holdings ......... 118,200 914,070 0.73
Consumer 9,881,632 7.86Alco Holdings ............. 2,554,000 714,039 0.57Belle InternationalHoldings ................... 945,000 848,349 0.67
China Dongxiang Group 1,207,000 487,599 0.39Dickson Concepts ........ 1,448,500 1,008,702 0.80Fujikon IndustrialHoldings ................... 3,360,000 848,887 0.68
Glorious SunEnterprises ................ 1,898,600 925,256 0.74
Goldlion Holdings ....... 4,220,000 1,082,398 0.86Hengan InternationalGroup ....................... 264,000 770,247 0.61
Little Sheep Group ....... 1,253,000 462,794 0.37Moiselle International ... 3,482,000 759,141 0.60Pacific Textile Holdings 892,000 161,298 0.13Pou Sheng InternationalHoldings ................... 10,387 3,157 0.00
SA SA InternationalHoldings ................... 2,770,000 1,257,557 1.00
Vinda InternationalHoldings ................... 1,864,000 552,208 0.44
Numberof shares
FairValue
US$
% ofNet
Assets
Financial Assets at Fair Value Through Profit or Loss*
Departmental Stores 2,981,567 2.37Aeon Stores ................ 1,386,500 2,592,519 2.06Convenience Retail Asia 1,280,000 389,048 0.31
Diversified Resourses 5,960,004 4.74China MerchantsHoldings International 190,000 734,659 0.58
Swire Pacific “A” ......... 1,910,000 5,225,345 4.16
Electronics 12,751,123 10.14ASM PacificTechnology ............... 314,700 2,375,132 1.89
China Resources PowerHoldings ................... 612,000 1,489,677 1.18
CLP Holdings ............. 605,000 5,179,064 4.12Kingboard ChemicalHoldings ................... 802,980 3,707,250 2.95
Finance 4,707,877 3.74Aeon Credit Service ..... 1,728,000 1,728,554 1.37First Pacific ................ 1,642,000 1,033,949 0.82Hopewell Holdings ....... 365,000 1,296,633 1.03Public FinancialHoldings ................... 988,000 648,741 0.52
Foods 4,963,037 3.95Cafe de Coral Holdings 1,536,000 2,753,867 2.19China Mengniu Dairy.... 783,000 2,209,170 1.76
Hotel 1,064,341 0.85Shangri-La Asia .......... 456,000 1,064,341 0.85
Industrial Material 9,748,988 7.75Fosun International**.... 897,500 652,623 0.52Haitian InternationalHoldings ................... 2,118,000 923,527 0.73
Jardine MathesonHoldings ................... 230,689 7,105,221 5.65
Yue Yuen IndustrialHoldings ................... 449,500 1,067,617 0.85
Infrastructure 2,286,956 1.82Anhui Expressway ....... 777,800 548,624 0.44Hopewell HighwayInfrastructure ............ 2,321,000 1,738,332 1.38
Machine Tools 1,089,349 0.87Chen Hsong Holdings ... 2,574,000 1,089,349 0.87
Management 343,538 0.27Link Real EstateInvestment Trust ......... 151,000 343,538 0.27
*Traded on regulated exchanges or markets.**Valued using a quote from a single broker.
FIRST STATE HONG KONG GROWTH FUND
SCHEDULE OF INVESTMENTS
AS OF 30 JUNE 2008
12
JOBNAME: 08081916 PAGE: 14 SESS: 26 OUTPUT: Mon Aug 18 12:43:17 2008
Numberof shares
FairValue
US$
% ofNet
Assets
Financial Assets at Fair Value Through Profit or Loss*
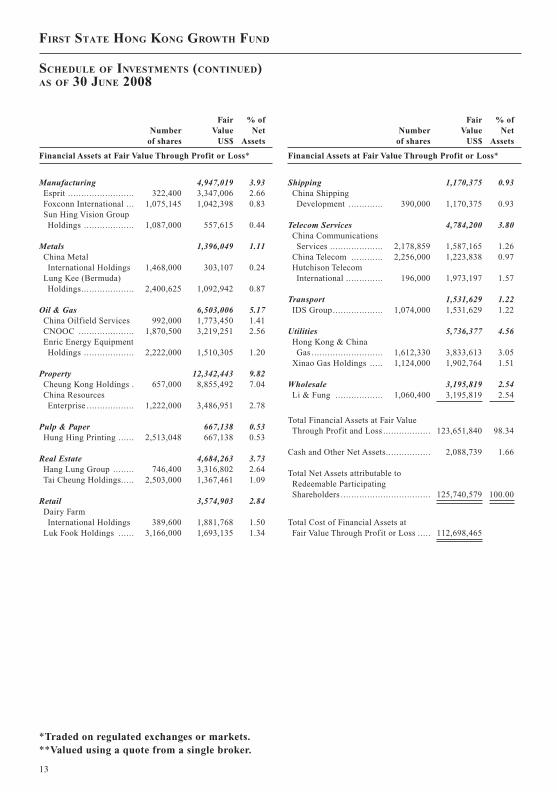
Manufacturing 4,947,019 3.93Esprit ......................... 322,400 3,347,006 2.66Foxconn International ... 1,075,145 1,042,398 0.83Sun Hing Vision GroupHoldings ................... 1,087,000 557,615 0.44
Metals 1,396,049 1.11China MetalInternational Holdings 1,468,000 303,107 0.24
Lung Kee (Bermuda)Holdings.................... 2,400,625 1,092,942 0.87
Oil & Gas 6,503,006 5.17China Oilfield Services 992,000 1,773,450 1.41CNOOC ..................... 1,870,500 3,219,251 2.56Enric Energy EquipmentHoldings ................... 2,222,000 1,510,305 1.20
Property 12,342,443 9.82Cheung Kong Holdings . 657,000 8,855,492 7.04China ResourcesEnterprise .................. 1,222,000 3,486,951 2.78
Pulp & Paper 667,138 0.53Hung Hing Printing ...... 2,513,048 667,138 0.53
Real Estate 4,684,263 3.73Hang Lung Group ........ 746,400 3,316,802 2.64Tai Cheung Holdings..... 2,503,000 1,367,461 1.09
Retail 3,574,903 2.84Dairy FarmInternational Holdings 389,600 1,881,768 1.50
Luk Fook Holdings ...... 3,166,000 1,693,135 1.34
Numberof shares
FairValue
US$
% ofNet
Assets
Financial Assets at Fair Value Through Profit or Loss*
Shipping 1,170,375 0.93China ShippingDevelopment ............. 390,000 1,170,375 0.93
Telecom Services 4,784,200 3.80China CommunicationsServices .................... 2,178,859 1,587,165 1.26
China Telecom ............ 2,256,000 1,223,838 0.97Hutchison TelecomInternational .............. 196,000 1,973,197 1.57
Transport 1,531,629 1.22IDS Group................... 1,074,000 1,531,629 1.22
Utilities 5,736,377 4.56Hong Kong & ChinaGas ........................... 1,612,330 3,833,613 3.05
Xinao Gas Holdings ..... 1,124,000 1,902,764 1.51
Wholesale 3,195,819 2.54Li & Fung .................. 1,060,400 3,195,819 2.54
Total Financial Assets at Fair ValueThrough Profit and Loss .................. 123,651,840 98.34
Cash and Other Net Assets................. 2,088,739 1.66
Total Net Assets attributable toRedeemable ParticipatingShareholders .................................. 125,740,579 100.00
Total Cost of Financial Assets atFair Value Through Profit or Loss ..... 112,698,465
*Traded on regulated exchanges or markets.**Valued using a quote from a single broker.
FIRST STATE HONG KONG GROWTH FUND
SCHEDULE OF INVESTMENTS (CONTINUED)AS OF 30 JUNE 2008
13

JOBNAME: 08081916 PAGE: 15 SESS: 26 OUTPUT: Mon Aug 18 12:43:17 2008
Purchased Sold
Financial Assets at Fair ValueThrough Profit or Loss*
Numberof shares
Numberof shares
ASM Pacific Technology ......... 35,900 91,300Cafe De Coral......................... 1,036,000 –Champion ............................. 311,000 311,000Cheung Kong Holdings ............ 167,000 50,000China Communications
Services ............................. 294,000 1,090,000China Dongxiang Group........... 395,000 1,875,000China Mengniu Dairy ............. 237,000 206,000China Merchants Bank ............ 199,500 154,000China Merchants ..................... – 172,000China Oilfield Services ........... 594,000 312,000China Resources ..................... 382,000 126,000China Resources Power Holding 50,000 1,134,000China Shenhua Energy ............. – 112,500China Shipping Development .... – 198,000China Telecom ....................... 952,000 496,000Chong Hing Bank ................... 92,000 –CLP Holdings ......................... 738,500 133,500CNOOC................................. 170,000 101,000Convenience Retail Asia .......... 1,280,000 –Dah Sing Banking Group.......... 82,953 –Dah Sing Finance Holdings ...... 224,800 –Dairy Farm International ......... 175,500 –Dickson Concepts .................. 584,500 –Enric Energy Equipment
Holding .............................. – 8,000Esprit .................................... – 46,100First Pacific ........................... 144,000 –Fosun International** ............. 256,000 –Foxconn International ............. – 82,000Fujikon Industrial Holdings ...... 262,000 –Haitian International Holdings . 179,000 –Hang Lung Group .................. – 349,000Hang Seng Bank ..................... – 115,100Hengan International Group...... 264,000 –Hong Kong & China Gas ......... 276,030 358,000
Purchased Sold
Financial Assets at Fair ValueThrough Profit or Loss*
Numberof shares
Numberof shares
Hong Kong AircraftEngineering ....................... – 87,200
Hopewell HighwayInfrastructure ...................... 274,500 –
Hutchison Telecommunications . – 928,000Hutchison Whampoa ............... 196,000 –IDS Group ............................ 106,000 –Jardine Matheson Holdings....... 44,400 32,800Kerry Properties ..................... – 188,654Kingboard Chemicals .............. 181,500 222,500Kingboard Laminates Holdings . – 1,238,000Lenovo ................................. 2,684,000 556,000Li & Fung .............................. 116,000 402,000Little Sheep Group ................. 1,253,000 –Luk Fook Holdings ................. – 162,000Minth Group .......................... 46,000 –MTR .................................... – 1,350,000Pou Sheng International .......... 10,387 –Public Financial Holdings ........ 1,698,000 710,000Regent Manner ...................... – 3,414,000Sa Sa International ................. 306,000 1,176,000Shangri-La Asia ..................... – 62,000Sino Gold Mining ................... 108,986 –Sun Hing Vision Group
Holdings ............................ – 512,000Sun Hung Kai Properties ......... 12,000 113,000Swire Pacific “A”.................... 55,500 252,500Tai Cheung Holdings ............... 65,000 –Tencent Holdings ................... – 53,800The Link Real Estate
Investment Trust .................. – 312,500TPV Technology .................... 384,000 384,000Transport International
Holdings ............................ – 87,600Wing Hang Bank..................... 21,500 95,000Yue Yuen Industrial Holdings .... 77,500 –
*Traded on regulated exchanges or markets.**Valued using a quote from a single broker.
FIRST STATE HONG KONG GROWTH FUND
PORTFOLIO CHANGES (UNAUDITED)
14

JOBNAME: 08081916 PAGE: 16 SESS: 26 OUTPUT: Mon Aug 18 12:43:17 2008
PERFORMANCE^
01/01/07To
30/06/07
01/01/08To
30/06/08
First State Indian Subcontinent Fund “The Fund”– Class I 15.78% -36.60%– Class II 15.35% -36.86%– Class I (Dist) 15.75% -36.65%
MSCI India Index(Total Return) 16.79% -41.38%
^ Performance calculation is base on official dealingNAV.
Over the six months to 30 June 2008 theMSCI India Index declined by 41.4% in US dollarterms, significantly underperforming the MSCIEmerging Markets Index which fell by 11.6%.
Rising concerns about global inflationarypressures driven by an escalating oil priceundermined investor confidence. Indian inflationfigures rose sharply and the central bank increasedinterest rates by 150 basis points. The governmentwas forced to raise prices of petrol, diesel andcooking gas to reduce subsidy levels and containthe fiscal deficit. Also, because of positiveperformance in late 2007 there were large profits tobe taken.
Fund performance was helped by SunPharmaceuticals (Health Care) which outperformedas investors were attracted by the defensive natureof its businesses. Aitken Spence, one of the largestbusiness groups in Sri Lanka, also added toperformance on an improving earnings outlook,particularly from its international businesses.Telecoms group Onmobile Global performedstrongly following its initial public offering (IPO).
On the negative side, Housing DevelopmentFinance underperformed on rising interest rates andGrasim Industries detracted as cement prices fellmore than anticipated. Indian Hotels (Consumer
Discretionary) underperformed as it declined onconcerns about the impact of rising inflation andtightening monetary policy.
Over the six month period we boughtsignificant new positions in Tech Mahindra, areasonably priced IT solution provider withexpertise in the telecoms space, and OnmobileGlobal, a value added service provider for Indianmobile phone operators. We also bought IndianBank which has a strong franchise in the southernstates and was attractively priced.
We sold Jaiprakash Associates, a companywith strength in hydro-dam construction, due tofears that margins may be squeezed by rising costs,and oil exploration company Cairn Energy onvaluation concerns. We also sold wind turbinemanufacturer Suzlon Energy because of adeterioration of the earnings outlook.
Short-term growth expectations are beingrevised down as the macro-economic picturedeteriorates with higher oil prices fuelling inflationand exacerbating the fiscal and current accountdeficits. However, the long-term structural growthdrivers of consumption, outsourcing and a positiveinvestment cycle remain intact and growth willremain well above the global average. Valuationshave corrected and some selective investmentopportunities are emerging with more reasonablerisk/return profiles. We continue to construct theportfolio from the ’bottom-up’, focusing oncompanies which offer quality in terms ofmanagement, franchise and financials. Greateremphasis is being given to earnings visibility andstronger cash flows. The fund maintains a strongexposure to the Consumer sectors.
FIRST STATE INDIAN SUBCONTINENT FUND
INVESTMENT MANAGER’S REPORT (UNAUDITED)
15

JOBNAME: 08081916 PAGE: 17 SESS: 26 OUTPUT: Mon Aug 18 12:43:17 2008
Numberof shares
FairValue
US$
% ofNet
Assets
Financial Assets at Fair Value Through Profit or Loss*
Equities
Automotive 3,819,774 2.86Mahindra & Mahindra .. 287,826 3,201,639 2.40Tata Motors ................ 62,500 618,135 0.46
Banks 6,172,999 4.63HDFC Bank ................ 145,185 3,381,974 2.54Indian Bank ................. 550,000 1,177,511 0.88Kotak Mahindra Bank .. 75,577 802,518 0.60National DevelopmentBank ........................ 612,800 810,996 0.61
Brewery 1,041,480 0.78Distilleries Co of SriLanka ....................... 1,144,300 1,041,480 0.78
Computer/Software 16,296,563 12.21Infosys Technologies .... 223,057 8,943,666 6.70MindTree ................... 63,457 578,869 0.43Tata ConsultancyServices .................... 176,310 3,534,652 2.65
Tata Elxsi ................... 308,000 1,447,826 1.09Tech Mahindra ............ 107,000 1,791,550 1.34
Consumer 14,820,986 11.11Colgate Palmolive ........ 343,700 2,846,970 2.13Godrej ConsumerProducts ................... 654,226 2,062,155 1.55
Godrej Industries ......... 346,101 1,079,250 0.81Hindustan Unilever ...... 1,093,097 5,237,566 3.93Titan Industries ........... 122,551 2,806,250 2.10Trent** ....................... 72,840 788,795 0.59
Diversified Resourses 12,316,774 9.23Aitken Spence.............. 501,700 2,446,181 1.83Hemas Holdings .......... 1,005,000 758,358 0.57John Keells Holdings ... 2,248,578 2,291,910 1.72Reliance Industries ...... 140,500 6,820,325 5.11
Electronic 3,442,129 2.58Bharat HeavyElectricals ................. 107,700 3,442,129 2.58
Engineering 2,158,117 1.62ABB .......................... 117,072 2,158,117 1.62
Numberof shares
FairValue
US$
% ofNet
Assets
Financial Assets at Fair Value Through Profit or Loss*
Finance 10,346,954 7.75Ascendas India Trust ..... 3,106,000 2,058,014 1.54Commercial Bank ofCeylon ..................... 866,666 1,010,138 0.76
Housing DevelopmentFinance .................... 152,717 6,873,189 5.15
India Infoline .............. 35,000 405,613 0.30
Food & Beverages 6,281,696 4.71Nestle ......................... 90,650 3,427,959 2.57Tata Tea ...................... 164,583 2,853,737 2.14
Healthcare 3,230,016 2.42Dabur ......................... 1,745,915 3,230,016 2.42
Hotel 3,136,299 2.35Indian Hotels .............. 1,765,200 3,136,299 2.35
Industrials 23,029,267 17.26Bosch ........................ 38,800 3,462,719 2.60Crompton Greaves ....... 471,091 2,356,990 1.77Everest KantoCylinder ................... 420,000 2,571,977 1.93
Grasim Industries ........ 65,409 2,815,942 2.11Kirloskar Brothers ....... 62,248 278,126 0.21Larsen & Toubro .......... 47,760 2,409,562 1.81Marico Industries ......... 813,687 965,699 0.72MAX India 341,964 1,217,548 0.91Praj Industries ............. 360,000 1,301,033 0.97Sintex Industries .......... 357,976 2,466,229 1.85Thermax ..................... 151,025 1,282,440 0.96Voltas ........................ 663,067 1,901,002 1.42
Manufacturing 2,310,667 1.73Shree Renuka Sugars .... 1,005,000 2,310,667 1.73
Medical 7,913,959 5.93Cipla ......................... 432,212 2,112,178 1.58Sun Pharma AdvancedResearch ................... 251,100 469,220 0.35
Sun Pharmaceutical ...... 165,422 5,332,561 4.00
Oil & Gas 3,781,000 2.83Oil & Natural Gas ........ 201,860 3,781,000 2.83
*Traded on regulated exchanges or markets.**Valued using a quote from a single broker.
FIRST STATE INDIAN SUBCONTINENT FUND
SCHEDULE OF INVESTMENTS
AS OF 30 JUNE 2008
16
JOBNAME: 08081916 PAGE: 18 SESS: 26 OUTPUT: Mon Aug 18 12:43:17 2008
Numberof shares
FairValue
US$
% ofNet
Assets
Financial Assets at Fair Value Through Profit or Loss*
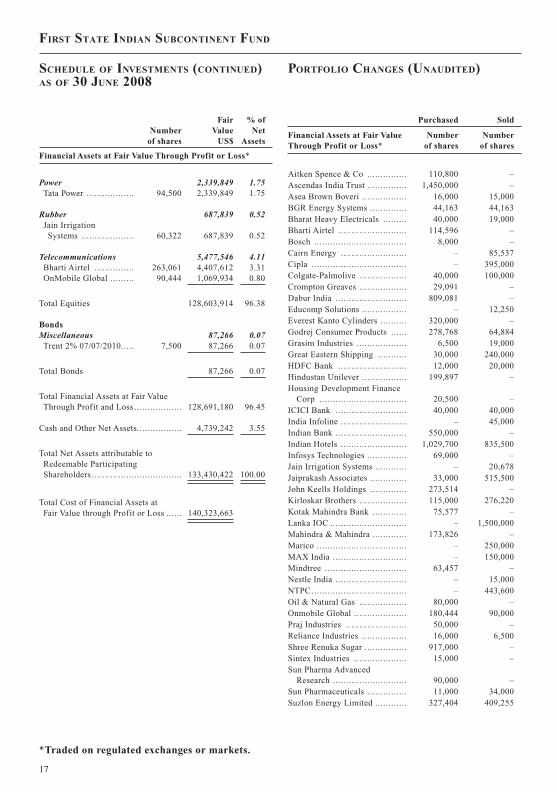
Power 2,339,849 1.75Tata Power .................. 94,500 2,339,849 1.75
Rubber 687,839 0.52Jain IrrigationSystems .................... 60,322 687,839 0.52
Telecommunications 5,477,546 4.11Bharti Airtel ............... 263,061 4,407,612 3.31OnMobile Global ......... 90,444 1,069,934 0.80
Total Equities 128,603,914 96.38
BondsMiscellaneous 87,266 0.07Trent 2% 07/07/2010..... 7,500 87,266 0.07
Total Bonds 87,266 0.07
Total Financial Assets at Fair ValueThrough Profit and Loss .................. 128,691,180 96.45
Cash and Other Net Assets................. 4,739,242 3.55
Total Net Assets attributable toRedeemable ParticipatingShareholders .................................. 133,430,422 100.00
Total Cost of Financial Assets atFair Value through Profit or Loss ...... 140,323,663
Purchased Sold
Financial Assets at Fair ValueThrough Profit or Loss*
Numberof shares
Numberof shares
Aitken Spence & Co ............... 110,800 –Ascendas India Trust ............... 1,450,000 –Asea Brown Boveri ................. 16,000 15,000BGR Energy Systems .............. 44,163 44,163Bharat Heavy Electricals ......... 40,000 19,000Bharti Airtel .......................... 114,596 –Bosch ................................... 8,000 –Cairn Energy ......................... – 85,537Cipla .................................... – 395,000Colgate-Palmolive .................. 40,000 100,000Crompton Greaves .................. 29,091 –Dabur India ........................... 809,081 –Educomp Solutions ................. – 12,250Everest Kanto Cylinders .......... 320,000 –Godrej Consumer Products ...... 278,768 64,884Grasim Industries ................... 6,500 19,000Great Eastern Shipping ........... 30,000 240,000HDFC Bank .......................... 12,000 20,000Hindustan Unilever ................. 199,897 –Housing Development Finance
Corp ................................. 20,500 –ICICI Bank ........................... 40,000 40,000India Infoline ......................... – 45,000Indian Bank ........................... 550,000 –Indian Hotels ......................... 1,029,700 835,500Infosys Technologies ............... 69,000 –Jain Irrigation Systems ............ – 20,678Jaiprakash Associates .............. 33,000 515,500John Keells Holdings .............. 273,514 –Kirloskar Brothers .................. 115,000 276,220Kotak Mahindra Bank ............. 75,577 –Lanka IOC ............................. – 1,500,000Mahindra & Mahindra ............. 173,826 –Marico .................................. – 250,000MAX India ............................ – 150,000Mindtree ............................... 63,457 –Nestle India ........................... – 15,000NTPC.................................... – 443,600Oil & Natural Gas .................. 80,000 –Onmobile Global .................... 180,444 90,000Praj Industries ....................... 50,000 –Reliance Industries ................. 16,000 6,500Shree Renuka Sugar ................ 917,000 –Sintex Industries .................... 15,000 –Sun Pharma Advanced
Research ............................ 90,000 –Sun Pharmaceuticals ............... 11,000 34,000Suzlon Energy Limited ............ 327,404 409,255
*Traded on regulated exchanges or markets.
FIRST STATE INDIAN SUBCONTINENT FUND
SCHEDULE OF INVESTMENTS (CONTINUED)AS OF 30 JUNE 2008
PORTFOLIO CHANGES (UNAUDITED)
17

JOBNAME: 08081916 PAGE: 19 SESS: 26 OUTPUT: Mon Aug 18 12:43:17 2008
Purchased Sold
Financial Assets at Fair ValueThrough Profit or Loss*
Numberof shares
Numberof shares
Tata Consultancy Services .. . . . . . . . . . . . . . . . . 57,000 127,383Tata Elxsi . . . . . . . . . . . . . . . . . . . . . . . . . . . . . . . . . . . . . . 100,000 –Tata Motors .. . . . . . . . . . . . . . . . . . . . . . . . . . . . . . . . . . . 222,500 160,000Tata Power .. . . . . . . . . . . . . . . . . . . . . . . . . . . . . . . . . . . . 44,000 47,500Tata Tea .. . . . . . . . . . . . . . . . . . . . . . . . . . . . . . . . . . . . . . . . 15,383 14,500Tech Mahindra .. . . . . . . . . . . . . . . . . . . . . . . . . . . . . . . 107,000 –Thermax ... . . . . . . . . . . . . . . . . . . . . . . . . . . . . . . . . . . . . . 101,025 –Titan Industries .. . . . . . . . . . . . . . . . . . . . . . . . . . . . . . 55,000 –Transport Corporation of India .. . . . . . . . . . . – 547,845Voltas .. . . . . . . . . . . . . . . . . . . . . . . . . . . . . . . . . . . . . . . . . . 368,067 –St Peter Port Capital NPV ... . . . . . . . . . . . . . . . . – 114,769
*Traded on regulated exchanges or markets.
FIRST STATE INDIAN SUBCONTINENT FUND
PORTFOLIO CHANGES (UNAUDITED)(CONTINUED)
18

JOBNAME: 08081916 PAGE: 20 SESS: 26 OUTPUT: Mon Aug 18 12:43:17 2008
PERFORMANCE^
01/01/07To
30/06/07
01/01/08To
30/06/08
First State Global Bond Fund “The Fund”– Class I -0.79% 4.24%– Class III -0.34% 4.70%
Citi Group World GovtBond – 1 Year -0.41% 5.02%
^ Performance calculation is base on official dealingNAV.
US Treasury yields fell during the early part of2008 on continuing concerns about the influence ofthe credit crunch on the global economy. The yieldof the 10-year benchmark bond declined from4.02% to 3.41% by the end of March.
In January on rising concerns about thefinancial system the Federal Reserve cut interestrates by 75 basis points (bps) and a week later by afurther 50 bps. Global bond markets benefited froma flight to quality. In March the Fed organized thetakeover of troubled investment bank Bear Stearnsby JP Morgan.
The tone of the market changed in April onrising inflationary fears driven by a higher oil priceand the 10-year bond yield rose to 3.73% by theend of the month. However, the Fed made another25 bps cut taking interest rates to 2%. Yieldscontinued to rise in May on surging oil prices andrising talk about the risk of stagflation. The yield ofthe 10-year benchmark bond rose to 3.97% at theend of the period.
US economic data was weak over the first sixmonths of 2008. The housing market continued toslump following the sub-prime crisis and prices fellsubstantially while foreclosures increased verysignificantly. The labour market continued toweaken and consumer confidence was negativelyimpacted by rising energy prices.
The European bond market followed the USwith yields falling on credit crunch concerns in theearly part of the year before rising as marketsfocused on inflation. However, the Europeaneconomic data was more resilient and the EuropeanCentral Bank left official interest rates at 4%throughout the period.
In Japan the bond market followed the samepattern with the benchmark 10-year JGB yieldfalling to 1.29% by the end of March on risingglobal risk aversion and weak domestic economicdata. But bond prices fell thereafter on risinginflationary concerns and had reached 1.60% by theend of June.
The Tankan quarterly survey was sluggish andhousehold spending and retail sales were alsosubdued. Core inflation returned to positiveterritory for the first time in 10 years.
US growth slowed in the first half of 2008 asthe housing market combined with financial sectormalaise continued to exert downward pressure onthe economy. The US Federal Reserve is in aposition where the conflicting forces of slowinggrowth and rising inflationary pressures arelimiting potential policy responses. As such, themarket is now expecting subdued growth for theremainder of 2008 and into 2009. Treasury yieldsare currently below our fair value estimate and weintend to hold a short duration position.
In Europe, the forward looking activity andconfidence surveys are now pointing to a slowdownin the economy. However, the ECB remainsconcerned about the potential for inflationarypressures to take hold within the Euro-zone. Inresponse Governor Trichet has sent a clear messageto the market that the ECB intends to raise officialrates, possibly as soon as July. The hawkish centralbank combined with slowing activity and a strongEuro is placing downward pressure on yields.Euro-zone bond yields are currently above fairvalue and as such we are holding a long durationposition.
FIRST STATE GLOBAL BOND FUND
INVESTMENT MANAGER’S REPORT (UNAUDITED)
19

JOBNAME: 08081916 PAGE: 21 SESS: 26 OUTPUT: Mon Aug 18 12:43:17 2008
In Japan the leading economic indicators areshowing weak growth and deteriorating businessconfidence. Nevertheless, rising global food andenergy prices are helping to push headline inflationtowards 10 year highs. The Bank of Japan hasindicated it remains comfortable that inflationarypressures will moderate in the near future whilehighlighting the downwards risks to growth. Yieldsin Japan are now close to what we consider fairvalue and we intend to maintain our neutralduration position.
FIRST STATE GLOBAL BOND FUND
INVESTMENT MANAGER’S REPORT (UNAUDITED)(CONTINUED)
20

JOBNAME: 08081916 PAGE: 22 SESS: 26 OUTPUT: Mon Aug 18 12:43:17 2008
Numberof shares
FairValue
US$
% ofNet
Assets
Financial Assets at Fair Value Through Profit or Loss*
Canadian Dollar 432,353 1.64Canada (Govt Of)4.25% 01/09/2008 ....... 100,000 99,411 0.38
Canada (Govt Of)5.25% 01/06/2013 ....... 310,000 332,942 1.26
Euro 10,178,528 38.59BundesrepublicDeutschland 4%04/01/2018................. 850,000 1,281,873 4.86
BundesrepublikDeutschland 4%04/07/2016................. 2,070,000 3,136,463 11.89
BundesrepublikDeutschland 4.75%04/07/2034................. 500,000 769,377 2.92
BundesrepublikDeutschland 5%04/07/2012................. 500,000 799,159 3.03
BundesrepublikDeutschland 5.25%04/07/2010................. 175,000 279,988 1.06
Caisse d’Amortissementde la Dette 4%25/10/2019................. 450,000 650,682 2.47
CAS Depositi e Prestiti3% 31/01/2013 ........... 250,000 357,570 1.36
France (Govt Of) 3.25%25/04/2016................. 950,000 1,356,527 5.14
France (Govt Of) 5.5%25/04/2010................. 165,000 264,260 1.00
Greece (Rep of) 3.7%20/07/2015................. 400,000 579,921 2.20
Italy (Rep of) 5%01/08/2034................. 470,000 702,708 2.66
Japanese Yen 7,428,700 28.16Depfa ACS Bank 1.65%20/12/2016................. 20,000,000 183,149 0.69
Deutsche Bahn Finance1.65% 01/12/2014 ....... 85,000,000 792,439 3.00
Development Bank ofJapan 1.7%20/09/2022................. 173,000,000 1,566,808 5.94
Development Bank ofJapan 1.75%17/03/2017................. 140,000,000 1,344,048 5.10
European InvestmentBank 1.4%20/06/2017................. 40,000,000 372,412 1.41
European InvestmentBank 1.9%26/01/2026................. 55,000,000 498,186 1.89
General Electric Capital1.45% 10/11/2011 ....... 140,000,000 1,289,493 4.89
Numberof shares
FairValue
US$
% ofNet
Assets
Financial Assets at Fair Value Through Profit or Loss*
Japanese Yen (continued)HBOS 0.55%01/07/2013................. 60,000,000 570,261 2.16
Japan (Govt Of) 0.9%22/12/2008................. 25,000,000 237,937 0.90
Japan (Govt Of) 1.1%21/03/2011................. 60,000,000 573,967 2.18
Swedish Krono 199,687 0.76Sweden (Govt Of) 4.5%12/08/2015 .................. 1,200,000 199,687 0.76
Sterling Pound 1,731,905 6.57Depfa ACS Bank4.875% 30/12/2008 ..... 110,000 217,871 0.83
UK 5% 07/03/2025 ....... 770,000 1,514,034 5.74
United States Dollars 5,043,752 19.12Development Bank ofJapan 4.25% 09/06/2015 ......................... 300,000 296,145 1.12
European InvestmentBank 2.625% 16/05/2011 ......................... 200,000 195,504 0.74
LandNordrehein-Westfalen3.75% 30/11/2009 ....... 200,000 201,180 0.76
US Treasury Note 3.5%15/02/2010................. 100,000 101,656 0.39
US Treasury Bond4.625% 31/07/2009 ..... 1,250,000 1,278,906 4.85
US Treasury Bond6.25% 15/08/2023 ....... 240,000 285,262 1.08
US Treasury Bill11/09/2008................. 1,500,000 1,488,358 5.64
US Treasury Bill31/07/2008................. 1,200,000 1,196,741 4.54
Futures Contracts (Note 9)................. – –
Total Financial Assets at Fair ValueThrough Profit or Loss .................... 25,014,925 94.84
Cash and other net assets ................... 1,361,993 5.16
Total Net Assets Attributable toRedeemable ParticipatingShareholders .................................. 26,376,918 100.00
Total Cost of Financial Assets atFair Value Through Profit or Loss ..... 25,516,485
*Traded on regulated exchanges or markets.
FIRST STATE GLOBAL BOND FUND
SCHEDULE OF INVESTMENTS
AS OF 30 JUNE 2008
21

JOBNAME: 08081916 PAGE: 23 SESS: 26 OUTPUT: Mon Aug 18 12:43:17 2008
Purchased Sold
Financial Assets at Fair ValueThrough Profit or Loss*
Numberof shares
Numberof shares
AIG Sunamerica 1.2%20/03/2008.......................... – 50,000,000
Bundesrepublic Deutschland4% 04/01/2018 .................... 1,850,000 1,000,000
Bundesobligation 3.25%17/04/2009.......................... 1,250,000 1,250,000
Bundesrepubic Deutscheland4% 04/07/2016 .................... 3,550,000 2,750,000
Bundesrepublic Deutschland5% 04/07/2012 .................... 700,000 2,100,000
Caisse d’Amortissement de laDette 4% 25/10/2019 ............ 450,000 450,000
CAS Depositi e Prestiti 3%31/01/2013.......................... 250,000 250,000
Depfa ACS Bank 1.65%20/12/2016.......................... 20,000,000 20,000,000
Depfa ACS Bank 4.875%30/12/2008.......................... 110,000 110,000
Deutsche Bahn Finance 1.65%01/12/2014.......................... 115,000,000 145,000,000
Development Bank of Japan1.7% 20/09/2022.................. 70,000,000 –
Development Bank of Japan1.75% 17/03/2017 ................ 60,000,000 20,000,000
Development Bank of Japan4.25% 09/06/2015 ................ 300,000 300,000
European Investment Bank1.9% 26/01/2026.................. 55,000,000 –
European Investment Bank1.4% 20/06/2017.................. 40,000,000 –
European Investment Bank2.625% 16/05/2011 .............. 200,000 –
France (Govt of) 3.25%25/04/2016.......................... 750,000 600,000
Purchased Sold
Financial Assets at Fair ValueThrough Profit or Loss*
Numberof shares
Numberof shares
Freddie Mac 4.25% 23/06/2008 . 125,000 250,000General Electric Capital 1.45%
10/11/2011.......................... 140,000,000 40,000,000German Treasury Bill 0%
19/03/2008.......................... 600,000 600,000Hellenic 3.7% 20/07/2015 ........ 400,000 400,000Japan Finance 1.35%
26/11/2013.......................... – 115,000,000Land Nordrehein-Westfalen
3.75% 30/11/2009 ................ 200,000 200,000Rabobank Ned 0.2%
20/06/2008.......................... 15,000,000 30,000,000Sweden (Govt) 4.5%
12/08/2015.......................... 1,200,000 1,200,000UK 4.75% 07/06/2010 ............. 150,000 300,000UK 5% 07/03/2025.................. 400,000 –US Treasury Note 3.5%
15/02/2010.......................... 100,000 100,000US Treasury Note 4.125%
15/05/2015.......................... 800,000 950,000US Treasury Note 5%
15/08/2011.......................... – 1,200,000US Treasury Bill 20/03/2008..... – 500,000US Treasury Bill 11/09/2008..... 1,500,000 –US Treasury Bill 0%
19/06/2008.......................... 1,000,000 1,000,000US Treasury Bill 0%
20/03/2008.......................... 900,000 900,000US Treasury Bill 31/07/2008..... 1,200,000 –US Treasury Bill 4.625%
15/02/2017.......................... – 400,000
*Traded on regulated exchanges or markets.
FIRST STATE GLOBAL BOND FUND
PORTFOLIO CHANGES (UNAUDITED)
22

JOBNAME: 08081916 PAGE: 24 SESS: 26 OUTPUT: Mon Aug 18 12:43:17 2008
PERFORMANCE^
01/01/07To
30/06/07
01/01/08To
30/06/08
First State High Quality Bond Fund “The Fund”– Class I – Dist -0.12% 1.81%– Class III 0.40% 2.23%
Lehman US Gov’t/CreditIndex 0.97% 0.98%
^ Performance calculation is base on official dealingNAV.
US Treasury yields fell during the early part of2008 on continuing concerns about the deflationaryinfluence of the credit crunch on the globaleconomy. The yield of the 10-year benchmark bonddeclined from 4.02% to 3.41% by the end ofMarch.
In January the Federal Reserve cut interestrates by 75 basis points (bps), and a week later by afurther 50 bps, on rising concerns about liquidity inthe financial system. Global bond marketsbenefited from a flight to quality as equity marketswere under pressure. In March the Fed organizedthe takeover of troubled investment bank BearStearns by JP Morgan which improved short-termsentiment.
The tone of the market changed in April asinvestors focused increasingly on risinginflationary pressures driven by a higher oil price.The 10-year bond yield rose to 3.73% by the end ofthe month. However, the Fed made another 25 bpscut taking interest rates to 2%. Yields continued torise in May on surging oil prices and rising concernabout the risk of stagflation.
In June US Treasuries rallied slightly as risingunemployment fuelled concerns about the growthoutlook for the economy. The yield of the 10-yearbenchmark bond rose to 3.97% at the end of theperiod.
US economic data was weak over the first sixmonths of 2008. The housing market continued toslump following the subprime crisis with pricesfalling substantially and foreclosures increasingvery significantly. The labour market weakenedwith the unemployment rate rising to 5.5% andconsumer confidence was negatively impacted byrising energy prices.
US economic growth has slowed in the firsthalf of 2008. Looking ahead, the weakness in thehousing market combined with financial sectormalaise will continue to exert downward pressureon the economy. However, one potential bright spotfor the US stems from the improvedcompetitiveness of domestic manufacturers due tothe dramatic decline in the dollar. Nevertheless, theFederal Reserve are in a position where theconflicting forces of slowing growth and risinginflationary pressures are limiting potential policyresponses. As such, the market is now expectingsubdued growth for the remainder of 2008 and into2009. Treasury yields are currently below our fairvalue estimate and we intend to hold a shortduration position.
FIRST STATE HIGH QUALITY BOND FUND
INVESTMENT MANAGER’S REPORT (UNAUDITED)
23
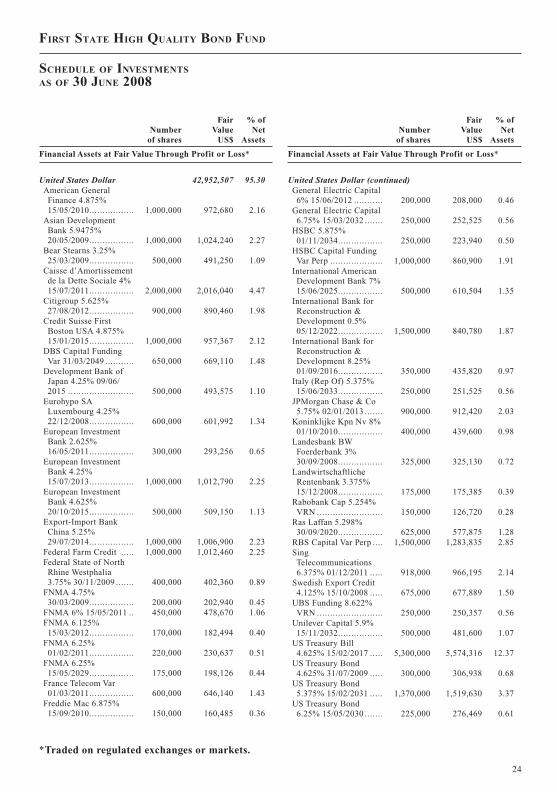
JOBNAME: 08081916 PAGE: 25 SESS: 26 OUTPUT: Mon Aug 18 12:43:17 2008
Numberof shares
FairValue
US$
% ofNet
Assets
Financial Assets at Fair Value Through Profit or Loss*
United States Dollar 42,952,507 95.30American GeneralFinance 4.875%15/05/2010................. 1,000,000 972,680 2.16
Asian DevelopmentBank 5.9475%20/05/2009................. 1,000,000 1,024,240 2.27
Bear Stearns 3.25%25/03/2009................. 500,000 491,250 1.09
Caisse d’Amortissementde la Dette Sociale 4%15/07/2011................. 2,000,000 2,016,040 4.47
Citigroup 5.625%27/08/2012................. 900,000 890,460 1.98
Credit Suisse FirstBoston USA 4.875%15/01/2015................. 1,000,000 957,367 2.12
DBS Capital FundingVar 31/03/2049 ........... 650,000 669,110 1.48
Development Bank ofJapan 4.25% 09/06/2015 ......................... 500,000 493,575 1.10
Eurohypo SALuxembourg 4.25%22/12/2008................. 600,000 601,992 1.34
European InvestmentBank 2.625%16/05/2011................. 300,000 293,256 0.65
European InvestmentBank 4.25%15/07/2013................. 1,000,000 1,012,790 2.25
European InvestmentBank 4.625%20/10/2015................. 500,000 509,150 1.13
Export-Import BankChina 5.25%29/07/2014................. 1,000,000 1,006,900 2.23
Federal Farm Credit ..... 1,000,000 1,012,460 2.25Federal State of NorthRhine Westphalia3.75% 30/11/2009 ....... 400,000 402,360 0.89
FNMA 4.75%30/03/2009................. 200,000 202,940 0.45
FNMA 6% 15/05/2011 .. 450,000 478,670 1.06FNMA 6.125%15/03/2012................. 170,000 182,494 0.40
FNMA 6.25%01/02/2011................. 220,000 230,637 0.51
FNMA 6.25%15/05/2029................. 175,000 198,126 0.44
France Telecom Var01/03/2011................. 600,000 646,140 1.43
Freddie Mac 6.875%15/09/2010................. 150,000 160,485 0.36
Numberof shares
FairValue
US$
% ofNet
Assets
Financial Assets at Fair Value Through Profit or Loss*
United States Dollar (continued)General Electric Capital6% 15/06/2012 ........... 200,000 208,000 0.46
General Electric Capital6.75% 15/03/2032 ....... 250,000 252,525 0.56
HSBC 5.875%01/11/2034................. 250,000 223,940 0.50
HSBC Capital FundingVar Perp .................... 1,000,000 860,900 1.91
International AmericanDevelopment Bank 7%15/06/2025................. 500,000 610,504 1.35
International Bank forReconstruction &Development 0.5%05/12/2022................. 1,500,000 840,780 1.87
International Bank forReconstruction &Development 8.25%01/09/2016................. 350,000 435,820 0.97
Italy (Rep Of) 5.375%15/06/2033................. 250,000 251,525 0.56
JPMorgan Chase & Co5.75% 02/01/2013 ....... 900,000 912,420 2.03
Koninklijke Kpn Nv 8%01/10/2010................. 400,000 439,600 0.98
Landesbank BWFoerderbank 3%30/09/2008................. 325,000 325,130 0.72
LandwirtschaftlicheRentenbank 3.375%15/12/2008................. 175,000 175,385 0.39
Rabobank Cap 5.254%VRN ......................... 150,000 126,720 0.28
Ras Laffan 5.298%30/09/2020................. 625,000 577,875 1.28
RBS Capital Var Perp .... 1,500,000 1,283,835 2.85SingTelecommunications6.375% 01/12/2011 ..... 918,000 966,195 2.14
Swedish Export Credit4.125% 15/10/2008 ..... 675,000 677,889 1.50
UBS Funding 8.622%VRN ......................... 250,000 250,357 0.56
Unilever Capital 5.9%15/11/2032................. 500,000 481,600 1.07
US Treasury Bill4.625% 15/02/2017 ..... 5,300,000 5,574,316 12.37
US Treasury Bond4.625% 31/07/2009 ..... 300,000 306,938 0.68
US Treasury Bond5.375% 15/02/2031 ..... 1,370,000 1,519,630 3.37
US Treasury Bond6.25% 15/05/2030 ....... 225,000 276,469 0.61
*Traded on regulated exchanges or markets.
FIRST STATE HIGH QUALITY BOND FUND
SCHEDULE OF INVESTMENTS
AS OF 30 JUNE 2008
24
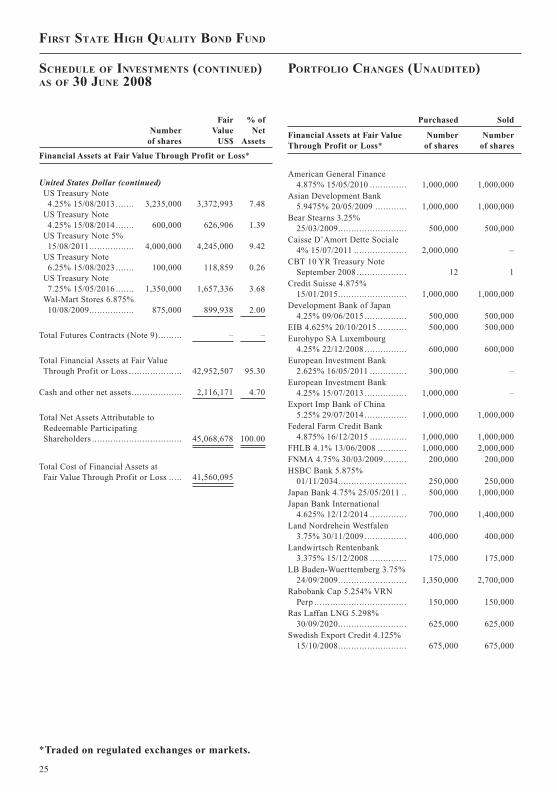
JOBNAME: 08081916 PAGE: 26 SESS: 26 OUTPUT: Mon Aug 18 12:43:17 2008
Numberof shares
FairValue
US$
% ofNet
Assets
Financial Assets at Fair Value Through Profit or Loss*
United States Dollar (continued)US Treasury Note4.25% 15/08/2013 ....... 3,235,000 3,372,993 7.48
US Treasury Note4.25% 15/08/2014 ....... 600,000 626,906 1.39
US Treasury Note 5%15/08/2011................. 4,000,000 4,245,000 9.42
US Treasury Note6.25% 15/08/2023 ....... 100,000 118,859 0.26
US Treasury Note7.25% 15/05/2016 ....... 1,350,000 1,657,336 3.68
Wal-Mart Stores 6.875%10/08/2009................. 875,000 899,938 2.00
Total Futures Contracts (Note 9)......... – –
Total Financial Assets at Fair ValueThrough Profit or Loss .................... 42,952,507 95.30
Cash and other net assets ................... 2,116,171 4.70
Total Net Assets Attributable toRedeemable ParticipatingShareholders .................................. 45,068,678 100.00
Total Cost of Financial Assets atFair Value Through Profit or Loss ..... 41,560,095
Purchased Sold
Financial Assets at Fair ValueThrough Profit or Loss*
Numberof shares
Numberof shares
American General Finance4.875% 15/05/2010 .............. 1,000,000 1,000,000
Asian Development Bank5.9475% 20/05/2009 ............ 1,000,000 1,000,000
Bear Stearns 3.25%25/03/2009.......................... 500,000 500,000
Caisse D’Amort Dette Sociale4% 15/07/2011 .................... 2,000,000 –
CBT 10 YR Treasury NoteSeptember 2008 ................... 12 1
Credit Suisse 4.875%15/01/2015.......................... 1,000,000 1,000,000
Development Bank of Japan4.25% 09/06/2015 ................ 500,000 500,000
EIB 4.625% 20/10/2015 ........... 500,000 500,000Eurohypo SA Luxembourg
4.25% 22/12/2008 ................ 600,000 600,000European Investment Bank
2.625% 16/05/2011 .............. 300,000 –European Investment Bank
4.25% 15/07/2013 ................ 1,000,000 –Export Imp Bank of China
5.25% 29/07/2014 ................ 1,000,000 1,000,000Federal Farm Credit Bank
4.875% 16/12/2015 .............. 1,000,000 1,000,000FHLB 4.1% 13/06/2008 ........... 1,000,000 2,000,000FNMA 4.75% 30/03/2009......... 200,000 200,000HSBC Bank 5.875%
01/11/2034.......................... 250,000 250,000Japan Bank 4.75% 25/05/2011 .. 500,000 1,000,000Japan Bank International
4.625% 12/12/2014 .............. 700,000 1,400,000Land Nordrehein Westfalen
3.75% 30/11/2009 ................ 400,000 400,000Landwirtsch Rentenbank
3.375% 15/12/2008 .............. 175,000 175,000LB Baden-Wuerttemberg 3.75%
24/09/2009.......................... 1,350,000 2,700,000Rabobank Cap 5.254% VRN
Perp ................................... 150,000 150,000Ras Laffan LNG 5.298%
30/09/2020.......................... 625,000 625,000Swedish Export Credit 4.125%
15/10/2008.......................... 675,000 675,000
*Traded on regulated exchanges or markets.
FIRST STATE HIGH QUALITY BOND FUND
SCHEDULE OF INVESTMENTS (CONTINUED)AS OF 30 JUNE 2008
PORTFOLIO CHANGES (UNAUDITED)
25

JOBNAME: 08081916 PAGE: 27 SESS: 26 OUTPUT: Mon Aug 18 12:43:17 2008
Purchased Sold
Financial Assets at Fair ValueThrough Profit or Loss*
Numberof shares
Numberof shares
US Treasury 4.125% 15/05/2015 ... . . . . . . . 3,500,000 4,800,000US Treasury 4.25% 15/08/2013 ... . . . . . . . . . – 2,000,000US Treasury 4.25% 15/08/2014 ... . . . . . . . . . 2,100,000 4,100,000US Treasury 4.625% 31/07/2009 ... . . . . . . . – 900,000US Treasury 5% 15/08/2011 ... . . . . . . . . . . . . . – 2,000,000US Treasury 5.375% 15/02/2031 ... . . . . . . . – 500,000US Treasury Bill 0% 20/03/2008 ... . . . . . . . 1,000,000 2,000,000US Treasury Bill 0% 11/09/2008 ... . . . . . . . 3,000,000 3,000,000US Treasury Bill 0% 20/03/2008 ... . . . . . . . 2,000,000 2,000,000US Treasury Bill 4.625% 15/02/2017... . . 2,300,000 4,000,000
*Traded on regulated exchanges or markets.
FIRST STATE HIGH QUALITY BOND FUND
PORTFOLIO CHANGES (UNAUDITED)(CONTINUED)
26

JOBNAME: 08081916 PAGE: 28 SESS: 26 OUTPUT: Mon Aug 18 12:43:17 2008
PERFORMANCE^
01/01/07To
30/06/07
01/01/08To
30/06/08
First State Long Term Bond Fund “The Fund”– Class III -0.91% 2.64%
Citi Group US TSY BondIndex Local 5+ Y -0.14% 2.29%
^ Performance calculation is base on official dealingNAV.
US Treasury yields fell during the early part of2008 on continuing concerns about the deflationaryinfluence of the credit crunch on the globaleconomy. The yield of the 10-year benchmark bonddeclined from 4.02% to 3.41% by the end ofMarch.
In January the Federal Reserve cut interestrates by 75 basis points (bps), and a week later by afurther 50 bps, on rising concerns about liquidity inthe financial system. Global bond marketsbenefited from a flight to quality as equity marketswere under pressure. In March the Fed organizedthe takeover of troubled investment bank BearStearns by JP Morgan which improved short-termsentiment.
The tone of the market changed in April asinvestors focused increasingly on risinginflationary pressures driven by a higher oil price.The 10-year bond yield rose to 3.73% by the end ofthe month. However, the Fed made another 25 bpscut taking interest rates to 2%. Yields continued torise in May on surging oil prices and rising concernabout the risk of stagflation.
In June US Treasuries rallied slightly as risingunemployment fuelled concerns about the growthoutlook for the economy. The yield of the 10-yearbenchmark bond rose to 3.97% at the end of theperiod.
US economic data was weak over the first sixmonths of 2008. The housing market continued toslump following the subprime crisis with pricesfalling substantially and foreclosures increasingvery significantly. The labour market weakenedwith the unemployment rate rising to 5.5% andconsumer confidence was negatively impacted byrising energy prices.
US economic growth has slowed in the firsthalf of 2008. Looking ahead, the weakness in thehousing market combined with financial sectormalaise will continue to exert downward pressureon the economy. However, one potential bright spotfor the US stems from the improvedcompetitiveness of domestic manufacturers due tothe dramatic decline in the dollar. Nevertheless, theFederal Reserve are in a position where theconflicting forces of slowing growth and risinginflationary pressures are limiting potential policyresponses. As such, the market is now expectingsubdued growth for the remainder of 2008 and into2009. Treasury yields are currently below our fairvalue estimate and we intend to hold a shortduration position.
FIRST STATE LONG TERM BOND FUND
INVESTMENT MANAGER’S REPORT (UNAUDITED)
27

JOBNAME: 08081916 PAGE: 29 SESS: 26 OUTPUT: Mon Aug 18 12:43:17 2008
Numberof shares
FairValue
US$
% ofNet
Assets
Financial Assets at Fair Value Through Profit or Loss*
United States Dollar 144,992,267 97.86Asian DevelopmentBank 5.9475%20/05/2009................. 1,000,000 1,024,240 0.69
Credit Suisse FirstBoston USA 4.875%15/01/2015................. 1,500,000 1,436,050 0.97
Development Bank ofJapan 4.25% 09/06/2015 ......................... 1,000,000 987,150 0.67
European InvestmentBank 4.625% 20/10/2015 ......................... 7,600,000 7,739,080 5.22
Federal Farm CreditBank 4.875% 16/12/2015 ......................... 2,500,000 2,531,150 1.71
General Capital 4.625%15/09/2009................. 600,000 606,336 0.41
Hong Kong (Govt Of)5.125% 01/08/2014 ..... 1,000,000 1,017,240 0.69
Inter-AmericanDevelopment Bank 7%15/06/2025................. 2,000,000 2,442,014 1.65
International Bank ofReconstruction &Development 0.5%05/12/2022................. 3,500,000 1,961,820 1.32
International Bank ofReconstruction &Development 8.25%01/09/2016................. 1,000,000 1,245,200 0.84
Japan Bank forInternationalCooperation 4.625%12/12/2014................. 700,000 708,022 0.48
Quebec (Province Of)7.5% 15/09/2029......... 1,500,000 1,903,710 1.28
Rabobank Capital FundTrust STP Perp ........... 300,000 253,440 0.17
Ras Laffan 5.298%30/09/2020................. 625,000 577,875 0.39
Tenn Valley Authority6.75% 01/11/2025 ....... 1,000,000 1,177,100 0.79
US Treasury Note4.125% 15/05/2015 ..... 4,500,000 4,653,281 3.14
Numberof shares
FairValue
US$
% ofNet
Assets
Financial Assets at Fair Value Through Profit or Loss*
United States Dollar (continued)US Treasury Note4.25% 15/08/2014 ....... 6,575,000 6,869,848 4.64
US Treasury Note 4.5%15/02/2036................. 3,200,000 3,169,375 2.14
US Treasury Bill4.625% 15/02/2017 ..... 20,200,000 21,245,508 14.34
US Treasury Note5.125% 15/05/2016 ..... 7,200,000 7,853,625 5.30
US Treasury Bond5.375% 15/02/2031 ..... 6,650,000 7,376,305 4.98
US Treasury Bond6.125% 15/08/2029 ..... 6,000,000 7,225,313 4.88
US Treasury Bond6.25% 15/08/2023 ....... 11,500,000 13,668,829 9.23
US Treasury Bond7.25% 15/05/2016 ....... 10,500,000 12,890,391 8.70
US Treasury Bond7.25% 15/08/2022 ....... 8,000,000 10,302,500 6.95
US Treasury Bond 8%15/11/2021................. 1,950,000 2,643,469 1.78
US Treasury StripPrincipal 15/02/2021 ... 10,000,000 5,577,300 3.76
US Treasury Bill11/09/2008................. 10,000,000 9,922,388 6.70
US Treasury Bill31/07/2008................. 6,000,000 5,983,708 4.04
Total Futures Contracts (Note 9)......... – –
Total Financial Assets at Fair ValueThrough Profit or Loss .................... 144,992,267 97.86
Cash and other net assets ................... 3,167,001 2.14
Total Net Assets Attributable toRedeemable ParticipatingShareholders .................................. 148,159,268 100.00
Total Cost of Financial Assets atFair Value Through Profit or Loss ..... 137,671,068
*Traded on regulated exchanges or markets.
FIRST STATE LONG TERM BOND FUND
SCHEDULE OF INVESTMENTS
AS OF 30 JUNE 2008
28

JOBNAME: 08081916 PAGE: 30 SESS: 26 OUTPUT: Mon Aug 18 12:43:17 2008
Purchased Sold
Financial Assets at Fair ValueThrough Profit or Loss*
Numberof shares
Numberof shares
Asian Development Bank5.9475% 20/05/2009 ............ 1,000,000 1,000,000
Credit Suisse First Boston USA4.875% 15/01/2015 .............. 1,500,000 1,500,000
Development Bank of Japan4.25% 09/06/2015 ................ 1,000,000 1,000,000
European Investment Bank4.625% 20/10/2015 .............. 7,600,000 7,600,000
Federal Farm Credit Bank4.875% 16/12/2015 .............. 2,500,000 2,500,000
Hong Kong (Govt) 5.125%01/08/2014.......................... 1,000,000 1,000,000
Japan Bank for InternationalCooperation 4.625%12/12/2014.......................... 700,000 700,000
Rabobank Capital 5.254% ....... 300,000 300,000Ras Laffan 5.298%
30/09/2020.......................... 625,000 625,000US Treasury Note 4.125%
15/05/2015.......................... 10,500,000 16,500,000US Treasury Note 4.25%
15/08/2014.......................... 6,575,000 6,575,000US Treasury Note 4.5%
15/02/2036.......................... 3,200,000 3,200,000US Treasury Note 5.125%
15/05/2016.......................... 4,700,000 4,700,000US Treasury Bond 7.25%
15/05/2016.......................... – 3,000,000US Treasury Bill 20/03/2008..... 2,000,000 12,000,000US Treasury Bill 11/09/2008..... 10,000,000 –US Treasury Bill 0%
19/06/2008.......................... 15,000,000 15,000,000US Treasury Bill 0%
20/03/2008.......................... 12,000,000 12,000,000US Treasury Bill 31/07/2008..... 19,000,000 13,000,000US Treasury Bill 4.625%
15/02/2017.......................... 13,000,000 13,000,000
*Traded on regulated exchanges or markets.
FIRST STATE LONG TERM BOND FUND
PORTFOLIO CHANGES (UNAUDITED)
29
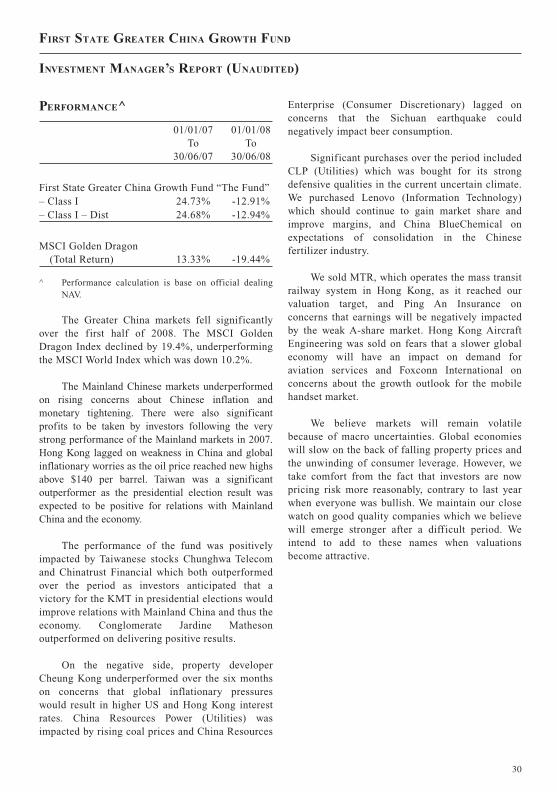
JOBNAME: 08081916 PAGE: 31 SESS: 26 OUTPUT: Mon Aug 18 12:43:17 2008
PERFORMANCE^
01/01/07To
30/06/07
01/01/08To
30/06/08
First State Greater China Growth Fund “The Fund”– Class I 24.73% -12.91%– Class I – Dist 24.68% -12.94%
MSCI Golden Dragon(Total Return) 13.33% -19.44%
^ Performance calculation is base on official dealingNAV.
The Greater China markets fell significantlyover the first half of 2008. The MSCI GoldenDragon Index declined by 19.4%, underperformingthe MSCI World Index which was down 10.2%.
The Mainland Chinese markets underperformedon rising concerns about Chinese inflation andmonetary tightening. There were also significantprofits to be taken by investors following the verystrong performance of the Mainland markets in 2007.Hong Kong lagged on weakness in China and globalinflationary worries as the oil price reached new highsabove $140 per barrel. Taiwan was a significantoutperformer as the presidential election result wasexpected to be positive for relations with MainlandChina and the economy.
The performance of the fund was positivelyimpacted by Taiwanese stocks Chunghwa Telecomand Chinatrust Financial which both outperformedover the period as investors anticipated that avictory for the KMT in presidential elections wouldimprove relations with Mainland China and thus theeconomy. Conglomerate Jardine Mathesonoutperformed on delivering positive results.
On the negative side, property developerCheung Kong underperformed over the six monthson concerns that global inflationary pressureswould result in higher US and Hong Kong interestrates. China Resources Power (Utilities) wasimpacted by rising coal prices and China Resources
Enterprise (Consumer Discretionary) lagged onconcerns that the Sichuan earthquake couldnegatively impact beer consumption.
Significant purchases over the period includedCLP (Utilities) which was bought for its strongdefensive qualities in the current uncertain climate.We purchased Lenovo (Information Technology)which should continue to gain market share andimprove margins, and China BlueChemical onexpectations of consolidation in the Chinesefertilizer industry.
We sold MTR, which operates the mass transitrailway system in Hong Kong, as it reached ourvaluation target, and Ping An Insurance onconcerns that earnings will be negatively impactedby the weak A-share market. Hong Kong AircraftEngineering was sold on fears that a slower globaleconomy will have an impact on demand foraviation services and Foxconn International onconcerns about the growth outlook for the mobilehandset market.
We believe markets will remain volatilebecause of macro uncertainties. Global economieswill slow on the back of falling property prices andthe unwinding of consumer leverage. However, wetake comfort from the fact that investors are nowpricing risk more reasonably, contrary to last yearwhen everyone was bullish. We maintain our closewatch on good quality companies which we believewill emerge stronger after a difficult period. Weintend to add to these names when valuationsbecome attractive.
FIRST STATE GREATER CHINA GROWTH FUND
INVESTMENT MANAGER’S REPORT (UNAUDITED)
30

JOBNAME: 08081916 PAGE: 32 SESS: 26 OUTPUT: Mon Aug 18 12:43:17 2008
Numberof shares
FairValue
US$
% ofNet
Assets
Financial Assets at Fair Value Through Profit or Loss*
China 144,620,985 36.28Anhui Expressway ........ 5,000,000 3,526,771 0.88Belle InternationalHoldings.................... 3,811,000 3,421,225 0.86
China Blue Chemical .... 2,648,000 1,833,819 0.46China CommunicationsServices .................... 7,418,353 5,403,815 1.36
China DongxiangGroup ....................... 6,887,000 2,782,180 0.70
China Mengniu Dairy.... 5,104,000 14,400,513 3.61China Merchants Bank .. 2,501,500 7,859,795 1.97China MerchantsHoldings International . 564,000 2,180,776 0.55
China Oilfield Services . 5,740,000 10,261,699 2.57China ResourcesEnterprise .................. 3,698,000 10,552,164 2.65
China Resources PowerHoldings.................... 4,050,000 9,858,160 2.47
China ShippingDevelopment .............. 2,418,000 7,256,326 1.82
China Telecom ............ 10,794,000 5,855,546 1.47China Vanke ................ 7,363,950 9,349,549 2.34CLP Holdings ............. 1,026,000 8,783,007 2.20CNOOC ...................... 7,075,500 12,177,391 3.06Fosun International**.... 2,836,500 2,062,578 0.52Lenovo ....................... 10,154,000 6,862,659 1.72Tencent Holdings.......... 515,600 3,987,263 1.00Xinao Gas Holdings ...... 3,244,000 5,491,606 1.38Yantai Changyu PioneerWine ......................... 1,722,192 10,714,143 2.69
Hong Kong 132,104,757 33.14Aeon Stores ................. 2,109,700 3,944,780 0.99ASM PacificTechnology ................ 776,300 5,858,962 1.47
Cheung Kong Holdings . 1,378,000 18,573,620 4.66Dah Sing BankingGroup ....................... 2,937,814 5,214,408 1.31
Esprit ......................... 803,700 8,343,638 2.09Glorious SunEnterprises ................ 3,955,900 1,927,851 0.48
Hang Lung Group ........ 2,249,700 9,997,064 2.51Hengan International .... 1,700,000 4,959,923 1.24Hong Kong & ChinaGas .......................... 1,658,800 3,944,104 0.99
Hopewell HighwayInfrastructure ............. 7,994,500 5,987,544 1.50
Hung Hing Printing....... 1,846,000 490,057 0.12IDS Group................... 1,955,000 2,788,022 0.70
Numberof shares
FairValue
US$
% ofNet
Assets
Financial Assets at Fair Value Through Profit or Loss*
Hong Kong (continued)Jardine Matheson ......... 600,659 18,500,297 4.64Kingboard ChemicalHoldings ................... 1,567,000 7,234,626 1.82
Li & Fung .................. 2,476,200 7,462,738 1.87Lung Kee Holdings ....... 6,943,125 3,161,025 0.79Minth Group ................ 3,610,000 2,537,070 0.64Swire Pacific “A” ......... 263,500 2,694,982 0.68Swire Pacific “B” ......... 4,910,000 10,012,055 2.51Wing Hang Bank ......... 639,500 8,471,991 2.13
Taiwan 104,847,838 26.31Advantech .................. 2,029,930 5,216,438 1.31Asustek Computer ....... 1,544,817 4,203,930 1.06China Trust Financial .... 5,010,051 4,836,243 1.21Chunghwa Telecom ...... 5,787,727 14,968,424 3.76Delta Electronics ......... 3,463,450 9,584,878 2.40E.sun FinancialHolding ..................... 8,362,795 4,532,269 1.14
FamilyMart.................. 1,035,789 1,791,550 0.45Hon Hai Precision ........ 1,835,964 9,042,817 2.27Hotai Motor ................. 1,679,000 4,989,484 1.25MediaTek ................... 556,000 6,347,116 1.59Powertech Technology .. 2,203,565 7,695,381 1.93President Chain Store .... 2,173,000 7,194,890 1.81Sinyi Realty................. 1,773,973 5,049,625 1.27Taiwan SemiconductorManufacturing ........... 7,626,996 16,307,846 4.09
Tripod Technology ........ 1,234,494 3,086,947 0.77
Total Financial Asset at Fair Valuethrough Profit or Loss ..................... 381,573,580 95.73
Cash and Other net assets .................. 17,003,090 4.27
Total Net Assets Attributable ToRedeemable ParticipatingShareholders .................................. 398,576,670 100.00
Total Cost of Financial Asset at FairValue through Profit or Loss ............ 320,391,285
*Traded on regulated exchanges or markets.**Valued using a quote from a single broker.
FIRST STATE GREATER CHINA GROWTH FUND
SCHEDULE OF INVESTMENTS
AS OF 30 JUNE 2008
31

JOBNAME: 08081916 PAGE: 33 SESS: 26 OUTPUT: Mon Aug 18 12:43:17 2008
Purchased Sold
Financial Assets at Fair ValueThrough Profit or Loss*
Numberof shares
Numberof shares
Acer ..................................... 789,000 789,000Advantech ............................. – 549,000ASM Pacific Technology ......... 60,100 78,200Asustek Computer .................. 180,000 110,000Beijing Enterprise .................. – 352,000Cheung Kong Holding ............ 294,000 45,000China Blue Chemical .............. 2,648,000 –China Communications
Services ............................. – 278,000China Dongxiang Group .......... 2,950,000 3,548,000China International Marine
Containers .......................... – 2,571,918China Mengniu Dairy ............. 755,000 735,000China Merchants Bank ............ 660,000 444,500China Merchants Holdings
International ....................... – 664,000China Oilfield Services ........... 1,218,000 860,000China Resources Enterprise ...... 962,000 520,000China Resources Power
Holding .............................. 330,000 3,476,000China Shenhua Energy ............ – 852,500China Shipping ...................... – 950,000China Telecom ....................... 3,460,000 1,648,000China Vanke .......................... 4,556,025 567,122Chinatrust Financial Holding ... 3,624,000 10,159,000Chunghwa Telecom ................. 3,170,000 399,273CLP Holdings ........................ 1,037,000 11,000CNOOC................................. – 2,116,000Dah Sing Banking Group ......... 1,771,814 –Delta Electronics..................... 647,000 250,000E Sun Financial Holdings ........ 3,181,000 –
Purchased Sold
Financial Assets at Fair ValueThrough Profit or Loss*
Numberof shares
Numberof shares
Esprit ................................... – 116,300First Pacific ........................... – 4,864,000Fosun International ................. 805,500 –Foxconn International Holdings – 2,941,137Hang Lung Group .................. – 829,000Hengan International Group...... 730,000 –HK & China Gas .................... 150,800 1,398,000Hon Hai Precision .................. – 509,000Hong Kong Aircraft
Engineering ....................... – 255,600Huaku Construction ................ 904,000 904,000Jardine Matheson Holdings....... 94,800 69,200Kerry Properties ..................... – 186,280Kingboard Chemicals .............. 155,000 479,500Lenovo .................................. 10,364,000 210,000Li & Fung ............................. 452,000 1,206,000Mediatek ............................... 172,000 194,000MTR ..................................... – 2,149,000New Era Electronics ............... – 508,510Parkson Retail Group .............. – 443,000Ping An Insurance .................. – 613,000Powertech Technology ............. 381,000 441,000President Chain Store ............. 221,000 504,000Sinyi Realty .......................... – 529,000Swire Pacific ......................... 117,500 627,000Taiwan Semicon
Manufacturing ..................... – 459,000Tencent Holdings ................... – 326,800Wing Hang Bank .................... – 220,500Yantai Changyu Pioneer Wine ... 44,400 123,500
*Traded on regulated exchanges or markets.**Valued using a quote from a single broker.
FIRST STATE GREATER CHINA GROWTH FUND
PORTFOLIO CHANGES (UNAUDITED)
32

JOBNAME: 08081916 PAGE: 34 SESS: 26 OUTPUT: Mon Aug 18 12:43:17 2008
PERFORMANCE^
01/01/07To
30/06/07
01/01/08To
30/06/08
First State Singapore and Malaysia Growth Fund“The Fund”
– Class I 27.56% -14.40%
Cap-weighted MSCI Malaysia & MSCI SingaporeFree (USD) 24.25% -11.46%
^ Performance calculation is base on official dealingNAV.
Singapore and Malaysia declined in the firsthalf of 2008 on rising concerns about the impact ofinflationary pressures on the global economy as theoil price hit new highs above $140 per barrel. Inboth countries inflation remains a prime concern.In Singapore it reached a 26-year high of 7.5%,while in Malaysia the government announced itsintention to remove fuel subsidies which will resultin further rises in the price of fuel and electricity.
The political situation in Malaysia remainedunsettled with former Prime Minister Dr Mahathirresigning from UMNO and calling for the currentPrime Minister to step down. The leader of theopposition Anwar Ibrahim was forced to seekrefuge in the Turkish embassy.
Fund performance was helped by AscottGroup as it rose strongly on receiving a takeoveroffer from its parent Capitaland, and JardineMatheson, a Singapore listed regionalconglomerate, which performed well due to itsstrong balance sheet and quality portfolio ofbusinesses. Oversea-Chinese Banking (Singapore)outperformed on widening loan spreads as bankswith strong balance sheets regained pricing power.
On the negative side, Guocoland lagged onpoor results and concerns about litigation at itsflagship project in China, and SP Setia fell due torising costs in the house building industry and
lower demand caused by the current economicslowdown. Petra Foods also lagged afterdisappointing results.
Over the six months we bought a new positionin Philex Mining which is attractively valued andoffers exposure to gold as a hedge against inflationand MobileOne (Singapore), a mobile telecomprovider which generates high levels of cash flow.We also purchased United Plantations which hasexcellent management and offers better value thanother stocks in its sector.
We sold Plus Expressways as we weredisappointed with the relatively low dividendpayout and there is potential for governmentinterference and Ascott Group as it rose on thetakeover bid. We also disposed of industrialequipment group Tat Hong to lock in profitsfollowing strong performance.
The prospect of a recession in some developedmarkets is becoming more likely as the ability ofcentral banks to cut interest rates is hindered byinflationary pressures. Singapore and Malaysia willbe impacted by any slowdown in Westerneconomies given the importance of exports. Weprefer companies with strong operating cash flowsthat are well positioned for difficult economicconditions and still favour domestic sectors inMalaysia and companies in Singapore with strongregional or global franchises.
FIRST STATE SINGAPORE AND MALAYSIA GROWTH FUND
INVESTMENT MANAGER’S REPORT (UNAUDITED)
33

JOBNAME: 08081916 PAGE: 35 SESS: 26 OUTPUT: Mon Aug 18 12:43:17 2008
Numberof shares
FairValue
US$
% ofNet
Assets
Financial Assets at Fair Value Through Profit or Loss*
Hong Kong 3,831,170 5.00Jardine Matheson ......... 76,000 2,340,800 3.05Tan ChongInternational .............. 5,097,000 1,490,370 1.95
India 272,745 0.36Meghmani Organics ..... 1,398,000 272,745 0.36
Malaysia 29,041,068 37.92Aeon .......................... 1,022,000 1,289,235 1.68Airasia ....................... 2,496,300 664,967 0.87Asiatic Development .... 316,100 793,637 1.04Astro All Asia Networks 1,291,600 1,320,865 1.72Axis Real Estate Invest.. 1,516,700 780,176 1.02Bandar RayaDevelopments ............ 1,434,390 615,220 0.80
Bumiputra-CommerceHoldings ................... 682,500 1,661,321 2.17
Gamuda ..................... 629,200 448,878 0.59Genting ...................... 994,000 1,704,348 2.23Hong Leong Credit ....... 834,300 1,190,397 1.55IJM ........................... 652,400 1,088,665 1.42IOI ............................ 1,077,205 2,457,188 3.21Lafarge MalayanCement ..................... 563,400 724,519 0.95
Malayan Banking ......... 49,675 107,229 0.14Media Prima ............... 1,830,000 1,014,176 1.32Pos Malaysia &Services .................... 1,850,100 1,251,905 1.63
Quill Capita Trust ......... 2,371,400 740,609 0.97Selangor Properties ...... 797,600 752,176 0.98Sime Darby ................. 868,928 2,447,685 3.20SP Setia (Warrants) ...... 233,825 30,427 0.04SP Setia ...................... 1,092,950 983,856 1.28Sunrise ....................... 1,084,000 557,600 0.73Sunway City ............... 891,133 549,043 0.72Tenaga Nasional .......... 1,222,200 3,049,887 3.98Tower Real EstateInvestment ................ 2,088,000 747,998 0.98
United Plantations ....... 223,000 894,458 1.17WTK Holdings ............ 1,759,750 1,174,603 1.53
Philippines 2,113,597 2.76Banco de Oro .............. 775,000 732,677 0.96Philex Mining ............. 6,000,000 934,268 1.22SM Investments ........... 82,292 446,652 0.58
Numberof shares
FairValue
US$
% ofNet
Assets
Financial Assets at Fair Value Through Profit or Loss*
Singapore 38,827,987 50.70Ascendas India Trust ..... 577,000 382,316 0.50Ascott Residence Trust .. 1,537,000 1,188,140 1.55Bukit SembawangEstates ...................... 217,000 1,397,887 1.83
Capitacommercial Trust . 425,600 598,466 0.78CH Offshore ............... 870,000 400,317 0.52CSE Global ................ 2,319,000 1,792,645 2.34DBS Group ................. 144,000 1,999,440 2.61Ezion Holdings ........... 3,838,000 1,101,980 1.44Fraser and Neave ......... 587,000 1,957,675 2.56GK Goh Holdings ........ 1,761,000 1,238,132 1.62Global Voice Group ..... 20,513,000 830,608 1.08Great Eastern .............. 108,000 1,338,968 1.75Guocoland .................. 684,985 1,099,365 1.44Jardine Cycle &Carriage ................... 59,609 744,290 0.97
Keppel ....................... 401,000 3,253,346 4.25Macquarie Meag PrimeReal Estate InvestmentTrust ......................... 572,000 429,537 0.56
MobileOne ................. 560,000 770,964 1.01NeraTelecommunications ... 2,943,000 790,838 1.03
Oversea ChineseBanking .................... 655,016 3,939,837 5.14
Petra Foods ................. 2,355,000 1,699,109 2.22SembCorp Industries .... 382,000 1,169,933 1.53Singapore Post ............ 2,494,000 2,001,369 2.61SingaporeTelecommunications ... 760,000 2,025,473 2.64
Starhub ...................... 770,080 1,615,790 2.11Unisteel Technology ..... 820,000 1,140,985 1.49United Overseas Bank .. 286,000 3,920,577 5.12
Thailand 221,269 0.29Lalin Property ............. 2,465,300 221,269 0.29
Total Financial Assets at Fair ValueThrough Profit or Loss .................... 74,307,836 97.03
Cash and other net assets ................... 2,277,994 2.97
Total Net Assets Attributable toRedeemable ParticipatingShareholders .................................. 76,585,830 100.00
Total Cost of Financial Assets at FairValue Through Profit or Loss ........... 72,607,463
*Traded on regulated exchanges or markets.
FIRST STATE SINGAPORE AND MALAYSIA GROWTH FUND
SCHEDULE OF INVESTMENTS
AS OF 30 JUNE 2008
34

JOBNAME: 08081916 PAGE: 36 SESS: 26 OUTPUT: Mon Aug 18 12:43:17 2008
Purchased Sold
Financial Assets at Fair ValueThrough Profit or Loss*
Numberof shares
Numberof shares
Aeon .................................... 511,000 45,000Air Asia ................................. – 300,000Ascendas India Trust ............... 592,000 15,000Ascott Residence Trust ............ – 90,000Asiatic Development ............... – 200,000Astro All Asia Networks .......... – 749,200Axis Real Estate Investment
Trust ................................. – 300,000Bandar Raya Development ....... – 50,000Bukit Sembawang Estates ......... – 20,000Bumiputra Commerce ............. – 130,000Capitacommercial Trust .......... – 201,000CH Offshore .......................... – 200,000DBS Group ........................... – 44,000Ezion Holdings ...................... 1,770,000 276,000Fraser & Neave ...................... – 96,000Gamuda ................................. – 155,000Genting ................................ – 100,000GK Goh Holdings .................. – 141,000Global Voice Group ................ 9,203,000 –Guocoland ............................. – 13,000Hong Leong Credit ................. – 60,000IJM ...................................... – 83,000IOI ....................................... – 194,500Jardine Cycle & Carriage ........ – 3,000Jardine Matheson ................... – 13,200Keppel .................................. – 80,000Lafarge Malayan Cement ......... – 120,000Malayan Banking .................... 114,825 554,450Media Prima .......................... – 170,000MobileOne ............................ 560,000 –
Purchased Sold
Financial Assets at Fair ValueThrough Profit or Loss*
Numberof shares
Numberof shares
Nera Telecommunications......... – 1,100,000Overseas Chinese Banking ....... – 156,000Petra Foods ........................... – 171,000Philex Mining ........................ 6,000,000 –Plus Expressways ................... – 1,299,000Pos Malaysia & Services
Holdings............................. – 70,000Prime Real Estate Investment
Trust .................................. – 805,000PT Holcin ............................. – 1,500,000Quill Capita Trust.................... – 600,000Selangor Properties ................ – 150,000Sembcorp Industries ............... – 145,000Sime Darby ........................... 1,098,928 1,492,928Singapore Post ....................... – 815,000Singapore Telecommunications . – 54,000SP Setia ................................. 467,650 777,650Starhub ................................. – 65,000Sunrise ................................. – 60,000Tan Chong International .......... – 660,000Tat Hong Holdings ................. – 194,000Tenaga Nasional ..................... – 45,000The Ascott Group ................... – 1,859,000Tower Real Estate Investment
Trust .................................. – 610,000Tradewinds ............................ 71,497 1,094,997Unisteel Technology ............... – 50,000United Overseas Bank ............. – 21,000United Plantations .................. 250,000 27,000WTK Holdings ...................... – 408,000
*Traded on regulated exchanges or markets.
FIRST STATE SINGAPORE AND MALAYSIA GROWTH FUND
PORTFOLIO CHANGES (UNAUDITED)
35

JOBNAME: 08081916 PAGE: 37 SESS: 26 OUTPUT: Mon Aug 18 12:43:17 2008
PERFORMANCE^
01/01/07To
30/06/07
01/01/08To
30/06/08
First State Asia Innovation and Technology Fund“The Fund”
– Class I 26.65% -16.23%
MSCI AC Asia Free InformationTechnology 5.26% -9.00%
^ Performance calculation is base on official dealingNAV.
The Asian technology sector declined withglobal markets over the first six months of 2008.The MSCI AC Asia IT Index fell by 9.0% in USdollar terms, slightly outperforming the MSCIWorld Index which was down by 10.2%.
The sector was negatively impacted byconcerns about the effect of the credit crunch andrising inflation on global growth and demand forelectronics products. Worries about a moresignificant slowdown in the US, which is still amajor destination for Asian technology exports,undermined sentiment. Rising raw material costsand stronger Asian currencies put pressure onprofit margins of technology companies. However,many Asian tech stocks reportedbetter-than-expected first quarter results on theback of stronger demand from emergingeconomies.
Performance was helped by TK Corp (SouthKorea), an industry fitting and piping materialsupplier which benefited from aggressiveexpansion in the petrochemical, shipbuilding andsemiconductor industries. Unisteel Technology(Singapore: Materials) outperformed after a privateequity-led takeover bid and Taiwan Semiconductor(Information Technology) rallied with theTaiwanese market on expectations that a victory forthe KMT in presidential elections would bebeneficial for the economy.
On the negative side, Guocoland (Singapore:Real Estate) lagged on poor results and concernsabout litigation at its flagship project in China.LED chipmaker Epistar (Taiwan) underperformeddue to rising competition and lower demand, andauto parts manufacturer Minth Group (Hong Kong)was weak on subdued auto sales.
Over the six months we bought ChinaShipping Development as it was attractively valuedfollowing weakness of the Chinese market, andChina Oilfield Services which is benefiting fromincreasing deepwater exploration and production.We also bought Starhub (Singapore), a mobilephone, broadband and cable TV operator, which hasbeen growing steadily.
We sold China Merchants on valuationconcerns and Malaysian construction companyGamuda after the CEO sold a major stake in thefirm. Epistar was sold because of the deterioratingearnings outlook.
Inflation in most countries is escalating andinterest rates are likely to rise further. In light of aweak global economy, many Asian governments areadopting stimulus packages to boost domesticeconomies. For instance, Taiwan and South Koreahave recently announced a series of infrastructureprojects. The US economy continues to deteriorate,which is likely to impact those economiesdependent on exporting to the US. In thisenvironment of rising inflation, our strategy is toinvest in companies that are price-setters ratherthan price-takers. We are pursuing a more defensivestrategy, focusing on companies with lowervaluations, defensive earnings and higher dividendyields.
FIRST STATE ASIA INNOVATION AND TECHNOLOGY FUND
INVESTMENT MANAGER’S REPORT (UNAUDITED)
36

JOBNAME: 08081916 PAGE: 38 SESS: 26 OUTPUT: Mon Aug 18 12:43:17 2008
Numberof shares
FairValue
US$
% ofNet
Assets
Financial Assets at Fair Value Through Profit or Loss*
China 17,478,695 19.23China Blue Chemical ... 1,038,000 718,846 0.79China High SpeedTransmissionEquipment Group ....... 1,310,000 2,688,041 2.96
China Merchants Bank . 298,000 936,326 1.03China Oilfield Services 1,090,000 1,948,650 2.13China ResourcesEnterprise .................. 534,000 1,523,758 1.68
China ShippingDevelopment .............. 734,000 2,202,706 2.42
China Telecom ............ 2,206,000 1,196,714 1.32CNOOC ..................... 753,000 1,295,962 1.43Tencent Holdings ......... 334,600 2,587,545 2.85Xinao Gas Holdings ...... 1,406,000 2,380,147 2.62
Hong Kong 4,528,311 4.98AAC AcousticTechnologies Holdings . 1,508,000 1,257,070 1.38
Hang Lung Group ......... 237,000 1,053,164 1.16Minth Group ................. 1,510,000 1,061,212 1.17Pou Sheng InternationalHoldings .................... 8,412 2,557 0.00
Yue Yuen IndustrialHoldings .................... 486,000 1,154,308 1.27
India 2,861,693 3.15Bharti Airtel ............... 52,703 883,044 0.97Infosys Technologies .... 27,147 1,088,483 1.20Tech Mahindra ............ 53,165 890,166 0.98
Malaysia 2,748,182 3.02IOI ............................ 707,350 1,613,520 1.77Tenaga Nasional .......... 454,700 1,134,662 1.25
Singapore 9,747,434 10.72CSE Global ................ 2,369,000 1,831,296 2.01Guocoland .................. 692,000 1,110,624 1.22SingaporeTelecommunications .... 841,000 2,241,346 2.47
StarHub ...................... 905,000 1,898,881 2.09Unisteel Technology ..... 1,216,000 1,691,997 1.86United Overseas Bank .. 71,000 973,290 1.07
Numberof shares
FairValue
US$
% ofNet
Assets
Financial Assets at Fair Value Through Profit or Loss*
South Korea 22,531,899 24.79Doosan HeavyIndustries .................. 11,235 1,063,351 1.17
LG ............................ 23,420 1,518,046 1.67LG Display .................. 29,000 1,086,807 1.20LG Household & HealthCare ......................... 6,472 1,259,132 1.39
Samsung Electronics .... 10,599 5,674,296 6.24Samsung Fire & MarineInsurance .................. 9,232 1,928,482 2.12
Samsung Techwin ........ 31,881 1,411,176 1.55Shinhan FinancialGroup ....................... 28,646 1,289,892 1.42
Shinsegae ................... 4,906 2,640,610 2.90TK ............................ 52,937 2,259,691 2.49Yuhan ........................ 11,465 2,400,416 2.64
Taiwan 25,153,977 27.67AU Optronics .............. 1,003,564 1,577,109 1.74Chunghwa Telecom ...... 921,818 2,384,038 2.62Everlight Electronics .... 308,000 795,546 0.88Formosa Plastics .......... 353,000 851,303 0.94Global Unichip ............ 165,030 1,207,019 1.33ITEQ ......................... 1,651,000 1,591,004 1.75Largan Precision .......... 252,000 3,212,994 3.53MediaTek ................... 287,000 3,276,299 3.60New Era Electronics ..... 527,279 488,141 0.54Powertech Technology .. 859,462 3,001,449 3.30President Chain Store ... 454,000 1,503,212 1.65Taiwan Semiconductor . 1,906,819 4,077,111 4.48Transcend Information . 462,000 1,188,752 1.31
United States 455,528 0.50Lenovo ....................... 674,000 455,528 0.50
Total Financial Asset at Fair Valuethrough Profit or Loss ..................... 85,505,719 94.06
Cash and Other net assets .................. 5,401,760 5.94
Total Net Assets Attributable ToRedeemable ParticipatingShareholders .................................. 90,907,479 100.00
Total Cost of Financial Asset at FairValue through Profit or Loss ............ 88,592,816
*Traded on regulated exchanges or markets.
FIRST STATE ASIA INNOVATION AND TECHNOLOGY FUND
SCHEDULE OF INVESTMENTS
AS OF 30 JUNE 2008
37
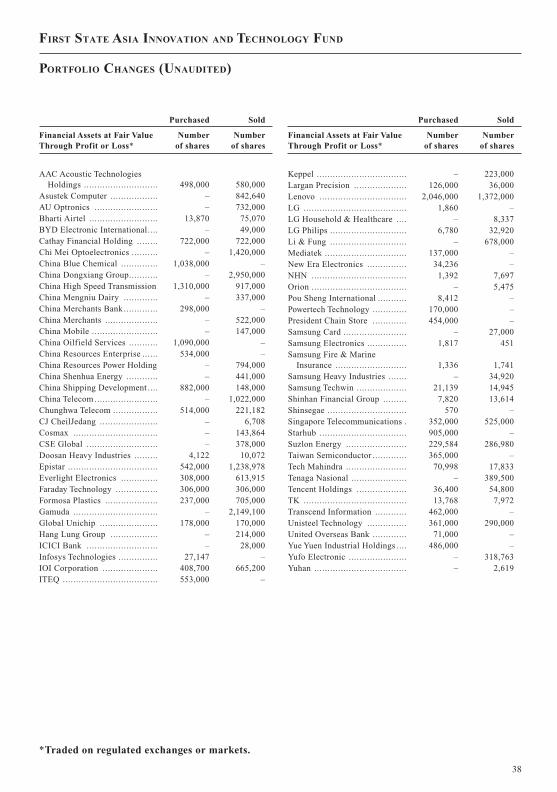
JOBNAME: 08081916 PAGE: 39 SESS: 26 OUTPUT: Mon Aug 18 12:43:17 2008
Purchased Sold
Financial Assets at Fair ValueThrough Profit or Loss*
Numberof shares
Numberof shares
AAC Acoustic TechnologiesHoldings ............................ 498,000 580,000
Asustek Computer .................. – 842,640AU Optronics ........................ – 732,000Bharti Airtel .......................... 13,870 75,070BYD Electronic International.... – 49,000Cathay Financial Holding ........ 722,000 722,000Chi Mei Optoelectronics .......... – 1,420,000China Blue Chemical .............. 1,038,000 –China Dongxiang Group........... – 2,950,000China High Speed Transmission 1,310,000 917,000China Mengniu Dairy ............. – 337,000China Merchants Bank ............. 298,000 –China Merchants .................... – 522,000China Mobile ......................... – 147,000China Oilfield Services ........... 1,090,000 –China Resources Enterprise ...... 534,000 –China Resources Power Holding – 794,000China Shenhua Energy ............ – 441,000China Shipping Development .... 882,000 148,000China Telecom ........................ – 1,022,000Chunghwa Telecom ................. 514,000 221,182CJ CheilJedang ...................... – 6,708Cosmax ................................ – 143,864CSE Global ........................... – 378,000Doosan Heavy Industries ......... 4,122 10,072Epistar .................................. 542,000 1,238,978Everlight Electronics .............. 308,000 613,915Faraday Technology ................ 306,000 306,000Formosa Plastics .................... 237,000 705,000Gamuda ................................ – 2,149,100Global Unichip ...................... 178,000 170,000Hang Lung Group .................. – 214,000ICICI Bank ........................... – 28,000Infosys Technologies ............... 27,147 –IOI Corporation ..................... 408,700 665,200ITEQ .................................... 553,000 –
Purchased Sold
Financial Assets at Fair ValueThrough Profit or Loss*
Numberof shares
Numberof shares
Keppel .................................. – 223,000Largan Precision .................... 126,000 36,000Lenovo ................................. 2,046,000 1,372,000LG ....................................... 1,860 –LG Household & Healthcare .... – 8,337LG Philips ............................. 6,780 32,920Li & Fung ............................. – 678,000Mediatek ............................... 137,000 –New Era Electronics ............... 34,236 –NHN .................................... 1,392 7,697Orion .................................... – 5,475Pou Sheng International ........... 8,412 –Powertech Technology ............. 170,000 –President Chain Store ............. 454,000 –Samsung Card ........................ – 27,000Samsung Electronics ............... 1,817 451Samsung Fire & Marine
Insurance ........................... 1,336 1,741Samsung Heavy Industries ....... – 34,920Samsung Techwin ................... 21,139 14,945Shinhan Financial Group ......... 7,820 13,614Shinsegae .............................. 570 –Singapore Telecommunications . 352,000 525,000Starhub ................................. 905,000 –Suzlon Energy ....................... 229,584 286,980Taiwan Semiconductor ............. 365,000 –Tech Mahindra ....................... 70,998 17,833Tenaga Nasional ..................... – 389,500Tencent Holdings ................... 36,400 54,800TK ....................................... 13,768 7,972Transcend Information ............ 462,000 –Unisteel Technology ............... 361,000 290,000United Overseas Bank ............. 71,000 –Yue Yuen Industrial Holdings .... 486,000 –Yufo Electronic ...................... – 318,763Yuhan ................................... – 2,619
*Traded on regulated exchanges or markets.
FIRST STATE ASIA INNOVATION AND TECHNOLOGY FUND
PORTFOLIO CHANGES (UNAUDITED)
38

JOBNAME: 08081916 PAGE: 40 SESS: 26 OUTPUT: Mon Aug 18 12:43:17 2008
PERFORMANCE^
01/01/07To
30/06/07
01/01/08To
30/06/08
First State Asian Equity Plus Fund “The Fund”– Class I – Dist 21.29% -9.29%– Class I 21.24% -9.30%
MSCI AC Asia Pacific ex Japan Free(Total Return) 18.45% -17.58%
^ Performance calculation is base on official dealingNAV.
Asia Pacific ex-Japan markets underperformedover the six months to 30 June 2007. The MSCIAsia Pacific ex-Japan Index fell by 17.6% in USdollar terms, significantly lagging the MSCI WorldIndex which declined by 10.2%.
The region was negatively influenced by weakglobal equity markets which declined on concernsabout the impact of the credit crunch on the globaleconomy and on rising inflationary pressures as theoil price reached new highs. Inflation rose stronglywithin the region and a number of central bankswere forced to tighten monetary policy. China andIndia fell very significantly on concerns aboutfurther rises in rates, while Taiwan was asignificant outperformer following a long period ofunderperformance as the presidential election resultwas taken positively by the market.
Fund performance was positively impactedby a number of holdings in Taiwan. ChunghwaTelecom (Telecom Services), Taiwan Semiconductor(Information Technology), Sinyi Realty (Financials)and Chinatrust Financial (Financials) all outperformedas investors anticipated that the presidentialelection victory by the KMT would be positive forrelations with Mainland China and thus economicgrowth in Taiwan.
On the negative side, stocks exposed to HongKong property underperformed. Both Cheung Kongand Swire Pacific lagged on concerns that globalinflationary pressures could result in higher US and
Hong Kong interest rates. Indian Hotels (ConsumerDiscretionary) underperformed as it fell with theIndian market which declined significantly onconcerns about rising inflation and furthermonetary tightening.
Over the six month period we bought HongKong utilities group CLP which offers relativelypredictable earnings in a difficult environment, andtelecoms group MobileOne (Singapore) for itsdefensive characteristics and attractive cash flowyield. We also purchased Dabur India which has astrong consumer franchise in India.
We sold AGL Energy (Australia: Utilities) onconcerns over the outlook following recentmanagement changes and Hang Seng Bank as webelieve that earnings are vulnerable to risinginterest rates in Hong Kong. We also soldAustralian retailer Woolworths on worries about theimpact of high interest rates on Australianconsumption.
Central banks are finally recognising theinflationary problem in Asia and are raising ratesaccordingly. Most countries have policy rates whichare well under the current inflation rate. However,despite the negative news about inflation, we havebeen adding to some of our positions on valuationgrounds. We believe Asia is in the middle of anadjustment in inflationary expectations which wethink is quite healthy. Nevertheless, we do believethat markets will remain volatile in the near termand we remain focused on stocks with strong cashflow, pricing power and attractive valuations.
FIRST STATE ASIAN EQUITY PLUS FUND
INVESTMENT MANAGER’S REPORT (UNAUDITED)
39

JOBNAME: 08081916 PAGE: 41 SESS: 26 OUTPUT: Mon Aug 18 12:43:17 2008
Numberof shares
FairValue
US$
% ofNet
Assets
Financial Assets at Fair Value Through Profit or Loss*
Australia 119,877,295 8.09BHP Billiton .. . . . . . . . . . . . . . . 352,345 14,798,524 1.00Brambles .. . . . . . . . . . . . . . . . . . . . 2,626,574 22,108,910 1.49Newcrest Mining .. . . . . . . . . . . 1,212,710 34,240,810 2.31Toll Holdings .. . . . . . . . . . . . . . . 1,891,118 10,971,204 0.74Wesfarmers .. . . . . . . . . . . . . . . . . 1,051,485 37,757,847 2.55
China 68,472,600 4.62Anhui Expressway ... . . . . . . . 11,832,000 8,345,752 0.56China Communications
Services .. . . . . . . . . . . . . . . . . . . . 12,009,604 8,748,259 0.59China Merchants Bank ... . 1,380,500 4,337,576 0.29China Oilfield Services .. . 1,702,000 3,042,755 0.21China Shipping
Development .. . . . . . . . . . . . . . 1,468,000 4,405,412 0.30China Telecom ... . . . . . . . . . . . 26,556,000 14,406,140 0.97CNOOC ... . . . . . . . . . . . . . . . . . . . 9,077,000 15,622,102 1.05Xinao Gas Holdings .. . . . . . 5,650,000 9,564,604 0.65
Hong Kong 422,247,507 28.51Aeon ... . . . . . . . . . . . . . . . . . . . . . . . 2,584,000 4,831,641 0.33Alco Holdings .. . . . . . . . . . . . . . 11,083,000 3,098,550 0.21ASM Pacific Technology .. 2,756,300 20,802,598 1.41Cafe de Coral Holdings .. . 8,968,000 16,078,569 1.09Cheung Kong Holdings .. . 2,895,000 39,020,776 2.63China Mengniu Dairy .. . . . 3,732,000 10,529,529 0.71China Resources
Enterprise .. . . . . . . . . . . . . . . . . . 7,234,000 20,642,065 1.39China Resources Power
Holdings .. . . . . . . . . . . . . . . . . . . . 2,812,000 6,844,727 0.46CLP Holdings .. . . . . . . . . . . . . . 4,975,000 42,588,169 2.88Dah Sing Financial
Holdings .. . . . . . . . . . . . . . . . . . . . 2,500,400 20,169,947 1.36Esprit . . . . . . . . . . . . . . . . . . . . . . . . . . 1,336,700 13,876,995 0.94Glorious Sun Enterprises . 7,954,000 3,876,268 0.26Hang Lung ... . . . . . . . . . . . . . . . . 5,450,000 24,218,339 1.64Hong Kong & China Gas . 8,747,200 20,798,088 1.40Hopewell Highway
Infrastructure .. . . . . . . . . . . . . . 39,030,000 29,231,831 1.97Hung Hing Printing Group 10,661,103 2,830,200 0.19Jardine Matheson ... . . . . . . . . 1,174,978 36,189,322 2.44Kingboard Chemical .. . . . . . 2,171,500 10,025,521 0.68Li & Fung ... . . . . . . . . . . . . . . . . . 5,816,400 17,529,388 1.18Lung Kee ... . . . . . . . . . . . . . . . . . . 8,623,500 3,926,056 0.27Public Financial Holdings 6,660,000 4,373,094 0.30SA SA International
Holdings .. . . . . . . . . . . . . . . . . . . 16,072,000 7,296,554 0.49
Numberof shares
FairValue
US$
% ofNet
Assets
Financial Assets at Fair Value Through Profit or Loss*
Hong Kong (continued)Swire Pacific “A”... . . . . . . . . . . 1,785,500 18,261,446 1.23Swire Pacific “B”... . . . . . . . . . . 6,007,500 12,249,984 0.83Tan Chong International .. . . 15,933,000 4,658,832 0.31Vitasoy International .. . . . . . . 7,576,000 3,585,180 0.24Wing Hang Bank... . . . . . . . . . . . 1,865,500 24,713,838 1.67
India 87,538,349 5.91Dabur India .. . . . . . . . . . . . . . . . . 3,415,516 6,318,848 0.43Godrej Consumer
Products .. . . . . . . . . . . . . . . . . . . . 5,387,905 16,982,959 1.15Hindustan Unilever .. . . . . . . 4,243,989 20,335,040 1.37Housing Development
Finance .. . . . . . . . . . . . . . . . . . . . . 73,920 3,326,847 0.22Indian Hotels .. . . . . . . . . . . . . . . 5,505,780 9,782,330 0.66Infosys Technologies .. . . . . . 313,246 12,559,873 0.85Sun Pharmaceutical . . . . . . . . 565,591 18,232,452 1.23
Malaysia 113,900,327 7.69Bumiputra-Commerce
Holdings .. . . . . . . . . . . . . . . . . . . 2,355,600 5,733,931 0.39Genting .. . . . . . . . . . . . . . . . . . . . . . 2,371,400 4,066,087 0.27IOI .. . . . . . . . . . . . . . . . . . . . . . . . . . . . 17,458,660 39,824,561 2.69Public Bank ... . . . . . . . . . . . . . . . 8,185,700 26,316,549 1.78Sime Darby ... . . . . . . . . . . . . . . . 4,189,536 11,801,510 0.80SP Setia .. . . . . . . . . . . . . . . . . . . . . 13,887,600 12,501,391 0.84Tenaga Nasional .. . . . . . . . . . . 3,901,800 9,736,580 0.66Uchi Technologies .. . . . . . . . . 6,400,900 3,919,718 0.26
Philippines 31,393,086 2.12Philippine Long Distance
Telephone .. . . . . . . . . . . . . . . . . . 414,269 22,024,311 1.49SM Investments .. . . . . . . . . . . . 1,726,120 9,368,775 0.63
Singapore 180,485,450 12.19Allgreen Properties .. . . . . . . 25,968,000 18,831,245 1.27Ascendas India Trust . . . . . . . 10,318,000 6,836,634 0.46Ascott Residence Trust. . . . . 7,121,000 5,504,712 0.37Capitacommercial Trust . . . 5,894,500 8,288,666 0.56Fraser & Neave .. . . . . . . . . . . . 4,511,000 15,044,416 1.02Macquarie Prime Real
Estate Investment Trust. . . 6,754,000 5,071,840 0.34MobileOne ... . . . . . . . . . . . . . . . . 11,257,000 15,497,747 1.05Oversea Chinese Banking 6,381,426 38,383,458 2.59Singapore Post . . . . . . . . . . . . . . 28,020,000 22,485,313 1.52Singapore
Telecommunications .. . . . 12,735,000 33,939,998 2.29Unisteel Technology ... . . . . 7,619,000 10,601,421 0.72
*Traded on regulated exchanges or markets.
FIRST STATE ASIAN EQUITY PLUS FUND
SCHEDULE OF INVESTMENTS
AS OF 30 JUNE 2008
40
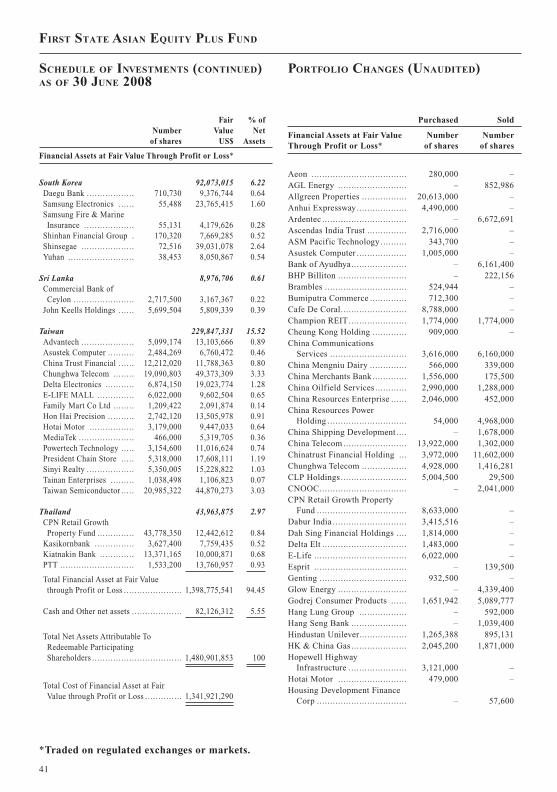
JOBNAME: 08081916 PAGE: 42 SESS: 26 OUTPUT: Mon Aug 18 12:43:17 2008
Numberof shares
FairValue
US$
% ofNet
Assets
Financial Assets at Fair Value Through Profit or Loss*
South Korea 92,073,015 6.22Daegu Bank ... . . . . . . . . . . . . . . . 710,730 9,376,744 0.64Samsung Electronics .. . . . . 55,488 23,765,415 1.60Samsung Fire & Marine
Insurance .. . . . . . . . . . . . . . . . . . 55,131 4,179,626 0.28Shinhan Financial Group . 170,320 7,669,285 0.52Shinsegae .. . . . . . . . . . . . . . . . . . . 72,516 39,031,078 2.64Yuhan ... . . . . . . . . . . . . . . . . . . . . . . 38,453 8,050,867 0.54
Sri Lanka 8,976,706 0.61Commercial Bank of
Ceylon .. . . . . . . . . . . . . . . . . . . . . . 2,717,500 3,167,367 0.22John Keells Holdings .. . . . . 5,699,504 5,809,339 0.39
Taiwan 229,847,331 15.52Advantech .. . . . . . . . . . . . . . . . . . . 5,099,174 13,103,666 0.89Asustek Computer .. . . . . . . . . 2,484,269 6,760,472 0.46China Trust Financial . . . . . . 12,212,020 11,788,363 0.80Chunghwa Telecom ... . . . . . 19,090,803 49,373,309 3.33Delta Electronics .. . . . . . . . . . 6,874,150 19,023,774 1.28E-LIFE MALL ... . . . . . . . . . . . 6,022,000 9,602,504 0.65Family Mart Co Ltd .. . . . . . . 1,209,422 2,091,874 0.14Hon Hai Precision .. . . . . . . . . 2,742,120 13,505,978 0.91Hotai Motor .. . . . . . . . . . . . . . . . 3,179,000 9,447,033 0.64MediaTek ... . . . . . . . . . . . . . . . . . . 466,000 5,319,705 0.36Powertech Technology ... . . 3,154,600 11,016,624 0.74President Chain Store .. . . . 5,318,000 17,608,111 1.19Sinyi Realty .. . . . . . . . . . . . . . . . . 5,350,005 15,228,822 1.03Tainan Enterprises .. . . . . . . . 1,038,498 1,106,823 0.07Taiwan Semiconductor .. . . . 20,985,322 44,870,273 3.03
Thailand 43,963,875 2.97CPN Retail Growth
Property Fund ... . . . . . . . . . . . 43,778,350 12,442,612 0.84Kasikornbank ... . . . . . . . . . . . . 3,627,400 7,759,435 0.52Kiatnakin Bank ... . . . . . . . . . . 13,371,165 10,000,871 0.68PTT ... . . . . . . . . . . . . . . . . . . . . . . . . . 1,533,200 13,760,957 0.93
Total Financial Asset at Fair Valuethrough Profit or Loss .. . . . . . . . . . . . . . . . . . . . . 1,398,775,541 94.45
Cash and Other net assets .. . . . . . . . . . . . . . . . . . 82,126,312 5.55
Total Net Assets Attributable ToRedeemable ParticipatingShareholders .. . . . . . . . . . . . . . . . . . . . . . . . . . . . . . . . . 1,480,901,853 100
Total Cost of Financial Asset at FairValue through Profit or Loss .. . . . . . . . . . . . . 1,341,921,290
Purchased Sold
Financial Assets at Fair ValueThrough Profit or Loss*
Numberof shares
Numberof shares
Aeon .................................... 280,000 –AGL Energy .......................... – 852,986Allgreen Properties ................. 20,613,000 –Anhui Expressway................... 4,490,000 –Ardentec ................................ – 6,672,691Ascendas India Trust ............... 2,716,000 –ASM Pacific Technology .......... 343,700 –Asustek Computer ................... 1,005,000 –Bank of Ayudhya..................... – 6,161,400BHP Billiton .......................... – 222,156Brambles ............................... 524,944 –Bumiputra Commerce .............. 712,300 –Cafe De Coral......................... 8,788,000 –Champion REIT...................... 1,774,000 1,774,000Cheung Kong Holding ............. 909,000 –China Communications
Services ............................. 3,616,000 6,160,000China Mengniu Dairy .............. 566,000 339,000China Merchants Bank ............. 1,556,000 175,500China Oilfield Services ............ 2,990,000 1,288,000China Resources Enterprise ...... 2,046,000 452,000China Resources Power
Holding .............................. 54,000 4,968,000China Shipping Development .... – 1,678,000China Telecom ........................ 13,922,000 1,302,000Chinatrust Financial Holding ... 3,972,000 11,602,000Chunghwa Telecom ................. 4,928,000 1,416,281CLP Holdings ......................... 5,004,500 29,500CNOOC................................. – 2,041,000CPN Retail Growth Property
Fund .................................. 8,633,000 –Dabur India ............................ 3,415,516 –Dah Sing Financial Holdings .... 1,814,000 –Delta Elt ................................ 1,483,000 –E-Life ................................... 6,022,000 –Esprit ................................... – 139,500Genting ................................. 932,500 –Glow Energy .......................... – 4,339,400Godrej Consumer Products ...... 1,651,942 5,089,777Hang Lung Group .................. – 592,000Hang Seng Bank ..................... – 1,039,400Hindustan Unilever.................. 1,265,388 895,131HK & China Gas ..................... 2,045,200 1,871,000Hopewell Highway
Infrastructure ...................... 3,121,000 –Hotai Motor .......................... 479,000 –Housing Development Finance
Corp .................................. – 57,600
*Traded on regulated exchanges or markets.
FIRST STATE ASIAN EQUITY PLUS FUND
SCHEDULE OF INVESTMENTS (CONTINUED)AS OF 30 JUNE 2008
PORTFOLIO CHANGES (UNAUDITED)
41

JOBNAME: 08081916 PAGE: 43 SESS: 26 OUTPUT: Mon Aug 18 12:43:17 2008
Purchased Sold
Financial Assets at Fair ValueThrough Profit or Loss*
Numberof shares
Numberof shares
Indian Hotels INR1 ................. 3,211,705 11,470,375Infosys Technologies ............... 152,900 91,156IOI Corporation ..................... 7,378,300 –Jardine Matheson .................... 171,600 101,200Kiatnakin Finance .................. 10,705,265 3,608,100Kingboard Chemicals .............. 468,000 512,500Li & Fung .............................. 426,000 1,310,000Mediatek ............................... 609,000 143,000MobileOne ............................. 11,257,000 –Newcrest Mining..................... 764,757 –Overseas Chinese Banking........ 1,115,000 –Philippine Long Distance
Telecom.............................. 162,850 –Powertech Technology.............. 863,000 333,000President Chain Store .............. 872,000 530,000Prime Reit.............................. – 1,151,000Public Bank ........................... 671,900 292,700Public Financial Holdings......... 10,694,000 4,034,000Sa Sa International .................. 5,392,000 8,216,000Shinsegae............................... 44,267 –Sime Darby ........................... 4,189,536 4,189,536Singapore Post ........................ 13,662,000 –Sino Thai Engineering ............. – 29,165,300Sinyi Realty ........................... 166,000 1,059,000SM Investments ...................... 119,690 –SP Setia Berhad ..................... 7,320,700 6,370,850Sun Pharmaceuticals................ – 50,460Swire Pacific .......................... 145,500 848,000Taiwan Semiconductor ............. 1,562,000 –Tata Consultancy Services ........ – 270,793Toll Holdings ......................... – 544,396Wesfarmers ............................ 116,832 296,633Wing Hang Bank..................... 271,500 472,000Woolworths ............................ – 294,077Yuhan ................................... 7,839 –
*Traded on regulated exchanges or markets.
FIRST STATE ASIAN EQUITY PLUS FUND
PORTFOLIO CHANGES (UNAUDITED)(CONTINUED)
42

JOBNAME: 08081916 PAGE: 44 SESS: 26 OUTPUT: Mon Aug 18 12:43:17 2008
PERFORMANCE^
01/01/07To
30/06/07
01/01/08To
30/06/08
First State Asian Bond Fund “The Fund”– Class I – Dist 1.67% -3.03%– Class III 2.08% -2.69%
JP Morgan Asia CreditIndex 1.37% -1.04%
^ Performance calculation is base on official dealingNAV.
The credit turmoil of 2007 continued into2008. In the first quarter, US Treasury yieldsdeclined and the yield curve steepenedsignificantly as economic data indicated the stronglikelihood of a recession. Problems in the creditmarkets continued with wider credit spreads drivenby concerns about the health of the banking systemand fears about downgrades of bond insurers. TheFederal Reserve cut interest rates by 200 basispoints (bps) to 2.25% in response and JP Morgan’stakeover of the troubled Bear Stearns, up to thispoint, marked the peak of market turmoil as fearsof systematic breakdown subsided.
After the Fed’s numerous interventions, riskappetite rose in the second quarter as banks raisedmore capital. Inflation worries dominated themarket on rising food and commodity prices. Buteconomic data was slightly stronger than expectedand more hawkish comments from the Fed led to arebound in yields and flatter curves. In the secondquarter, the Fed only cut once by 25 bps to 2%, andthe market started to price in monetary tightening.
Over the first half of 2008, the US Treasuryyield curve shifted down with a steepening bias,with 2-year and 10-year yields declining by 43 bpsand 5 bps to 2.62% and 3.97% respectively.
Although most non-Japan Asian economiescontinued to decouple from a slowing US economy,US dollar bond prices were negatively impacted byintensively weak market sentiment following theUS sub-prime crisis.
Over the period, the JP Morgan Asia DollarCredit Index returned -1.03% and the spreadwidened by 92 bps to 328 bps – the highest levelsince early 1999 in the wake of the Asian financialcrisis.
The current high level of non-Japan Asiancredit spreads is pricing in an excessively highdefault rate and is disregarding strong governmentfiscal positions; solid external accounts backed upby significant foreign exchange reserves; healthybanking systems with solid capital bases and littleUS sub-prime exposures; and abundant liquidity indomestic economies. At the current credit spreadlevels, we see good value in Asian credits. Inparticular, we like top tier Asian bank credits frominvestment-grade countries like Singapore, HongKong and South Korea. Also, the high-yield bondsfrom commodity related and domestic consumptionsectors have compelling values on a risk-adjustedbasis.
FIRST STATE ASIAN BOND FUND
INVESTMENT MANAGER’S REPORT (UNAUDITED)
43

JOBNAME: 08081916 PAGE: 45 SESS: 26 OUTPUT: Mon Aug 18 12:43:17 2008
Numberof shares
FairValue
US$
% ofNet
Assets
Financial Assets at Fair Value Through Profit or Loss*
United States Dollar 21,022,709 96.23Agile Property Holdings9% 22/09/2013 ........... 1,400,000 1,204,000 5.51
Avago Technologies10.125% 01/12/2013 ... 200,000 214,250 0.98
Avago Technologies Var01/06/2013................. 32,000 31,990 0.15
BLT Finance 7.5%15/05/2014................. 850,000 569,500 2.61
Blue Ocean Resources11% 28/06/2012 ......... 900,000 776,250 3.55
BW Group 6.625%28/06/2017................. 1,250,000 1,100,825 5.04
C&M Finance 8.1%01/02/2016................. 150,000 147,938 0.68
China Properties9.125% 04/05/2014 ..... 1,000,000 690,000 3.16
Ciliandra PerkasaFinance 10.75%08/12/2011................. 200,000 205,500 0.94
Davomas InternationalFinanc 11% 09/05/2011 ......................... 770,000 773,850 3.54
DBS Capital FundingCorp 7.657% Perp....... 500,000 514,700 2.36
Giti Tire 12.25%26/01/2012................. 850,000 752,250 3.44
Greentown ChinaHoldings 9% 08/11/2013 ......................... 1,250,000 887,500 4.06
GT 2005 BONDS10.25% 21/07/2010 ..... 1,100,000 990,000 4.53
Hana Funding 8.748%Perp .......................... 500,000 519,015 2.38
Hang Fung GoldTechnology 9.25%17/10/2014................. 150,000 124,500 0.57
Hynix Semiconductor7.875% 27/06/2017 ..... 1,000,000 757,500 3.47
Krung Thai Bank7.378% Perp............... 700,000 648,312 2.97
Lai Fung Holdings9.125% 04/04/2014 ..... 950,000 805,229 3.69
Numberof shares
FairValue
US$
% ofNet
Assets
Financial Assets at Fair Value Through Profit or Loss*
United States Dollar (continued)Lippo Karawaci Finance8.875% 09/03/2011 ..... 550,000 527,140 2.41
Matahari Finance 9.5%06/10/2009................. 800,000 799,040 3.66
Resona Bank 5.85%Perp .......................... 500,000 418,400 1.92
Road KingInfrastructure Finance6.25% 15/07/2011 ....... 750,000 622,500 2.85
Road KingInfrastructure Finance7.625% 14/05/2014 ..... 500,000 389,310 1.78
Russian Agriculture6.97% 21/09/2016 ....... 60,000 57,270 0.26
Shimao PropertyHoldings 01/12/2011 ... 600,000 426,372 1.95
Shinhan Bank 6.819%20/09/2036................. 1,000,000 862,350 3.95
Shinsegae 6.125%27/06/2011................. 1,000,000 996,770 4.56
SMFG Preferred Capital8.75% Perp ................ 750,000 748,125 3.42
Standard Chartered8.125% Perp............... 800,000 806,216 3.69
United Overseas Bank4.5% 02/07/2013......... 500,000 479,400 2.19
United Overseas Bank5.375% 03/09/2019 ..... 1,130,000 1,071,127 4.90
Woori Bank 6.208%02/05/2037................. 1,400,000 1,105,580 5.06
Total Financial Asset at Fair Valuethrough Profit or Loss ................... 21,022,709 96.23
Cash and other net liabilities ............ 824,731 3.77
Total Net Assets Attributable ToRedeemable ParticipatingShareholders ................................ 21,847,440 100.00
Total Cost of Financial Asset at FairValue through Profit or Loss........... 23,349,670
*Traded on regulated exchanges or markets.
FIRST STATE ASIAN BOND FUND
SCHEDULE OF INVESTMENTS
AS OF 30 JUNE 2008
44

JOBNAME: 08081916 PAGE: 46 SESS: 26 OUTPUT: Mon Aug 18 12:43:17 2008
Purchased Sold
Financial Assets at Fair ValueThrough Profit or Loss*
Numberof shares
Numberof shares
Advance Agro Public 11%19/12/2012.......................... – 850,000
AES China 8.25% 26/06/2010... 200,000 400,000ATF Bank 9% 11/05/2016 ........ 200,000 200,000ATF Capital 10% VRN Perp ..... 200,000 400,000BW Group 6.625% 28/06/2017.. 1,250,000 –C&M Finance 8.1% 01/02/
2016 .................................. 900,000 1,650,000CII Carbon 11.125% 15/11/
2015 .................................. – 1,000,000Ciliandra Perkasa 10.75%
08/12/2011.......................... 200,000 –Davomas International Finance
11% 09/05/2011 .................. 870,000 870,000DBS Capital Funding Corp
7.657% VRN Perp................ 500,000 –Development Bank Philippines
8.375% Var Perp .................. – 1,100,000GT 2005 BONDS 10.25%
21/07/2010.......................... 750,000 750,000Hana Funding 8.748% VRN
Perp ................................... 500,000 –Hynix Semicondurctor 7.875%
27/06/2017.......................... 1,000,000 –ICICI Bank 6.625% 03/10/
2012 .................................. 500,000 500,000Indo Integrated 8.5% 01/06/
2012 .................................. – 900,000Indonesia (Gov) 7.75% 17/01/
2038 .................................. 500,000 500,000Islamic Republic of Pakistan
7.125% 31/03/2016 .............. 100,000 200,000Islamic Republic of Pakistan
7.875% 31/03/2036 .............. – 500,000Korea Southern Power 5.375%
18/04/2013.......................... 250,000 250,000Korea Southern Power 5.375%
18/04/2013.......................... 250,000 250,000Krung Thai Bank 7.378% VRN
Perp ................................... 570,000 570,000Lippo Karawaci Finance
8.875% 09/03/2011 .............. 800,000 1,300,000Majapahit Holding 7.75%
17/10/2016.......................... – 1,300,000Marfrig Overseas 9.625%
16/11/2016.......................... – 500,000
Purchased Sold
Financial Assets at Fair ValueThrough Profit or Loss*
Numberof shares
Numberof shares
Matahari Finance 9.5% 06/10/2009 .................................. 800,000 800,000
National Power Var 23/08/2011 . 233,000 466,000Pakistan Mobile 8.625%
13/11/2013.......................... 700,000 1,400,000PGN Euro Finance 7.5%
10/09/2013.......................... 200,000 400,000Philippine Long Distance
Telephone 8.35% 06/03/2017 . 100,000 200,000Philippines (Rep of) 9.875%
15/01/2019.......................... – 1,250,000Philippines (Rep of) 9.5%
02/02/2030.......................... 2,000,000 2,000,000Resona Bank 5.85% VRN Perp.. 500,000 –Road King 7.625% 14/05/2014.. 500,000 –Road King Infrastructure 6.25%
15/07/2011.......................... 750,000 –RSHB Capital 7.125% 14/01/
2014 .................................. 1,200,000 1,200,000Russian Agriculture 6.97%
21/09/2016 Step................... 60,000 60,000Shinhan Bank 6.819% VRN
20/09/2036.......................... 1,000,000 –Shinsegae 6.125% 27/06/2011... 2,000,000 1,000,000SMFG Preferred Capital 8.75%
Perp ................................... 2,000,000 1,250,000Standard Chartered 8.125%
Perp ................................... 2,000,000 1,200,000Sun Sage 8.125% 26/03/2009.... 260,000 260,000Titan Petrochemical Group
8.5% 18/03/2012.................. 250,000 1,250,000United Overseas Bank 4.5%
02/07/2013.......................... 500,000 –United Overseas Bank 5.375%
03/09/2019.......................... 1,130,000 –US Treasury Bill 0% 26/06/
2008 .................................. 2,500,000 2,500,000US Treasury Bill 0% 11/09/
2008 .................................. 2,000,000 2,000,000VTB Capital 6.875% 29/05/
2018 .................................. 1,500,000 1,500,000Woori Bank 6.208% VRN
02/05/2037.......................... 1,400,000 –
*Traded on regulated exchanges or markets.
FIRST STATE ASIAN BOND FUND
PORTFOLIO CHANGES (UNAUDITED)
45
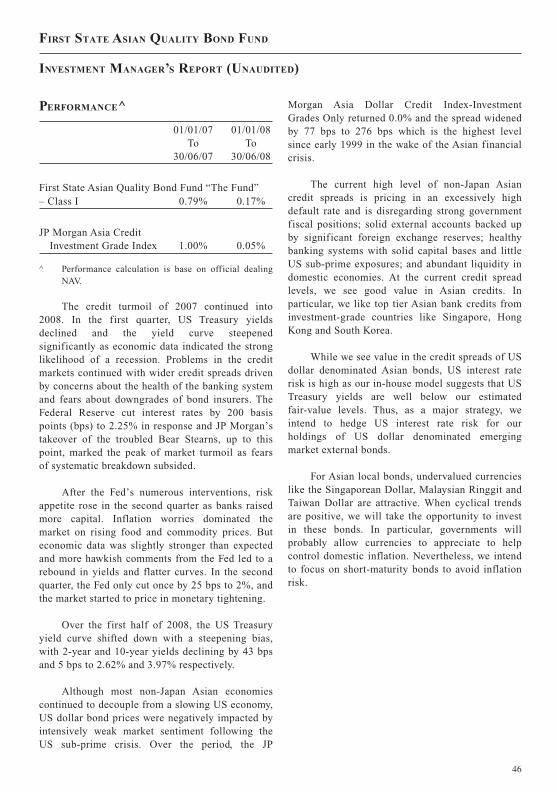
JOBNAME: 08081916 PAGE: 47 SESS: 26 OUTPUT: Mon Aug 18 12:43:17 2008
PERFORMANCE^
01/01/07To
30/06/07
01/01/08To
30/06/08
First State Asian Quality Bond Fund “The Fund”– Class I 0.79% 0.17%
JP Morgan Asia CreditInvestment Grade Index 1.00% 0.05%
^ Performance calculation is base on official dealingNAV.
The credit turmoil of 2007 continued into2008. In the first quarter, US Treasury yieldsdeclined and the yield curve steepenedsignificantly as economic data indicated the stronglikelihood of a recession. Problems in the creditmarkets continued with wider credit spreads drivenby concerns about the health of the banking systemand fears about downgrades of bond insurers. TheFederal Reserve cut interest rates by 200 basispoints (bps) to 2.25% in response and JP Morgan’stakeover of the troubled Bear Stearns, up to thispoint, marked the peak of market turmoil as fearsof systematic breakdown subsided.
After the Fed’s numerous interventions, riskappetite rose in the second quarter as banks raisedmore capital. Inflation worries dominated themarket on rising food and commodity prices. Buteconomic data was slightly stronger than expectedand more hawkish comments from the Fed led to arebound in yields and flatter curves. In the secondquarter, the Fed only cut once by 25 bps to 2%, andthe market started to price in monetary tightening.
Over the first half of 2008, the US Treasuryyield curve shifted down with a steepening bias,with 2-year and 10-year yields declining by 43 bpsand 5 bps to 2.62% and 3.97% respectively.
Although most non-Japan Asian economiescontinued to decouple from a slowing US economy,US dollar bond prices were negatively impacted byintensively weak market sentiment following theUS sub-prime crisis. Over the period, the JP
Morgan Asia Dollar Credit Index-InvestmentGrades Only returned 0.0% and the spread widenedby 77 bps to 276 bps which is the highest levelsince early 1999 in the wake of the Asian financialcrisis.
The current high level of non-Japan Asiancredit spreads is pricing in an excessively highdefault rate and is disregarding strong governmentfiscal positions; solid external accounts backed upby significant foreign exchange reserves; healthybanking systems with solid capital bases and littleUS sub-prime exposures; and abundant liquidity indomestic economies. At the current credit spreadlevels, we see good value in Asian credits. Inparticular, we like top tier Asian bank credits frominvestment-grade countries like Singapore, HongKong and South Korea.
While we see value in the credit spreads of USdollar denominated Asian bonds, US interest raterisk is high as our in-house model suggests that USTreasury yields are well below our estimatedfair-value levels. Thus, as a major strategy, weintend to hedge US interest rate risk for ourholdings of US dollar denominated emergingmarket external bonds.
For Asian local bonds, undervalued currencieslike the Singaporean Dollar, Malaysian Ringgit andTaiwan Dollar are attractive. When cyclical trendsare positive, we will take the opportunity to investin these bonds. In particular, governments willprobably allow currencies to appreciate to helpcontrol domestic inflation. Nevertheless, we intendto focus on short-maturity bonds to avoid inflationrisk.
FIRST STATE ASIAN QUALITY BOND FUND
INVESTMENT MANAGER’S REPORT (UNAUDITED)
46

JOBNAME: 08081916 PAGE: 48 SESS: 26 OUTPUT: Mon Aug 18 12:43:17 2008
Numberof shares
FairValue
US$
% ofNet
Assets
Financial Assets at Fair Value Through Profit or Loss*
BondsSingapore Dollar 7,867,610 1.54Hongkong LandTreasury ServicesSingapore 3.01%04/10/2010................. 10,750,000 7,867,610 1.54
United States Dollar 463,821,937 90.95Bangkok Bank 9.025%15/03/2029................. 8,850,000 9,547,380 1.87
Bank of East Asia5.625% 13/12/2015 ..... 2,325,000 2,302,796 0.45
BTMU Curacao3.0975% 19/04/2017 ... 5,900,000 5,536,483 1.09
Chinatrust CommercialBank 5.625% Perp ...... 15,550,000 13,884,595 2.72
Chong Hing Bank3.70625% 16/12/2016.. 10,000,000 9,805,500 1.92
Chuo Mitsui Trust &Banking 5.506% Perp .. 5,000,000 4,351,800 0.85
CKWH-UT2 9.125%Perp .......................... 950,000 983,896 0.19
CMHI Finance BVI6.125% 18/06/2013 ..... 5,000,000 4,919,230 0.96
CMHI Finance BVI7.125% 18/06/2018 ..... 19,000,000 18,644,700 3.66
Dah Sing Bank3.38438% 06/05/2015.. 4,100,000 3,891,925 0.76
Dah Sing Bank3.43063% 03/06/2016.. 2,000,000 1,889,200 0.37
Dah Sing Bank VarPerp .......................... 3,500,000 3,280,270 0.64
DBS Bank 2.94%16/05/2017................. 18,730,000 17,451,191 3.42
DBS Bank 3.32313%15/07/2021................. 5,000,000 4,459,500 0.87
DBS Capital Funding7.657% Perp............... 14,350,000 14,771,890 2.90
Export-Import Bank OfKorea 2.96% 16/11/2010 ......................... 500,000 482,805 0.09
Gain Silver Finance6.375% 25/08/2016 ..... 2,600,000 2,491,091 0.49
Goldman Sachs 6.25%01/09/2017................. 15,750,000 15,627,218 3.06
GPB Eurobond Finance6.5% 23/09/2015......... 6,500,000 5,874,700 1.15
Hana Bank 5.375%12/04/2017................. 7,500,000 6,875,250 1.35
Hana Bank 5.875%14/09/2016................. 7,000,000 6,776,000 1.33
Numberof shares
FairValue
US$
% ofNet
Assets
Financial Assets at Fair Value Through Profit or Loss*
United States Dollar (continued)Hana Funding 8.748%Perp .......................... 13,000,000 13,494,390 2.65
Hanarotelecom 7%01/02/2012................. 7,000,000 6,921,600 1.36
Hutchison WhampoaInternational 6.5%13/02/2013................. 1,000,000 1,008,900 0.20
Hyundai Card 3.21438%03/05/2010................. 8,500,000 8,190,600 1.61
ICICI Bank UK3.25813% 27/02/2012.. 6,500,000 6,028,100 1.18
Korea Exchange Bank3.1475% 20/07/2012 ... 5,350,000 5,086,299 1.00
Krung Thai Bank PCL7.378% Perp............... 9,500,000 8,798,520 1.73
Kuznetski Capital forBank of Moscow6.807% 10/05/2017 ..... 11,250,000 10,218,375 2.00
Kuznetski (Bank ofMoscow) 7.5%25/11/2015................. 2,720,000 2,663,968 0.52
Li & Fung 5.5%16/05/2017................. 4,000,000 3,733,360 0.73
Merrill Lynch 6.4%28/08/2017................. 8,250,000 7,803,015 1.53
Morgan Stanley 6.25%28/08/2017................. 11,250,000 10,857,938 2.13
National AgriculturalCooperative Federation5.375% 26/04/2017 ..... 3,750,000 3,551,250 0.70
Pusan Bank 5.5%14/03/2017................. 7,200,000 6,769,152 1.33
Pusan Bank 6% 30/10/2017 ......................... 18,000,000 16,907,760 3.33
Resona Bank 5.85%Perp .......................... 29,000,000 24,267,200 4.77
RSHB Capital 6.97%21/09/2016................. 9,400,000 8,972,300 1.76
SBB Capital 6.62%Perp .......................... 6,700,000 6,308,720 1.24
Shimao PropertyHoldings 4.8775%01/12/2011................. 4,500,000 3,197,790 0.63
Shimao PropertyHoldings 8% 01/12/2016 ......................... 1,900,000 1,337,220 0.26
Shinhan Bank 5.663%02/03/2035................. 8,400,000 6,885,480 1.35
Shinhan Bank 5.75%28/02/2016................. 2,000,000 1,930,000 0.38
*Traded on regulated exchanges or markets.**Valued using a quote from a single broker.
FIRST STATE ASIAN QUALITY BOND FUND
SCHEDULE OF INVESTMENTS
AS OF 30 JUNE 2008
47

JOBNAME: 08081916 PAGE: 49 SESS: 26 OUTPUT: Mon Aug 18 12:43:17 2008
Numberof shares
FairValue
US$
% ofNet
Assets
Financial Assets at Fair Value Through Profit or Loss*
United States Dollar (continued)Shinhan Bank 6.25%08/09/2013................. 60,000 60,213 0.01
Shinhan Bank 6.819%20/09/2036................. 18,700,000 16,125,945 3.16
Shinsegae 6.125%27/06/2011................. 12,700,000 12,658,979 2.48
SMFG Preferred CapitalUSD 2 8.75% Perp ...... 22,600,000 22,543,500 4.42
Standard CharteredBank 8.125% Perp ...... 9,200,000 9,271,484 1.82
Standard CharteredBank 6.4% 26/09/2017 ......................... 4,635,000 4,409,771 0.86
Standard Chartered FirstBank Korea 7.267%03/03/2034................. 5,460,000 5,477,472 1.07
United Overseas Bank5.375 03/09/2019 ........ 19,000,000 18,010,100 3.53
US Treasury Bill2.875% 30/06/2010 ..... 24,700,000 24,804,203 4.86
Wing Hang Bank 6%Perp .......................... 3,200,000 2,856,864 0.56
Woori Bank 6.208%02/05/2037................. 36,500,000 28,824,049 5.65
Total Bonds ..................................... 471,689,547 92.49
Futures Contracts(Note 9) ........................................ – –
Total Financial Assets at Fair ValueThrough Profit or Loss .................... 471,667,667 92.49
Forward foreign exchange contracts(Note 9) ........................................ (21,880) –
Total Financial Liabilities at FairValue Through Profit or Loss ........... (21,880) –
Cash and other net liabilities .............. 38,322,859 7.51
Total Net Assets Attributable toRedeemable ParticipatingShareholders .................................. 509,990,526 100.00
Total Cost of Financial Assets at FairValue Through Profit or Loss ........... 493,167,140
Purchased Sold
Financial Assets at Fair ValueThrough Profit or Loss*
Numberof shares
Numberof shares
Bank Negara 0% T Bill 05/06/2008 .................................. 19,700,000 46,900,000
Bank Negara 3.569% 14/02/2008 .................................. – 25,500,000
Bank Negara Monetary Note3.541% 08/08/2008 .............. – 26,500,000
Bank of Baroda 6.625% VRN25/05/2022.......................... – 6,400,000
Bank of East Asia 5.625%13/12/2015.......................... 2,325,000 2,325,000
Bank of Moscow 7.5% VRN25/11/2015.......................... 3,470,000 3,470,000
Bank of Negra 0% 12/06/2008 .. 66,800,000 66,800,000CBT 10 YR Treasury Note
September 2008 ................... 10 10Chinatrust 5.625% VRN Perp.... 8,050,000 1,050,000Chong Hing FRN 16/12/2016.... 1,000,000 1,000,000Chuo Mitsui Trust & Bank
5.506% VRN Perp................ 5,000,000 –CMHI Finance 6.125% 18/06/
2013 .................................. 5,000,000 5,000,000CMHI Finance 6.125% 18/06/
2013 .................................. 5,000,000 –CMHI Finance 7.125% 18/06/
2018 .................................. 38,000,000 19,000,000Dah Sing Bank FRN 06/05/15 ... 2,100,000 2,100,000DBS Bank 5% VRN 15/11/
2019 .................................. 1,635,000 –DBS Bank FRN 15/07/2021 ...... 5,000,000 –DBS Bank FRN 16/05/2017 ...... 9,000,000 –DBS Capital Funding Corp
7.657% VRN Perp................ 14,350,000 –Export-Import Bank of Korea
2.28% 06/05/2029 ................ 5,000,000 5,000,000Export-Import Bank of Korea
FRN 16/11/2010 .................. 500,000 500,000First Bank Korea 7.267% VRN
03/03/2034.......................... 5,460,000 –Gain Silver Finance 6.375%
25/08/2016.......................... – 13,700,000Gazprombank 6.5% 23/09/2015. 4,400,000 10,400,000Hana Bank 5.875% VRN
14/09/2016.......................... 7,000,000 –Hana Bank VRN 5.375%
12/04/2017.......................... 7,500,000 –Hana Funding 8.748% VRN
Perp ................................... 13,000,000 –Hanaro Telecom 7% 01/02/
2012 .................................. 7,000,000 –
*Traded on regulated exchanges or markets.**Valued using a quote from a single broker.
FIRST STATE ASIAN QUALITY BOND FUND
SCHEDULE OF INVESTMENTS (CONTINUED)AS OF 30 JUNE 2008
PORTFOLIO CHANGES (UNAUDITED)
48

JOBNAME: 08081916 PAGE: 50 SESS: 26 OUTPUT: Mon Aug 18 12:43:17 2008
Purchased Sold
Financial Assets at Fair ValueThrough Profit or Loss*
Numberof shares
Numberof shares
Hong Kong Land Treasury3.01% 04/10/2010 ................ 10,750,000 –
Hutchinson Wham 7.45%24/11/2033.......................... – 7,500,000
Hutchison Whampoa 6.25%24/01/2014.......................... – 7,700,000
ICICI Bank 6.625% 03/10/2012 .................................. 4,500,000 10,500,000
ICICI Bank FRN 27/02/2012 .... – 3,000,000IRPC 6.375% 25/05/2017 ......... – 9,100,000Korea Southern Power 5.375%
18/04/2013.......................... 12,580,000 12,580,000Malaysia T Bill 0% 02/05/2008 . – 10,500,000Malaysia T Bill 0% 18/01/2008 . – 5,190,000Malaysian 0% T Bill 18/04/
2008 .................................. – 13,300,000Malaysian T-Bill 0% 04/039455. – 5,000,000Malaysian T-Bill 0% 04/039546. – 10,000,000Malaysian T-Bill 0% 07/039515. – 14,000,000Malaysian T-Bill 0% 08/05/
2008 .................................. – 39,000,000Malaysian T-Bill 0% 17/06/
2008 .................................. 5,000,000 5,000,000National Agricultural 5.375%
26/04/2017.......................... 3,750,000 –PCCW Capital 5.25% 20/07/
2015 .................................. – 1,000,000PCI Capital 5.875% 17/12/
2014 .................................. 2,499,999 2,500,000Pusan Bank 5.5% VRN 14/03/
2017 .................................. 7,200,000 –Pusan Bank 6% VRN 30/10/
2017 .................................. 18,000,000 –Resona Bank 5.85% VRN Perp.. 29,000,000 –RSHB Capital 7.125% 14/01/
2014 .................................. 1,800,000 1,800,000Russian Agriculture 6.97%
21/09/2016.......................... 3,500,000 3,500,000Shimao Property 8% 01/12/
2016 .................................. 1,900,000 1,900,000Shimao Property FRN 01/12/
2011 .................................. 4,500,000 4,500,000
Purchased Sold
Financial Assets at Fair ValueThrough Profit or Loss*
Numberof shares
Numberof shares
Shinhan Bank 5.66% 02/03/2035 .................................. 8,400,000 –
Shinhan Bank 5.75% 28/02/2016 .................................. 2,000,000 –
Shinhan Bank 6.819% VRN20/09/2036.......................... 5,400,000 1,400,000
Shinsegae 6.125% 27/06/211 .... 12,700,000 12,700,000Shinsegae Co 6.125% 27/06/
2011 .................................. 12,700,000 –Singapore (Govt) 1.5% 01/04/
2008 .................................. – 15,000,000Singapore (Govt) 2.375%
01/10/2009.......................... 29,000,000 29,000,000Singapore T Bill 0% 24/01/
2008 .................................. – 5,000,000Singapore T-Bill 0% 02/05/
2008 .................................. 22,500,000 22,500,000Singapore T-Bill 0% 30/04/
2008 .................................. – 3,000,000Singapore Treasury Bill0%
31/01/2008.......................... – 22,500,000SingaporeT Bill 0% 01/03/
2008 .................................. – 13,000,000SingaporeT Bill 0% 10/01/
2008 .................................. – 8,000,000SMFG Preferred Capital 8.75%
Perp ................................... 27,600,000 5,000,000Standard Chartered 8.125%
Perp ................................... 12,500,000 3,300,000United Overseas Bank 5.375%
03/09/2019.......................... 8,000,000 –US T Bill 0% 26/06/2008 ......... 14,100,000 14,100,000US T Bill 2.875% 30/06/2010 ... 48,900,000 24,200,000US Treasury 3.875% 15/05/
2018 .................................. 11,000,000 11,000,000VTB Bank 6.609% 31/10/2012.. – 1,500,000Wan Hai Lines 6.5% 29/06/
2015 .................................. 70,000 140,000Woori Bank 6.208% VRN
02/05/2037.......................... 21,450,000 –
*Traded on regulated exchanges or markets.
FIRST STATE ASIAN QUALITY BOND FUND
PORTFOLIO CHANGES (UNAUDITED)(CONTINUED)
49

JOBNAME: 08081916 PAGE: 51 SESS: 26 OUTPUT: Mon Aug 18 12:43:17 2008
PERFORMANCE^
01/01/07To
30/06/07
01/01/08To
30/06/08
First State Hong Kong Dollar Bond Fund“The Fund”
– Class III -1.24% 0.25%
HSBC Hong Kong DollarBond Index -1.69% 0.74%
^ Performance calculation is base on official dealingNAV.
The credit turmoil of 2007 continued into2008. In the first quarter, US Treasury yieldsdeclined and the yield curve steepenedsignificantly as economic data indicated the stronglikelihood of a recession. Problems in the creditmarkets continued with wider credit spreads drivenby concerns about the health of the banking systemand fears about downgrades of bond insurers. TheFederal Reserve cut interest rates by 200 basispoints (bps) to 2.25% in response and JP Morgan’stakeover of the troubled Bear Stearns, up to thispoint, marked the peak of market turmoil as fearsof systematic breakdown subsided.
After the Fed’s numerous interventions, riskappetite rose in the second quarter as banks raisedmore capital. Inflation worries dominated themarket on rising food and commodity prices. Buteconomic data was slightly stronger than expectedand more hawkish comments from the Fed led to arebound in yields and flatter curves. In the secondquarter, the Fed only cut once by 25 bps to 2%, andthe market started to price in monetary tightening.
Over the period, the US Treasury yield curveshifted down with a steepening bias, with 2-yearyields down by 43 bps and 10-year yields 5 bpslower.
The strong liquidity in Hong Kong resulted inoutperformance of the Hong Kong dollar (HKD)rate market relative to their US counterparts untilApril. Thereafter a weak equity market led to
capital outflows from the economy and theunderperformance of HKD rates. During the firsthalf, the HKD/USD 1-year forward discount shiftedfrom -668 to -338. The prime rate in Hong Kongwas cut by 150 bps, less than the reduction in USrates, as an elevated HIBOR limited room for banksin HK to cut rates further. The HK Governmentyield curve steepened, with the 2-year bond yielddropping 14 bps while the 10-year bond yieldincreased by 3 bps.
The Fed is being constrained by risinginflationary expectations. It remains to be seenwhether the US economy weakens further or ascenario of stagflation develops. However, arecession is looking more likely.
In Hong Kong, room for prime rate cuts islimited, and banks have started raising mortgagerates. This trend is expected to continue given anelevated HIBOR and a pause in the US easingcycle.
Amid inflationary pressures in HK, a rise ininterest rates from a low level would help alleviatenegative real rates and a possible asset bubble.Also, the Hong Kong Monetary Authority wouldface less pressure from inflows speculating an endto the currency peg.
We believe, however, that Hong Kong dollarbond yields should continue to trade at a discountto US bonds, due to better economic fundamentalsand speculation about the end of the currency peg.Thus, rates in HK are likely to stay lower than UScounterparts. We also anticipate further upwardpressure, although more subdued, on the renminbi.
FIRST STATE HONG KONG DOLLAR BOND FUND
INVESTMENT MANAGER’S REPORT (UNAUDITED)
50
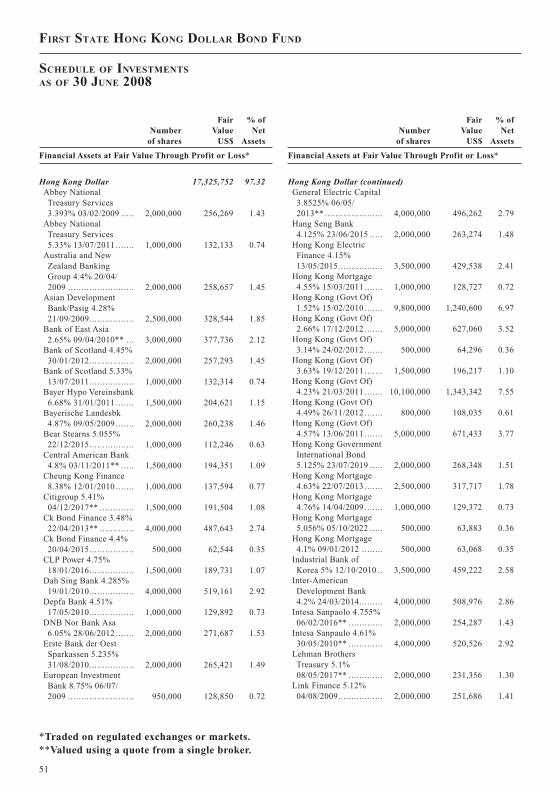
JOBNAME: 08081916 PAGE: 52 SESS: 26 OUTPUT: Mon Aug 18 12:43:17 2008
Numberof shares
FairValue
US$
% ofNet
Assets
Financial Assets at Fair Value Through Profit or Loss*
Hong Kong Dollar 17,325,752 97.32Abbey NationalTreasury Services3.393% 03/02/2009 ..... 2,000,000 256,269 1.43
Abbey NationalTreasury Services5.33% 13/07/2011 ....... 1,000,000 132,133 0.74
Australia and NewZealand BankingGroup 4.4% 20/04/2009 ......................... 2,000,000 258,657 1.45
Asian DevelopmentBank/Pasig 4.28%21/09/2009................. 2,500,000 328,544 1.85
Bank of East Asia2.65% 09/04/2010** ... 3,000,000 377,736 2.12
Bank of Scotland 4.45%30/01/2012................. 2,000,000 257,293 1.45
Bank of Scotland 5.33%13/07/2011................. 1,000,000 132,314 0.74
Bayer Hypo Vereinsbank6.68% 31/01/2011 ....... 1,500,000 204,621 1.15
Bayerische Landesbk4.87% 09/05/2009 ....... 2,000,000 260,238 1.46
Bear Stearns 5.055%22/12/2015................. 1,000,000 112,246 0.63
Central American Bank4.8% 03/11/2011** ..... 1,500,000 194,351 1.09
Cheung Kong Finance8.38% 12/01/2010 ....... 1,000,000 137,594 0.77
Citigroup 5.41%04/12/2017** ............. 1,500,000 191,504 1.08
Ck Bond Finance 3.48%22/04/2013** ............. 4,000,000 487,643 2.74
Ck Bond Finance 4.4%20/04/2015................. 500,000 62,544 0.35
CLP Power 4.75%18/01/2016................. 1,500,000 189,731 1.07
Dah Sing Bank 4.285%19/01/2010................. 4,000,000 519,161 2.92
Depfa Bank 4.51%17/05/2010................. 1,000,000 129,892 0.73
DNB Nor Bank Asa6.05% 28/06/2012 ....... 2,000,000 271,687 1.53
Erste Bank der OestSparkassen 5.235%31/08/2010................. 2,000,000 265,421 1.49
European InvestmentBank 8.75% 06/07/2009 ......................... 950,000 128,850 0.72
Numberof shares
FairValue
US$
% ofNet
Assets
Financial Assets at Fair Value Through Profit or Loss*
Hong Kong Dollar (continued)General Electric Capital3.8525% 06/05/2013** ...................... 4,000,000 496,262 2.79
Hang Seng Bank4.125% 23/06/2015 ..... 2,000,000 263,274 1.48
Hong Kong ElectricFinance 4.15%13/05/2015................. 3,500,000 429,538 2.41
Hong Kong Mortgage4.55% 15/03/2011 ....... 1,000,000 128,727 0.72
Hong Kong (Govt Of)1.52% 15/02/2010 ....... 9,800,000 1,240,600 6.97
Hong Kong (Govt Of)2.66% 17/12/2012 ....... 5,000,000 627,060 3.52
Hong Kong (Govt Of)3.14% 24/02/2012 ....... 500,000 64,296 0.36
Hong Kong (Govt Of)3.63% 19/12/2011 ....... 1,500,000 196,217 1.10
Hong Kong (Govt Of)4.23% 21/03/2011 ....... 10,100,000 1,343,342 7.55
Hong Kong (Govt Of)4.49% 26/11/2012 ....... 800,000 108,035 0.61
Hong Kong (Govt Of)4.57% 13/06/2011 ....... 5,000,000 671,433 3.77
Hong Kong GovernmentInternational Bond5.125% 23/07/2019 ..... 2,000,000 268,348 1.51
Hong Kong Mortgage4.63% 22/07/2013 ....... 2,500,000 317,717 1.78
Hong Kong Mortgage4.76% 14/04/2009 ....... 1,000,000 129,372 0.73
Hong Kong Mortgage5.056% 05/10/2022 ..... 500,000 63,883 0.36
Hong Kong Mortgage4.1% 09/01/2012 ........ 500,000 63,068 0.35
Industrial Bank ofKorea 5% 12/10/2010 .. 3,500,000 459,222 2.58
Inter-AmericanDevelopment Bank4.2% 24/03/2014......... 4,000,000 508,976 2.86
Intesa Sanpaolo 4.755%06/02/2016** ............. 2,000,000 254,287 1.43
Intesa Sanpaulo 4.61%30/05/2010** ............. 4,000,000 520,526 2.92
Lehman BrothersTreasury 5.1%08/05/2017** ............. 2,000,000 231,356 1.30
Link Finance 5.12%04/08/2009................. 2,000,000 251,686 1.41
*Traded on regulated exchanges or markets.**Valued using a quote from a single broker.
FIRST STATE HONG KONG DOLLAR BOND FUND
SCHEDULE OF INVESTMENTS
AS OF 30 JUNE 2008
51

JOBNAME: 08081916 PAGE: 53 SESS: 26 OUTPUT: Mon Aug 18 12:43:17 2008
Numberof shares
FairValue
US$
% ofNet
Assets
Financial Assets at Fair Value Through Profit or Loss*
Hong Kong Dollar (continued)National Australia Bank3.6% 13/10/2009......... 1,000,000 128,599 0.72
National Australia Bank5.185% 25/05/2011 ..... 500,000 65,823 0.37
Nordea Bank 4.94%06/04/2011................. 1,000,000 130,852 0.74
Nordic Investment Bank3.77% 12/07/2010 ....... 3,000,000 389,309 2.19
Province of QuebecCanada 4.3% 02/02/2012 ......................... 2,000,000 259,558 1.46
St George Bank 4.83%20/04/2009................. 2,000,000 259,619 1.46
Sun Hung Kay 3.75%30/04/2013** ............. 5,000,000 615,454 3.46
Svensk Exportkredit AB6.1% 27/09/2011......... 2,000,000 273,539 1.54
Swire Pacific 4.93%28/03/2013................. 5,000,000 630,189 3.54
Triumph Assets2.76286% 28/06/2010** ...................... 2,000,000 255,749 1.44
Westpac Banking 4.4%17/05/2010................. 4,000,000 520,572 2.92
Westpac Banking 5.22%13/06/2012................. 1,000,000 130,646 0.73
Wing Hang Bank 4.93%04/05/2009................. 1,000,000 130,189 0.73
Total Financial Assets at Fair ValueThrough Profit or Loss .................. 17,325,752 97.32
Cash and other net assets ................. 476,560 2.68
Total Net Assets Attributable toRedeemable ParticipatingShareholders ................................ 17,802,312 100.00
Total Cost of Financial Assets at FairValue Through Profit or Loss .......... 17,504,014
Purchased Sold
Financial Assets at Fair ValueThrough Profit or Loss*
Numberof shares
Numberof shares
Abbey National 3.393%03/02/2009.......................... 3,000,000 4,000,000
Abbey National 5.33% 13/07/2011 .................................. 1,000,000 1,000,000
ANZ Melbourne 4.83%12/05/2008.......................... 1,500,000 1,500,000
ANZ National 4.4% 20/04/2009 .................................. 2,000,000 2,000,000
Bank of East Asia 2.65%09/04/2010.......................... 6,000,000 3,000,000
Bayer Hypo 6.68% 31/01/2011 .. 1,500,000 1,500,000Bayerische Landesbk 4.87%
09/05/2009.......................... 2,000,000 2,000,000Bear Stearns 5.055% 22/12/
2015 .................................. 1,000,000 1,000,000Cheung Kong 3.5% 07/07/2008 . 1,500,000 3,000,000CK Bond Finance 3.48%
22/04/2013.......................... 4,000,000 –CK Bond Finance 4.4%
20/04/2015.......................... 500,000 500,000Erste Bank 5.235% 31/08/2010 . 2,000,000 2,000,000European Investment Bank
8.75% 06/07/2009 ................ 950,000 950,000General Electric Capital
3.8525% 06/05/2013 ............ 8,000,000 4,000,000Hang Seng Bank 4.125%
23/06/2015.......................... 2,000,000 2,000,000HBOS 4.65% 19/01/2016 ......... 2,500,000 5,000,000HBOS 5.33% 13/07/2011 ......... 1,000,000 1,000,000Hong Kong (Govt Of) 1.52%
15/02/2010.......................... 13,800,000 4,000,000Hong Kong (Govt Of) 2.03%
18/03/2013.......................... 11,300,000 11,300,000Hong Kong (Govt Of) 2.66%
17/12/2012.......................... 5,000,000 –Hong Kong (Govt Of) 3.14%
24/02/2012.......................... 1,700,000 1,700,000Hong Kong (Govt Of) 3.5%
22/06/2015.......................... – 4,050,000Hong Kong (Govt Of) 3.52%
05/12/2017.......................... 1,500,000 1,500,000Hong Kong (Govt Of) 3.52%
22/03/2010.......................... 4,000,000 4,300,000Hong Kong (Govt Of) 3.78%
06/12/2016.......................... – 1,000,000Hong Kong (Govt Of) 4.23%
21/03/2011.......................... 10,100,000 –
*Traded on regulated exchanges or markets.**Valued using a quote from a single broker.
FIRST STATE HONG KONG DOLLAR BOND FUND
SCHEDULE OF INVESTMENTS (CONTINUED)AS OF 30 JUNE 2008
PORTFOLIO CHANGES (UNAUDITED)
52

JOBNAME: 08081916 PAGE: 54 SESS: 26 OUTPUT: Mon Aug 18 12:43:17 2008
Purchased Sold
Financial Assets at Fair ValueThrough Profit or Loss*
Numberof shares
Numberof shares
Hong Kong (Govt Of) 4.26%20/12/2010.......................... 1,000,000 1,000,000
Hong Kong (Govt Of) 4.49%26/11/2012.......................... 800,000 800,000
Hong Kong (Govt Of) 4.57%13/06/2011.......................... 5,000,000 –
Hong Kong (Govt Of) 4.65%29/08/2022.......................... 500,000 500,000
Hong Kong (Govt Of) 4.85%27/06/2017.......................... – 1,000,000
Hong Kong (Govt Of) 5.125%23/07/2019.......................... 2,000,000 2,000,000
Hong Kong 3.51% 08/12/2014 .. 6,300,000 6,300,000Hong Kong 4.55% 15/03/2011 .. 1,000,000 1,000,000Hong Kong 4.76% 14/04/2009 .. 1,000,000 –Hong Kong 4.76% 14/04/2009 .. 1,000,000 2,000,000Hong Kong Electric Finance
4.15% 13/05/2015 ................ 3,500,000 3,500,000Hong Kong Mortgage 4.1%
09/01/2012.......................... 500,000 500,000Hong Kong Mortgage 4.63%
22/07/2013.......................... 2,500,000 –Hong Kong Mortgage 5.056%
05/10/2022.......................... – 500,000ICB 4.67% 09/03/2009............. 1,000,000 2,000,000Inter American Development
Bank 4.2% 24/03/2014 ......... 4,000,000 –
Purchased Sold
Financial Assets at Fair ValueThrough Profit or Loss*
Numberof shares
Numberof shares
Intesa Sanpaolo 4.755%06/02/2016.......................... 2,000,000 2,000,000
Lehman Brothers Treasury 5.1%08/05/2017.......................... 2,000,000 –
Link Finance 5.12% 04/08/2009 .................................. 2,000,000 2,000,000
National Australia Bank3.6%13/10/2009 .................. 1,000,000 1,000,000
Nordea Bank 4.94% 06/04/2011 .................................. 1,000,000 1,000,000
Nordic Investment Bank 3.77%12/07/2010.......................... 2,000,000 –
Sarawak Corp FRN 22/12/2009 . 280,000 560,000St George Bank 4.83% 20/04/
2009 .................................. 2,000,000 2,000,000Sun Hung Kay 3.75% 30/04/
2013 .................................. 5,000,000 –Superfirst Mortgage Asset Var
25/06/2031.......................... 4,000,000 8,000,000Swire Pacific MTN Fin 4.93%
28/03/2013.......................... 5,000,000 1,000,000Union Bank Norway 6.05%
28/06/2012.......................... 2,000,000 2,000,000Westpac Banking 5.22%
13/06/2012.......................... 1,000,000 1,000,000Wing Hang Bank 4.93%
04/05/2009.......................... 1,000,000 1,000,000
*Traded on regulated exchanges or markets.
FIRST STATE HONG KONG DOLLAR BOND FUND
PORTFOLIO CHANGES (UNAUDITED)(CONTINUED)
53

JOBNAME: 08081916 PAGE: 55 SESS: 26 OUTPUT: Mon Aug 18 12:43:17 2008
PERFORMANCE^
01/01/07To
30/06/07
01/01/08To
30/06/08
First State Global Emerging Markets Debt Fund“The Fund”
– Class III 3.23% -6.15%
JP Morgan EmergingMarket Bond Index 0.86% -0.31%
^ Performance calculation is base on official dealingNAV.
The benchmark JP Morgan EMBI-GlobalDiversified Index recorded a -0.31% return for thesix month period. The average credit spread of thesecurities in the index widened by 54 basis points(bps) from 264 bps at the end of 2007 to 318 bps by30 June 2008.
Although the economies of most majoremerging market countries like China, Brazil,Russia, India, Turkey, Indonesia and Argentinacontinued to decouple from a slowing US economy,external sovereign bond prices were negativelyimpacted by intensively weak market sentimentfollowing the US sub-prime crisis.
We believe the secular trend of urbanizationand industrialization of China and India willsupport economic growth, which in turn shouldbenefit commodity exporting countries. The strongproductivity gains in emerging Asian countries andrising commodity prices and export volumes forLatin America, Russia and the Gulf countriesshould underpin positive credit developments. Thisshould result in improving external debtperformance once negative sentiment around theUS sub-prime crisis subsides. In particular, we seegood value in the external sovereign bonds ofRussia, Colombia, Peru and Venezuela given theirimproving trade and fiscal surpluses and declininggovernment debt levels.
While we see value in the credit spreads of USdollar denominated emerging market bonds, USinterest rate risk is high as our in-house modelsuggests that US Treasury yields are well below ourestimated fair-value levels. Thus, as a majorstrategy, we intend to hedge US interest rate riskfor our holdings of US dollar denominatedemerging market external bonds.
The underperformance of the fund against thebenchmark index in the first half of 2008 was dueto overweight positions in the local currency bondsof Brazil, Turkey, Egypt and Indonesia. Due tosurging food and oil prices, market fears ofinflation drove down domestic bond prices.Nevertheless, central banks have launched crediblemonetary policies to control rising prices.
Given high yields of over 14%, 17%, 10% and12% for Brazil, Turkey, Egypt and Indonesiarespectively, and signs of softening inflation, wefind value in domestic bonds in these countries. Inaddition, currencies are well supported byconstructive fundamentals. We may hedge currencyrisk from time to time if there are cyclical forcesthat are acting against the currencies.
FIRST STATE GLOBAL EMERGING MARKETS DEBT FUND
INVESTMENT MANAGER’S REPORT (UNAUDITED)
54
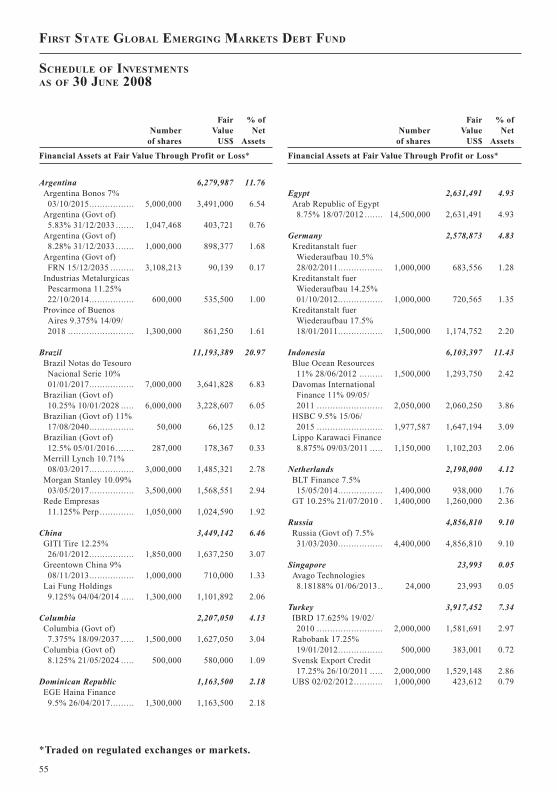
JOBNAME: 08081916 PAGE: 56 SESS: 26 OUTPUT: Mon Aug 18 12:43:17 2008
Numberof shares
FairValue
US$
% ofNet
Assets
Financial Assets at Fair Value Through Profit or Loss*
Argentina 6,279,987 11.76Argentina Bonos 7%03/10/2015................. 5,000,000 3,491,000 6.54
Argentina (Govt of)5.83% 31/12/2033 ....... 1,047,468 403,721 0.76
Argentina (Govt of)8.28% 31/12/2033 ....... 1,000,000 898,377 1.68
Argentina (Govt of)FRN 15/12/2035 ......... 3,108,213 90,139 0.17
Industrias MetalurgicasPescarmona 11.25%22/10/2014................. 600,000 535,500 1.00
Province of BuenosAires 9.375% 14/09/2018 ......................... 1,300,000 861,250 1.61
Brazil 11,193,389 20.97Brazil Notas do TesouroNacional Serie 10%01/01/2017................. 7,000,000 3,641,828 6.83
Brazilian (Govt of)10.25% 10/01/2028 ..... 6,000,000 3,228,607 6.05
Brazilian (Govt of) 11%17/08/2040................. 50,000 66,125 0.12
Brazilian (Govt of)12.5% 05/01/2016 ....... 287,000 178,367 0.33
Merrill Lynch 10.71%08/03/2017................. 3,000,000 1,485,321 2.78
Morgan Stanley 10.09%03/05/2017................. 3,500,000 1,568,551 2.94
Rede Empresas11.125% Perp ............. 1,050,000 1,024,590 1.92
China 3,449,142 6.46GITI Tire 12.25%26/01/2012................. 1,850,000 1,637,250 3.07
Greentown China 9%08/11/2013................. 1,000,000 710,000 1.33
Lai Fung Holdings9.125% 04/04/2014 ..... 1,300,000 1,101,892 2.06
Columbia 2,207,050 4.13Columbia (Govt of)7.375% 18/09/2037 ..... 1,500,000 1,627,050 3.04
Columbia (Govt of)8.125% 21/05/2024 ..... 500,000 580,000 1.09
Dominican Republic 1,163,500 2.18EGE Haina Finance9.5% 26/04/2017......... 1,300,000 1,163,500 2.18
Numberof shares
FairValue
US$
% ofNet
Assets
Financial Assets at Fair Value Through Profit or Loss*
Egypt 2,631,491 4.93Arab Republic of Egypt8.75% 18/07/2012 ....... 14,500,000 2,631,491 4.93
Germany 2,578,873 4.83Kreditanstalt fuerWiederaufbau 10.5%28/02/2011................. 1,000,000 683,556 1.28
Kreditanstalt fuerWiederaufbau 14.25%01/10/2012................. 1,000,000 720,565 1.35
Kreditanstalt fuerWiederaufbau 17.5%18/01/2011................. 1,500,000 1,174,752 2.20
Indonesia 6,103,397 11.43Blue Ocean Resources11% 28/06/2012 ......... 1,500,000 1,293,750 2.42
Davomas InternationalFinance 11% 09/05/2011 ......................... 2,050,000 2,060,250 3.86
HSBC 9.5% 15/06/2015 ......................... 1,977,587 1,647,194 3.09
Lippo Karawaci Finance8.875% 09/03/2011 ..... 1,150,000 1,102,203 2.06
Netherlands 2,198,000 4.12BLT Finance 7.5%15/05/2014................. 1,400,000 938,000 1.76
GT 10.25% 21/07/2010 . 1,400,000 1,260,000 2.36
Russia 4,856,810 9.10Russia (Govt of) 7.5%31/03/2030................. 4,400,000 4,856,810 9.10
Singapore 23,993 0.05Avago Technologies8.18188% 01/06/2013.. 24,000 23,993 0.05
Turkey 3,917,452 7.34IBRD 17.625% 19/02/2010 ......................... 2,000,000 1,581,691 2.97
Rabobank 17.25%19/01/2012................. 500,000 383,001 0.72
Svensk Export Credit17.25% 26/10/2011 ..... 2,000,000 1,529,148 2.86
UBS 02/02/2012........... 1,000,000 423,612 0.79
*Traded on regulated exchanges or markets.
FIRST STATE GLOBAL EMERGING MARKETS DEBT FUND
SCHEDULE OF INVESTMENTS
AS OF 30 JUNE 2008
55

JOBNAME: 08081916 PAGE: 57 SESS: 26 OUTPUT: Mon Aug 18 12:43:17 2008
Numberof shares
FairValue
US$
% ofNet
Assets
Financial Assets at Fair Value Through Profit or Loss*
United States 1,606,750 3.01United States Treasury2.875% 30/06/2010 ..... 1,600,000 1,606,750 3.01
Venezuela 2,415,000 4.52Venezuela (Govt of) 7%31/03/2038................. 3,500,000 2,415,000 4.52
Total Bonds ..................................... 50,624,834 94.83
Total Futures Contracts (Note 9)......... – –
Total Financial Assets at Fair ValueThrough Profit or Loss .................... 50,624,834 94.83
Total Forward foreign exchangecontracts (Note 9) ........................... (29,707) (0.06)
Total Financial Liabilities at FairValue Through Profit or Loss ........... (29,707) (0.06)
Cash and other net assets ................... 2,788,920 5.23
Total Net Assets Attributable toRedeemable ParticipatingShareholders .................................. 53,384,047 100.00
Total Cost of Financial Assets at FairValue Through Profit or Loss ........... 58,060,794
Purchased Sold
Financial Assets at Fair ValueThrough Profit or Loss*
Numberof shares
Numberof shares
Arab Rep of Egypt 8.75%18/07/2012.......................... – 16,000,000
Argentina (Govt) 5.83%31/12/2033.......................... 1,047,468 1,047,468
Argentina (Govt) 8.28%31/12/2033.......................... 1,600,000 1,600,000
Argentina(Govt) FRN 15/12/2035 .................................. 6,216,426 –
ATF Bank 9% 11/05/2016 ........ – 850,000ATF Capital 10% VRN Perp ..... 280,000 560,000ATF Capital 9.25% 21/02/2014 . – 1,000,000Avago Technologies FRN
01/06/2013.......................... 150,000 150,000BR Malls International Finance
9.75%Perp .......................... – 850,000Brazil (Rep of) 12.5% 05/01/
2016 .................................. 287,000 287,000Caiua Servicos 11.125% Perp ... 1,600,000 –CBT 10 YR Treasury Note
September 2008 ................... 10 10Colombia (Rep of) 7.375%
18/09/2037.......................... 1,500,000 –Davomas International 11%
09/05/2011.......................... 1,400,000 1,400,000Electricidad de Caracas 10.25%
15/10/2014.......................... 250,000 500,000GT 2005 Bonds 10.25%
21/07/2010.......................... 1,000,000 2,000,000HSBC 9.5% 15/06/2015 ........... 3,955,174 –Lippo Karawaci Fin 8.875%
09/03/2011.......................... 1,200,000 1,200,000Lupatech Finance 9.875% Perp . – 200,000Marfrig Overseas 9.625%
16/11/2016.......................... – 500,000Pakistan Mobile 8.625%
13/11/2013.......................... 1,250,000 2,500,000Rede Empresas 11.125% Perp ... 1,600,000 500,000Republic of Colombia 8.125%
21/05/2024.......................... 500,000 –Republic of Venezuela 7%
31/03/2038.......................... 4,000,000 500,000Russia (Govt) 5% VRN 31/03/
2030 .................................. 4,400,000 –Titan Petrochemical Group
8.5% 18/03/2012.................. 250,000 2,000,000US T Bill 2.875% 30/06/2010 ... 1,600,000 –Venezuala (Rep of) 9.25%
15/09/2027.......................... – 250,000Venezuela (Rep of) 7% 01/12/
2018 .................................. – 4,000,000
*Traded on regulated exchanges or markets.
FIRST STATE GLOBAL EMERGING MARKETS DEBT FUND
SCHEDULE OF INVESTMENTS (CONTINUED)AS OF 30 JUNE 2008
PORTFOLIO CHANGES (UNAUDITED)
56

JOBNAME: 08081916 PAGE: 58 SESS: 26 OUTPUT: Mon Aug 18 12:43:17 2008
PERFORMANCE^
01/01/07To
30/06/07
01/01/08To
30/06/08
First State Global Emerging Markets Leaders Fund“The Fund”
– Class I 17.87% -7.87%– Class III 18.24% -7.69%
MSCI Emerging MarketsIndex 17.75% -11.64%
^ Performance calculation is base on official dealingNAV.
Global emerging markets fell significantlyover the six month period to 30 June 2008. TheMSCI Emerging Markets Index declined by 11.6%in US dollar terms, underperforming the MSCIWorld Index which fell by 10.2%.
Risk aversion rose as inflationary pressuresintensified driven by the price of oil whichincreased to record highs above $140 per barrel. Asa result central banks in a number of countries wereforced to raise interest rates. Brazil and Russia,which benefited from a rising oil price,outperformed. China and India declined verysignificantly on concerns about tighteningmonetary policy.
Performance was positively impacted byTaiwanese stocks Chunghwa Telecom and TaiwanSemiconductor which both outperformed onexpectations that the KMT victory in presidentialelections would be positive for relations withMainland China and thus the economy. Lukoil(Russia: Energy) was positive as it rose with thestrong oil price.
On the negative side, Shinsegae (South Korea:Consumer Staples) underperformed on concernsthat earnings would be impacted by a slowdown inthe South Korean economy, and AngloGold Ashanti(South Africa: Materials) lagged as the gold price
corrected. China Resources Enterprise (ConsumerDiscretionary) underperformed on the deterioratingconsumer environment in China.
We bought All America Latina, a Brazilianrailway operator with proven management whichwas out of favour with the market, and Mahindra &Mahindra, an Indian holding company with adominant market share in the domestic tractor andutility vehicle markets. We also purchasedSberbank, the dominant Russian banking franchise,after a meeting with new management confirmedthat the company could be drastically restructuredover the next five years.
We sold Teva Pharmaceutical (Israel: HealthCare) following strong performance on concernsabout long-term earnings sustainability, andlaminates and PCB manufacturer KingboardChemicals (China) on worries about the earningsoutlook. We also sold Shinhan Financial (SouthKorea) because of its seemingly tight capitalposition.
The significant outperformance of LatinAmerica over Asia in the last 12 months suggeststhat stocks may now be much better value in Asiain both absolute terms and relative to local interestrates. A swift return to the bull market conditionsof the last five years appears unlikely. Interest ratesacross the majority of emerging markets remainnegative and it is clear that central banks will haveto increase the cost of money. The environment forgold remains positive because of inflationarypressures in the global economy. Domestic stocksin South Africa, Turkey and India have fallensignificantly and those in Turkey and South Africaare beginning to look undervalued. Indian stocks,however, with some exceptions, do not yet lookcheap enough.
FIRST STATE GLOBAL EMERGING MARKETS LEADERS FUND
INVESTMENT MANAGER’S REPORT (UNAUDITED)
57
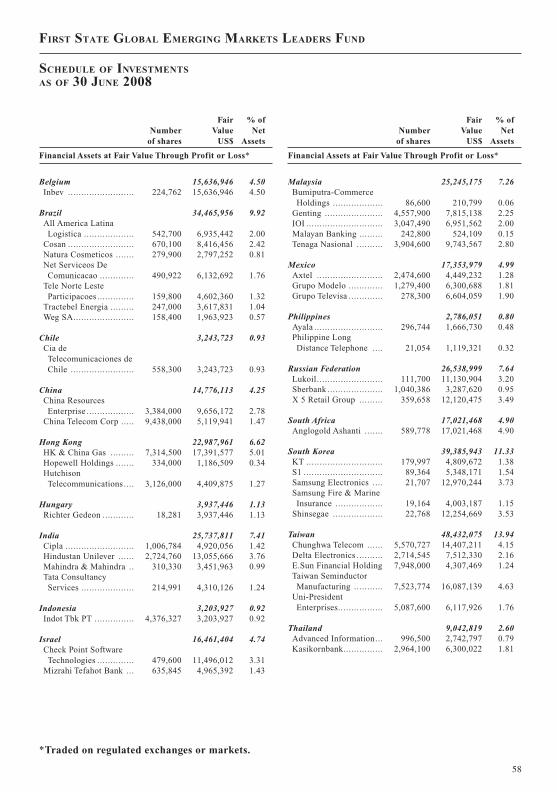
JOBNAME: 08081916 PAGE: 59 SESS: 26 OUTPUT: Mon Aug 18 12:43:17 2008
Numberof shares
FairValue
US$
% ofNet
Assets
Financial Assets at Fair Value Through Profit or Loss*
Belgium 15,636,946 4.50Inbev ......................... 224,762 15,636,946 4.50
Brazil 34,465,956 9.92All America LatinaLogistica ................... 542,700 6,935,442 2.00
Cosan ......................... 670,100 8,416,456 2.42Natura Cosmeticos ....... 279,900 2,797,252 0.81Net Serviceos DeComunicacao ............. 490,922 6,132,692 1.76
Tele Norte LesteParticipacoes .............. 159,800 4,602,360 1.32
Tractebel Energia ......... 247,000 3,617,831 1.04Weg SA....................... 158,400 1,963,923 0.57
Chile 3,243,723 0.93Cia deTelecomunicaciones deChile ........................ 558,300 3,243,723 0.93
China 14,776,113 4.25China ResourcesEnterprise .................. 3,384,000 9,656,172 2.78
China Telecom Corp ..... 9,438,000 5,119,941 1.47
Hong Kong 22,987,961 6.62HK & China Gas ......... 7,314,500 17,391,577 5.01Hopewell Holdings ....... 334,000 1,186,509 0.34HutchisonTelecommunications .... 3,126,000 4,409,875 1.27
Hungary 3,937,446 1.13Richter Gedeon ............ 18,281 3,937,446 1.13
India 25,737,811 7.41Cipla .......................... 1,006,784 4,920,056 1.42Hindustan Unilever ...... 2,724,760 13,055,666 3.76Mahindra & Mahindra .. 310,330 3,451,963 0.99Tata ConsultancyServices .................... 214,991 4,310,126 1.24
Indonesia 3,203,927 0.92Indot Tbk PT ............... 4,376,327 3,203,927 0.92
Israel 16,461,404 4.74Check Point SoftwareTechnologies .............. 479,600 11,496,012 3.31
Mizrahi Tefahot Bank ... 635,845 4,965,392 1.43
Numberof shares
FairValue
US$
% ofNet
Assets
Financial Assets at Fair Value Through Profit or Loss*
Malaysia 25,245,175 7.26Bumiputra-CommerceHoldings ................... 86,600 210,799 0.06
Genting ...................... 4,557,900 7,815,138 2.25IOI ............................. 3,047,490 6,951,562 2.00Malayan Banking ......... 242,800 524,109 0.15Tenaga Nasional .......... 3,904,600 9,743,567 2.80
Mexico 17,353,979 4.99Axtel ......................... 2,474,600 4,449,232 1.28Grupo Modelo ............. 1,279,400 6,300,688 1.81Grupo Televisa ............. 278,300 6,604,059 1.90
Philippines 2,786,051 0.80Ayala .......................... 296,744 1,666,730 0.48Philippine LongDistance Telephone .... 21,054 1,119,321 0.32
Russian Federation 26,538,999 7.64Lukoil......................... 111,700 11,130,904 3.20Sberbank ..................... 1,040,386 3,287,620 0.95X 5 Retail Group ......... 359,658 12,120,475 3.49
South Africa 17,021,468 4.90Anglogold Ashanti ....... 589,778 17,021,468 4.90
South Korea 39,385,943 11.33KT ............................. 179,997 4,809,672 1.38S1 .............................. 89,364 5,348,171 1.54Samsung Electronics .... 21,707 12,970,244 3.73Samsung Fire & MarineInsurance .................. 19,164 4,003,187 1.15
Shinsegae ................... 22,768 12,254,669 3.53
Taiwan 48,432,075 13.94Chunghwa Telecom ...... 5,570,727 14,407,211 4.15Delta Electronics .......... 2,714,545 7,512,330 2.16E.Sun Financial Holding 7,948,000 4,307,469 1.24Taiwan SeminductorManufacturing ........... 7,523,774 16,087,139 4.63
Uni-PresidentEnterprises................. 5,087,600 6,117,926 1.76
Thailand 9,042,819 2.60Advanced Information... 996,500 2,742,797 0.79Kasikornbank............... 2,964,100 6,300,022 1.81
*Traded on regulated exchanges or markets.
FIRST STATE GLOBAL EMERGING MARKETS LEADERS FUND
SCHEDULE OF INVESTMENTS
AS OF 30 JUNE 2008
58

JOBNAME: 08081916 PAGE: 60 SESS: 26 OUTPUT: Mon Aug 18 12:43:17 2008
Numberof shares
FairValue
US$
% ofNet
Assets
Financial Assets at Fair Value Through Profit or Loss*
Turkey 10,844,568 3.13Anadolu Efes Biracilik .. 651,405 5,580,510 1.61Enka Insaat Ve Sanayi ... 293,700 3,354,792 0.97Turkiye Garanti Bankasi 823,976 1,909,266 0.55
Total Financial Assets at Fair ValueThrough Profit or Loss .................... 337,102,364 97.01
Cash and other net assets ................... 10,395,832 2.99
Total Net Assets attributable toRedeemable ParticipatingShareholders .................................. 347,498,196 100.00
Total Cost of Financial Assets at Fairvalue through Profit or Loss ............. 341,809,686
Purchased Sold
Financial Assets at Fair ValueThrough Profit or Loss*
Numberof shares
Numberof shares
Anglogold Ashanti .................. 119,275 –Acer ..................................... 1,737,000 1,737,000Advanced Information ............. 369,200 –All America Latina Logistica .... 715,100 172,400Anadolou Efes Biracilik .......... – 25,776Anglogold ............................. 96,327 497,631Axtel ..................................... 304,800 –Ayala..................................... 312,534 –Bidvest .................................. 6,600 120,072Bumiputra – Commerce
Holdings............................. 86,600 –Cemex ................................... 4,700 84,814Check Point Software
Technologies ....................... 204,100 13,500China Mengniu Dairy .............. 164,000 164,000China Merchants Holdings ....... 124,000 124,000China Resources Enterprise ...... 1,372,000 –China Resources Power
Holding .............................. 22,000 22,000China Telecom Corp ................ 6,284,000 822,000Chunghwa Telecom ................. 1,527,273 –Cipla ..................................... 689,937 201,812Cosan ................................... 466,800 407,414CTC ...................................... 173,000 –Delta Electronics..................... 963,000 –E Sun Financial Holding .......... 942,000 –Enka Insaat Ve Sanayi .............. 345,086 49,415Garanti Bankasi ..................... 823,976 –Gedeon Richter ....................... 3,381 –Genting ................................. 525,200 –Grupo Modelo ........................ 301,400 252,200Grupo Televisa ....................... 98,400 80,800Hindustan Unilever.................. 374,986 158,792HK & China Gas .................... 8,261,500 890,000Hopewell Holdings .................. 19,000 –Hutchison Telecommunications 360,000 3,438,000InBev ................................... 58,548 –Indonesian Satellite ................ 812,500 77,104IOI ....................................... 408,100 1,653,800Kasikornbank ........................ 1,781,179 1,779,679Kingboard Chemicals .............. 36,000 655,500KT ....................................... 54,690 –Lukoil .................................. 22,200 57,050Mahindra & Mahindra ............. 310,330 –Malayan Banking .................... 2,777,625 2,370,625Mediatek ............................... 89,000 89,000Mizrahi Tefahot Bank ............. 72,911 211,431Natura Cosmeticos .................. 25,100 –Net Servicos De Comunicacao .. 197,317 440,561
*Traded on regulated exchanges or markets.
FIRST STATE GLOBAL EMERGING MARKETS LEADERS FUND
SCHEDULE OF INVESTMENTS (CONTINUED)AS OF 30 JUNE 2008
PORTFOLIO CHANGES (UNAUDITED)
59

JOBNAME: 08081916 PAGE: 61 SESS: 26 OUTPUT: Mon Aug 18 12:43:17 2008
Purchased Sold
Financial Assets at Fair ValueThrough Profit or Loss*
Numberof shares
Numberof shares
Philippine Long DistanceTelephone Co. ..................... 2,812 25,500
S1 ........................................ 9,070 2,714Samsung Electronics ............... 2,943 572Samsung Fire & Marine
Insurance ........................... 2,494 –Sberbank ............................... 1,040,386 –Shinhan Financial Group ......... 16,520 63,520Shinsegae............................... 11,745 –Taiwan Semicon
Manufacturing ..................... 2,240,000 227,000Tata Consultancy Services ........ 83,608 –Tele Norte Leste Participacoes . 15,400 82,300Tenaga Nasional ..................... 1,191,300 113,000Teva Pharmaceutical ................ – 165,700Tractebel Energia ................... 172,300 208,800Uni-President Enterprises ......... 2,626,000 2,102,000Weg SA ................................. 158,400 –X 5 Retail Group..................... 548,265 10,547
FIRST STATE GLOBAL EMERGING MARKETS LEADERS FUND
PORTFOLIO CHANGES (UNAUDITED)(CONTINUED)
60
JOBNAME: 08081916 PAGE: 62 SESS: 26 OUTPUT: Mon Aug 18 12:43:17 2008
PERFORMANCE^
01/01/07To
30/06/07
01/01/08To
30/06/08
First State Global Resources Fund “The Fund”– Class I* 21.50% 10.76%– Class III 23.80% 11.08%
Benchmark:Customized Benchmark# 29.65% 12.60%
^ Performance calculation is base on official dealingNAV.
* 13 February 2007# 75% HSBC Global Mining Index & 25% MSCI
World Energy Index
The global mining market continued toperform strongly in the first half of 2008 despiteequity market volatility and concerns about theglobal growth outlook. The HSBC Global MiningIndex rose by 11.3% in US dollar terms and theMSCI Energy Index by 7.9%. The market wasassisted by very strong oil prices and expectationsof robust earnings growth from mining companies.
Major commodities were mixed over the sixmonths. Copper (+27.5%), Aluminium (+29.3%)and tin (+42.8%) rose very strongly, while lead(-29.8%), nickel (-16.5%) and zinc (-18.5%)declined. The oil price continued its relentless riseto above $140 per barrel, an increase of 45.8% overthe period, while the gold price increased by 10.9%on inflationary concerns.
Fund performance was helped by our holdingsin diversified resource companies BHP Billiton andRio Tinto as investors showed a preference for thediversity and size of the large diversified miners.Potash Corporation of Saskatchewan alsooutperformed on expectations that demand forfertilizers will continue to grow.
On the negative side, China Shenhuaunderperformed on rising cost pressures and aconstrained ability to take advantage of higher coalprices. Precious metal miner Coeur D’Alene lagged
on disappointing production results and costpressures and Andean Resources fell as it raisedequity despite a series of positive drilling andexploration results.
We bought Freeport-McMoRan Copper &Gold which has assets in Indonesia, the US andSouth America and is focused on organic growth,and aluminium company Century Aluminium whichhas interests in alumina and bauxite assets in theUS and Jamaica, and is growing aluminiumcapacity in Iceland. We also purchased Brazilian oiland gas explorer Petrobras Energia for its enormousoil and gas exploration activities, especiallyoffshore Brazil.
We sold aluminium producer Alumina asenergy prices increased its cost base and Agrium,switching into Mosaic which has more attractivepotash and phosphate assets. Nickel miner JubileeMines was sold following its takeover by Xstrata.
Despite positive long-term fundamentals forthe sector, the fund maintains a cautionary stance.We believe it is prudent to hold a diversifiedportfolio of high quality companies with excellentore bodies. We favour the size, quality and relativevaluations of Vale, Rio Tinto and BHP Billitonwhich are focused on expanding productionvolumes and are more able to cope with swings incommodity prices. We maintain our investmentphilosophy of not speculating on the direction ofcommodity prices, but retain our ’long’ focus onquality companies which can deliver growth at lowcash costs. This, we believe, will deliver excessreturns over the full commodity price cycle.
FIRST STATE GLOBAL RESOURCES FUND
INVESTMENT MANAGER’S REPORT
61
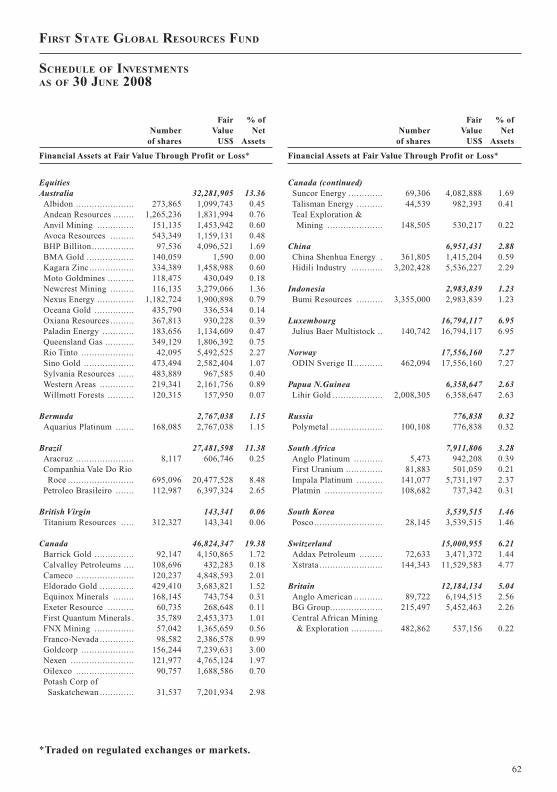
JOBNAME: 08081916 PAGE: 63 SESS: 26 OUTPUT: Mon Aug 18 12:43:17 2008
Numberof shares
FairValue
US$
% ofNet
Assets
Financial Assets at Fair Value Through Profit or Loss*
EquitiesAustralia 32,281,905 13.36Albidon ...................... 273,865 1,099,743 0.45Andean Resources ........ 1,265,236 1,831,994 0.76Anvil Mining .............. 151,135 1,453,942 0.60Avoca Resources ......... 543,349 1,159,131 0.48BHP Billiton................ 97,536 4,096,521 1.69BMA Gold .................. 140,059 1,590 0.00Kagara Zinc ................. 334,389 1,458,988 0.60Moto Goldmines .......... 118,475 430,049 0.18Newcrest Mining ......... 116,135 3,279,066 1.36Nexus Energy .............. 1,182,724 1,900,898 0.79Oceana Gold ............... 435,790 336,534 0.14Oxiana Resources ......... 367,813 930,228 0.39Paladin Energy ............ 183,656 1,134,609 0.47Queensland Gas ........... 349,129 1,806,392 0.75Rio Tinto .................... 42,095 5,492,525 2.27Sino Gold ................... 473,494 2,582,404 1.07Sylvania Resources ...... 483,889 967,585 0.40Western Areas ............. 219,341 2,161,756 0.89Willmott Forests .......... 120,315 157,950 0.07
Bermuda 2,767,038 1.15Aquarius Platinum ....... 168,085 2,767,038 1.15
Brazil 27,481,598 11.38Aracruz ...................... 8,117 606,746 0.25Companhia Vale Do RioRoce ......................... 695,096 20,477,528 8.48
Petroleo Brasileiro ....... 112,987 6,397,324 2.65
British Virgin 143,341 0.06Titanium Resources ..... 312,327 143,341 0.06
Canada 46,824,347 19.38Barrick Gold ............... 92,147 4,150,865 1.72Calvalley Petroleums .... 108,696 432,283 0.18Cameco ...................... 120,237 4,848,593 2.01Eldorado Gold ............. 429,410 3,683,821 1.52Equinox Minerals ........ 168,145 743,754 0.31Exeter Resource .......... 60,735 268,648 0.11First Quantum Minerals . 35,789 2,453,373 1.01FNX Mining ............... 57,042 1,365,659 0.56Franco-Nevada ............. 98,582 2,386,578 0.99Goldcorp .................... 156,244 7,239,631 3.00Nexen ........................ 121,977 4,765,124 1.97Oilexco ...................... 90,757 1,688,586 0.70Potash Corp ofSaskatchewan ............. 31,537 7,201,934 2.98
Numberof shares
FairValue
US$
% ofNet
Assets
Financial Assets at Fair Value Through Profit or Loss*
Canada (continued)Suncor Energy ............. 69,306 4,082,888 1.69Talisman Energy .......... 44,539 982,393 0.41Teal Exploration &Mining ..................... 148,505 530,217 0.22
China 6,951,431 2.88China Shenhua Energy . 361,805 1,415,204 0.59Hidili Industry ............ 3,202,428 5,536,227 2.29
Indonesia 2,983,839 1.23Bumi Resources .......... 3,355,000 2,983,839 1.23
Luxembourg 16,794,117 6.95Julius Baer Multistock .. 140,742 16,794,117 6.95
Norway 17,556,160 7.27ODIN Sverige II ........... 462,094 17,556,160 7.27
Papua N.Guinea 6,358,647 2.63Lihir Gold ................... 2,008,305 6,358,647 2.63
Russia 776,838 0.32Polymetal .................... 100,108 776,838 0.32
South Africa 7,911,806 3.28Anglo Platinum ........... 5,473 942,208 0.39First Uranium .............. 81,883 501,059 0.21Impala Platinum .......... 141,077 5,731,197 2.37Platmin ...................... 108,682 737,342 0.31
South Korea 3,539,515 1.46Posco.......................... 28,145 3,539,515 1.46
Switzerland 15,000,955 6.21Addax Petroleum ......... 72,633 3,471,372 1.44Xstrata ........................ 144,343 11,529,583 4.77
Britain 12,184,134 5.04Anglo American ........... 89,722 6,194,515 2.56BG Group.................... 215,497 5,452,463 2.26Central African Mining& Exploration ............ 482,862 537,156 0.22
*Traded on regulated exchanges or markets.
FIRST STATE GLOBAL RESOURCES FUND
SCHEDULE OF INVESTMENTS
AS OF 30 JUNE 2008
62
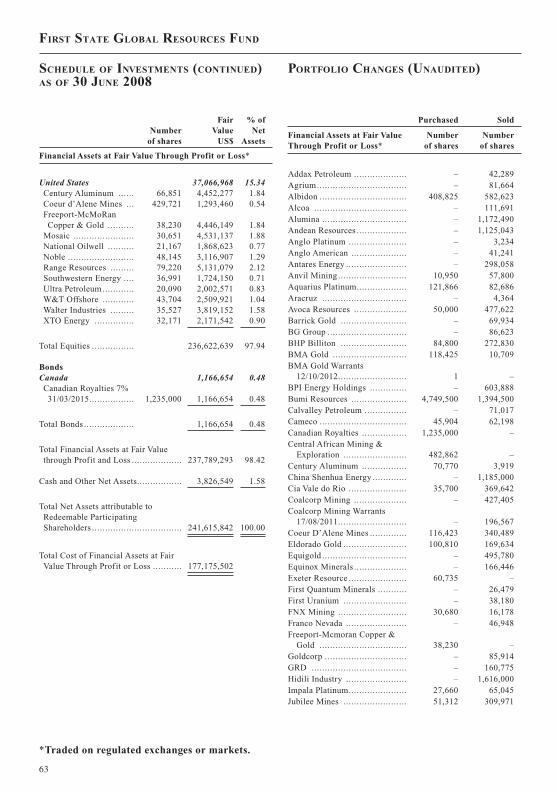
JOBNAME: 08081916 PAGE: 64 SESS: 26 OUTPUT: Mon Aug 18 12:43:17 2008
Numberof shares
FairValue
US$
% ofNet
Assets
Financial Assets at Fair Value Through Profit or Loss*
United States 37,066,968 15.34Century Aluminum ...... 66,851 4,452,277 1.84Coeur d’Alene Mines ... 429,721 1,293,460 0.54Freeport-McMoRanCopper & Gold .......... 38,230 4,446,149 1.84
Mosaic ....................... 30,651 4,531,137 1.88National Oilwell .......... 21,167 1,868,623 0.77Noble ......................... 48,145 3,116,907 1.29Range Resources ......... 79,220 5,131,079 2.12Southwestern Energy .... 36,991 1,724,150 0.71Ultra Petroleum ............ 20,090 2,002,571 0.83W&T Offshore ............ 43,704 2,509,921 1.04Walter Industries ......... 35,527 3,819,152 1.58XTO Energy ............... 32,171 2,171,542 0.90
Total Equities ................ 236,622,639 97.94
BondsCanada 1,166,654 0.48Canadian Royalties 7%31/03/2015................. 1,235,000 1,166,654 0.48
Total Bonds ................... 1,166,654 0.48
Total Financial Assets at Fair Valuethrough Profit and Loss ................... 237,789,293 98.42
Cash and Other Net Assets................. 3,826,549 1.58
Total Net Assets attributable toRedeemable ParticipatingShareholders .................................. 241,615,842 100.00
Total Cost of Financial Assets at FairValue Through Profit or Loss ........... 177,175,502
Purchased Sold
Financial Assets at Fair ValueThrough Profit or Loss*
Numberof shares
Numberof shares
Addax Petroleum .................... – 42,289Agrium.................................. – 81,664Albidon ................................. 408,825 582,623Alcoa ................................... – 111,691Alumina ................................ – 1,172,490Andean Resources ................... – 1,125,043Anglo Platinum ...................... – 3,234Anglo American ..................... – 41,241Antares Energy ....................... – 298,058Anvil Mining .......................... 10,950 57,800Aquarius Platinum................... 121,866 82,686Aracruz ................................ – 4,364Avoca Resources .................... 50,000 477,622Barrick Gold ......................... – 69,934BG Group .............................. – 86,623BHP Billiton ......................... 84,800 272,830BMA Gold ............................ 118,425 10,709BMA Gold Warrants
12/10/2012.......................... 1 –BPI Energy Holdings .............. – 603,888Bumi Resources ..................... 4,749,500 1,394,500Calvalley Petroleum ................ – 71,017Cameco ................................. 45,904 62,198Canadian Royalties ................. 1,235,000 –Central African Mining &
Exploration ........................ 482,862 –Century Aluminum ................. 70,770 3,919China Shenhua Energy ............. – 1,185,000Cia Vale do Rio ...................... 35,700 369,642Coalcorp Mining .................... – 427,405Coalcorp Mining Warrants
17/08/2011.......................... – 196,567Coeur D’Alene Mines .............. 116,423 340,489Eldorado Gold ........................ 100,810 169,634Equigold ................................ – 495,780Equinox Minerals .................... – 166,446Exeter Resource ...................... 60,735 –First Quantum Minerals ........... – 26,479First Uranium ........................ – 38,180FNX Mining .......................... 30,680 16,178Franco Nevada ....................... – 46,948Freeport-Mcmoran Copper &
Gold ................................. 38,230 –Goldcorp ............................... – 85,914GRD .................................... – 160,775Hidili Industry ....................... – 1,616,000Impala Platinum...................... 27,660 65,045Jubilee Mines ........................ 51,312 309,971
*Traded on regulated exchanges or markets.
FIRST STATE GLOBAL RESOURCES FUND
SCHEDULE OF INVESTMENTS (CONTINUED)AS OF 30 JUNE 2008
PORTFOLIO CHANGES (UNAUDITED)
63
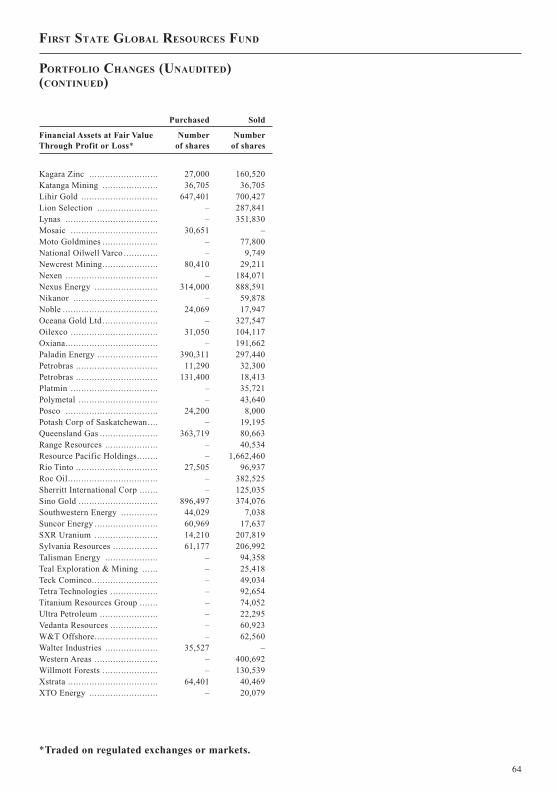
JOBNAME: 08081916 PAGE: 65 SESS: 26 OUTPUT: Mon Aug 18 12:43:17 2008
Purchased Sold
Financial Assets at Fair ValueThrough Profit or Loss*
Numberof shares
Numberof shares
Kagara Zinc .......................... 27,000 160,520Katanga Mining ..................... 36,705 36,705Lihir Gold ............................. 647,401 700,427Lion Selection ....................... – 287,841Lynas ................................... – 351,830Mosaic ................................. 30,651 –Moto Goldmines ..................... – 77,800National Oilwell Varco ............. – 9,749Newcrest Mining..................... 80,410 29,211Nexen ................................... – 184,071Nexus Energy ........................ 314,000 888,591Nikanor ................................ – 59,878Noble .................................... 24,069 17,947Oceana Gold Ltd ..................... – 327,547Oilexco ................................. 31,050 104,117Oxiana................................... – 191,662Paladin Energy ....................... 390,311 297,440Petrobras ............................... 11,290 32,300Petrobras ............................... 131,400 18,413Platmin ................................. – 35,721Polymetal .............................. – 43,640Posco ................................... 24,200 8,000Potash Corp of Saskatchewan.... – 19,195Queensland Gas ...................... 363,719 80,663Range Resources .................... – 40,534Resource Pacific Holdings........ – 1,662,460Rio Tinto ............................... 27,505 96,937Roc Oil.................................. – 382,525Sherritt International Corp ....... – 125,035Sino Gold .............................. 896,497 374,076Southwestern Energy .............. 44,029 7,038Suncor Energy ........................ 60,969 17,637SXR Uranium ........................ 14,210 207,819Sylvania Resources ................. 61,177 206,992Talisman Energy .................... – 94,358Teal Exploration & Mining ...... – 25,418Teck Cominco......................... – 49,034Tetra Technologies .................. – 92,654Titanium Resources Group ....... – 74,052Ultra Petroleum ...................... – 22,295Vedanta Resources .................. – 60,923W&T Offshore........................ – 62,560Walter Industries .................... 35,527 –Western Areas ........................ – 400,692Willmott Forests ..................... – 130,539Xstrata .................................. 64,401 40,469XTO Energy .......................... – 20,079
*Traded on regulated exchanges or markets.
FIRST STATE GLOBAL RESOURCES FUND
PORTFOLIO CHANGES (UNAUDITED)(CONTINUED)
64

JOBNAME: 08081916 PAGE: 66 SESS: 26 OUTPUT: Mon Aug 18 12:43:17 2008
PERFORMANCE^
01/01/07To
30/06/07
01/01/08To
30/06/08
First State Global Property Securities Fund“The Fund”
– Class III 1.41% -12.71%
UBS Global Real EstateInvestors Index -2.89% -9.52%
^ Performance calculation is base on official dealingNAV.
Global property markets fell over the first halfof 2008. The UBS Global Real Estate InvestorsIndex declined by 9.5% in US dollar terms, slightlyoutperforming the MSCI World Index which wasdown by 10.2%.
Markets were impacted by the global creditcrunch and concerns about the outlook for growth.The slump in the US property sector and risingconcerns about the UK market were also negative.Financing concerns among UK property developersincreased the gloomy sentiment. Inflationarypressures in the global economy intensified, drivenby the oil price, and the prospect of further interestrate cuts disappeared. As a result bond yields roseover the six month period putting downwardpressure on property valuations.
Performance was helped by Simon Property, aUS retail REIT, which outperformed on deliveringpositive results. Unibail-Rodamco, a largediversified European focused REIT, impactedpositively as the European real estate markets werepreferred by investors over the UK. German officetrust Alstria Office outperformed as it reported asubstantial increase in profits driven byacquisitions.
Our holdings in property developers AgileProperty and Kerry Properties were unhelpful onconcerns about the outlook for the Chinese
property market on expectations of tighteningmonetary policy. Retirement village operator INGReal Estate lagged on worries about vacancies insome of their Australian retirement villages and USstudent accommodation.
Over the six months we purchased PublicStorage (US), which has a strong balance sheet andearnings which have a low correlation witheconomic growth, and Ventas (US) which owns avariety of healthcare related properties. We alsobought HCP(US) which has a solid balance sheet,high quality portfolio, and attractive valuation.
We sold Taubman Centers (US: Retail) onvaluation concerns following positive relativeperformance and Host Hotels & Resorts (US) onworries about its exposure to a slowdown in the UShotel market. We also sold Brookfield Properties(Canada: Office) as there were more attractivelypriced REITs elsewhere in the sector.
We expect the remainder of 2008 to be volatilewith investor sentiment driving the market. Therecent falls in property shares have providedpockets of value and the market is likely to recoverover time as it offers attractive yields and relativelystable cash flows. Reasonable levels of economicgrowth in emerging economies driven byurbanisation and population growth should assistdemand for property.
FIRST STATE GLOBAL PROPERTY SECURITIES FUND
INVESTMENT MANAGER’S REPORT
65

JOBNAME: 08081916 PAGE: 67 SESS: 26 OUTPUT: Mon Aug 18 12:43:17 2008
Numberof shares
FairValue
US$
% ofNet
Assets
Financial Assets at Fair Value Through Profit or Loss*
Australia 51,684 2.47Goodman Group ........... 11,444 33,693 1.61ING Real EstateCommunity Living ...... 17,981 7,463 0.36
Mirvac Group .............. 3,735 10,528 0.50
British Virgin 9,024 0.43Eastern PropertyHoldings.................... 141 9,024 0.43
Canada 83,548 3.99Allied Properties RealEstate ....................... 1,089 21,792 1.04
Boardwalk Real Estate . 1,030 38,144 1.82Canadian Real Estate ... 850 23,612 1.13
Cyprus 21,240 1.01AFI Development ......... 2,851 21,240 1.01
Finland 31,750 1.52Citycon ...................... 6,500 31,750 1.52
France 245,264 11.70Affine......................... 246 12,627 0.60Klepierre..................... 997 50,733 2.42Societe de la Tour ........ 592 70,253 3.35Unibail Holdings .......... 483 111,651 5.33
Germany 50,626 2.42Alstria Office .............. 1,742 29,438 1.41Deutsche Euroshop ...... 555 21,188 1.01
Guernsey 9,335 0.44Summit Germany ........... 12,838 9,335 0.44
Hong Kong 142,540 6.80Agile PropertyHoldings.................... 22,000 19,186 0.91
Champion Real EstateInvestment Trust ......... 36,000 16,297 0.78
China Overseas Land &Investment ................. 24,000 37,858 1.81
Hang Lung Properties ... 6,000 19,198 0.92Kerry Properties ........... 9,603 50,001 2.38
India 23,608 1.13Ishaan Real Estate ....... 15,619 23,608 1.13
Isle Of Man 14,265 0.68Unitech Corporate Parks 12,326 14,265 0.68
Numberof shares
FairValue
US$
% ofNet
Assets
Financial Assets at Fair Value Through Profit or Loss*
Japan 122,816 5.86Mitsubishi Estate .......... 1,000 23,096 1.10Mitsui Fudosan ............ 2,000 43,150 2.06Nippon Building Fund... 2 23,761 1.13Tokyu Real EstateInvestment Trust ......... 4 32,809 1.57
Netherlands 17,336 0.83EurocommercialProperties .................. 368 17,336 0.83
Singapore 85,366 4.07Ascendas India Trust ..... 15,614 10,346 0.49Capitaland ................... 8,000 33,336 1.59Capitamall Trust ........... 19,000 41,684 1.99
Malaysia 990 0.05SP Setia ..................... 1,100 990 0.05
United Kingdom 242,664 11.58British Land Company .. 2,931 41,145 1.96Brixton ....................... 2,779 13,212 0.63Great Portland Estates .. 1,784 12,121 0.58Hammerson ................ 1,996 35,029 1.67Land Securities Group .. 2,574 63,021 3.01Local Shopping andReal Estate InvestmentTrust ........................ 7,503 10,181 0.48
Mapeley ...................... 908 23,663 1.13Segro ......................... 3,022 24,000 1.15Terrace Hill Group........ 19,187 20,292 0.97
United States 860,858 41.08Alexandria Real EstateEquities ..................... 462 45,322 2.16
AMB Property ............ 517 25,948 1.24American CampusCommunities .............. 477 13,323 0.64
Biomed Realty Trust ..... 1,111 27,353 1.31Corporate OfficeProperties Trust ......... 339 11,567 0.55
Digital Realty Trust ...... 1,159 47,032 2.24Douglas Emmett ........... 803 17,513 0.84EntertainmentProperties Trust .......... 221 10,867 0.52
Essex Property Trust ..... 206 21,993 1.05Eurocastle Investment ... 518 4,725 0.23Extra Space Storage ...... 1,739 26,485 1.26HCP ........................... 1,059 33,369 1.59Home Properties........... 395 18,838 0.90
*Traded on regulated exchanges or markets.
FIRST STATE GLOBAL PROPERTY SECURITIES FUND
SCHEDULE OF INVESTMENTS
AS OF 30 JUNE 2008
66

JOBNAME: 08081916 PAGE: 68 SESS: 26 OUTPUT: Mon Aug 18 12:43:17 2008
Numberof shares
FairValue
US$
% ofNet
Assets
Financial Assets at Fair Value Through Profit or Loss*
United States (continued)Host Hotels &Residentials ............... 1,984 27,339 1.30
Kimco Realty .............. 1,349 46,810 2.23Macerich .................... 430 26,694 1.27Nationwide HealthProperties .................. 901 28,246 1.35
Prologis ...................... 1,355 72,912 3.48Regency Centers .......... 457 26,940 1.29Simon Property Group... 1,132 102,808 4.91SL Green Realty .......... 303 25,013 1.19Starwood Hotels .......... 428 17,180 0.82Sunstone HotelInvestors.................... 1,860 30,876 1.47
Tanger Factory OutletCenters...................... 627 22,440 1.07
Ventas......................... 796 33,400 1.59Vornado Realty Trust .... 1,100 95,865 4.58
Total Financial Assets at Fair ValueThrough Profit and Loss ................ 2,012,914 96.06
Cash and Other Net Assets ............... 82,549 3.94
Total Net Assets attributable toRedeemable ParticipatingShareholders ................................ 2,095,463 100.00
Total Cost of Financial Assets at FairValue Through Profit or Loss .......... 2,448,052
Purchased Sold
Financial Assets at Fair ValueThrough Profit or Loss*
Numberof shares
Numberof shares
Aeon Mall.............................. – 900AFI Developments .................. 613 –Agile Property Holdings .......... 2,000 14,000Allied Properties Real Estate ... 18 –Alstria Office ........................ – 346Babcock & Brown Japan
Property Trust ..................... 389 8,269BRE Properties ...................... – 455British Land ........................... 349 –Brookfield Properties ............. – 1,678Canadian Apartment Properties 8 8Canadian Real Estate .............. 13 –Capita Land ........................... – 2,000Capitaretail China Trust ........... – 11,060Centro Properties ................... – 3,736Challenger Kenedix Japan Trust 12,617 25,234China Overseas Land &
Investment .......................... 4,000 –Citycon ................................. – 1,776Corporate Office Properties
Trust .................................. 339 –Deutsche Euroshop ................. – 149Douglas Emmett .................... 803 –Dupont Fabros Technology ....... – 333Entertainment Properties Trust .. 221 –Eurocastle Investment ............. – 18Eurocommerical Properties ...... 57 –Fukuora ................................ – 3Goodman Group ..................... 3,192 –Great Portland Estates ............. 1,784 –Hang Lung Properties ............. 1,000 –HCP ..................................... 1,059 –Home Properties ..................... 395 –ING Real Estate Community
Living ............................... – 15,078Japan Retail Fund Investment.... – 2Kerry Properties ..................... 1,000 2,000Kimco Realty ........................ 248 –Klepierre .............................. – 195Land Securities Group ............. 227 –Macerich ............................... 160 –Mapeley ................................ 475 –Mapletree Logistics Trust ........ – 16,000Mirvac Group ........................ 3,735 –Mitsubishi Estate ................... 1,000 –Morgans Hotel Group ............. 1,400 2,762Nationwide Health Properties ... 446 –Nippon Building Fund ............ 1 –
*Traded on regulated exchanges or markets.
FIRST STATE GLOBAL PROPERTY SECURITIES FUND
SCHEDULE OF INVESTMENTS (CONTINUED)AS OF 30 JUNE 2008
PORTFOLIO CHANGES (UNAUDITED)
67

JOBNAME: 08081916 PAGE: 69 SESS: 26 OUTPUT: Mon Aug 18 12:43:17 2008
Purchased Sold
Financial Assets at Fair ValueThrough Profit or Loss*
Numberof shares
Numberof shares
Pacific Management ................ 8 27Plaza Centers ......................... – 2,717Primaris Retail ....................... 9 809Prologis ................................ – 535Regency Centers .................... 457 –Risanamento .......................... – 1,436Rubicon Japan Trust ............... – 30,102Simon Property Group ............ 174 180Societe De La Tour ................. – 80SP Setia ................................ 7,200 6,100Starwood Hotels ..................... – 110Summit Germany .................... – 2,159Sunstone Hotel Investors ......... 535 412Tanger Factory Outlet Centre ... 627 –Taubman Centres .................... – 760Terrace Hill Group ................. 5,139 –Unibail Holding ..................... 56 –Unitech Corporate Parks ......... – 2,855Ventas .................................. 796 –
*Traded on regulated exchanges or markets.
FIRST STATE GLOBAL PROPERTY SECURITIES FUND
PORTFOLIO CHANGES (UNAUDITED)(CONTINUED)
68

JOBNAME: 08081916 PAGE: 70 SESS: 26 OUTPUT: Mon Aug 18 12:43:17 2008
PERFORMANCE^
01/01/07To
30/06/07
01/01/08To
30/06/08
First State Asian Property Securities Fund“The Fund”
– Class I* 1.90% -25.56%– Class III 15.78% -25.26%– Class I – Dist** N/A -25.51%
UBS Asia Global RealEstate Investors Index 9.77% -22.56%
^ Performance calculation is base on official dealingNAV.
* 25 April 2007** 03 July 2007
Asian listed property markets fell heavily inthe first half of 2008 with the UBS Asia RealEstate Index declining by 22.6% in US dollarterms.
Global market weakness and rising concernsabout inflationary pressures and thus rising interestrates undermined confidence. The poorperformance of property markets in the US and UKcaused by the credit crunch was also negative.Inflationary pressures in the global economyintensified driven by the oil price and the prospectof further interest rate cuts disappeared. As a resultbond yields rose over the six month period puttingdownward pressure on property valuations.
Performance was helped by Japanese stocksAeon Mall, which outperformed because of thedefensive nature of its retail assets, and propertydeveloper Mitsui Fudosan, which rallied verystrongly on positive results driven by lowervacancies and rising office rents.
On the negative side, a number of positions inHong Kong underperformed. Agile Properties(Residential), Kerry Properties (Diversified) andChina Overseas Land (Office) all lagged onconcerns about rising inflationary pressure andfurther monetary tightening in China.
Over the six months we bought Hong Kongdeveloper Sun Hung Kai Properties, as thecompany is a beneficiary of negative real interestrates, and Link REIT for exposure to the defensiveHong Kong retail sector. We also purchasedCapitacommercial (Singapore: Office) which wasattractively valued and offers strong organicgrowth.
We sold Mapletree Logistics (Singapore:Industrial) on concerns about the company’s debtlevel and Nippon Residential on worries aboutweakness in the Japanese residential market. Wealso sold SPG Land (Hong Kong: Residential) toreduce exposure to the Shanghai residential andhotel market.
In Singapore our strategy remains to invest inS-REITs with good management track records,investment grade portfolios, sound balance sheetsand strong organic earnings growth. So far in 2008,growth in the Hong Kong property market hasslowed, impacted by the weakening US economy.The fund has limited exposure to the Hong KongREIT market given the generally poor quality of theREIT sector. Instead we are focused on Hong Konglisted China stocks and Hong Kong propertydevelopers. In Japan property fundamentals arefirm with the office market performing well,although hindered by disappointing economicgrowth. Office rental growth in Tokyo shouldcontinue with low vacancy rates.
FIRST STATE ASIAN PROPERTY SECURITIES FUND
INVESTMENT MANAGER’S REPORT (UNAUDITED)
69
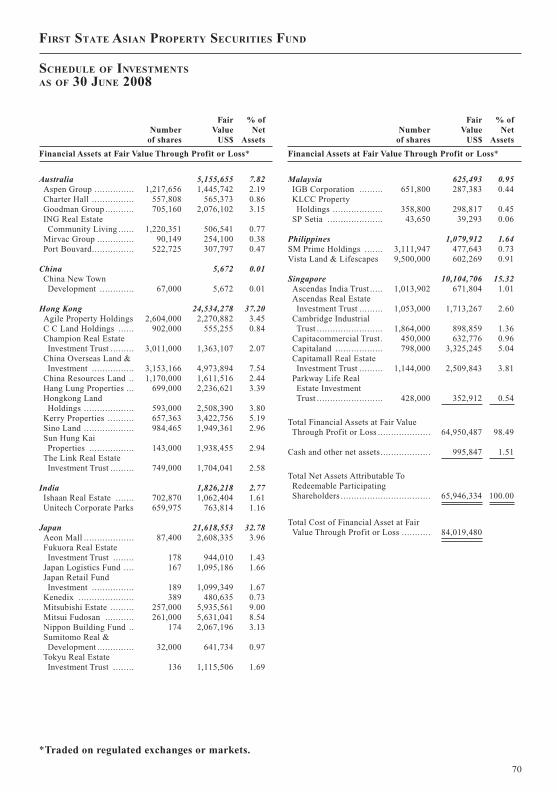
JOBNAME: 08081916 PAGE: 71 SESS: 26 OUTPUT: Mon Aug 18 12:43:17 2008
Numberof shares
FairValue
US$
% ofNet
Assets
Financial Assets at Fair Value Through Profit or Loss*
Australia 5,155,655 7.82Aspen Group ............... 1,217,656 1,445,742 2.19Charter Hall ................ 557,808 565,373 0.86Goodman Group ........... 705,160 2,076,102 3.15ING Real EstateCommunity Living ...... 1,220,351 506,541 0.77
Mirvac Group .............. 90,149 254,100 0.38Port Bouvard................ 522,725 307,797 0.47
China 5,672 0.01China New TownDevelopment ............. 67,000 5,672 0.01
Hong Kong 24,534,278 37.20Agile Property Holdings 2,604,000 2,270,882 3.45C C Land Holdings ...... 902,000 555,255 0.84Champion Real EstateInvestment Trust ......... 3,011,000 1,363,107 2.07
China Overseas Land &Investment ................ 3,153,166 4,973,894 7.54
China Resources Land .. 1,170,000 1,611,516 2.44Hang Lung Properties ... 699,000 2,236,621 3.39Hongkong LandHoldings ................... 593,000 2,508,390 3.80
Kerry Properties .......... 657,363 3,422,756 5.19Sino Land ................... 984,465 1,949,361 2.96Sun Hung KaiProperties ................. 143,000 1,938,455 2.94
The Link Real EstateInvestment Trust ......... 749,000 1,704,041 2.58
India 1,826,218 2.77Ishaan Real Estate ....... 702,870 1,062,404 1.61Unitech Corporate Parks 659,975 763,814 1.16
Japan 21,618,553 32.78Aeon Mall ................... 87,400 2,608,335 3.96Fukuora Real EstateInvestment Trust ........ 178 944,010 1.43
Japan Logistics Fund .... 167 1,095,186 1.66Japan Retail FundInvestment ................ 189 1,099,349 1.67
Kenedix ..................... 389 480,635 0.73Mitsubishi Estate ......... 257,000 5,935,561 9.00Mitsui Fudosan ........... 261,000 5,631,041 8.54Nippon Building Fund .. 174 2,067,196 3.13Sumitomo Real &Development .............. 32,000 641,734 0.97
Tokyu Real EstateInvestment Trust ........ 136 1,115,506 1.69
Numberof shares
FairValue
US$
% ofNet
Assets
Financial Assets at Fair Value Through Profit or Loss*
Malaysia 625,493 0.95IGB Corporation ......... 651,800 287,383 0.44KLCC PropertyHoldings ................... 358,800 298,817 0.45
SP Setia ..................... 43,650 39,293 0.06
Philippines 1,079,912 1.64SM Prime Holdings ....... 3,111,947 477,643 0.73Vista Land & Lifescapes 9,500,000 602,269 0.91
Singapore 10,104,706 15.32Ascendas India Trust ..... 1,013,902 671,804 1.01Ascendas Real EstateInvestment Trust ......... 1,053,000 1,713,267 2.60
Cambridge IndustrialTrust ......................... 1,864,000 898,859 1.36
Capitacommercial Trust . 450,000 632,776 0.96Capitaland .................. 798,000 3,325,245 5.04Capitamall Real EstateInvestment Trust ......... 1,144,000 2,509,843 3.81
Parkway Life RealEstate InvestmentTrust ......................... 428,000 352,912 0.54
Total Financial Assets at Fair ValueThrough Profit or Loss .................... 64,950,487 98.49
Cash and other net assets ................... 995,847 1.51
Total Net Assets Attributable ToRedeemable ParticipatingShareholders .................................. 65,946,334 100.00
Total Cost of Financial Asset at FairValue Through Profit or Loss ........... 84,019,480
*Traded on regulated exchanges or markets.
FIRST STATE ASIAN PROPERTY SECURITIES FUND
SCHEDULE OF INVESTMENTS
AS OF 30 JUNE 2008
70
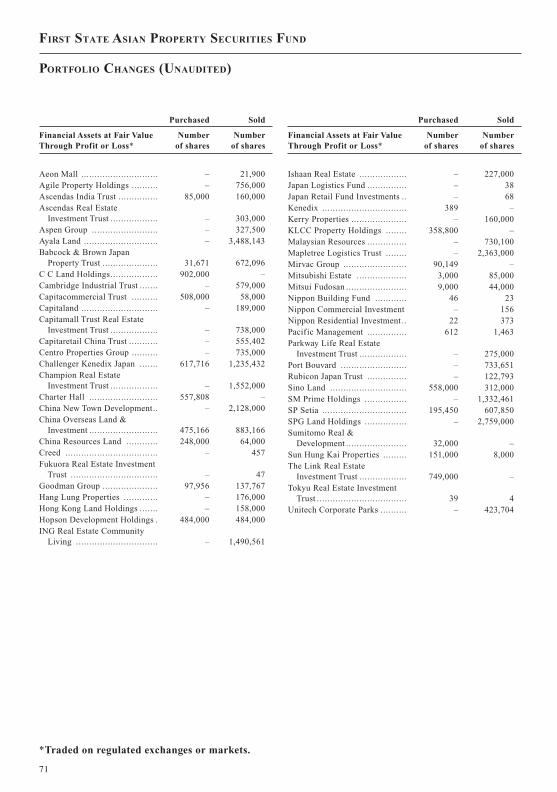
JOBNAME: 08081916 PAGE: 72 SESS: 26 OUTPUT: Mon Aug 18 12:43:17 2008
Purchased Sold
Financial Assets at Fair ValueThrough Profit or Loss*
Numberof shares
Numberof shares
Aeon Mall ............................. – 21,900Agile Property Holdings .......... – 756,000Ascendas India Trust ............... 85,000 160,000Ascendas Real Estate
Investment Trust .................. – 303,000Aspen Group ......................... – 327,500Ayala Land ............................ – 3,488,143Babcock & Brown Japan
Property Trust ..................... 31,671 672,096C C Land Holdings.................. 902,000 –Cambridge Industrial Trust ....... – 579,000Capitacommercial Trust .......... 508,000 58,000Capitaland ............................. – 189,000Capitamall Trust Real Estate
Investment Trust .................. – 738,000Capitaretail China Trust ........... – 555,402Centro Properties Group .......... – 735,000Challenger Kenedix Japan ....... 617,716 1,235,432Champion Real Estate
Investment Trust .................. – 1,552,000Charter Hall .......................... 557,808 –China New Town Development.. – 2,128,000China Overseas Land &
Investment .......................... 475,166 883,166China Resources Land ............ 248,000 64,000Creed ................................... – 457Fukuora Real Estate Investment
Trust ................................. – 47Goodman Group ..................... 97,956 137,767Hang Lung Properties ............. – 176,000Hong Kong Land Holdings ....... – 158,000Hopson Development Holdings . 484,000 484,000ING Real Estate Community
Living ............................... – 1,490,561
Purchased Sold
Financial Assets at Fair ValueThrough Profit or Loss*
Numberof shares
Numberof shares
Ishaan Real Estate .................. – 227,000Japan Logistics Fund ............... – 38Japan Retail Fund Investments .. – 68Kenedix ................................ 389 –Kerry Properties ..................... – 160,000KLCC Property Holdings ........ 358,800 –Malaysian Resources ............... – 730,100Mapletree Logistics Trust ........ – 2,363,000Mirvac Group ........................ 90,149 –Mitsubishi Estate ................... 3,000 85,000Mitsui Fudosan ....................... 9,000 44,000Nippon Building Fund ............ 46 23Nippon Commercial Investment – 156Nippon Residential Investment .. 22 373Pacific Management ............... 612 1,463Parkway Life Real Estate
Investment Trust .................. – 275,000Port Bouvard ......................... – 733,651Rubicon Japan Trust ............... – 122,793Sino Land ............................. 558,000 312,000SM Prime Holdings ................ – 1,332,461SP Setia ................................ 195,450 607,850SPG Land Holdings ................ – 2,759,000Sumitomo Real &
Development ....................... 32,000 –Sun Hung Kai Properties ......... 151,000 8,000The Link Real Estate
Investment Trust .................. 749,000 –Tokyu Real Estate Investment
Trust .................................. 39 4Unitech Corporate Parks .......... – 423,704
*Traded on regulated exchanges or markets.
FIRST STATE ASIAN PROPERTY SECURITIES FUND
PORTFOLIO CHANGES (UNAUDITED)
71
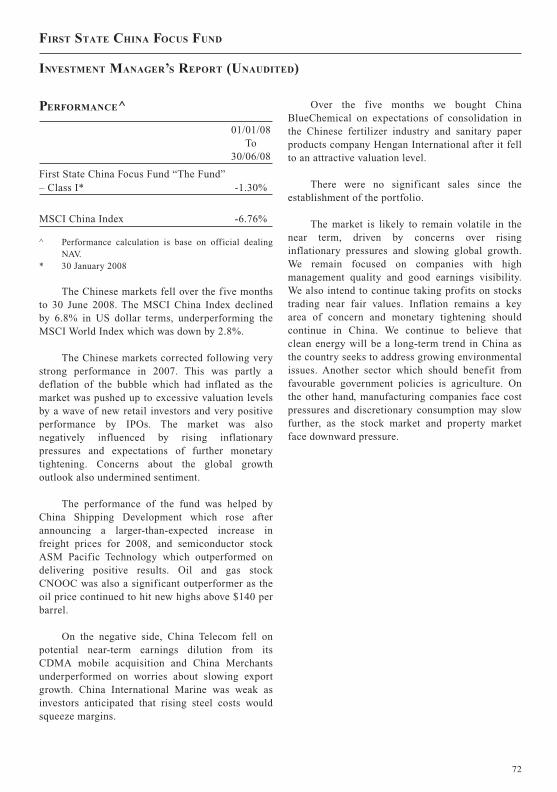
JOBNAME: 08081916 PAGE: 73 SESS: 26 OUTPUT: Mon Aug 18 12:43:17 2008
PERFORMANCE^
01/01/08To
30/06/08
First State China Focus Fund “The Fund”– Class I* -1.30%
MSCI China Index -6.76%
^ Performance calculation is base on official dealingNAV.
* 30 January 2008
The Chinese markets fell over the five monthsto 30 June 2008. The MSCI China Index declinedby 6.8% in US dollar terms, underperforming theMSCI World Index which was down by 2.8%.
The Chinese markets corrected following verystrong performance in 2007. This was partly adeflation of the bubble which had inflated as themarket was pushed up to excessive valuation levelsby a wave of new retail investors and very positiveperformance by IPOs. The market was alsonegatively influenced by rising inflationarypressures and expectations of further monetarytightening. Concerns about the global growthoutlook also undermined sentiment.
The performance of the fund was helped byChina Shipping Development which rose afterannouncing a larger-than-expected increase infreight prices for 2008, and semiconductor stockASM Pacific Technology which outperformed ondelivering positive results. Oil and gas stockCNOOC was also a significant outperformer as theoil price continued to hit new highs above $140 perbarrel.
On the negative side, China Telecom fell onpotential near-term earnings dilution from itsCDMA mobile acquisition and China Merchantsunderperformed on worries about slowing exportgrowth. China International Marine was weak asinvestors anticipated that rising steel costs wouldsqueeze margins.
Over the five months we bought ChinaBlueChemical on expectations of consolidation inthe Chinese fertilizer industry and sanitary paperproducts company Hengan International after it fellto an attractive valuation level.
There were no significant sales since theestablishment of the portfolio.
The market is likely to remain volatile in thenear term, driven by concerns over risinginflationary pressures and slowing global growth.We remain focused on companies with highmanagement quality and good earnings visibility.We also intend to continue taking profits on stockstrading near fair values. Inflation remains a keyarea of concern and monetary tightening shouldcontinue in China. We continue to believe thatclean energy will be a long-term trend in China asthe country seeks to address growing environmentalissues. Another sector which should benefit fromfavourable government policies is agriculture. Onthe other hand, manufacturing companies face costpressures and discretionary consumption may slowfurther, as the stock market and property marketface downward pressure.
FIRST STATE CHINA FOCUS FUND
INVESTMENT MANAGER’S REPORT (UNAUDITED)
72
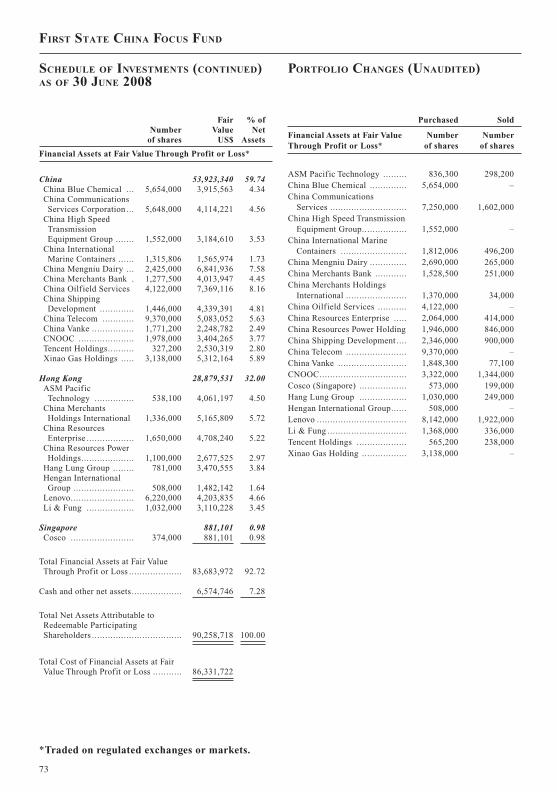
JOBNAME: 08081916 PAGE: 74 SESS: 26 OUTPUT: Mon Aug 18 12:43:17 2008
Numberof shares
FairValue
US$
% ofNet
Assets
Financial Assets at Fair Value Through Profit or Loss*
China 53,923,340 59.74China Blue Chemical ... 5,654,000 3,915,563 4.34China CommunicationsServices Corporation ... 5,648,000 4,114,221 4.56
China High SpeedTransmissionEquipment Group ....... 1,552,000 3,184,610 3.53
China InternationalMarine Containers ...... 1,315,806 1,565,974 1.73
China Mengniu Dairy ... 2,425,000 6,841,936 7.58China Merchants Bank . 1,277,500 4,013,947 4.45China Oilfield Services 4,122,000 7,369,116 8.16China ShippingDevelopment ............. 1,446,000 4,339,391 4.81
China Telecom ............ 9,370,000 5,083,052 5.63China Vanke ................ 1,771,200 2,248,782 2.49CNOOC ..................... 1,978,000 3,404,265 3.77Tencent Holdings.......... 327,200 2,530,319 2.80Xinao Gas Holdings ..... 3,138,000 5,312,164 5.89
Hong Kong 28,879,531 32.00ASM PacificTechnology ............... 538,100 4,061,197 4.50
China MerchantsHoldings International 1,336,000 5,165,809 5.72
China ResourcesEnterprise .................. 1,650,000 4,708,240 5.22
China Resources PowerHoldings.................... 1,100,000 2,677,525 2.97
Hang Lung Group ........ 781,000 3,470,555 3.84Hengan InternationalGroup ....................... 508,000 1,482,142 1.64
Lenovo........................ 6,220,000 4,203,835 4.66Li & Fung .................. 1,032,000 3,110,228 3.45
Singapore 881,101 0.98Cosco ........................ 374,000 881,101 0.98
Total Financial Assets at Fair ValueThrough Profit or Loss .................... 83,683,972 92.72
Cash and other net assets ................... 6,574,746 7.28
Total Net Assets Attributable toRedeemable ParticipatingShareholders .................................. 90,258,718 100.00
Total Cost of Financial Assets at FairValue Through Profit or Loss ........... 86,331,722
Purchased Sold
Financial Assets at Fair ValueThrough Profit or Loss*
Numberof shares
Numberof shares
ASM Pacific Technology ......... 836,300 298,200China Blue Chemical .............. 5,654,000 –China Communications
Services ............................. 7,250,000 1,602,000China High Speed Transmission
Equipment Group................. 1,552,000 –China International Marine
Containers ......................... 1,812,006 496,200China Mengniu Dairy .............. 2,690,000 265,000China Merchants Bank ............ 1,528,500 251,000China Merchants Holdings
International ....................... 1,370,000 34,000China Oilfield Services ........... 4,122,000 –China Resources Enterprise ..... 2,064,000 414,000China Resources Power Holding 1,946,000 846,000China Shipping Development .... 2,346,000 900,000China Telecom ....................... 9,370,000 –China Vanke .......................... 1,848,300 77,100CNOOC................................. 3,322,000 1,344,000Cosco (Singapore) .................. 573,000 199,000Hang Lung Group .................. 1,030,000 249,000Hengan International Group...... 508,000 –Lenovo .................................. 8,142,000 1,922,000Li & Fung .............................. 1,368,000 336,000Tencent Holdings ................... 565,200 238,000Xinao Gas Holding ................. 3,138,000 –
*Traded on regulated exchanges or markets.
FIRST STATE CHINA FOCUS FUND
SCHEDULE OF INVESTMENTS (CONTINUED)AS OF 30 JUNE 2008
PORTFOLIO CHANGES (UNAUDITED)
73

JOBNAME: 08081916 PAGE: 75 SESS: 26 OUTPUT: Mon Aug 18 12:43:17 2008
PERFORMANCE^
01/01/08To
30/06/08
First State Global Listed Infrastructure Fund“The Fund”
– Class I – Dist* N/A
UBS 50/50 Global Infrastructure &Utilities Index N/A
^ The fund was launch at 27 June 2008 & therefore noperformance figure provided
* 30 June 2008
Global listed infrastructure outperformedglobal equity and property markets in the first halfof 2008. The UBS Global Infrastructure & Utilities50-50 Index fell by 8.7% in US dollar terms, whilethe MSCI World Index was down by 10.2%. Withinan Asian context, global listed infrastructuresignificantly outperformed the MSCI AC Far Eastex Japan Index (-18.2%) and the MSCI EmergingMarkets Index (-11.6%).
Concerns about the impact of the creditcrunch on the global economy and risinginflationary pressures driven by the oil price, whichhit new highs above $140 per barrel, negativelyimpacted world equity markets. The prospect ofrising interest rates to combat inflationarypressures resulted in weak bond markets in thesecond quarter and falling valuations for listedinfrastructure assets.
The fund’s inception date was 27 June 2008.
Global listed infrastructure is deliveringstrong earnings growth in the face of slowingeconomic growth and rising inflationary pressures.A large majority of our companies have organicgrowth opportunities, driven by market dynamics(pipeline infrastructure transporting Canadian oilsands to the US), new growth markets (airportcapacity to Eastern Europe), decades of
under-investment (US power generation) andincentive-based regulation (wind farms andrequired transmission). This sustainable growth andthe inflation-linked pricing power of infrastructureassets in developed markets should continue toprovide positive returns from the asset class.
The investment universe for global listedinfrastructure continues to expand with the $4bninitial public offering (IPO) of US water utility,American Water Works, in late April. As weprogress through 2008 and into 2009 we expectmore listed infrastructure opportunities to arise inEurope, North America and Asia.
Recent market volatility is creatingopportunities to acquire defensive, long durationinfrastructure assets at very attractive prices. Webelieve that falls in share prices are overdone andprovide a great opportunity to buy qualitycompanies at significant discounts to fair value.
We believe our fund is naturally hedgedagainst the oil price with exposure to both energyinfrastructure (positively correlated) and airports(negatively correlated). While we do not makepredictions about the price of oil, we think the fundcan continue to perform regardless of the futuredirection of the commodity.
High barriers to entry, strong pricing power,sustainable growth and predictable cash generationmake the asset class a relative safe haven in anuncertain financial world.
FIRST STATE GLOBAL LISTED INFRASTURE FUND
INVESTMENT MANAGER’S REPORT (UNAUDITED)
74

JOBNAME: 08081916 PAGE: 1 SESS: 20 OUTPUT: Mon Aug 18 12:43:17 2008
30-June-2008Total
AsianGrowth
Fund
ChinaGrowth
FundGlobal 100
Fund
Hong KongGrowth
FundUS$ US$ US$ US$ US$
ASSETSCash and Cash Equivalents (Note 10) ...... 466,083,005 7,519,847 178,396,270 1,732,211 2,832,656Due from Brokers ................................... 54,489,441 2,935 1,395,842 1,202,807 75,230Due from Shareholders ........................... 75,175,212 640,769 18,224,547 237,243 642,518Financial Assets at Fair Value Through
Profit or Loss (Note 2 and 6) ............... 6,064,899,705 168,638,792 2,149,380,305 55,213,341 123,651,840Dividends and Other Receivables ............ 21,147,886 40,676 6,090,749 130,380 138,547
TOTAL ASSETS ................................... 6,681,795,249 176,843,019 2,353,487,713 58,515,982 127,340,791
LIABILITIESBank Overdrafts (Note 10) ...................... 161,128,421 3,257,471 53,238,327 1,294,521 1,901,086Due to Brokers ....................................... 81,607,337 446,611 14,383,217 1,263,753 34,379Due to Shareholders ............................... 39,263,838 366,288 22,948,611 363,193 512,018Due to Investment Manager (Note 3) ....... 8,722,593 203,831 4,074,870 57,760 116,811Dividends Payable .................................. 130,757 1,370 106,932 – –Financial Liabilities at Fair Value
Through Profit or Loss (Note 2 and 6) . 51,587 – – – –Accrued Expenses .................................. 1,994,432 53,400 798,570 25,848 24,285
TOTAL LIABILITES ........................... 292,898,965 4,328,971 95,550,527 3,005,075 2,588,579
NET ASSETS ATTRIBUTABLE TOREDEEMABLE PARTICIPATINGSHARES AT BID MARKETPRICES ............................................. 6,388,896,284 172,514,048 2,257,937,186 55,510,907 124,752,212
Adjustment from bid market prices tomid market prices ............................... 28,307,326 295,349 15,473,615 49,001 988,367
NET ASSETS ATTRIBUTABLE TOREDEEMABLE PARTICIPATINGSHARES AT DEALING NAV ............ 6,417,203,610 172,809,397 2,273,410,801 55,559,908 125,740,579
Shares in IssueClass I ................................................... 5,998,349 29,508,856 5,343,577 2,381,186Class II .................................................. 33,228 26,051 – –Class III ................................................. 839,081 – 1,258,470 1,045,748Class I Distributing ................................ 58,873 325,768 – –
Net Asset Value Per Share-Class I ........... $24.40 $75.60 $7.56 $30.92Net Asset Value Per Share-Class II .......... $60.07 $116.77 – –Net Asset Value Per Share-Class III ......... $27.10 – $12.00 $49.74Net Asset Value Per Share-Class I
Distributing ........................................ $24.08 $73.52 – –
* Date of commencement of new Funds# Date of termination of Funds
See Accompanying Notes to the Financial Statements
FIRST STATE GLOBAL UMBRELLA FUND P.L.C.
BALANCE SHEET (UNAUDITED)AS AT 30 JUNE 2008
75

JOBNAME: 08081916 PAGE: 2 SESS: 21 OUTPUT: Mon Aug 18 12:43:17 2008
IndianSubcontinent
FundUK Growth
FundGlobal Bond
FundHigh QualityBond Fund
Long TermBond Fund
GreaterChina
GrowthFund
SingaporeAnd
MalaysiaGrowth
FundUS$ US$ US$ US$ US$ US$ US$
7,778,191 – 1,139,719 1,735,293 2,014,293 31,888,541 4,201,884230,126 – – – – 103,477 147,399
1,119,651 – 263,750 16,425 – 1,725,673 202,185
128,691,180 – 25,014,925 42,952,507 144,992,267 381,573,580 74,307,836268,840 – 442,867 615,050 1,728,957 303,783 149,150
138,087,988 – 26,861,261 45,319,275 148,735,517 415,595,054 79,008,454
3,433,977 – 234,031 295,859 622,529 9,406,285 2,401,097343,860 – – – – 1,345,462 –662,931 – 244,809 5,832 – 7,777,892 293,350188,180 – 15,736 12,009 37,169 534,820 101,588
– – – – – 2,178 –
– – – – – – –63,848 – 4,743 5,978 10,632 128,978 16,600
4,692,796 – 499,319 319,678 670,330 19,195,615 2,812,635
133,395,192 – 26,361,942 44,999,597 148,065,187 396,399,439 76,195,819
35,230 – 14,976 69,081 94,081 2,177,231 390,011
133,430,422 – 26,376,918 45,068,678 148,159,268 398,576,670 76,585,830
4,956,068 – 965,174 – – 8,559,127 2,746,48734,361 – – – – – –
– – 645,966 2,667,898 8,648,350 – –26,274 – – 81,803 – 56,840 –
$26.65 – $15.99 – – $46.02 $27.74$17.76 – – – – – –
– – $16.92 $16.47 $17.12 – –
$26.29 – – $12.94 – $44.90 –
8 Jan 2008
FIRST STATE GLOBAL UMBRELLA FUND P.L.C.
76

JOBNAME: 08081916 PAGE: 3 SESS: 20 OUTPUT: Mon Aug 18 12:43:17 2008
AsiaInnovation
AndTechnology
FundAsian Equity
Plus FundAsian Bond
Fund
AsianQuality
Bond Fund
Hong KongDollar Bond
FundUS$ US$ US$ US$ US$
ASSETSCash and Cash Equivalents (Note 10) ...... 8,251,151 145,323,730 1,920,769 36,818,929 300,435Due from Brokers ................................... 742,701 880,271 – 45,433,951 –Due from Shareholders ........................... 136,247 8,198,292 43,300 1,389,999 –Financial Assets at Fair Value Through
Profit or Loss (Note 2 and 6) ............... 85,505,719 1,398,775,541 21,022,709 471,689,547 17,325,752Dividends and Other Receivables ............ 70,730 769,249 557,794 6,434,875 222,324
TOTAL ASSETS ................................... 94,706,548 1,553,947,083 23,544,572 561,767,301 17,848,511
LIABILITIESBank Overdrafts (Note 10) ...................... 2,256,549 62,806,266 1,632,151 4,758,923 59,849Due to Brokers ....................................... 978,023 9,755,291 – 48,977,945 –Due to Shareholders ............................... 551,255 1,703,609 186,881 – –Due to Investment Manager (Note 3) ....... 143,147 1,936,028 11,123 432,081 4,517Dividends Payable .................................. – 20,208 69 – –Financial Liabilities at Fair Value
Through Profit or Loss (Note 2 and 6) . – – – 21,880 –Accrued Expenses .................................. 36,116 362,399 11,259 129,345 1,453
TOTAL LIABILITES ........................... 3,965,090 76,583,801 1,841,483 54,320,174 65,819
NET ASSETS ATTRIBUTABLE TOREDEEMABLE PARTICIPATINGSHARES AT BID MARKETPRICES ............................................. 90,741,458 1,477,363,282 21,703,089 507,447,127 17,782,692
Adjustment from bid market prices tomid market prices ............................... 166,021 3,538,571 144,351 2,543,399 19,620
NET ASSETS ATTRIBUTABLE TOREDEEMABLE PARTICIPATINGSHARES AT DEALING NAV ............ 90,907,479 1,480,901,853 21,847,440 509,990,526 17,802,312
Shares in IssueClass I ................................................... 3,985,258 1,190,699 – 43,799,152 –Class II .................................................. – – – – –Class III ................................................. – – 1,019,968 – 1,495,710Class I Distributing ................................ – 49,906,797 892,866 – –
Net Asset Value Per Share-Class I ........... $22.77 $31.22 – $11.59 –Net Asset Value Per Share-Class II .......... – – – – –Net Asset Value Per Share-Class III ......... – – $12.96 – $11.89Net Asset Value Per Share-Class I
Distributing ........................................ – $28.86 $9.50 – –
* Date of commencement of new Funds# Date of termination of Funds
See Accompanying Notes to the Financial Statements
FIRST STATE GLOBAL UMBRELLA FUND P.L.C.
BALANCE SHEET (UNAUDITED) (CONTINUED)AS AT 30 JUNE 2008
77
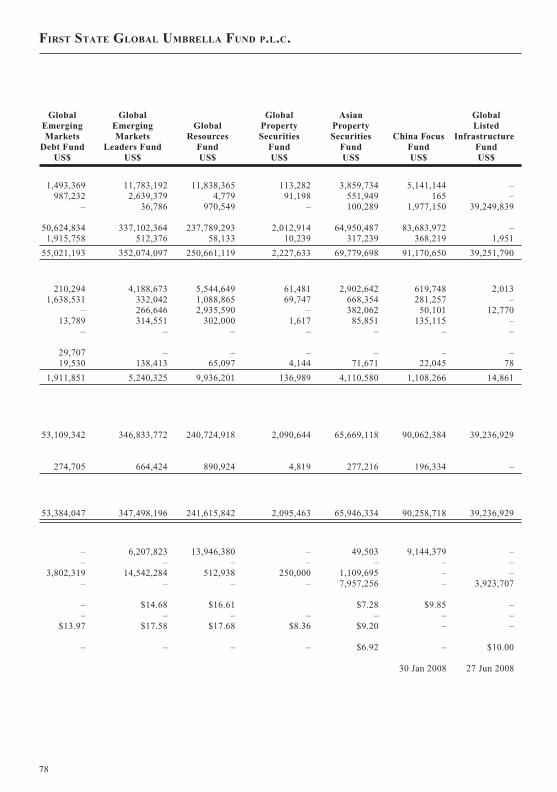
JOBNAME: 08081916 PAGE: 4 SESS: 20 OUTPUT: Mon Aug 18 12:43:17 2008
GlobalEmergingMarkets
Debt Fund
GlobalEmergingMarkets
Leaders Fund
GlobalResources
Fund
GlobalPropertySecurities
Fund
AsianPropertySecurities
FundChina Focus
Fund
GlobalListed
InfrastructureFund
US$ US$ US$ US$ US$ US$ US$
1,493,369 11,783,192 11,838,365 113,282 3,859,734 5,141,144 –987,232 2,639,379 4,779 91,198 551,949 165 –
– 36,786 970,549 – 100,289 1,977,150 39,249,839
50,624,834 337,102,364 237,789,293 2,012,914 64,950,487 83,683,972 –1,915,758 512,376 58,133 10,239 317,239 368,219 1,951
55,021,193 352,074,097 250,661,119 2,227,633 69,779,698 91,170,650 39,251,790
210,294 4,188,673 5,544,649 61,481 2,902,642 619,748 2,0131,638,531 332,042 1,088,865 69,747 668,354 281,257 –
– 266,646 2,935,590 – 382,062 50,101 12,77013,789 314,551 302,000 1,617 85,851 135,115 –
– – – – – – –
29,707 – – – – – –19,530 138,413 65,097 4,144 71,671 22,045 78
1,911,851 5,240,325 9,936,201 136,989 4,110,580 1,108,266 14,861
53,109,342 346,833,772 240,724,918 2,090,644 65,669,118 90,062,384 39,236,929
274,705 664,424 890,924 4,819 277,216 196,334 –
53,384,047 347,498,196 241,615,842 2,095,463 65,946,334 90,258,718 39,236,929
– 6,207,823 13,946,380 – 49,503 9,144,379 –– – – – – – –
3,802,319 14,542,284 512,938 250,000 1,109,695 – –– – – – 7,957,256 – 3,923,707
– $14.68 $16.61 $7.28 $9.85 –– – – – – – –
$13.97 $17.58 $17.68 $8.36 $9.20 – –
– – – – $6.92 – $10.00
30 Jan 2008 27 Jun 2008
FIRST STATE GLOBAL UMBRELLA FUND P.L.C.
78

JOBNAME: 08081916 PAGE: 5 SESS: 20 OUTPUT: Mon Aug 18 12:43:17 2008
31-Dec-2007Total
AsianGrowth
Fund
ChinaGrowth
FundGlobal 100
Fund
Hong KongGrowth
FundUS$ US$ US$ US$ US$
ASSETSCash and Cash Equivalents (Note 10) ...... 256,477,024 9,673,518 77,502,725 1,099,499 2,192,490Due from Brokers ................................... 26,327,806 – 4,010,428 222,657 468,367Due from Shareholders ........................... 111,172,422 647,953 55,732,104 318,413 1,776,838Financial Assets at Fair Value Through
Profit or Loss (Note 2 and 6) ............... 7,288,290,162 170,064,352 3,163,934,202 60,860,286 165,382,727Dividends and Other Receivables ............ 15,271,230 144,653 1,307,771 38,444 117,098
TOTAL ASSETS ................................... 7,697,538,644 180,530,476 3,302,487,230 62,539,299 169,937,520
LIABILITIESBank Overdrafts (Note 10) ...................... 94,962,561 1,971,236 29,887,369 781,315 1,080,148Due to Brokers ....................................... 30,680,322 – 13,944,906 – 272,973Due to Shareholders ............................... 58,380,346 873,370 45,014,351 233,616 442,223Due to Investment Manager (Note 3) ....... 8,602,460 195,188 4,033,694 61,052 143,999Dividends payable .................................. 130,688 1,370 106,932 – –Accrued Expenses .................................. 2,193,459 74,811 807,810 21,135 38,867
TOTAL LIABILITES ........................... 194,949,836 3,115,975 93,795,062 1,097,118 1,978,210
NET ASSETS ATTRIBUTABLE TOREDEEMABLE PARTICIPATINGSHARES AT BID MARKETPRICES ............................................. 7,502,588,808 177,414,501 3,208,692,168 61,442,181 167,959,310
Adjustment from bid market prices tomid market prices ............................... 15,491,845 466,930 5,004,218 75,350 282,444
NET ASSETS ATTRIBUTABLE TOREDEEMABLE PARTICIPATINGSHARES AT DEALING NAV ............ 7,518,080,653 177,881,431 3,213,696,386 61,517,531 168,241,754
Shares in IssueClass I ................................................... 5,162,936 31,629,730 5,286,411 2,673,249Class II .................................................. 37,052 27,301 – –Class III ................................................. 841,856 – 1,261,457 1,089,384Class I Distributing ................................ 65,043 415,049 – –
Net Asset Value Per Share-Class I ........... $28.47 $100.19 $8.45 $38.10Net Asset Value Per Share-Class II .......... $70.25 $154.96 – –Net Asset Value Per Share-Class III ......... $31.41 – $13.33 $60.91Net Asset Value Per Share-Class I
Distributing ........................................ $28.13 $97.33 – –
See Accompanying Notes to the Financial Statements
FIRST STATE GLOBAL UMBRELLA FUND P.L.C.
BALANCE SHEET (AUDITED)AS AT 31 DECEMBER 2007
79
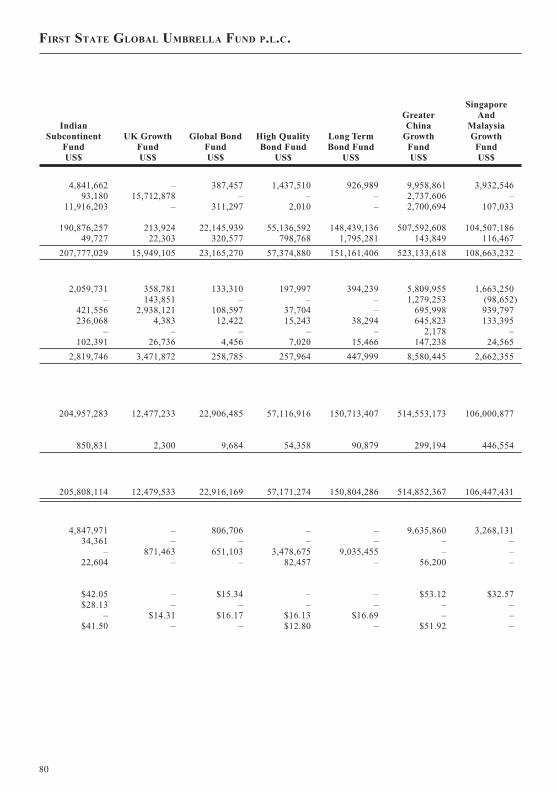
JOBNAME: 08081916 PAGE: 6 SESS: 20 OUTPUT: Mon Aug 18 12:43:17 2008
IndianSubcontinent
FundUK Growth
FundGlobal Bond
FundHigh QualityBond Fund
Long TermBond Fund
GreaterChina
GrowthFund
SingaporeAnd
MalaysiaGrowth
FundUS$ US$ US$ US$ US$ US$ US$
4,841,662 – 387,457 1,437,510 926,989 9,958,861 3,932,54693,180 15,712,878 – – – 2,737,606 –
11,916,203 – 311,297 2,010 – 2,700,694 107,033
190,876,257 213,924 22,145,939 55,136,592 148,439,136 507,592,608 104,507,18649,727 22,303 320,577 798,768 1,795,281 143,849 116,467
207,777,029 15,949,105 23,165,270 57,374,880 151,161,406 523,133,618 108,663,232
2,059,731 358,781 133,310 197,997 394,239 5,809,955 1,663,250– 143,851 – – – 1,279,253 (98,652)
421,556 2,938,121 108,597 37,704 – 695,998 939,797236,068 4,383 12,422 15,243 38,294 645,823 133,395
– – – – – 2,178 –102,391 26,736 4,456 7,020 15,466 147,238 24,565
2,819,746 3,471,872 258,785 257,964 447,999 8,580,445 2,662,355
204,957,283 12,477,233 22,906,485 57,116,916 150,713,407 514,553,173 106,000,877
850,831 2,300 9,684 54,358 90,879 299,194 446,554
205,808,114 12,479,533 22,916,169 57,171,274 150,804,286 514,852,367 106,447,431
4,847,971 – 806,706 – – 9,635,860 3,268,13134,361 – – – – – –
– 871,463 651,103 3,478,675 9,035,455 – –22,604 – – 82,457 – 56,200 –
$42.05 – $15.34 – – $53.12 $32.57$28.13 – – – – – –
– $14.31 $16.17 $16.13 $16.69 – –$41.50 – – $12.80 – $51.92 –
FIRST STATE GLOBAL UMBRELLA FUND P.L.C.
80
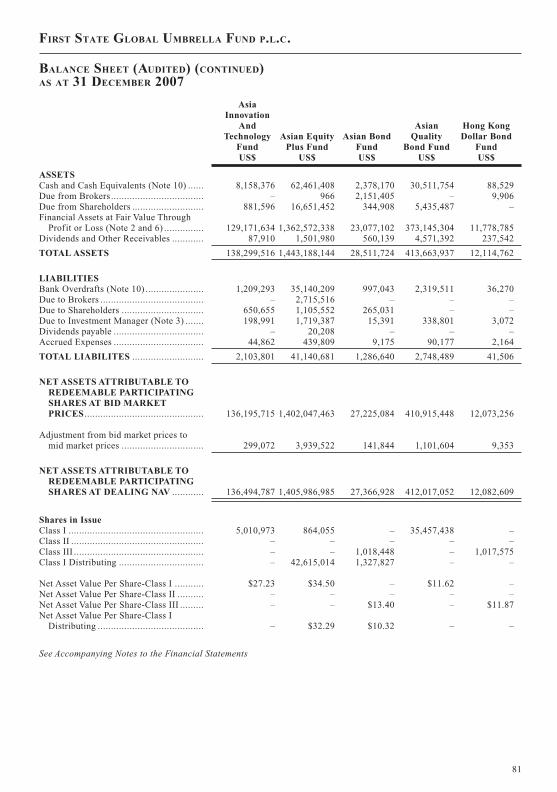
JOBNAME: 08081916 PAGE: 7 SESS: 20 OUTPUT: Mon Aug 18 12:43:17 2008
AsiaInnovation
AndTechnology
FundAsian Equity
Plus FundAsian Bond
Fund
AsianQuality
Bond Fund
Hong KongDollar Bond
FundUS$ US$ US$ US$ US$
ASSETSCash and Cash Equivalents (Note 10) ...... 8,158,376 62,461,408 2,378,170 30,511,754 88,529Due from Brokers ................................... – 966 2,151,405 – 9,906Due from Shareholders ........................... 881,596 16,651,452 344,908 5,435,487 –Financial Assets at Fair Value Through
Profit or Loss (Note 2 and 6) ............... 129,171,634 1,362,572,338 23,077,102 373,145,304 11,778,785Dividends and Other Receivables ............ 87,910 1,501,980 560,139 4,571,392 237,542
TOTAL ASSETS 138,299,516 1,443,188,144 28,511,724 413,663,937 12,114,762
LIABILITIESBank Overdrafts (Note 10) ...................... 1,209,293 35,140,209 997,043 2,319,511 36,270Due to Brokers ....................................... – 2,715,516 – – –Due to Shareholders ............................... 650,655 1,105,552 265,031 – –Due to Investment Manager (Note 3) ....... 198,991 1,719,387 15,391 338,801 3,072Dividends payable .................................. – 20,208 – – –Accrued Expenses .................................. 44,862 439,809 9,175 90,177 2,164
TOTAL LIABILITES ........................... 2,103,801 41,140,681 1,286,640 2,748,489 41,506
NET ASSETS ATTRIBUTABLE TOREDEEMABLE PARTICIPATINGSHARES AT BID MARKETPRICES ............................................. 136,195,715 1,402,047,463 27,225,084 410,915,448 12,073,256
Adjustment from bid market prices tomid market prices ............................... 299,072 3,939,522 141,844 1,101,604 9,353
NET ASSETS ATTRIBUTABLE TOREDEEMABLE PARTICIPATINGSHARES AT DEALING NAV ............ 136,494,787 1,405,986,985 27,366,928 412,017,052 12,082,609
Shares in IssueClass I ................................................... 5,010,973 864,055 – 35,457,438 –Class II .................................................. – – – – –Class III ................................................. – – 1,018,448 – 1,017,575Class I Distributing ................................ – 42,615,014 1,327,827 – –
Net Asset Value Per Share-Class I ........... $27.23 $34.50 – $11.62 –Net Asset Value Per Share-Class II .......... – – – – –Net Asset Value Per Share-Class III ......... – – $13.40 – $11.87Net Asset Value Per Share-Class I
Distributing ........................................ – $32.29 $10.32 – –
See Accompanying Notes to the Financial Statements
FIRST STATE GLOBAL UMBRELLA FUND P.L.C.
BALANCE SHEET (AUDITED) (CONTINUED)AS AT 31 DECEMBER 2007
81

JOBNAME: 08081916 PAGE: 8 SESS: 20 OUTPUT: Mon Aug 18 12:43:17 2008
GlobalEmerging
Markets DebtFund
GlobalEmergingMarketsLeaders
Fund
GlobalResources
Fund
GlobalPropertySecurities
Fund
AsianPropertySecurities
FundUS$ US$ US$ US$ US$
296,366 22,246,048 12,763,827 2,373,823 3,245,466– 905,536 3,373 3,569 7,935– 9,511,627 3,914,717 – 920,090
58,340,790 325,818,427 306,288,043 2,360,901 106,583,6292,204,603 648,895 146,006 14,885 442,940
60,841,759 359,130,533 323,115,966 4,753,178 111,200,060
4,243,863 2,414,849 3,298,643 47,994 917,555– 12,404,025 14,498 3,952 –– 260,341 1,438,949 2,297,500 656,985
14,316 270,706 388,585 2,879 130,771– – – – –
14,357 114,074 102,668 5,308 100,370
4,272,536 15,463,995 5,243,343 2,357,633 1,805,681
56,569,223 343,666,538 317,872,623 2,395,545 109,394,379
224,009 804,629 954,573 4,650 429,847
56,793,232 344,471,167 318,827,196 2,400,195 109,824,226
– 5,603,021 20,641,275 – 49,503– – – – –
3,796,653 13,366,921 510,796 250,000 1,674,328– – – – 9,329,029
– $15.96 $15.05 – $9.82– – – – –
$14.95 $19.07 $15.97 $9.60 $12.35
– – – – $9.50
FIRST STATE GLOBAL UMBRELLA FUND P.L.C.
82

JOBNAME: 08081916 PAGE: 9 SESS: 20 OUTPUT: Mon Aug 18 12:43:17 2008
30-June-2008Total
AsianGrowth
Fund
ChinaGrowth
FundGlobal 100
Fund
Hong KongGrowth
FundUS$ US$ US$ US$ US$
INCOMEInterest Income ...................................... 23,482,375 71,561 762,620 6,722 36,621Dividend Income .................................... 73,868,873 2,148,830 32,786,643 992,502 2,193,837Sundry Income ....................................... 41,933 1,328 1,498 189 390Realised Gain/(Loss) on financial assets
and liabilities at fair value throughprofit or loss ....................................... 318,054,722 6,893,423 194,445,894 (768,840) 10,338,108
Net Gain /(Loss) on foreign exchange ..... 3,734,640 (187,759) 44,929 (15,536) (2,942)Net Change in Unrealised (Depreciation)/
Appreciation on financial assets andliabilities at fair value through profitor loss ............................................... (1,546,197,566) (32,599,243) (980,585,624) (5,897,490) (42,625,415)
TOTAL NET (EXPENSE)/ INCOME ... (1,127,015,023) (23,671,860) (752,544,040) (5,682,453) (30,059,401)
EXPENSESInvestment Advisory Fees ....................... 49,475,326 1,205,700 22,307,088 341,178 739,662Investment Advisory Fixed Expenses
Fees (Note 3) ...................................... 16,825 5,358 8,512 – –Custodian Fees ....................................... 1,969,285 57,734 701,963 12,730 33,296Administration Fees................................ 2,707,215 78,880 1,060,069 31,104 53,651Audit Fees.............................................. 274,133 7,885 110,727 2,984 –Directors Fees ........................................ 30,142 888 12,082 385 713Amortised Established Expenses ............. 2,753 – – – –Other Expenses ...................................... 920,532 32,009 315,450 11,418 24,227
TOTAL EXPENSES .............................. 55,396,211 1,388,454 24,515,891 399,799 851,549
OPERATING (LOSS)/PROFIT ............ (1,182,411,234) (25,060,314) (777,059,931) (6,082,252) (30,910,950)
FINANCE COSTSDistributions to Redeemable
Participating Shareholders ................... (18,470,876) (1,813) – – –Interest Expenses.................................... (91,765) – – (10,180) (3,660)
(LOSS)/PROFIT FOR THEFINANCIAL PERIOD BEFORETAX ................................................... (1,200,973,875) (25,062,127) (777,059,931) (6,092,432) (30,914,610)
Capital gains tax..................................... (141,787) (63,871) – – –Withholding tax on Dividends ................. (1,618,223) (78,295) – (212,176) –
(LOSS)/PROFIT FOR THEFINANCIAL PERIOD AFTER TAX.. (1,202,733,885) (25,204,293) (777,059,931) (6,304,608) (30,914,610)
Adjustment from bid prices to midmarket prices ...................................... 12,815,481 (171,581) 10,469,397 (26,349) 705,923
(DECREASE)/INCREASE IN NETASSETS ATTRIBUTABLE TOREDEEMABLE PARTICIPATINGSHAREHOLDERS ............................ (1,189,918,404) (25,375,874) (766,590,534) (6,330,957) (30,208,687)
* Date of commencement of new Funds# Date of termination of Funds
Gains and losses arose solely from continuing operations. There were no gains or losses other than those dealt with inthe income statement.
See Accompanying Notes to the Financial Statements
FIRST STATE GLOBAL UMBRELLA FUND P.L.C.
INCOME STATEMENT (UNAUDITED)FOR THE PERIOD ENDED 30 JUNE 2008
83

JOBNAME: 08081916 PAGE: 10 SESS: 20 OUTPUT: Mon Aug 18 12:43:17 2008
IndianSubcontinent
FundUK Growth
FundGlobal
Bond Fund
HighQuality
Bond FundLong TermBond Fund
GreaterChina
GrowthFund
Singaporeand
MalaysiaGrowth
FundUS$ US$ US$ US$ US$ US$ US$
56,865 24,411 305,704 1,123,531 3,197,997 59,381 32,8191,000,472 – – – – 4,508,322 1,670,120
37 10,092 112 – 33 16,879 –
3,096,039 (36,535) 377,434 909,686 1,829,378 29,535,452 3,291,011(118,399) (2,390) 2,145,742 – – (55,222) (120,231)
(78,377,440) 13,652 (1,827,484) (591,961) (791,032) (98,822,344) (17,943,582)
(74,342,426) 9,230 1,001,508 1,441,256 4,236,376 (64,757,532) (13,069,863)
1,243,830 672 90,851 77,185 224,678 3,288,277 658,029
2,955 – – – – – –67,928 1 6,993 8,960 24,710 142,328 27,59579,541 104 13,917 4,024 3,616 191,898 47,642
7,465 1,201 1,038 3,227 7,152 20,105 5,096823 10 114 318 830 2,344 664
– – – – – – –68,361 16,241 13,125 8,587 7,333 36,249 19,522
1,470,903 18,229 126,038 102,301 268,319 3,681,201 758,548
(75,813,329) (8,999) 875,470 1,338,955 3,968,057 (68,438,733) (13,828,411)
– – – (13,827) – (3,509) –(1,197) (135) (3,583) (193) (2,813) (11,405) (5)
(75,814,526) (9,134) 871,887 1,324,935 3,965,244 (68,453,647) (13,828,416)
(391,483) – – – – – –(6,507) – – – – – (34,114)
(76,212,516) (9,134) 871,887 1,324,935 3,965,244 (68,453,647) (13,862,530)
(815,601) (2,300) 5,292 14,723 3,202 1,878,037 (56,543)
(77,028,117) (11,434) 877,179 1,339,658 3,968,446 (66,575,610) (13,919,073)
8 Jan 2008
FIRST STATE GLOBAL UMBRELLA FUND P.L.C.
84

JOBNAME: 08081916 PAGE: 11 SESS: 20 OUTPUT: Mon Aug 18 12:43:17 2008
AsiaInnovation
andTechnology
FundAsian Equity
Plus FundAsian Bond
Fund
AsianQuality
Bond Fund
Hong KongDollar Bond
FundUS$ US$ US$ US$ US$
INCOMEInterest Income ...................................... 56,054 238,774 1,113,836 12,673,841 308,849Dividend Income .................................... 873,172 19,897,414 – – –Sundry Income ....................................... 4,336 125 – – –Realised Gain/(Loss) on financial assets
and liabilities at fair value throughprofit or loss ....................................... (3,461,219) 34,570,916 (899,877) 3,617,393 65,261
Net Gain /(Loss) on foreign exchange ..... (55,977) (13,258) – (3,676) (32,290)Net Change in Unrealised (Depreciation)/
Appreciation on financial assets andliabilities at fair value through profitor loss ............................................... (17,290,994) (184,440,044) (856,995) (14,345,619) (451,468)
TOTAL NET (EXPENSE)/ INCOME ... (19,874,628) (129,746,073) (643,036) 1,941,939 (109,648)
EXPENSESInvestment Advisory Fees ....................... 939,043 10,713,996 79,069 2,341,538 22,536Investment Advisory Fixed Expenses
Fees (Note 3) ...................................... – – – – –Custodian Fees ....................................... 40,146 461,873 10,265 119,304 2,799Administration Fees................................ 55,631 603,324 11,582 202,071 2,566Audit Fees.............................................. 4,335 51,611 1,311 15,546 582Directors Fees ........................................ 417 5,264 158 1,366 72Amortised Established Expenses ............. – – – – –Other Expenses ...................................... 48,169 101,496 13,589 21,457 2,903
TOTAL EXPENSES .............................. 1,087,741 11,937,564 115,974 2,701,282 31,458
OPERATING (LOSS)/PROFIT ............ (20,962,369) (141,683,637) (759,010) (759,343) (141,106)
FINANCE COSTSDistributions to Redeemable
Participating Shareholders ................... – (16,588,214) (545,124) – –Interest Expenses.................................... (486) (9,850) (6,243) (3,895) (22)
(LOSS)/PROFIT FOR THEFINANCIAL PERIOD BEFORETAX ................................................... (20,962,855) (158,281,701) (1,310,377) (763,238) (141,128)
Capital gains tax..................................... 256,728 (18,091) – – –Withholding tax on Dividends ................. (51,607) (561,661) (2,150) – –
(LOSS)/PROFIT FOR THEFINANCIAL PERIOD AFTER TAX.. (20,757,734) (158,861,453) (1,312,527) (763,238) (141,128)
Adjustment from bid prices to midmarket prices ...................................... (133,051) (400,951) 2,507 1,441,795 10,267
(DECREASE)/INCREASE IN NETASSETS ATTRIBUTABLE TOREDEEMABLE PARTICIPATINGSHAREHOLDERS ............................ (20,890,785) (159,262,404) (1,310,020) 678,557 (130,861)
* Date of commencement of new Funds# Date of termination of Funds
Gains and losses arose solely from continuing operations. There were no gains or losses other than those dealt with inthe income statement.
See Accompanying Notes to the Financial Statements
FIRST STATE GLOBAL UMBRELLA FUND P.L.C.
INCOME STATEMENT (UNAUDITED) (CONTINUED)FOR THE PERIOD ENDED 30 JUNE 2008
85

JOBNAME: 08081916 PAGE: 12 SESS: 20 OUTPUT: Mon Aug 18 12:43:17 2008
GlobalEmergingMarkets
Debt Fund
GlobalEmergingMarketsLeaders
Fund
GlobalResources
Fund
GlobalPropertySecurities
Fund
AsianPropertySecurities
FundChina Focus
Fund
Global ListedInfrastructure
FundUS$ US$ US$ US$ US$ US$ US$
3,013,176 119,682 99,833 8,323 20,176 151,599 –– 3,772,900 1,575,458 47,045 1,320,046 1,082,112 –– – 155 – 6,759 – –
(2,722,504) 7,214,628 38,203,627 (149,655) (11,317,476) 3,022,578 –2,333,431 (104,423) (4,517) 84 (21,985) (50,941) –
(6,026,211) (36,743,416) (8,743,502) (185,928) (14,417,676) (2,647,750) –
(3,402,108) (25,740,629) 31,131,054 (280,131) (24,410,156) 1,557,598 –
82,117 1,770,189 2,034,570 9,736 584,670 720,712 –
– – – – – – –15,578 125,108 67,767 1,570 17,840 22,797 –
2,942 50,654 123,258 3,095 43,124 44,522 –2,382 12,805 12,151 229 3,860 2,416 25
257 1,329 1,351 32 401 319 5– – – – – 2,704 49
5,104 41,561 85,858 1,807 20,574 25,444 48
108,380 2,001,646 2,324,955 16,469 670,469 818,914 127
(3,510,488) (27,742,275) 28,806,099 (296,600) (25,080,625) 738,684 (127)
– – – – (1,318,389) – –(32,037) (975) (739) (71) (4,263) – (13)
(3,542,525) (27,743,250) 28,805,360 (296,671) (26,403,277) 738,684 (140)
– 74,930 – – – – –– (447,847) (120,453) (8,230) (95,183) – –
(3,542,525) (28,116,167) 28,684,907 (304,901) (26,498,460) 738,684 (140)
50,696 (140,205) (63,649) 169 (152,631) 196,334 –
(3,491,829) (28,256,372) 28,621,258 (304,732) (26,651,091) 935,018 (140)
30 Jan 2008 27 Jun 2008
FIRST STATE GLOBAL UMBRELLA FUND P.L.C.
86

JOBNAME: 08081916 PAGE: 13 SESS: 20 OUTPUT: Mon Aug 18 12:43:17 2008
30-June-2007Total
AsianGrowth
Fund
ChinaGrowth
FundGlobal 100
Fund
Hong KongGrowth
FundUS$ US$ US$ US$ US$
INCOMEInterest Income .............................................. 14,102,024 40,326 321,529 4,406 25,511Dividend Income ........................................... 46,640,022 1,798,859 19,086,092 876,226 1,692,557Sundry Income .............................................. 53,162 812 32,015 6,285 1,337Realised Gain/(Loss) on financial assets at
fair value through profit or loss................... 394,397,981 16,702,348 201,276,719 9,795,754 9,940,131Net Gain/(loss) on foreign exchange ............... 10,101,826 1,544,362 (1,838,041) 950,371 (602,815)Net Change in Unrealised Appreciation/
(Depreciation) on financial assets at fairvalue through profit or loss ........................ 439,105,293 6,054,818 260,622,241 (3,786,794) 12,076,104
TOTAL INVESTMENT INCOME/(EXPENSE) .............................................. 904,400,308 26,141,525 479,500,555 7,846,248 23,132,825
EXPENSESInvestment Advisory Fees............................... 26,857,303 940,273 11,207,008 406,919 424,201Investment Advisory Fixed Expenses Fees....... – – – – –Custodian Fees............................................... 1,115,273 44,781 398,606 13,234 23,762Administration Fees ....................................... 2,161,538 73,293 883,401 37,570 34,192Audit Fees ..................................................... 116,920 4,614 30,804 2,736 3,394Directors Fees................................................ 27,497 2,703 4,870 1,200 1,785Amortised Establishment Expenses (Note 2) ... 4,986 – – – –Other Expenses .............................................. 269,332 16,845 58,010 26,504 1,751
TOTAL EXPENSES ..................................... 30,552,849 1,082,509 12,582,699 488,163 489,085
OPERATING PROFIT/(LOSS) .................... 873,847,459 25,059,016 466,917,856 7,358,085 22,643,740
FINANCE COSTSDistributions to Redeemable Participating
Shareholders .............................................. (12,457,272) – (59,979) – –Interest Expenses ........................................... (1,256,232) (1,567) (198,620) (9,077) (13)
PROFIT/(LOSS) FOR THE FINANCIALPERIOD BEFORE TAX ........................... 860,133,955 25,057,449 466,659,257 7,349,008 22,643,727
Capital gains tax ............................................ (695,096) (128,772) – – –Withholding tax on Dividends ........................ (1,947,855) (119,260) (43,311) (194,511) (12,288)
PROFIT/(LOSS) FOR THE FINANCIALPERIOD AFTER TAX .............................. 857,491,004 24,809,417 466,615,946 7,154,497 22,631,439
Adjustment from bid prices to mid marketprices......................................................... 1,736,751 (52,058) 1,222,378 (12,961) (80,728)
INCREASE/(DECREASE) IN NETASSETS ATTRIBUTABLE TOREDEEMABLE PARTICIPATINGSHAREHOLDERS ................................... 859,227,755 24,757,359 467,838,324 7,141,536 22,550,711
Gains and losses arose solely from continuing operations. There were no gains or losses other than those dealt with inthe income statement.
See Accompanying Notes to the Financial Statements
FIRST STATE GLOBAL UMBRELLA FUND P.L.C.
INCOME STATEMENT (UNAUDITED)FOR THE PERIOD ENDED 30 JUNE 2007
87

JOBNAME: 08081916 PAGE: 14 SESS: 20 OUTPUT: Mon Aug 18 12:43:17 2008
IndianSubcontinent
FundUK Growth
FundGlobal
Bond Fund
HighQuality
Bond FundLong TermBond Fund
GreaterChina
GrowthFund
Singaporeand
MalaysiaGrowth
FundUS$ US$ US$ US$ US$ US$ US$
30,959 6,579 475,599 1,336,320 3,409,873 47,321 56,106833,955 209,646 – – – 4,398,302 1,540,786
1,333 66 968 224 497 1,305 482
15,751,532 2,095,105 (135,881) (32,151) 1,161,290 58,346,704 1,746,0753,606,167 347,528 230,686 2 8 (577,530) 135,004
2,639,042 (487,781) (475,217) (953,301) (5,431,846) 21,278,170 17,261,277
22,862,988 2,171,143 96,155 351,094 (860,178) 83,494,272 20,739,730
1,009,176 26,790 62,965 81,551 208,035 2,673,958 707,047– – – – – – –
55,521 3,195 4,792 9,342 23,791 101,840 27,72583,599 2,638 10,483 6,113 3,430 161,120 97,320
5,693 648 838 2,043 5,602 10,113 1,4631,375 223 355 780 1,925 2,723 559
– – – – – – –48,114 7,610 2,131 (19,677) (1,019) (1,357) 9,239
1,203,478 41,104 81,564 80,152 241,764 2,948,397 843,353
21,659,510 2,130,039 14,591 270,942 (1,101,942) 80,545,875 19,896,377
– – – (29,699) – – –(39,217) (14,147) (136,698) (48,752) (70,669) (180,142) (14,114)
21,620,293 2,115,892 (122,107) 192,491 (1,172,611) 80,365,733 19,882,263
(380,762) – – – – – –(12,188) (21,595) (3,123) – – (109,928) (25,234)
21,227,343 2,094,297 (125,230) 192,491 (1,172,611) 80,255,805 19,857,029
(217,517) (10,468) (933) (26,092) (67,074) (197,402) 611,538
21,009,826 2,083,829 (126,163) 166,399 (1,239,685) 80,058,403 20,468,567
FIRST STATE GLOBAL UMBRELLA FUND P.L.C.
88
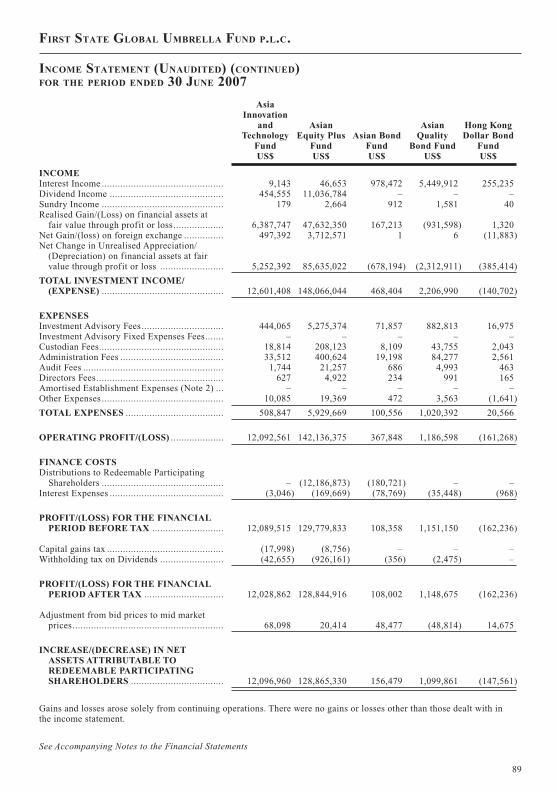
JOBNAME: 08081916 PAGE: 15 SESS: 20 OUTPUT: Mon Aug 18 12:43:17 2008
AsiaInnovation
andTechnology
Fund
AsianEquity Plus
FundAsian Bond
Fund
AsianQuality
Bond Fund
Hong KongDollar Bond
FundUS$ US$ US$ US$ US$
INCOMEInterest Income .............................................. 9,143 46,653 978,472 5,449,912 255,235Dividend Income ........................................... 454,555 11,036,784 – – –Sundry Income .............................................. 179 2,664 912 1,581 40Realised Gain/(Loss) on financial assets at
fair value through profit or loss................... 6,387,747 47,632,350 167,213 (931,598) 1,320Net Gain/(loss) on foreign exchange ............... 497,392 3,712,571 1 6 (11,883)Net Change in Unrealised Appreciation/
(Depreciation) on financial assets at fairvalue through profit or loss ........................ 5,252,392 85,635,022 (678,194) (2,312,911) (385,414)
TOTAL INVESTMENT INCOME/(EXPENSE) .............................................. 12,601,408 148,066,044 468,404 2,206,990 (140,702)
EXPENSESInvestment Advisory Fees............................... 444,065 5,275,374 71,857 882,813 16,975Investment Advisory Fixed Expenses Fees....... – – – – –Custodian Fees............................................... 18,814 208,123 8,109 43,755 2,043Administration Fees ....................................... 33,512 400,624 19,198 84,277 2,561Audit Fees ..................................................... 1,744 21,257 686 4,993 463Directors Fees................................................ 627 4,922 234 991 165Amortised Establishment Expenses (Note 2) ... – – – – –Other Expenses .............................................. 10,085 19,369 472 3,563 (1,641)
TOTAL EXPENSES ..................................... 508,847 5,929,669 100,556 1,020,392 20,566
OPERATING PROFIT/(LOSS) .................... 12,092,561 142,136,375 367,848 1,186,598 (161,268)
FINANCE COSTSDistributions to Redeemable Participating
Shareholders .............................................. – (12,186,873) (180,721) – –Interest Expenses ........................................... (3,046) (169,669) (78,769) (35,448) (968)
PROFIT/(LOSS) FOR THE FINANCIALPERIOD BEFORE TAX ........................... 12,089,515 129,779,833 108,358 1,151,150 (162,236)
Capital gains tax ............................................ (17,998) (8,756) – – –Withholding tax on Dividends ........................ (42,655) (926,161) (356) (2,475) –
PROFIT/(LOSS) FOR THE FINANCIALPERIOD AFTER TAX .............................. 12,028,862 128,844,916 108,002 1,148,675 (162,236)
Adjustment from bid prices to mid marketprices......................................................... 68,098 20,414 48,477 (48,814) 14,675
INCREASE/(DECREASE) IN NETASSETS ATTRIBUTABLE TOREDEEMABLE PARTICIPATINGSHAREHOLDERS ................................... 12,096,960 128,865,330 156,479 1,099,861 (147,561)
Gains and losses arose solely from continuing operations. There were no gains or losses other than those dealt with inthe income statement.
See Accompanying Notes to the Financial Statements
FIRST STATE GLOBAL UMBRELLA FUND P.L.C.
INCOME STATEMENT (UNAUDITED) (CONTINUED)FOR THE PERIOD ENDED 30 JUNE 2007
89

JOBNAME: 08081916 PAGE: 16 SESS: 20 OUTPUT: Mon Aug 18 12:43:17 2008
GlobalEmerging
Markets DebtFund
GlobalEmergingMarketsLeaders
Fund
GlobalResources
Fund
GlobalPropertySecurities
Fund
AsianPropertySecurities
FundUS$ US$ US$ US$ US$
1,430,595 40,858 134,943 205 1,479– 3,081,764 1,396,365 88,495 145,636
710 550 862 294 46
715,664 21,242,686 2,285,714 154,176 95,083(22,318) 1,786,139 365,286 (2,471) (18,639)
(1,105,003) 908,582 42,393,755 (111,947) 712,298
1,019,648 27,060,579 46,576,925 128,752 935,903
49,545 1,052,170 1,254,283 24,111 38,187– – – – –
8,682 69,608 40,442 4,450 4,6582,814 87,101 132,600 2,998 2,694
586 11,010 7,681 277 275196 1,736 42 43 43
– – 1,662 1,662 1,6622,714 50,294 26,144 4,301 5,880
64,537 1,271,919 1,462,854 37,842 53,399
955,111 25,788,660 45,114,071 90,910 882,504
– – – – –(210,800) (28,254) (4,842) (1,162) (10,258)
744,311 25,760,406 45,109,229 89,748 872,246
– (158,808) – – –(356) (257,379) (137,106) (18,245) (21,684)
743,955 25,344,219 44,972,123 71,503 850,562
(129,099) (180,961) 684,315 2,867 88,096
614,856 25,163,258 45,656,438 74,370 938,658
FIRST STATE GLOBAL UMBRELLA FUND P.L.C.
90

JOBNAME: 08081916 PAGE: 17 SESS: 20 OUTPUT: Mon Aug 18 12:43:17 2008
30-June-2008Total
Asian GrowthFund
ChinaGrowth
FundGlobal 100
Fund
Hong KongGrowth
FundUS$ US$ US$ US$ US$
Net Assets Attributable to RedeemableParticipating Shareholders atbeginning of period .......................... 7,518,080,653 177,881,431 3,213,696,386 61,517,531 168,241,754
(Decrease)/Increase in Net AssetsAttributable to RedeemableParticipating Shareholders ................ (1,189,918,404) (25,375,874) (766,590,534) (6,330,957) (30,208,687)
Proceeds on the Issue of Shares............ 1,455,224,779 33,013,663 572,660,039 15,900,769 24,549,319
Payments on the Redemption ofShares ............................................. (1,366,183,418) (12,709,823) (746,355,090) (15,527,435) (36,841,807)
Net Assets Attributable to RedeemableParticipating Shareholders at end ofperiod.............................................. 6,417,203,610 172,809,397 2,273,410,801 55,559,908 125,740,579
* Date of commencement of new Funds# Date of termination of Funds
See Accompanying Notes to the Financial Statements
FIRST STATE GLOBAL UMBRELLA FUND P.L.C.
STATEMENT OF CHANGES IN NET ASSETS ATTRIBUTABLE TO
REDEEMABLE PARTICIPATING SHAREHOLDERS (UNAUDITED)FOR THE PERIOD ENDED 30 JUNE 2008
91
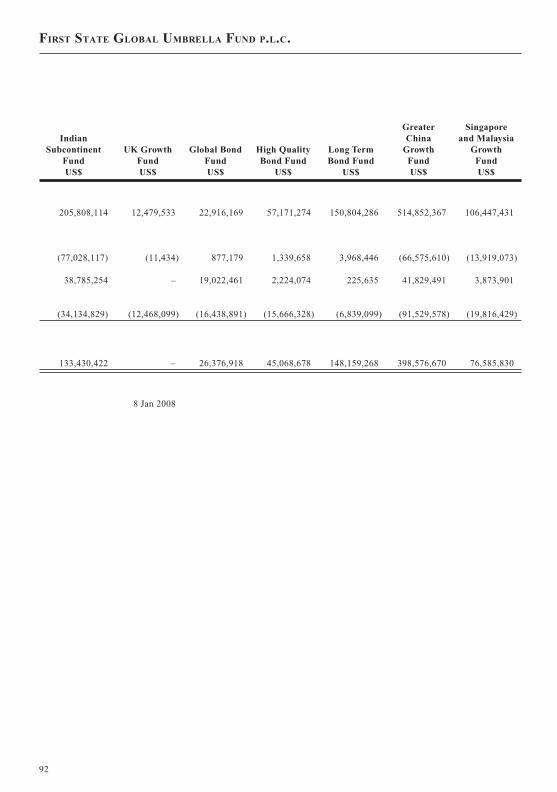
JOBNAME: 08081916 PAGE: 18 SESS: 21 OUTPUT: Mon Aug 18 12:43:17 2008
IndianSubcontinent
FundUK Growth
FundGlobal Bond
FundHigh QualityBond Fund
Long TermBond Fund
GreaterChina
GrowthFund
Singaporeand Malaysia
GrowthFund
US$ US$ US$ US$ US$ US$ US$
205,808,114 12,479,533 22,916,169 57,171,274 150,804,286 514,852,367 106,447,431
(77,028,117) (11,434) 877,179 1,339,658 3,968,446 (66,575,610) (13,919,073)
38,785,254 – 19,022,461 2,224,074 225,635 41,829,491 3,873,901
(34,134,829) (12,468,099) (16,438,891) (15,666,328) (6,839,099) (91,529,578) (19,816,429)
133,430,422 – 26,376,918 45,068,678 148,159,268 398,576,670 76,585,830
8 Jan 2008
FIRST STATE GLOBAL UMBRELLA FUND P.L.C.
(CONTINUED)
92

JOBNAME: 08081916 PAGE: 19 SESS: 20 OUTPUT: Mon Aug 18 12:43:17 2008
AsiaInnovation
AndTechnology
FundAsian Equity
Plus FundAsian Bond
Fund
AsianQuality
Bond Fund
Hong KongDollar Bond
FundUS$ US$ US$ US$ US$
Net Assets Attributable to RedeemableParticipating Shareholders atbeginning of period .......................... 136,494,787 1,405,986,985 27,366,928 412,017,052 12,082,609
(Decrease)/Increase in Net AssetsAttributable to RedeemableParticipating Shareholders ................ (20,890,785) (159,262,404) (1,310,020) 678,557 (130,861)
Proceeds on the Issue of Shares............ 6,908,070 294,240,990 3,620,916 106,576,493 5,850,564
Payments on the Redemption ofShares ............................................. (31,604,593) (60,063,718) (7,830,384) (9,281,576) –
Net Assets Attributable to RedeemableParticipating Shareholders at end ofperiod.............................................. 90,907,479 1,480,901,853 21,847,440 509,990,526 17,802,312
* Date of commencement of new Funds# Date of termination of Funds
See Accompanying Notes to the Financial Statements
FIRST STATE GLOBAL UMBRELLA FUND P.L.C.
STATEMENT OF CHANGES IN NET ASSETS ATTRIBUTABLE TO
REDEEMABLE PARTICIPATING SHAREHOLDERS (UNAUDITED) (CONTINUED)FOR THE PERIOD ENDED 30 JUNE 2008
93
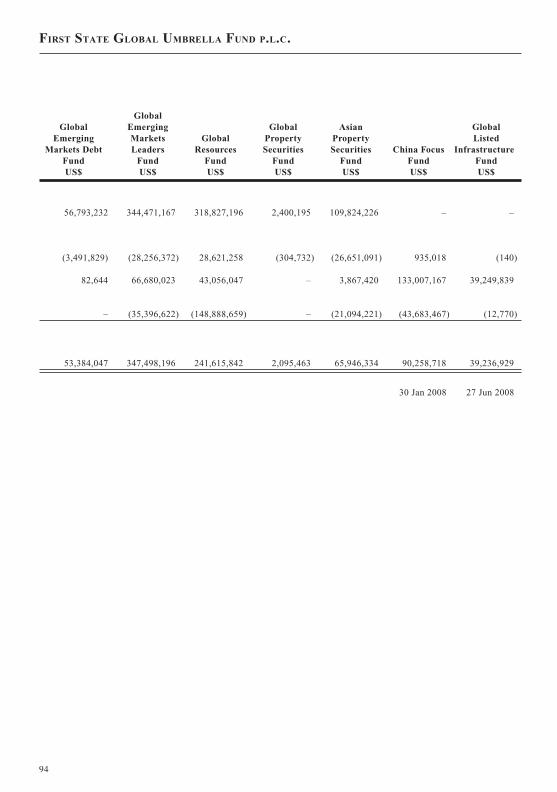
JOBNAME: 08081916 PAGE: 20 SESS: 20 OUTPUT: Mon Aug 18 12:43:17 2008
GlobalEmerging
Markets DebtFund
GlobalEmergingMarketsLeaders
Fund
GlobalResources
Fund
GlobalPropertySecurities
Fund
AsianPropertySecurities
FundChina Focus
Fund
GlobalListed
InfrastructureFund
US$ US$ US$ US$ US$ US$ US$
56,793,232 344,471,167 318,827,196 2,400,195 109,824,226 – –
(3,491,829) (28,256,372) 28,621,258 (304,732) (26,651,091) 935,018 (140)
82,644 66,680,023 43,056,047 – 3,867,420 133,007,167 39,249,839
– (35,396,622) (148,888,659) – (21,094,221) (43,683,467) (12,770)
53,384,047 347,498,196 241,615,842 2,095,463 65,946,334 90,258,718 39,236,929
30 Jan 2008 27 Jun 2008
FIRST STATE GLOBAL UMBRELLA FUND P.L.C.
94

JOBNAME: 08081916 PAGE: 21 SESS: 20 OUTPUT: Mon Aug 18 12:43:17 2008
30-June-2007Total
Asian GrowthFund
ChinaGrowth
FundGlobal 100
Fund
Hong KongGrowth
FundUS$ US$ US$ US$ US$
Net assets attributable to redeemableparticipating shareholders atbeginning of period .......................... 3,481,994,628 137,712,383 1,346,175,604 69,271,498 91,491,365
Increase/(Decrease) in Net AssetsAttributable to RedeemableParticipating Shareholders ................ 859,227,755 24,757,359 467,838,324 7,141,536 22,550,711
Proceeds on the Issue of Shares............ 3,747,830,409 (14,838,633) 808,504,585 2,208,237 19,394,454
Payments on the Redemption ofShares ............................................. (3,205,169,188) – (733,667,147) (12,509,490) (17,105,746)
Net assets attributable to redeemableparticipating shareholders at end ofperiod.............................................. 4,883,883,604 147,631,109 1,888,851,366 66,111,781 116,330,784
FIRST STATE GLOBAL UMBRELLA FUND P.L.C.
STATEMENT OF CHANGES IN NET ASSETS ATTRIBUTABLE TO
REDEEMABLE PARTICIPATING SHAREHOLDERS (UNAUDITED)FOR THE PERIOD ENDED 30 JUNE 2007
95
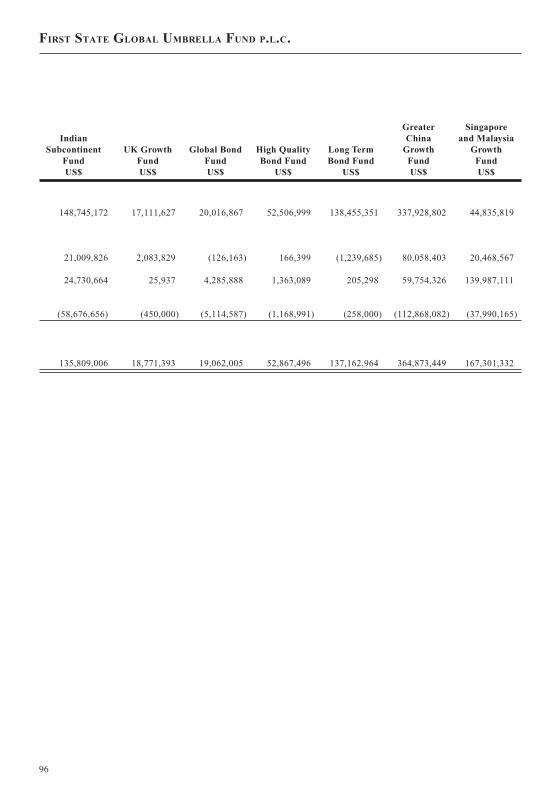
JOBNAME: 08081916 PAGE: 22 SESS: 20 OUTPUT: Mon Aug 18 12:43:17 2008
IndianSubcontinent
FundUK Growth
FundGlobal Bond
FundHigh QualityBond Fund
Long TermBond Fund
GreaterChina
GrowthFund
Singaporeand Malaysia
GrowthFund
US$ US$ US$ US$ US$ US$ US$
148,745,172 17,111,627 20,016,867 52,506,999 138,455,351 337,928,802 44,835,819
21,009,826 2,083,829 (126,163) 166,399 (1,239,685) 80,058,403 20,468,567
24,730,664 25,937 4,285,888 1,363,089 205,298 59,754,326 139,987,111
(58,676,656) (450,000) (5,114,587) (1,168,991) (258,000) (112,868,082) (37,990,165)
135,809,006 18,771,393 19,062,005 52,867,496 137,162,964 364,873,449 167,301,332
FIRST STATE GLOBAL UMBRELLA FUND P.L.C.
(CONTINUED)
96

JOBNAME: 08081916 PAGE: 23 SESS: 20 OUTPUT: Mon Aug 18 12:43:17 2008
AsiaInnovation
AndTechnology
FundAsian Equity
Plus FundAsian Bond
Fund
AsianQuality
Bond Fund
Hong KongDollar Bond
FundUS$ US$ US$ US$ US$
Net assets attributable to redeemableparticipating shareholders atbeginning of period .......................... 51,185,638 614,540,741 18,677,739 144,681,249 11,433,501
Increase/(Decrease) in Net AssetsAttributable to RedeemableParticipating Shareholders ................ 12,096,960 128,865,330 156,479 1,099,861 (147,561)
Proceeds on the Issue of Shares............ 13,734,181 2,166,803,457 19,069,904 79,058,708 16,812Payments on the Redemption of
Shares ............................................. (11,812,247) (2,047,796,590) (6,019,220) (2,787,000) –
Net assets attributable to redeemableparticipating shareholders at end ofperiod.............................................. 65,204,532 862,412,938 31,884,902 222,052,818 11,302,752
FIRST STATE GLOBAL UMBRELLA FUND P.L.C.
STATEMENT OF CHANGES IN NET ASSETS ATTRIBUTABLE TO
REDEEMABLE PARTICIPATING SHAREHOLDERS (UNAUDITED) (CONTINUED)FOR THE PERIOD ENDED 30 JUNE 2007
97

JOBNAME: 08081916 PAGE: 24 SESS: 20 OUTPUT: Mon Aug 18 12:43:17 2008
GlobalEmerging
Markets DebtFund
GlobalEmergingMarketsLeaders
Fund
GlobalResources
Fund
GlobalPropertySecurities
Fund
AsianPropertySecurities
FundUS$ US$ US$ US$ US$
27,627,616 193,409,456 5,268,147 5,401,965 5,517,089
614,856 25,163,258 45,656,438 74,370 938,658
28,749,069 62,415,082 320,322,939 – 12,039,301
– (66,587,496) (90,355,396) – (2,375)
56,991,541 214,400,300 280,892,128 5,476,335 18,492,673
FIRST STATE GLOBAL UMBRELLA FUND P.L.C.
(CONTINUED)
98
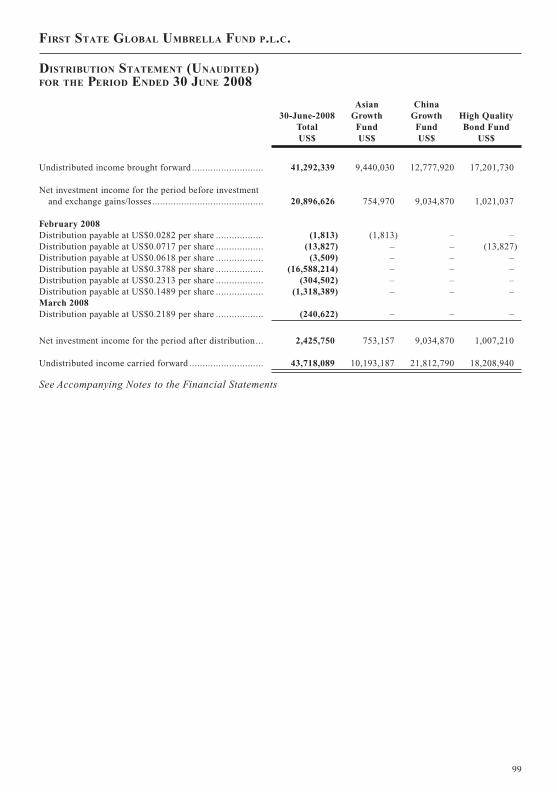
JOBNAME: 08081916 PAGE: 25 SESS: 20 OUTPUT: Mon Aug 18 12:43:17 2008
30-June-2008Total
AsianGrowth
Fund
ChinaGrowth
FundHigh QualityBond Fund
US$ US$ US$ US$
Undistributed income brought forward ........................... 41,292,339 9,440,030 12,777,920 17,201,730
Net investment income for the period before investmentand exchange gains/losses.......................................... 20,896,626 754,970 9,034,870 1,021,037
February 2008Distribution payable at US$0.0282 per share .................. (1,813) (1,813) – –Distribution payable at US$0.0717 per share .................. (13,827) – – (13,827)Distribution payable at US$0.0618 per share .................. (3,509) – – –Distribution payable at US$0.3788 per share .................. (16,588,214) – – –Distribution payable at US$0.2313 per share .................. (304,502) – – –Distribution payable at US$0.1489 per share .................. (1,318,389) – – –March 2008Distribution payable at US$0.2189 per share .................. (240,622) – – –
Net investment income for the period after distribution... 2,425,750 753,157 9,034,870 1,007,210
Undistributed income carried forward ............................ 43,718,089 10,193,187 21,812,790 18,208,940
See Accompanying Notes to the Financial Statements
FIRST STATE GLOBAL UMBRELLA FUND P.L.C.
DISTRIBUTION STATEMENT (UNAUDITED)FOR THE PERIOD ENDED 30 JUNE 2008
99

JOBNAME: 08081916 PAGE: 26 SESS: 20 OUTPUT: Mon Aug 18 12:43:17 2008
Greater ChinaGrowth Fund
Asian EquityPlus Fund
Asian BondFund
Asian PropertySecurities
FundUS$ US$ US$ US$
8,246,892 (10,470,544) 4,096,311 –
891,976 7,627,238 989,469 577,066
– – – –– – – –
(3,509) – – –– (16,588,214) – –– – (304,502) –– – – (1,318,389)
– – (240,622) –
888,467 (8,960,976) 444,345 (741,323)
9,135,359 (19,431,520) 4,540,656 (741,323)
FIRST STATE GLOBAL UMBRELLA FUND P.L.C.
100

JOBNAME: 08081916 PAGE: 27 SESS: 20 OUTPUT: Mon Aug 18 12:43:17 2008
30-June-2007Total
AsianGrowth
Fund
ChinaGrowth
FundHigh QualityBond Fund
US$ US$ US$ US$
Undistributed income brought forward ........................... 45,811,746 8,484,878 12,282,274 14,790,957
Net investment income for the period before investmentand exchange gains/losses.......................................... 151,370,488 507,889 6,615,006 1,207,640
February 2007Distribution payable at US$0.1092 per share .................. (59,979) – (59,979) –Distribution payable at US$0.5876 per share .................. (29,699) – – (29,699)Distribution payable at US$0.4943 per share .................. (12,186,873) – – –Distribution payable at US$0.2968 per share .................. (180,721) – – –
Net investment income for the period after distribution... 138,913,216 507,889 6,555,027 1,177,941
Undistributed income carried forward ............................ 184,724,962 8,992,767 18,837,301 15,968,898
See Accompanying Notes to the Financial Statements
FIRST STATE GLOBAL UMBRELLA FUND P.L.C.
DISTRIBUTION STATEMENT (UNAUDITED)FOR THE PERIOD ENDED 30 JUNE 2007
101
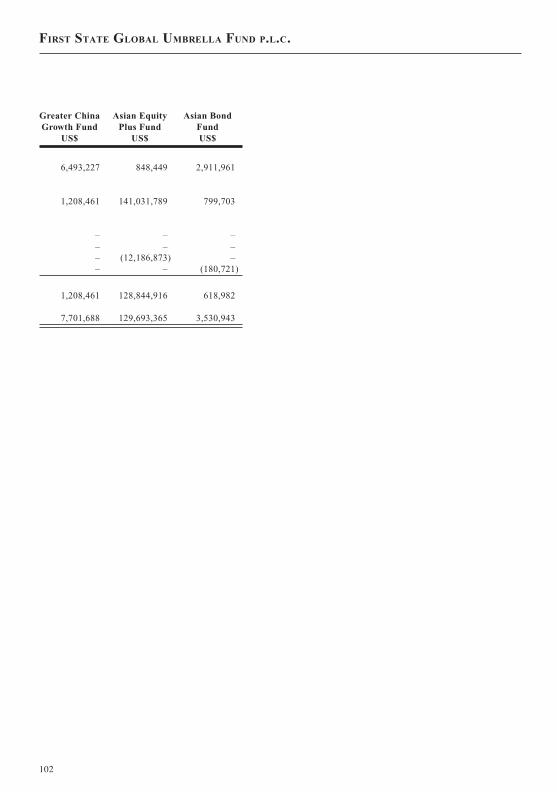
JOBNAME: 08081916 PAGE: 28 SESS: 20 OUTPUT: Mon Aug 18 12:43:17 2008
Greater ChinaGrowth Fund
Asian EquityPlus Fund
Asian BondFund
US$ US$ US$
6,493,227 848,449 2,911,961
1,208,461 141,031,789 799,703
– – –– – –– (12,186,873) –– – (180,721)
1,208,461 128,844,916 618,982
7,701,688 129,693,365 3,530,943
FIRST STATE GLOBAL UMBRELLA FUND P.L.C.
102

JOBNAME: 08081916 PAGE: 1 SESS: 20 OUTPUT: Mon Aug 18 12:43:17 2008
1. ORGANISATION
The Company was incorporated on 18 June1998 and registered in Ireland under the CompaniesActs, 1963 to 2006 and the European Communities(Undertakings for Collective Investment inTransferable Securities) Regulations, 2003 (asamended), as an umbrella type open-endedinvestment Company with variable capital. Theauthorised share capital is 30,000 Subscriber sharesof no par value and five hundred billionunclassified shares of no par value.
2. PRINCIPAL ACCOUNTING POLICIES
The significant accounting policies adopted bythe Company are as follows:
(a) Accounting Convention
The Financial Statements have been preparedunder the historical cost convention, as modified bythe revaluation of financial assets and liabilitiesheld at fair value through profit or loss.
The preparation of Financial Statementsrequires the use of accounting estimates. It alsorequires management to exercise its judgement inthe process of applying the Company’s accountingpolicies.
(b) Basis of Presentation
The format and certain wordings of theFinancial Statements have been adapted from thosecontained in the Companies (Amendment) Act1986 so that, in the opinion of the Directors, theymore appropriately reflect the nature of theCompany’s business as an investment fund.
The Financial Statements have been preparedin accordance with accounting standards generallyaccepted in Ireland and Irish statute comprising theCompanies Acts, 1963 to 2006 and the EuropeanCommunities (Undertakings for CollectiveInvestment in Transferable Securities) Regulations,2003 (as amended). Accounting standards generallyaccepted in Ireland in preparing FinancialStatements giving a true and fair view are those
published by the Institute of Chartered Accountantsin Ireland and issued by the Accounting StandardsBoard.
The preparation of financial statements inconformity with Generally Accepted AccountingPolicies in Ireland requires management to makeestimates and assumptions that affect the reportedamounts of assets and liabilities and disclosure ofcontingent assets and liabilities at the date of thefinancial statements and the reported amounts ofrevenues and expenses during the period. Actualresults could differ from those estimates. Theestimates and underlying assumptions are reviewedon an ongoing basis. Revisions to accountingestimates are recognised in the period in which theestimate is revised if the revision affects only thatperiod or in the period of the revision and futureperiods if the revision affects both current andfuture periods.
The format and certain wordings of theFinancial Statements have been adopted from thosecontained in the Companies (Amendment) Act1986 and FRS 3 “Reporting FinancialPerformance” so that, in the opinion of theDirectors, they more appropriately reflect thenature of the Company’s business as an investmentfund. The Company has availed of the exemptionavailable to open-ended investment funds underFRS 1, not to prepare a cash flow statement.
The Financial Statements are based on thevaluations prepared at 11:00am on 30 June 2008.For a number of funds these are based on pricesand include investment transactions up to 30 June2008. This method is in accordance with thevaluation policies outlined in the Fund’s offeringdocuments.
All references to net assets throughout thisdocument refer to net assets attributable toredeemable participating shareholders unlessotherwise stated.
FIRST STATE GLOBAL UMBRELLA FUND P.L.C.
NOTES FORMING PART OF THE FINANCIAL STATEMENTS
FOR THE PERIOD ENDED 30 JUNE 2008
103

JOBNAME: 08081916 PAGE: 2 SESS: 20 OUTPUT: Mon Aug 18 12:43:17 2008
2. PRINCIPAL ACCOUNTING POLICIES (CONTINUED)
(c) Financial Assets and Liabilities at Fair ValueThrough Profit or Loss
The Company has designated its investmentsinto the financial assets and liabilities at fair valuethrough profit or loss category. This category hastwo sub-categories: financial assets and liabilitiesheld for trading, and those designated bymanagement at fair value through profit and loss atinception. Financial assets or liabilities held fortrading are acquired or incurred principally for thepurpose of selling or repurchasing in the shortterm. All investments and derivative contracts havebeen categorised as held for trading.
Purchases and sales of investments arerecognised on trade date – the date on which theCompany commits to purchase or sell the asset.Investments are initially recognised at fair valueand are derecognised when the rights to receivecash flows from the investments have expired or theCompany has transferred substantially all risks andrewards of ownership. Transaction costs for allfinancial assets carried at fair value through profitand loss are expensed as incurred and included inthe Income Statement. Gains and losses arisingfrom changes in the fair value of the ’financialassets at fair value through profit or loss’ categoryare included in the Income Statement in the periodin which they arise.
(d) Valuation of Financial Assets and Liabilities
The fair value of financial assets andliabilities traded in active markets is based onquoted market prices at the period end date.Financial assets are valued at bid prices, whilefinancial liabilities are valued at offer prices. Ifmarket prices are unavailable or do not, in theopinion of the Directors, represent probablerealisation value, or if the securities are not listed,the value of the relevant securities is ascertained bythe Directors in good faith and with the approval ofthe Custodian.
As at 30 June 2008, there were investmentstotalling US$788,795 (representing 0.59% of NAV)for Indian Subcontinent Fund and investmentstotalling US$3,624,868 (representing 20.37% ofNAV) for Hong Kong Dollar Bond Fund, whichwere valued using a quote from a single broker, asan estimate of fair value.
Because of their inherent uncertainty,estimated fair values may differ significantly fromthe values that would have been used had a readymarket for these securities existed. These thinlytraded investments have a greater amount of riskand exposure to market volatility then many otherinvestments. These investments trade in a limitedmarket and may not be able to be immediatelyliquidated at these estimated fair values if needed.Furthermore, the estimated net realisable value ofthe Fund’s investments may be affected byeconomic and political developments in a specificcountry or region and those effects could bematerial to the financial statements.
(e) Foreign Currency Translation
(i) Functional and Presentation Currency
Items included in the Company’s financialstatements are measured using the US Dollar as, inthe opinion of the Directors, the US Dollar bestrepresents the economic effects of the underlyingtransactions, events and conditions applicable tothe Company. The Company has also adopted theUS Dollar as its presentation currency.
(ii) Transactions and balances
Monetary assets and liabilities denominated incurrencies other than the presentation currency aretranslated to the presentation currency at theclosing rates of exchange at period end.Transactions during the period, including purchasesand sales of securities, income and expenses, aretranslated at the rate of exchange prevailing on thedate of the transaction. Foreign currencytransaction gains and losses are included in theIncome Statement.
FIRST STATE GLOBAL UMBRELLA FUND P.L.C.
NOTES FORMING PART OF THE FINANCIAL STATEMENTS
FOR THE PERIOD ENDED 30 JUNE 2008 (CONTINUED)
104

JOBNAME: 08081916 PAGE: 3 SESS: 20 OUTPUT: Mon Aug 18 12:43:17 2008
2. PRINCIPAL ACCOUNTING POLICIES (CONTINUED)
(f) Income
Interest income is recognised in the incomestatement for all debt instruments using theeffective interest method.
The effective interest method is a method ofcalculating the amortised cost of a financial assetor financial liability and of allocating the interestincome or interest expense over the relevant period.The effective interest rate is the rate that exactlydiscounts estimated future cash payments orreceipts throughout the expected life of thefinancial instrument, or a shorter period whereappropriate, to the net carrying amount of thefinancial asset or liability. When calculating theeffective interest rate, the Company estimates cashflows considering all contractual terms of thefinancial instrument but does not consider futurecredit losses. The calculation includes all fees andpoints paid or received between parties to thecontract that are an integral part of the effectiveinterest rate, transaction costs and all otherpremiums or discounts.
Dividend income is credited to the incomestatement on the date on which the relevantsecurities are listed as “ex-dividend”. Dividendincome is shown gross of any non-recoverablewithholding taxes, which is disclosed separately inthe Income Statement, and net of any tax credits.
(g) Cash and Cash Equivalents
Cash and cash equivalents include cash inhand, deposits held at call with banks and bankoverdrafts.
(h) Due to and from Brokers
Amounts due to/from brokers representpayables for investments purchased and receivablesfor securities sold that have been contracted for butnot yet delivered by the end of the period.
These amounts are recognised initially at fairvalue and subsequently measured at amortised costusing the effective interest mentioned, lessprovision for impairment for amounts due frombrokers. A provision for impairment of amountsdue from brokers is established when there isobjective evidence that the Company will not beable to collect all amounts due from the relevantbroker. Significant financial difficulties of thebroker, probability that the broker will enterbankruptcy or financial reorganisation, and defaultsin payments are considered indicators that theamount due from brokers is impaired. Once afinancial asset or group of similar financial assetshas been written down as a result of an impairmentloss, interest income is recognised using the rate ofinterest used to discount the future cash flows forthe purpose of measuring the impairment loss.
(i) Distributions to Redeemable ParticipatingShareholders
Distributions to redeemable participatingshareholders are recognised in the IncomeStatement as finance costs. The Company iscertified as a distributing fund for the purposes ofUK Taxation for the year ended 31 December 2006.Certification is being sought for the year ended 31December 2007 for the following Funds: First StateAsian Growth Fund, First State China Growth Fund,First State Greater China Growth Fund, First StateAsian Equity Plus Fund and First State IndianSubcontinent Fund. At least 85% of the netinvestment income return of these Funds (i.e.income from dividends, interest or otherwise lessaccrued expenses) will be distributed. In addition,the Funds may distribute such part of any netrealised capital gains as is, in their opinion,appropriate to maintain a satisfactory level ofdistribution.
FIRST STATE GLOBAL UMBRELLA FUND P.L.C.
NOTES FORMING PART OF THE FINANCIAL STATEMENTS
FOR THE PERIOD ENDED 30 JUNE 2008 (CONTINUED)
105

JOBNAME: 08081916 PAGE: 4 SESS: 20 OUTPUT: Mon Aug 18 12:43:17 2008
2. PRINCIPAL ACCOUNTING POLICIES (CONTINUED)
(j) Redeemable Participating Shares
The Company issues redeemable participatingshares, which are redeemable at the holder’s optionand are classified as financial liabilities.Redeemable participating shares can be put back tothe Company at any time for cash equal to aproportionate share of the Company’s net assetvalue. The redeemable share is carried at theredemption amount that is payable at the balancesheet date if the holder exercises the right to put theshare back to the Company.
Redeemable participating shares are issuedand redeemed at the holder’s option at prices basedon the Company’s net assets value per share at thetime of issue or redemption. The Company’s netasset value per share is calculated by dividing thenet assets attributable to the holders of redeemableparticipating shares with the total number ofoutstanding redeemable participating shares. Inaccordance with the provisions of the Company’sregulations, investment positions are valued basedon the mid market price for the purpose ofdetermining the net asset value per share forsubscriptions and redemptions.
All issued redeemable participating shares arefully paid. The Company has no restrictions orspecific capital requirements on the subscriptionsand redemptions of participating shares. Therelevant movements are shown on the statement ofchanges in net assets attributable to participatingshareholders.
(k) Taxation
Under current law and practice, the Companyqualifies as an investment undertaking as definedin Section 739B of the Taxes Consolidation Act,1997, as amended. On that basis, it is notchargeable to Irish tax on its income and gains.
However, tax may arise on the happening of a“chargeable event”. A chargeable event includesany distribution payments to shareholders or anyencashment, redemption or transfer of shares. Notax will arise on the Company in respect ofchargeable events in respect of:
(i) a shareholder who is not Irish resident and notordinarily resident in Ireland for tax purposesat the time of the chargeable event, providedappropriate valid declarations in accordancewith the provisions of the Taxes ConsolidationAct, 1997, as amended, are held by theCompany; and
(ii) certain exempted Irish resident shareholderswho have provided the Company with thenecessary signed statutory declarations.
Dividend income and interest and any capitalgains received on investments made by theCompany may be subject to withholding taxesimposed by the country from which the investmentincome/gains are received and such taxes may notbe recoverable by the Company or its shareholders.
FIRST STATE GLOBAL UMBRELLA FUND P.L.C.
NOTES FORMING PART OF THE FINANCIAL STATEMENTS
FOR THE PERIOD ENDED 30 JUNE 2008 (CONTINUED)
106
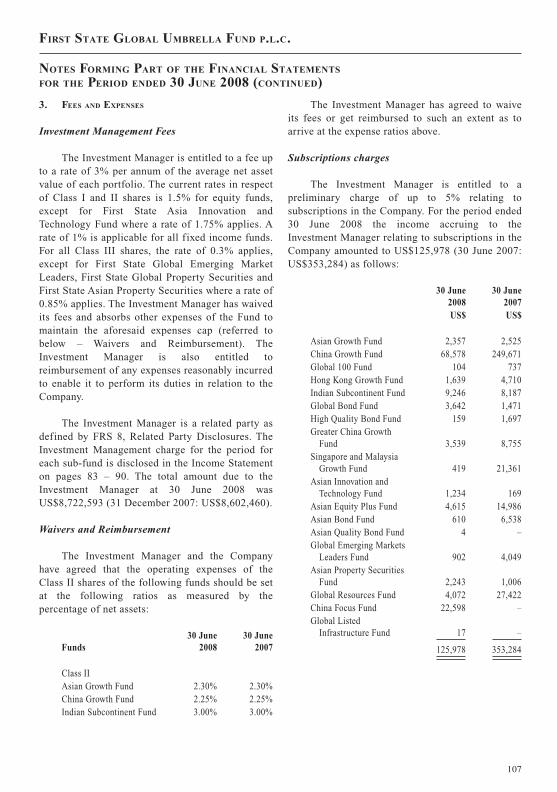
JOBNAME: 08081916 PAGE: 5 SESS: 20 OUTPUT: Mon Aug 18 12:43:17 2008
3. FEES AND EXPENSES
Investment Management Fees
The Investment Manager is entitled to a fee upto a rate of 3% per annum of the average net assetvalue of each portfolio. The current rates in respectof Class I and II shares is 1.5% for equity funds,except for First State Asia Innovation andTechnology Fund where a rate of 1.75% applies. Arate of 1% is applicable for all fixed income funds.For all Class III shares, the rate of 0.3% applies,except for First State Global Emerging MarketLeaders, First State Global Property Securities andFirst State Asian Property Securities where a rate of0.85% applies. The Investment Manager has waivedits fees and absorbs other expenses of the Fund tomaintain the aforesaid expenses cap (referred tobelow – Waivers and Reimbursement). TheInvestment Manager is also entitled toreimbursement of any expenses reasonably incurredto enable it to perform its duties in relation to theCompany.
The Investment Manager is a related party asdefined by FRS 8, Related Party Disclosures. TheInvestment Management charge for the period foreach sub-fund is disclosed in the Income Statementon pages 83 – 90. The total amount due to theInvestment Manager at 30 June 2008 wasUS$8,722,593 (31 December 2007: US$8,602,460).
Waivers and Reimbursement
The Investment Manager and the Companyhave agreed that the operating expenses of theClass II shares of the following funds should be setat the following ratios as measured by thepercentage of net assets:
Funds30 June
200830 June
2007
Class IIAsian Growth Fund 2.30% 2.30%China Growth Fund 2.25% 2.25%Indian Subcontinent Fund 3.00% 3.00%
The Investment Manager has agreed to waiveits fees or get reimbursed to such an extent as toarrive at the expense ratios above.
Subscriptions charges
The Investment Manager is entitled to apreliminary charge of up to 5% relating tosubscriptions in the Company. For the period ended30 June 2008 the income accruing to theInvestment Manager relating to subscriptions in theCompany amounted to US$125,978 (30 June 2007:US$353,284) as follows:
30 June2008
30 June2007
US$ US$
Asian Growth Fund 2,357 2,525China Growth Fund 68,578 249,671Global 100 Fund 104 737Hong Kong Growth Fund 1,639 4,710Indian Subcontinent Fund 9,246 8,187Global Bond Fund 3,642 1,471High Quality Bond Fund 159 1,697Greater China Growth
Fund 3,539 8,755Singapore and Malaysia
Growth Fund 419 21,361Asian Innovation and
Technology Fund 1,234 169Asian Equity Plus Fund 4,615 14,986Asian Bond Fund 610 6,538Asian Quality Bond Fund 4 –Global Emerging Markets
Leaders Fund 902 4,049Asian Property Securities
Fund 2,243 1,006Global Resources Fund 4,072 27,422China Focus Fund 22,598 –Global Listed
Infrastructure Fund 17 –
125,978 353,284
FIRST STATE GLOBAL UMBRELLA FUND P.L.C.
NOTES FORMING PART OF THE FINANCIAL STATEMENTS
FOR THE PERIOD ENDED 30 JUNE 2008 (CONTINUED)
107

JOBNAME: 08081916 PAGE: 6 SESS: 20 OUTPUT: Mon Aug 18 12:43:17 2008
3. FEES AND EXPENSES (CONTINUED)
Administration Fees
The Administrator is entitled to a fee from theCompany at a rate of 0.15% on balances up toUS$25 million, and 0.1% on balances in excess ofUS$25 million, and 0.8% per annum on balancesover US$50 million on the net asset valueattributable to Class I and Class II Shares. A flatfee of US$5,000 per annum per sub-fund for ClassIII shares will apply in respect of administrationservices provided.
The Administrator is entitled to a transactionfee of US$15 for processing of subscriptions,redemptions, transfers and othershareholder-related transactions. The Administratoris also entitled to charge US$30 in respect of eachinvestment transaction relating to the sale andpurchase of securities by the Investment Manageron behalf of the Fund
Custodian Fees
The Custodian is entitled to a fee from theCompany for Class I Class II and Class III shares,of 0.035% per annum on the average net asset valueof securities in developed markets and 0.08% perannum on the average net asset value per annum ofsecurities in emerging markets.
Directors’ Fees
Directors are entitled to remuneration for theirservices. Peter Blessing and Hans Vogel eachreceive US$25,000 (2007: US$25,000) per annumfor acting as Directors. All other Directorscurrently waive their entitlement to suchremuneration. The total Directors fees for theperiod ended 30 June 2008 were US$30,142 (30June 2007: US$27,497).
4. EXCHANGE RATES
The following exchange rates were used totranslate assets and liabilities into the reportingcurrency (United States Dollars) at 30 June 2008.
30 June2008
31 Dec2007
Argentinean Peso 3.08375 3.17125Australian Dollar 1.03595 1.13895Brazilian Real 1.60100 1.78170Chinese Renminbi 6.85440 7.30410Czech Koruna 15.14600 18.05600Canadian Dollar 1.00830 0.98230Danish Krone 4.71840 5.50688Euro 0.63259 0.67965Hong Kong Dollar 7.79750 7.79685Hungarian Forint 149.50000 171.40000Indian Rupee 42.97200 39.41500Indonesian Rupiah 9,220.00000 9,392.50000Israeli Shekel 3.33200 3.84500Japanese Yen 105.21500 112.05500Malaysian Ringgit 3.26600 3.30700Mexican Peso 10.29500 10.90400New Zealand Dollar 1.30762 1.29358Norwegian Krone 5.06030 5.41670Peruvian Sol 2.95950 2.99500Philippine Peso 44.95500 41.25000Singapore Dollar 1.35830 1.43800South African Rand 7.84180 6.80250South Korean Won 1046.00000 936.05000Sri Lankan Rupee 107.67500 108.65000Sterling Pound 0.50115 0.49894Swedish Krona 5.97725 6.40470Swiss Franc 1.01560 1.12510Taiwan Dollar 30.35300 32.43450Thai Baht 33.42500 33.68500Turkish Lira 1.22565 1.16410
5. SOFT COMMISSIONS
There were no soft commission arrangementsin place during the period. The Company makes useof commission sharing arrangements withbrokerage firms that sell shares or that provideresearch and advisory services to the Company.This may include situations where the dealingcommission on a particular trade or a series oftrades is shared between one or more providers ofexecution and/or research services. In this case aportion of the commission paid by the Company tothe executing broker is used to purchase third partyresearch or execution services.
FIRST STATE GLOBAL UMBRELLA FUND P.L.C.
NOTES FORMING PART OF THE FINANCIAL STATEMENTS
FOR THE PERIOD ENDED 30 JUNE 2008 (CONTINUED)
108

JOBNAME: 08081916 PAGE: 7 SESS: 20 OUTPUT: Mon Aug 18 12:43:17 2008
6. FINANCIAL ASSETS AND LIABILITIES AT FAIR VALUE THROUGH PROFIT OR LOSS
TotalAsia Growth
FundChina Growth
FundGlobal 100
FundHong Kong
Growth Fund
IndianSubcontinent
FundUK Growth
FundGlobal Bond
FundJune 2008 June 2008 June 2008 June 2008 June 2008 June 2008 June 2008 June 2008
US$ US$ US$ US$ US$ US$ US$ US$
Financial assets at fair valuethrough profit or loss
Held for trading:– Listed equity securities 5,290,023,244 168,638,792 2,149,380,305 55,213,341 123,651,840 128,603,914 – –– Listed debt securities 774,876,461 – – – – 87,266 – 25,014,925
Total financial assets at fairvalue through profit orloss 6,064,899,705 168,638,792 2,149,380,305 55,213,341 123,651,840 128,691,180 – 25,014,925
Financial liabilities at fairvalue through profit orloss
– Derivative contracts(Note 9) 51,587 – – – – – – –
Total financial liabilities atfair value through profitor loss 51,587 – – – – – – –
Dec 2007 Dec 2007 Dec 2007 Dec 2007 Dec 2007 Dec 2007 Dec 2007 Dec 2007US$ US$ US$ US$ US$ US$ US$ US$
Financial assets at fair valuethrough profit or lossHeld for trading:– Listed equity securities 6,596,226,514 170,064,352 3,163,934,202 60,860,286 165,382,727 190,876,257 213,924 –– Listed debt securities 692,063,648 – – – – – – 22,145,939
Total financial assets at fairvalue through profit orloss 7,288,290,162 170,064,352 3,163,934,202 60,860,286 165,382,727 190,876,257 213,924 22,145,939
FIRST STATE GLOBAL UMBRELLA FUND P.L.C.
NOTES FORMING PART OF THE FINANCIAL STATEMENTS
FOR THE PERIOD ENDED 30 JUNE 2008 (CONTINUED)
109

JOBNAME: 08081916 PAGE: 8 SESS: 20 OUTPUT: Mon Aug 18 12:43:17 2008
6. FINANCIAL ASSETS AND LIABILITIES AT FAIR VALUE THROUGH PROFIT OR LOSS (CONTINUED)
High QualityBond Fund
Long TermBond Fund
Greater ChinaGrowth Fund
Singapore andMalaysia
Growth Fund
AsiaInnovation
andTechnology
FundAsian Equity
Plus FundAsian Bond
FundAsian Quality
Bond FundJune 2008 June 2008 June 2008 June 2008 June 2008 June 2008 June 2008 June 2008
US$ US$ US$ US$ US$ US$ US$ US$Financial assets at fair value
through profit or lossHeld for trading:–Listed equity securities – – 381,573,580 74,307,836 85,505,719 1,398,775,541 – –– Listed debt securities 42,952,507 144,992,267 – – – – 21,022,709 471,689,547
Total financial assets at fairvalue through profit orloss 42,952,507 144,992,267 381,573,580 74,307,836 85,505,719 1,398,775,541 21,022,709 471,689,547
Financial liabilities at fairvalue through profit orloss
– Derivative contracts(Note 9) – – – – – – – 21,880
Total financial liabilities atfair value through profitor loss – – – – – – – 21,880
Dec 2007 Dec 2007 Dec 2007 Dec 2007 Dec 2007 Dec 2007 Dec 2007 Dec 2007US$ US$ US$ US$ US$ US$ US$ US$
Financial assets at fair valuethrough profit or lossHeld for trading:– Listed equity securities – – 507,592,608 104,507,186 129,171,634 1,362,572,338 – –– Listed debt securities 55,136,592 148,439,136 – – – – 23,077,102 373,145,304
Total financial assets at fairvalue through profit orloss 55,136,592 148,439,136 507,592,608 104,507,186 129,171,634 1,362,572,338 23,077,102 373,145,304
FIRST STATE GLOBAL UMBRELLA FUND P.L.C.
NOTES FORMING PART OF THE FINANCIAL STATEMENTS
FOR THE PERIOD ENDED 30 JUNE 2008 (CONTINUED)
110
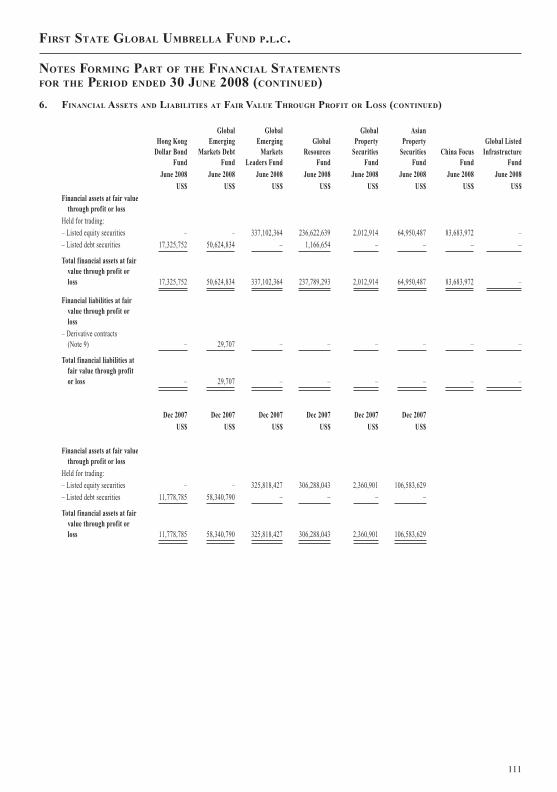
JOBNAME: 08081916 PAGE: 9 SESS: 20 OUTPUT: Mon Aug 18 12:43:17 2008
6. FINANCIAL ASSETS AND LIABILITIES AT FAIR VALUE THROUGH PROFIT OR LOSS (CONTINUED)
Hong KongDollar Bond
Fund
GlobalEmerging
Markets DebtFund
GlobalEmerging
MarketsLeaders Fund
GlobalResources
Fund
GlobalProperty
SecuritiesFund
AsianProperty
SecuritiesFund
China FocusFund
Global ListedInfrastructure
FundJune 2008 June 2008 June 2008 June 2008 June 2008 June 2008 June 2008 June 2008
US$ US$ US$ US$ US$ US$ US$ US$Financial assets at fair value
through profit or lossHeld for trading:– Listed equity securities – – 337,102,364 236,622,639 2,012,914 64,950,487 83,683,972 –– Listed debt securities 17,325,752 50,624,834 – 1,166,654 – – – –
Total financial assets at fairvalue through profit orloss 17,325,752 50,624,834 337,102,364 237,789,293 2,012,914 64,950,487 83,683,972 –
Financial liabilities at fairvalue through profit orloss
– Derivative contracts(Note 9) – 29,707 – – – – – –
Total financial liabilities atfair value through profitor loss – 29,707 – – – – – –
Dec 2007 Dec 2007 Dec 2007 Dec 2007 Dec 2007 Dec 2007US$ US$ US$ US$ US$ US$
Financial assets at fair valuethrough profit or loss
Held for trading:– Listed equity securities – – 325,818,427 306,288,043 2,360,901 106,583,629– Listed debt securities 11,778,785 58,340,790 – – – –
Total financial assets at fairvalue through profit orloss 11,778,785 58,340,790 325,818,427 306,288,043 2,360,901 106,583,629
FIRST STATE GLOBAL UMBRELLA FUND P.L.C.
NOTES FORMING PART OF THE FINANCIAL STATEMENTS
FOR THE PERIOD ENDED 30 JUNE 2008 (CONTINUED)
111

JOBNAME: 08081916 PAGE: 10 SESS: 20 OUTPUT: Mon Aug 18 12:43:17 2008
7. INCORPORATION AND SHARE CAPITAL
The authorised share capital of the Companyis equal to 30,000 Subscriber shares of no parvalue, and 500,000,000,000 Participating shares ofno par value. Subscriber shares are not entitled toany dividends or to participate in the profits of theCompany beyond the amount of capital paid up onissue. Subscriber shares in issue at 30 June 2008have not been included in the Financial Statements.Subscriber shareholders are entitled to one vote pershare held. The subscriber shareholders are FirstState (Hong Kong) LLC, First State Nominees(Hong Kong) Ltd and First State Investment (HongKong) Ltd.
Participating shares of the sub-funds areentitled to share in any dividends and profits ofthose specific sub-funds, and are redeemable at theoption of the shareholder.
Transactions in shares during the period wereas follows:
Subscriber shares
At At30 June
200830 June
2007
Issued at a price of €1.27 3 3
Participating Shares of no par value
At 31 Dec2007
SharesIssued
SharesRedeemed
At 30 June2008
Asian Growth FundClass I 5,162,936 1,305,984 (470,571) 5,998,349Class II 37,052 100 (3,924) 33,228Class III 841,856 – (2,775) 839,081Class I (Dist) 65,043 70 (6,240) 58,873
China Growth FundClass I 31,629,730 6,757,395 (8,878,269) 29,508,856Class II 27,301 – (1,250) 26,051Class I (Dist) 415,049 33,695 (122,976) 325,768
Global 100 FundClass I 5,286,411 2,006,014 (1,948,848) 5,343,577Class III 1,261,457 17,330 (20,317) 1,258,470
At 31 Dec2007
SharesIssued
SharesRedeemed
At 30 June2008
Hong Kong Growth FundClass I 2,673,249 721,596 (1,013,659) 2,381,186Class III 1,089,384 7,776 (51,412) 1,045,748
Indian Subcontinent FundClass I 4,847,971 1,085,682 (977,585) 4,956,068Class II 34,361 – – 34,361Class I (Dist) 22,604 5,909 (2,239) 26,274
UK Growth FundClass III 871,463 – (871,463) –
Global Bond FundClass I 806,706 1,153,380 (994,912) 965,174Class III 651,103 28,120 (33,257) 645,966
High Quality Bond FundClass III 3,478,675 9,432 (820,209) 2,667,898Class I (Dist) 82,457 157,623 (158,277) 81,803
Long Term Bond FundClass III 9,035,455 13,188 (400,293) 8,648,350
Greater China Growth FundClass I 9,635,860 849,103 (1,925,836) 8,559,127Class I (Dist) 56,200 896 (256) 56,840
Singapore and Malaysia Growth FundClass I 3,268,131 129,457 (651,101) 2,746,487
Asia Innovation and Technology FundClass I 5,010,973 275,823 (1,301,538) 3,985,258
Asian Equity Plus FundClass I 864,055 428,199 (101,555) 1,190,699Class I (Dist) 42,615,014 9,165,702 (1,873,919) 49,906,797
Asian Bond FundClass III 1,018,448 1,520 – 1,019,968Class I (Dist) 1,327,827 365,363 (800,324) 892,866
Asian Quality Bond FundClass I 35,457,438 9,135,201 (793,487) 43,799,152
Hong Kong Dollar Bond FundClass III 1,017,575 478,135 – 1,495,710
Global Emerging Markets Debt FundClass III 3,796,653 5,666 – 3,802,319
Global Emerging Markets Leaders FundClass I 5,603,021 2,143,983 (1,539,181) 6,207,823Class III 13,366,921 1,849,599 (674,236) 14,542,284
Global Resources FundClass I 20,641,275 2,787,533 (9,482,428) 13,946,380Class III 510,796 2,142 – 512,938
Global Property Securities FundClass III 250,000 – – 250,000
FIRST STATE GLOBAL UMBRELLA FUND P.L.C.
NOTES FORMING PART OF THE FINANCIAL STATEMENTS
FOR THE PERIOD ENDED 30 JUNE 2008 (CONTINUED)
112

JOBNAME: 08081916 PAGE: 11 SESS: 20 OUTPUT: Mon Aug 18 12:43:17 2008
7. INCORPORATION AND SHARE CAPITAL (CONTINUED)
At 31 Dec2007
SharesIssued
SharesRedeemed
At 30 June2008
Asian Property Securities FundClass I 49,503 – – 49,503Class III 1,674,328 154,385 (719,018) 1,109,695Class I (Dist) 9,329,029 262,886 (1,634,659) 7,957,256
China Focus FundClass I – 13,225,596 (4,081,217) 9,144,379
Global Listed Infrastructure FundClass I (Dist) – 3,924,984 (1,277) 3,923,707
Asian Growth FundClass I 5,711,809 1,492,334 (2,030,345) 5,173,798Class II 42,448 – (3,861) 38,587Class III 876,796 512 (22,883) 854,425Class I (Dist) 136,926 2,723 (87,383) 52,266
China Growth FundClass I 22,751,576 12,348,876 (11,178,801) 23,921,651Class II 135,421 – (105,161) 30,260Class I (Dist) 603,418 234,630 (279,473) 558,575
Global 100 FundClass I 7,313,660 243,173 (1,505,931) 6,050,902Class III 1,358,264 24,469 (73,470) 1,309,263
Hong Kong Growth FundClass I 1,583,472 689,787 (379,577) 1,893,682Class III 1,356,138 7,572 (152,359) 1,211,351
Indian Subcontinent FundClass I 5,653,798 955,580 (2,154,159) 4,455,219Class II 43,996 – (6,572) 37,424Class I (Dist) 26,648 401 (4,445) 22,604
UK Growth FundClass III 1,223,427 1,729 (31,579) 1,193,577
Global Bond FundClass I 676,655 251,431 (243,982) 684,104Class III 727,709 52,729 (117,673) 662,765
High Quality Bond FundClass III 3,455,624 35,820 (22,330) 3,469,114Class I (Dist) 37,059 65,428 (66,688) 35,799
Long Term Bond FundClass III 9,024,853 13,309 (16,614) 9,021,548
Greater China Growth FundClass I 9,464,397 1,568,491 (2,868,669) 8,164,219Class I (Dist) 31,648 24,390 – 56,038
Singapore and Malaysia Growth FundClass I 1,847,360 4,877,519 (1,322,469) 5,402,410
Asia Innovation and Technology FundClass I 2,553,516 571,522 (556,182) 2,568,856
At 31 Dec2007
SharesIssued
SharesRedeemed
At 30 June2008
Asian Equity Plus FundClass I 693,979 244,935 (65,344) 873,570Class I (Dist) 24,232,565 81,049,585 (76,773,315) 28,508,835
Asian Bond FundClass III 1,015,375 1,487 – 1,016,862Class I (Dist) 446,719 1,710,491 (539,791) 1,617,419
Asian Quality Bond FundClass I 12,730,859 6,896,473 (243,762) 19,383,570
Hong Kong Dollar Bond FundClass III 1,014,534 1,505 – 1,016,039
Global Emerging Markets Debt FundClass III 1,894,522 1,896,428 – 3,790,950
Global Emerging Markets Leaders FundClass I 11,092,410 553,813 (5,299,493) 6,346,730Class III 4,000,000 3,305,568 – 7,305,568
Global Resources FundClass I – 30,494,083 (7,916,575) 22,577,508Class III 507,424 1,499 – 508,923
Global Property Securities FundClass III 500,000 – – 500,000
Asian Property Securities FundClass I 44,686 – – 44,686Class III 500,000 912,555 (183) 1,412,372
8. RISK ARISING FROM FINANCIAL INSTRUMENTS
The Company’s investment objective is toseek capital growth from a portfolio of securitiesdrawn from markets external to Ireland. Theholding of securities, investing activities andassociated financing undertaken pursuant to thisobjective involves certain inherent risks. Below is adescription of the principal risks inherent in theCompany’s activities along with the actions it hastaken to manage these risks.
The Company’s assets and liabilities comprisefinancial instruments which include:
� Investments including equity and non-equityshares, fixed income securities, and floatingrate securities. These are held in accordancewith the Company’s investment objective andpolicies;
FIRST STATE GLOBAL UMBRELLA FUND P.L.C.
NOTES FORMING PART OF THE FINANCIAL STATEMENTS
FOR THE PERIOD ENDED 30 JUNE 2008 (CONTINUED)
113

JOBNAME: 08081916 PAGE: 12 SESS: 20 OUTPUT: Mon Aug 18 12:43:17 2008
8. RISK ARISING FROM FINANCIAL INSTRUMENTS
(CONTINUED)
� Borrowings/debenture stock/floating ratenotes/term loans the main purpose of which isto raise finance for the Company’s investmentactivities; and
� Cash, liquid resources and short-term debtorsand creditors that arise directly from itsinvestment activities;
As an investment fund, the Company buys,sells or holds financial assets and liabilities inorder to take advantage of changes in market pricesor rates.
The main risks arising from the Company’soperations are market risk comprising equity pricerisk, foreign currency risk, interest rate risk andalso credit risk and liquidity risk. The Boardreviews and agrees policies for managing each ofthese risks and they are summarised below. Thesepolicies have remained substantially unchangedsince the beginning of the period to which theseFinancial Statements relate.
(a) Equity Price Risk
Equity price risk is the risk that the fair valuesof equities or future cash flows of a financialinstrument will fluctuate because of changes inmarket prices (other than those arising frominterest rate risk or currency risk).
The investments of the Company are subject tonormal market fluctuations and the risks inherent ininvestment in international securities markets andthere can be no assurances that appreciation willoccur. It is the policy of the Investment Manager tomaintain a diversified portfolio of investments foreach Fund so as to minimise risk.
The Company strives to invest in strongbusinesses with quality management and at sensibleprices. The Company’s preferred strategy is to holdequity investments for the medium-to-long term.The Investment Manager is therefore not concernedby short-term equity price volatility with respect to
its investments provided that the underlyingbusiness, economic and management characteristicsof its investments remains favourable.
The carrying values of investments subject toequity price risk are, in almost all instances, basedon quoted market prices as of the balance sheetdates. Market prices are subject to fluctuation and,consequently, the amount realised in the subsequentsale of an investment may significantly differ fromthe reported market value. Fluctuation in themarket price of a security may result fromperceived changes in the underlying economiccharacteristics of the investment, the relative priceof alternative investments and general marketconditions. Furthermore, amounts realised in thesale of a particular security may be affected by therelative quantity of the security being sold.
The Investment Manager manages theexposure to equity price risk by constructing adiversified portfolio from which it expects theunderlying companies it invests in to performdifferently in reaction to different risk influences.The Investment Manager monitors the equity pricerisk in the Fund’s portfolios through both thevolatility of the underlying holdings and theircombined volatility, both at an absolute level andrelative to each Fund’s benchmark. The InvestmentManager expects portfolios to carry a certain levelof equity price risk and uses such risk measurementto highlight unintended risks in the portfolio.
The table below summarises the effect on thenet assets attributable to redeemable participatingshareholders for equity funds, as at 30 June 2008and 31 December 2007, of a reasonably possiblechange in the benchmark market indices as appliedto the respective beta reported by Lipper.
FIRST STATE GLOBAL UMBRELLA FUND P.L.C.
NOTES FORMING PART OF THE FINANCIAL STATEMENTS
FOR THE PERIOD ENDED 30 JUNE 2008 (CONTINUED)
114
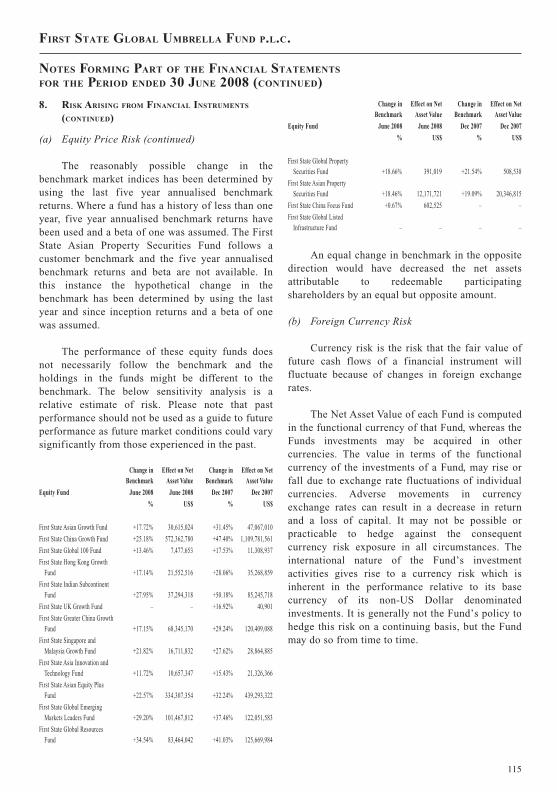
JOBNAME: 08081916 PAGE: 13 SESS: 20 OUTPUT: Mon Aug 18 12:43:17 2008
8. RISK ARISING FROM FINANCIAL INSTRUMENTS
(CONTINUED)
(a) Equity Price Risk (continued)
The reasonably possible change in thebenchmark market indices has been determined byusing the last five year annualised benchmarkreturns. Where a fund has a history of less than oneyear, five year annualised benchmark returns havebeen used and a beta of one was assumed. The FirstState Asian Property Securities Fund follows acustomer benchmark and the five year annualisedbenchmark returns and beta are not available. Inthis instance the hypothetical change in thebenchmark has been determined by using the lastyear and since inception returns and a beta of onewas assumed.
The performance of these equity funds doesnot necessarily follow the benchmark and theholdings in the funds might be different to thebenchmark. The below sensitivity analysis is arelative estimate of risk. Please note that pastperformance should not be used as a guide to futureperformance as future market conditions could varysignificantly from those experienced in the past.
Change inBenchmark
Effect on NetAsset Value
Change inBenchmark
Effect on NetAsset Value
Equity Fund June 2008 June 2008 Dec 2007 Dec 2007
% US$ % US$
First State Asian Growth Fund +17.72% 30,615,024 +31.45% 47,067,010
First State China Growth Fund +25.18% 572,362,780 +47.40% 1,109,781,561
First State Global 100 Fund +13.46% 7,477,653 +17.53% 11,308,937
First State Hong Kong GrowthFund +17.14% 21,552,516 +28.06% 35,268,859
First State Indian SubcontinentFund +27.95% 37,294,318 +50.18% 85,245,718
First State UK Growth Fund – – +16.92% 40,901
First State Greater China GrowthFund +17.15% 68,345,170 +29.24% 120,409,088
First State Singapore andMalaysia Growth Fund +21.82% 16,711,832 +27.62% 28,864,885
First State Asia Innovation andTechnology Fund +11.72% 10,657,347 +15.43% 21,326,366
First State Asian Equity PlusFund +22.57% 334,307,354 +32.24% 439,293,322
First State Global EmergingMarkets Leaders Fund +29.20% 101,467,812 +37.46% 122,051,583
First State Global ResourcesFund +34.54% 83,464,042 +41.03% 125,669,984
Change inBenchmark
Effect on NetAsset Value
Change inBenchmark
Effect on NetAsset Value
Equity Fund June 2008 June 2008 Dec 2007 Dec 2007
% US$ % US$
First State Global PropertySecurities Fund +18.66% 391,019 +21.54% 508,538
First State Asian PropertySecurities Fund +18.46% 12,171,721 +19.09% 20,346,815
First State China Focus Fund +0.67% 602,525 – –
First State Global ListedInfrastructure Fund – – – –
An equal change in benchmark in the oppositedirection would have decreased the net assetsattributable to redeemable participatingshareholders by an equal but opposite amount.
(b) Foreign Currency Risk
Currency risk is the risk that the fair value offuture cash flows of a financial instrument willfluctuate because of changes in foreign exchangerates.
The Net Asset Value of each Fund is computedin the functional currency of that Fund, whereas theFunds investments may be acquired in othercurrencies. The value in terms of the functionalcurrency of the investments of a Fund, may rise orfall due to exchange rate fluctuations of individualcurrencies. Adverse movements in currencyexchange rates can result in a decrease in returnand a loss of capital. It may not be possible orpracticable to hedge against the consequentcurrency risk exposure in all circumstances. Theinternational nature of the Fund’s investmentactivities gives rise to a currency risk which isinherent in the performance relative to its basecurrency of its non-US Dollar denominatedinvestments. It is generally not the Fund’s policy tohedge this risk on a continuing basis, but the Fundmay do so from time to time.
FIRST STATE GLOBAL UMBRELLA FUND P.L.C.
NOTES FORMING PART OF THE FINANCIAL STATEMENTS
FOR THE PERIOD ENDED 30 JUNE 2008 (CONTINUED)
115

JOBNAME: 08081916 PAGE: 14 SESS: 20 OUTPUT: Mon Aug 18 12:43:17 2008
8. RISK ARISING FROM FINANCIAL INSTRUMENTS
(CONTINUED)
(b) Foreign Currency Risk (continued)
The First State High Quality Bond Fund, FirstState Long Term Bond Fund and the First StateAsian Bond Fund acquire their investments in thefunctional currency; all other Funds acquireinvestments in a range of currencies other than thefunctional currency. The following tables set outthe total exposure to foreign currency risk in allfunds with non-US Dollar exposure at 30 June 2008with comparative figures as at 31 December 2007.These tables also show the effect of an estimated5% change in the underlying exchange ratesapplied immediately and uniformly across allcurrencies. In considering this analysis however, itshould be noted that the Investment Manager hasnot applied this 5% change to the Hong KongDollar, the Malaysian Ringgitt and the ChinaRenminbi as these currencies are strongly linked tothe US Dollar. Therefore the Investment Managerwould expect these currencies to move in line withthe US Dollar. The changes in value do notnecessarily reflect the best or worst case scenariosand actual results may differ.
First State Asian Growth Fund
Currency30 June 2008
Non-Monetary30 June 2008
Monetary
Change inCurrency
RateEffect on Net
Asset ValueUS$ US$ % US$
Australian Dollar 49,903,111 – – –Hong Kong Dollar 11,257,740 12,581 – –Indian Rupee 17,706,409 – – –Korean Won 2,776,701 245 +5 12Malaysian Ringgit 18,314,909 15,346 – –Phillipine Peso 19,916,969 12,749 +5 637Singapore Dollar 28,577,089 (446,611) +5 (22,331)Taiwan Dollar 7,395,167 526,832 +5 26,342Thai Baht 11,455,110 – – –
167,303,205 121,142 4,660
First State Asian Growth Fund
Currency30 June 2007
Non-Monetary30 June 2007
Monetary
Change inCurrency
RateEffect on Net
Asset ValueUS$ US$ % US$
Hong Kong Dollar 61,827,472 (62) – –Indian Rupee 11,465,661 – – –Malaysian Ringgitt 20,533,824 57,622 – –Philippine Peso 3,832,798 7,841 +5 392Singapore Dollar 19,175,035 40,851 +5 2,043South Korean Won 22,913,088 262 +5 13Taiwan Dollar 22,302,565 2,974,293 +5 148,715Thai Baht 6,113,626 – – –
168,164,069 3,080,807 151,163
First State China Growth Fund
Currency30 June 2008
Non-Monetary30 June 2008
Monetary
Change inCurrency
RateEffect on Net
Asset ValueUS$ US$ % US$
Australian Dollar 27,419,290 4,568 +5 228Chinese Renminbi – 2,896,872 – –Euro 2,861,253 – – –Hong Kong Dollar 2,111,148,853 (10,176,175) – –Singapore Dollar 7,950,909 – – –Sterling Pound – 1 +5 –
2,149,380,305 (7,274,734) 228
First State China Growth Fund
Currency30 June 2007
Non-Monetary30 June 2007
Monetary
Change inCurrency
RateEffect on Net
Asset ValueUS$ US$ % US$
China Renminbi – 654,187 – –Euro 4,311,042 – – –Hong Kong Dollar 3,111,942,009 641,121 – –Singapore Dollar 40,366,106 – – –Sterling Pound – 69 +5 3
3,156,619,157 1,295,377 3
FIRST STATE GLOBAL UMBRELLA FUND P.L.C.
NOTES FORMING PART OF THE FINANCIAL STATEMENTS
FOR THE PERIOD ENDED 30 JUNE 2008 (CONTINUED)
116

JOBNAME: 08081916 PAGE: 15 SESS: 20 OUTPUT: Mon Aug 18 12:43:17 2008
8. RISK ARISING FROM FINANCIAL INSTRUMENTS
(CONTINUED)
(b) Foreign Currency Risk (continued)
First State Global 100 Fund
Currency30 June 2008
Non-Monetary30 June 2008
Monetary
Change inCurrency
RateEffect on Net
Asset ValueUS$ US$ % US$
Canadian Dollar 704,378 (10,530) +5 (527)Denmark Kroner 969,227 – – –Euro 9,624,508 (77,659) +5 (3,883)Hong Kong Dollar 1,463,105 (20,807) – –Japanese Yen 4,281,433 197,302 +5 9,865Norwegian Krone 1,002,407 (8,001) +5 (400)South Korean Won – 2 +5 –Sterling Pound 4,846,181 624,424 +5 31,221Swiss Franc 3,552,826 7,952 +5 398Taiwan Dollar – 70,229 +5 3,511
26,444,065 782,912 40,185
First State Global 100 Fund
Currency30 June 2007
Non-Monetary30 June 2007
Monetary
Change inCurrency
RateEffect on Net
Asset ValueUS$ US$ % US$
Canadian Dollar 1,279,566 1,992 +5 100Denmark Kroner 1,521,859 – – –Euro 14,750,532 – – –Hong Kong Dollar 1,206,641 55 – –Japanese Yen 4,543,242 – – –Norwegian Krone 1,307,078 – – –South Korean Won 417,023 3 +5 –Sterling Pound 4,248,176 669,373 +5 33,469Swiss Franc 3,173,999 – – –Taiwan Dollar – 65,656 +5 3,283
32,448,116 737,079 36,852
First State Hong Kong Growth Fund
Currency30 June 2008
Non-Monetary30 June 2008
Monetary
Change inCurrency
RateEffect on Net
Asset ValueUS$ US$ % US$
Chinese Renminbi – 33,663 – –Hong Kong Dollar 114,664,851 151,264 – –
114,664,851 184,927 –
First State Hong Kong Growth Fund
Currency30 June 2007
Non-Monetary30 June 2007
Monetary
Change inCurrency
RateEffect on Net
Asset ValueUS$ US$ % US$
Hong Kong Dollar 158,380,486 1,450,700 – –
158,380,486 1,450,700 –
First State Indian Subcontinent Fund
Currency30 June 2008
Non-Monetary30 June 2008
Monetary
Change inCurrency
RateEffect on Net
Asset ValueUS$ US$ % US$
Indian Rupee 118,274,102 304,152 +5 15,208Singapore Dollar 2,058,014 – – –Sri Lankan Rupee 8,359,064 51,189 +5 2,559
128,691,180 355,341 17,767
First State Indian Subcontinent Fund
Currency30 June 2007
Non-Monetary30 June 2007
Monetary
Change inCurrency
RateEffect on Net
Asset ValueUS$ US$ % US$
Indian Rupee 176,175,577 1,023,020 +5 51,151Singapore Dollar 1,474,047 – – –Sri Lankan Rupee 7,911,222 42,108 +5 2,105Sterling Pound 5,220,270 – – –
190,781,116 1,065,128 53,256
First State UK Growth Fund
Currency30 June 2007
Non-Monetary30 June 2007
Monetary
Change inCurrency
RateEffect on Net
Asset ValueUS$ US$ % US$
Sterling Pound 213,924 22,303 +5 1,115
213,924 22,303 1,115
FIRST STATE GLOBAL UMBRELLA FUND P.L.C.
NOTES FORMING PART OF THE FINANCIAL STATEMENTS
FOR THE PERIOD ENDED 30 JUNE 2008 (CONTINUED)
117

JOBNAME: 08081916 PAGE: 16 SESS: 20 OUTPUT: Mon Aug 18 12:43:17 2008
8. RISK ARISING FROM FINANCIAL INSTRUMENTS
(CONTINUED)
(b) Foreign Currency Risk (continued)
First State Global Bond Fund
Currency30 June 2008
Non-Monetary30 June 2008
Monetary
Change inCurrency
RateEffect on Net
Asset ValueUS$ US$ % US$
Australian Dollar – 35 +5 2Canadian Dollar – 458,469 +5 22,923Danish Krone – 48,745 +5 2,437Euro – 10,568,489 +5 528,424Japanese Yen – 7,578,241 +5 378,912New Zealand Dollar – 1 +5 –Sterling Pound – 1,780,138 +5 89,007Swedish Krona – 242,751 +5 12,138
– 20,676,869 1,033,843
First State Global Bond Fund
Currency30 June 2007
Non-Monetary30 June 2007
Monetary
Change inCurrency
RateEffect on Net
Asset ValueUS$ US$ % US$
Australian Dollar – 32 +5 2Canadian Dollar – 454,215 +5 22,711Danish Krone – 45,375 +5 2,269Euro – 9,347,027 +5 467,351Japanese Yen – 6,365,599 +5 318,280New Zealand Dollar – 2 +5 –Sterling Pound – 1,344,526 +5 67,226Swedish Krona – 230,127 +5 11,506
– 17,786,903 889,345
First State Greater China Growth Fund
Currency30 June 2008
Non-Monetary30 June 2008
Monetary
Change inCurrency
RateEffect on Net
Asset ValueUS$ US$ % US$
Chinese Renminbi – 167,866 – –Hong Kong Dollar 258,225,446 (1,106,055) – –Taiwan Dollar 104,847,837 7,982,757 +5 399,138
363,073,283 7,044,568 399,138
First State Greater China Growth Fund
Currency30 June 2007
Non-Monetary30 June 2007
Monetary
Change inCurrency
RateEffect on Net
Asset ValueUS$ US$ % US$
Hong Kong Dollar 386,352,369 17,757 – –Taiwan Dollar 105,311,105 4,104,993 +5 205,250
491,663,474 4,122,750 205,250
First State Singapore and Malaysia GrowthFund
Currency30 June 2008
Non-Monetary30 June 2008
Monetary
Change inCurrency
RateEffect on Net
Asset ValueUS$ US$ % US$
Hong Kong Dollar 1,490,370 – – –Malaysian Ringgitt 29,041,068 287,697 – –Philippine Peso 2,113,597 – – –Singapore Dollar 39,100,733 32 +5 2Thai Baht 221,269 – – –
71,967,037 287,729 2
First State Singapore and Malaysia GrowthFund
Currency30 June 2007
Non-Monetary30 June 2007
Monetary
Change inCurrency
RateEffect on Net
Asset ValueUS$ US$ % US$
Hong Kong Dollar 2,104,369 7 – –Indonesia Rupiahs 277,881 – – –Malaysian Ringgitt 46,836,018 94,990 – –Philippine Peso 1,814,952 – – –Singapore Dollar 50,763,072 34,561 +5 1,728Thai Baht 240,053 – – –
102,036,345 129,558 1,728
FIRST STATE GLOBAL UMBRELLA FUND P.L.C.
NOTES FORMING PART OF THE FINANCIAL STATEMENTS
FOR THE PERIOD ENDED 30 JUNE 2008 (CONTINUED)
118

JOBNAME: 08081916 PAGE: 17 SESS: 20 OUTPUT: Mon Aug 18 12:43:17 2008
8. RISK ARISING FROM FINANCIAL INSTRUMENTS
(CONTINUED)
(b) Foreign Currency Risk (continued)
First State Asia Innovation and Technology Fund
Currency30 June 2008
Non-Monetary30 June 2008
Monetary
Change inCurrency
RateEffect on Net
Asset ValueUS$ US$ % US$
Chinese Renminbi – 12,173 – –Hong Kong Dollar 22,462,534 (128,226) – –Indian Rupee 2,861,693 304,413 +5 15,221Malaysian Ringgitt 2,748,182 – – –Singapore Dollar 9,747,434 (298,456) +5 (14,923)South Korean Won 22,531,899 436,366 +5 21,818Taiwan Dollar 25,153,978 1,638,214 +5 81,911
85,505,720 1,964,484 104,027
First State Asia Innovation and Technology Fund
Currency30 June 2007
Non-Monetary30 June 2007
Monetary
Change inCurrency
RateEffect on Net
Asset ValueUS$ US$ % US$
Hong Kong Dollar 36,135,586 – – –Indian Rupee 5,668,503 – – –Malaysian Ringgitt 7,814,226 30,791 – –Singapore Dollar 11,113,046 39,489 +5 1,974South Korean Won 37,051,109 124 +5 6Taiwan Dollar 29,667,164 585,917 +5 29,296
127,449,634 656,321 31,276
First State Asian Equity Plus Fund
Currency30 June 2008
Non-Monetary30 June 2008
Monetary
Change inCurrency
RateEffect on Net
Asset ValueUS$ US$ % US$
Australian Dollar 119,877,296 – – –Chinese Renminbi – 179,118 – –Hong Kong Dollar 454,530,782 550,210 – –Indian Rupee 87,538,350 624,721 +5 31,236Malaysian Ringgit 113,900,328 219,090 – –Phillipine Peso 31,393,086 (8,770,271) +5 (438,514)Singapore Dollar 180,485,449 84 +5 4South Korean Won 92,073,015 73 +5 4Sri Lankan Rupee 8,976,706 52,932 +5 2,647Taiwan Dollar 229,847,331 15,895,784 +5 794,789Thai Baht 43,963,876 – – –
1,362,586,219 8,751,741 390,166
First State Asian Equity Plus Fund
Currency30 June 2007
Non-Monetary30 June 2007
Monetary
Change inCurrency
RateEffect on Net
Asset ValueUS$ US$ % US$
Australian Dollar 140,988,260 – – –Hong Kong Dollar 482,768,586 545,534 – –Indian Rupee 101,223,116 – – –Malaysian Ringgitt 106,568,616 335,871 – –Philippine Peso 32,440,147 – – –Singapore Dollar 139,237,418 495,939 +5 24,797South Korean Won 81,722,638 44 +5 2Sri Lankan Rupee 10,186,286 127,492 +5 6,375Taiwan Dollar 182,026,904 10,454,828 +5 522,741Thai Baht 54,813,556 – – –
1,331,975,527 11,959,708 553,915
First State Asian Quality Bond Fund
Currency30 June 2008
Non-Monetary30 June 2008
Monetary
Change inCurrency
RateEffect on Net
Asset ValueUS$ US$ % US$
Malaysian Ringgitt – 386,785 – –Singapore Dollar – 3,662,524 +5 183,126
– 4,049,309 183,126
FIRST STATE GLOBAL UMBRELLA FUND P.L.C.
NOTES FORMING PART OF THE FINANCIAL STATEMENTS
FOR THE PERIOD ENDED 30 JUNE 2008 (CONTINUED)
119
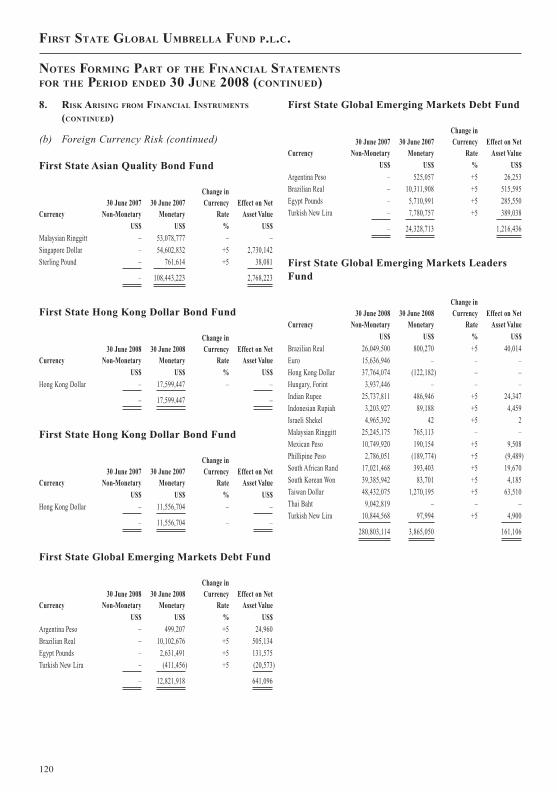
JOBNAME: 08081916 PAGE: 18 SESS: 20 OUTPUT: Mon Aug 18 12:43:17 2008
8. RISK ARISING FROM FINANCIAL INSTRUMENTS
(CONTINUED)
(b) Foreign Currency Risk (continued)
First State Asian Quality Bond Fund
Currency30 June 2007
Non-Monetary30 June 2007
Monetary
Change inCurrency
RateEffect on Net
Asset ValueUS$ US$ % US$
Malaysian Ringgitt – 53,078,777 – –Singapore Dollar – 54,602,832 +5 2,730,142Sterling Pound – 761,614 +5 38,081
– 108,443,223 2,768,223
First State Hong Kong Dollar Bond Fund
Currency30 June 2008
Non-Monetary30 June 2008
Monetary
Change inCurrency
RateEffect on Net
Asset ValueUS$ US$ % US$
Hong Kong Dollar – 17,599,447 – –
– 17,599,447 –
First State Hong Kong Dollar Bond Fund
Currency30 June 2007
Non-Monetary30 June 2007
Monetary
Change inCurrency
RateEffect on Net
Asset ValueUS$ US$ % US$
Hong Kong Dollar – 11,556,704 – –
– 11,556,704 – –
First State Global Emerging Markets Debt Fund
Currency30 June 2008
Non-Monetary30 June 2008
Monetary
Change inCurrency
RateEffect on Net
Asset ValueUS$ US$ % US$
Argentina Peso – 499,207 +5 24,960Brazilian Real – 10,102,676 +5 505,134Egypt Pounds – 2,631,491 +5 131,575Turkish New Lira – (411,456) +5 (20,573)
– 12,821,918 641,096
First State Global Emerging Markets Debt Fund
Currency30 June 2007
Non-Monetary30 June 2007
Monetary
Change inCurrency
RateEffect on Net
Asset ValueUS$ US$ % US$
Argentina Peso – 525,057 +5 26,253Brazilian Real – 10,311,908 +5 515,595Egypt Pounds – 5,710,991 +5 285,550Turkish New Lira – 7,780,757 +5 389,038
– 24,328,713 1,216,436
First State Global Emerging Markets LeadersFund
Currency30 June 2008
Non-Monetary30 June 2008
Monetary
Change inCurrency
RateEffect on Net
Asset ValueUS$ US$ % US$
Brazilian Real 26,049,500 800,270 +5 40,014Euro 15,636,946 – – –Hong Kong Dollar 37,764,074 (122,182) – –Hungary, Forint 3,937,446 – – –Indian Rupee 25,737,811 486,946 +5 24,347Indonesian Rupiah 3,203,927 89,188 +5 4,459Israeli Shekel 4,965,392 42 +5 2Malaysian Ringgitt 25,245,175 765,113 – –Mexican Peso 10,749,920 190,154 +5 9,508Phillipine Peso 2,786,051 (189,774) +5 (9,489)South African Rand 17,021,468 393,403 +5 19,670South Korean Won 39,385,942 83,701 +5 4,185Taiwan Dollar 48,432,075 1,270,195 +5 63,510Thai Baht 9,042,819 – – –Turkish New Lira 10,844,568 97,994 +5 4,900
280,803,114 3,865,050 161,106
FIRST STATE GLOBAL UMBRELLA FUND P.L.C.
NOTES FORMING PART OF THE FINANCIAL STATEMENTS
FOR THE PERIOD ENDED 30 JUNE 2008 (CONTINUED)
120

JOBNAME: 08081916 PAGE: 19 SESS: 20 OUTPUT: Mon Aug 18 12:43:17 2008
8. RISK ARISING FROM FINANCIAL INSTRUMENTS
(CONTINUED)
(b) Foreign Currency Risk (continued)
First State Global Emerging Markets LeadersFund
Currency30 June 2007
Non-Monetary30 June 2007
Monetary
Change inCurrency
RateEffect on Net
Asset ValueUS$ US$ % US$
Brazilian Real 18,945,723 198,739 +5 9,937Euro 13,964,275 – – –Hong Kong Dollar 46,656,084 (262) – –Hungary, Forint 3,564,177 – – –Indian Rupee 19,826,502 – – –Indonesian Rupiah 3,353,107 – – –Israeli Shekel 5,983,455 36 +5 2Malaysian Ringgitt 34,127,121 191,921 – –Mexican Peso 10,729,778 – – –Phillipine Peso 3,494,092 (308,848) +5 (15,442)South African Rand 18,710,944 – – –South Korean Won 36,265,378 (3,328,383) +5 (166,419)Taiwan Dollar 35,409,921 3,570,142 +5 178,507Thai Baht 9,395,449 (677,771) +5 (33,889)Turkish New Lira 12,058,052 – – –
272,484,058 (354,426) (27,304)
First State Global Resources Fund
Currency30 June 2008
Non-Monetary30 June 2008
Monetary
Change inCurrency
RateEffect on Net
Asset ValueUS$ US$ % US$
Australian Dollar 36,117,127 23,724 +5 1,186Canadian Dollar 53,847,422 265,899 +5 13,295Hong Kong Dollar 6,951,431 142 – –Indonesian Rupiah 2,983,839 – – –South African Rand 6,673,405 – – –Sterling Pound 62,351,148 679 +5 34
168,924,372 290,444 14,515
First State Global Resources Fund
Currency30 June 2007
Non-Monetary30 June 2007
Monetary
Change inCurrency
RateEffect on Net
Asset ValueUS$ US$ % US$
Australian Dollar 64,703,658 13,994 +5 700Canadian Dollar 77,312,960 58,851 +5 2,943Hong Kong Dollar 16,626,224 – – –South African Rand 7,517,033 – – –Sterling Pound 70,388,601 (10,460) +5 (523)
236,548,476 62,385 3,120
First State Global Property Securities Fund
Currency30 June 2008
Non-Monetary30 June 2008
Monetary
Change inCurrency
RateEffect on Net
Asset ValueUS$ US$ % US$
Australian Dollar 51,684 4,260 +5 213Canadian Dollar 83,548 461 +5 23Euro 359,036 282 +5 14Hong Kong Dollar 142,541 (17,157) – –Japanese Yen 122,815 696 +5 35Malaysian Ringgit 990 6,702 – –Singapore Dollar 85,366 8 +5 –Sterling Pound 280,536 3,051 +5 153
1,126,516 (1,697) 438
First State Global Property Securities Fund
Currency30 June 2007
Non-Monetary30 June 2007
Monetary
Change inCurrency
RateEffect on Net
Asset ValueUS$ US$ % US$
Australian Dollar 113,388 12,463 +5 623Canadian Dollar 106,589 24,105 +5 1,205Euro 418,745 266 +5 13Hong Kong Dollar 231,663 (17,158) – –Japanese Yen 171,782 803 +5 40Singapore Dollar 131,407 66 +5 3Sterling Pound 331,377 3,141 +5 157
1,504,951 23,686 2,041
FIRST STATE GLOBAL UMBRELLA FUND P.L.C.
NOTES FORMING PART OF THE FINANCIAL STATEMENTS
FOR THE PERIOD ENDED 30 JUNE 2008 (CONTINUED)
121

JOBNAME: 08081916 PAGE: 20 SESS: 20 OUTPUT: Mon Aug 18 12:43:17 2008
8. RISK ARISING FROM FINANCIAL INSTRUMENTS
(CONTINUED)
(b) Foreign Currency Risk (continued)
First State Asian Property Securities Fund
Currency30 June 2008
Non-Monetary30 June 2008
Monetary
Change inCurrency
RateEffect on Net
Asset ValueUS$ US$ % US$
Australian Dollar 5,155,656 182,167 +5 9,108Hong Kong Dollar 22,025,888 48,491 – –Japanese Yen 21,618,552 (582,298) +5 (29,115)Malaysian Ringgitt 625,493 467,093 – –Phillipine Peso 1,079,912 – – –Singapore Dollar 10,110,378 70,652 +5 3,533Sterling Pound 1,826,219 – – –
62,442,098 186,105 (16,474)
First State Asian Property Securities Fund
Currency30 June 2007
Non-Monetary30 June 2007
Monetary
Change inCurrency
RateEffect on Net
Asset ValueUS$ US$ % US$
Australian Dollar 13,284,207 278,707 +5 13,935Hong Kong Dollar 33,242,774 (967,938) – –Japanese Yen 29,378,484 81,386 +5 4,069Malaysian Ringgitt 1,603,371 – – –Phillipine Peso 3,618,185 2,537 +5 127Singapore Dollar 17,331,858 98,550 +5 4,928Sterling Pound 4,429,830 (103,588) +5 (5,179)
102,888,709 (610,346) 17,880
First State China Focus Fund
Currency30 June 2008
Non-Monetary30 June 2008
Monetary
Change inCurrency
RateEffect on Net
Asset ValueUS$ US$ % US$
Chinese Renminbi – 181,153 – –Hong Kong Dollar 82,802,871 187,073 – –Singapore Dollar 881,101 – – –Sterling Pound – 228 +5 11
83,683,972 368,454 11
(c) Interest rate risk
Interest rate risk is the risk that the fair valueof future cash flows of a financial instrument willfluctuate because of changes in market interestrates.
The majority of the assets of the funds areequity shares which neither pay interest nor have amaturity date apart from the First State GlobalBond Fund, First State High Quality Bond Fund,First State Long Term Bond Fund, First State AsianBond Fund, First State Asian Quality Bond Fund,First State Hong Kong Dollar Bond Fund and FirstState Global Emerging Markets Debt Fund.
The fair values of the Company’s fixedincome investments will fluctuate in response tochanges in market interest rates. Increases anddecreases in prevailing interest rates generallytranslate into decreases and increases in fair valuesof those instruments. Additionally fair values ofinterest rate sensitive instruments may be affectedby the creditworthiness of the issuer, prepaymentoptions, relative values of alternative investments,the liquidity of the instrument and other generalmarket conditions. Fixed interest rate investmentsmay be more sensitive to interest rate changes thanvariable rate investments.
The Company’s strategy is to acquire fixedincome securities that are attractively priced inrelation to the perceived credit risk. The InvestmentManager recognises and accepts that losses mayoccur. The Company may utilise derivativeproducts, such as interest rate swaps, to manageinterest rate risks on a limited basis. No suchderivative products were utilised as at 30 June 2008and 31 December 2007.
FIRST STATE GLOBAL UMBRELLA FUND P.L.C.
NOTES FORMING PART OF THE FINANCIAL STATEMENTS
FOR THE PERIOD ENDED 30 JUNE 2008 (CONTINUED)
122
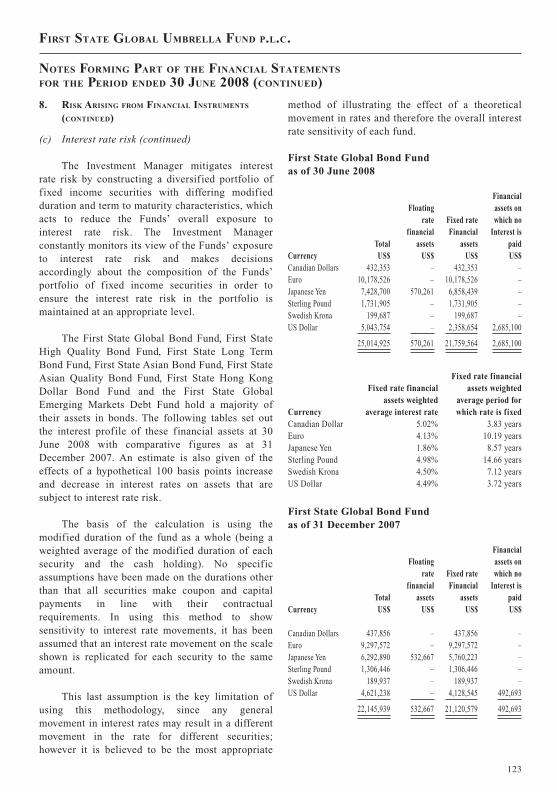
JOBNAME: 08081916 PAGE: 21 SESS: 20 OUTPUT: Mon Aug 18 12:43:17 2008
8. RISK ARISING FROM FINANCIAL INSTRUMENTS
(CONTINUED)
(c) Interest rate risk (continued)
The Investment Manager mitigates interestrate risk by constructing a diversified portfolio offixed income securities with differing modifiedduration and term to maturity characteristics, whichacts to reduce the Funds’ overall exposure tointerest rate risk. The Investment Managerconstantly monitors its view of the Funds’ exposureto interest rate risk and makes decisionsaccordingly about the composition of the Funds’portfolio of fixed income securities in order toensure the interest rate risk in the portfolio ismaintained at an appropriate level.
The First State Global Bond Fund, First StateHigh Quality Bond Fund, First State Long TermBond Fund, First State Asian Bond Fund, First StateAsian Quality Bond Fund, First State Hong KongDollar Bond Fund and the First State GlobalEmerging Markets Debt Fund hold a majority oftheir assets in bonds. The following tables set outthe interest profile of these financial assets at 30June 2008 with comparative figures as at 31December 2007. An estimate is also given of theeffects of a hypothetical 100 basis points increaseand decrease in interest rates on assets that aresubject to interest rate risk.
The basis of the calculation is using themodified duration of the fund as a whole (being aweighted average of the modified duration of eachsecurity and the cash holding). No specificassumptions have been made on the durations otherthan that all securities make coupon and capitalpayments in line with their contractualrequirements. In using this method to showsensitivity to interest rate movements, it has beenassumed that an interest rate movement on the scaleshown is replicated for each security to the sameamount.
This last assumption is the key limitation ofusing this methodology, since any generalmovement in interest rates may result in a differentmovement in the rate for different securities;however it is believed to be the most appropriate
method of illustrating the effect of a theoreticalmovement in rates and therefore the overall interestrate sensitivity of each fund.
First State Global Bond Fundas of 30 June 2008
Total
Floatingrate
financialassets
Fixed rateFinancial
assets
Financialassets onwhich no
Interest ispaid
Currency US$ US$ US$ US$Canadian Dollars 432,353 – 432,353 –Euro 10,178,526 – 10,178,526 –Japanese Yen 7,428,700 570,261 6,858,439 –Sterling Pound 1,731,905 – 1,731,905 –Swedish Krona 199,687 – 199,687 –US Dollar 5,043,754 – 2,358,654 2,685,100
25,014,925 570,261 21,759,564 2,685,100
Currency
Fixed rate financialassets weighted
average interest rate
Fixed rate financialassets weighted
average period forwhich rate is fixed
Canadian Dollar 5.02% 3.83 yearsEuro 4.13% 10.19 yearsJapanese Yen 1.86% 8.57 yearsSterling Pound 4.98% 14.66 yearsSwedish Krona 4.50% 7.12 yearsUS Dollar 4.49% 3.72 years
First State Global Bond Fundas of 31 December 2007
Total
Floatingrate
financialassets
Fixed rateFinancial
assets
Financialassets onwhich no
Interest ispaid
Currency US$ US$ US$ US$
Canadian Dollars 437,856 – 437,856 –Euro 9,297,572 – 9,297,572 –Japanese Yen 6,292,890 532,667 5,760,223 –Sterling Pound 1,306,446 – 1,306,446 –Swedish Krona 189,937 – 189,937 –US Dollar 4,621,238 – 4,128,545 492,693
22,145,939 532,667 21,120,579 492,693
FIRST STATE GLOBAL UMBRELLA FUND P.L.C.
NOTES FORMING PART OF THE FINANCIAL STATEMENTS
FOR THE PERIOD ENDED 30 JUNE 2008 (CONTINUED)
123

JOBNAME: 08081916 PAGE: 22 SESS: 20 OUTPUT: Mon Aug 18 12:43:17 2008
8. RISK ARISING FROM FINANCIAL INSTRUMENTS
(CONTINUED)
(c) Interest rate risk (continued)
Currency
Fixed rate financialassets weighted
average interest rate
Fixed rate financialassets weighted
average period forwhich rate is fixed
Canadian Dollars 5.02% 4.38 yearsEuro 4.38% 9.9 yearsJapanese Yen 1.46% 7.04 yearsSterling Pound 4.92% 11.2 yearsSwedish Krona 4.50% 7.72 yearsUS Dollar 4.73% 4.64 years
At 30 June 2008, should interest rates havelowered by 100 basis points with all other variablesremaining constant, the increase in net assetsattributable to holders of redeemable shares for theperiod would amount to approximatelyUS$1,629,302, arising substantially from theincrease in market values of debt securities (2007:US$1,402,699). An increase in interest rates of 100basis points would have had an equal but oppositeeffect.
First State High Quality Bond Fundas of 30 June 2008
Total
Floatingrate
financialassets
Fixed rateFinancial
assets
Financialassets onwhich no
Interest ispaid
Currency US$ US$ US$ US$US Dollar 42,952,507 3,393,863 39,558,644 –
42,952,507 3,393,863 39,558,644 –
Currency
Fixed rate financialassets weighted
average interest rate
Fixed rate financialassets weighted
average period forwhich rate is fixed
US Dollar 5.15% 6.76 years
First State High Quality Bond Fundas of 31 December 2007
Total
Floatingrate
financialassets
Fixed rateFinancial
assets
Financialassets onwhich no
Interest ispaid
Currency US$ US$ US$ US$US Dollar 55,136,592 3,526,440 50,624,766 985,386
55,136,592 3,526,440 50,624,766 985,386
Currency
Fixed rate financialassets weighted
average interest rate
Fixed rate financialassets weighted
average period forwhich rate is fixed
US Dollar 4.97% 7.14 years
At 30 June 2008, should interest rates havelowered by 100 basis points with all other variablesremaining constant, the increase in net assetsattributable to holders of redeemable shares for theperiod would amount to approximatelyUS$2,640,123, arising substantially from theincrease in market values of debt securities (2007:US$3,369,103). An increase in interest rates of 100basis points would have had an equal but oppositeeffect.
First State Long Term Bond Fundas of 30 June 2008
Total
Floatingrate
financialassets
Fixed rateFinancial
assets
Financialassets onwhich no
Interest ispaid
Currency US$ US$ US$ US$US Dollar 144,992,267 253,440 123,255,431 21,483,396
144,992,267 253,440 123,255,431 21,483,396
Currency
Fixed rate financialassets weighted
average interest rate
Fixed rate financialassets weighted
average period forwhich rate is fixed
US Dollar 5.67% 11.91 years
FIRST STATE GLOBAL UMBRELLA FUND P.L.C.
NOTES FORMING PART OF THE FINANCIAL STATEMENTS
FOR THE PERIOD ENDED 30 JUNE 2008 (CONTINUED)
124
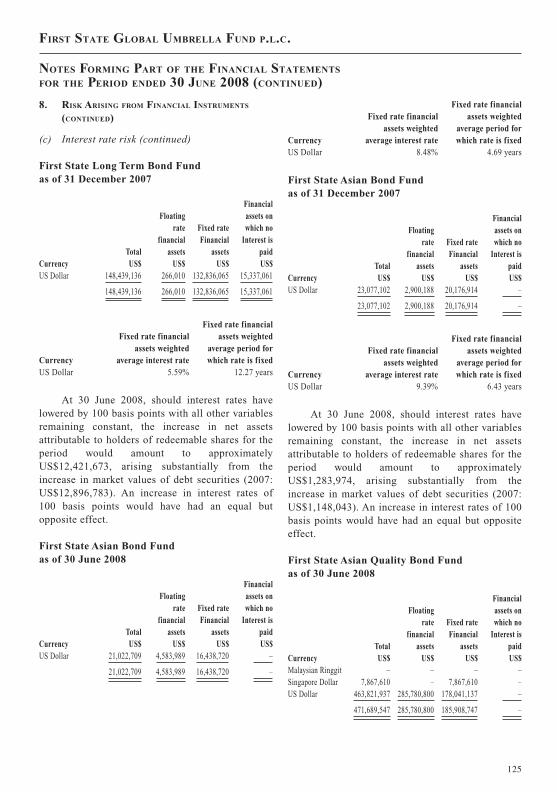
JOBNAME: 08081916 PAGE: 23 SESS: 20 OUTPUT: Mon Aug 18 12:43:17 2008
8. RISK ARISING FROM FINANCIAL INSTRUMENTS
(CONTINUED)
(c) Interest rate risk (continued)
First State Long Term Bond Fundas of 31 December 2007
Total
Floatingrate
financialassets
Fixed rateFinancial
assets
Financialassets onwhich no
Interest ispaid
Currency US$ US$ US$ US$US Dollar 148,439,136 266,010 132,836,065 15,337,061
148,439,136 266,010 132,836,065 15,337,061
Currency
Fixed rate financialassets weighted
average interest rate
Fixed rate financialassets weighted
average period forwhich rate is fixed
US Dollar 5.59% 12.27 years
At 30 June 2008, should interest rates havelowered by 100 basis points with all other variablesremaining constant, the increase in net assetsattributable to holders of redeemable shares for theperiod would amount to approximatelyUS$12,421,673, arising substantially from theincrease in market values of debt securities (2007:US$12,896,783). An increase in interest rates of100 basis points would have had an equal butopposite effect.
First State Asian Bond Fundas of 30 June 2008
Total
Floatingrate
financialassets
Fixed rateFinancial
assets
Financialassets onwhich no
Interest ispaid
Currency US$ US$ US$ US$US Dollar 21,022,709 4,583,989 16,438,720 –
21,022,709 4,583,989 16,438,720 –
Currency
Fixed rate financialassets weighted
average interest rate
Fixed rate financialassets weighted
average period forwhich rate is fixed
US Dollar 8.48% 4.69 years
First State Asian Bond Fundas of 31 December 2007
Total
Floatingrate
financialassets
Fixed rateFinancial
assets
Financialassets onwhich no
Interest ispaid
Currency US$ US$ US$ US$US Dollar 23,077,102 2,900,188 20,176,914 –
23,077,102 2,900,188 20,176,914 –
Currency
Fixed rate financialassets weighted
average interest rate
Fixed rate financialassets weighted
average period forwhich rate is fixed
US Dollar 9.39% 6.43 years
At 30 June 2008, should interest rates havelowered by 100 basis points with all other variablesremaining constant, the increase in net assetsattributable to holders of redeemable shares for theperiod would amount to approximatelyUS$1,283,974, arising substantially from theincrease in market values of debt securities (2007:US$1,148,043). An increase in interest rates of 100basis points would have had an equal but oppositeeffect.
First State Asian Quality Bond Fundas of 30 June 2008
Total
Floatingrate
financialassets
Fixed rateFinancial
assets
Financialassets onwhich no
Interest ispaid
Currency US$ US$ US$ US$Malaysian Ringgit – – – –Singapore Dollar 7,867,610 – 7,867,610 –US Dollar 463,821,937 285,780,800 178,041,137 –
471,689,547 285,780,800 185,908,747 –
FIRST STATE GLOBAL UMBRELLA FUND P.L.C.
NOTES FORMING PART OF THE FINANCIAL STATEMENTS
FOR THE PERIOD ENDED 30 JUNE 2008 (CONTINUED)
125

JOBNAME: 08081916 PAGE: 24 SESS: 20 OUTPUT: Mon Aug 18 12:43:17 2008
8. RISK ARISING FROM FINANCIAL INSTRUMENTS
(CONTINUED)
(c) Interest rate risk (continued)
Currency
Fixed rate financialassets weighted
average interest rate
Fixed rate financialassets weighted
average period forwhich rate is fixed
Singapore Dollar 3.01% 2.26 yearsUS Dollar 6.37% 6.44 years
First State Asian Quality Bond Fundas of 31 December 2007
Total
Floatingrate
financialassets
Fixed rateFinancial
assets
Financialassets onwhich no
Interest ispaid
Currency US$ US$ US$ US$Malaysian Ringgit 52,887,748 – 15,719,995 37,167,753Singapore Dollar 46,184,572 – 10,419,680 35,764,892US Dollar 274,072,984 157,509,122 116,563,862 –
373,145,304 157,509,122 142,703,537 72,932,645
Currency
Fixed rate financialassets weighted
average interest rate
Fixed rate financialassets weighted
average period forwhich rate is fixed
Malaysian Ringgit 3.55% 0.33 yearsSingapore Dollar 1.50% 0.26 yearsUS Dollar 6.64% 10.87 years
At 30 June 2008, should interest rates havelowered by 100 basis points with all other variablesremaining constant, the increase in net assetsattributable to holders of redeemable shares for theperiod would amount to approximatelyUS$41,013,438, arising substantially from theincrease in market values of debt securities (2007:US$22,516,732). An increase in interest rates of100 basis points would have had an equal butopposite effect.
First State Hong Kong Dollar Bondas of 30 June 2008
Total
Floatingrate
financialassets
Fixed rateFinancial
assets
Financialassets onwhich no
Interest ispaid
Currency US$ US$ US$ US$Hong Kong Dollar 17,325,752 519,023 16,806,729 –
17,325,752 519,023 16,806,729 –
Currency
Fixed rate financialassets weighted
average interest rate
Fixed rate financialassets weighted
average period forwhich rate is fixed
Hong Kong Dollar 4.27% 2.70 years
First State Hong Kong Dollar Bondas of 31 December 2007
Total
Floatingrate
financialassets
Fixed rateFinancial
assets
Financialassets onwhich no
Interest ispaid
Currency US$ US$ US$ US$Hong Kong Dollar 11,495,005 512,823 10,946,651 35,531US Dollar 283,780 283,780 – –
11,778,785 796,603 10,946,651 35,531
Currency
Fixed rate financialassets weighted
average interest rate
Fixed rate financialassets weighted
average period forwhich rate is fixed
Hong Kong Dollar 4.72% 4.25 years
At 30 June 2008, should interest rates havelowered by 100 basis points with all other variablesremaining constant, the increase in net assetsattributable to holders of redeemable shares for theperiod would amount to approximatelyUS$509,502, arising substantially from the increasein market values of debt securities (2007:US$408,932). An increase in interest rates of 100basis points would have had an equal but oppositeeffect.
FIRST STATE GLOBAL UMBRELLA FUND P.L.C.
NOTES FORMING PART OF THE FINANCIAL STATEMENTS
FOR THE PERIOD ENDED 30 JUNE 2008 (CONTINUED)
126

JOBNAME: 08081916 PAGE: 25 SESS: 20 OUTPUT: Mon Aug 18 12:43:17 2008
8. RISK ARISING FROM FINANCIAL INSTRUMENTS
(CONTINUED)
(c) Interest rate risk (continued)
First State Global Emerging Markets Debt Fundas of 30 June 2008
Total
Floatingrate
financialassets
Fixed rateFinancial
assets
Financialassets onwhich no
Interest ispaid
Currency US$ US$ US$ US$Argentinean Peso 493,861 493,861 – –Brazilian Real 10,102,675 – 10,102,675 –Egyptian Pound 2,631,491 – 2,631,491 –Turkish Lira 6,496,324 – 6,072,712 423,612US Dollar 30,900,483 4,880,803 26,019,680 –
50,624,834 5,374,664 44,826,558 423,612
Currency
Fixed rate financialassets weighted
average interest rate
Fixed rate financialassets weighted
average period forwhich rate is fixed
Brazilian Real 10.24% 12.10 yearsEgyptian Pound 8.75% 6.96 yearsTurkish Lira 16.28% 2.79 yearsUS Dollar 8.69% 8.91 years
First State Global Emerging Markets Debt Fundas of 31 December 2007
Total
Floatingrate
financialassets
Fixed rateFinancial
assets
Financialassets onwhich no
Interest ispaid
Currency US$ US$ US$ US$Argentinean Peso 519,936 519,936 – –Brazilian Real 10,311,908 – 10,311,908 –Egyptian Pound 5,710,991 – 5,710,991 –Turkish Lira 7,484,391 – 7,006,168 478,223US Dollar 34,313,564 308,764 34,004,800 –
58,340,790 828,700 57,033,867 478,223
Currency
Fixed rate financialassets weighted
average interest rate
Fixed rate financialassets weighted
average period forwhich rate is fixed
Brazilian Real 10.25% 12.74 yearsEgyptian Pound 8.75% 4.61 yearsTurkish Lira 16.29% 3.35 yearsUS Dollar 9.16% 6.93 years
At 30 June 2008, should interest rates havelowered by 100 basis points with all other variablesremaining constant, the increase in net assetsattributable to holders of redeemable shares for theperiod would amount to approximatelyUS$2,554,427, arising substantially from theincrease in market values of debt securities (2007:US$2,977,101). An increase in interest rates of 100basis points would have had an equal but oppositeeffect.
In accordance with the Company’s policy, theInvestment Manager monitors the Company’soverall interest sensitivity on a daily basis, and theBoard of Directors reviews it on a quarterly basis.
(d) Credit risk
The Company takes on exposure to credit risk,which is the risk that a counterparty will be unableto pay amounts in full when due. Impairmentprovisions are provided for losses that have beenincurred by the Balance Sheet date, if any.
The Company’s investments in fixed incomesecurities are subject to credit risk. Credit riskreflects the possibility that a borrower will not beable to meet its obligation to make payments ofinterest or principal when they fall due. TheInvestment Manager analyses the credit risk of theCompany’s fixed income investments prior topurchase and continue to monitor developments incredit quality subsequently.
FIRST STATE GLOBAL UMBRELLA FUND P.L.C.
NOTES FORMING PART OF THE FINANCIAL STATEMENTS
FOR THE PERIOD ENDED 30 JUNE 2008 (CONTINUED)
127

JOBNAME: 08081916 PAGE: 26 SESS: 20 OUTPUT: Mon Aug 18 12:43:17 2008
8. RISK ARISING FROM FINANCIAL INSTRUMENTS
(CONTINUED)
(d) Credit risk (continued)
Credit risk also represents the loss that theCompany would incur if a counterparty failed toperform its contractual obligation to the Company.To reduce the Company’s counterparty creditexposures, securities trading is primarily conductedon recognised exchanges and on adelivery-versus-payment basis. In addition, theInvestment Manager seeks to enter into nettingagreements with counterparties that would allowreceivables and payables to that counterparty to beoffset.
To measure and manage the Company’s creditexposures, the Investment Manager primarily usescredit limits. While the Company’s investmentactivities expose it to many different industries andcounterparties, the Company routinely executes ahigh volume of transactions with counterparties inthe financial services industry, including brokersand dealers and commercial banks, resulting insignificant relative credit concentration withrespect to this industry. In the ordinary course ofbusiness, the Company may also be subject to aconcentration of credit risk to a particularcounterparty, borrower or issuer; however theInvestment Manager controls this exposure throughthe use of counterparty, credit and issuer limits. Ingeneral the limits applied (expressed as a value ofeach Fund) are 10% to individual issuers, 20% todeposit taking financial institutions, 5% (or 10% ifan approved bank) to OTC derivativecounterparties, and 20% to combined issuers/counterparties. Lower limits may be applied toindividual issuers or counterparties if theInvestment Manager feels it prudent to do so.
The Company’s assets are safeguarded andheld by the Custodian. The Investment Manageranalyses the Credit risk of the Company’sCustodian prior to appointment and continues tomonitor developments in its credit qualitysubsequently. In addition the Investment Managermakes use from time to time of money market orexchange-traded funds or the placing of monies ondeposit both in order to maximise return and to
diversify the exposure of such assets. TheInvestment Manager only places deposits withapproved banks with a short-term credit rating ofP-1 and utilises money market funds with a ratingof AAA. The Custodian has a short-term creditrating of P-1.
All transactions in listed securities are settled/paid for upon delivery using the approvedCustodian. The risk of default is consideredminimal, as delivery of securities sold is only madeonce the custodian has received payment. Paymentis made on a purchase once the securities have beenreceived by the custodian. The trade will fail ifeither party fails to meet its obligation.Substantially all of the securities and cash of theCompany are held by HSBC. Bankruptcy orinsolvency of HSBC may cause the Company’srights with respect to securities and cash held byHSBC to be delayed or limited.
The carrying amounts of the financial assetsbest represent the maximum credit risk exposure atthe balance sheet date. Details of the Company’sfinancial assets exposed to credit risk are shown inthe assets section of the current and prior periodBalance Sheets on pages 75 – 82.
In accordance with the respective Fund’spolicy, the Investment Manager monitors theFund’s credit position on daily basis.
The First State Global Bond Fund, First StateHigh Quality Bond Fund, First State Long TermBond Fund, First State Asian Bond Fund, First StateAsian Quality Bond Fund, First State Hong KongDollar Bond Fund and the First State GlobalEmerging Markets Debt Fund hold a majority oftheir assets in debt securities. An analysis of thesedebt securities portfolios by credit rating is shownin the following tables. This analysis is performedon the basis of the respective published net assetvalue as calculated in accordance with theprovisions of the Company’s regulations.
FIRST STATE GLOBAL UMBRELLA FUND P.L.C.
NOTES FORMING PART OF THE FINANCIAL STATEMENTS
FOR THE PERIOD ENDED 30 JUNE 2008 (CONTINUED)
128

JOBNAME: 08081916 PAGE: 27 SESS: 20 OUTPUT: Mon Aug 18 12:43:17 2008
8. RISK ARISING FROM FINANCIAL INSTRUMENTS
(CONTINUED)
(d) Credit risk (continued)
First State Global Bond Fund
Portfolio by rating category
Rating30 June
200831 December
2007AAA 72.55% 66.65%AA+ – 2.01%AA /*- 3.17% –AA 16.07% 22.35%AA- 0.80% 0.90%A+ 5.09% 5.56%A 2.32% 2.53%
Total 100.00% 100.00%
First State High Quality Bond Fund
Portfolio by rating category
Rating30 June
200831 December
2007AAA 65.01% 65.73%AA+ 2.34% 4.25%AA 3.54% 4.98%AA- 5.37% 3.34%A+ 10.43% 8.76%A 10.83% 7.84%A- 1.51% 1.18%BBB+ 1.02% 0.80%N/A (0.05)% 3.12%
Total 100.00% 100.00%
First State Long Term Bond Fund
Portfolio by rating category
Rating30 June
200831 December
2007AAA 95.25% 95.29%AA 2.05% 2.01%AA- 0.99% 0.99%A+ 1.31% 1.32%A 0.40% 0.39%
Total 100.00% 100.00%
First State Asian Bond Fund
Portfolio by rating category
Rating30 June
200831 December
2007A 2.45% –A- 12.12% –BBB+ 7.67% –BBB- 5.24% –BBB 13.82% –BB+ 5.11% 9.44%BB /*- 4.81% –BB 6.32% 6.34%BB- 9.00% 20.58%B+ 20.78% 32.50%B+ /*- – 3.17%B 6.39% 8.60%B- 3.58% 7.13%CCC+ – 4.39%CCC+ /*- 2.71% –N/A – 7.85%
Total 100.00% 100.00%
FIRST STATE GLOBAL UMBRELLA FUND P.L.C.
NOTES FORMING PART OF THE FINANCIAL STATEMENTS
FOR THE PERIOD ENDED 30 JUNE 2008 (CONTINUED)
129

JOBNAME: 08081916 PAGE: 28 SESS: 20 OUTPUT: Mon Aug 18 12:43:17 2008
8. RISK ARISING FROM FINANCIAL INSTRUMENTS
(CONTINUED)
(d) Credit risk (continued)
First State Hong Kong Dollar Bond
Portfolio by rating category
Rating30 June
200831 December
2007AAA 10.69% 4.97%AA+ 1.58% 2.36%AA 42.47% 27.49%AA- 10.07% 5.27%A+ /*+ 1.50% –A+ 5.16% 13.35%A 13.87% 8.35%A- 10.91% 6.91%BBB+ 3.75% 5.50%N/A – 25.80%
Total 100.00% 100.00%
First State Asian Quality Bond Fund
Portfolio by rating category
Rating30 June
200831 December
2007AAA 5.26% 12.34%AA+ 5.02% –AA – –AA- 2.39% 3.14%AA– /*- – 3.10%A+ 9.13% 4.75%A 5.73% 2.46%A- 8.26% 22.71%BBB+ 18.83% 2.47%BBB- 6.55% 12.42%BBB 36.00% 14.52%BB+ 2.83% 3.86%BBBu – 2.82%BBu – 1.50%N/A – 13.91%
Total 100.00% 100.00%
First State Global Emerging Markets Debt Fund
Portfolio by rating category
Rating30 June
200831 December
2007AAA 12.15% 8.91%AA+ 3.02% 3.08%AA – 0.82%AA- 4.09% 3.61%AA– /*- – 3.07%A+ 3.10% 2.74%A 2.93% –BBB+ 9.59% –BBB- 18.41% –BB+ 5.20% 24.96%BB- 6.22% 10.18%B+ 22.34% 22.52%B+ /*- – 2.07%B 7.87% 9.90%B- 3.23% 3.07%CCC+ /*- 1.85% –N/A – 5.07%
Total 100.00% 100.00%
(e) Liquidity risk
Liquidity risk is the risk that an entity willencounter difficulty in meeting obligationsassociated with financial liabilities.
The Company is exposed to daily cashredemptions of redeemable shares. It thereforeinvests the majority of its assets in investments thatare traded in an active market and can be readilydisposed of; it invests only a limited proportion ofits assets in investments not actively traded on astock exchange. The Company’s listed securitiesare considered readily realisable, as they are listedon major stock exchanges.
FIRST STATE GLOBAL UMBRELLA FUND P.L.C.
NOTES FORMING PART OF THE FINANCIAL STATEMENTS
FOR THE PERIOD ENDED 30 JUNE 2008 (CONTINUED)
130
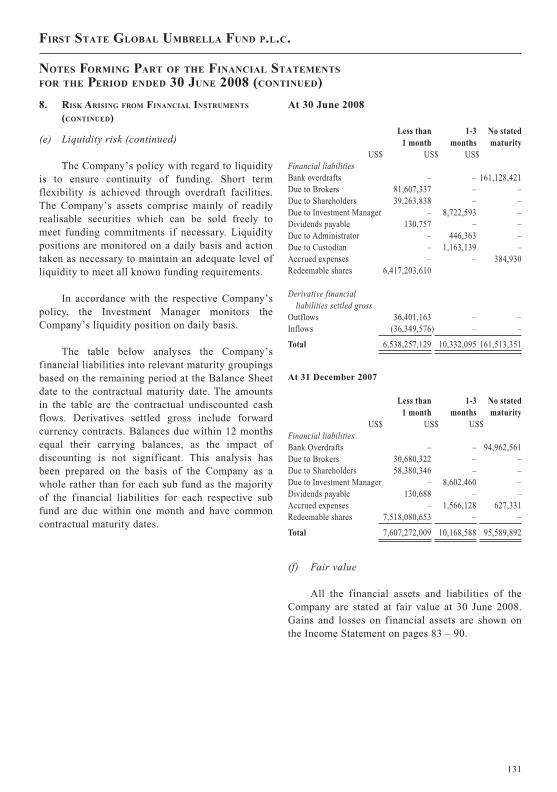
JOBNAME: 08081916 PAGE: 29 SESS: 20 OUTPUT: Mon Aug 18 12:43:17 2008
8. RISK ARISING FROM FINANCIAL INSTRUMENTS
(CONTINUED)
(e) Liquidity risk (continued)
The Company’s policy with regard to liquidityis to ensure continuity of funding. Short termflexibility is achieved through overdraft facilities.The Company’s assets comprise mainly of readilyrealisable securities which can be sold freely tomeet funding commitments if necessary. Liquiditypositions are monitored on a daily basis and actiontaken as necessary to maintain an adequate level ofliquidity to meet all known funding requirements.
In accordance with the respective Company’spolicy, the Investment Manager monitors theCompany’s liquidity position on daily basis.
The table below analyses the Company’sfinancial liabilities into relevant maturity groupingsbased on the remaining period at the Balance Sheetdate to the contractual maturity date. The amountsin the table are the contractual undiscounted cashflows. Derivatives settled gross include forwardcurrency contracts. Balances due within 12 monthsequal their carrying balances, as the impact ofdiscounting is not significant. This analysis hasbeen prepared on the basis of the Company as awhole rather than for each sub fund as the majorityof the financial liabilities for each respective subfund are due within one month and have commoncontractual maturity dates.
At 30 June 2008
Less than1 month
1-3months
No statedmaturity
US$ US$ US$Financial liabilitiesBank overdrafts – – 161,128,421Due to Brokers 81,607,337 – –Due to Shareholders 39,263,838 – –Due to Investment Manager – 8,722,593 –Dividends payable 130,757 – –Due to Administrator – 446,363 –Due to Custodian – 1,163,139 –Accrued expenses – – 384,930Redeemable shares 6,417,203,610
Derivative financialliabilities settled gross
Outflows 36,401,163 – –Inflows (36,349,576) – –
Total 6,538,257,129 10,332,095 161,513,351
At 31 December 2007
Less than1 month
1-3months
No statedmaturity
US$ US$ US$Financial liabilitiesBank Overdrafts – – 94,962,561Due to Brokers 30,680,322 – –Due to Shareholders 58,380,346 – –Due to Investment Manager – 8,602,460 –Dividends payable 130,688 – –Accrued expenses – 1,566,128 627,331Redeemable shares 7,518,080,653 – –
Total 7,607,272,009 10,168,588 95,589,892
(f) Fair value
All the financial assets and liabilities of theCompany are stated at fair value at 30 June 2008.Gains and losses on financial assets are shown onthe Income Statement on pages 83 – 90.
FIRST STATE GLOBAL UMBRELLA FUND P.L.C.
NOTES FORMING PART OF THE FINANCIAL STATEMENTS
FOR THE PERIOD ENDED 30 JUNE 2008 (CONTINUED)
131

JOBNAME: 08081916 PAGE: 30 SESS: 20 OUTPUT: Mon Aug 18 12:43:17 2008
9. DERIVATIVE CONTRACTS
The Company’s holdings in derivatives astranslated into US Dollar are specified in thefollowing tables.
Forward contracts
At 30 June 2008 the Company heldoutstanding forward contracts as set out below:
First State Asian Quality Bond Fund
CurrencyBought
Amount CurrencySold
AmountMaturity
DateUnrealised
(Loss)/Gain
US Dollar 21,623,051 Malaysian Ringgitt 21,597,293 09-July-2008 25,758
US Dollar 7,848,452 Singapore Dollar 7,896,090 09-July-2008 (47,638)
(21,880)
First State Global Emerging Markets Debt Fund
CurrencyBought
Amount CurrencySold
AmountMaturity
DateUnrealised
(Loss)/Gain
US Dollar 6,878,073 New Turkish Lira 69,07,780 28-July-2008 (29,707)
(29,707)
Future contracts
At 30 June 2008 the Company heldoutstanding futures contracts as set out below:
First State Global Bond Fund
DescriptionNumber ofContracts
ClosingPrice Settlement Date
UnrealisedGain/(Loss)
US$US 10 Year Note Futures 1 113.2650 September-2008 –
–
First State High Quality Bond Fund
DescriptionNumber ofContracts
ClosingPrice Settlement Date
UnrealisedGain/(Loss)
US$US 10 Year Note Futures 10 113.30 September-2008 –
–
First State Long Term Bond Fund
DescriptionNumber ofContracts
ClosingPrice Settlement Date
UnrealisedGain/(Loss)
US$US 10 Year Note Futures 1 113.2650 September-2008 –
–
First State Asian Quality Bond Fund
DescriptionNumber ofContracts
ClosingPrice Settlement Date
UnrealisedGain/(Loss)
US$US 10 Year Note Futures 10 113.30 September-2008 –
–
First State Global Emerging Market Debt Fund
DescriptionNumber ofContracts
ClosingPrice Settlement Date
UnrealisedGain/(Loss)
US$US 10 Year Note Futures 10 113.30 September-2008 –
–
Futures and forward contracts arecommitments either to purchase or sell a designatedfinancial instrument, currency, commodity or anindex at a specified future date for a specified priceand may be settled in cash or another financialasset. Futures are standardised exchange-tradedcontracts whereas forwards are individually tradedover-the-counter contracts. Initial marginrequirements for futures are met in cash or otherinstruments, and changes in the future contractvalues are settled daily. Futures contracts have littlecredit risk because the counterparties are futuresexchanges. Forward contracts result in creditexposure to the counterparty.
FIRST STATE GLOBAL UMBRELLA FUND P.L.C.
NOTES FORMING PART OF THE FINANCIAL STATEMENTS
FOR THE PERIOD ENDED 30 JUNE 2008 (CONTINUED)
132

JOBNAME: 08081916 PAGE: 31 SESS: 20 OUTPUT: Mon Aug 18 12:43:17 2008
9. DERIVATIVE CONTRACTS (CONTINUED)
Futures and forward contracts both result inexposure to market risk based on changes in marketprices relative to contracted amounts. Market risksarise due to the possible movement in foreigncurrency exchange rates, indices, and securities’values underlying these instruments. In addition,because of the low margin deposits normallyrequired in relation to notional contract sizes, ahigh degree of leverage may be typical of a futuresor forward trading account. As a result, a relativelysmall price movement in an underlying of a futuresor forward contract may result in substantial lossesto the Company. While forward contracts aregenerally traded over-the-counter and therefore aresubject to greater liquidity risk, futures trading mayalso be illiquid. Certain futures exchanges do notpermit trading in particular futures contracts atprices that represent a fluctuation in price during asingle day’s trading beyond certain set limits. Ifprices fluctuate during a single day’s tradingbeyond those limits, the Company could beprevented from promptly liquidating unfavourablepositions and thus could be subject to substantiallosses.
Notional amounts are the underlying referenceamounts to stock exchange indices, equities andforeign currencies upon which the fair value of thefutures, and forward contracts traded by theCompany are based. While notional amounts do notrepresent the current fair value and are notnecessarily indicative of the future cash flows ofthe Company’s futures and forward contracts, theunderlying price changes in relation to the variablesspecified by the notional amounts affect the fairvalue of these derivative financial instruments.
10. CASH AND CASH EQUIVALENTS
Bank balances were held with HSBC BankPlc, HSBC Institutional Trust Services (Asia)Limited (a wholly owned subsidiary of HSBCHoldings Plc), The Hong Kong & ShanghaiBanking Corporation Banking for Indian andCentral Trust Account for Taiwan cash.
Any temporary overdraft balances are securedby way of a charge on the cash and securities of theCompany.
11. CROSS LIABILITY
The Company has introduced segregatedliability between the various sub-funds.
12. DELEGATION TO SUB-INVESTMENT MANAGERS
The Investment Manager has delegated theinvestment management of certain investmentportfolios of the Funds to First State InvestmentManagement (UK) Limited and First StateInvestments (Singapore), all of which are whollyowned subsidiaries of the Commonwealth Bank ofAustralia group of companies.
The table below sets out the details of theFunds which are managed by the InvestmentManager or which are delegated to each of theSub-investment managers:
Investment Manager/Sub-Investment Managers
Funds
First State Investments(Hong Kong) Limited
First State Asian Equity Plus FundFirst State China Focus FundFirst State China Growth FundFirst State Greater China Growth FundFirst State Hong Kong Growth FundFirst State Asian Bond FundFirst State Asian Quality Bond FundFirst State Global Emerging Markets Debt FundFirst State Hong Kong Dollar Bond Fund
First State Investments(Singapore)
First State Asian Growth FundFirst State Asia Innovation and Technology FundFirst State Singapore and Malaysia Growth Fund
First State InvestmentsManagement (UK) Limited
First State Global 100 FundFirst State Indian Subcontinent FundFirst State UK Growth FundFirst State Global Emerging Markets Leaders Fund
Colonial First StateInvestments Limited
First State Global Bond FundFirst State High Quality Bond FundFirst State Long Term Bond FundFirst State Global Resources FundFirst State Global Property Securities FundFirst State Asian Property Securities FundFirst State Global Listed Infrastructure Fund
FIRST STATE GLOBAL UMBRELLA FUND P.L.C.
NOTES FORMING PART OF THE FINANCIAL STATEMENTS
FOR THE PERIOD ENDED 30 JUNE 2008 (CONTINUED)
133

JOBNAME: 08081916 PAGE: 32 SESS: 20 OUTPUT: Mon Aug 18 12:43:17 2008
13. COMPARATIVES
The Comparative figures for the BalanceSheet relate to the year ended 31 December 2007,while the comparative figures for the IncomeStatement, Statement of Changes in Net AssetsAttributable to Redeemable ParticipatingShareholders and Distribution Statement relate tothe period ended 30 June 2007.
14. APPROVAL OF THE FINANCIALSTATEMENTS
The Financial Statements were approved bythe Board of Directors on 18 August 2008.
FIRST STATE GLOBAL UMBRELLA FUND P.L.C.
NOTES FORMING PART OF THE FINANCIAL STATEMENTS
FOR THE PERIOD ENDED 30 JUNE 2008 (CONTINUED)
134

JOBNAME: 08081916 PAGE: 33 SESS: 20 OUTPUT: Mon Aug 18 12:43:17 2008
FIRST STATE GLOBAL UMBRELLA FUND P.L.C.REGISTERED OFFICE: HSBC HOUSE, HARCOURT CENTRE, HARCOURT STREET, DUBLIN 2
INVESTMENT MANAGERFirst State Investments(Hong Kong) Limited
Sixth Floor, Three Exchange SquareCentral
Hong Kong
SUB-INVESTMENT MANAGERSFirst State Investments (Singapore)
One Temasek Avenue#17-01 Millenia Tower
Singapore 039192
First State Investment Management (UK) Limited23 St Andrew SquareEdinburgh EH2 1BB
Scotland
Colonial First State Investments LimitedLevel 29
Colonial Centre52 Martin Place
SydneyNew South Wales
2000Australia
DIRECTORS*Peter Blessing (Irish)Greg Cooper (British)
Lindsay Mann (Australian)*Hans Vogel (German)
*Irish Resident and Independent Non-ExecutiveDirectors
LEGAL ADVISERS IN IRELANDArthur Cox
Earlsfort CentreEarlsfort Terrace
Dublin 2Ireland
ADMINISTRATOR, SECRETARY ANDREGISTRAR
HSBC Securities Services (Ireland) LimitedHSBC House
Harcourt Centre, Harcourt StreetDublin 2Ireland
CUSTODIANHSBC Institutional Trust Services (Ireland) Limited
HSBC HouseHarcourt Centre, Harcourt Street
Dublin 2Ireland
AUDITORSPricewaterhouseCoopersChartered Accountants
and Registered AuditorsOne Spencer Dock, North Wall Quay
Dublin 1Ireland
DISTRIBUTORSLONDON OFFICE
First State Investments (UK) Limited3rd Floor
30 Canon StreetLondon EC4M 6YQ
England
EDINBURGH OFFICEFirst State Investments (UK) Limited
23 St Andrew SquareEdinburgh EH2 1BB
Scotland
DISTRIBUTORS
HONG KONG OFFICEFirst State Investments (Hong Kong) Limited
Sixth FloorThree Exchange Square
CentralHong Kong
SINGAPORE OFFICEFirst State Investments (Singapore)
One Temasek Avenue#17-01 Millenia Tower Singapore 039192
FIRST STATE GLOBAL UMBRELLA FUND P.L.C.
DIRECTORY
135

2008 Semi-Annual Report
First StateGlobal Umbrella Fund plc