Sandra L. Fenwick President and CEO · 2017-05-24 · empowered to represent the organization for...
23
2015 Cost Trends Hearing – Boston Children’s Hospital September 11, 2015 Ms. Lois Johnson General Counsel Health Policy Commission Two Boylston Street, 6th Floor Boston, MA 02116 Dear Ms. Johnson, Attached, please find the testimony of Boston Children’s Hospital, signed under pains and penalties of perjury, in response to questions provided by the Health Policy Commission and the Office of the Attorney General. As the President and Chief Executive Officer of Boston Children’s Hospital, I am legally authorized and empowered to represent the organization for the purposes of this testimony. If you have any questions, please contact Joshua Greenberg, Vice President of Government Relations, at (617) 919-3055. Sincerely, Sandra L. Fenwick President and CEO Boston Children’s Hospital
-
Upload
nguyenlien -
Category
Documents
-
view
214 -
download
0
Transcript of Sandra L. Fenwick President and CEO · 2017-05-24 · empowered to represent the organization for...

2015 Cost Trends Hearing – Boston Children’s Hospital
September 11, 2015 Ms. Lois Johnson General Counsel Health Policy Commission Two Boylston Street, 6th Floor Boston, MA 02116 Dear Ms. Johnson, Attached, please find the testimony of Boston Children’s Hospital, signed under pains and penalties of perjury, in response to questions provided by the Health Policy Commission and the Office of the Attorney General. As the President and Chief Executive Officer of Boston Children’s Hospital, I am legally authorized and empowered to represent the organization for the purposes of this testimony. If you have any questions, please contact Joshua Greenberg, Vice President of Government Relations, at (617) 919-3055. Sincerely,
Sandra L. Fenwick President and CEO Boston Children’s Hospital

2015 Cost Trends Hearing – Boston Children’s Hospital
Exhibit B: HPC Questions for Written Testimony
1. Chapter 224 of the Acts of 2012 (Chapter 224) sets a health care cost growth benchmark for the Commonwealth based on the long-term growth in the state’s economy. The benchmark for growth in CY2013 and CY2014 is 3.6%.
a. What trends has your organization experienced in revenue, utilization, and operating expenses in CY2014 and year-to-date CY2015? Please comment on the factors driving these trends.
Boston Children's Hospital (BCH) calculates financial performance on a fiscal year basis. Each year, we calculate a unit-price operating expense trend for the organization that has previously been shared with the Health Policy Commission, and is attached as Exhibit 1. For FY14 (as for many years prior), our operating expense trend was 1.8% and has continued to run below the state benchmark of 3.6%. While we are unable to project this trend for FY15 as audited financials will not be available for several months, we estimate that operating expenses are growing at 2.6%, and that volume-adjusted operating expenses are growing at approximately 2.0%, each below the benchmark. Boston Children’s Hospital is a unique organization in that we are the only freestanding children’s hospital in the state and our sole focus on the care of pediatric patients. We are consistently recognized as one of the top children's hospitals in the country, and draw a significant percentage of our patients (and our revenue) from regional, national, and international referrals. These patients tend to be more complex, utilize more resources when hospitalized, and have longer lengths of stay than typical patients, and are therefore by definition “more costly” than the average pediatric patient. Nevertheless, prior to 2009 and ongoing since the passage of Chapter 224, Boston Children’s Hospital has remained below the 3.6% cost growth benchmark. To achieve this in the local market, we have aggressively pursued actions to reduce the total cost of care, frequently through the use of lower cost settings. In some cases, these settings are other community hospitals (many of which are staffed by BCH physicians) and in some cases we have been able to replace inpatient care with outpatient services. We have also continued to have a significant focus on prevention-based strategies to avoid the use of services altogether, including a very substantial commitment to primary care medical home development. The results of these longer-term trends on the hospital are:
• Significant increases in the acuity and length of stay (LOS) of patients that are hospitalized on our Longwood Campus, as lower acuity and less complex patients are managed elsewhere;
• Growth in the percentage of bed days/revenue from combined regional, national, and international patients;
• Significant increases in volume seen in lower-cost satellite outpatient facilities; • Deepening investment in accountable care infrastructure and supports.
In terms of cost of care delivery, like many others in the health care system we have little flexibility when it comes to wage and benefit costs, pharmaceutical costs, and energy costs. In addition, as a
2015 Cost Trends Hearing – Boston Children’s Hospital
free-standing children’s hospital our patients require higher intensity nursing and unique pharmaceutical services such as compounding of highly specialized medications, both of which are examples of the disproportionate challenges we face compared to rest of the market in caring for our unique, medically complex, pediatric patients. We question whether the current reimbursement system established for all hospitals is designed to work well for pediatric hospitals such as Boston Children’s, given both our unique safety net role for high complexity pediatric services and our high Medicaid payor mix. The costs of unique (“stand by”) pediatric services should be covered and shared proportionately by all payors and in a manner that does not impose unrealistic cost-sharing burdens on families with special pediatric needs. The regionalization of higher complexity pediatric care is a national, not a local, phenomenon. It arises as a result of the heterogeneity of rare conditions in children, the high level of specialization required, and the need for scale to adequately address these conditions.
b. What actions has your organization undertaken since January 1, 2014 to ensure the
Commonwealth will meet the benchmark, and what have been the results of these actions?
In the course of negotiations with third party payors, we have established modest rates of reimbursement increase in support of the state's goals, even as we do not anticipate being a driver of increased costs. Our contracted inflation rates fall below the cost trend targets and applicable medical inflation increases and often below general inflation, even as we experience substantial increases in pharmacy and other operating costs. In order to achieve this reduced level of cost growth, we have implemented several initiatives that are intended to address unnecessary utilization of specialty care, including Standardized Clinical Assessment and Management Protocols (SCAMPs), a rapid-cycle quality improvement effort focused (in part) on the elimination of unnecessary utilization of services. We have worked with major pediatric primary care groups to develop shared care protocols in order to enable enhanced medical home capabilities. We have invested heavily in accountable care capabilities that target high-needs patients through enhanced care coordination and case management and integration of behavioral health. We also continue to explore enhanced telemedicine supports with an eye towards avoiding unnecessary visits and improving patient satisfaction, although the regulatory and financial environment does not optimally enable these efforts. At the macro level, pediatric spending is generally a very small proportion of overall health care spending. The Commonwealth is thus unlikely to meet its cost targets through a focus on pediatric spending (at least in the short term); as a corollary, efforts at Boston Children’s Hospital are likely to make only a small contribution to the state meeting its cost targets. However, nationally, it has been estimated that 6% of pediatric patients account for 40% of all pediatric spending and 80% of this spending is for inpatient, emergency department (ED) and outpatient care. These patients have highly complex chronic conditions and disproportionately rely on children’s hospitals. To that end, Boston Children’s Hospital remains committed to working on developing accountable care infrastructure that addresses this population, while also working on federal and state policy reforms to improve access to care for these patients and lowering health care costs.

2015 Cost Trends Hearing – Boston Children’s Hospital
c. Please describe specific actions your organization plans to undertake between now
and October 1, 2016 to ensure the Commonwealth will meet the benchmark, including e.g., increased adoption to alternative payment methods (including specifically bundled/episodic payments), participation in CMS Medicare Shared Savings, Pioneer or Next Gen programs?
Boston Children's Hospital has been aggressively pursuing cost reduction strategies since 2009, prior to the passage of Chapter 224 and the establishment of specific cost targets. In each of the years since that time, we have managed to keep unit cost growth well below Consumer Price Index (CPI-M) (for years prior to c. 224) and below the Massachusetts cost growth targets in the most recent period. We intend to continue our successful and sustainable strategies designed to eliminate unnecessary utilization, and to deliver care in the most appropriate setting. We think about cost containment from three perspectives: 1) how can we reduce our internal costs; 2) how can we reduce costs to the overall healthcare system through prevention-based strategies; 3) how can we attempt to ensure that these reductions are passed along to employers and consumers through price reductions? Boston Children’s Hospital has been working on efforts to reduce costs from every angle, including unit price, efficiency and utilization. The hospital has decreased our overall per unit cost, volume adjusted, each year for the last five years. We have taken over $125M of expenses out of our system. In FY2013 we implemented $76M in clinical cost savings and identified an additional $24M in cost savings for FY2014. If successful, we will surpass reductions in costs of over $200M over the last several years. In addition to internal cost reductions, the enterprise has worked to reduce the total cost of care to the health care system, including: reducing lengths of stay, reducing utilization, reducing admissions altogether, and transitioning care to lower-priced settings. For example, as part of our participation in the Blue Cross Blue Shield Alternative Quality Contract (AQC) through the Children's Hospital Integrated Care Organization (CHICO), we have worked across the continuum to support appropriate utilization of services and focused on cost-effective settings. Some examples include:
• Reducing Admissions: Our home ventilation program for technology-dependent children sends teams comprised of Intensive Care Unit (ICU) physicians, nurses, and respiratory therapists on home visits to prevent admissions to the ICU through better at-home management of these very complex patients. This program was featured by Blue Cross Blue Shield in its annual report this year (2014).
• Reducing ED Utilization: Asthma is the most common cause of ED admission for children in Massachusetts. Our community asthma initiative has reduced asthma ED visit rates by 68% for children with uncontrolled asthma through intense patient education and environmental mitigation efforts. Within CHICO, we have worked with our primary care practices to implement evidence-based strategies such as extended office hours, nurse call line offerings, and follow-up to sick visits.
• Lower-Priced Settings: Our physicians staff the pediatric services in a number of lower cost community hospitals in eastern Massachusetts. Our general experience is that these staffing

2015 Cost Trends Hearing – Boston Children’s Hospital
arrangements result in fewer admissions overall and fewer transfers of low complexity care to our Longwood campus. Similarly, we have increasingly used our outpatient satellites to deliver less-complex care in lower costs settings; nearly a third of all outpatient care is now delivered in these settings.
• Reducing Variability in Care Delivery: In addition to the SCAMPs efforts cited in Question 1b, we are undertaking a major cross-institutional initiative with the Healthcare Performance Initiative to continue to enhance our work around creating a culture of safety in the organization. The focus of this work is harm reduction (as opposed to cost containment/meeting state cost targets). We do expect it to lead to a reduction in medical errors consistent with your question. In general, we agree with the hypothesis that error reduction leads to enhanced value and reduced cost, though this can be difficult to prove with respect to individual initiatives. Nevertheless, these efforts to avoid harm are important in their own right.
• Further Development of Accountable Care Capabilities: We continue to make significant investments in our integrated care organization and will begin to roll out enhanced care management capabilities for medically complex patients. We are also working hard to enhance the capacity of our primary care network to address the needs of children with behavioral health concerns.
d. What systematic or policy changes would encourage or enable your organization to operate more efficiently without reducing quality?
The state should encourage the use of telemedicine capabilities and payors (including Medicaid) should define clear pathways for approval of its use. We should streamline requirements for credentialing providers including eliminating the requirement that individual hospitals need to separately credential providers offering "remote" services. The state should recognize that intermediate levels of care are frequently important mechanisms for improving patient flow within an inpatient facility and should assess as part of its Determination of Need regulatory review whether existing licensure statutes and regulations enable hospitals to flex beds and/or services at times of high need. Medicaid underpayment significantly constrains the overall ability to meet cost targets. Boston Children's Hospital and its physicians receives one third of its reimbursement from the Medicaid program, and in FY14 shouldered $120m in combined losses on these patients and routinely experiences rate reductions (as opposed to reasonable inflationary increases) from Medicaid. This experience should be factored in to the establishment of cost targets for individual institutions and for the overall system. Measures of quality for a pediatric population must include assessment of the care for patients with major chronic and complex conditions, in addition, to well child care measures which are very different from those for adults. Such measures (process and outcome) exist and are tracked by national consortiums of pediatric hospitals and are important indicators of the quality of high-acuity pediatric care. Examples include measures of lung function for patients with Cystic Fibrosis, and measures of

2015 Cost Trends Hearing – Boston Children’s Hospital
Blood Stream Infection for patients in pediatric ICU’s. We encourage the state to require the reporting of such measures from all entities in the Commonwealth providing care to such populations. Lastly, we should assure that patients with behavioral health needs receive the care they require on a timely basis and in a well-coordinated manner. There is a growing body of evidence that patients with co-morbid behavioral health conditions are some of the least well-managed and most costly patients in terms of their medical (i.e., non-behavioral health) needs. It is our frequent experience that the children we treat with behavioral health concerns experience by far the most bureaucratic hurdles in accessing the care they need. It is not a good clinical outcome or a good use of resources to have a child boarded on our medical floor for two weeks awaiting placement in a behavioral health hospital; this occurs all too frequently. We should absolutely assure that mental health parity protections are fully implemented, that we are closely monitoring the performance of payors in delivering behavioral health services, that we have adequate clinical capacity across all levels of care in the state to serve patients, and that we eliminate as many unnecessary bureaucratic barriers as possible to accessing necessary care. The state and its regulatory agencies must play a lead role in assuring this occurs.
2. What are the barriers to your organization’s increased adoption of alternative payment methods and how should such barriers be addressed?
There are several barriers that we have commented on in the past. First, the state still has not produced actionable data, inclusive of public payor data, for analytic purposes that is readily accessible to providers. Second, our largest payor not under an accountable care contract is Medicaid. Based on the current planning schedule, we expect to see an opportunity in January 2017. In pediatrics, a significant component of care and of our business is for complex children with heterogeneous conditions. We need pediatric-specific risk adjustment methodologies, a willingness of payors to collaborate around small numbers of complex patients, and the development of more regionalized approaches to alternative payment methodologies (APM’s). Finally, as a referral center, the vast majority of our patients are not members of our own primary care network – this makes the development of integrated approaches more challenging. Yet, this population is an important one to explore for appropriate alternative/accountable models.
3. In its prior Cost Trends Reports and Cost Trends Hearings, the Commission has identified four key opportunities for more efficient and effective care delivery: 1) spending on post-acute care; 2) reducing avoidable 30-day readmissions; 3) reducing avoidable emergency department (ED) use; and 4) providing focused care for high-risk/high-cost patients.
a. Please describe your organization’s efforts during the past 12 months to address each of these four areas, attaching any analyses your organization has conducted on such efforts.
Post-Acute Care: We do not agree that overuse of post-acute care for children is a problem and would like to see pediatric-specific analysis from the Health Policy Commission showing this is the case. In pediatrics, our strong preference is that children return home after inpatient admission. At times, this is facilitated through the use of home based services and supports (visiting nurses, care managers, etc.) Of course, returns home are not always possible for children in state custody or requiring habilitative care.

2015 Cost Trends Hearing – Boston Children’s Hospital
Reducing avoidable 30-day readmissions: The 30-day readmissions measures used by Medicare and the HPC suffer from two related problems as applied to children. First, the measures have typically been developed and validated on adult and elder populations (i.e. in some cases measure exclusions include children). Second, proprietary measures allege that they have been validated for children, but are “black boxes” that are not in the public domain and are not transparent in terms of their logic. This makes it extremely difficult for end users like us with many complex/outlier patients to utilize the tool for quality improvement purposes. This lack of transparency has also been well-understood by federal policymakers. As a national center of excellence in measure development, Boston Children’s was tasked by the Centers for Medicaid and Medicare Services (CMS) and Agency for Healthcare Research and Quality (AHRQ) to develop a validated pediatric readmissions measure, which has only just (this past year) been accepted by National Quality Forum (NQF) for endorsement. We do not know enough to know whether Massachusetts would rank high for pediatric 30 day readmissions in its pediatric population, and are unaware of any payor or policy-maker intending to collect this data comprehensively from all Massachusetts hospitals providing care to pediatric patients. A more complete description is available here: http://www.childrenshospital.org/research-and-innovation/research/centers/center-of-excellence-for-pediatric-quality-measurement-cepqm/cepqm-measures/pediatric-readmissions ED Use: At Boston Children’s Hospital our focus is on avoiding preventable ED use, not appropriate ED use. Much of our activity has been focused on providing information to, and developing quality improvement (QI) systems with our primary care practices and advocating for policies at the state level that are focused on continuity of primary care, and prevention focused policies and practices. Over the past 12 months the Children’s Hospital Integrated Care Organization (CHICO) has employed several tools to address avoidable utilization of the Emergency Department. These efforts touch on provision of care in the primary care setting for low acuity problems in order to avoid inappropriate use of the Emergency Department (ED), and on keeping patients with chronic conditions more stable in order to avoid complications leading to necessary ED use. Examples include reports to the primary care practices that are part of CHICO about patients in their panels who use the ED more than once. In addition, reports are delivered daily to these practices about any of their patients who were seen in the ED the previous day. The latter reports trigger outreach calls to address follow-up needs, and to educate families about afterhours access to the practice and about self-management of minor conditions, as well as improving preventive care for patients with chronic/complex conditions. Further, CHICO has undertaken learning communities on topics that have an effect on ED utilization. For example, we implemented a learning community on common orthopedic conditions and this led to increased primary care provider (PCP) competence and confidence in providing such care in the medical home, resulting in fewer referrals to the ED for these conditions and more care in the medical home. Asthma is one of the most common chronic disorders in childhood, and a leading cause of ED use and hospitalization in children. Boston Children’s Hospital has developed a highly regarded intervention

2015 Cost Trends Hearing – Boston Children’s Hospital
called the Community Asthma Initiative (CAI) which has since 2013 lead to a 68 percent had a decrease in emergency department visits, and 84.8 percent had a decrease in hospitalizations. It is important to note that our ED struggles to deliver care to two populations that severely impact operations and staffing. First, there has been a dramatic increase in the number of homeless families seeking overnight shelter in our ED in order to meet the Commonwealth’s eligibility requirements for emergency shelter. BCH provides the intensive social work and case management services that are necessary to safely discharge families from the ED into emergency shelter. Second, there has been an increase in the number of children coming into our ED in psychiatric crisis. These children often arrive because of an inability to access community-based care that may have prevented the need for acute care. These children often spend anywhere from 24 – 72 hours in our ED, which impacts patient flow, staffing patterns, operations and overall health care costs. High risk/high cost patients: CHICO has undertaken a number of efforts over the last 12 months to identify and support high risk/high cost patients. These include programs for our patients with asthma who have been hospitalized or visited the emergency department. We also have a care management program for patients with complex, multispecialty conditions. Further, we have an expanding program to integrate behavioral health into the primary care medical home, with a behavioral health clinician being an integral on–going member of the medical home team. This allows for early identification and action on developing behavioral health problems, thus avoiding crises that often lead to ED visits and admission. Another example is our Critical Care, Anesthesia, Perioperative, Extension (CAPE) and Home Ventilation Program which supports ventilator–dependent children living at home. This program involves physicians from our critical care medicine and anesthesia departments, as well as nurses and social workers, and it provides in-home assessment, education and support. This has led to avoidance of ED visits and hospitalizations. Many of these efforts are not reimbursed. The patients are often members of our referral population and, thus, the reduced medical services costs that result benefit payors, but reduce revenue to BCH and make it increasingly challenging to sustain such important work.
b. Please describe your organization’s specific plans over the next 12 months to
address each of these four areas. Post-Acute Care: We do not intend to do anything with respect to the use of post-acute care beyond continuing to work on assuring safe, high quality hand-offs. Reducing avoidable 30-day readmissions: We are intending to continue work with the other children’s hospitals nationally to test and potentially refine the measure. As a matter of practice, we have extensive work clinically and operationally to review readmitted patients.

2015 Cost Trends Hearing – Boston Children’s Hospital
ED use: Over the coming year we intend to institute systems to proactively identify patients at high risk for avoidable medical and behavioral health ED visits and admissions. We consider these some of the worst health outcomes for such patients. These efforts will involve close monitoring of these patients based on multiple sources of data, including claims, daily hospitalization and ED reports, and select clinical information. Risk stratification will be applied such that specific interventions will be triggered based on changes in the status of these children. The goal of this effort is to keep these vulnerable children more clinically stable and, thus, avoid clinical deterioration leading to ED visits and admissions. In addition, we have begun tracking the ED utilization of homeless families. BCH also continuously advocates for policy solutions to address these challenges with particular attention paid to emergency shelter regulations and access to community based mental health services. High risk/high cost patients: Over the coming year we intend to institute systems to proactively identify patients at high risk for avoidable medical and behavioral health ED visits and admissions. We consider these the worst health outcomes for such patients. These efforts will involve close monitoring of these patients based on multiple sources of data, including claims, daily hospitalization and ED reports, and select clinical information. Risk stratification will be applied such that specific interventions will be triggered based on changes in the status of these children. The goal of this effort is to keep these vulnerable children more clinically stable and, thus, avoid clinical deterioration leading to ED visits and admissions.
4. As documented by the Office of the Attorney General in 2010, 2011, and 2013; by the Division of Health Care Finance and Policy in 2011; by the Special Commission on Provider Price Reform in 2011; by the Center for Health Information and Analysis in 2012, 2013, and 2015; and by the Health Policy Commission in 2014, prices paid to different Massachusetts providers for the same services vary significantly across different provider types, and such variation is not necessarily tied to quality or other indicia of value. Reports by the Office of the Attorney General have also identified significant variation in global budgets.
a. In your view, what are acceptable and unacceptable reasons for prices for the same services, or global budgets, to vary across providers?
It is an acceptable reason for prices to vary if the underlying cost of care for the specific population is different. There are many reasons why the underlying cost of caring for children is greater including the time it takes to evaluate and treat them, the need to provide a much wider range of specialized equipment and customized pharmacy supports, and the relatively greater population of children with high complexity referred here for care. Until Massachusetts decides to pay hospitals and physicians more appropriately for care delivered to MassHealth members, it also reasonable to vary prices from private payors due to the need to cross-subsidize MassHealth losses. We have given a number of specific examples in our past answers to the HPC. Finally, it is worth noting that 25% of BCH inpatients are transferred from local Massachusetts hospitals, including other Boston based academic medical centers, making our stand by capacity an important and acceptable consideration in any price variation discussion.

2015 Cost Trends Hearing – Boston Children’s Hospital
b. Please describe your view of the impact of Massachusetts’ price variation on the overall cost of care, as well as on the financial health and sustainability of community and lower-cost providers.
Many “community and lower cost” providers do not provide pediatric care at all, and those that do, do not provide the highly specialized care delivered at Boston Children’s. For example, the average case mix for pediatric inpatients is approximately four times greater at Boston Children’s than at a community hospital. It is also commonly understood that adult systems cross-subsidize their pediatric care. We extensively benchmark our costs and the prices we receive from payors against other children’s hospitals on a yearly basis and are consistently below average in cost and price relative to our peers on a risk-adjusted basis. This information has been previously shared with the Health Policy Commission.
5. The Commission has identified that spending for patients with comorbid behavioral health and chronic medical conditions is 2 to 2.5 times as high as spending for patients with a chronic medical condition but no behavioral health condition. As reported in the July 2014 Cost Trends Report Supplement, higher spending for patients with behavioral health conditions is concentrated in emergency departments and inpatient care.
a. Please describe ways that your organization has collaborated with other providers over the past 12 months 1) to integrate physical and behavioral health care services and provide care across a continuum to these patients and 2) to avoid unnecessary utilization of emergency room departments and inpatient care.
Boston Children’s Hospital is committed to caring for patients with co-morbid physical and behavioral health care needs through provision of integrated mental health care within primary and specialty care medical services. These collaborations range from straight-forward co-location care to fully integrated care models. Some examples of these collaborations include:
• Social work, psychology, and psychiatry clinicians are available for consultation to medical/surgical specialty physicians throughout all medical/surgical inpatient units. These clinicians are supported by resource specialists and care coordinators, whose role is to access community resources for the patient and family in a timely manner, in order to decrease the need for more acute and costly services.
• Social work, psychology, and psychiatry clinicians are integrated into a number of specialty care programs where specific disorders are targeted including pain disorders, neurodevelopmental disorders, solid organ transplants, epilepsy, brain disorders, deafness/hearing loss, and pediatric cancers. These collaborations involve longitudinal care across both inpatient and outpatient settings, and focus on early identification and treatment of mental health co-morbidities in order to prevent the need for high-cost services.
• BCH continued its implementation of a stepped-care integrated healthcare model into its primary care clinics at Longwood and Martha Eliot Health Center as well as into 43of the Pediatric Physicians Organization at Children’s (PPOC), a network of 88 pediatric practices that provides primary care to 420,000children and adolescents in communities across eastern Massachusetts.

2015 Cost Trends Hearing – Boston Children’s Hospital
While BCH can care for patients with complex medical and behavioral co-morbidities in integrated primary and medical specialty clinics as well as outpatient and inpatient psychiatry services, we understand the importance of utilizing community resources to ensure that our patients have access to a broad spectrum of community-based services. Some examples:
• BCH patients with Medicaid are encouraged to use the range of Children’s Behavioral Health Initiative (CBHI) services to provide wraparound community-based care. This includes referral to community-based Emergency Services Providers in lieu of ED visits, when clinically appropriate.
• In the ED, BCH patients receive stabilizing intervention and are referred to diversionary levels of care, including partial hospital programs, home-based treatment, and Community Based Acute Treatment, whenever possible.
Because of our capacity to care for patients with medical and psychiatric co-morbidity as well as complex psychiatric illness, we are seen as a state-wide resource for complex psychiatric crisis. As a result, there is a high volume of patients in psychiatric crisis from outside of the Boston area who come to BCH for crisis care. Because of the high volume of acute needs and statewide lack of availability of a full care continuum for specialized populations, BCH faced a historic boarder crisis in the past year. BCH has increased support for these patients by hiring two full time social workers and increasing capacity in the Behavioral Response Team (BRT), a behavioral code team that is available 24/7 to address acute behavioral health needs for patients who are in non-behavioral health settings in the hospital. Over the past year, BCH leadership demonstrated its commitment to providing comprehensive and integrated care to patients with behavioral health care needs by convening teams of behavioral health and primary care leadership for the following initiatives:
• Medicaid accountable care organization (ACO) development. Behavioral health was one of four populations identified as critical to developing practice and outcome criteria within the ACO.
• Enterprise-wide Behavioral Health Task Force. With outside consultation, enterprise-wide experts identified how BCH can better meet the needs of patients with primary behavioral health diagnoses and co-morbid medical/behavioral health diagnoses.
• Community behavioral health. In response to the community needs assessment, this group has worked to create novel ways that BCH can address the behavioral health needs of the community.
b. Please describe your specific plans for the next 12 months to improve integration of physical and behavioral health care services to provide care across a continuum to these patients and to avoid unnecessary utilization of emergency room departments and inpatient care.
As a result of the work completed this year, Boston Children’s Hospital will embark on several new initiatives over the next year, each of which is designed to improve the capacity to provide care outside of the Emergency Department (ED) or inpatient setting.

2015 Cost Trends Hearing – Boston Children’s Hospital
• BCH will open a 14 bed Community Based Acute Treatment Center (CBAT) for children ages 8-17 on the BCH Waltham campus, projected to open in early 2016. This program will allow diversionary and step-down care for lower acuity patients in psychiatric crisis. It is anticipated that the CBAT will shorten lengths of stay in the inpatient unit and alleviate some of the boarder crisis by providing appropriate level of care for less acute patients.
• The Pediatric Physicians Organization at Children's Hospital (PPOC) currently has behavioral health clinicians embedded in 43 of 88 practices. We anticipate that over the next 12 months, the remaining practices will hire 15 BH clinicians. The role of the clinicians is to provide a stepped-care integration model in order to prevent high cost ED and inpatient care.
• BCH behavioral health leadership is exploring the development of a partial hospital program, in order to have a robust continuum of care for complex patients.
6. The Commission has identified the need for care delivery reforms that efficiently deliver
coordinated, patient-centered, high-quality care, including in models such as the Patient Centered Medical Home (PCMH) and Accountable Care Organizations (ACOs). What specific capabilities has your organization developed or does your organization plan to develop to successfully implement these models?
Patient Centered Medical Home (PCMH)- Hospital based practices
Our primary care network includes both a large, hospital-operated practice and a community-based network of pediatricians. With respect to the hospital owned and operated practice (Boston Children’s Primary Care at Longwood and Martha Eliot Healthcare Center), over the past two years Boston Children’s Hospital has invested in patient-centered medical home transformation using the Change Concepts from the Safety Net Medical Home Project. The practices seek to deliver high-quality, proactive preventive and acute health care to all of our primary care patients through the use of care teams, population management techniques, evidence-based care for chronic illness, and approaches which empower our patients. Below is a timeline of this work:
• Empanelment: In July 2013 the practices achieved the goal of assigning 95% of patients to a primary care provider and team and are currently maintaining that level. By August 2013 over 90% of patient families queried were able to correctly identify their primary care physician.
• Team-Based Care: In January 2013 the practices rolled out care teams that included nurses, clinical assistants, physicians, social workers, administrative staff, and patient navigators. All care is delivered through these patient care teams. By June 2014, 85% of staff reported that the teams were highly functioning.
• Loop Closure: Electronic communication strategies have been implemented for communication with specialists and loop closure is in place for referrals, labs, and tests.
• Population Management/Chronic Disease Management: Registries were established for patients with complex care needs, asthma, and obesity. Care coordination was instituted and patients’ progress in the medical system continues to be tracked. Patients in need of well child care are also tracked and supported using automated reports. Electronic decision-making support has been developed but is not yet in place for obese children.

2015 Cost Trends Hearing – Boston Children’s Hospital
• Patient Empowerment: A parent advisory board was established and there is a parent representative on the transformation team. A monthly newsletter provides seasonal advice. Group-based visits have been developed for obese children and their families, which include nutritional and direct exercise components and have been wildly successful. Group visits for children with asthma are now under development. Cultural competence training is mandatory for all staff.
• Mental Health Integration: The practices are now actively working on mental health integration with practice-wide screening, secondary assessment, stepped care and coordination.
Patient Centered Medical Home (PCMH)- PPOC With respect to the Pediatric Physicians Organization at Children's Hospital (PPOC), their undertakings in this space have been described elsewhere in this document with regard to:
• Behavioral health integration [Q5] • Primary care based strategies of cost reduction and ED utilization reduction [Q3] • Strategies to address high risk/high cost populations [Q3]
Accountable Care Organization (ACO) Boston Children’s Hospital is eager to implement a pediatric ACO to improve the health and quality of life of children living in/near poverty in the Commonwealth and to use resources efficiently and effectively. There are close to 60,000 children enrolled in the MassHealth program that receive care from a BCH-affiliated PCC. As noted above, MassHealth is our second largest payor. To that end we have been working on an ACO design that accounts for the large proportion of children with complex conditions in our primary care population (MCO’s and PCC), while also allowing for the exploration of models for the high complexity referral population. We have begun the implementation/simulation phase of this project. To support the work being done by the Executive Office of Health and Human Services (EOHHS) and the HPC on ACO development, experts from across Boston Children’s Hospital offered applications for each of the eight workgroups and we have representation on the following:
• Payment design • Certification • Attribution • Health home
7. Since 2013, Children’s Hospital Corporation (Children’s) has sought to reorganize its contracting entity and enter into new clinical affiliations. Please provide information, as described in more detail below, about these recent material changes and attach analytic support for your responses where available.
a. How have costs (e.g., prices and total medical expenses), referral patterns, quality, and access to care changed after these material changes?

2015 Cost Trends Hearing – Boston Children’s Hospital
The “new contracting entity” referred to in this question was the reorganization and capitalization of our primary care network IPA (the Pediatric Physicians Organization at Children’s). The contracting process that integrates the Children’s Hospital system of care – comprised of the Hospital (CHB), the specialists (PO) and the primary care physicians (PPOC) - had been in existence prior to this filing and the reorganization was not intended to alter referral patterns. Rather the purpose was to strengthen governance that enabled our primary care practices to expand its investment in population health management and quality improvement infrastructure, to take on risk contracts including the Blue Cross Blue Shield AQC and our in-process Medicaid ACO, and to support care innovations (“advanced primary care’) including, for example, the co-location of behavioral health clinicians across our network.
Our performance on the AQC and on quality measures more generally has been very strong, including our ability to control total medical expense (TME) trend (our average trend compares favorably to the wider BCBS network over the lifespan of the contract), as well as our ability to consistently perform at a market-leading level in pediatric clinical quality.
b. With regard to Children’s new contracting entity:
i. How has the reorganization of its contracting entity impacted the way Children's delivers care?
As noted, Boston Children’s Hospital’s contracting entity has not changed. This Notice of Material Change has not changed the way we contract. Independent of the Notice of Material Change, the Children’s Hospital Integrated Care Organization (CHICO) has been the pivotal vehicle through which our system has introduced meaningful changes to care delivery. Two examples of ongoing work, which have been discussed earlier in this document, include:
• Our primary care network has worked continuously with various sub-
subspecialties on practice redesign aimed at reducing avoidable use of specialty and/or emergency services. For example, treatment for non-critical orthopedic injuries, which used to be the top driver of our ED visits, now can often be retained within the primary care practices or obtain real time access to specialty consult. Protocols and standards of care are developed and installed through a cross-system training series which we call “Learning Communities” under the joint oversight of PPOC and PO leadership.
• CHICO has established a high-risk care management program that specializes in helping patients with the most complex medical needs. These patients are typically touched by multiple parts of the system (hospital, primary care, multiple specialties, home/community-based care) and success of their care and recovery is crucially dependent on the seamless coordination among these components. The CHICO program focuses on coordinating all aspects of patients’ interface with the delivery system, helping them adhere to an integrated plan of care, and addressing their comprehensive needs as they navigate through complex treatment processes.
We have consistently demonstrated that overall utilization of pediatric services for our network is lower than our peers which we believe represents our unique focus on children, better integration
2015 Cost Trends Hearing – Boston Children’s Hospital
across the system, the ability to provide more comprehensive care at the local (primary care) level, and an overall strengthen in delivering high-quality treatment outcome while minimizing wasteful, avoidable utilization.
ii. Children’s stated that the new contracting LLC will “support and manage
the development and implementation of an interoperable electronic health records system…[,] coordinate formation of a better integrated pediatric care network and…advance more generally patient population health management….” What progress has been made on these initiatives? Specifically, please describe steps taken to develop an interoperable electronic health records system and enhance integration of pediatric practices.
The Pediatric Physicians Organization at Children's Hospital (PPOC)primary care practices, have planned for the consolidation of the eMR system across all practices into a single system, which will support a shared interface with the broader CHICO network and enable system-wide interoperability and care coordination. The process received substantial consultative support from the Massachusetts eHealth Collaborative, and had all parties of the CHICO network at the table. We expect to announce our selection and begin the process of implementing the common platform across our network by the end of the year.
In addition, CHICO has also launched and continuously expanded the MyPatient portal, a data exchange platform dedicated to PCP-Hospital/specialty communication and sharing of patient records. MyPatient is now used not only by our PPOC practices, but also a growing number of referring networks that use the Children’s network for their pediatric services. Many of our other efforts have been mentioned in our answers to the earlier questions on PCMH development, avoidable ED use, behavioral health integration, etc.

2015 Cost Trends Hearing – Boston Children’s Hospital
Exhibit C: Instructions and AGO Questions for Written Testimony
Please note that these pre-filed testimony questions are for hospitals. To the extent that a hospital submitting pre-filed testimony responses is affiliated with a provider system also submitting pre-filed testimony responses, each entity may reference the other’s response as appropriate.
1. Please provide the following statistics related to consumer inquiries pursuant to G.L. Ch. 111, § 228(a)-(b), including but not limited to a summary table (using the template below) showing for each quarter from January 2014 to the second quarter of 2015 the volume of inquiries by method of inquiry (e.g., in-person/phone, website), the number of consumer inquiries resolved (e.g., an estimate was provided), and the types of services (e.g., MRI of knee) to which consumer inquiries pertained. Please explain why any consumer inquiries pursuant to G.L. Ch. 111, § 228(a)-(b) were unable to be resolved.
Number of Inquiries via Telephone/In
Person
Number of Inquiries via
Website
Number of Inquiries Resolved
Types of Services to which Inquiries Pertained (List)
CY2014
Q1 Q2 Q3 Q4
CY2015 Q1 Q2
38T Boston Children's Hospital
Estimates
Number of Inquiries via
Telephone/In Person
Number of Inquiries via
Website
Number of
Inquiries Resolved Types of Service
CY14
Q1 124 46 170 Surgery, Diagnostic Testing, Admissions, Consults Q2 140 17 157 Surgery, Diagnostic Testing, Admissions, Consults Q3 148 38 186 Surgery, Diagnostic Testing, Admissions, Consults Q4 213 44 257 Surgery, Diagnostic Testing, Admissions, Consults
CY15 Q1 238 45 283 Surgery, Diagnostic Testing, Admissions, Consults Q2 245 32 277 Surgery, Diagnostic Testing, Admissions, Consults
* Please note that data collection on a per services basis requires a lengthy manual review and is not available at this time
2. Please submit a summary table showing for each year 2011 to 2014 your total revenue under pay for performance arrangements, risk contracts, and other fee for service arrangements according to the format and parameters provided and attached as AGO Hospital Exhibit 1 with all applicable fields completed. To the extent you are unable to provide complete answers for any category of revenue, please explain the reasons why. Please see attached Excel document.

2015 Cost Trends Hearing – Boston Children’s Hospital
Exhibit 1: Trends in revenue, utilization and operating expenses

2015 Cost Trends Hearing – Boston Children’s Hospital
Appendix 1: Unique aspects of pediatric post-acute care
There are some unique aspects of pediatric post-acute care that may be of interest to the HPC. In general, the availability of facility-based post-acute care for children may be more limited than for adults, but is also likely to require more specialized settings and services. The options available are few and far between. As a result, we tend to have strong and well-coordinated communication between our clinical staff and the post-acute care settings, as we frequently need to "customize" a service for the unique needs of the child in question. At present, the only pediatric-specific post-acute inpatient medical facility in the Commonwealth is Franciscan Hospital for Children. They are a unique organization that provides a range of services from medical care, to behavioral health, to residential educational programming. Their capabilities are more comprehensive than those available through home health agencies or pediatric skilled nursing facilities. We believe that appropriate use of these services can reduce length of stay at BCH and reduce overall costs to the health care system because the Franciscan cost structure is lower than that at a tertiary/quaternary hospital like BCH. We have an ongoing joint clinical operations committee designed to plan and trouble shoot individual patient cases. It is worth noting that services for many pediatric patients tends to be habilitative as distinguished from rehabilitative (e.g., we are seeking to optimize a child's potential function, not to restore it to a prior baseline). For example, a three year old has not fully developed gross and fine motor skills, so a three year old receiving physical therapy services requires a different approach than a post-stroke elder. Like Boston Children's, Franciscan's cost structure differs from that of its adult-serving counterparts due to the relatively resource-intensive needs of children. For medically complex children or those with chronic illness, we are increasingly developing models of care (including telemedicine, home visiting, and the use of community health workers). These are frequently not reimbursed by payors. It is relatively common that hospitalized children with behavioral health needs step down to residential treatment programs. In this circumstance, we frequently must negotiate the transition with relevant payors (insurers and/or school systems). Given the limited capacity in Massachusetts and payor-specific issues, it would be inaccurate to say we choose where a child goes. We attempt to assure that children are placed in the best care setting given their clinical needs and profile, but frequently spend an enormous amount of time negotiating these placements. For home based services for children with behavioral health needs, we primarily rely on the matrix of services available through the Children's Behavioral Health Initiative (CBHI). These services are not available to privately insured patients, but arguably should be given the intermediate care requirements of the parity law.

Exhibit 1 AGO Questions to HospitalsNOTES: 1. Data entered in worksheets is hypothetical and solely for illustrative purposes, provided as a guide to completing this spreadsheet. Respondent may provide explanatory notes and additional information at its discretion.
3. Please include POS payments under HMO.4. Please include Indemnity payments under PPO.5. P4P Contracts are pay for performance arrangements with a public or commercial payer that reimburse providers for achieving certain quality or efficiency benchmarks. For purposes of this excel, P4P Contracts do not include Risk Contracts.6. Risk Contracts are contracts with a public or commercial payer for payment for health care services that incorporate a per member per month budget against which claims costs are settled for purposes of determining the withhold returned, surplus paid, and/or deficit charged to you, including contracts that subject you to very limited or minimal "downside" risk.
2. For hospitals, please include professional and technical/facility revenue components.
7. FFS Arrangements are those where a payer pays a provider for each service rendered, based on an agreed upon price for each service. For purposes of this excel, FFS Arrangements do not include payments under P4P Contracts or Risk Contracts.
9. Claims-Based Revenue is the total revenue that a provider received from a public or commercial payer under a P4P Contract or a Risk Contract for each service rendered, based on an agreed upon price for each service before any retraction for risk settlement is made.
10. Incentive-Based Revenue is the total revenue a provider received under a P4P Contract that is related to quality or efficiency targets or benchmarks established by a public or commercial payer.11. Budget Surplus/(Deficit) Revenue is the total revenue a provider received or was retracted upon settlement of the efficiency-related budgets or benchmarks established in a Risk Contract.12. Quality Incentive Revenue is the total revenue that a provider received from a public or commercial payer under a Risk Contract for quality-related targets or benchmarks established by a public or commercial payer.
8. Other Revenue is revenue under P4P Contracts, Risk Contracts, or FFS Arrangements other than those categories already identified, such as management fees and supplemental fees (and other non-claims based, non-incentive, non-surplus/deficit, non-quality bonus revenue).

2011
HMO PPO HMO PPO TOTAL HMO PPO HMO PPO HMO PPO HMO PPO HMO PPO BothBlue Cross Blue Shield 4,229,376 220,925,036 Tufts Health Plan 61,981,078 Harvard Pilgrim Health Care 93,024,232
Fallon Community Health Plan 7,207,027
CIGNA 10,721,844 United Healthcare 16,831,800 Aetna 21,472,859 Other Commercial 8,344,931 Total Commercial - - - - 4,229,376 - - - - - - - - - - 440,508,807
Network Health 16,681,553
Neighborhood Health Plan 48,310,153
BMC HealthNet, Inc. 26,702,794 Health New England - Fallon Community Health Plan -
Other Managed Medicaid 4,197,535
Total Managed Medicaid - - - - - - - - - - - - - - - 95,892,035
Children's Medical Security Plan 914,017
Medicaid Out of State 34,856,835
MassHealth 1,220,409 70,119,551
Tufts Medicare Preferred -
Blue Cross Senior Options -
Other Comm Medicare - Commercial Medicare Subtotal -
Medicare 27,639,225
Out of State Commercial 200,872,467
Other 91,373,187
GRAND TOTAL - - 1,220,409 - 4,229,376 - - - - - - - - - - 962,176,124
Revenue
FFS Arrangements Other RevenueRisk Contracts
Claims-Based Revenue Claims-Based RevenueBudget Surplus/(Deficit) Revenue
QualityIncentiveIncentive-Based Revenue
P4P Contracts

2012
HMO PPO HMO PPO TOTAL HMO PPO HMO PPO HMO PPO HMO PPO HMO PPO BothBlue Cross Blue Shield 1,724,960 16,174,852 (9,755) 1,332,351 96,990 184,570,047 Tufts Health Plan 62,479,716 Harvard Pilgrim Health Care 94,966,355
Fallon Community Health Plan 7,626,423
CIGNA 10,265,785 United Healthcare 19,842,059 Aetna 19,759,986 Other Commercial 9,518,299 Total Commercial - - - - 1,724,960 16,174,852 - (9,755) - 1,332,351 - - - 96,990 - 409,028,671
Network Health 13,537,172
Neighborhood Health Plan 42,708,188
BMC HealthNet, Inc. 21,334,393 Health New England - Fallon Community Health Plan -
Other Managed Medicaid 3,263,460
Total Managed Medicaid - - - - - - - - - - - - - - - 80,843,213
Children's Medical Security Plan 882,646
Medicaid Out of State 30,344,579
MassHealth 1,384,901 70,802,813
Tufts Medicare Preferred -
Blue Cross Senior Options -
Other Comm Medicare - Commercial Medicare Subtotal -
Medicare 25,912,658
Out of State Commercial 196,424,960
Other 83,279,603
GRAND TOTAL - - ######## - 1,724,960 16,174,852 - (9,755) - 1,332,351 - - - 96,990 - 897,519,143
Risk Contracts
(Deficit) Revenue IncentiveQuality
P4P Contracts
Incentive-Based RevenueRevenue
Claims-Based Revenue Claims-Based RevenueBudget Surplus/
FFS Arrangements Other Revenue
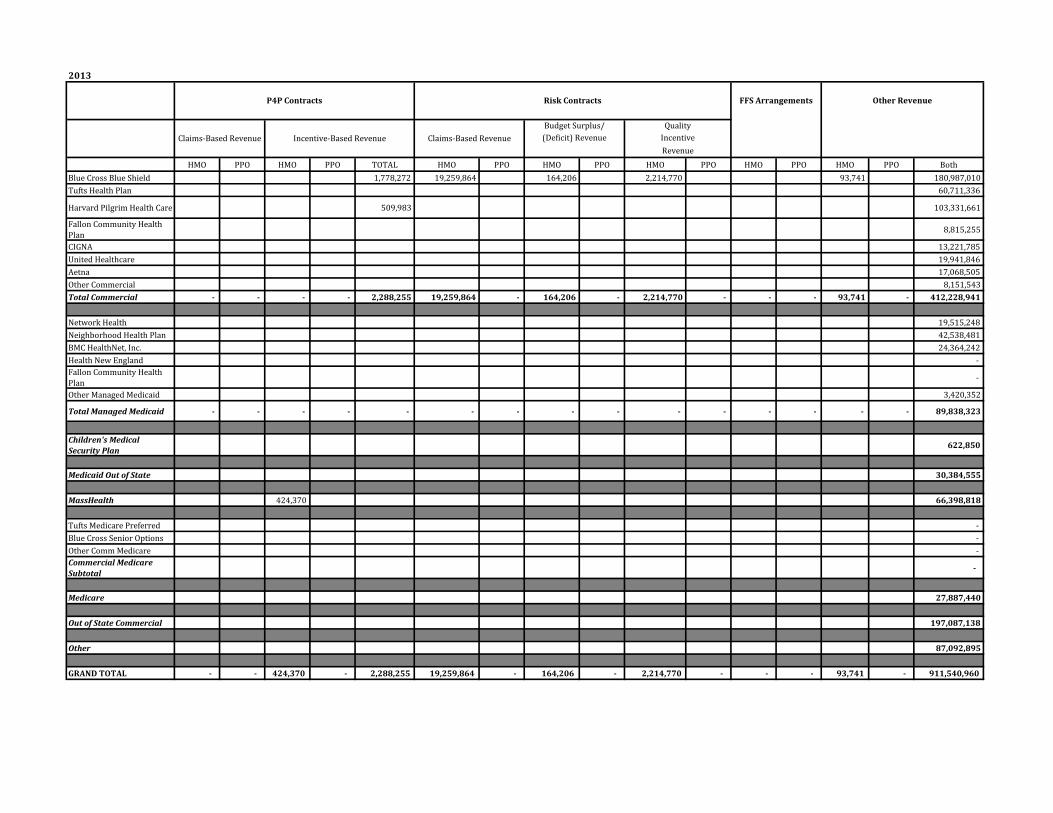
2013
HMO PPO HMO PPO TOTAL HMO PPO HMO PPO HMO PPO HMO PPO HMO PPO BothBlue Cross Blue Shield 1,778,272 19,259,864 164,206 2,214,770 93,741 180,987,010 Tufts Health Plan 60,711,336
Harvard Pilgrim Health Care 509,983 103,331,661
Fallon Community Health Plan 8,815,255
CIGNA 13,221,785 United Healthcare 19,941,846 Aetna 17,068,505 Other Commercial 8,151,543 Total Commercial - - - - 2,288,255 19,259,864 - 164,206 - 2,214,770 - - - 93,741 - 412,228,941
Network Health 19,515,248 Neighborhood Health Plan 42,538,481 BMC HealthNet, Inc. 24,364,242 Health New England - Fallon Community Health Plan -
Other Managed Medicaid 3,420,352
Total Managed Medicaid - - - - - - - - - - - - - - - 89,838,323
Children's Medical Security Plan 622,850
Medicaid Out of State 30,384,555
MassHealth 424,370 66,398,818
Tufts Medicare Preferred - Blue Cross Senior Options - Other Comm Medicare - Commercial Medicare Subtotal -
Medicare 27,887,440
Out of State Commercial 197,087,138
Other 87,092,895
GRAND TOTAL - - 424,370 - 2,288,255 19,259,864 - 164,206 - 2,214,770 - - - 93,741 - 911,540,960
Risk Contracts
(Deficit) Revenue IncentiveQuality
Incentive-Based Revenue
P4P Contracts
RevenueClaims-Based Revenue Claims-Based Revenue
Budget Surplus/
FFS Arrangements Other Revenue

2014
HMO PPO HMO PPO TOTAL HMO PPO HMO PPO HMO PPO HMO PPO HMO PPO BothBlue Cross Blue Shield 1,734,626 20,985,952 (126,323) 2,481,735 88,260 186,056,878 Tufts Health Plan 66,999,459 Harvard Pilgrim Health Care 454,660 97,240,715
Fallon Community Health Plan 7,156,187
CIGNA 13,335,221 United Healthcare 17,683,527 Aetna 17,693,362 Other Commercial 13,986,740 Total Commercial - - - - 2,189,286 20,985,952 - (126,323) - 2,481,735 - - - 88,260 - 420,152,090
Network Health 22,832,805 Neighborhood Health Plan 42,221,034 BMC HealthNet, Inc. 20,725,375 Health New England - Fallon Community Health Plan -
Other Managed Medicaid 4,778,428
Total Managed Medicaid 90,557,642
Children's Medical Security Plan 563,214
Medicaid Out of State 38,829,104
MassHealth 1,514,879 1,514,879 81,050,723
Tufts Medicare Preferred - Blue Cross Senior Options - Other Comm Medicare - Commercial Medicare Subtotal -
Medicare 28,488,531
Out of State Commercial 214,830,209
Other 106,329,544
GRAND TOTAL - - 1,514,879 - 3,704,165 20,985,952 - (126,323) - 2,481,735 - - - 88,260 - 980,801,057
Claims-Based Revenue Incentive-Based Revenue Claims-Based RevenueBudget Surplus/
(Deficit) Revenue
P4P Contracts Risk Contracts FFS Arrangements Other Revenue
Revenue
QualityIncentive