Sanderson, D.C.W., Allyson, J.D., Tyler, A.N. and Murphy ...
52
Sanderson, D.C.W. , Allyson, J.D., Tyler, A.N. and Murphy, S. (1992) An Aerial Gamma Ray Survey of Springfields and the Ribble Estuary in September 1992. Technical Report. Scottish Universities Research and Reactor Centre. http://eprints.gla.ac.uk/57327/ Deposited on: 24 January 2012 Enlighten – Research publications by members of the University of Glasgow http://eprints.gla.ac.uk
Transcript of Sanderson, D.C.W., Allyson, J.D., Tyler, A.N. and Murphy ...

Sanderson, D.C.W., Allyson, J.D., Tyler, A.N. and Murphy, S. (1992) An Aerial Gamma Ray Survey of Springfields and the Ribble Estuary in September 1992. Technical Report. Scottish Universities Research and Reactor Centre. http://eprints.gla.ac.uk/57327/
Deposited on: 24 January 2012
Enlighten – Research publications by members of the University of Glasgow http://eprints.gla.ac.uk

AN AERIAL GAMMA RAY SURVEY OF SPRINGFIELDS
AND THE RIBBLE ESTUARY IN SEPTEMBER 1992
D.C.W. SANDERSON, J.D. ALLYSON,
A.N. TYLER, S. MURPHY
SCOTTISH UNIVERSITIES RESEARCH AND
REACTOR CENTRE, EAST KILBRIDE

i
CONTENTS
1. INTRODUCTION Page 1
2. SURVEY PLANS Page 3
2.1 Detector Fields of View and Sampling Strategy
2.2 Baseline Mapping Page 5
3. FIELDWORK Page 7
3.1 Field Sampling
3.2 Detector Description Page 7
3.3 Installation
3.4 Flight Testing and Fieldbase Establishment
3.5 Recording Page 8
3.6 Field Measurements Page 9
4. DATA ANALYSIS Page 10
4.1 Sampling Analysis
4.2 General
4.3 Summary File Formation
4.4 Background Subtraction Page 11
4.5 Spectral Stripping
4.6 Altitude Correction and Calibration
4.7 Mapping Page 12
4.8 Quality Assurance
4.9 Status of the stripping and calibration constants
5. RESULTS AND DISCUSSION Page 15
5.1 Warton Bank Sediment Analysis & Interlaboratory Comparison
5.2 Aerial Survey Results Page 18
5.2.1 Measurement of 234m
Pa Page 20
5.2.2 Analysis of 234m
Pa & 228
Ac Page 23
5.2.3 Analysis of 208
Tl
6. CONCLUSIONS Page 35
7. REFERENCES Page 37
APPENDICES Page 39

ii
Acknowledgements
We would like to acknowledge the considerable contribution to this work of Roger Cheshire,
(BNF), whose logistic support and navigational input resulted, as usual, in a rapid and
effective survey. We would also like to thank Capt. Paul Heathcoat (Dollar Helicopters) and
supporting staff for skilful and efficient flying, and Bill Rose and staff of BAe Warton (Flight
Operations) for making us feel welcome and providing office facilities.
In addition we wish to express our thanks to Roger Wilson, Miss Mary Kerr and Mark
Parker (BNF) and S. Ni-Riain and Margaret Graham (SURRC) for support with fieldwork.
The survey was commissioned from SURRC by British Nuclear Fuels plc.

iii
SUMMARY
A short aerial gamma ray survey was conducted in the vicinity of the Springfields site and
Ribble Estuary from 1st-5
th September 1992, to define existing background radiation levels,
against which any future changes can be assessed. A twin engine AS 355 "Squirrel"
helicopter chartered from Dollar Helicopters was used for this work. It was loaded with a
16 litre NaI(Tl) gamma ray detector and spectroscopy system on the 31st August and during
the following days over 2700 separate spectra were recorded within a survey area of 20 x
12 km. Gamma ray spectra were recorded every 5 seconds at survey speed and altitude of
120 kph and 75 m respectively. A flight line spacing of 0.3km was chosen for the main
survey area. On the 3rd
September a low altitude, high spatial resolution (flight line spacing
100m and altitude 30m) was made over Banks Marsh (an area frequented by local wild
fowlers).
Survey results have been stored archivally and used to map the naturally occurring
radionuclides 40
K, 214
Bi & 208
Tl together with 137
Cs and total gamma ray flux. In addition, for
the first time, estimates of 234m
Pa in terms of deconvoluted count rate (normalised to 100m
altitude) were made in the presence of 228
Ac interference probably in disequilibrium with its
parent thorium series.
The maps provide a clear indication of the distribution and sources of environmental
radioactivity in the Ribble at the time of the survey. The Ribble estuary is subject to regular
and ongoing ground based studies by BNF, MAFF, HMIP, and University based groups, as
a result of the authorised discharges of low level radioactivity from the Springfields site. The
results of this survey complement this ground based work, and add to confidence that the
estuarine system, it's associated sediments, tide washed pastures, salt marshes and river
banks, have been thoroughly examined. There is support for earlier conclusions that the Cs
on the salt marshes is the dominant source of external gamma exposure, and that the
Springfields contribution to these locations is minor in comparison with this, Sellafield
derived, signal. Upstream the situation is more complex, particularly where the dynamic
sources of beta radiation are considered. As far as critical group assessments are concerned
the survey provides clear evidence that the areas affected by 137
Cs, where external gamma
dose and possible food chain effects are of greatest interest, are in the lower reaches of the
Ribble, whereas, at the time of the survey the 234m
Pa distribution was in the upper reaches
of the river. This not only confirms the findings of ground based work, but provides some
assurance that the different exposure paths (external gamma dose, skin dose) are not entirely
synergistic. The discovery of possible transient sources of natural 228
Ac in the salt marsh
environment as a consequence of Th series disequilibrium immediately following spring tides
is extremely interesting. If substantiated by further studies using semiconductor detectors this
provides a new insight into the dynamic radiation environment of tide washed contexts.
Aerial survey can potentially provide a rapid and cost effective means of studying
environmentally dynamic sources such as 234m
Pa. In the case of the Ribble it would be
necessary to reduce survey height to below 50m ground clearance to improve spatial
resolution. Possible inconvenience to residents and property owners of such low altitude
flights would have to be considered in addition to the potential value of environmental
knowledge of the behaviour of short lived nuclides in a dynamic system such the Ribble
estuary. There is nonetheless considerable potential for time series studies of this location.

iv
Recent flight trials by SURRC incorporating high efficiency germanium semiconductor
detectors have verified the feasibility and potential a hybrid scintillation/ semiconductor
spectrometer. Such a device can resolve any ambiguities arising from overlapping gamma ray
peaks. This is particularly relevant to the confirmation of 228
Ac in salt marshes. Ground based
sampling at the time of measurement would enable concentration calibrations to be made for
these dynamic sources. Further ground based measurements would be desirable to establish
the extent to which low energy photons contribute to external gamma ray dose rates from
sources with pronounced subsurface activity maxima.

1
1. INTRODUCTION
A short aerial gamma ray survey was conducted in the vicinity of Springfields from 1st-5
th
September 1992 as part of a continuing programme of baseline mapping for nuclear sites.
The survey, commissioned by BNF, extends the baseline surveys of BNF owned nuclear sites
to three (Calder Hall, Chapelcross and Springfields). The main purpose was to define the
existing radiation background from aerial survey heights to enable future changes to be
assessed following repeat surveys. Additional objectives were to determine the capability of
aerial survey radiometrics in the mapping of 234m
Pa and 228
Ac in the Ribble Estuary, and to
demonstrate the high spatial resolution capability of the aerial survey technique. For
calibration purposes and to aid data interpretation, soil samples were collected from a
predetermined hexagonal sampling plan and analysed in the laboratory at SURRC. At the
same time, a few samples were collected simultaneously by BNF for inter-laboratory
comparison.
Aerial radiation survey techniques are particularly well suited to large scale environmental
surveys and are highly complementary to subsequent ground based investigations. Their main
strengths derive from the mobility of the observational platform, in this case a helicopter, and
the spatial response of the detector, which averages signals over a field of view which can
extend to several hundred metres. By recording a sequence of gamma ray spectra in flight,
interleaved with navigational data and radioaltimetry it is possible to map the total radiation
fields above a survey area. This leads to a highly effective means of locating areas of
enhanced radiation, especially in remote locations or difficult terrain 1-7
. The method can be
applied to total area searches at regional or national level, and the remote sensing nature of
such measurements minimises exposure of survey teams to contamination or radiation
hazards. These considerations, together with the speed of measurement, typically more than
two orders of magnitude faster than ground based approaches, lead to important potential
contributions to emergency response planning and implementation.
The ability to work in a complementary manner with ground based teams is no less
important, allowing limited conventional resources to be effectively directed to areas of
greatest need. Ground based in-situ spectrometry is capable of high spatial resolution and
sensitivity, and leads naturally to sampling for investigation of radionuclide profiles and
chemical speciation. However these methods alone are not particularly effective for large
scale surveys due to their inherent lack of speed and low sampling densities. The combination
of aerial observations and ground based studies provides a powerful approach to
comprehensive evaluation of the radiation environment.
The radiation environment of BNF sites has been under study for many years for operational,
regulatory, emergency response and research purposes. The majority of this work has been
based at ground or sea level. However a brief aerial survey was conducted in Cumbria in
October 1957 8,9
immediately following the Windscale Fire. Although at that time the
equipment available was not capable of spectral discrimination, the dominant nuclide, 131
I,
was estimated by scaling total counts to ground measurements. More recently SURRC has
conducted some 15 aerial survey projects using fully spectrometric equipment. These have
included upland areas of West Cumbria affected by the Chernobyl accident and historic
Windscale discharges10
, the immediate surroundings of the Sellafield11
and Chapelcross12
plants, and an area 2500 km2 of Ayrshire districts for baseline definition purposes
13, South

2
West Scotland14
and searches for lost radioactive sources 15
.
The BNF Springfields Works manufactures fuel and fuel products for nuclear power stations
in the UK and abroad16
, and is authorised by HMIP to discharge low levels of liquid effluent
into the Ribble via a continuous discharge pipeline. Authorised discharge limits have
historically been applied to total alpha and beta activity , and since October 1991 to include
additional nuclide specific limits for 232
Th, 230
Th, Uranium,237
Np and 99
Tc. BNF reports
demonstrate that only small proportions of the authorised discharge limits have been
discharged in recent years16
. Additional solid waste have been disposed of at Clifton Marsh,
where radioactivity levels are satisfactorily within authorised limits. BNF conduct regular
monitoring and sampling programmes of the Ribble estuary in particular measuring external
gamma dose rates in silt and sediment at 8 statutory monitoring stations, and a number of
additional points. In addition MAFF Fisheries Directorate examine coastal waters and
mudbanks17
, and further monitoring is conducted, particularly for Uranium in faeces, soil and
grass near Springfields, but also recently of similar samples from the Ribble river bank near
the Springfields outfall18
. The radiation environment of the Ribble is both dynamic and
multinuclide. Contamination arising from Sellafield discharges (particularly 137
Cs and 241
Am)
is known in the area, and gives rise to the main component of external gamma dose rates to
critical groups. However the Springfields derived 234m
Pa, a short lived U series daughter
supported by 234
Th, may represent a local source of beta exposure during periods where the
plant is operational. The increasing importance of skin dose under ICRP 60 assessments has
been pointed out recently19
, and although this component of radiation exposure is expected
to remain within dose limits to the public, there is increasing interest in the behaviour of such
nuclides in dynamic estuarine systems.
This project therefore aims to define the distribution of both the main components of external
gamma exposure, to support ground based sampling and monitoring programmes, and to
examine the possibility of detecting the dynamic components associated with beta emitters.
It is hoped that the production of total area maps may help not only to focus future
monitoring and sampling programmes, but also may offer some assurance to the general
public that the distribution of activity arising from past low level discharges is well known.
3
2. SURVEY PLANS
2.1 Soil Sampling Strategy
Typically a detector measuring 137
Cs at aerial survey altitudes of between 50m and 100 m has
a field of view of 130 m and 195 m radius respectively (dependent upon the source mass
relaxation depth). This typically represents a centre weighted area sampled of 6x10⁶ and
1.4x10⁷ greater than a typical 2 kg soil sample. Thus, clearly, there is a problem in spatially
matching soil sample strategies with in-situ detector measurements. This in conjunction with
inherent site variability requires ground verification with soil samples to take into
consideration site variability and the centre weighted averaging of activity within the field
of view of the detector.
Detector fields of view can be calculated with photon transport equations, which take into
consideration of detector altitude and shape, the distribution of source activity within the soil
or sediment column, attenuation within the soil and air path length and photon energy (Refs).
Having determined the fields of view for the underlying environmental parameters a sampling
plan can be developed to match these calculated fields of view.
Several sampling strategies have been developed at SURRC based on concentric circles
weighted to match the field of view of 137
Cs at 100m 12-14
. This sampling strategy, whilst able
to quantify the amount of activity within the field of view of the detector at 100 m height
with an associated sampling error, it was not flexible in its ability to estimate activity for any
detector height above ground for any radionuclide, nor quantify the variability within a
particular field of view with sample spacing.
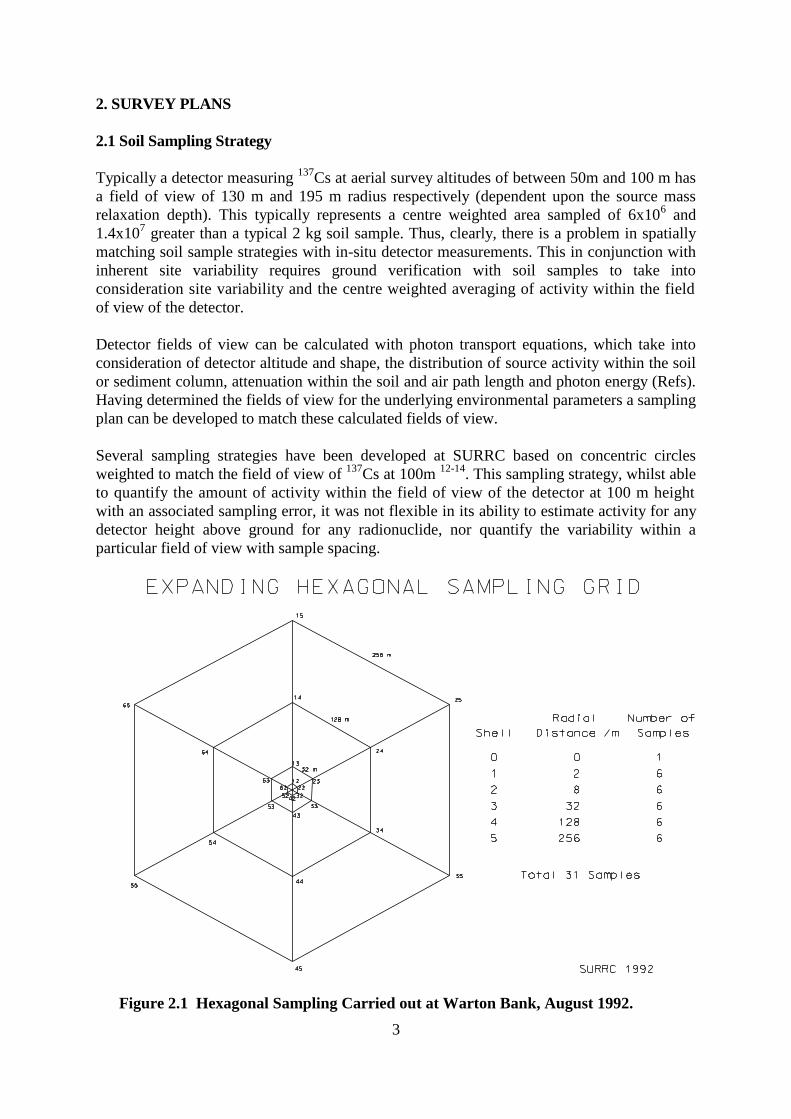
Figure 2.1 Hexagonal Sampling Carried out at Warton Bank, August 1992.

4
The expanding hexagonal sampling plan was developed as part of PhD research at SURRC
and was illustrated on the Caerlaverock salt marsh 13,14
and Wigton salt marsh 14
. For the
purposes of flexible calibration and consistency, an identical sampling plan was set up on
Warton Bank for Springfields calibration. Shells can be set up on a x 2, x 3 or x 4 basis.
Figure 2.1 illustrates the five shell configuration set up on Warton Bank.
By weighting the inventories associated with each shell appropriately, the sampling plan can
be forced to match the circle of investigation for a detector at any appropriate height. When
using this weighting in the averaging of shell inventories and sampling errors, this will
provide the mean inventory associated with that detector height as illustrated in figure 2.2.
Provisional site locations were determined in the laboratory prior to field work on the basis
of representability of the area of interest, access and safety both from land and air, potential
activity distribution and lateral extent. With these criteria, Warton Bank was identified as the
ideal site, with Banks Marsh held as a possible alternative.
2.2 Baseline Mapping
The survey area comprised a main rectangular box 20 x 12 km approximately centred about
Figure 2.2 The Relationship between the Circle of Investigation for 137
Cs at 100 m
altitude and the appropriately weighted Hexagonal Sampling Strategy.

5
the Ribble Estuary and River together with a single flight line up the River Ribble through
Preston (figure 2.3).
The main zone, bounded by OS coordinates SD 300320, 500320, 300200 and 500200 was
flown at 300 m resolution and selected to provide detailed baseline map of the distribution
of anthropogenic and natural radionuclides in the area to the south and west of Springfields.
This includes the towns of Lytham St Annes, Freckleton, Hutton, Longton, Much Hoole,
Tarleton, Banks and the very northern part of Southport.
East-West flight lines were chosen, set 300 m apart and labelled sequentially as illustrated
in figure 2.4. Flight speed and integration period were selected to provide comparable spatial
resolution along the flight lines. The baseline survey also included an area of detailed
surveying, flown at 30 m altitude and by free flying at approximately 100 m line spacing
centred around Banks Marsh, also illustrated in figure 2.4.
This flight plan was chosen to in order to aid the new and advanced development of the
aerial survey technique to the mapping of 234m
Pa and 228
Ac in the environment. Banks Marsh
was chosen for detailed spatial flying because of interest expressed by Springfields into
critical group assessment on this site with special regard to wild fowlers.
Provision was made to conduct the survey from BAe Warton Aerodrome, which was
centrally located in the survey area. Working space for data reductions and processing was
provided by Flight Operations. Ground power was supplied to the survey instruments
Figure 2.3 The Survey Area and River Ribble

6
onboard the helicopter via a portable generator.
Figure 2.4 Flight lines flown in the Ribble Estuary

7
3. FIELDWORK
3.1 Field Sampling
On the 26th
August, permission was gained by the local farmer to visit Warton Bank salt
marsh. Exploratory investigations by A.N. Tyler and M. Graham (SURRC) with a 3"x3"
NaI(Tl) detector coupled to a Canberra Series 10 MCA, confirmed the approximately
homogeneous 137
Cs signals across the site. Therefore a decision was taken to proceed with
sampling. The field team was then joined by M. Kerr (BNF Springfields) and M. Parker
(BNF Sellafield). The sampling hexagons were surveyed rapidly using a compass, ranging
rods and a pre-marked guide string. Each sampling location was marked by a wooden peg.
A total of 31 sampling locations were laid out as illustrated in figure 2.1. Two transects (1
and 4, positions 1 to 5) and the central core were then rapidly sampled (figure 2.1) with a
105 mm soil corer to 30 cm depth, under extremely poor weather conditions. The samples
collected were whole and intact. These were bagged and carefully labelled. A parallel set
of samples was collected from 5 sites with a 71 mm diameter corer at locations 01, 12, 13,
14, 42, 45 for cross comparison between the SURRC and BNF (Sellafield) coring systems.
The following day, 27th
August, the remaining 4 transects and 20 cores were collected. The
centre of the hexagonal site was clearly marked to aid identification from the air, and a
central in-situ gamma spectrum recorded at ground level.
3.2 Detector Description
The spectrometer comprised a standard 16 litre NaI detector coupled to an SURRC aerial
radiometrics rack containing instrumentation power supplies, EHT, pulse height analyzer and
data logging computer. The installation incorporates a flexible power supply capable of
operation from mains, under self power for a period of roughly one hour (which may be
supplemented with external batteries) and for unlimited periods when supported by the
aircraft 28 V dc supply. The equipment was shock mounted to a laminated fibreboard
baseplate rigidly mounted to the rear section of the helicopter floorpan. This installation was
devised to ease rapid installation following the 1990 Sellafield survey with Dollar helicopters,
and has been approved by CAA following brief flight trials in 199120
. It was used
successfully during the Chapelcross baseline survey12
. Navstar XR-4 GPS satellite navigation
system was incorporated in the spectrometer, following successful functional trials in 1991,
and proved extremely useful at Chapelcross. This survey also used GPS position logging.
The uncertainties in stand-alone mode are typically better than 50m, but can be extend to
100m or poorer on occasions. An opportunity was taken to evaluate a real-time differential
GPS facility which uses corrections from a fixed terrestrial base station, transmitted to the
aircraft via a telemetry link, to compensate for error producing terms in the stand alone
receiver, including the deliberate degrading signal introduced by the US Department of
Defence under "selective availability". This differential system operated successfully,
producing estimated precision of better that 5-10m in the aircraft, and would be useful for
any future high-resolution (ie line spacing of 100m or better) surveys which might be
contemplated in the future.
The detector consisted four identical 10x10x40 cm NaI scintillators, operated through a bifet
8
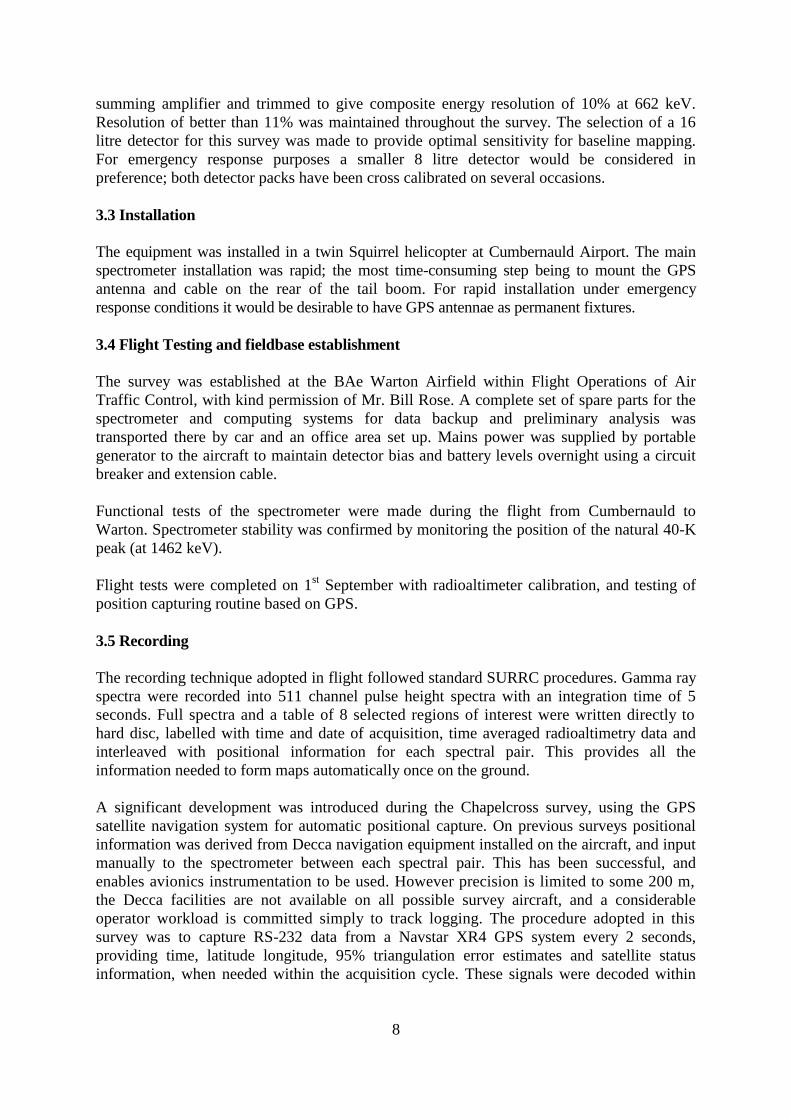
summing amplifier and trimmed to give composite energy resolution of 10% at 662 keV.
Resolution of better than 11% was maintained throughout the survey. The selection of a 16
litre detector for this survey was made to provide optimal sensitivity for baseline mapping.
For emergency response purposes a smaller 8 litre detector would be considered in
preference; both detector packs have been cross calibrated on several occasions.
3.3 Installation
The equipment was installed in a twin Squirrel helicopter at Cumbernauld Airport. The main
spectrometer installation was rapid; the most time-consuming step being to mount the GPS
antenna and cable on the rear of the tail boom. For rapid installation under emergency
response conditions it would be desirable to have GPS antennae as permanent fixtures.
3.4 Flight Testing and fieldbase establishment
The survey was established at the BAe Warton Airfield within Flight Operations of Air
Traffic Control, with kind permission of Mr. Bill Rose. A complete set of spare parts for the
spectrometer and computing systems for data backup and preliminary analysis was
transported there by car and an office area set up. Mains power was supplied by portable
generator to the aircraft to maintain detector bias and battery levels overnight using a circuit
breaker and extension cable.
Functional tests of the spectrometer were made during the flight from Cumbernauld to
Warton. Spectrometer stability was confirmed by monitoring the position of the natural 40-K
peak (at 1462 keV).
Flight tests were completed on 1st September with radioaltimeter calibration, and testing of
position capturing routine based on GPS.
3.5 Recording
The recording technique adopted in flight followed standard SURRC procedures. Gamma ray
spectra were recorded into 511 channel pulse height spectra with an integration time of 5
seconds. Full spectra and a table of 8 selected regions of interest were written directly to
hard disc, labelled with time and date of acquisition, time averaged radioaltimetry data and
interleaved with positional information for each spectral pair. This provides all the
information needed to form maps automatically once on the ground.
A significant development was introduced during the Chapelcross survey, using the GPS
satellite navigation system for automatic positional capture. On previous surveys positional
information was derived from Decca navigation equipment installed on the aircraft, and input
manually to the spectrometer between each spectral pair. This has been successful, and
enables avionics instrumentation to be used. However precision is limited to some 200 m,
the Decca facilities are not available on all possible survey aircraft, and a considerable
operator workload is committed simply to track logging. The procedure adopted in this
survey was to capture RS-232 data from a Navstar XR4 GPS system every 2 seconds,
providing time, latitude longitude, 95% triangulation error estimates and satellite status
information, when needed within the acquisition cycle. These signals were decoded within

9
the SURRC data logging programme and appended to spectroscopy files in an identical
manner to previous surveys, thus ensuring compatibility with mapping software. A parallel
navigational log summary was also recorded to permit assessment of the GPS performance.
Options to revert to external input or to record data for retrospective track reconstruction
have been retained for use in the event of GPS failures.
The possibility of using differential GPS for high resolution aerial survey applications was
investigated with assistance from Clive de la Fuente of NavStar. This proved successful, and
would be useful for low altitude, high spatial resolution (<100m) radiometrics. For work
with stand alone GPS, the nominal 100m or better precision is well within the detector fields
of view (400-500m) at normal aerial survey altitudes.
The choices of 5 second integration time, 65 knot speed and 60-75 m nominal ground
clearance were made after consideration of the spatial response of the detector, performance
data for the helicopter, and the counting statistics of the 16 l. detector. The field of view of
the detector varies with survey height and gamma ray energy21-23
. There is also a slight
topographic influence. However the most important feature for practical purposes is the
influence of aircraft height. A static detector receives 90% of its signal from a centre
weighted zone with diameter at 662 keV of roughly 4-5 times the ground clearance. At 75-
100 m altitude this means an effective spatial smoothing of 300-500 m. Allowing the aircraft
to transit a distance up to this circle of investigation within each reading leads to a safe and
economical flight without loss of spatial detail. It is extremely important to take the spatial
characteristics of these data into account when interpreting features recorded, and when
making comparisons with ground based results.
The detector display during flight indicated the position, acquisition status, average height
above ground and gross and net rates within 8 spectral regions of interest. This display was
updated every 5 seconds in flight. All of these data plus full pulse height spectra were
recorded on hard disc.
The procedures for archival backup and data transfer are described more fully in section 4.
The essential feature is that duplex backup copies of all data and initial reductions were made
on the aircraft and transferred to a ground based computer before clearing the primary copies
and resuming survey.
3.6 Field Measurements
Each daily flight was preceded by a check on the resolution of the 662 keV line from 137
Cs,
using a 370 kBq reference source placed beneath the aircraft. Detector gain was continuously
monitored using the natural 40
K peak, and maintained within 1% of 6 keV per channel at all
times.

10
4. DATA ANALYSIS
4.1 Soil Sample Analysis
On return to the laboratory the samples were cut into 15cm intervals with five samples
collected from the north-south transect divided into 2 cm and 5 cm intervals in order to
determine the source mass depth characteristics. These samples were then weighed and dried
at about 40 oC. Once dry, the samples were reweighed and subsequently ground and
homogenised in a 1 kg capacity Mixer Mill. Sub-samples were then taken and placed in
standard size 150 cc polystyrene geometry containers.
Two 50% relative efficient n-type HPGe detectors were then calibrated. This was undertaken
with uncontaminated soils of varying density spiked with an Amersham International mixed
gamma radionuclide reference standard. Thus the calibration is density compensated and all
samples are IAEA traceable. Samples were counted rapidly, with sufficient counting statistics
for 241
Am and 137
Cs validation.
Also, several surface samples were counted for several days on a Ge(Li) detector soon after
the field work for 234m
Pa measurement, paying particular interest to the 1001 keV and 766.4
keV energy lines.
4.2 General
Each full record stored by the spectrometer includes quality assurance information on
acquisition time, positional fixes, radioaltimetry data, a table of integrated count rates in
preselected regions of interest together with estimates of their associated poisson errors, plus
the full spectra recorded over 511 channels. Gain stabilisation is achieved using the natural 40
K peak. A gain monitor is based on comparing the ratio of two windows (k1/k2) arranged
to bisect the 1462 keV full energy peak. If this ratio is significantly different from 1 then
gain adjustments can be made manually to the detector high voltage. Keeping the gain
monitor between 0.7 and 1.3 is equivalent to better than ±1% gain shift, and this in turn has
previously been shown to have a negligible effect on spectral characteristics.
The acquisition rate during survey was high - resulting in over 2700 gamma spectra recorded
over the four survey days. The emphasis of SURRC data handling procedures has been to
allow such sets to be reduced rapidly and in a manner which automatically leaves a traceable
quality assurance trail. A suite of programmes has been developed in the "AERO" package,
capable of flexible reduction, analysis, mapping, statistical summarisation and spectral
display. Production of mapped survey data follows five main stages described below together
with a brief statement on quality assurance and a summary of the present status of the
calibration. Preparation of hard copies of maps and archival results was conducted afterwards
at SURRC.
4.3 Summary file formation.
The first stage of data reduction was the formation of compressed summary files - each
containing a series of single line entries for each spectral observation. These comprise the
positions, altitudes and 6 integrated count rate estimates at preselected energy windows.

11
Windows were chosen, to estimate 137
Cs, 234m
Pa, 40
K, 214
Bi, 208
Tl and the total dose rate using
an integrated window above 450 keV. Each line of survey data was initially assigned a single
summary file. Formation of summary files, and tabular printout was conducted during the
survey in a manner which kept pace with the previous flight. Numerical assessments were
therefore available on the day of flying.
4.4 Background Subtraction
The second stage of data analysis was to link the summary files forming the survey area
together into area records of net count rate. Detector background count rates (recorded at
high altitude or over clean water) were subtracted at this stage. A complete summary file
describing the net data set was formed in the process, together with a header recording the
background count rates used. This net file is also printable in tabular form, and is available
for mapping or for subsequent calibration.
4.5 Spectral Stripping.
Spectral interferences occur with NaI spectroscopy due to the combined effects of unresolved
full energy peak overlap (line interference) and scattering both in transport from source to
detector and also within the detector. This leads to multiple contributions to net count rates
within each integrated window. These are deconvoluted using a matrix inversion stripping
method which depends on values for the fractional interference from pure radionuclide
sources into each region of interest. A matrix of fractional interferences between each
channel is assembled and inverted. Stripped counts for each channel are obtained by matrix
multiplication of the inverse stripping matrix and a vector representing net count rates.
Again a full file copy of the data set is produced in printable form, available for mapping or
further analysis.
As with previous surveys the stripping matrix was estimated by laboratory measurements
of pure nuclide sources. In this case however a set of standard 1 m2 calibration pads, doped
with potassium, U series and Th series activities was used in preference to small scale
laboratory sources. The pads themselves were purchased in 1991 through the Geological
Survey of Canada24
and are an internationally traceable standard for field spectrometry. In
addition, stripping matrices were experimentally derived to account for altitude dependence.
The simulation of the air column between source and detector was achieved by using perspex
sheets of suitable thicknesses. Monte carlo simulation of gamma-ray scattering within the
environment and detector may eventually lead to the determination of a final set of
corrections for stripping in standard aerial survey detectors.
The detector response to 137
Cs has been made from carefully fabricated doped plywood
sheets, providing a surface area of 1m2. The placement of these sheets upon a background
calibration pad (a blank), provides a more realistic simulation of the physical form of the
activity found in the environment, than has been previously been made.
4.6 Altitude Correction and Calibration.
The final conversions to calibrated data combined altitude corrections with sensitivity
estimates. Stripped data were first converted to standardised values at 100m altitude. The

12
form of the altitude dependence is an exponential integral, however a simple exponential
approximation is adequate for survey heights over 30m above ground. Coefficients were
determined in 1990 during the SURRC survey of Ayrshire 13
: the altitude dependence factor
of 234m
Pa was determined by simple interpolation from existing data. Calibration was
achieved (with the exception of 234m
Pa) using a set of linear equations determined by
comparison of ground based readings from known sites with aerial survey data. The
calibrated data set has been printed out and is stored archivally at SURRC for future
reference.
4.7 Mapping
Radiometric maps were produced from the calibrated data following standard procedures.
The calibrated data files were read into the AERO program, and latitude and longitude
coordinates transformed to OS grid references, which were also used as plotting coordinates.
This produced an implicit set of x and y values for each observation. Thereafter the
calibrated level for each nuclide was sequentially selected for allocation to the z variable. A
new routine to allow concatenation of "XYZ" files was used at this stage to produce complete
records for each nuclide individually, covering the whole survey. These files can be read
back into the package directly as a quick entry point to mapping, and can also be exchanged
with standard mainframe graphics packages. Before mapping, the z values were examined
statistically (histograms, summary statistics) and assigned to up to 14 colour codes using
linear or logarithmic coding. Linear coding was applied to all channels except 137
Cs.
Once colour-coded the individual data points were plotted in their appropriate colours on a
high resolution monitor and then subject to a spatial contouring procedure whereby each
screen pixel was replaced by the colour code corresponding to the average value of all data
points within a certain locality, weighted inversely in proportion to distance from the implied
position. Screen capture routines were used to store the resulting images, which were then
printed using a Tektronix 4697 colour inkjet printer. Geographical detail was added using a
CAD/CAM system.
4.8 Quality Assurance
Attention was given to quality assurance at all stages of the work. The recording technique
and data nomenclature are designed to enable a continuous check of spectrometer operation
possible in flight, and to allow rapid traceability of full records from each reading for quality
control purposes thereafter. The archive for the survey is fully retrievable, doubly backed
up, and use has been made of ASCII text only files for all data storage to enable quality
assurance checks to be made. The data reduction stages are all self recording, and the archive
is so structured that primary data can be examined readily where any unusual features have
been located. Finally the algorithms used have been tested with known data.
4.9 Status of the Stripping and Calibration Constants
The values of stripping factors and calibration constants used in this work are shown in
appendix A. These represent current SURRC working values at the time of the survey. Such
values are under continual review, and may therefore be subject to future change. Their
status is as follows.

13
The stripping factors have been discussed above. Although experiments with absorbers and
transport calculations are expected to lead to further revisions to stripping matrices in the
future, this is only likely to effect Cs estimates close to the detection limit of approximately
1 kBq m-2
. For spectra where full energy photons comprise the major contribution to window
count rates, stripping has a neutral effect. An error analysis of the stripping process was
conducted in 1988 following the SURRC survey of West Cumbria10
. This showed that the
combined statistical errors in full energy peak estimates for 137
Cs at levels above 15 kBq m-2
were better than ±10%. In the tide washed pasture context the statistical precision of 137
Cs
is typically better than 2%.
The gamma dose rate estimates were derived by scaling integrated spectra above a 450 keV
threshold to ground based dose rate measurements on calibration sites. This high energy
threshold method derives from a ground based technique designed to avoid problems
associated with the low energy over-response of scintillation detectors. It is believed to be
accurate within ± 10-15% for evaluating dose rates from natural media. The potential of
systematic underestimation from anthropogenic sources with complex vertical distributions
has been recognised, but not yet quantified.
The calibration data for nuclide inventories, and any associated systematic errors, depend on
comparison between ground sites where inventories have been estimated by gamma
spectroscopy of collected cores with correlated aerial survey data. The values used here
derive from an analysis of data from Warton Bank and Caerlaverock where ground to air
comparisons could be made, spanning a range of 137
Cs activities from 0-500 kBq m-2
. It is
implicit in the calibration process that the vertical distribution of activity in the survey area
is comparable with that from calibration sites. Furthermore it is vital that lateral spatial
association, and spatial variability of deposition be considered when comparing aerial survey
and ground measurements. Aerial survey results are spatially smoothed over 104-10
5 m
2
whereas soil cores typically represent sampling areas of 10-2
m2, or less. Ideally calibration
experiments would be conducted over uniform areas of deposition. While this may be
practicable for natural radioactivity, it rarely, if ever occurs with anthropogenic deposition
in the environment.
The original calibration performed in 1988 used data obtained from 12 sites in SW Scotland
selected from over 50 analysed to maximise Cs contrast. An extremely good correlation
between aerial and ground based data was obtained. The resulting working calibration was
concordant in West Cumbria (1988) with spatially matched results from 1400 soil samples
collected by MAFF on a 200m cartesian grid, however the high degree of spatial variability
exhibited by the latter, and the relatively small numbers of associated aerial survey
observations limited more detailed conclusions. SURRC surveys in 1989 were calibrated by
re-flying calibration sites and lines through West Cumbria using new detectors and projecting
sensitivity estimates onto them, and collecting a limited number of extra cores from each
survey to confirm traceability. Procedures for overlaying two or more aerial survey data sets
and cross comparing their results were developed for this purpose.
Finally in 1990 a new set of local calibration sites was defined in Ayrshire with ground
samples collected in a manner which attempts to overcome the problem of spatial matching.
In this work each site has a pattern of 17 soil sampling locations laid out on three concentric
arcs around a marked centre with an area density which approximates the field of view of

14
a static aerial survey detector. Aerial survey readings are taken on these sites while hovering
at various heights above the centre marker, thus providing better counting statistics than
obtained during dynamic calibration measurements, and data to determine altitude
corrections.
The unweighted mean of the 17 soil cores gives a better ground estimate of mean activity
than single cores or other sampling configurations. These new sites produced a total of over
150 soil samples for high resolution gamma spectroscopy. A preliminary analysis of roughly
half of these data together with old sites was used to determine the 1990 working values
which were used to calibrate these data. The working values are not significantly different
from those used in earlier surveys - suggesting that sensitivity estimates may be approaching
final values. For 137
Cs they are also within error of theoretical sensitivity estimates based on
laboratory efficiency determination and geometrical integration of uniform activity
distributions.
The expanding hexagonal sampling plan tested at Caerlaverock extended this concept of
spatial weighting of soil cores so that response functions at different altitudes could be
evaluated. The results from both in-situ gamma spectrometry and soils cores at this site
indicate that it had maximal 137
Cs activity it the centre point, with a significant fall-off at
radial distances beyond 32 m. from the centre point. Natural nuclides were much more
uniformly distributed. The weighted estimate for 137
Cs, based on high resolution gamma
spectrometry, for the activity seen at 100m altitude is 50.8 kBq m-2
. This value compares
with observed values of 49.8 kBq m-2
(BNWES168A , 66 m height), 41.6 kBq m-2
(BNWES168b, 74 m) and 39.6 kBq m-2
(BNWES169a, 100m) recorded above the calibration
mark on 6th February, and evaluated using the "working" sensitivity values. The aerial
survey results thus appear to underestimate inventory by some 20-30% on this site. Given
the lateral variability (by more than 50% over the detector field of view), and the possibility
that vertical activity profiles are variable throughout the tide-washed zones, it was decided
to note this potential under-response but to retain earlier working values for the purpose of
mapping, thus ensuring consistency with previous surveys, and avoiding over-estimation of
inventories for near surface terrestrial sources.
The vertical distribution determined at Caerlaverock showed a pronounced sub-surface
maximum at 10-15 cm depth, which is one obvious contributory factor for the systematic
under-response in estimating inventory on the tide washed pasture. Where the lateral
dimensions of tide washed pastures are smaller or comparable with the field of view of the
detector, then there is further potential for compounded under-estimation of Cs inventories
by aerial survey. Therefore it is recommended that the inventory estimates be interpreted
cautiously as representing probable lower limits to the inventories of tide washed contexts.
These factors should not be overlooked in making comparisons with ground based
observations.
In light of the experience at Caerlaverock, a calibration site for the Springfields survey was
required. The site had to represent an effective infinite plane source that was potentially
uniform in its characteristics. Hence the site at Warton Bank was chosen. Subsequent
laboratory analysis of the soil cores illustrated significant 137
Cs sub-surface maxima across
the site which lead to a marked change in the calibration constant as illustrated in section 5.1.

15
5. RESULTS AND DISCUSSION
5.1 Warton Bank Sediment Analysis and Interlaboratory Comparison
The results of the soil core analysis are illustrated in Appendix B in terms of both activity
per unit weight and activity per unit area. The sample location numbers are illustrated in
figure 2.1. Six of the samples from the north-south transects have been selected and
subdivided into 2 cm and 5 cm depth distribution portions. The remainder were divided into
to 15 cm intervals. The data is summarized as integrated inventories with depth and are
illustrated in table I.
By weighting the expected observations from each shell appropriately, the expected activity
observed by the detector can be calculated and used for calibration. Table II illustrates the
spatially weighted and averaged results for a detector at 1 m, 50 m and 100 m altitudes. The
relatively small change in inventory estimates with detector height illustrates the relative
spatial homogeneity of the site, in contrast to that experienced at Caerlaverock salt marsh.
Relatively large changes in inventory estimates are observed at sample spacings of 256 m
(table I), which does not contribute significantly to the error estimate of detector calibration
Table I Integrated Inventories from the Expanding Hexagon at Warton Bank for 137
Cs
Activities (kBq m-2
).
Transect Hexagonal Shell No (Spacing m)
No. 0 (0) 1 (2) 2 (8) 3 (32) 4 (128) 5 (256)
1 314.20 338.52 349.45 315.19 366.75 53.68
Error 5.13 11.49 13.24 7.70 5.88 1.17
2 301.11 285.68 230.61 189.93 132.17
Error 10.48 9.90 7.77 6.53 4.14
3 431.12 386.37 217.32 204.96 159.65
Error 14.64 13.00 7.31 7.16 5.41
4 159.89 321.19 159.87 175.13 610.94
Error 5.65 11.15 5.44 2.78 10.50
5 395.41 388.92 412.00 360.36 265.53
Error 12.88 12.99 14.28 11.02 7.63
6 334.58 364.31 226.02 110.74 138.21
Error 11.60 12.56 8.30 3.98 4.78
Mean 314.2 326.77 349.32 260.17 234.65 226.70
St. Dev. 5.13 85.93 36.53 81.67 95.76 182.73
St. Err. 35.08 14.91 33.34 39.10 74.60

16
at 100 m altitude (table II).
However, of particular importance to aerial survey observation interpretation and calibration
is the source depth distribution within the sediment profile. This phenomenon is illustrated
in both A.N. Tyler and J.D. Allyson's forthcoming PhD thesis'25,26
and has a considerable
control on the photon fluence rate. Source depth distribution is quantified in terms of mass
depth (g cm-2
). Figure 5.1 illustrates the variation in source depth of 137
Cs across the
calibration site at Warton Bank. There is a clear decrease in the sub-surface maxima with
distance from the Ribble River, although over the central portions of the area (within a 128
m radius), the mean mass depth appears to remain fairly constant. Such source burial must
have overriding consideration in the interpretation of aerial survey data. A significant change
was observed in the calibration constant for 137
Cs. This is explained by the source burial
characteristics; greater than that observed at Caerlaverock; and thus the new calibration
Table II Illustrating the Spatially Weighted Mean Activities for 137
Cs at Caerlaverock
Sampling Site
Radius Percent Cumulative Activity St. Dev. St. Error
metres Weighting Percentage kBq/m2
1 σ of Mean
Detector Height 1
0 10 10 314.20 5.13 5.13
2 70 80 326.77 85.93 35.08
8 17 97 349.32 36.53 14.91
32 3 100 260.17 81.67 33.24
Weighted Mean 327.35 28.60
Detector Height 50 m
2 2 2 326.77 85.93 35.08
8 7 9 349.32 36.53 14.91
32 47 56 260.17 81.67 33.24
128 34 90 234.65 95.76 39.10
256 10 100 226.70 182.73 74.60
Weighted Mean 255.72 93.49 38.12
Detector Height 100 m
2 1 1 326.77 85.93 35.08
8 2 3 349.32 36.53 14.91
35 32 35 260.17 81.67 33.34
128 45 80 234.65 95.76 39.10
256 20 100 226.33 182.73 73.60
Weighted Mean 245.33 107.36 43.63

17
constant had to be employed for this survey. However, this is likely to cause an
overestimation in the 137
Cs activity associated with weapons testing and Chernobyl fallout on
land by a factor of 2.6.
234m
Pa concentration estimation for the Warton Bank site was calculated to be of the order of
40 kBq m-2
. This estimate is prone to considerable analytical error for statistical reasons, and
represents an upper limit to the activity, decay corrected to the time of sampling. This is
significantly lower than observed in samples collected by BNF in other upstream areas of the
Ribble, with typical 234m
Pa/137
Cs values of about 100 (Wilson pers comm). However this is
consistent with the observed distributions of 234m
Pa and 137
Cs found by the aerial survey.
228
Ac levels on Warton Bank are estimated to be in the region of 12 kBq m-2
and 40
K, 214
Bi
and 208
Tl are of the order of 170 kBq m-2
, 8.8 kBq m-2
and 4.5 kBq m-2
respectively (20 %
error). These provide calibration coefficients consistent with the Caerlaverock calibration
site. From these levels measured at Warton Bank, it would appear that 208
Tl was
approximately in equilibrium with 228
Ac at the time of measurement. Therefore any excess 228
Ac which had been present at the time of sampling, or which was present the following
week during the aerial survey (after a high spring tide had flooded the salt marsh) was
probably unsupported by 228
Ra.
The results of the inter-laboratory comparison of samples collected by BNF and SURRC at
Warton Bank are illustrated in figure 5.2. The random distribution about the 1:1 comparison
line suggests that the small discrepancies are controlled by sampling error. Current
verification of this is underway with each laboratory measuring the others samples.
Figure 5.1 Illustrating the change in 137
Cs mass depth profile with position across the
Warton Bank calibration site. Spacing between sampling positions = 128 m.

18
5.2 Aerial Survey Results
A frequency histogram of survey gain stabilisation (k1/k2 ratio) is shown in figure 5.3. From
this data and figure 5.4, it is possible to estimate the average and range of percentage gain
drift during the entire survey. A mean of 1.11 corresponds to a gain of -0.45% and is likely
to be easily within the experimental accuracy of figure 5.4.
The baseline maps for 137
Cs, 40
K, 214
Bi, 208
Tl, gamma dose rate and estimates of stripped 234m
Pa & 228
Ac are presented in figures 5.7 to 5.17. In interpreting these maps the spatial
averaging of the aerial measurements and the contouring process should be taken into
account, together with the comments on underresponse from buried sources above. This leads
to a slight tendency to broaden spatial features and to reduce maximum values particularly
for boundaries less than the spatial resolution (500m) of the survey. Small scale features will
also be underestimated.
Figure 5.2 Illustrating the results from corresponding samples collected by BNF and SURRC
at Warton Bank.

19
Figure 5.3 Variation in k1/k2 ratio.
Figure 5.4 k1/k2 ratio as a function of percentage gain shift.

20
The 137
Cs map shows a number of features associated with the Springfields site and the liquid
effluent from Sellafield discharges accumulating in the tidal waters of the River Ribble. The
most significant levels of 137
Cs are found in the salt marsh regions near the entrance of the
estuary, where inventories up to and over 500 kBq m-2
are observed, both from the aerial
survey and from the calibration measurements undertaken by SURRC and BNF. The
upstream signal does not extend much further than 1km east of Savick Brook to any degree,
however small source geometry may have led to the underestimation of signals from narrow
mudbanks in these areas. It would appear that the historical development of land reclamation
at Hesketh Out Marsh and Hesketh New Marsh, is reflected in the variation of deposition.
For the latter the tidal barrier may have been breached at high tide during the past or
redistribution of soil may have occurred through farming practices (as indicated by the
corresponding variations of the natural emitters).
Weapons fallout and Chernobyl derived Cs contamination is below 14 kBq m-2
, and will be
overepresented due to the calibration factor used.
Geologically the area is predominantly represented by Permian and Triassic sandstones and
mudstones. However, the natural radionuclides (40
K, 214
Bi & 208
Tl) show variations which
reflect the local soil types and sedimentation processes. Saltmarsh deposits appear to have
elevated levels of potassium and thalium, although land management have altered any
characteristic features (also seen in the bismuth map). Estuarine sediments have lower
associated natural radioactivity due to relatively higher water content and tidal inundation.
Terrestrial soils show enhanced bismuth levels; this may indicate potential radon emission
from these soils and underlying sandstones.
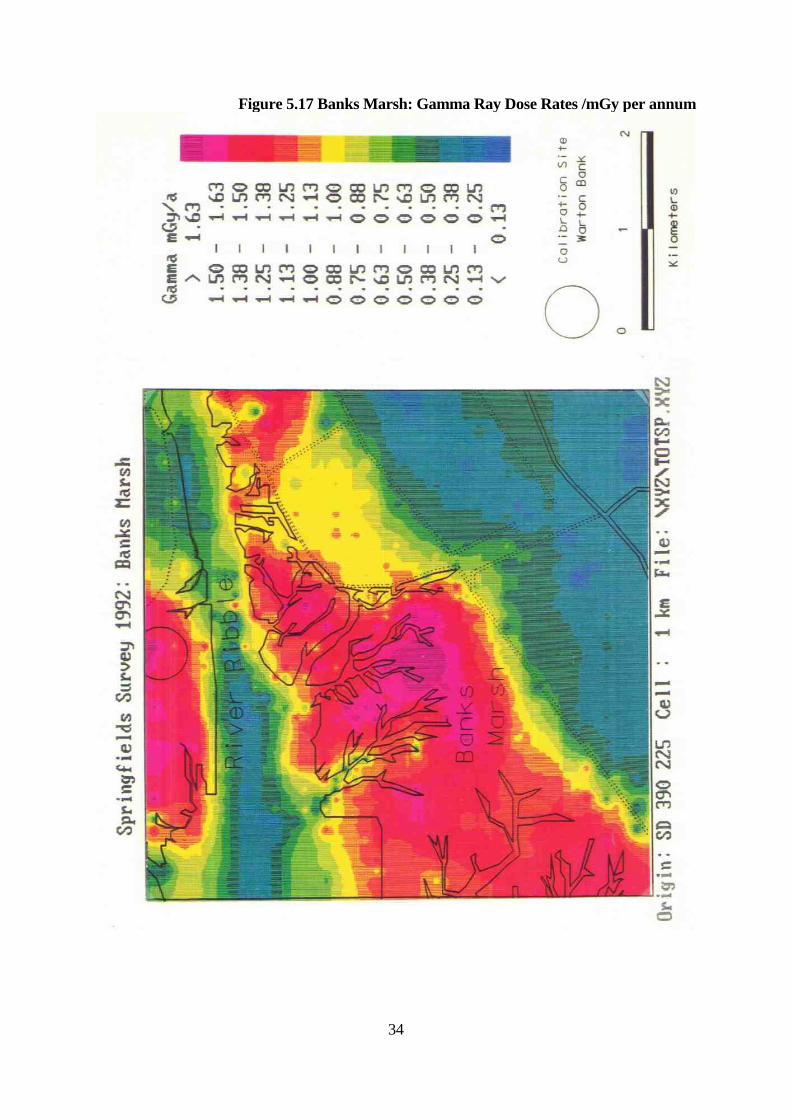
The gamma dose estimates correspond strongly with 137
Cs deposition. Thus occupancy of the
Banks Marsh region, and other salt marsh areas identified by the survey, is of particular
significance, and should be taken into consideration with respect to critical group
assessments. MAFF has identified the critical group to be a small number of people who live
on house boats moored in the muddy creeks of the Ribble Estuary 16
.
High resolution mapping of Banks Marsh was conducted in response to BNF interest in the
radiological implications for wild fowlers. Flights were made at approximately 30m altitude
and about 100m flight line spacing. These results are shown in figures 5.15-5.17.
5.2.1 Measurement of 234m
Pa
The potential measurement of 234m
Pa was investigated at SURRC prior to the Springfields
survey, by analysis of the spectral response of the survey detector from depleted uranium.
During the processing of the Springfields data and the mapping of 234m
Pa, it became clear that
either:
a). 234m
Pa is distributed more widely than previously thought, or
b). an excess count-rate occurred in the 234m
Pa channel window owing to detector gain drifts,
or
c). an unforeseen interference had been measured.
Calibration of 234m
Pa to equivalent concentration levels was not possible owing to insufficient
ground based measurements and therefore height corrected (to 100m) stripped count rate only

21
is displayed. Following a careful visual inspection of the full spectral measurements, 234m
Pa
was positively identified at Springfields from data recorded during flights made around the
perimeter of the plant or at greater than 500 ft altitude above the site, under the supervision
of Roger Cheshire. A second observation was seen near the riverbank in Preston (BNF has
documented this source during past discharges). In the Ribble estuary, a low intensity peak
is observed corresponding in energy to about 930 keV, below that of 234m
Pa (1001 keV).
Throughout the survey and concurrently with all spectral information, a detector gain drift
indicator was employed based on relative measurements of the 40
K peak (the detector package
contains deep insulation to reduce thermally induced effects, to which the NaI(Tl) crystal is
susceptible). Subsequent analysis of this showed that the observed gain drifts (typically less
than +-1% at one standard deviation, although the effects of a 1.45% gain adjustment on the
first survey day were detected) showed that this could not account for the energy difference
described above. The gain stability is further discussed in connection with 208
Tl is discussed
in section 5.2.2.
The possibility was examined that peak summing between 662 keV and low energy
backscattered photons might be responsible for a low count rate signal at 930 keV which was
spatially correlated with the presence of high environmental levels of 137
Cs. However
laboratory investigations using multiple sources confirmed that the detector was capable of
sustaining up to 10 times the count rates of 137
Cs observed in this survey without gross peak
shape effects. Furthermore there is a possible sum peak (see figure 5.6) at approximately 800
keV, which is more consistent with the main backscatter energy, and would not supply the
necessary joint count rate to account for the observed count rate from 900-1000 keV.
It is therefore postulated that an excess 228
Ac signal, owing to disequilibrium with respect to
the parent 232
Th radioisotope, is seen in these regions. Three gamma-ray emission lines of 228
Ac occur at 911, 964 and 969 keV. The resolution of the detector is such that a single
broad peak is formed by the superimposition of these lines. Figure 5.5 shows the summation
of three spectra, two near Springfields and one near Preston, to accentuate the 234m
Pa peak.
Likewise, figure 5.6 shows the accumulation of ten spectra to show the broad 228
Ac peak (this
peak is nevertheless low in intensity). The presence of unsupported 228
Ac in the salt marsh
environment following recent tide washing is a new suggestion. However it is in principle
consistent with the expected chemical behaviour of Th series nuclides in this situation. The
parent 232
Th is known to be relatively insoluble and particle reactive. By contrast, it's
immediate daughter, 228
Ra is relatively soluble, and extractable from estuarine sediments.
The next series member 228
Ac, which rapidly decays to 228
Th, is again an insoluble and particle
reactive species. The presence of 228
Ra in estuarine waters, and depletion of 228
Th relative to 232
Th in sands and muds have both been observed in the near shore marine environment. The
possibility that 228
Ac can be preferentially deposited on salt marshes, while postulated here
for the first time, seems to be geochemically quite credible.

22
Figure 5.5 234m
Pa Accumulated Spectra
Figure 5.6 228
Ac Accumulated Spectra.

23
5.2.2 Analysis of 234m
Pa & 228
Ac
Attempts have been made to separate the 234m
Pa/228
Ac pair, using an extension of standard
SURRC data processing procedures. This has been particularly difficult owing to the almost
overlapping nature of the observed peaks. Excessive overlapping of spectral windows is
undesirable, therefore two narrow and adjacent windows (140-160ch, 160-180ch) were
tentatively chosen instead of the single 150-185 channel window as used during the survey.
It must be noted that each peak contributes to some extent into its neighbouring window.
A 6x6 stripping matrix was formed using experimental and monte carlo based results. Since
an experimental gamma-ray measurement of a pure source of 228
Ac is not presently available,
an estimation of its spectrum was calculated at aerial survey heights and with full simulation
of the detector package.
Upon reintegrating the entire dataset, and producing new summary, net and stripped count-
rates, the full survey area was remapped. Comparison with the previous preliminary stripped
count-rates showed near identical results for 137
Cs, 40
K, 214
Bi and 208
Tl. Analysis of 234m
Pa and 228
Ac stripped data showed a very strong correlation between the two, likely caused by
inadequate separation due to overlapping peaks and poor deconvolution. However, the
probable interpretation from this advanced processing provides a reasonable indication of the
distribution of the two radioisotopes: 234m
Pa is clearly seen at Springfields and at the upper
reaches of the Ribble, with some elevated levels at grid references 436272, 456278, 478287,
490288 and 504292; 228
Ac is estimated to be in regions of the salt marsh and Springfields.
Other spuriously high estimates, particularly of 234m
Pa in the more inland regions, can only
be explained in terms of processing limitations.
Recent flight trials by SURRC incorporating a high efficiency (50% rel.eff.) semiconductor
detector into the aerial survey package have proven the feasibility of operation and would
enable the study of complex or interfering multi-energy gamma ray fields.
5.2.3 Analysis of 208
Tl
Post flight data processing revealed that for flights BNF4B, BNF4E, BNF4F, BNF4G,
BNF4H, and BNF4I, an unusually low k1/k2 ratio had existed (approximately 1.3% gain
increase). Since a choice of IAEA recommended channel windows had been chosen for the
survey, which are somewhat narrower than SURRC windows by 5-20 channels, it was
reasoned that detector drifting may have had more significant affects than previously
experienced.
The preliminary mapping of 208
Tl showed an unusually linear feature corresponding to the
area in which these measurements were taken. An investigation into the possibility that
drifting may have introduced errors into the estimation of this radionuclide was made. A
correction was conceived by means of averaging (2 successive pairs) the k1/k2 ratio, to
reduce statistical effects. Upon remapping 208
Tl, the same attribute remained.

24
Figure 5.7 137
Cs /kBq m-2

25
Figure 5.8 40
K /kBq m-2

26
Figure 5.9 214
Bi /kBq m-2

27
Figure 5.10 208
Tl /kBq m-2

28
Figure 5.11 Gamma Ray Dose Rates /mGy per annum

29
Figure 5.12 Combined 234m
Pa & 228
Ac Stripped cps (corrected to 100m)

30
Figure 5.13 234m
Pa Stripped cps (corrected to 100m)

31
Figure 5.14 228
Ac Stripped cps (corrected to 100m)

32
Figure 5.15 Banks Marsh: 137
Cs /kBq m-2

33
Figure 5.16 Banks Marsh: Combined 234m
Pa & 228
Ac Stripped cps (corrected to 100m)
34
Figure 5.17 Banks Marsh: Gamma Ray Dose Rates /mGy per annum

35
6. CONCLUSIONS
The survey has defined the gamma radiation environment of the Springfields and Ribble
Estuary in unprecedented detail. The off site contributions to environmental dose rates are
modest, although the gamma dose rates due to 137
Cs in the tide washed areas represent a
significant fraction of the total gamma dose rates. These results can form the basis for critical
dose assessments. Further ground based gamma dose assessments would be beneficial, in
establishing the contribution of low energy gamma rays to the total gamma ray field.
The maps provide a clear indication of the distribution and sources of environmental
radioactivity in the Ribble at the time of the survey. The Ribble estuary is subject to regular
and ongoing ground based studies by BNF, MAFF, HMIP, and University based groups, as
a result of the authorised discharges of low level radioactivity from the Springfields site. The
results of this survey complement this ground based work, and add to confidence that the
estuarine system, it's associated sediments, tide washed pastures, salt marshes and river
banks, have been thoroughly examined. There is support for earlier conclusions that the Cs
on the salt marshes is the dominant source of external gamma radiation, and that the
Springfields contribution to these locations is minor in comparison with this, Sellafield
derived, signal. Upstream the situation is more complex, particularly where the dynamic
sources of beta radiation are considered. As far as critical group assessments are concerned
the survey provides clear evidence that the areas affected by 137
Cs, where external gamma
dose and possible food chain effects are of greatest interest, are in the lower reaches of the
Ribble, whereas, at the time of the survey the 234m
Pa distribution was in the upper reaches
of the river. This not only confirms the findings of ground based work, but provides some
assurance that the different exposure paths (external gamma dose, skin dose) are not entirely
synergistic. The discovery of possible transient sources of natural 228
Ac in the salt marsh
environment as a consequence of Th series disequilibrium immediately following spring tides
is extremely interesting. If substantiated by further studies using semiconductor detectors this
provides a new insight into the dynamic radiation environment of tide washed environments.
The significant development in the application of aerial survey to the studies of a dynamic
source, 234m
Pa, has been demonstrated. Owing to the limitations of detector energy resolution,
the 228
Ac signals inferred in the salt marsh environment can only be partially separated from 234m
Pa. Nevertheless aerial survey remains the only practical and cost effective means of
mapping such dynamic sources. The technique is rapid, crossing all geographical obstacles
and boundaries and therefore enables time series measurements to be made of the total
estuarine system, which would not be possible using ground based approaches. In the case
of the Ribble it would be necessary to reduce survey height to below 50m ground clearance
to improve spatial resolution. The possible inconvenience to residents and property owners
of such low altitude flights would have to be considered in addition to the potential value of
environmental knowledge of the behaviour of these nuclides which could be obtained in
further studies. There is nonetheless considerable scope for time series studies of this
location.
Ground based sampling at the time of measurement would in principle enable concentration
calibrations to be made for these dynamic sources. It may however be necessary to
incorporate corrections derived from Monte-Carlo simulations to account for the finite source
geometries of some of the deposition sinks identified in this survey. Further ground based

36
measurements, in conjunction with Monte-Carlo simulations would be desirable to establish
the extent to which low energy photons contribute to external gamma ray dose rates from
sources with pronounced subsurface activity maxima. The vertical activity distributions found
on these salt marshes give rise to variable and enhanced levels of low energy scattered
photons, whose associated photon fluence spectra may influence the critical region for
detector response where the transition between photoelectric and compton interactions takes
place. The effects which this has on the calibration of routine dosimetry instruments and
systems has yet to be determined, and is important, along with extended habit survey in
critical group dose analyses.
Recent flight trials by SURRC incorporating high efficiency germanium semiconductor
detectors have proven the potential of their inclusion into the aerial survey package. Such a
device would solve any ambiguities with regard energy resolution, especially of near
overlapping gamma ray peaks. Surveying at low altitudes (30-50m) would be required to
enable small localised ground features to be spatially resolved and also offer low energy
gamma ray detection capability (array of LOAX detectors) eg. 241
Am (59.5 keV), 234
Th
(63.93 keV). Differential GPS would be the favoured choice to positively identify the
location of discrete sources. This survey was undertaken at less than optimal survey
parameters (altitude, speed). It would be desirable therefore to fly lower and slower for
semiconductor application. This could be achieved safely using twin engined aircraft, as
deployed for this work. Nevertheless in addition to CAA exemptions to permit low altitude
survey, which were obtained prior to this survey, further cooperation from local authorities
and local residents would be needed to exploit the full potential of this approach.

37
7. REFERENCES
1. SANDERSON, D.C.W., SCOTT, E.M., BAXTER, M.S., Use of Airborne
Radiometric Measurements for Monitoring Environmental Radioactive
Contamination, IAEA SM-306/138, 411-421, Vienna, 1990.
2. SANDERSON, D.C.W, SCOTT, E.M., BAXTER, M.S., The use and potential of
aerial radiometrics for monitoring environmental radioactivity, in "Nuclear
Contamination of Water Resources", Institute of Civil Engineers, pages 99-106,
1990.
3. CHAMBERLAIN, A.C., GARNER, R.J., and WILLIAMS, D., 1961,
Environmental monitoring after accidental deposition of radioactivity, Reactor
Science and Technology, 14,155-167.
4. PEIRSON D.H. and CROOKS R.N., Survey of environmental radioactivity: A
preliminary assessment of the use of helicopters in an emergency.1961. AERE
report M-927.
5. GRASTY R.L., 1980, The search for Cosmos 954, in Search Theory and
Applications, ed HEVLEV & STONE, 1980, Plenum Publishing Corporation.
6. BRISTOW Q., The application of airborne gamma-ray spectrometry in the search
for radioactive debris from the Russian satellite Cosmos 954, Current
Research, Part B, Geol. Survey of Canada paper 1978-1B, 151-162
7. LINDEN A. and MELLANDER H., Airborne measurements in Sweden of the
radioactive fallout after the nuclear accident in Chernobyl, USSR.,1986 Swedish
Geological Company, TFRAP 8606
8. WILLIAMS D. CAMBRAY R.S. and MASKELL S.C. An airborne radiometric
survey of the Windscale area October 19-22nd 1957, AERE report R-2890
9. CHAMBERLAIN A.C. GARNER R.J. and WILLIAMS D. Environmental
monitoring after accidental deposition of radioactivity, 1961, Reactor Science and
Technology, 14, 155-167.
10. SANDERSON D.C.W. & SCOTT E.M., Aerial radiometric survey in West Cumbria
in 1988, MAFF FOOD SCIENCE REPORT N611, 1989.
11. SANDERSON D.C.W., ALLYSON, J.D., CAIRNS K.J., MACDONALD P.A.,
A brief aerial survey in the vicinity of Sellafield in September 1990 ,
SURRC report, 1991
12. SANDERSON, D.C.W., ALLYSON, J.D., MARTIN, E., TYLER, A.N., SCOTT,
E.M., An Aerial Gamma-ray Survey of Three Ayrshire Districts. Commissioned by
the District Councils of Cunninghame, Kilmarnock and Loudon, and Kyle and
Carrick, 1990.

38
13. Sanderson, D.C.W., Allyson, J.D., Tyler, A.N., 1992, An Aerial Survey of
Chapelcross and its Surroundings in February 1992. SURRC Aerial Survey Report.
14. Sanderson, D.C.W., Allyson, J.D., Tyler, A.N., S. Ni Rian, S. Murphy, 1993, An
Airborne Gamma Ray Survey of Parts of SW Scotland in February 1993. SURRC
Preliminary Aerial Survey Report.
15. SANDERSON D.C.W. and ALLYSON J.D., An aerial gamma ray search for a
missing 137
Cs source in the Niger Delta, May 1991, SURRC report, 1991
16. BNF, 1991, Annual Report on Radioactive Discharges and Monitoring of the
Environment 1990, British Nuclear Fuels plc, Health and Safety Directorate,
Risley.
17. MAFF, 1991, Radioactivity in Food and Agricultural Products in England and
Wales, TRAMP/6, London
18. MAFF, 1993, Radioactivity in Surface and Coastal Waters of the British Isles,
Aquatic Environment Monitoring Report, 34, Directory of Fisheries,
Lowestoft.
19. HUNT G.J., 1992, External doses to the public from beta emitters in the
aquatic environment near Springfields and Sellafield, J. Rad. Prot. 12(4),233--
238
20. SANDERSON D.C.W., CAIRNS, K.J., TYLER A.N., 1991, Radiometrics
flight trials on the forth estuary, SURRC Aerial survey report.
21. LOVBORG, L., KIRKEGAARD, P., Numerical evaluation of the natural gamma
radiation field at aerial survey heights, Riso report R 317,1975
22. DUVAL J.S. COOK B. and ADAMS J.A.S., Circle of investigation of an airborne
gamma-ray spectrometer, J. Geophys. Res, 76, 8466-8470
23. GRASTY R.L., KOSANKE, K.L., AND FOOTE, R.S., Fields of View of airborne
gamma-ray detectors, Geophysics,44(8),1979,144-1457
24. GRASTY R.L., HOLMAN P.B., AND BLANCHARD Y.B., 1990,
Transportable Calibration Pads for Ground and Airborne Gamma-ray
Spectrometers
25. Allyson, J.D. PhD Thesis forthcoming.
26. Tyler, A.N. PhD Thesis forthcoming.

39
APPENDIX A.
SUMMARY OF DETECTOR CALIBRATION : SPRINGFIELDS BASELINE
SEPTEMBER 1992
1). Detector
16 l NaI detector - box of 4 10x10x40cm NaI crystals
Resolution 9-10.5% at 662 keV
SURRC 19" RACK INSTALLATION
Recording with MCA28ca/cb software
Radalt 10 mV/ft output
2). Spectral Window Parameters
a). Springfields Aerial Survey Parameters (16 litre detector)
Spectral Windows Channel Number Equivalent Energy Background
/keV /cps
137
Cs 95-128 544-761 43.9 234m
Pa 150-185 885-1102 28.8 40
K 228-260 1370-1570 14.4 214
Bi 275-307 1660-1860 6.5 208
Tl 396-460 2410-2810 9.6
Total 75-500 >450 178
Note. Windows for the natural emitters are recommended by IAEA.
Stripping Matrix (at 60m):
208
Tl 214
Bi 40
K 234m
Pa 137
Cs
208
Tl 1.0 0.35 0.42 1.66 3.09
214
Bi 0.17 1.0 0.76 1.77 4.35
40
K 0 0.015 1.0 0.502 0.72
234m
Pa 0 0.07 0.103 1.0 1.6
137
Cs 0 0 0 0 1.0

40
b). Speculative Windows used for 234m
Pa/228
Ac Separation (16 litre detector)
Spectral Windows Channel Number Equivalent Energy Background
/keV /cps
137
Cs 95-128 544-761 43.9 234m
Pa 160-180 947-1071 12.3 40
K 228-260 1370-1570 14.4 214
Bi 275-307 1660-1860 6.5 208
Tl 396-460 2410-2810 9.6 228
Ac 140-160 823-947 16.0
Total 75-500 >450 178
Stripping Matrix (at 60m):
228
Ac 208
Tl 214
Bi 40
K 234m
Pa 137
Cs
228
Ac 1.0 0 0.025 0.132 0.62 1.11
208
Tl 1.419 1.0 0.348 0.42 0.813 3.085
214
Bi 1.159 0.167 1.0 0.756 0.967 4.35
40
K 0.312 0 0.015 1.0 0.279 0.718
234m
Pa 0.819 0.011 0.10 0.153 1.0 2.165
137
Cs 0 0 0 0 0 1.0
c). SURRC Windows used in previous surveys
Spectral Windows Channel Number Equivalent Energy /keV
137
Cs 95-128 544-761 134
Cs 125-150 730-885 40
K 220-270 1319-1629 214
Bi 270-318 1629-1927 208
Tl 390-480 2370-2932
Total 75-500 >450

41
3). Calibration Constants
a: exponential altitude coefficient (m-1
)
b: slope of calibration line (kBq m-2
per cps, at 100m)
c: calibration intercept
Window Nuclide a b c
_______________________________________________________
1 137
Cs 0.00962 0.5337 0
2 234
Pa 0.00775 - 0
3 40
K 0.006 3.941 0
4 214
Bi 0.0066 2.48 0
5 208
Tl 0.004 0.3477 0
6 >450 keV 0.0062 0.0007 0
_______________________________________________________
4). Mapping Coordinates
Latitude and Longitude of Grid Origins (SD 300 150), 5km scale &
(SD 390,225), 1km scale.
53.488 , 3.532
Grid Angle 0.4

42
APPENDIX B
WARTON BANK - RIBBLE ESTUARY, SAMPLE ACTIVITIES
Sampling Date, August 1992
Sample 241
Am 1 σ 137
Cs 1 σ 241
Am 1 σ 137
Cs 1 σ
Name Bq/g Error Bq/g Error Bq/m2 Error Bq/m
2 Error
WART 01 0-2 0.2501 0.0126 0.909 0.041 3177 160 11553 521
WART 01 2-4 0.3090 0.0154 1.261 0.056 4711 235 19226 854
WART 01 4-6 0.4303 0.0243 2.164 0.079 6758 381 33987 1241
WART 01 6-8 0.725 0.032 4.373 0.144 11303 499 68178 2245
WART 01 8-10 0.7301 0.0390 4.783 0.170 13153 703 86177 3070
WART 01 10-15 0.3413 0.0195 1.727 0.063 16355 937 82745 3021
WART 01 15-20 BDL 0.121 0.007 BDL 5934 342
WART 01 20-25 BDL 0.126 0.006 BDL 4885 244
WART 01 25-30 BDL 0.040 0.002 BDL 1516 59
TOTAL 53924 1359 314199 5130
WART 11 0-15 0.4993 0.0277 2.884 0.104 55179 3057 318739 11469
WART 11 15-30 BDL 0.134 0.005 BDL 197774 706
TOTAL 55179 3057 338517 11491
WART 12 0-15 0.4724 0.0085 2.955 0.118 52920 952 331026 13219
WART 12 15-30 BDL 0.125 0.005 BDL 18428 667
TOTAL 52920.39 952.1885 349454 13235
WART 13 0-5 0.2888 0.019 1.120 0.04 8658 570 33587 1199
WART 13 5-10 0.5970 0.0324 4.430 0.158 23899 1298 177309 6323
WART 13 10-15 0.4349 0.0250 2.481 0.090 14795 851 84405 3079
WART 13 15-30 BDL 0.148 0.005 BDL 19885 714
TOTAL 47353 1654 315186 7170

43
Sample 241
Am 1 σ 137
Cs 1 σ 241
Am 1 σ 137
Cs 1 σ
Name Bq/g Error Bq/g Error Bq/m2 Error Bq/m
2 Error
WART 14 0-2 0.2639 0.011 1.074 0.04 7314 305 29765 1109
WART 14 2-4 0.3848 0.0211 1.856 0.0671 7222 396 34825 1259
WART 14 4-6 0.5322 0.0290 4.031 0.1438 9871 538 74760 2667
WART 14 6-8 0.6936 0.0371 4.927 0.1753 14418 772 102425 3644
WART 14 8-10 0.6764 0.0366 3.936 0.1408 15466 838 90010 3220
WART 14 10-15 0.0880 0.0075 0.456 0.0186 4086 349 21192 866
WART 14 15-30 BDL 0.0992 0.004 BDL 13771 493
TOTAL 58376 1400 366749 5879
WART 15 0-2 0.2019 0.022 0.972 0.04 755 82 3647 150
WART 15 2-5 0.2058 0.0132 1.413 0.0525 3147 202 21709 806
WART 15 5-10 0.0315 0.0072 0.518 0.0211 1076 245 17807 724
WART 15 10-15 BDL 0.1538 0.0081 BDL 4399 232
WART 15 15-22 BDL 0.0839 0.0056 BDL 3478 231
WART 15 22-30 BDL 0.0528 0.0049 BDL 2645 244
TOTAL 4978 328 53684 1168
WART 21 0-15 0.410 0.0221 2.4862 0.0888 48514 2616 292652 10449
WART 21 15-30 BDL 0.0537 0.0048 BDL 8461 762
TOTAL 48514 2616 301113 10476
WART 22 0-15 0.4719 0.0262 2.8554 0.1028 45484 2520 274048 9870
WART 22 15-30 BDL 0.0862 0.0056 BDL 11636 761
TOTAL 45484 2520 285684 9899
WART 23 0-15 0.4357 0.0242 2.7619 0.0994 33823 1879 214407 7714
WART 23 15-30 BDL 0.1385 0.0078 BDL 16203 907
TOTAL 33823 1879 230610 7767

44
Sample 241
Am 1 σ 137
Cs 1 σ 241
Am 1 σ 137
Cs 1 σ
Name Bq/g Error Bq/g Error Bq/m2 Error Bq/m
2 Error
WART 24 0-15 0.4390 0.0240 2.7753 0.1002 28505 1557 180190 6503
WART 24 15-30 BDL 0.1250 0.0077 BDL 9643 591
TOTAL 28505 1557 189833 6530
WART 25 0-15 0.2256 0.0149 1.2491 0.0469 18833 1201 104264 3916
WART 25 15-30 BDL 0.2357 0.0113 BDL 27906 1333
TOTAL 18833 1201 132169 4137
WART 31 0-15 0.4874 0.0245 3.1627 0.1110 64370 3232 417699 14633
WART 31 15-30 BDL 0.1279 0.0052 BDL 13419 546
TOTAL 64370 3232 431118 14643
WART 32 0-15 0.4907 0.0270 2.6172 0.09439 67226 3696 358526 12931
WART 32 15-30 BDL 0.1753 0.00872 BDL 27840 1384
TOTAL 67226 3696 386366 13004
WART 33 0-15 0.5108 0.0283 3.3751 0.12154 30518 1693 201631 7261
WART 33 15-30 BDL 0.1673 0.0091 BDL 15684 854
TOTAL 30518 1693 217315 7311
WART 34 0-15 0.4452 0.0250 2.7722 0.1003 31651 1780 197087 7130
WART 34 15-30 BDL 0.0642 0.0052 BDL 7876 633
TOTAL 31651 1780 204963 7158
WART 35 0-15 0.2685 0.0160 1.6174 0.0594 24382 1455 146871 5391
WART 35 15-30 BDL 0.1170 0.0043 BDL 12784 470
TOTAL 24382 1455 159655 5412
WART 41 0-15 0.3790 0.0209 2.0065 0.07310 29166 1609 154399 5625
WART 41 15-30 BDL 0.0426 0.00376 BDL 5491 486
TOTAL 29166 1609 159891 5646
WART 42 0-15 0.4051 0.0219 2.1737 0.07839 57468 3106 308396 11121
WART 42 15-30 BDL 0.1069 0.00624 BDL 12790 746
TOTAL 57468 3106 321186 11146

45
Sample 241
Am 1 σ 137
Cs 1 σ 241
Am 1 σ 137
Cs 1 σ
Name Bq/g Error Bq/g Error Bq/m2 Error Bq/m
2 Error
WART 43 0-15 0.3428 0.019 2.0498 0.07444 24974 1382 149350 5423
WART 43 15-30 BDL 0.0909 0.00332 BDL 10525 385
TOTAL 24974 1382 159875 5437
WART 44 0-2 0.1832 0.012 0.6409 0.03 662 43 2317 108
WART 44 2-4 0.2743 0.22 0.9203 0.0396 1764 1415 5920 255
WART 44 4-6 0.4603 0.1 1.892 0.0662 3939 856 16191 567
WART 44 6-8 0.4961 0.026 3.042 0.1004 3598 189 22062 728
WART 44 8-10 0.8212 0.0731 4.207 0.1304 7985 711 40909 1268
WART 44 10-15 0.6827 0.0361 3.5919 0.1289 11148 590 58656 2105
WART 44 15-20 0.1863 0.0106 1.1147 0.0407 3740 212 22373 816
WART 44 20-25 0.0390 0.0043 0.3736 0.0153 790 86 7576 311
WART 44 25-30 BDL 0.1436 0.0071 BDL 2727 135
TOTAL 32524 1918 175127 2783
WART 45 0-5 0.271 0.011 1.056 0.042 11095 450 43233 1719
WART 45 5-10 0.448 0.024 2.620 0.094 22203 1192 129912 4663
WART 45 10-15 0.658 0.035 3.9638 0.1413 33696 1773 203019 7237
WART 45 15-20 0.7063 0.0354 3.3143 0.1161 30010 1502 140816 4931
WART 45 20-25 0.2223 0.0112 1.6114 0.0565 11618 584 84227 2951
WART 45 25-30 0.0392 0.0044 0.2309 0.0105 1651 187 9735 444
TOTAL 110273 2720 610943 10502
WART 51 0-15 0.5002 0.0268 3.0264 0.1085 58842 3149 356009 12760
WART 51 15-30 0.0107 0.0036 0.2749 0.0120 1528 515 39400 1723
TOTAL 60370 3191 395409 12876
WART 52 0-15 0.4786 0.0252 2.6795 0.0955 64696 3400 362176 12912
WART 52 15-30 BDL 0.1568 0.0081 BDL 26740 1379
TOTAL 64696 3400 388916 12985

46
Sample 241
Am 1 σ 137
Cs 1 σ 241
Am 1 σ 137
Cs 1 σ
Name Bq/g Error Bq/g Error Bq/m2 Error Bq/m
2 Error
WART 53 0-15 0.4658 0.0247 2.4694 0.0885 75102 3986 398137 14272
WART 53 15-30 BDL 0.1114 0.004 BDL 13865 498
TOTAL 75102 3986 412002 14281
WART 54 0-15 0.5252 0.0279 2.8859 0.1034 54607 2902 300083 10759
WART 54 15-30 0.1191 0.0076 0.4432 0.0176 16203 1039 60277 2387
TOTAL 70811 3082 360361 11021
WART 55 0-15 0.4728 0.0255 3.2706 0.1171 29041 1566 200907 7192
WART 55 15-30 0.0101 0.0053 0.7796 0.0307 833 437 64627 2543
TOTAL 29875 1626 265534 7628
WART 61 0-15 0.1655 0.0118 2.7046 0.0976 19618 1404 320501 11569
WART 61 15-30 BDL 0.0910 0.0053 BDL 14082 813
TOTAL 19618 1404 334583 11598
WART 62 0-15 0.2639 0.0156 2.3969 0.0866 38191 2254 346843 12525
WART 62 15-30 BDL 0.1168 0.0064 BDL 17469 952
TOTAL 38191 2254 364312 12561
WART 63 0-15 0.0990 0.009 2.0113 0.0736 10775 986 218927 8015
WART 63 15-30 BDL 0.0588 0.0040 BDL 7093 485
TOTAL 10775 986 218927 8015
WART 64 0-15 0.0938 0.0089 1.7573 0.0649 5708 544 106930 3949
WART 64 15-30 BDL 0.0400 0.0048 BDL 3814 462
TOTAL 5708 544 110744 3976
WART 65 0-15 0.0594 0.0077 1.4678 0.0548 5167 669 127605 4766
WART 65 15-30 BDL 0.0798 0.0030 BDL 9605 360
TOTAL 5166.792 669.0033 137210.8 4779.5
BDL: Below Detection Limits