San Marcos Direct Water Reuse Expansion Feasibility Study · Acknowl Funding Texas W edgements for...
131
Transcript of San Marcos Direct Water Reuse Expansion Feasibility Study · Acknowl Funding Texas W edgements for...
San MFeas Study Pa
Fina
TWD
TeP.O. AustiDece
Marcoibility
articipants:
al Repo
DB Co
xas WBox 13231, in, Texas 78mber 2013
os DireStudy
ort
ntract
Water DCapitol Stat711-3231
ect Way
No. 12
Develoption
ter Re
248321
pment
euse Ex
14488
Board
xpansi
d
on

This page is intentionally blank

ii
This page is intentionally blank
Acknowl
Funding Texas W
ledgements
for this projWater Develop
ect was provpment Board
vided by the d.
iii
City of San
n Marcos, Teexas State Unniversity, annd the

iv
This page is intentionally blank
v
Direct Water Reuse Expansion
Feasibility Study
Table of Contents 1 Executive Summary ................................................................................................................... 1
1.1 Existing Reclaimed Water System .................................................................................. 1 1.2 Reclaimed Water Supply and Demand ........................................................................... 1 1.3 Reclaimed Water Project Benefits .................................................................................. 3 1.4 Reclaimed Water Costs ................................................................................................... 4 1.5 Project Financing ............................................................................................................ 6 1.6 Project Implementation ................................................................................................... 6
2 Introduction ................................................................................................................................ 9 2.1 Background ..................................................................................................................... 9 2.2 Purpose of the Study ..................................................................................................... 10 2.3 Participants .................................................................................................................... 10 2.4 Study Area .................................................................................................................... 10 2.5 Planning Process ........................................................................................................... 12 2.6 Document Organization ................................................................................................ 13 2.7 Abbreviations, Acronyms and Conversions ................................................................. 14 2.8 Background Reports...................................................................................................... 15
3 Problems and Needs ................................................................................................................. 19 3.1 Water Management Needs ............................................................................................ 19 3.2 Water Supplies and Demands ....................................................................................... 20 3.3 Supply Costs ................................................................................................................. 22
4 Water Reclamation and Reuse Opportunities .......................................................................... 25 4.1 Existing and Potential Reclaimed Water Users ............................................................ 25 4.2 Reclaimed Water Source ............................................................................................... 29 4.3 Existing Reclaimed Water System ................................................................................ 30 4.4 Evaluation and Sizing Criteria ...................................................................................... 31
5 Description of Alternatives ...................................................................................................... 33 5.1 Service Area Definition ................................................................................................ 34 5.2 Phased Demand Increase .............................................................................................. 36 5.3 Formulation of Project Alternatives .............................................................................. 41 5.4 Peak Demand Supply Alternatives ............................................................................... 42 5.5 Development of Project Costs ...................................................................................... 46
6 Economic Analysis ................................................................................................................... 47 6.1 Life Cycle Cost Analysis .............................................................................................. 47 6.2 Reclaimed Water Cost Comparison .............................................................................. 49 6.3 Economic Analysis ....................................................................................................... 49 6.4 Methodology ................................................................................................................. 54 6.5 Summary and Conclusions ........................................................................................... 55
7 Recommended Alternative ....................................................................................................... 57 8 Environmental Considerations ................................................................................................. 59
8.1 Potential Environmental Effects ................................................................................... 59
vi
8.2 Endangered or Threatened Species ............................................................................... 59 8.3 Wetlands ....................................................................................................................... 64 8.4 Floodplain ..................................................................................................................... 64 8.5 Archeological and Cultural Resources .......................................................................... 66 8.6 Public Health and Safety ............................................................................................... 66 8.7 Natural Resources ......................................................................................................... 66 8.8 Potentially Significant Environmental Effects.............................................................. 66 8.9 Regional Water Supply and Water Quality .................................................................. 67 8.10 Public Involvement ....................................................................................................... 67 8.11 Historic Properties ........................................................................................................ 67
9 Legal and Institutional Requirements ....................................................................................... 69 9.1 State Regulations .......................................................................................................... 69 9.2 Water Rights Considerations ........................................................................................ 72 9.3 Return Flows and Environmental Flows....................................................................... 73 9.4 Interlocal Agreements ................................................................................................... 73
10 Implementation Strategy .......................................................................................................... 75 10.1 Financial Status of the City ........................................................................................... 75 10.2 Implementation Schedule.............................................................................................. 75 10.3 Project Funding Alternatives ........................................................................................ 77 10.4 Project Implementation Considerations ........................................................................ 82 10.5 Preliminary Project Funding Plan ................................................................................. 83 10.6 Reclaimed Water Pricing .............................................................................................. 84 10.7 Research Needs ............................................................................................................. 85
11 References ................................................................................................................................ 87 12 Appendices ............................................................................................................................... 89 Appendix A: Reclaimed water demand. Appendix B: Opinion of probable project costs. Appendix C: O&M cost detail. Appendix D: Present value analysis tables.
Appendix E: Public involvement Appendix F: Report comments and responses
List of Figures Figure 1-1. Study area. .................................................................................................................. 2 Figure 2-1. Study area and existing reclaimed water system. ..................................................... 11 Figure 3-1. City of San Marcos water supply vs. demand. ......................................................... 22 Figure 4-1. Seasonal thermal plant makeup water demand. ....................................................... 28 Figure 4-2. Average monthly effluent flow (2008 - 2011), mgd. ............................................... 30 Figure 5-1. Reclaimed water service areas. ................................................................................ 35 Figure 5-2. Phase 1 service expansion. ....................................................................................... 37 Figure 5-3. Phase 2 service expansion. ....................................................................................... 38 Figure 5-4. Phase 3 service expansion. ....................................................................................... 39 Figure 5-5. Phase 4 service expansion. ....................................................................................... 40 Figure 5-6. Average day reclaimed water demand. .................................................................... 41 Figure 5-7. Maximum day reclaimed water demand. ................................................................. 42
vii
Figure 8-1. Edwards Aquifer recharge zone. .............................................................................. 61 Figure 8-2. Critical habitat areas. ................................................................................................ 63 Figure 8-3. Floodplain areas. ...................................................................................................... 65 Figure 8-4. Historic districts. ...................................................................................................... 68
List of Tables Table 1-1. Projected annual reclaimed water demand. ................................................................. 3 Table 1-2. Reclaimed water system expansion. ............................................................................ 5 Table 1-3. Summary of project costs. ........................................................................................... 5 Table 3-1. San Marcos River water rights in the study area. ...................................................... 21 Table 3-2. Projected service area population. ............................................................................. 21 Table 3-3. Average water supply costs. ...................................................................................... 23 Table 4-1. Reclaimed water demand. ......................................................................................... 27 Table 4-2. Reclaimed water chemical analysis. .......................................................................... 28 Table 4-3. San Marcos WWTP discharge parameters. ............................................................... 29 Table 4-4. Projected WWTP average day flow (mgd). .............................................................. 30 Table 5-1. System expansion phases. ......................................................................................... 36 Table 5-2. Peak demand supply requirement. ............................................................................. 41 Table 6-1. Conveyance system opinion of probable project costs. ............................................. 47 Table 6-2. Peak demand supply alternatives. .............................................................................. 48 Table 6-3. Project alternative costs. ............................................................................................ 48 Table 6-4. Life cycle cost analysis. ............................................................................................. 48 Table 6-5. Reclaimed water cost comparison. ............................................................................ 49 Table 6-6. Average annual reclaimed water demand (AF). ........................................................ 50 Table 6-7. Project cost summary. ............................................................................................... 55 Table 9-1. Texas reclaimed water quality standards. .................................................................. 69 Table 10-1. Preliminary funding plan. ........................................................................................ 83 Table 10-2. Alternative funding plan. ......................................................................................... 84
P:\Active\11047.01_SM_Water_Reuse_Feasibility\Report\Report\FINAL 12 10 13.docx

viii
This page is intentionally blank
1
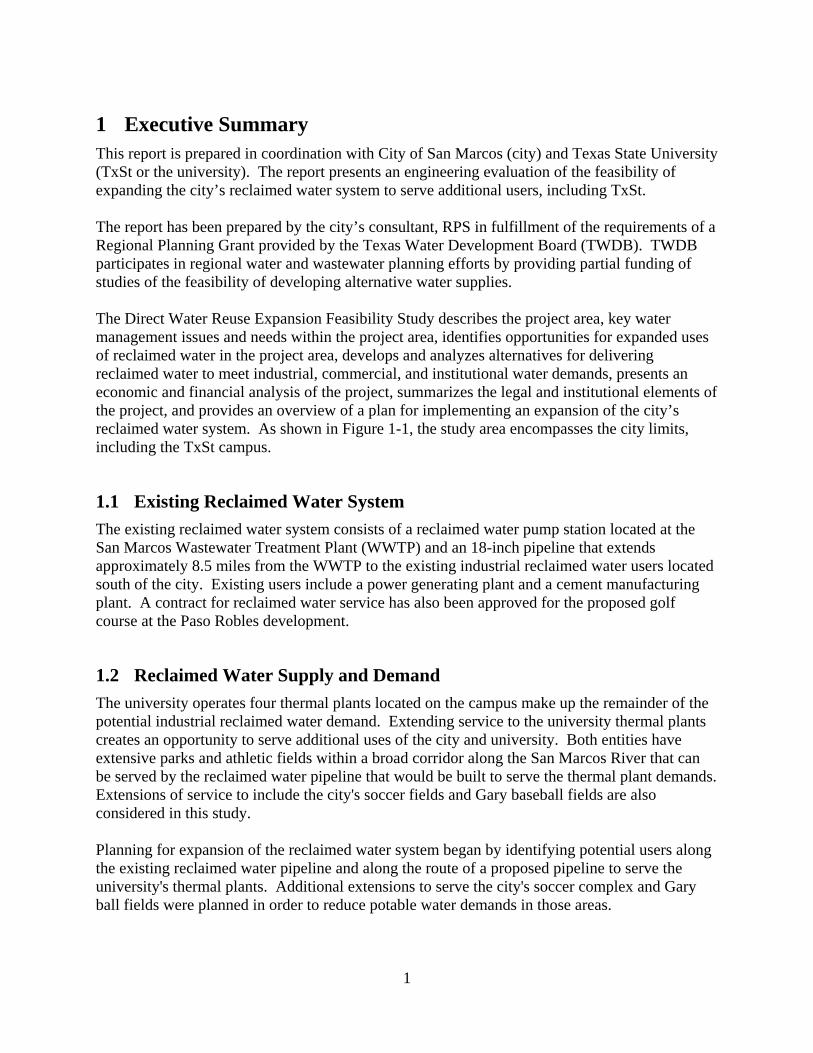
1 Executive Summary This report is prepared in coordination with City of San Marcos (city) and Texas State University (TxSt or the university). The report presents an engineering evaluation of the feasibility of expanding the city’s reclaimed water system to serve additional users, including TxSt. The report has been prepared by the city’s consultant, RPS in fulfillment of the requirements of a Regional Planning Grant provided by the Texas Water Development Board (TWDB). TWDB participates in regional water and wastewater planning efforts by providing partial funding of studies of the feasibility of developing alternative water supplies. The Direct Water Reuse Expansion Feasibility Study describes the project area, key water management issues and needs within the project area, identifies opportunities for expanded uses of reclaimed water in the project area, develops and analyzes alternatives for delivering reclaimed water to meet industrial, commercial, and institutional water demands, presents an economic and financial analysis of the project, summarizes the legal and institutional elements of the project, and provides an overview of a plan for implementing an expansion of the city’s reclaimed water system. As shown in Figure 1-1, the study area encompasses the city limits, including the TxSt campus.
1.1 Existing Reclaimed Water System
The existing reclaimed water system consists of a reclaimed water pump station located at the San Marcos Wastewater Treatment Plant (WWTP) and an 18-inch pipeline that extends approximately 8.5 miles from the WWTP to the existing industrial reclaimed water users located south of the city. Existing users include a power generating plant and a cement manufacturing plant. A contract for reclaimed water service has also been approved for the proposed golf course at the Paso Robles development.
1.2 Reclaimed Water Supply and Demand
The university operates four thermal plants located on the campus make up the remainder of the potential industrial reclaimed water demand. Extending service to the university thermal plants creates an opportunity to serve additional uses of the city and university. Both entities have extensive parks and athletic fields within a broad corridor along the San Marcos River that can be served by the reclaimed water pipeline that would be built to serve the thermal plant demands. Extensions of service to include the city's soccer fields and Gary baseball fields are also considered in this study. Planning for expansion of the reclaimed water system began by identifying potential users along the existing reclaimed water pipeline and along the route of a proposed pipeline to serve the university's thermal plants. Additional extensions to serve the city's soccer complex and Gary ball fields were planned in order to reduce potable water demands in those areas.
HWY 1
23
HWY 21
HWY 80
§̈¦IH 35
§̈¦IH 35
FM 1979
FM 1978
FM 1984
FM 621
HUNTER RD
OLD BASTROP HWY
STAPLES RD
REDWOOD RD
N LBJ DR
CENT
ERPO
INT R
D
W Wonder World DrE MCCARTY LN
W MCCARTY LN
RANCH ROAD 12
WONDER WORLD DR
S LBJ DR
W HOPKINS ST
CLOVIS BARKER RD
AQUARENA SPRINGS DR
W SESSOM DR E SESSOM DR
N OLD BASTROP HWYRATTLER RD
CENTERPOINT RD
REDWOOD RD
CENTERPOINT RD
IN.T.S
P:\Ac
tive\1
1047
.01_S
M_Wa
ter_R
euse
_Fea
sibility
\GIS\
work\
Exhib
its_fo
r_Rep
ort
LegendTexas State UniversityCity Limit
Figure 1-1. Study area.
2
3
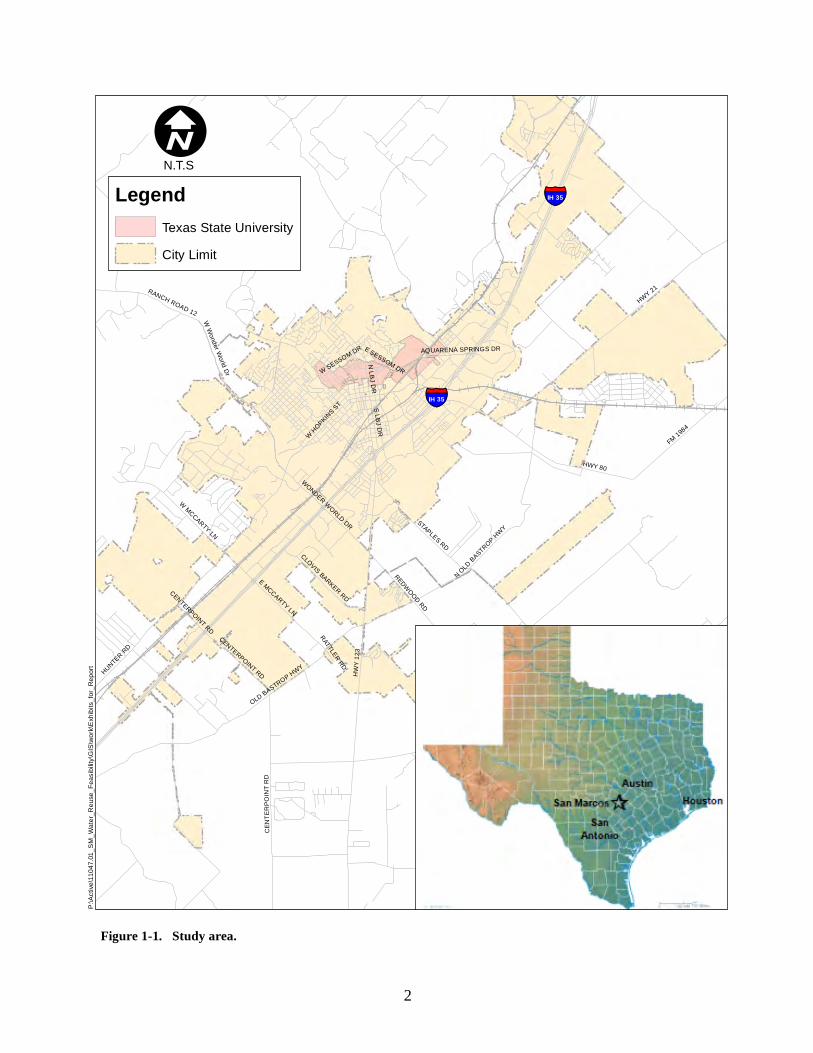
The water demands of potential reclaimed water users were developed using one of three methodologies: metered potable water consumption; irrigation demand based on landscape coefficients; and demand specified under existing contracts for reclaimed water service. The total of 2,123 AF of reclaimed water demands identified through this study is detailed in Table 1-1.
Table 1-1. Projected annual reclaimed water demand.
Use (AF) 2015 2017 2020 2032 Total
Industrial 1,616 -- -- -- 1,616
City Irrigation -- 221 19 120 360
University Irrigation -- 20 -- -- 20
School Irrigation -- -- 49 3 52
Commercial Irrigation -- -- 26 49 75
Total 1,616 241 94 172 2,123
The San Marcos Wastewater Treatment Plant (WWTP) produces effluent that meets the state criteria for the highest quality of reclaimed water. As Type 1 reclaimed water, no additional costs for treatment are required in order to make reclaimed water available for irrigation of public parks. The WWTP flow is sufficient to meet the average demand for reclaimed water. However, just as the peak demand for reclaimed water can be expected to occur during the summer months, the coincidental minimum day flow for the WWTP was found to occur between the second summer session and fall semester at the university. Alternatives for supplementing the supply of reclaimed water to meet peak demands were developed and evaluated. The recommended peak demand supply alternative is construction of a 105 MG seasonal storage facility on the 97-acre city-owned tract located adjacent to the WWTP. This facility will provide approximately 30 days of storage capacity to meet peak summer demand for reclaimed water.
1.3 Reclaimed Water Project Benefits
Expansion of the reclaimed water system is consistent with the city’s 2013 Comprehensive Plan goal of establishing proactive policies that encourage recycling and resource and energy efficiency. The proposed system expansion is a step toward meeting the defined objective of Goal 3 of the Environment & Resource Protection section of the Comprehensive Plan by making reclaimed water available in specific activity nodes. As detailed in Section 5.3, there are a number of potential benefits that can be attributed to the expansion of the reclaimed water system. While many are indirect benefits that are difficult to quantify in terms of cost, savings, or economic value, there are significant potential benefits in:
further diversification of water supply sources, environmental benefits as a result of reduced withdrawals from the Edwards Aquifer and
the San Marcos River, and improved sustainability of public parks.
Some of the key benefits of an expanded reclaimed water system include:
4
Reduced potable water demand
Reducing potable water demand benefits the city and the university by reducing the future demand on water supply sources. Approximately 224 AF of potable water now used by potential reclaimed water users for landscape irrigation could be offset using reclaimed water. These current uses include city and university facilities, as well as schools and commercial irrigation. In addition to providing an offset to potable water consumption for irrigation, converting thermal plant makeup water from water supplied by the university’s Jackson Well to reclaimed water would reduce potable water demand by an additional 388 AF.
Environmental enhancement
The university has committed to reduce withdrawals from the San Marcos River as spring flow at the San Marcos Springs declines. Making reclaimed water available to the university would reduce demand for San Marco River water and benefit the areas of critical habitat by allowing increased river flows through the areas of critical habitat. Reclaimed water could also be used to support the riparian and aquatic habitat along the San Marcos River by providing water for irrigation of vegetative buffers in city parks along the river identified in the USACE Section 206 Aquatic Ecosystem Restoration Project.
Park sustainability
The city’s parks along the San Marcos River are the centerpiece of the city’s recreational tourist economy. Much of the city’s parks are maintained without supplemental irrigation. The prospect of developing reclaimed water for irrigation of city parks highlights a significant paradox in the economics of operating and maintaining city parks. Ensuring that parks are developed and maintained at levels of service that meet the needs and expectations of current and future residents presents a significant dilemma for any city. In its simplest form, the city must choose between operating parks without irrigation, irrigating with potable water, or irrigating parks with reclaimed water. Leaving parks without irrigation appears to be the lowest cost alternative, but that option does not address the loss of some uses during drought periods and a limited ability to restore overused areas or to boost community appeal. The alternative of irrigating parks using potable water will increase the level of service and costs during normal rainfall years, but will essentially become the no-irrigation alternative during drought periods when outdoor water use is restricted. This alternative also increases the city’s overall demand for new water supplies that are developed at higher costs. Supplemental irrigation of parks, picnic areas, playgrounds, and athletic fields, can contribute to developing additional capacity for accommodating the increased and heavier uses associated with more visitors and activities.
1.4 Reclaimed Water Costs
Expansion of the reclaimed water system to meet all of the demands summarized in Table 1-1 was developed in a phased approach in which the system would be expanded as the projected demands are developed. Development of each phase would add reclaimed water service to one or more service areas. The four service areas are:
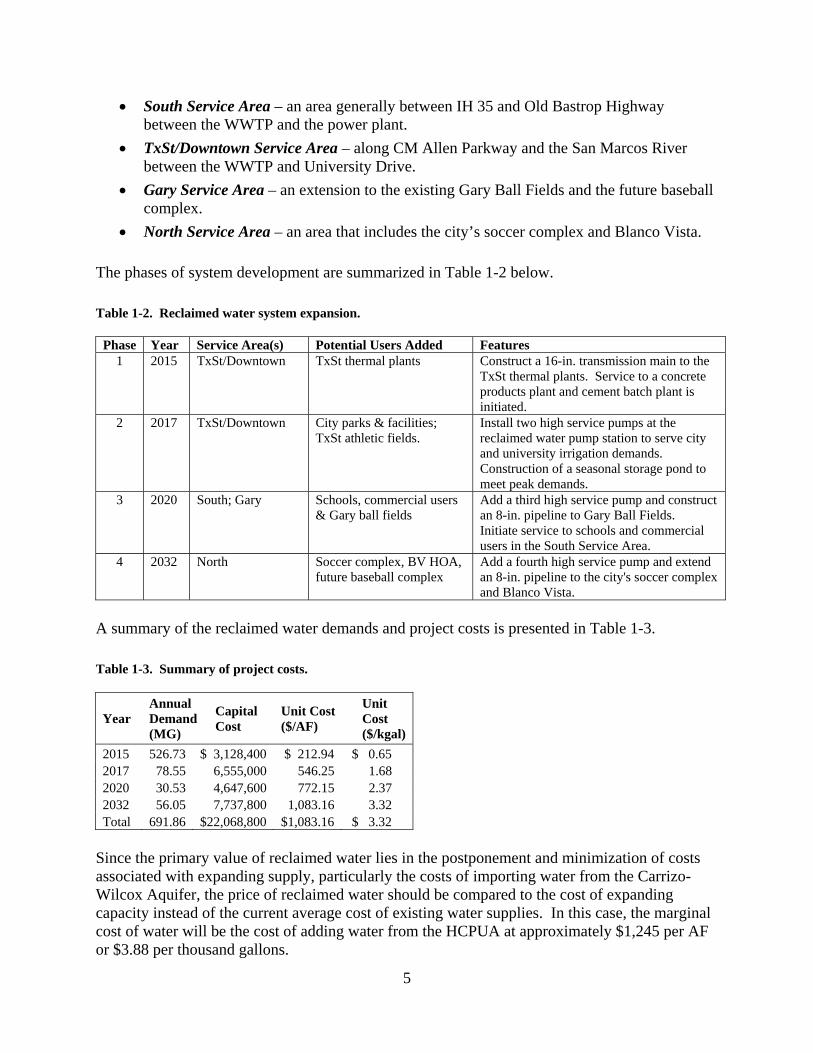
5
South Service Area – an area generally between IH 35 and Old Bastrop Highway between the WWTP and the power plant.
TxSt/Downtown Service Area – along CM Allen Parkway and the San Marcos River between the WWTP and University Drive.
Gary Service Area – an extension to the existing Gary Ball Fields and the future baseball complex.
North Service Area – an area that includes the city’s soccer complex and Blanco Vista.
The phases of system development are summarized in Table 1-2 below.
Table 1-2. Reclaimed water system expansion.
Phase Year Service Area(s) Potential Users Added Features 1 2015 TxSt/Downtown TxSt thermal plants Construct a 16-in. transmission main to the
TxSt thermal plants. Service to a concrete products plant and cement batch plant is initiated.
2 2017 TxSt/Downtown City parks & facilities; TxSt athletic fields.
Install two high service pumps at the reclaimed water pump station to serve city and university irrigation demands. Construction of a seasonal storage pond to meet peak demands.
3 2020 South; Gary Schools, commercial users & Gary ball fields
Add a third high service pump and construct an 8-in. pipeline to Gary Ball Fields. Initiate service to schools and commercial users in the South Service Area.
4 2032 North Soccer complex, BV HOA, future baseball complex
Add a fourth high service pump and extend an 8-in. pipeline to the city's soccer complex and Blanco Vista.
A summary of the reclaimed water demands and project costs is presented in Table 1-3.
Table 1-3. Summary of project costs.
Year Annual Demand (MG)
Capital Cost
Unit Cost ($/AF)
Unit Cost ($/kgal)
2015 526.73 $ 3,128,400 $ 212.94 $ 0.65 2017 78.55 6,555,000 546.25 1.68 2020 30.53 4,647,600 772.15 2.37 2032 56.05 7,737,800 1,083.16 3.32 Total 691.86 $22,068,800 $1,083.16 $ 3.32
Since the primary value of reclaimed water lies in the postponement and minimization of costs associated with expanding supply, particularly the costs of importing water from the Carrizo-Wilcox Aquifer, the price of reclaimed water should be compared to the cost of expanding capacity instead of the current average cost of existing water supplies. In this case, the marginal cost of water will be the cost of adding water from the HCPUA at approximately $1,245 per AF or $3.88 per thousand gallons.
6
1.5 Project Financing
There are a number of financing strategies available for water reuse projects that include federal and regional grants, state loans, and local revenue bonds. The U.S. Department of the Interior Bureau of Reclamation (Reclamation), through its highly competitive Title XVI program, can fund up to 25 percent of the capital costs of reuse projects. Regional funding opportunities include Conservation Grants from the Edwards Aquifer Authority. State financing opportunities are available through the TWDB. Most common are low interest loans through the Clean Water State Revolving Fund (CWSRF) and the Drinking Water State Revolving Fund (DWSRF), but applicants may be eligible for some level of loan forgiveness. To receive loan forgiveness, applicants must be included in the Intended Use Plan (IUP) as an eligible Green Project Reserve (GPR) project and be invited to apply for the subsidy. The GPR can be used for planning, design, and/or construction activities that advance one or more of the objectives in the categories of Green Infrastructure, Water Efficiency, Energy Efficiency, and Environmentally Innovative. A new financing mechanism will become available to TWDB in 2015 as a result of actions of the 83rd Legislature. Three bills were passed as part of a broad package to provide funding for projects in the State Water Plan. The bills proposed an amendment to the state constitution that would create the State Water Implementation Fund for Texas (SWIFT), appropriate $2 billion from the economic stabilization fund to the SWIFT, and direct TWDB on how the SWIFT may be used. The SWIFT legislation references funding projects on the 2011 regional water plan list, but the draft 2016 lists will be available about the same time as the SWIFT funds become available. That may indicate that the 2011 water plans would not have to be revised in order to get a project into consideration, but would need to be included in the draft 2016 regional water plan. Approved by voters on November 5, 2013 as Proposition 6, the SWIFT will become available about the time the draft 2016 list of regional projects is published. The regional water planning group (RWPG) stakeholder committee will submit project prioritization criteria to the TWDB by Dec. 1, 2013. The TWDB rules for SWIFT should be adopted by March 2015. The draft 2016 regional water plans are due May 1, 2015. The subsidy for the SWIFT will be established over the next 18 months. The subsidy is capped so that entities, such as local governments, will have to pay at least half of the interest rate for TWDB’s cost of funds. As part of a comprehensive water supply plan, financing plans for water reuse should consider cost sharing as part of the water, wastewater, and reclaimed water rate structures. Considerations in the pricing of reclaimed water include defining both the overall goals and objectives of developing a reclaimed water system and a desired level of cost sharing with the water and wastewater operations.
1.6 Project Implementation
Implementation involves a logical, step-by-step approach, beginning with a consensus on the need for the project and the framework in which the project would be developed. The initial steps toward implementation should include:
7
Securing inclusion of the reclaimed water expansion project in the Region L Regional Water Plan and the State Water Plan.
Disseminating public information regarding the purposes of reclaimed water and the project costs.
Securing commitments for reclaimed water from potential users.
Developing a project financing plan.
Incorporating the project into the city’s CIP.

8
This page is intentionally blank
9
2 Introduction The City of San Marcos (city) developed a reclaimed water system in 1999 to provide cooling water to a power generation plant located southeast of the city. In subsequent years, the city has added as reclaimed water customers a cement manufacturing plant and a proposed golf course. The university’s need for new thermal plants resulting from continued campus growth comes at a time when the university, the city, and others who rely on the Edwards Aquifer are focused on diversifying water supplies. This diversification is, in part, driven by the Edwards Aquifer Recovery Implementation Plan (EARIP). The city and university have commissioned RPS to perform a study of the feasibility of expanding the existing reclaimed water system to serve industrial and irrigation needs of the city, university, and private sector users. This feasibility study has identified and categorized existing and potential users and developed a proposed plan for expanding the existing reclaimed water system.
2.1 Background
The city has actively pursued the development of water conservation and water supply strategies for more than thirty years. The city’s efforts have not only been driven by the recurring drought cycles of the region, but also part of the city's cooperation in regional efforts to preserve the endangered species habitat of the San Marcos River by reducing demands on the Edwards Aquifer. In 1989, the city contracted with the Guadalupe-Blanco River Authority (GBRA) to supply 5,000 acre-feet (AF) of surface water from Canyon Lake and increased that supply to 10,000 AF in 2009. During the next decade, the city, with cooperation by GBRA, developed a regional surface water treatment plant that has shifted the bulk of the city’s water demand from the Edwards Aquifer to surface water. By upgrading the WWTP process from secondary to tertiary treatment, the city also began producing wastewater effluent that meets the state criteria for Type 1 reclaimed water. As these major capital investments were being completed, the developer of a gas-fired power plant approached the city seeking a reliable supply of cooling water. The power plant was built south of the city and is supplied with both reclaimed water from the city’s WWTP and raw water from the raw water pipeline that transports the city’s surface water supply from the Guadalupe River to the San Marcos Surface Water Treatment Plant. Since service to the first reclaimed water customer began in 2000, the city has approved two additional reclaimed water contracts. One user is a cement manufacturer that has committed to reducing reliance on Edwards Aquifer wells for water used for manufacturing and dust control and the other is a proposed golf course for a new residential development. As part of the regional effort to reduce reliance on the Edwards Aquifer, the university has also undertaken efforts to evaluate alternative water sources. Water sources for the university include the city water system that supplies much of the eastern campus, a university-owned Edwards Aquifer well that serves the western campus, and water rights to Spring Lake and the San Marcos River. Converting the source of makeup water for the four thermal plants to reclaimed water would provide a significant reduction in the use of water from both the Edwards Aquifer and the San Marcos River.
10
2.2 Purpose of the Study
Discussions of the feasibility of providing reclaimed water to the university thermal plants began in 2010. The city and the university, in partnership with the TWDB, initiated a feasibility study for an expansion of the existing reclaimed water system in 2011. The concept for the expanded system includes reclaimed water service to: existing industrial users, university thermal plants, city and university parks and athletic fields, and commercial and school district users. The purpose of this study is to evaluate the feasibility of expanding the city's existing reclaimed water system for various public and private sector uses within the city and its utility service area during a twenty year planning period (2015-2035). The project scope includes tasks that provide a review of available data, identify potential reclaimed water users, develop conceptual distribution system plans, evaluate costs, benefits, and environmental considerations, and to identify necessary steps for implementation. The Direct Water Reuse Expansion Feasibility Study (Study) includes the projected water demands for irrigation and potable water replacement and a recommended plan for a system that will meet the projected demands using reclaimed water. The initial challenges of an expanded system are balancing the increase in reclaimed water demand with supply and defining the potential costs for planning the expansion. The feasibility study provides an evaluation of wastewater volume, current and potential reclaimed water demands, and defines the most appropriate service areas for expansion of the city's reclaimed water system along with planning costs for extending service to each service area.
2.3 Participants
The City of San Marcos, as the study sponsor, engaged the participation of Texas State University in conducting the Study. The Study was made possible through funding by participants and by the Texas Water Development Board (TWDB) Regional Water and Wastewater Planning Grant Program.
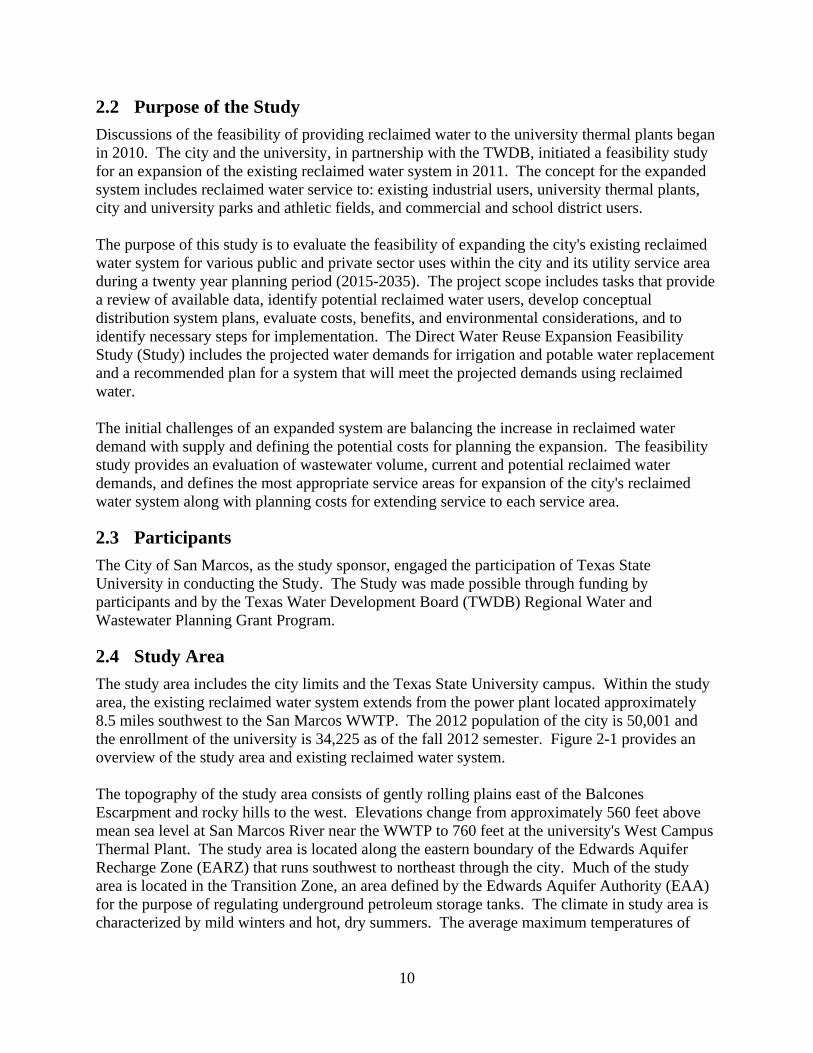
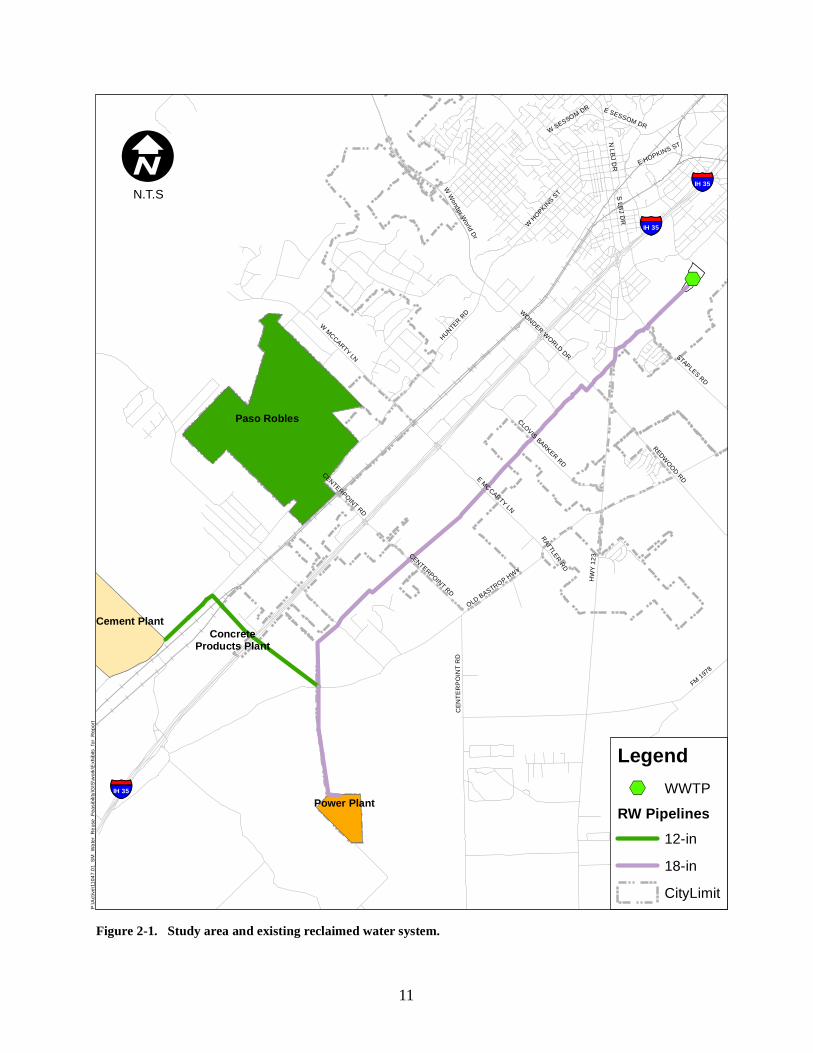
2.4 Study Area
The study area includes the city limits and the Texas State University campus. Within the study area, the existing reclaimed water system extends from the power plant located approximately 8.5 miles southwest to the San Marcos WWTP. The 2012 population of the city is 50,001 and the enrollment of the university is 34,225 as of the fall 2012 semester. Figure 2-1 provides an overview of the study area and existing reclaimed water system. The topography of the study area consists of gently rolling plains east of the Balcones Escarpment and rocky hills to the west. Elevations change from approximately 560 feet above mean sea level at San Marcos River near the WWTP to 760 feet at the university's West Campus Thermal Plant. The study area is located along the eastern boundary of the Edwards Aquifer Recharge Zone (EARZ) that runs southwest to northeast through the city. Much of the study area is located in the Transition Zone, an area defined by the Edwards Aquifer Authority (EAA) for the purpose of regulating underground petroleum storage tanks. The climate in study area is characterized by mild winters and hot, dry summers. The average maximum temperatures of
%,
HWY 1
23
§̈¦IH 35
§̈¦IH 35
§̈¦IH 35
FM 1978
FM 1979
HUNTER RD
OLD BASTROP HWY
CENT
ERPO
INT R
D
E MCCARTY LN
STAPLES RD
W MCCARTY LN
REDWOOD RD
W Wonder World Dr
N LBJ DR
WONDER WORLD DR
S LBJ DR
W HOPKINS ST
E HOPKINS ST
CLOVIS BARKER RD
W SESSOM DR E SESSOM DR
RATTLER RD
CENTERPOINT RD
CENTERPOINT RD
Paso Robles
Cement Plant
Power Plant
ConcreteProducts Plant
P:\Ac
tive\1
1047
.01_S
M_Wa
ter_R
euse
_Fea
sibility
\GIS
\work
\Exh
ibits_
for_R
eport
IN.T.S
Legend%, WWTP
RW Pipelines12-in18-inCityLimit
Figure 2-1. Study area and existing reclaimed water system.
11
12
over 95o F occur in August while the average minimum temperature of 35o F occurs in January. Historically, the wettest month of the year has been May with an average rainfall of 3.76 inches. With an average annual rainfall of just over 31 inches, extended drought cycles have prompted utilities in the region to implement comprehensive water conservation programs. The city presently receives water from the Edwards Aquifer and the Canyon Lake, but also is participating in the development of the Carrizo-Wilcox Aquifer in eastern Caldwell and Gonzales Counties. The university receives water from a separate Edwards Aquifer well, and is also a retail customer of the city's water utility. In conducting Study, the following features of the study area were considered:
The city and university are committed to the goals of the Edwards Aquifer Recovery Implementation Plan (EARIP) Habitat Conservation Plan (HCP) to improve springflow at the San Marcos Springs by reducing withdrawals from the aquifer.
The commitments of the city and university to the goals of the HCP include undertaking activities to improve watershed water quality.
The university has committed to a graduated reduction in diversions of its municipal water rights based on the rate of springlfow from the San Marcos Springs.
Existing and future infrastructure will be required for the conveyance and storage of reclaimed water.
City and university parks and city athletic fields, as well as commercial customers could benefit from a relatively drought-proof water supply source for irrigation.
2.5 Planning Process
2.5.1 Overview
This study addresses delivering reclaimed water to customers of the city's water utility and to the university for industrial and irrigation needs. The planning process gave participants and the public opportunities to understand and contribute to the overall direction of the study.
2.5.2 Public Involvement
Three public meetings were conducted to solicit public input regarding the study with notices of the meetings posted in accordance with public meeting notice requirements and on the city’s web site. The first meeting was a conducted as an open public meeting on July 23, 2012. The second public meeting was conducted as part of the city's regular Parks and Recreation Board meeting on January 22, 2013. The final public meeting was conducted as part of the regular agenda for the City Council on October 2, 2013. Documentation of public involvement is presented in Appendix E. The draft final report was made available for public review and comment between September 22 and October 2, 2013 with a notice posted in the local newspaper. Copies of the draft report were also provided for review by the following agencies:
13
Texas Parks and Wildlife Department Edwards Aquifer Authority U.S. Fish and Wildlife Service Texas Commission on Environmental Quality
Review comments received from the public and from TWDB are presented in Appendix F with responses to those comments.
2.6 Document Organization
This report is organized into 11 sections:
Executive Summary provides a summary of the key findings of the feasibility study.
Section 1 provides an introduction and background information for water reuse in San Marcos, as well as a description of the study area.
Section 2 - Problems and Needs identifies the key water resource management issues that caused the city and university to evaluate the feasibility of expanding the existing reclaimed water system, including projected water demands and supplies.
Section 3 - Water Reuse Opportunities describes the source and potential uses of reclaimed water in the study area.
Section 4 – Description of Alternatives summarizes the objectives that alternatives are designed to meet and the project costs.
Section 5 - Economic and Financial Capability Analysis provides an economic comparison of alternatives that could meet the projected reclaimed water demands.
Section 6 - Recommended Alternative provides a review of the needs, demands, supplies, costs, benefits, and tradeoffs of the alternatives and presents the recommended alternative.
Section 7 - Environmental Considerations provides information regarding potential environmental impacts and benefits related to the project.
Section 8 - Legal and Institutional Requirements analyzes existing regulatory requirements and institutional issues that may affect implementation of the recommended alternative.
Section 9 - Implementation Strategy outlines an approach to developing the recommended project alternative and describes potential research needs for the project.
Section 10 - References contains a list of references used in the preparation of the study.
14
2.7 Abbreviations, Acronyms and Conversions
AF, ac-ft ……………Acre-Feet (1 acre-foot = 325,851 gallons) AWWA……….……. American Water Works Association BOD5………………. Biochemical Oxygen Demand CBOD5………..…….Carbonaceous Biochemical Oxygen Demand CFU…………………Colony Forming Units CIP ……………....…Capital Improvements Plan City……….…………City of San Marcos EAA…………...…….Edwards Aquifer Authority EARZ……………… Edwards Aquifer Recharge Zone ET………………….. Evapotranspiration FEMA……….………Federal Emergency Management Agency GBRA………….……Guadalupe-Blanco River Authority gpm………….………Gallons per Minute HCPUA………..…… Hays – Caldwell Public Utility Agency HP …………….…….Horsepower IH………….….……. Interstate Highway in …………….……. Inches kgal ………...……… Thousand Gallons kwh…………..…….. Kilowatt Hours LF………………….. Linear Feet mgd………….……. Million Gallons per Day mg/l ………….…….. Milligrams per Liter ml …………….……..Milliliter NPDES…………….. National Pollutant Discharge Elimination System NRCS………….…… Natural Resources Conservation Service NTU………….…….. Nephelometric Turbidity Units NWI………….….…. National Wetlands Inventory O&M……………….. Operations and Maintenance POTW………..…….. Publicly Owned Treatment Works Region L…..…………South Central Texas Regional Water Planning Group RWPF………….…… Reclaimed Water Production Facility TAC ………….……..Texas Administrative Code TCEQ………….…… Texas Commission on Environmental Quality TPDES ……….……. Texas Pollutant Discharge Elimination System TPWD…………..….. Texas Parks & Wildlife Department TWCA……….…….. Texas Water Conservation Association TWDB……….…….. Texas Water Development Board TSS ………….…….. Total Suspended Solids TxDOT……….……. Texas Department of Transportation TxSt/University………Texas State University USACE…………….. U.S. Army Corps of Engineers USFWS………..…… U.S. Fish and Wildlife Service UV………………….. Ultraviolet (disinfection) WWTP……….…….. Wastewater Treatment Plant
15
2.8 Background Reports
Several existing reports and studies were reviewed to develop a general background of information. The following documents provide an historical basis for developing the feasibility of expanding the City of San Marcos reclaimed water system.
Engineering Feasibility Study Reclaimed Water Reservoir Site, Alan Plummer Associates, Inc. (APAI), June 2002.
Reclaimed Water Technical Memorandum, APAI, September 2003.
Reclaimed Water Distribution System Evaluation, APAI, April 2004.
City of San Marcos Water Supply Master Plan, Turner Collie & Braden, Inc., December 2004.
Texas State University Campus Water System Study, Final Engineering Report (Section 9.0 Reclaimed Water System Analysis), Bury Partners, May 2012.
Texas State University Utilities Review, Affiliated Engineers, April 2011.
The scope and recommendations of each of these reports are summarized below.
Engineering Feasibility Study Reclaimed Water Reservoir Site
This 2002 report evaluated the feasibility of developing a 97 acre tract adjacent to the San Marcos WWTP as a reclaimed water reservoir. The report included an assessment of engineering costs and feasibility of construction on the site, as well as a review of potential environmental constraints. The report concluded that the environmental constraints were wetlands along the San Marcos River and a potential prehistoric site on the western boundary of the site. The report also concluded that the only engineering constraints associated with developing the site as a reclaimed water reservoir was the overland flow across the tract between the Blanco River and San Marcos River and a 30-inch gas pipeline that bisects the proposed reservoir site. The 2002 report presented opinions of probable construction costs of $4.2 million for a 120 million gallon reservoir and $5.5 million for a 225 million gallon reservoir.
Reclaimed Water Technical Memorandum
The memorandum addressed the disinfection requirements for a potential expansion of the reclaimed water system. The report presented four alternatives for disinfection:
1. Installation of UV disinfection in the reclaimed water discharge header: It was noted that turning the UV lamps off when the reclaimed water pumps are not in operation and then turning the lamps on when pumping starts could present a significant operational issue. Chlorination was recommended to inhibit bacterial regrowth in the transmission system.
2. Relocation of the reclaimed water pump station downstream of the existing plant UV disinfection system: This alternative was developed to reduce the chlorine demand of reclaimed water by changing the withdrawal point from the effluent filters to after the plant UV disinfection and reaeration.
16
3. Construction of a gravity line from the reaeration basin to the existing reclaimed water pump station: As an alternative to relocation of the reclaimed water pump station, construction of a 48-in. diameter gravity pipeline from the reareation basin to the existing pump station would have the advantage of low capital and low operations and maintenance costs. However, the feasibility of this alternative depends on whether the minimum submergence requirements for the vertical turbine pumps could be maintained.
4. Relocation of the reclaimed water pump station to a seasonal storage reservoir: In this alternative, a gravity pipeline would transport reclaimed water from the reaeration basins to a seasonal storage reservoir, where a new reclaimed water pump station would then pump water from the reservoir into the transmission system. Additional filtration and disinfection are required for water that has been stored in an open environment.
Reclaimed Water Distribution System Evaluation
This draft report summarized the WWTP flow volume, the reclaimed water contract volume, and listed potential reclaimed water users. The supply and demand estimates were then used to develop three alternatives for expanding the reclaimed water system to extend service to city parks along the San Marcos River, San Marcos Independent School District athletic fields, university thermal plants and athletic fields, and to a proposed resort development in the vicinity of Post Road and Mimosa Circle that would include landscape and golf course irrigation. A list of potential concerns associated with the expansion of the reclaimed water system was included in the report. Those potential concerns were:
1. Peak summer demands for reclaimed water exceeded the volume of wastewater effluent by 2.2 mgd based on the base power plant demand volume. Maximum demand from the power plant would leave no effluent for other users. The solution of a seasonal storage reservoir was suggested.
2. The fecal coliform monitoring point is located 13,000 LF from the reclaimed water pump station and the addition of a new transmission main approximately 3,400 LF from the pump station would require installation of additional fecal coliform monitoring points.
3. Depending on the proximity of the closest reclaimed water user to the pump station, the chlorine dosage needed to ensure Type I reclaimed water quality would have to be increased significantly.
4. It was observed that a separate pump station that draws water from the reaeration basin could serve as the fecal coliform monitoring point and significantly reduce the chlorine dosage required to maintain Type I water quality.
5. Construction of additional storage and a secondary pump station at the university could reduce the irrigation peak demand and overall pipeline diameter.
City of San Marcos Water Supply Master Plan
Several water supply strategies were evaluated as part of this report, including expanded direct nonpotable reuse, substituting reclaimed water for surface and groundwater demands, and indirect potable reuse.
17
Texas State University Campus Water System Study (Section 9.0 Reclaimed Water System Analysis)
A study of the TxSt campus water system included an evaluation of the potential demands and uses for reclaimed water. This evaluation estimated cooling tower make-up water to be 87 MG and 81 MG for fiscal years 2010 and 2011. The projected cooling tower make-up water volume was projected to increase by 16 MG to approximately 100 MG per year with the construction of an additional one million square feet of new buildings during the 2012-2017 Campus Master Plan period.
Texas State University Utilities Review
As part of the development of the TxSt Campus Master Plan for 2012-2017, a review of campus utilities was conducted and documented in this report. In the report, it was observed that potable water supplied to the campus from the Edwards Aquifer has a very high hardness and that the use of reclaimed water from the City could provide a source of make-up water for the campus thermal plants.
Texas State University Well and Aquifer Evaluation
According to this letter report, production from the TxSt Jackson Well was 304 MG in 2011 and projected to increase to 377 MG in 2020. The projected peak day demand is projected to be 1.66 MGD in 2015 and 1.86 MGD in 2020. TxSt is permitted by EAA to withdraw up to 2,000 AF from the Edwards Aquifer using the Jackson Well. Stage V conditions would reduce the maximum allowable production to 1,120 AF. TxSt production is presently below the Stage V limit and the projected 2020 demand would be approximately 1,156 AF.

18
This page is intentionally blank
19
3 Problems and Needs The City of San Marcos and Texas State University have undertaken this study of the feasibility of expanding the city's reclaimed water system as part of ongoing efforts to maintain water levels in the Edwards Aquifer and San Marcos River in order to preserve critical habitat, as well as to expand water reuse as an alternative water supply for industrial and municipal uses. This section describes the water management needs within the study area which have led the city and the university to evaluate increased use of reclaimed water.
3.1 Water Management Needs
The San Marcos area is a unique setting of environmental sensitivity and significant growth of city population and university enrollment. The Edwards Aquifer was the primary water supply source for the south central Texas region for many decades. Realizing that the region could not remain heavily dependent on the aquifer without adversely affecting the source of supply for the San Marcos and Comal Springs, utilities began to expand efforts to develop water management strategies to address local and regional water management needs. The water management needs of the study area can be summarized in five primary components:
Develop reliable sources of water supply;
Ensure that water supplies protect and promote public health;
Develop water management strategies that enhance and restore the local environment;
Minimize the costs of developing new water supplies by full utilization of local water sources; and
Make water resource management an integral part of local economic development.
Expanding the reclaimed water system also addresses two secondary water management needs in that it generates revenue for the utility and provides water that satisfies the specific needs of users, such as public parks that would otherwise continue without supplemental landscape irrigation.
3.1.1 Water Quality
The Edwards Aquifer and San Marcos River are exceptional in terms of water quality and habitat for threatened and endangered species. The EARIP and HCP represent the efforts of the regional stakeholders to preserve the water quality and spring flow necessary to protect the endangered species found in the aquifer and river from harm during the most severe drought. Efforts to protect the water quality of the San Marcos River include implementation of best management practices (BMPs) for stormwater management. BMPs that rely on maintaining vegetation can be compromised during periods of drought when landscape irrigation is curtailed.
20
3.2 Water Supplies and Demands
Completion of the construction of a surface water treatment plant and rehabilitation of the WWTP in 2000 signaled the city's transition from complete reliance on the Edwards Aquifer to a more diversified water management strategy. With those construction projects, the city moved from solely groundwater supply to mostly surface water for potable water and added reclaimed water to the city's inventory of water supplies.
3.2.1 Water supplies
The city and the university maintain a diverse inventory of water supplies. The city presently relies on the Edwards Aquifer and surface water to meet all demands of its water utility customers. The city also provides water utility service to a large portion of the university, primarily the eastern portions of the campus. The city is also a member of the Hays-Caldwell Public Utility Agency (HCPUA) - a consortium of water utilities that was formed to develop a water supply from the Carrizo-Wilcox Aquifer in Gonzales and eastern Caldwell Counties. The city’s current water supplies include an annual maximum of 5,433 AF from the Edwards Aquifer and the purchase of 10,000 AF of surface water from GBRA. The GBRA surface water supply is pumped from the Guadalupe River downstream of New Braunfels to the San Marcos Surface Water Treatment Plant located just south of the municipal airport. The surface water supply contract consists of a rate for delivery of each 1,000 gallons and an annual raw water fee per acre-foot on a ‘take-or-pay’ basis. An additional 4,000 AF will be added to the city’s water supply in 2023 from the HCPUA, with an additional 8,000 AF of water from HCPUA in 2032. The university operates an Edwards Aquifer well that has a permitted maximum withdrawal of 2,000 AF to supply the campus potable, industrial, and irrigation uses. The university also purchases approximately 62 AF of potable water from the city on a retail basis. Both the city and university have implemented detailed and aggressive conservation programs in an effort to extend existing water supplies for continuing growth. Average per capital water consumption in San Marcos now averages 116 gpcd after implementation of a broad range of water conservation measures.
San Marcos River
The San Marcos River originates at San Marcos Springs, where approximately 200 springs emerge from the Edwards Aquifer to fill Spring Lake. The springs provide an environment for eight federally listed endangered or threatened species. The river is a constant 72o F and is used year round for recreational activities. Both the city and university hold water rights on the San Marcos River. Through certificate of adjudication (CA) number 18-3865D, the university has a range of uses that include municipal, irrigation, and industrial. The university's rights include consumptive use of up to 513 AF for municipal uses and 534 AF for industrial uses. The city is authorized under permit number 5092 to divert up to 150 AF for municipal uses (Table 3-1). Presently, the San Marcos River is not used as a source of potable water supply by either the city or the university. Both water from the
21
university's Jackson Well and the 534 AF of industrial water rights have been used to provide makeup water for the university's thermal plants.
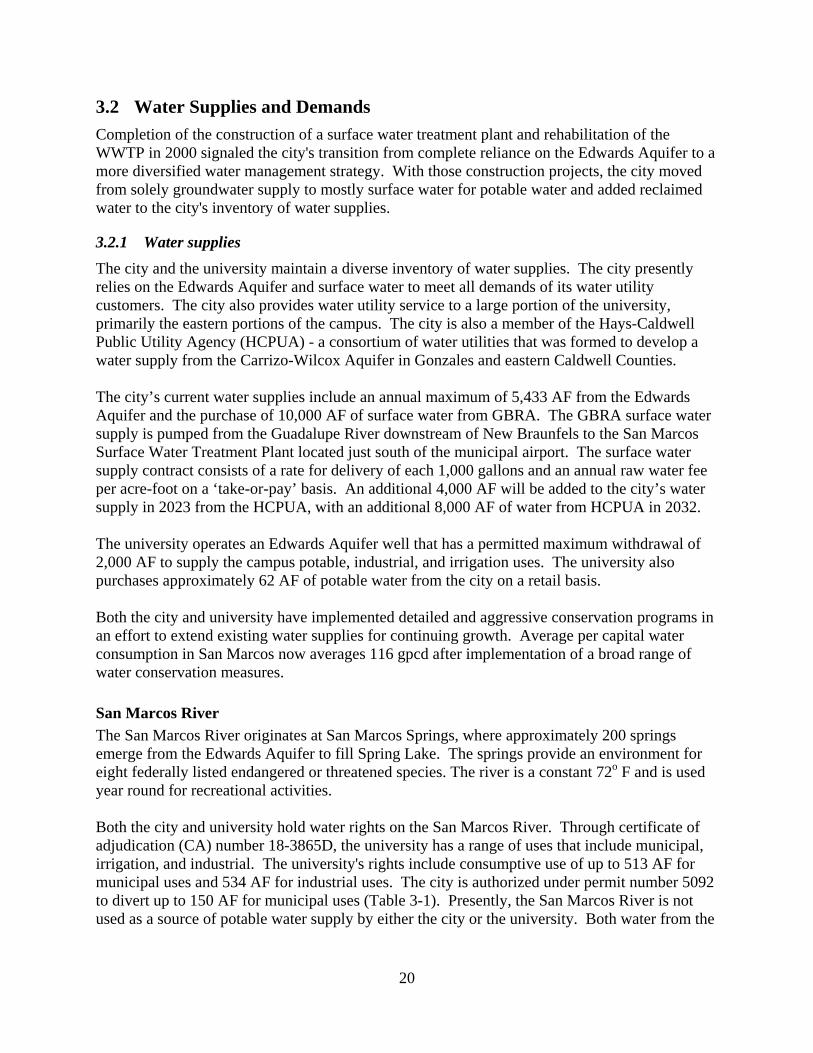
Table 3-1. San Marcos River water rights in the study area.
Water Right Number
Priority Date
Authorized Annual
Diversion Rate (AF/Yr.)
Authorized Use Maximum Diversion Rate (cfs)
CA# 18-3865D 09/04/1895 513 Municipal 2.22 534 Industrial 1.33
64,370 Hydroelectric 120.00 80 Irrigation 1.33
700 Artificial Waterfall 4.78 100 Irrigation 1.33
P# 5092 09/02/1986 150 Municipal 1.10 A key provision of the HCP is a progressive reduction of the university's total surface diversion rate from the headwaters of the San Marcos River for consumptive use based on spring flow. The reduced diversion would occur just below Spring Lake Dam in order to enhance the flow through the areas of critical habitat in the San Marcos River. Under the HCP, the university committed to reduce the total rate of surface water diversion by an additional 2 cfs to a total of approximately 6.1 cfs when spring flow reaches 80 cfs. The university would reduce the rate of diversion by another 2 cfs when spring flow drops to 60 cfs and would suspend all diversions when spring flow drops to 45 cfs.
3.2.2 Water demands
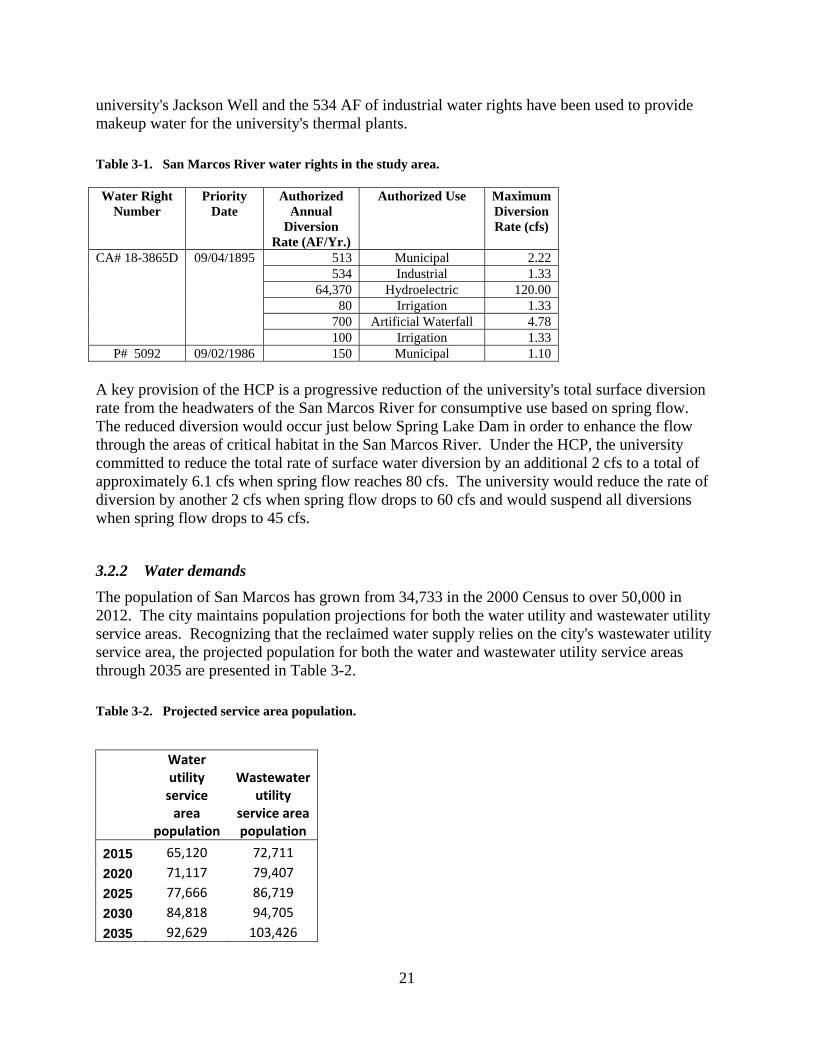
The population of San Marcos has grown from 34,733 in the 2000 Census to over 50,000 in 2012. The city maintains population projections for both the water utility and wastewater utility service areas. Recognizing that the reclaimed water supply relies on the city's wastewater utility service area, the projected population for both the water and wastewater utility service areas through 2035 are presented in Table 3-2.
Table 3-2. Projected service area population.
Water utility service area
population
Wastewater utility
service area population
2015 65,120 72,711
2020 71,117 79,407
2025 77,666 86,719
2030 84,818 94,705
2035 92,629 103,426
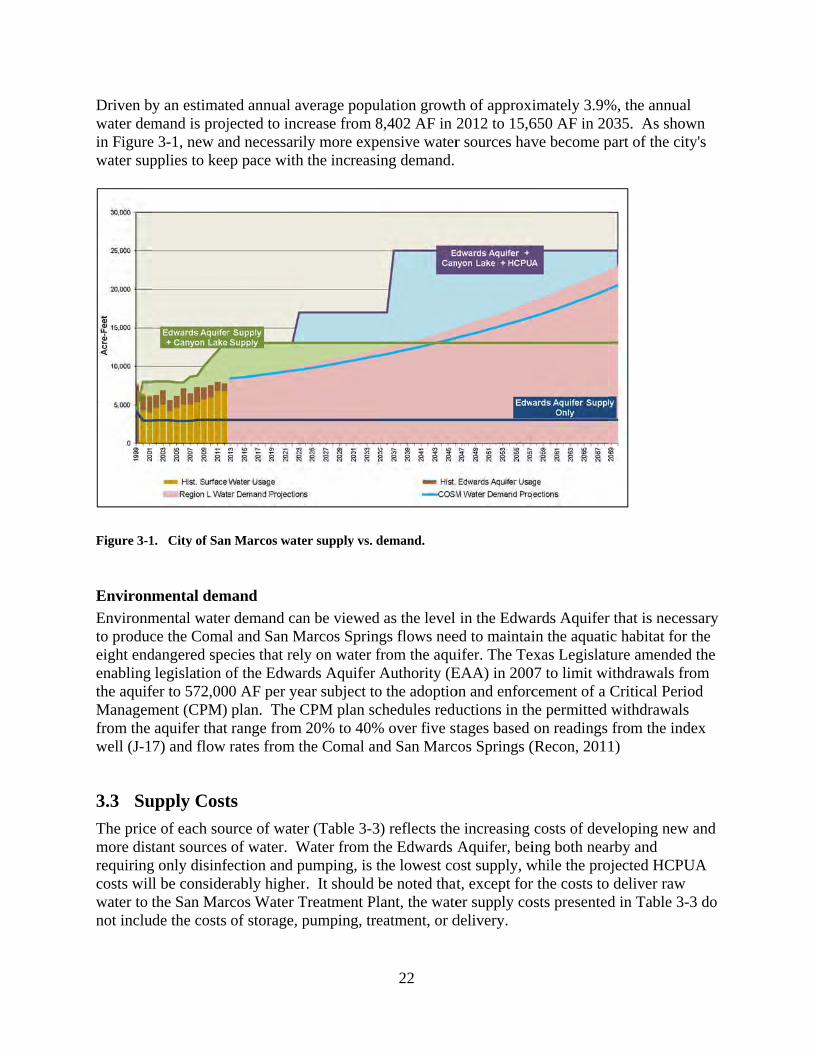
Driven bwater demin Figurewater sup
Figure 3-1
Environ
Environmto produceight endenabling the aquifManagemfrom the well (J-1
3.3 Su
The pricemore distrequiringcosts wilwater to tnot inclu
y an estimatmand is proje 3-1, new anpplies to kee
1. City of San
mental dem
mental waterce the Comadangered spelegislation o
fer to 572,00ment (CPM) aquifer that 7) and flow
upply Cost
e of each soutant sources
g only disinfel be considethe San Marde the costs
ted annual avjected to incrnd necessarilep pace with
n Marcos wate
mand
r demand canal and San Mecies that relyof the Edwar0 AF per yeplan. The Crange from rates from th
ts
urce of waterof water. W
fection and prably higher
rcos Water Tof storage, p
verage popurease from 8ly more expethe increasi
er supply vs. d
n be viewed Marcos Spring
y on water frds Aquifer Aar subject to
CPM plan sc20% to 40%he Comal an
r (Table 3-3Water from th
umping, is tr. It should bTreatment Plpumping, tre
22
lation growt8,402 AF in 2ensive waterng demand.
demand.
as the level gs flows neefrom the aquAuthority (E
o the adoptiochedules redu% over five stnd San Marc
) reflects thehe Edwards the lowest cobe noted thatant, the wate
eatment, or d
th of approxi2012 to 15,6r sources hav
in the Edwaed to maintaiuifer. The TeEAA) in 200on and enforcuctions in thtages based
cos Springs (
e increasing Aquifer, bei
ost supply, wat, except forer supply codelivery.
imately 3.9%650 AF in 20ve become p
ards Aquiferin the aquati
exas Legislat07 to limit wicement of a
he permitted on readings
(Recon, 201
costs of deving both neawhile the pror the costs toosts presented
%, the annua035. As shopart of the ci
r that is neceic habitat forture amendedithdrawals frCritical Periwithdrawalsfrom the ind
1)
veloping newarby and ojected HCPUo deliver rawd in Table 3
al own ity's
essary r the d the
from iod s dex
w and
UA w
-3 do
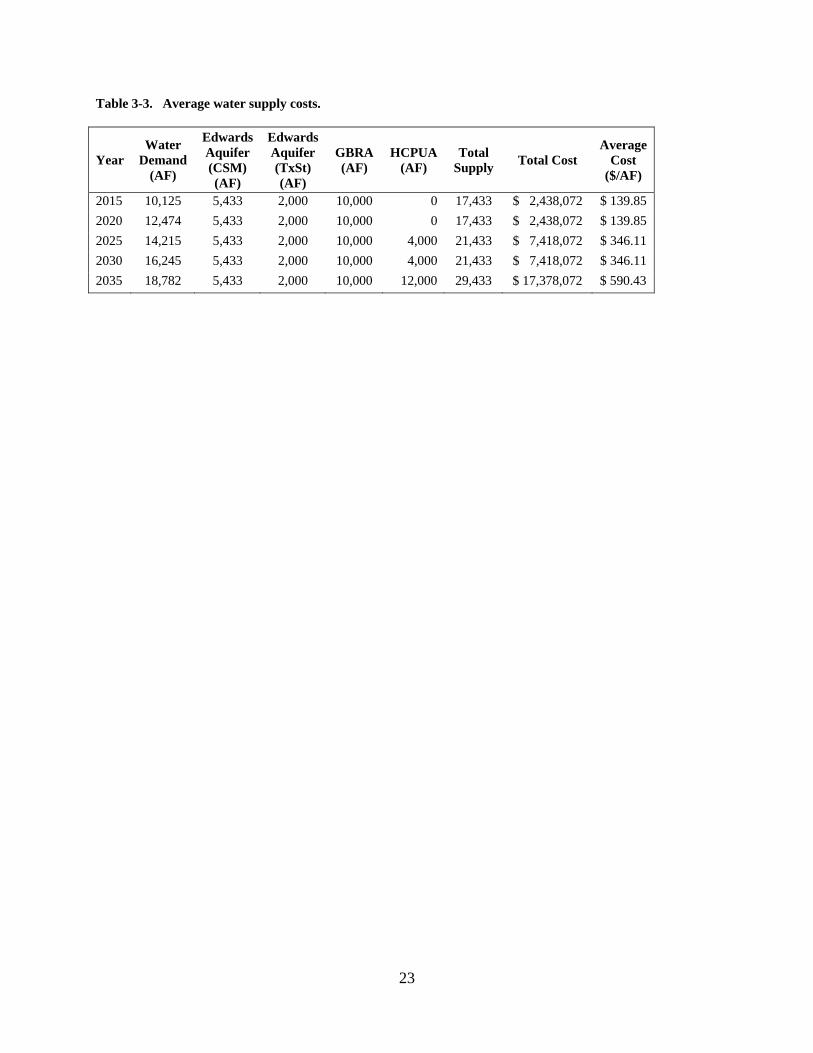
23
Table 3-3. Average water supply costs.
Year Water
Demand (AF)
Edwards Aquifer (CSM) (AF)
Edwards Aquifer (TxSt) (AF)
GBRA (AF)
HCPUA (AF)
Total Supply
Total Cost Average
Cost ($/AF)
2015 10,125 5,433 2,000 10,000 0 17,433 $ 2,438,072 $ 139.85
2020 12,474 5,433 2,000 10,000 0 17,433 $ 2,438,072 $ 139.85
2025 14,215 5,433 2,000 10,000 4,000 21,433 $ 7,418,072 $ 346.11
2030 16,245 5,433 2,000 10,000 4,000 21,433 $ 7,418,072 $ 346.11
2035 18,782 5,433 2,000 10,000 12,000 29,433 $ 17,378,072 $ 590.43

24
This page is intentionally blank
25
4 Water Reclamation and Reuse Opportunities While the rate of population growth in the South Central Texas region continues to lead the state and nation, utilities in the region are working to extend water supplies through conservation and the development of new supplies. Recognizing the value of diversified water resources, the City of San Marcos began their first water reuse project in 2000 following the expansion of the city's wastewater treatment plant and change from secondary to tertiary treatment. Extending an 18-inch diameter pipeline approximately 8.5 miles from the city wastewater treatment plant to a gas-fired power plant in 2000 made it possible for the city to serve additional customers. Contracts were executed for extending reclaimed water service to a cement plant in 2007 and to a proposed golf course in 2010. Development of the Edwards Aquifer Recovery Implementation Plan (EARIP) and the Habitat Conservation Plan (HCP) have increased regional interests in reducing demand on the Edwards Aquifer as a way to preserve springflow for the San Marcos River. As part of a continuing commitment of Texas State University to preserve flow in the Upper San Marcos River, the university is evaluating reclaimed water as an alternative to water from its Edwards Aquifer well or water rights to the San Marcos River for makeup water for the university's four thermal plants. In addition to the current and potential industrial uses for reclaimed water in San Marcos, the city's parks department has suggested that reclaimed water irrigation of the city's parklands along the San Marcos River could provide environmental and social benefits by reducing erosion potential along the river and improving the level of service of the local parks. This section discusses the potential for delivering reclaimed water within the study area.
4.1 Existing and Potential Reclaimed Water Users
The primary water demands in the study area that can be met using reclaimed water are industrial and irrigation uses. Three categories of reclaimed water users were identified for this study: 1) industrial users that have a need for process water or for dust control; 2) landscape irrigation for commercial properties; and 3) institutional customer irrigation. Institutional customers include city parks and city, school, and university athletic fields. A proposed private golf course and a homeowners association located near the city’s soccer complex were also included as institutional customers. For the purposes of the study, potential commercial users are primarily limited to those properties that are located in close proximity to the existing or proposed reclaimed water distribution system and have significant historical irrigation demands. The city has contracts to deliver reclaimed water to a power plant, a cement manufacturer, and a proposed golf course. All of the contracted users are located south of the city and in close proximity to the existing reclaimed water distribution system. Potential industrial users include a concrete products manufacturer, a concrete batch plant, and the university’s thermal plants. Both the city and the university have a number of parks and other facilities that are not included as potential reclaimed water users. Parks and athletic fields included as potential reclaimed water users in the study are those that are close to the existing pipeline or to the pipeline intended
26
to serve the university thermal plants, or are heavily used and have a significant irrigation demand, such as the city’s soccer and baseball complexes.
4.1.1 Reclaimed Water Demand Projections
The potential demands of reclaimed water uses were developed based on available data using one of three methodologies.
Method A – Demand Based on Water Use Data
Metered consumption data was available for water utility accounts that included some of the parks, university facilities east of the San Marcos River, school district athletic fields, HOA irrigation meters, industrial, and commercial customers. Data included monthly metered volumes for the period of 2006 – 2011 and advanced metering infrastructure (AMI) data for the period of May 1, 2012 through August 31, 2012. Peak month demands for irrigation accounts were identified from the peak irrigation period of May through September. AMI data also provided peak day and peak hour information. The university’s thermal plant average annual demand was based on the historical metered consumption for three of the four thermal plants provided by the university, along with the projected annual demand provided by the university for the new South Thermal Plant. The projected annual demand was increased to account for increases in cycles of concentration due to higher conductivity and ammonia in reclaimed water.
Method B – Irrigation Demand Based on Landscape Coefficient Data
Method B was used for potential users where metered consumption data are not available. These users included park areas that are presently not irrigated or are not fully irrigated, and where the level of irrigation has been limited. Method B is based on historical evapotranspiration rate data for the Austin station maintained by the Texas A&M Agrilife Extension’s Texas ET Network. The ET Network average ET0 is computed using climatic data over a period of 70 years. Precipitation data was obtained from the Texas Water Development Board (TWDB) Precipitation and Lake Evaporation Data for Texas. Single runoff and irrigation efficiency factors were assumed for all sites. Turf coefficients (Tc) and quality factors (Qf) used are those available through the Texas ET Network that assume turfgrass with no stress conditions. The following equation was used to determine the unit irrigation demand for Method B: [(ET0 x Tc x Qf) – (P-R)] ÷ ei Where: ET0 = Monthly evapotranspiration, from Texas ET Network (inches) Tc = Turf coefficient (unitless) Qf = Quality factor (unitless) P = Average monthly precipitation, from TWDB (inches) R = Runoff, 25% of precipitation (inches) ei = Irrigation efficiency, (assumed 75%)
27
The irrigation demand was calculated using the area of each parcel to be irrigated as provided by the city Parks Department.
Method C – Water Demand Based on Existing Reclaimed Water Contracts
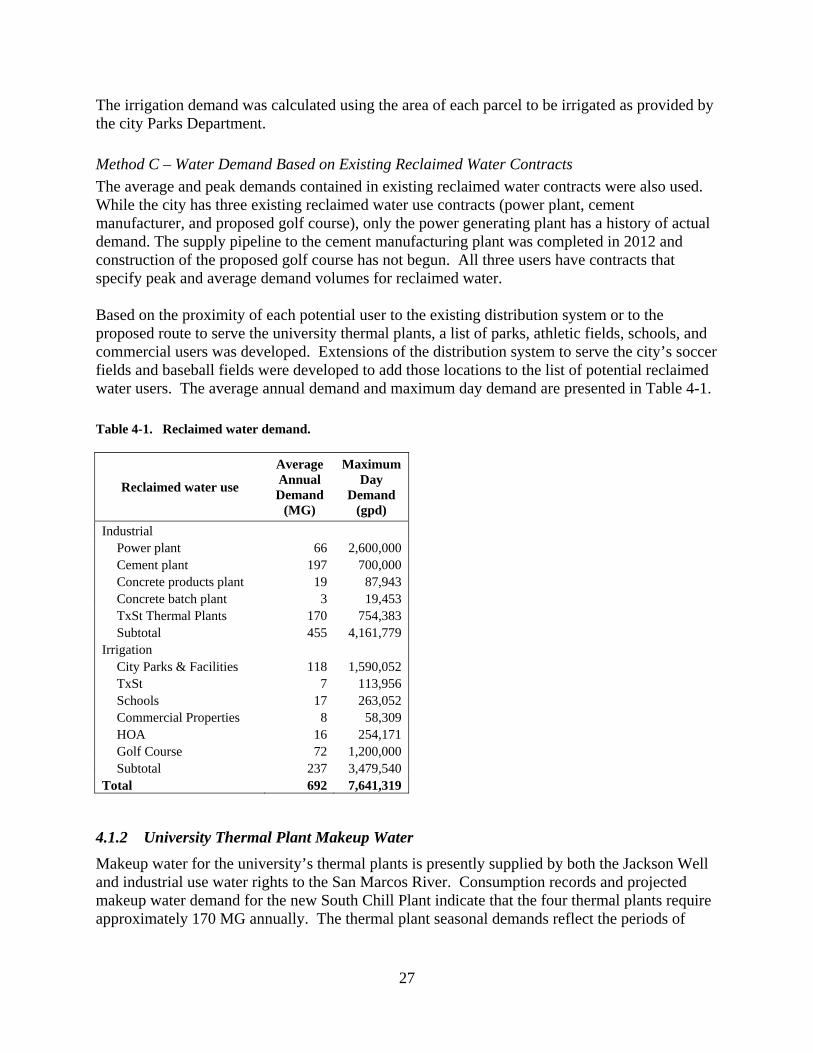
The average and peak demands contained in existing reclaimed water contracts were also used. While the city has three existing reclaimed water use contracts (power plant, cement manufacturer, and proposed golf course), only the power generating plant has a history of actual demand. The supply pipeline to the cement manufacturing plant was completed in 2012 and construction of the proposed golf course has not begun. All three users have contracts that specify peak and average demand volumes for reclaimed water. Based on the proximity of each potential user to the existing distribution system or to the proposed route to serve the university thermal plants, a list of parks, athletic fields, schools, and commercial users was developed. Extensions of the distribution system to serve the city’s soccer fields and baseball fields were developed to add those locations to the list of potential reclaimed water users. The average annual demand and maximum day demand are presented in Table 4-1.
Table 4-1. Reclaimed water demand.
Reclaimed water use
Average Annual Demand
(MG)
Maximum Day
Demand (gpd)
Industrial Power plant 66 2,600,000 Cement plant 197 700,000 Concrete products plant 19 87,943 Concrete batch plant 3 19,453 TxSt Thermal Plants 170 754,383 Subtotal 455 4,161,779
Irrigation City Parks & Facilities 118 1,590,052 TxSt 7 113,956 Schools 17 263,052 Commercial Properties 8 58,309 HOA 16 254,171 Golf Course 72 1,200,000 Subtotal 237 3,479,540
Total 692 7,641,319
4.1.2 University Thermal Plant Makeup Water
Makeup water for the university’s thermal plants is presently supplied by both the Jackson Well and industrial use water rights to the San Marcos River. Consumption records and projected makeup water demand for the new South Chill Plant indicate that the four thermal plants require approximately 170 MG annually. The thermal plant seasonal demands reflect the periods of
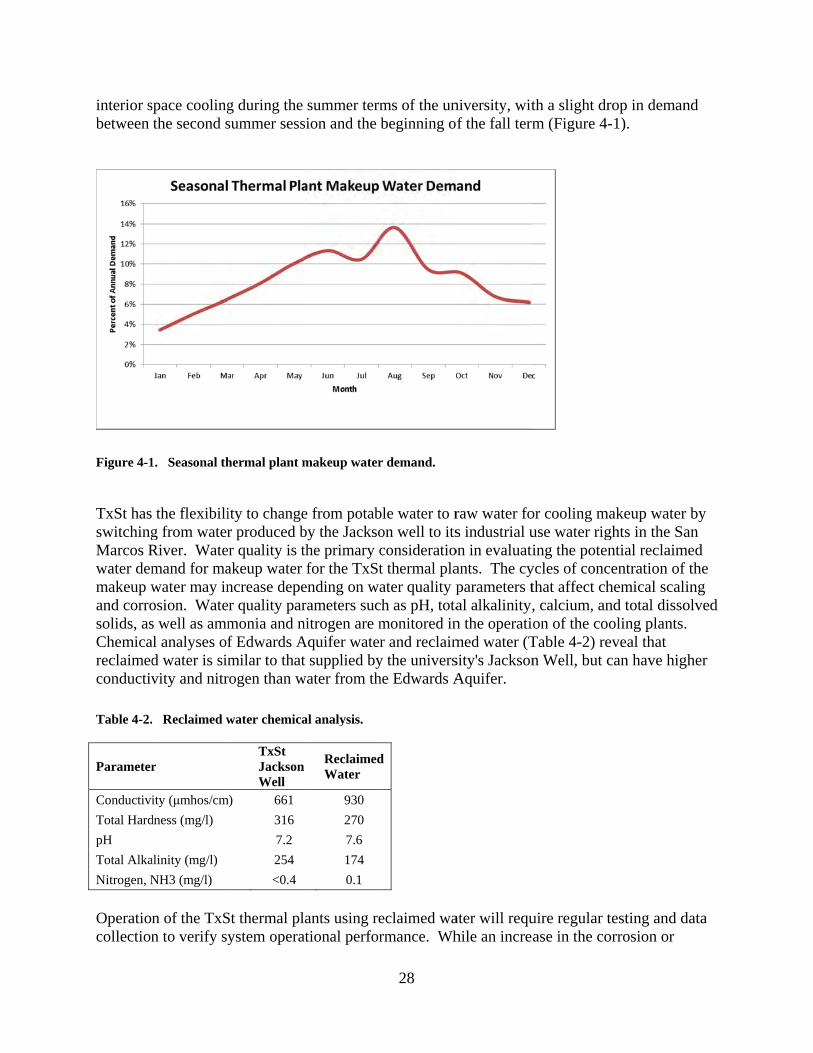
interior sbetween
Figure 4-1
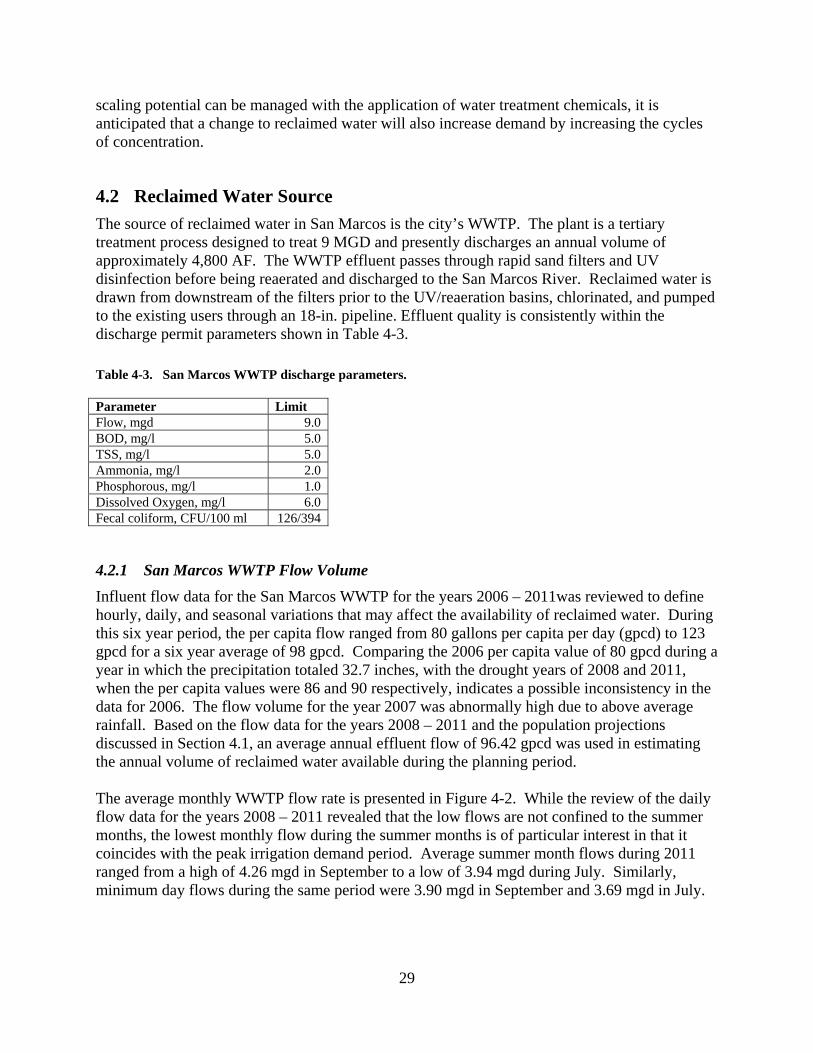
TxSt hasswitchingMarcos Rwater demmakeup wand corrosolids, asChemicareclaimedconductiv
Table 4-2.
Parameter
Conductivi
Total Hard
pH
Total Alka
Nitrogen, N
Operationcollection
space coolingthe second s
1. Seasonal th
the flexibilig from waterRiver. Watemand for mawater may inosion. Wates well as ammal analyses ofd water is simvity and nitr
. Reclaimed w
r
ity (μmhos/cm
dness (mg/l)
alinity (mg/l)
NH3 (mg/l)
n of the TxSn to verify sy
g during the summer sess
hermal plant m
ity to changer produced br quality is t
akeup water ncrease deper quality parmonia and nf Edwards Amilar to that
rogen than w
water chemica
TxSt JacksonWell
m) 661
316
7.2
254
<0.4
St thermal plystem opera
summer termsion and the
makeup water
e from potabby the Jacksothe primary cfor the TxSt
ending on warameters sucnitrogen are mAquifer watert supplied by
water from th
al analysis.
ReclaimedWater
930
270
7.6
174
0.1
ants using reational perfor
28
ms of the unbeginning o
r demand.
ble water to ron well to itsconsideratiot thermal plaater quality p
ch as pH, totamonitored inr and reclaim
y the univershe Edwards A
d
eclaimed warmance. Wh
niversity, witf the fall term
raw water fos industrial u
on in evaluatiants. The cyparameters tal alkalinity,n the operatimed water (Tsity's JacksonAquifer.
ater will requhile an incre
th a slight drm (Figure 4-
or cooling muse water riging the poten
ycles of concthat affect ch, calcium, anon of the co
Table 4-2) ren Well, but c
uire regular tase in the co
rop in deman-1).
makeup waterghts in the Santial reclaimcentration ofhemical scalnd total dissooling plantseveal that can have hig
testing and dorrosion or
nd
r by an
med f the ling olved .
gher
data
29
scaling potential can be managed with the application of water treatment chemicals, it is anticipated that a change to reclaimed water will also increase demand by increasing the cycles of concentration.
4.2 Reclaimed Water Source
The source of reclaimed water in San Marcos is the city’s WWTP. The plant is a tertiary treatment process designed to treat 9 MGD and presently discharges an annual volume of approximately 4,800 AF. The WWTP effluent passes through rapid sand filters and UV disinfection before being reaerated and discharged to the San Marcos River. Reclaimed water is drawn from downstream of the filters prior to the UV/reaeration basins, chlorinated, and pumped to the existing users through an 18-in. pipeline. Effluent quality is consistently within the discharge permit parameters shown in Table 4-3.
Table 4-3. San Marcos WWTP discharge parameters.
Parameter Limit Flow, mgd 9.0 BOD, mg/l 5.0 TSS, mg/l 5.0 Ammonia, mg/l 2.0 Phosphorous, mg/l 1.0 Dissolved Oxygen, mg/l 6.0 Fecal coliform, CFU/100 ml 126/394
4.2.1 San Marcos WWTP Flow Volume
Influent flow data for the San Marcos WWTP for the years 2006 – 2011was reviewed to define hourly, daily, and seasonal variations that may affect the availability of reclaimed water. During this six year period, the per capita flow ranged from 80 gallons per capita per day (gpcd) to 123 gpcd for a six year average of 98 gpcd. Comparing the 2006 per capita value of 80 gpcd during a year in which the precipitation totaled 32.7 inches, with the drought years of 2008 and 2011, when the per capita values were 86 and 90 respectively, indicates a possible inconsistency in the data for 2006. The flow volume for the year 2007 was abnormally high due to above average rainfall. Based on the flow data for the years 2008 – 2011 and the population projections discussed in Section 4.1, an average annual effluent flow of 96.42 gpcd was used in estimating the annual volume of reclaimed water available during the planning period. The average monthly WWTP flow rate is presented in Figure 4-2. While the review of the daily flow data for the years 2008 – 2011 revealed that the low flows are not confined to the summer months, the lowest monthly flow during the summer months is of particular interest in that it coincides with the peak irrigation demand period. Average summer month flows during 2011 ranged from a high of 4.26 mgd in September to a low of 3.94 mgd during July. Similarly, minimum day flows during the same period were 3.90 mgd in September and 3.69 mgd in July.
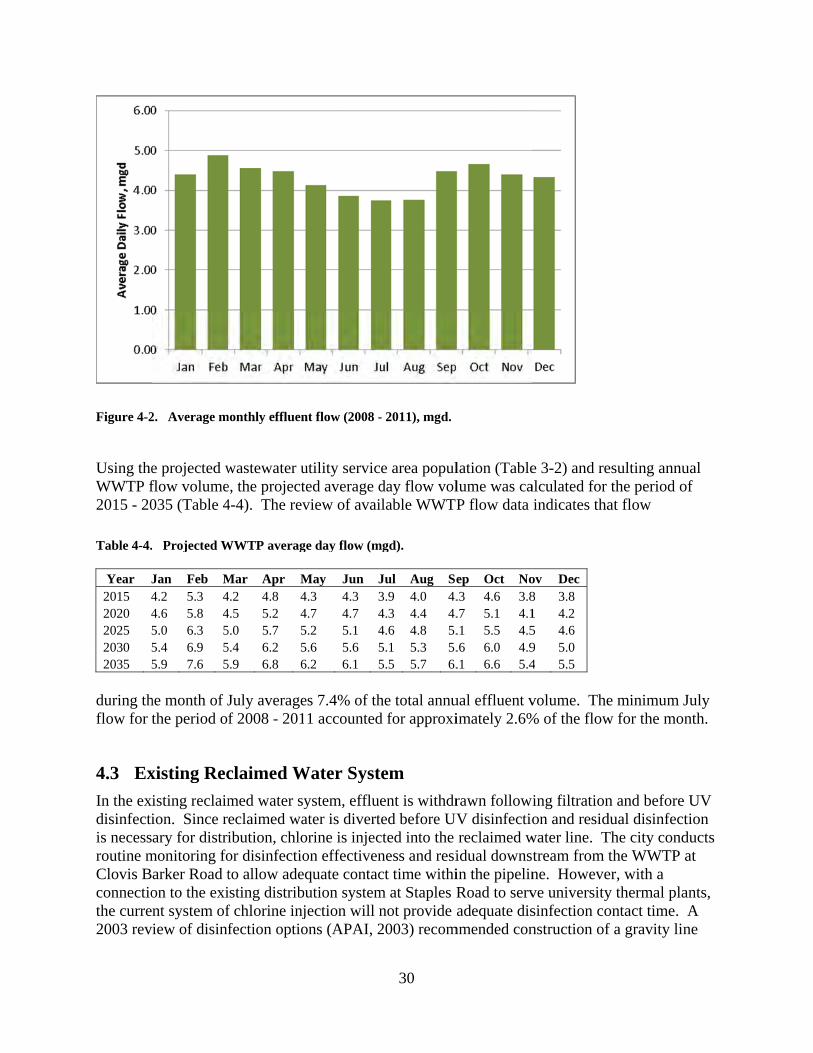
Figure 4-2
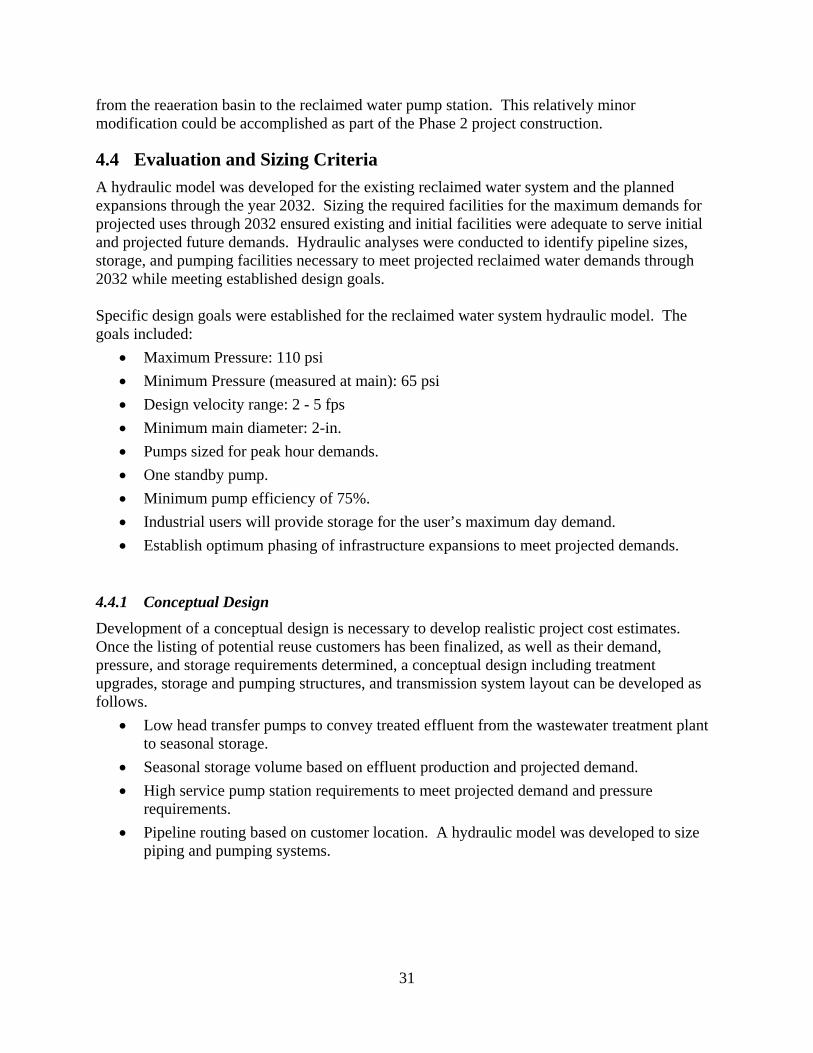
Using theWWTP f2015 - 20
Table 4-4.
Year J2015 42020 42025 52030 52035 5
during thflow for t
4.3 Ex
In the exdisinfectiis necessroutine mClovis Bconnectiothe curre2003 rev
2. Average m
e projected wflow volume035 (Table 4
. Projected W
Jan Feb M4.2 5.3 44.6 5.8 45.0 6.3 55.4 6.9 55.9 7.6 5
he month of Jthe period o
xisting Rec
isting reclaimion. Since rary for distri
monitoring foarker Road ton to the exint system ofiew of disinf
monthly effluen
wastewater ue, the project4-4). The rev
WWTP averag
Mar Apr M4.2 4.8 44.5 5.2 45.0 5.7 55.4 6.2 55.9 6.8 6
July averagef 2008 - 201
claimed W
med water syeclaimed waibution, chloor disinfectioto allow adeisting distribf chlorine injfection optio
nt flow (2008 -
utility servicted average dview of avai
ge day flow (m
May Jun J4.3 4.3 34.7 4.7 45.2 5.1 45.6 5.6 56.2 6.1 5
es 7.4% of th1 accounted
Water Syst
ystem, efflueater is divertorine is injecon effectivenquate contac
bution systemjection will nons (APAI, 2
30
- 2011), mgd.
e area populday flow volilable WWTP
mgd).
Jul Aug Se3.9 4.0 4.4.3 4.4 4.4.6 4.8 5.5.1 5.3 5.5.5 5.7 6.
he total annud for approxi
tem
ent is withdrted before UVcted into the ness and resict time withim at Staples Rnot provide 2003) recom
lation (Tablelume was caP flow data
ep Oct No.3 4.6 3.8.7 5.1 4.1.1 5.5 4.5.6 6.0 4.9.1 6.6 5.4
ual effluent vimately 2.6%
rawn followV disinfectioreclaimed widual downsin the pipelinRoad to servadequate dis
mmended con
e 3-2) and realculated for indicates tha
ov Dec 8 3.8 1 4.2 5 4.6 9 5.0 4 5.5
volume. The% of the flow
ing filtrationon and resid
water line. Ttream from tne. Howeveve universitysinfection construction of
esulting annuthe period o
at flow
e minimum Jw for the mon
n and before dual disinfectThe city condthe WWTP
er, with a y thermal plaontact time. f a gravity lin
ual of
July nth.
UV tion ducts at
ants, A
ne
31
from the reaeration basin to the reclaimed water pump station. This relatively minor modification could be accomplished as part of the Phase 2 project construction.
4.4 Evaluation and Sizing Criteria
A hydraulic model was developed for the existing reclaimed water system and the planned expansions through the year 2032. Sizing the required facilities for the maximum demands for projected uses through 2032 ensured existing and initial facilities were adequate to serve initial and projected future demands. Hydraulic analyses were conducted to identify pipeline sizes, storage, and pumping facilities necessary to meet projected reclaimed water demands through 2032 while meeting established design goals. Specific design goals were established for the reclaimed water system hydraulic model. The goals included:
Maximum Pressure: 110 psi
Minimum Pressure (measured at main): 65 psi
Design velocity range: 2 - 5 fps
Minimum main diameter: 2-in.
Pumps sized for peak hour demands.
One standby pump.
Minimum pump efficiency of 75%.
Industrial users will provide storage for the user’s maximum day demand.
Establish optimum phasing of infrastructure expansions to meet projected demands.
4.4.1 Conceptual Design
Development of a conceptual design is necessary to develop realistic project cost estimates. Once the listing of potential reuse customers has been finalized, as well as their demand, pressure, and storage requirements determined, a conceptual design including treatment upgrades, storage and pumping structures, and transmission system layout can be developed as follows.
Low head transfer pumps to convey treated effluent from the wastewater treatment plant to seasonal storage.
Seasonal storage volume based on effluent production and projected demand.
High service pump station requirements to meet projected demand and pressure requirements.
Pipeline routing based on customer location. A hydraulic model was developed to size piping and pumping systems.

32
This page is intentionally blank
33
5 Description of Alternatives This section describes the planning process used to develop the conceptual supply and transmission alternatives for each service area. The delineation of potential service areas for the extension of reclaimed water service focused on the immediate and readily identifiable opportunities for industrial uses (including university thermal plants), city, school, and university irrigation demands in close proximity to the reclaimed water distribution service to industrial users, and major demands in two outlying areas. Alternatives for expanding the San Marcos reclaimed water system were evaluated on the basis of meeting the objectives of providing service to meet the users' water demands while reducing current and future potable water demand, and providing positive social and environmental benefits. An analysis of potential reclaimed water users was performed within the city and the university campus to determine options for expanding the existing reclaimed water distribution system. The goals of the analysis were to provide an economically sound distribution system to maximize utilization of the available reclaimed water supply while allowing for system flexibility for future demand, reduction in potable water demand, and enhancement of city and university facilities. The options considered represent a phased approach in an attempt to maximize the reduction in potable water demand and expansion of the reclaimed water system. Five phases of potential system expansion for the reclaimed water system were developed. The options were compared to a "no-action" option to provide a point of reference point for maintaining the existing system without any expansion. The broad characteristics that would be used to define potential service areas and reclaimed water users were defined in the Study. These characteristics included:
existing, identified, and potential reclaimed water uses in the study area;
proximity to the existing reclaimed water distribution system and to an extension of the system to serve the university thermal plants; and extensions to serve areas of significant demand in limited areas; and
supply alternatives to meet peak reclaimed water demands during summer minimum WWTP flows.
Two water sources were considered during the planning process: treated effluent from the San Marcos WWTP and use of potable water to meet peak demands that cannot be met using only reclaimed water. Construction of seasonal storage for reclaimed water was also considered. Based on the initial evaluation, a preferred alternative was selected and used as the basis for the recommended project alternative. Social benefits were generally defined as enhancements to the aesthetic appeal of public parks and facilities (city, university, public schools, and homeowners association), as well as commercial facilities that have a significant presence in the community (hospital and shopping centers). Environmental benefits as objectives for project alternatives included reducing demands on the Edwards Aquifer and Upper San Marcos River, as well as establishing and maintaining a vegetative buffer along the San Marcos River within public parks.
34
5.1 Service Area Definition
As previously noted, prospective reclaimed water users were evaluated on the basis of potential reclaimed water demand and proximity to a reclaimed water conveyance system to serve existing users and the university thermal plants. Four service areas were defined by existing and potential extensions of the reclaimed water conveyance system to areas of significant use with limited need for service lateral extensions. The service areas, shown in Figure 5-1, are:
1. South Service Area
2. TxSt/Downtown Service Area
3. Gary Service Area
4. North Service Area
The service areas are described in the following sections.
5.1.1 South Service Area
The South Service Area includes the area generally along South IH 35 between the San Marcos River and the existing power plant delivery point. The reclaimed water conveyance system consists of an existing 18-inch diameter main from the WWTP to the power plant with an existing 12-inch diameter extension to the cement plant and a planned extension to the proposed Paso Robles golf course. In addition to the power plant and cement plant, a contract to supply reclaimed water to the proposed Paso Robles golf course was completed in 2010. Potential users in the South Service Area include a concrete products plant and a concrete batch plant. Potential irrigation customers in the South Service Area include the local hospital, shopping centers, and public schools.
5.1.2 TxSt/Downtown Service Area
This service area includes both the thermal plants and irrigation uses on the Texas State University campus, as well as the irrigation demands for the city's parks and facilities located along the San Marcos River corridor, downtown, and along Hopkins St. Service to the area begins with construction of a 16-inch diameter pipeline from the existing transmission main to a delivery point for the university's thermal plants at N. LBJ St. and University Drive. City and university irrigation demands are concentrated along the river corridor and along Hopkins St. and Aquarena Springs Dr.
5.1.3 Gary Service Area
The Gary Service Area includes two major potential reclaimed water users. The Gary Ball Fields currently use potable water for irrigation and are located adjacent to the Gary Job Corps Center (GJCC) property. A baseball complex is proposed to be built on property adjacent to the GJCC and the city's surface water treatment plant sometime within the next 20 years would also be part of the Gary Service Area. Reclaimed water service to this area would involve construction of almost five miles of an 8-inch diameter pipeline.
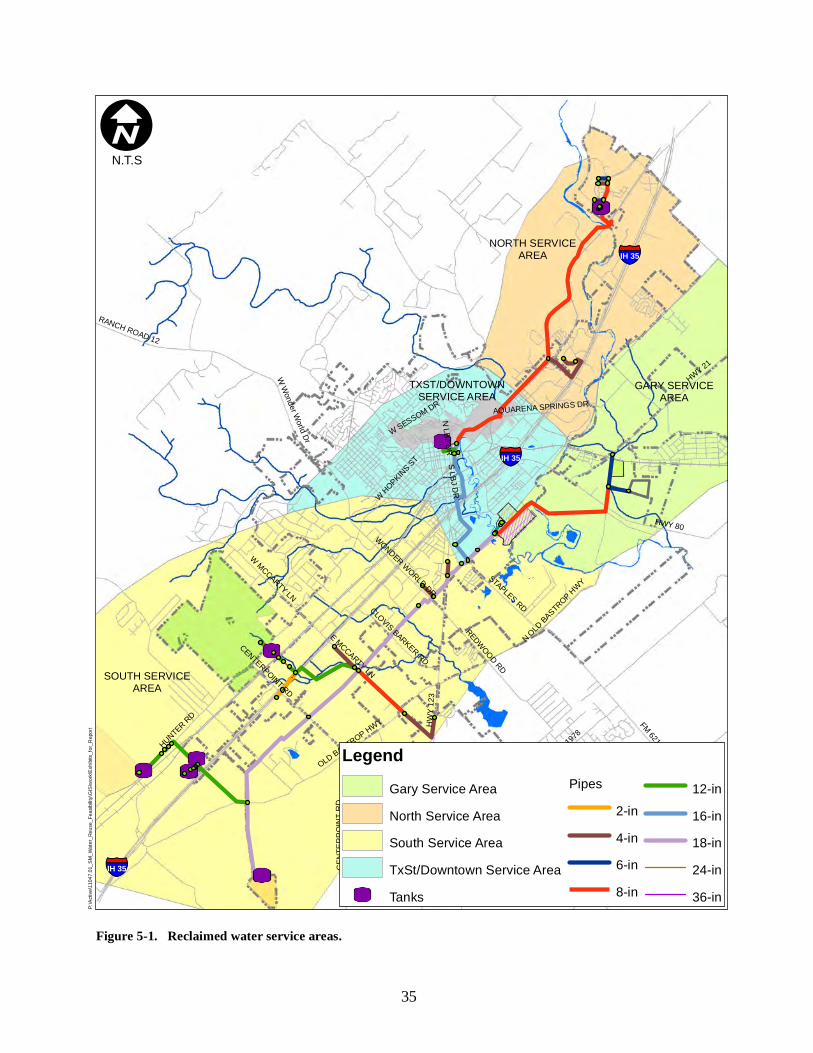
UT
UT
UT
UT
UTUT
UT
HWY 1
23
HWY 80
HWY 21
§̈¦IH 35
§̈¦IH 35
§̈¦IH 35
FM 1978
FM 1979
FM 621HUNTER RD
OLD BASTROP HWY
STAPLES RD
REDWOOD RD
N LBJ DR
RANCH ROAD 12
W Wonder World Dr
E MCCARTY LN
W MCCARTY LN
CENT
ERPO
INT R
D
WONDER WORLD DR
S LBJ DRW HOPKINS ST
CLOVIS BARKER RD
AQUARENA SPRINGS DR
W SESSOM DR
N OLD BASTROP HWY
CENTERPOINT RD
REDWOOD RD
P:\Ac
tive\1
1047
.01_S
M_Wa
ter_R
euse
_Fea
sibility
\GIS
\work
\Exhib
its_fo
r_Rep
ort
GARY SERVICEAREA
SOUTH SERVICEAREA
LegendGary Service AreaNorth Service AreaSouth Service AreaTxSt/Downtown Service Area
UT Tanks
Pipes2-in4-in6-in8-in
12-in16-in18-in24-in36-in
NORTH SERVICEAREA
TXST/DOWNTOWNSERVICE AREA
IN.T.S
Figure 5-1. Reclaimed water service areas.
35
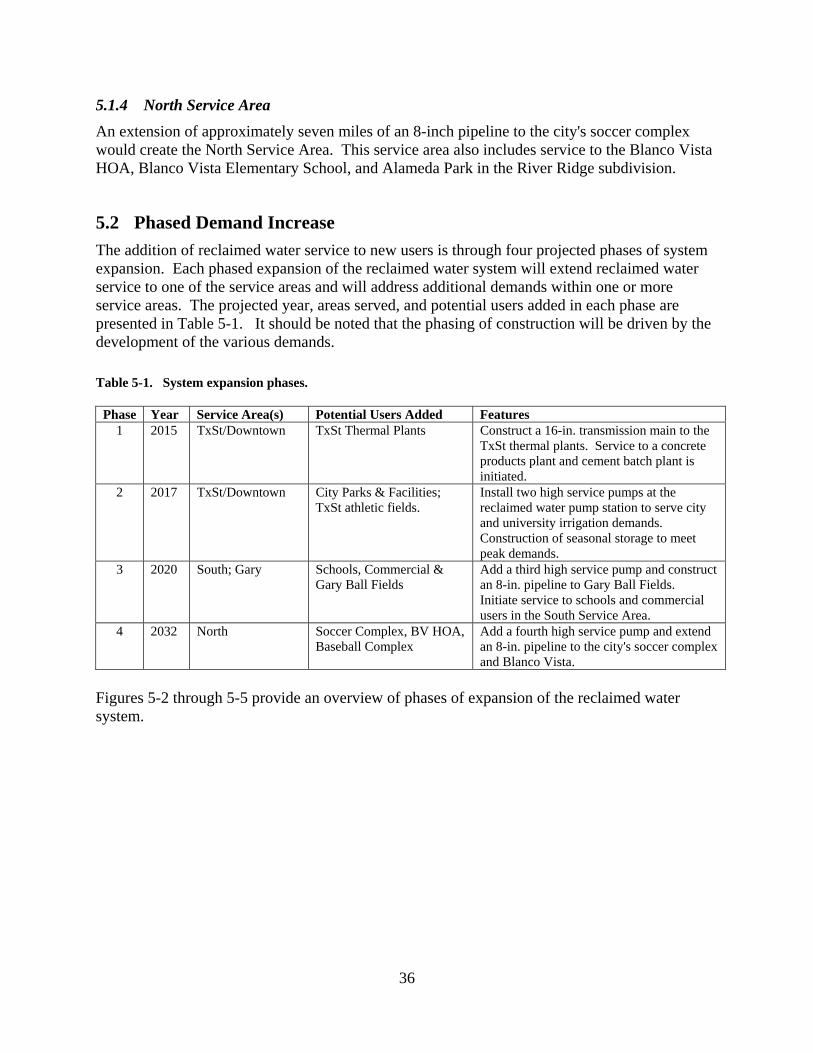
36
5.1.4 North Service Area
An extension of approximately seven miles of an 8-inch pipeline to the city's soccer complex would create the North Service Area. This service area also includes service to the Blanco Vista HOA, Blanco Vista Elementary School, and Alameda Park in the River Ridge subdivision.
5.2 Phased Demand Increase
The addition of reclaimed water service to new users is through four projected phases of system expansion. Each phased expansion of the reclaimed water system will extend reclaimed water service to one of the service areas and will address additional demands within one or more service areas. The projected year, areas served, and potential users added in each phase are presented in Table 5-1. It should be noted that the phasing of construction will be driven by the development of the various demands.
Table 5-1. System expansion phases.
Phase Year Service Area(s) Potential Users Added Features 1 2015 TxSt/Downtown TxSt Thermal Plants Construct a 16-in. transmission main to the
TxSt thermal plants. Service to a concrete products plant and cement batch plant is initiated.
2 2017 TxSt/Downtown City Parks & Facilities; TxSt athletic fields.
Install two high service pumps at the reclaimed water pump station to serve city and university irrigation demands. Construction of seasonal storage to meet peak demands.
3 2020 South; Gary Schools, Commercial & Gary Ball Fields
Add a third high service pump and construct an 8-in. pipeline to Gary Ball Fields. Initiate service to schools and commercial users in the South Service Area.
4 2032 North Soccer Complex, BV HOA, Baseball Complex
Add a fourth high service pump and extend an 8-in. pipeline to the city's soccer complex and Blanco Vista.
Figures 5-2 through 5-5 provide an overview of phases of expansion of the reclaimed water system.
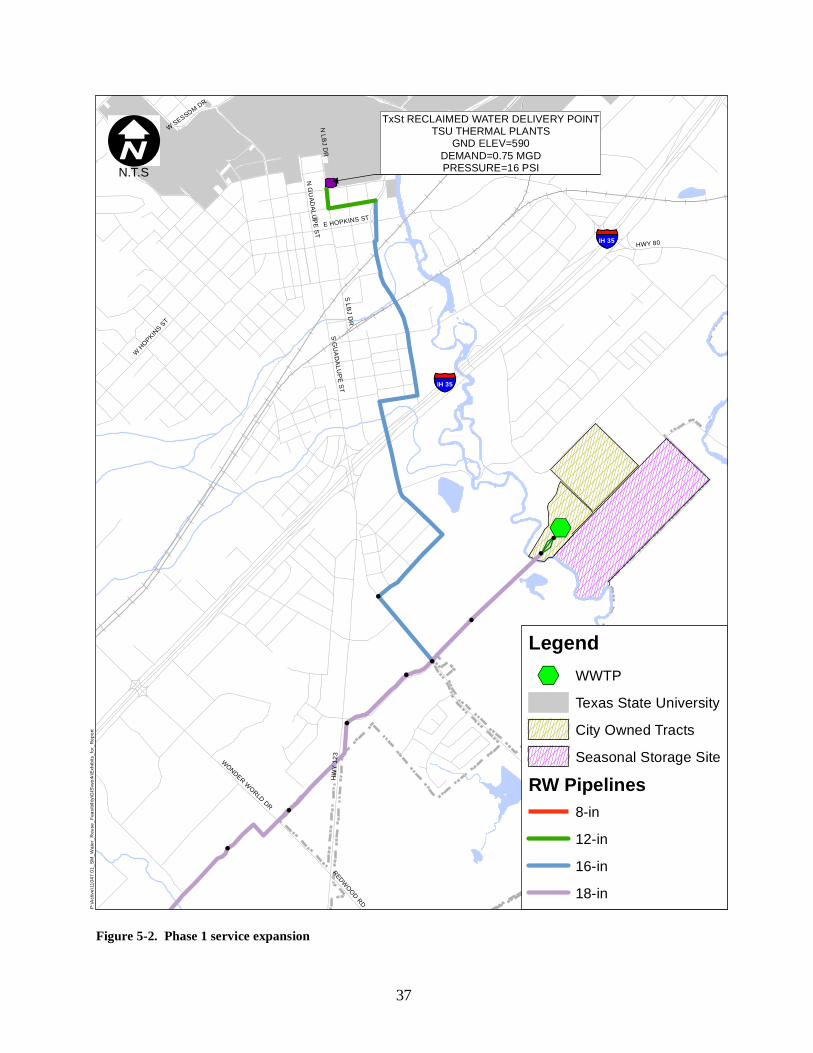
UT
!(
!(
!(
!(
!(
!(
!(
!(
!(
%,
HWY 1
23
HWY 80§̈¦IH 35
§̈¦IH 35
STAPLES RD
S LBJ DR
E HOPKINS ST
W HOPKINS ST
N LBJ DR
WONDER WORLD DR
S GUADALUPE ST
N GUADALUPE ST
W SESSOM DR
REDWOOD RD
P:\A
ctive
\1104
7.01_
SM_W
ater_R
euse
_Fea
sibilit
y\GIS
\work
\Exh
ibits_
for_R
eport
TxSt RECLAIMED WATER DELIVERY POINTTSU THERMAL PLANTS
GND ELEV=590DEMAND=0.75 MGDPRESSURE=16 PSIIN.T.S
Legend%, WWTP
Texas State UniversityCity Owned TractsSeasonal Storage Site
RW Pipelines8-in12-in16-in18-in
Figure 5-2. Phase 1 service expansion
37
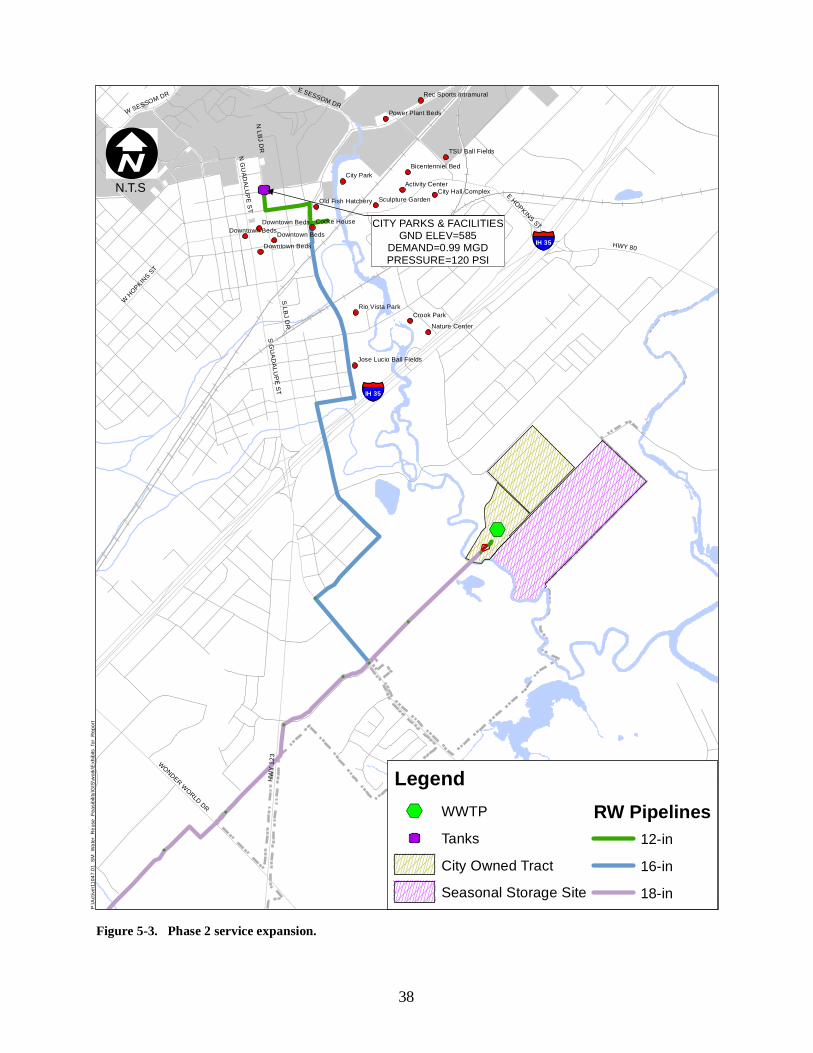
UT
UT
UT
UT
UT
!(
!(
!(
!(
!(
!(
!(
!(
!(
!(!(
%,
City Park
Crook Park
Cocke House
Downtown Beds
Nature Center
Downtown BedsDowntown BedsDowntown Beds
Rio Vista Park
TSU Ball Fields
Activity Center
Power Plant Beds
Sculpture Garden
Bicentenniel Bed
City Hall ComplexOld Fish Hatchery
Rec Sports Intramural
Jose Lucio Ball Fields
HWY 1
23
HWY 80§̈¦IH 35
§̈¦IH 35
STAPLES RD
S LBJ DR
E HOPKINS ST
N LBJ DRS GUADALUPE ST
W HOPKINS ST
WONDER WORLD DR
N GUADALUPE ST
E SESSOM DRW SESSOM DR
P:\Ac
tive\1
1047
.01_S
M_Wa
ter_R
euse
_Fea
sibility
\GIS
\work
\Exh
ibits_
for_R
eport
CITY PARKS & FACILITIESGND ELEV=585
DEMAND=0.99 MGDPRESSURE=120 PSI
IN.T.S
Legend%, WWTPUT Tanks
City Owned TractSeasonal Storage Site
RW Pipelines12-in16-in18-in
Figure 5-3. Phase 2 service expansion.
38
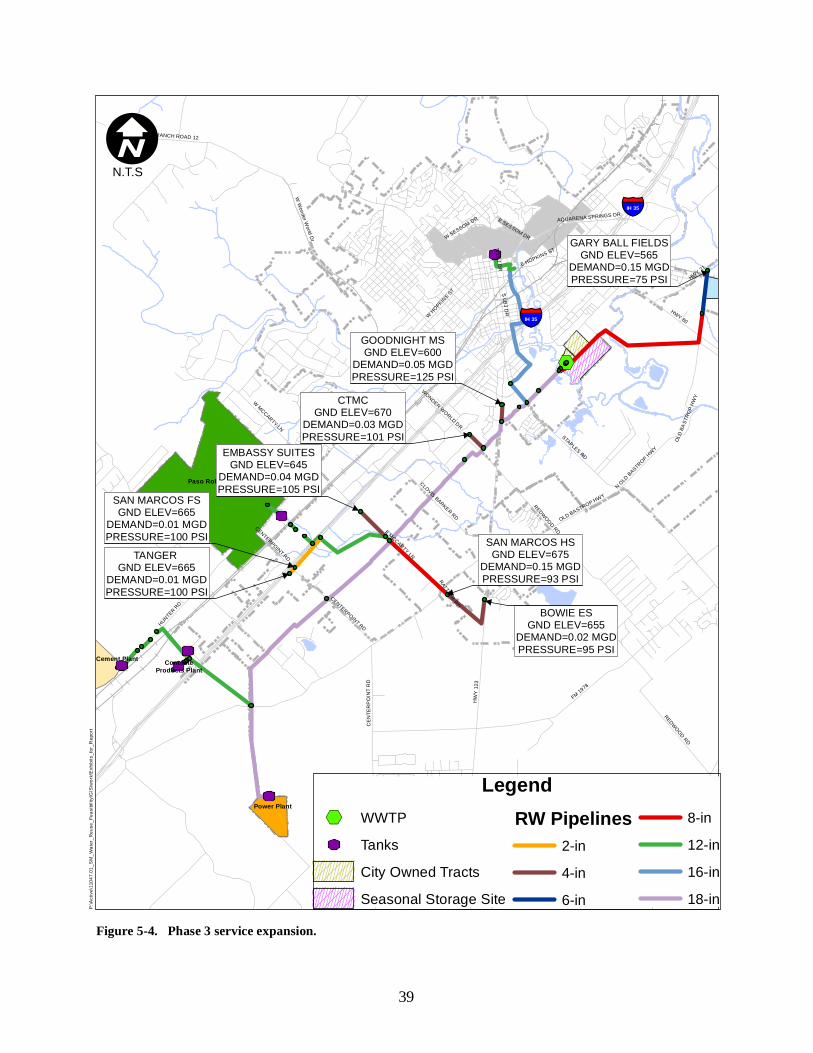
%,
UT
UT
UT
UT
UT
UT
HWY
123
HWY 80
HWY 21
§̈¦IH 35
§̈¦IH 35
FM 1978
FM 1979
HUNTER RD
OLD BASTROP HWY
STAPLES RD
REDWOOD RD
N LBJ DR
CENT
ERPO
INT R
D
W Wonder World Dr
RANCH ROAD 12
E MCCARTY LNW MCCARTY LN
WONDER WORLD DR
S LBJ DR
W HOPKINS ST
E HOPKINS ST
CLOVIS BARKER RD
AQUARENA SPRINGS DR
W SESSOM DR E SESSOM DR
N OLD BASTROP HWY
RATTLER RD
REDWOOD RD
CENTERPOINT RD
OLD B
ASTR
OP HW
Y
CENTERPOINT RD
Paso Robles
Power Plant
Cement Plant ConcreteProducts Plant
P:\A
ctive
\1104
7.01_
SM_W
ater_
Reus
e_Fe
asibi
lity\G
IS\w
ork\E
xhibi
ts_for
_Rep
ort
GARY BALL FIELDSGND ELEV=565
DEMAND=0.15 MGDPRESSURE=75 PSI
GOODNIGHT MSGND ELEV=600
DEMAND=0.05 MGDPRESSURE=125 PSI
CTMCGND ELEV=670
DEMAND=0.03 MGDPRESSURE=101 PSI
EMBASSY SUITESGND ELEV=645
DEMAND=0.04 MGDPRESSURE=105 PSI
BOWIE ESGND ELEV=655
DEMAND=0.02 MGDPRESSURE=95 PSI
SAN MARCOS HSGND ELEV=675
DEMAND=0.15 MGDPRESSURE=93 PSI
IN.T.S
Legend%, WWTPUT Tanks
City Owned TractsSeasonal Storage Site
RW Pipelines2-in4-in6-in
8-in12-in16-in18-in
TANGER GND ELEV=665
DEMAND=0.01 MGDPRESSURE=100 PSI
SAN MARCOS FSGND ELEV=665
DEMAND=0.01 MGDPRESSURE=100 PSI
Figure 5-4. Phase 3 service expansion.
39
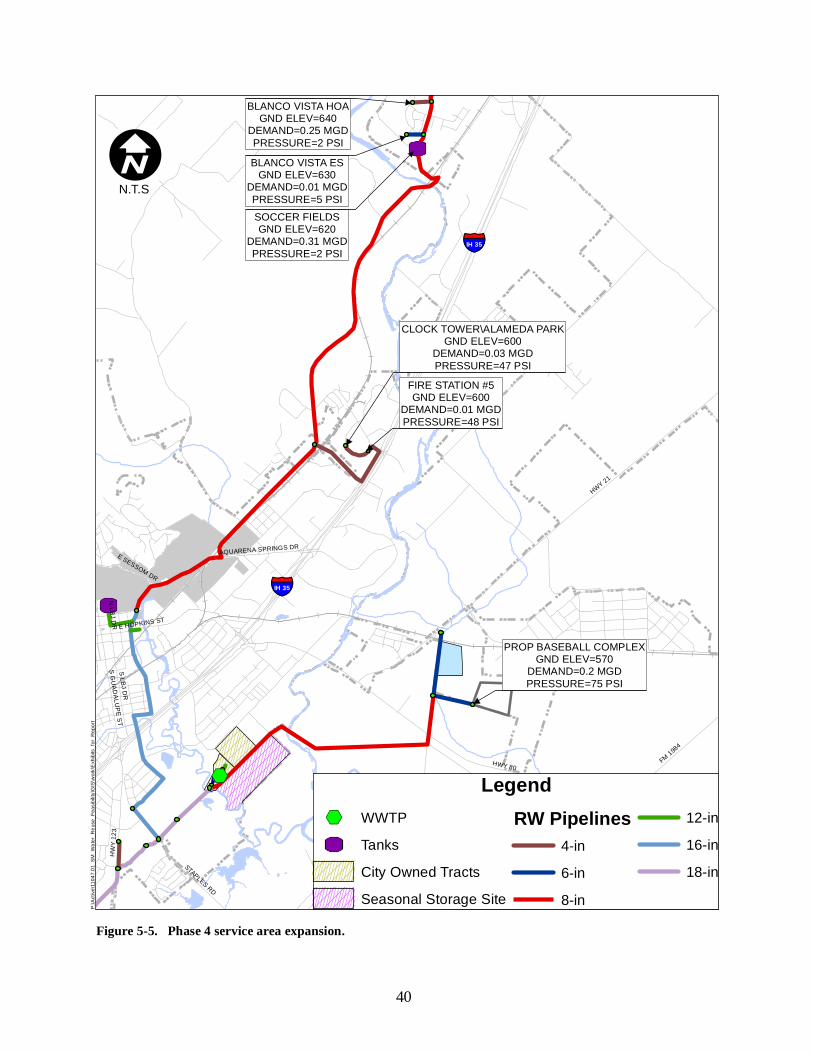
UT
UT
%,
HWY 21
HWY 80
HWY 1
23
§̈¦IH 35
§̈¦IH 35
FM 1984
STAPLES RD
N LBJ DRS LBJ DR
E HOPKINS ST
AQUARENA SPRINGS DR
S GUADALUPE ST
OLD
BAST
ROP H
WY
E SESSOM DR
P:\Ac
tive\1
1047
.01_S
M_Wa
ter_R
euse
_Fea
sibility
\GIS
\work
\Exh
ibits_
for_R
eport
FIRE STATION #5GND ELEV=600
DEMAND=0.01 MGDPRESSURE=48 PSI
CLOCK TOWER\ALAMEDA PARKGND ELEV=600
DEMAND=0.03 MGDPRESSURE=47 PSI
BLANCO VISTA HOAGND ELEV=640
DEMAND=0.25 MGDPRESSURE=2 PSIBLANCO VISTA ES
GND ELEV=630DEMAND=0.01 MGDPRESSURE=5 PSI
PROP BASEBALL COMPLEXGND ELEV=570
DEMAND=0.2 MGDPRESSURE=75 PSI
SOCCER FIELDSGND ELEV=620
DEMAND=0.31 MGDPRESSURE=2 PSI
IN.T.S
Legend%, WWTPUT Tanks
City Owned TractsSeasonal Storage Site
RW Pipelines4-in6-in8-in
12-in16-in18-in
Figure 5-5. Phase 4 service area expansion.
40
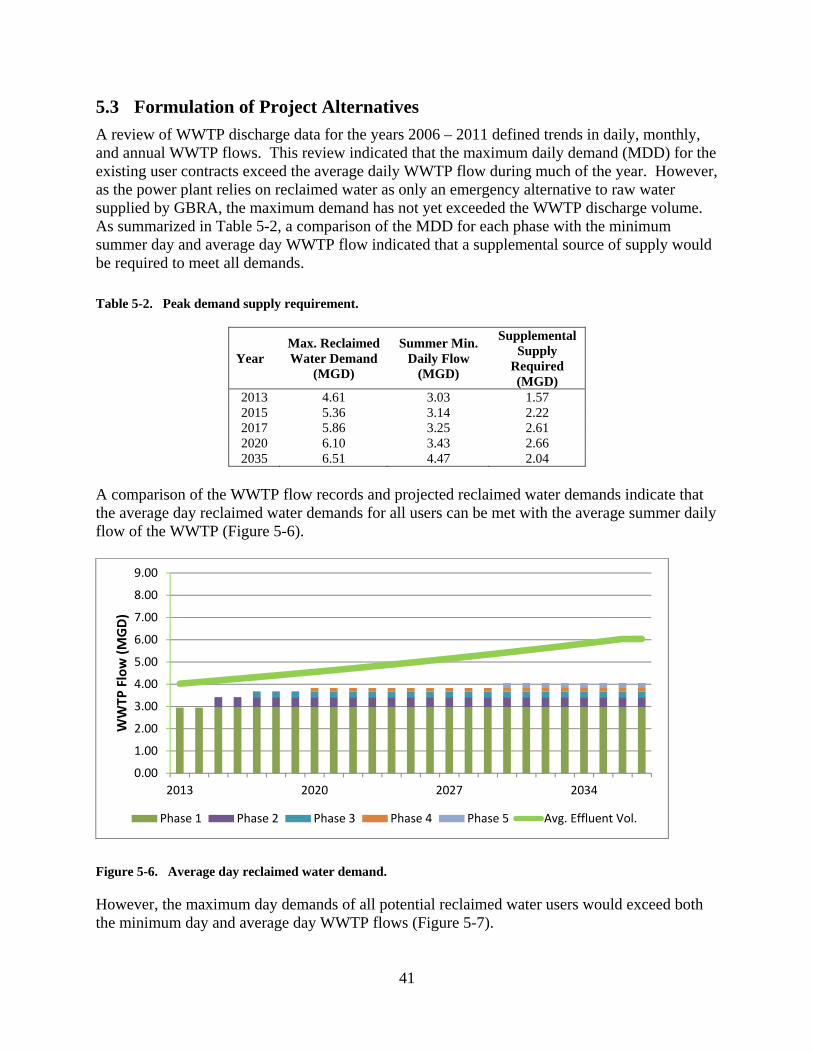
41
5.3 Formulation of Project Alternatives
A review of WWTP discharge data for the years 2006 – 2011 defined trends in daily, monthly, and annual WWTP flows. This review indicated that the maximum daily demand (MDD) for the existing user contracts exceed the average daily WWTP flow during much of the year. However, as the power plant relies on reclaimed water as only an emergency alternative to raw water supplied by GBRA, the maximum demand has not yet exceeded the WWTP discharge volume. As summarized in Table 5-2, a comparison of the MDD for each phase with the minimum summer day and average day WWTP flow indicated that a supplemental source of supply would be required to meet all demands.
Table 5-2. Peak demand supply requirement.
Year Max. Reclaimed Water Demand
(MGD)
Summer Min. Daily Flow
(MGD)
Supplemental Supply
Required (MGD)
2013 4.61 3.03 1.57 2015 5.36 3.14 2.22 2017 5.86 3.25 2.61 2020 6.10 3.43 2.66 2035 6.51 4.47 2.04
A comparison of the WWTP flow records and projected reclaimed water demands indicate that the average day reclaimed water demands for all users can be met with the average summer daily flow of the WWTP (Figure 5-6).
Figure 5-6. Average day reclaimed water demand.
However, the maximum day demands of all potential reclaimed water users would exceed both the minimum day and average day WWTP flows (Figure 5-7).
0.00
1.00
2.00
3.00
4.00
5.00
6.00
7.00
8.00
9.00
2013 2020 2027 2034
WWTP
Flow (MGD)
Phase 1 Phase 2 Phase 3 Phase 4 Phase 5 Avg. Effluent Vol.
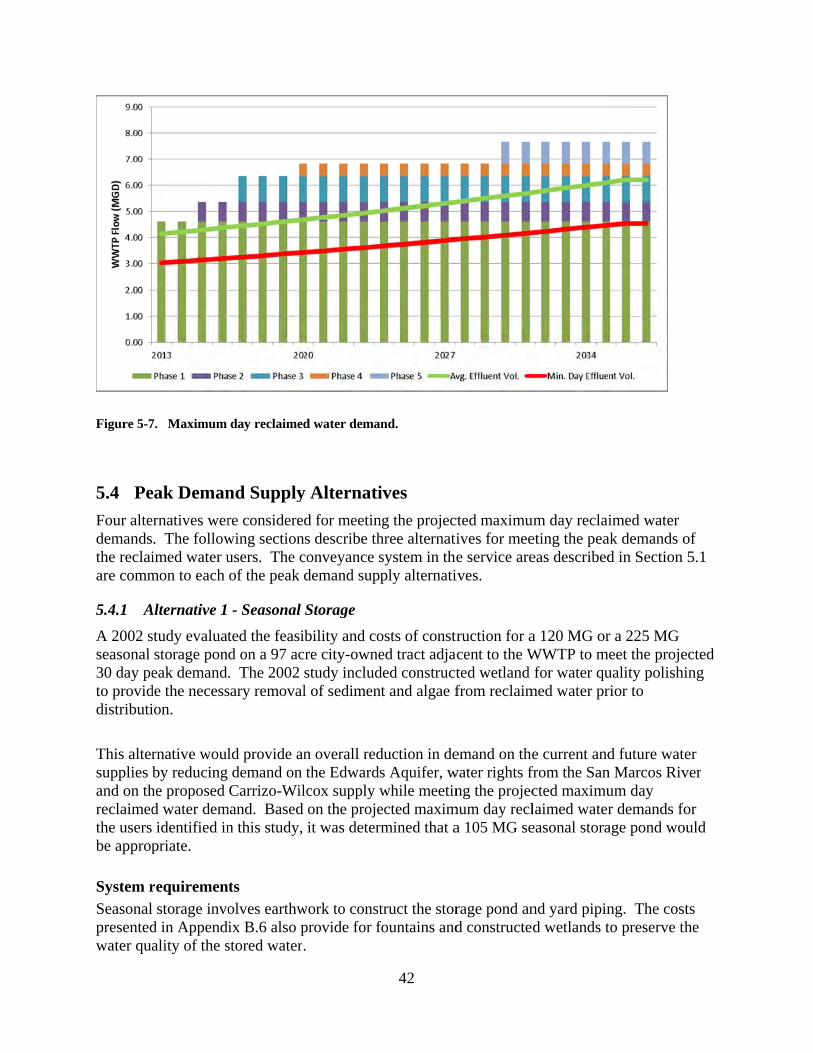
Figure 5-7
5.4 Pe
Four altedemandsthe reclaiare comm
5.4.1 A
A 2002 sseasonal 30 day peto providdistributi
This altersupplies and on threclaimedthe usersbe approp
System r
Seasonalpresentedwater qua
7. Maximum
eak Deman
ernatives wer. The followimed water umon to each
Alternative 1
study evaluatstorage poneak demand
de the necession.
rnative woulby reducing
he proposed d water dem identified inpriate.
requiremen
l storage invod in Appendality of the s
day reclaimed
nd Supply
re consideredwing sectionusers. The cof the peak d
- Seasonal
ted the feasid on a 97 ac. The 2002 sary removal
ld provide andemand on Carrizo-Wil
mand. Based n this study,
ts
olves earthwix B.6 also pstored water.
d water dema
y Alternati
d for meetins describe th
conveyance sdemand supp
Storage
bility and cocre city-ownestudy includl of sedimen
n overall redthe Edwards
lcox supply won the projeit was deter
work to constprovide for f.
42
nd.
ives
ng the projechree alternatisystem in theply alternati
osts of constred tract adjacded constructnt and algae f
duction in des Aquifer, wwhile meetinected maximrmined that a
truct the storfountains and
cted maximuives for meee service areives.
truction for acent to the Wted wetland from reclaim
emand on thewater rights fng the projec
mum day recla 105 MG se
rage pond and constructe
um day reclaieting the peaeas described
a 120 MG orWWTP to mfor water qu
med water pr
e current andfrom the Sancted maximulaimed watereasonal stora
nd yard pipind wetlands t
imed water ak demands od in Section
r a 225 MG meet the proje
uality polishirior to
d future watn Marcos Rivum day r demands foage pond wo
ng. The costo preserve th
of 5.1
ected ing
er ver
for ould
ts he
43
Effect on existing water supplies
With the combined city and university potable supply sources being approximately 76.8% surface water from Canyon Lake and 23.2% groundwater from the Edwards Aquifer, Alternative 1 could provide 1,504AF of reclaimed water as an offset to the Edwards Aquifer and Canyon Lake water supplies. As a potable water offset, this would reduce the need to withdraw 1,155 AF from Canyon Lake and 349 AF from the Edwards Aquifer. For the projected water demand that is not presently receiving potable water, an additional 372 AF from the HCPUA would be offset by using reclaimed water. As a potable offset, Alternative 1 extends the city's Canyon Lake supply and both the city and university's Edwards Aquifer supply and increases the availability of the HCPUA supply for the service area.
5.4.2 Alternative 2 - Raw Water Supply Supplement
The city purchases stored water from GBRA that is treated at the city's Surface Water Treatment Plant. Under the terms of the 'take or pay' contract, the city bears the cost of the full contract volume of stored water whether used or not. Using this alternative, a portion of the city's stored water purchased from the GBRA would be used to meet the peak demands of the reclaimed water users until the minimum daily flow of the WWTP is sufficient to meet all demands. To avoid interconnection of the raw and reclaimed water systems, raw water would be delivered to a ground storage tank located near the power plant and then pumped to the reclaimed water pipeline. Meeting the maximum-day demand in this fashion has a significant drawback in that the raw water delivery infrastructure would be used infrequently.
System requirements
Alternative 2 includes a ground storage tank and pump station to receive raw water to be pumped to the reclaimed water system during peak demand periods. The facilities and costs associated with this alternative are presented in Appendix B.7.
Effect on existing water supplies
Alternative 2 will provide a reduction in demand on current and future water supplies by minimizing demand on the Edwards Aquifer and on the proposed Carrizo-Wilcox supply while meeting the projected maximum day reclaimed water demand. The reclaimed water peak demands can be met using the Canyon Lake supply within the city's existing stored water contract. As the service area population increases and water supplies are converted to wastewater flow, the supply of reclaimed water will increase, offsetting the use of raw water for meeting peak demands. While most peak demands could be met using reclaimed water supplemented with raw water, the overall reliability of the raw water supply should be carefully considered as it relates to the demands of the power plant. The power plant operates during periods of peak electrical demand when flow to the WWTP can be at its lowest. The power plant maintains a primary supply of cooling water using the same GBRA raw water pipeline that supplies the city's water treatment plant. The reclaimed water supply contract provides an emergency supply alternative for the power plant that has been used during interruptions in the operation of the raw water pipeline.
44
The proposed infrastructure to use the raw water pipeline as a peak demand supply alternative would support most user demands, but the combination of the 1.25 MG ground storage tank and the 2.2 MG storage capacity at the power plant would limit the ability of the power plant to remain in operation during a prolonged interruption of the raw water supply. The value of the raw water supply would require further analysis using an assessment of risk to the power plant and raw water supply developed in conjunction with seasonal storage or supplement using water rights in the San Marcos River.
5.4.3 Alternative 3 - Water Rights Supplement
The university's water rights at Spring Lake and Sewell Park total 1,207 AF for municipal, irrigation, and industrial uses. The right to 513 AF (167 MG) for municipal use has not been exercised and no diversion point has been established (HCP, 2012, p. 5-34). As part of the Habitat Conservation Plan for the EARIP, the university has committed to reducing the total rate of surface water diversion of municipal water rights at the headwaters of the San Marcos River (HCP, 2012, p. 5-33). By establishing the point of diversion for the university's municipal water rights at the WWTP, the supply of water to the critical habitat would be further enhanced and it could be demonstrated that the reduced diversions committed to in the HCP could be avoided without adversely affecting the San Marcos River critical habitat. By locating a diversion point at the WWTP, municipal water rights owned by the university could be incorporated into the reclaimed water system and used to offset peak demands in the reclaimed water system. The need for supplemental supply during periods of maximum demand and minimum WWTP flow ranges from 1.57 MGD (2013) to 3.40 MGD (2020). However, the current maximum diversion rate of 1,000 gpm would limit the supplemental supply to 1.44 MGD if only the municipal water rights were diverted to an intake at the WWTP. Diversion of the university's industrial water rights to the WWTP at the current diversion rate of 600 gpm would provide an additional 0.864 MGD. This supplement of 2.3 MGD would be sufficient to meet the projected peak demand occurring during periods of minimum WWTP flows through the year 2016. Storage would be required as part of this alternative due to the limited diversion rate of 600 gpm. A 35 MG seasonal storage pond located on the adjacent 97 acre tract would be sufficient to meet the maximum day reclaimed water demands. This alternative includes certain assumptions:
An agreement could be developed that would permit the use of the university's municipal water rights.
The diversion point for the municipal water rights would be established at the WWTP.
The university's agreement under the HCP to limit municipal water rights diversions would not apply to diversions downstream of the critical habitat.
System requirements
It should be noted that this alternative alone would not meet the entire projected maximum day reclaimed water demand, but could be used to reduce the scope of Alternative 1 or Alternative 2. For Alternative 2, for example, supplementing the reclaimed water supply using both the university's industrial and municipal water rights during peak demand periods would reduce the
45
capacity of the seasonal storage pond from 105 MG to 35 MG. The infrastructure requirements for the 35 MG seasonal storage pond are detailed in Appendix B.8 and the raw water intake on the San Marcos River is detailed in in Appendix B.9.
Effect on existing water supplies
Alternative 3 will benefit the city and the university by making full use of the university's existing municipal water right without reduction while still preserving springflows through the critical habitat area of the San Marcos River. This alternative would also reduce the university's reliance on water from the Edwards Aquifer by supplying the makeup water demand for the thermal plants with reclaimed water instead of water from the Jackson Well.
5.4.4 Alternative 4 - No Action Alternative
The "no action alternative" assumes no expansion of the reclaimed water system with only a continuation of service under existing contracts. With "no action," the TxSt thermal plants would continue to rely on the Edwards Aquifer or the San Marcos River for a supply of makeup water. The city's parks would continue with no irrigation except using potable water for limited areas needed to preserve structural foundations and vegetative barriers along the river would not be irrigated during drought periods. Other irrigated locations, including the university's athletic fields, would continue to rely on the Edwards Aquifer, Canyon Lake, and the proposed Carrizo-Wilcox supplies.
Industrial users
Without an expansion of the reclaimed water system, supply for industrial use would be limited during peak demand periods. Current contracts for reclaimed water provide a commitment to the power plant, but supply other users only on the basis of available supply. Other than the power plant, current and potential industrial users have access to potable water supplies to meet peak demands during periods of limited supply. Of the total 1,616 AF of projected average annual demand for industrial users, 204 AF is attributable to the power plant's contract for reclaimed water as an alternative water supply. Another 220 AF in average annual demand for the proposed Paso Robles golf course is under contract, but there is to date no construction of the facility. The remaining 1,192 AF is industrial demand that is met using water supplied by the Edwards Aquifer, Canyon Lake, or San Marcos River. Since the infrastructure for supplying the average and peak demands is already in place, capital costs associated with the No-Action alternative would be the opportunity costs associated with system expansion for future potable water customers. The result of the evaluation process was that two alternatives were carried forward for further feasibility analysis:
Alternative 1 - Seasonal Storage
Alternative 3 - Water Rights Supplement
Alternative 2 - Raw Water Supplement was not evaluated further as the reliance on raw water from the GBRA raw water pipeline to meet the projected maximum day reclaimed water demand
46
would not provide a reliable alternative supply to the power plant in the event of a service interruption of that pipeline occurring during peak reclaimed water demand periods.
5.5 Development of Project Costs
Preliminary opinions of probable project costs were developed using cost data provided by equipment suppliers and recent project bid tabulations for utility construction. Current 2013 year costs are used for all phases of construction. Sizes of pumps and distribution piping were developed through a computer model of the proposed system using H2OMap Water® software.
5.5.1 Opinions of Probable Project Costs
The assumptions used in developing the probable project costs for expansion of the reclaimed water system begin with assumed year for each phase of development. However, the timing of construction, and components of the system will likely be modified and refined as the system is being built over the approximately 20-year planning period. Factors that can impact the design and timing of expansion of the actual reclaimed water system include actual utilization of the reclaimed system, identification of additional potential users, removal of identified potential users, changes in projected demands, effects of possible climate and regulatory changes, and city and university budgeting. Capital costs are based on 2012 and 2013 construction prices, with no attempt to predict future price levels. The probable costs include allowances of 30 percent for contingencies and 15 percent for engineering and survey costs. The costs include an allowance for land and right-of-way acquisition when appropriate, but assume all other construction will take place on city property or within existing rights-of-way. All of the cost opinions are subject to refinement during final design and build-out of the system. As exact routes are determined for individual pipelines, the cost projections can be adjusted to reflect actual conditions. Operation and Maintenance costs (O&M) are comprised of the following items:
Purchased power (pumping costs): The majority of purchased power will be used to pump the reclaimed water. Average flow pumping is used to determine the power consumption. The costs are based on an average of $0.10 per kilowatt-hour.
Disinfection: Disinfection costs include the addition of chlorine for the average annual volume of reclaimed water.
Maintenance of the pumping and distribution systems: The average annual maintenance expense is estimated as 1.5% of the construction costs.
Details of the opinions of probable project costs are included in Appendix B.
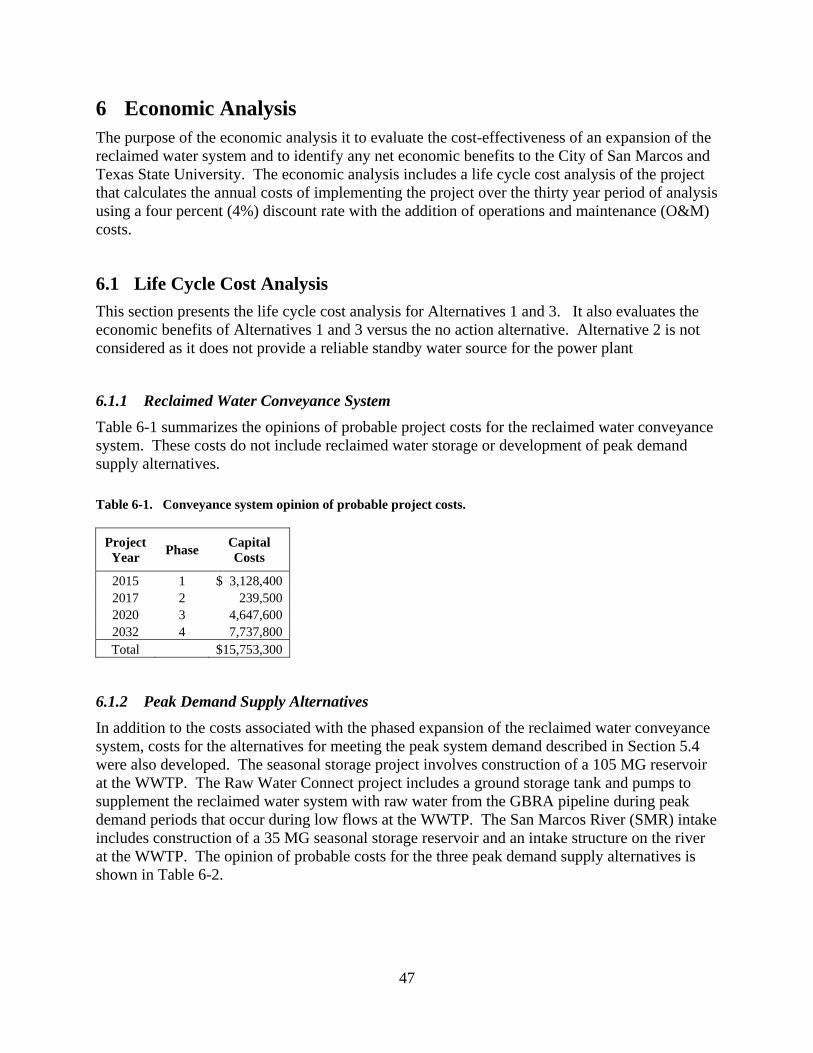
47
6 Economic Analysis The purpose of the economic analysis it to evaluate the cost-effectiveness of an expansion of the reclaimed water system and to identify any net economic benefits to the City of San Marcos and Texas State University. The economic analysis includes a life cycle cost analysis of the project that calculates the annual costs of implementing the project over the thirty year period of analysis using a four percent (4%) discount rate with the addition of operations and maintenance (O&M) costs.
6.1 Life Cycle Cost Analysis
This section presents the life cycle cost analysis for Alternatives 1 and 3. It also evaluates the economic benefits of Alternatives 1 and 3 versus the no action alternative. Alternative 2 is not considered as it does not provide a reliable standby water source for the power plant
6.1.1 Reclaimed Water Conveyance System
Table 6-1 summarizes the opinions of probable project costs for the reclaimed water conveyance system. These costs do not include reclaimed water storage or development of peak demand supply alternatives.
Table 6-1. Conveyance system opinion of probable project costs.
Project Year
Phase Capital Costs
2015 1 $ 3,128,400 2017 2 239,500 2020 3 4,647,600 2032 4 7,737,800 Total $15,753,300
6.1.2 Peak Demand Supply Alternatives
In addition to the costs associated with the phased expansion of the reclaimed water conveyance system, costs for the alternatives for meeting the peak system demand described in Section 5.4 were also developed. The seasonal storage project involves construction of a 105 MG reservoir at the WWTP. The Raw Water Connect project includes a ground storage tank and pumps to supplement the reclaimed water system with raw water from the GBRA pipeline during peak demand periods that occur during low flows at the WWTP. The San Marcos River (SMR) intake includes construction of a 35 MG seasonal storage reservoir and an intake structure on the river at the WWTP. The opinion of probable costs for the three peak demand supply alternatives is shown in Table 6-2.
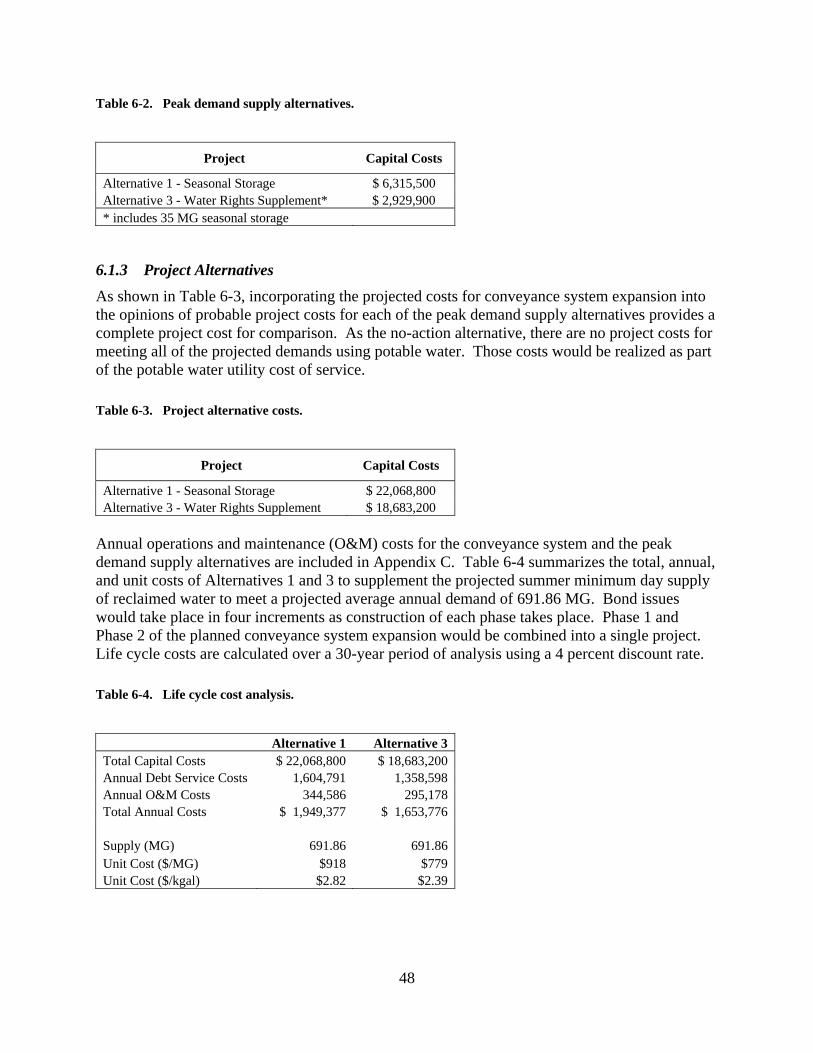
48
Table 6-2. Peak demand supply alternatives.
Project Capital Costs
Alternative 1 - Seasonal Storage $ 6,315,500 Alternative 3 - Water Rights Supplement* $ 2,929,900 * includes 35 MG seasonal storage
6.1.3 Project Alternatives
As shown in Table 6-3, incorporating the projected costs for conveyance system expansion into the opinions of probable project costs for each of the peak demand supply alternatives provides a complete project cost for comparison. As the no-action alternative, there are no project costs for meeting all of the projected demands using potable water. Those costs would be realized as part of the potable water utility cost of service.
Table 6-3. Project alternative costs.
Project Capital Costs
Alternative 1 - Seasonal Storage $ 22,068,800 Alternative 3 - Water Rights Supplement $ 18,683,200
Annual operations and maintenance (O&M) costs for the conveyance system and the peak demand supply alternatives are included in Appendix C. Table 6-4 summarizes the total, annual, and unit costs of Alternatives 1 and 3 to supplement the projected summer minimum day supply of reclaimed water to meet a projected average annual demand of 691.86 MG. Bond issues would take place in four increments as construction of each phase takes place. Phase 1 and Phase 2 of the planned conveyance system expansion would be combined into a single project. Life cycle costs are calculated over a 30-year period of analysis using a 4 percent discount rate.
Table 6-4. Life cycle cost analysis.
Alternative 1 Alternative 3 Total Capital Costs $ 22,068,800 $ 18,683,200 Annual Debt Service Costs 1,604,791 1,358,598 Annual O&M Costs 344,586 295,178 Total Annual Costs $ 1,949,377 $ 1,653,776
Supply (MG) 691.86 691.86 Unit Cost ($/MG) $918 $779 Unit Cost ($/kgal) $2.82 $2.39
49
6.2 Reclaimed Water Cost Comparison
This analysis compares the costs of three reclaimed water project alternatives with the costs of supplying water from existing water supplies. The primary value of reclaimed water lies in the ability to postpone and minimize costs associated with expansion of supply, particularly, in the case of San Marcos, the costs of importing water from the Carrizo-Wilcox Aquifer. For this reason, the price of reclaimed water should be compared to the marginal cost of expanding capacity instead of the current average cost of existing water supplies. In this case, the marginal cost of water will be the cost of adding water from the HCPUA at approximately $1,245 per AF. Table 6-5 presents a comparison of the projected cost of water from the Carrizo-Wilcox Aquifer as the marginal cost of the city's water supply with each of the three reclaimed water alternatives.
Table 6-5. Reclaimed water cost comparison.
Project Capital Costs Unit Cost
($/AF) Unit Cost ($/kgal)
Alternative 1 - Seasonal Storage $ 22,068,800 $ 918 $ 2.82 Alternative 3 - Water Rights Supplement 18,683,200 779 2.39 Alternative 4 - No Action -- 1,245 3.82
6.3 Economic Analysis
The water supply benefits of expanding the reclaimed water system would be realized through the provision of water for industrial use and for landscape irrigation, thereby reducing demand on existing and future water supplies. Expanding the reclaimed water system will also provide environmental benefits by enhancing the critical habitat of the Edwards Aquifer and San Marcos River by reducing withdrawals and providing a drought resistant water supply for irrigation of vegetative barriers along the river. Water supply benefits are measured by comparing the project costs shown in Table 6-5 above with the costs of a feasible non-reuse project that would provide similar water supplies to the potential reclaimed water users. If the costs of the reclaimed water system expansion are less than the non-reuse water supply, the project would be considered to be cost-effective and provide a net economic water supply benefit to the region. The use of alternative costs to calculate water supply benefits is an accepted method for evaluating federally developed water supplies. The economic analysis estimates benefits of expanding the reclaimed water system relative to future conditions without such a project. It is expected that the project would yield direct benefits to sustaining San Marcos River flows needed for maintaining critical aquatic habitat, as well as additional benefits to municipal water supplies.
6.3.1 Overview of Economic Benefits
There are a number of benefits related to the use of reclaimed water which may accrue to different entities and stakeholders in the community that can be either difficult to quantify or
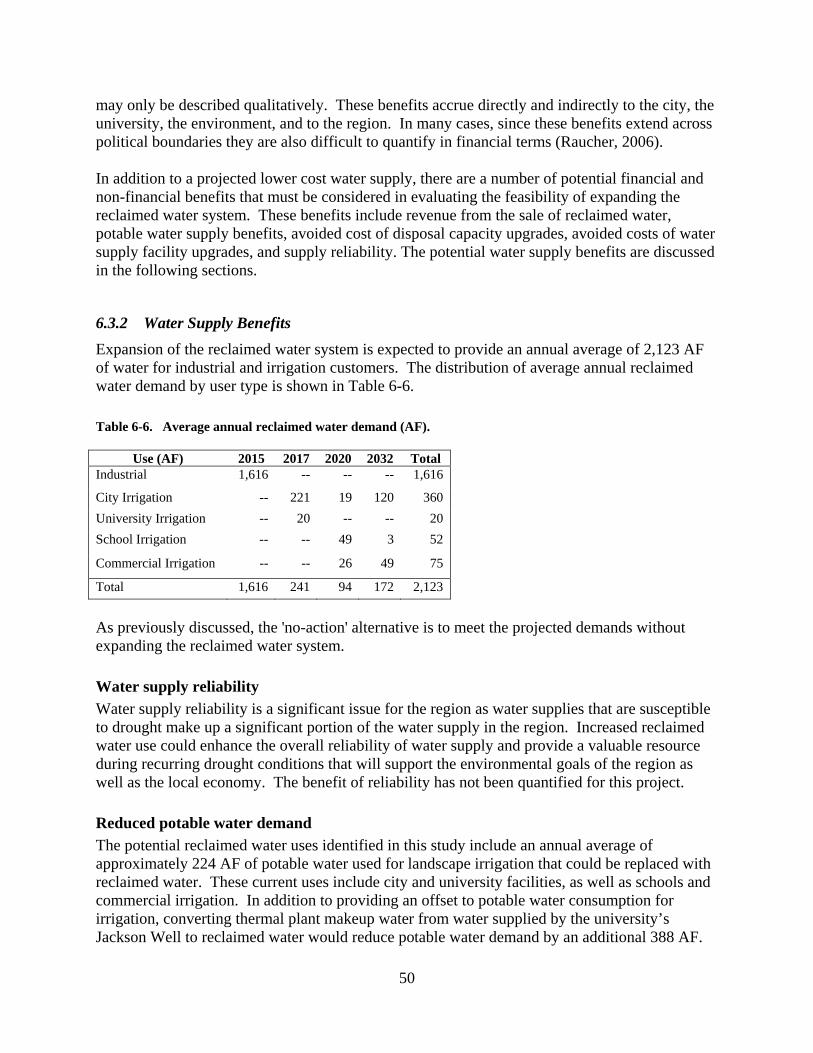
50
may only be described qualitatively. These benefits accrue directly and indirectly to the city, the university, the environment, and to the region. In many cases, since these benefits extend across political boundaries they are also difficult to quantify in financial terms (Raucher, 2006). In addition to a projected lower cost water supply, there are a number of potential financial and non-financial benefits that must be considered in evaluating the feasibility of expanding the reclaimed water system. These benefits include revenue from the sale of reclaimed water, potable water supply benefits, avoided cost of disposal capacity upgrades, avoided costs of water supply facility upgrades, and supply reliability. The potential water supply benefits are discussed in the following sections.
6.3.2 Water Supply Benefits
Expansion of the reclaimed water system is expected to provide an annual average of 2,123 AF of water for industrial and irrigation customers. The distribution of average annual reclaimed water demand by user type is shown in Table 6-6.
Table 6-6. Average annual reclaimed water demand (AF).
Use (AF) 2015 2017 2020 2032 Total Industrial 1,616 -- -- -- 1,616
City Irrigation -- 221 19 120 360
University Irrigation -- 20 -- -- 20
School Irrigation -- -- 49 3 52
Commercial Irrigation -- -- 26 49 75
Total 1,616 241 94 172 2,123
As previously discussed, the 'no-action' alternative is to meet the projected demands without expanding the reclaimed water system.
Water supply reliability
Water supply reliability is a significant issue for the region as water supplies that are susceptible to drought make up a significant portion of the water supply in the region. Increased reclaimed water use could enhance the overall reliability of water supply and provide a valuable resource during recurring drought conditions that will support the environmental goals of the region as well as the local economy. The benefit of reliability has not been quantified for this project.
Reduced potable water demand
The potential reclaimed water uses identified in this study include an annual average of approximately 224 AF of potable water used for landscape irrigation that could be replaced with reclaimed water. These current uses include city and university facilities, as well as schools and commercial irrigation. In addition to providing an offset to potable water consumption for irrigation, converting thermal plant makeup water from water supplied by the university’s Jackson Well to reclaimed water would reduce potable water demand by an additional 388 AF.
51
Water demand in the City of San Marcos' service area is expected to increase by an average of approximately 378 AF per year between 2013 and 2035. Reclaimed water service within the city’s service area could minimize the use of higher quality water supplies, particularly the more expensive HCPUA supply, leaving the higher quality supplies for the potable water demands of a growing community. Realization of the financial benefit associated with conserving potable water comes when new residential or business development is supported by the potable water supply that is made available by substituting reclaimed water for uses that would otherwise require water from the potable water sources of supply.
Avoided cost of future water supply
Presently, the city and university have water supplies available to meet projected demands. However, as growth continues, water supplies will continue to become more expensive. In addition to the Carrizo-Wilcox Aquifer supply, other utilities in the region are exploring even more costly water supply options (e.g. brackish water desalination and purchase of distant groundwater rights). This benefit could be quantified by evaluating the future water supply projects that may be needed to meet demand. An estimated value of this benefit has not been quantified to date.
6.3.3 Environmental Benefits
Environmental enhancement
The Habitat Conservation Plan (Recon, 2012) has identified minimizing withdrawals from the Edwards Aquifer and the San Marcos River as essential to the survival of the endangered species that rely on both the aquifer and the river. Sustaining San Marcos Spring flows depends on the efforts of users to identify alternative sources of water supply. Significant levels of reclaimed water use may reduce withdrawals from both the aquifer and from the San Marcos River. Expansion of the reclaimed water system can reduce the demand for river water needed for the university’s thermal plant makeup water. Making reclaimed water available to the university would reduce demand for San Marcos River water and benefit the areas of critical habitat by allowing increased river flows through the areas of critical habitat. TxSt has committed to reduce withdrawals from the San Marcos River as spring flow at the San Marcos Springs declines. Making reclaimed water available to the university will reduce demand for San Marco River water and benefit the areas of critical habitat by allowing increased river flows through the areas of critical habitat. Reclaimed water could also be used to support the riparian and aquatic habitat along the San Marcos River by providing water for irrigation of vegetative buffers in city parks along the river identified in the USACE Section 206 Aquatic Ecosystem Restoration Project. An estimated value of environmental restoration has not been quantified to date.
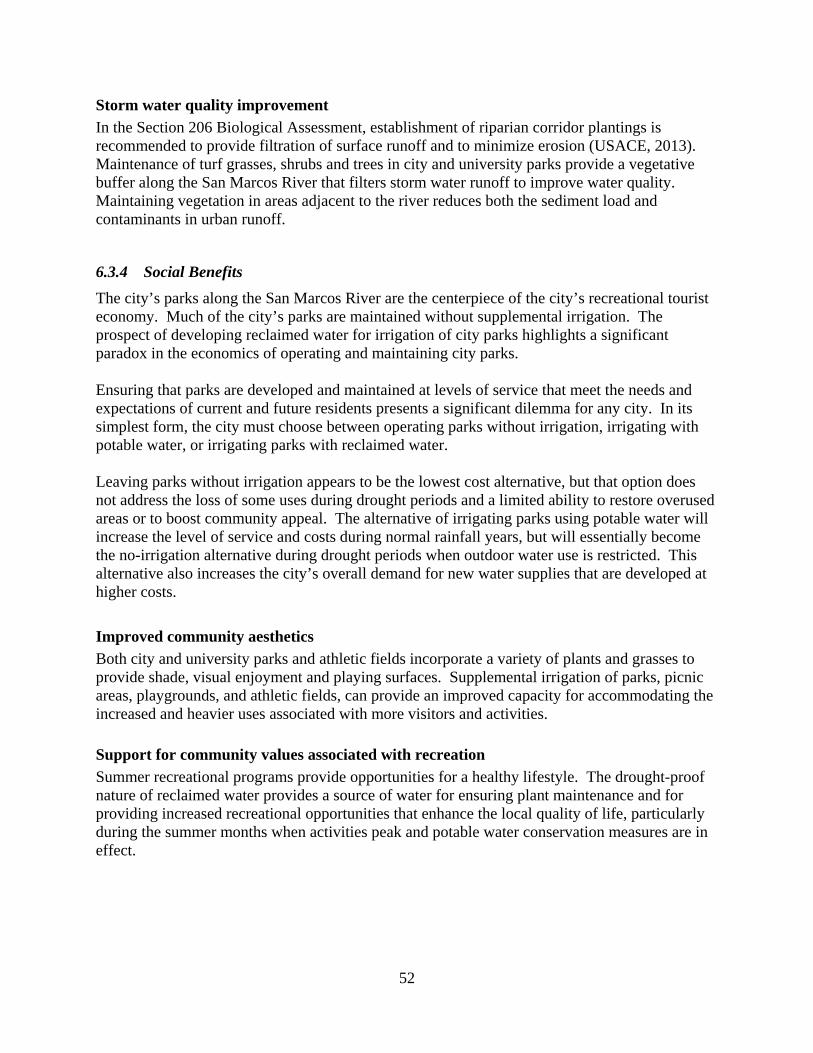
52
Storm water quality improvement
In the Section 206 Biological Assessment, establishment of riparian corridor plantings is recommended to provide filtration of surface runoff and to minimize erosion (USACE, 2013). Maintenance of turf grasses, shrubs and trees in city and university parks provide a vegetative buffer along the San Marcos River that filters storm water runoff to improve water quality. Maintaining vegetation in areas adjacent to the river reduces both the sediment load and contaminants in urban runoff.
6.3.4 Social Benefits
The city’s parks along the San Marcos River are the centerpiece of the city’s recreational tourist economy. Much of the city’s parks are maintained without supplemental irrigation. The prospect of developing reclaimed water for irrigation of city parks highlights a significant paradox in the economics of operating and maintaining city parks. Ensuring that parks are developed and maintained at levels of service that meet the needs and expectations of current and future residents presents a significant dilemma for any city. In its simplest form, the city must choose between operating parks without irrigation, irrigating with potable water, or irrigating parks with reclaimed water. Leaving parks without irrigation appears to be the lowest cost alternative, but that option does not address the loss of some uses during drought periods and a limited ability to restore overused areas or to boost community appeal. The alternative of irrigating parks using potable water will increase the level of service and costs during normal rainfall years, but will essentially become the no-irrigation alternative during drought periods when outdoor water use is restricted. This alternative also increases the city’s overall demand for new water supplies that are developed at higher costs.
Improved community aesthetics
Both city and university parks and athletic fields incorporate a variety of plants and grasses to provide shade, visual enjoyment and playing surfaces. Supplemental irrigation of parks, picnic areas, playgrounds, and athletic fields, can provide an improved capacity for accommodating the increased and heavier uses associated with more visitors and activities.
Support for community values associated with recreation
Summer recreational programs provide opportunities for a healthy lifestyle. The drought-proof nature of reclaimed water provides a source of water for ensuring plant maintenance and for providing increased recreational opportunities that enhance the local quality of life, particularly during the summer months when activities peak and potable water conservation measures are in effect.
53
6.3.5 Other Project Benefits
Tournament revenue
The city's Parks and Recreation Department annually hosts up to four youth soccer tournaments at the San Marcos Soccer Complex. The complex has turf fields that are irrigated using potable water. The city is scheduled to host four tournaments during 2013 and estimates the total economic impact to be $631,100, exclusive of hotel revenues. The annual number of tournaments is assumed to remain constant unless the quality of the facilities cannot be maintained, as would be the case with a loss of irrigation due to Stage V restrictions. The city is presently evaluating artificial turf as an alternative to potable or reclaimed water irrigation.
Long-term sustainability of parks
Developing parks is a significant investment by the current generation to ensure that the city’s parks meet the needs of the present without compromising the ability of future generations to meet their own needs. Preserving vegetation in the parks provides both an inviting developed environment for people and a means of preventing damage due to erosion of surfaces worn by increasing use.
Support and diversification of the local economy
San Marcos is fortunate to have a diverse local economy that includes higher education, retail shopping, manufacturing, and tourism. There are clear and strong links between all four segments of the economy, as seen with university students and visitors who come to shop at the city's outlet malls and also take advantage of river recreation. A study of the economic impact of the university (LeSage, 2007) concluded that students and visitors to TxSt have an annual impact of $516.5 million on the Texas economy and a $56.5 million impact in Hays County. The study does not attempt to determine what impact the university's location at the headwaters of the San Marcos River might have on attracting students or visitors, but few would disagree that the San Marcos River and adjacent city and university parks are an integral part of the local and regional economy. These areas are the centerpiece of both the tourist economy as well as a key point of attraction for potential TxSt students and faculty. The level of maintenance of parks during the summer months has a positive effect on the local economy by attracting tourists to the area.
Reclaimed water cost recovery benefit
Reclaimed water is a valuable commodity that can be sold to recover much of the costs of a project to expand the reclaimed water system. Like any commodity, market conditions will govern the sale of reclaimed water. For existing customers, rates for reclaimed water are established under existing contracts. The city’s potable water rate is approximately $2,158 per AF. It is assumed that a similar water rate would apply for irrigation and industrial uses. This benefit is realized by serving new customers. The rate at which reclaimed water could be sold depends on a number of economic factors. Additional discussion and consideration of policy objectives are needed to identify appropriate rates.
54
Regionalization benefit
The financial benefit of regionalization is difficult to quantify, but expansion of the reclaimed water system would allow for cost-sharing opportunities and economy of scale benefits for the city and university.
6.4 Methodology
A present value analysis was performed to determine the relative expense of expanding the reclaimed water system as a water supply alternative compared to a baseline alternative of continued potable water use for industrial use and landscape irrigation. An alternative is preferred in a present value analysis when its present value is lower in absolute terms relative to other alternatives. The analysis forecasts the costs of each alternative over a 30-year period with a discount rate of 4%. The analysis horizon of 30 years has been selected because it captures each of the phased expansions of the reclaimed water system and the retirement of three of the four anticipated debt issuances (2015, 2017, and 2032), as well as 60% of the projected life of the project.
6.4.1 Calculating the Annual Costs of the Baseline Alternative
The baseline alternative is defined as the cost of meeting the projected reclaimed water demands with water from the potable water sources during each year of the analysis horizon to meet the maximum day and annual average demands of reclaimed water users. The baseline scenario includes the average cost of supply and the costs of potable water treatment, conveyance, storage, and distribution. As a water supply source, the cost of reclaimed water can be considered as part of the overall average cost of water supply as presented in Table 3-3. For the purposes of the present value analysis, the average costs of water are assumed to be uniform for each year and increased only with the cost of an additional source of supply. The costs of debt service, potable water treatment, and conveyance are included to complete the annual costs of the baseline non-reuse alternative
6.4.2 Calculating the Annual Costs of the Reuse Alternatives
The annual costs of the reuse alternatives include the costs of other water supply sources, debt service costs, power costs, treatment, and operations and maintenance.
Costs of other water supply sources
Since the reuse alternatives would be used in conjunction with the existing and planned water supplies, the existing water supply sources are considered as part of the cost structure, though the quantity required to meet required demand would be reduced as a result of the availability of this alternative. These existing water sources include the city and university's Edwards Aquifer permitted volumes, the Canyon Lake stored volume contract supply through GBRA, and the HCPUA. As discussed in Section 6.4.1, the average costs of water are assumed to be uniform for each year and increased only with the cost of an additional source of supply.
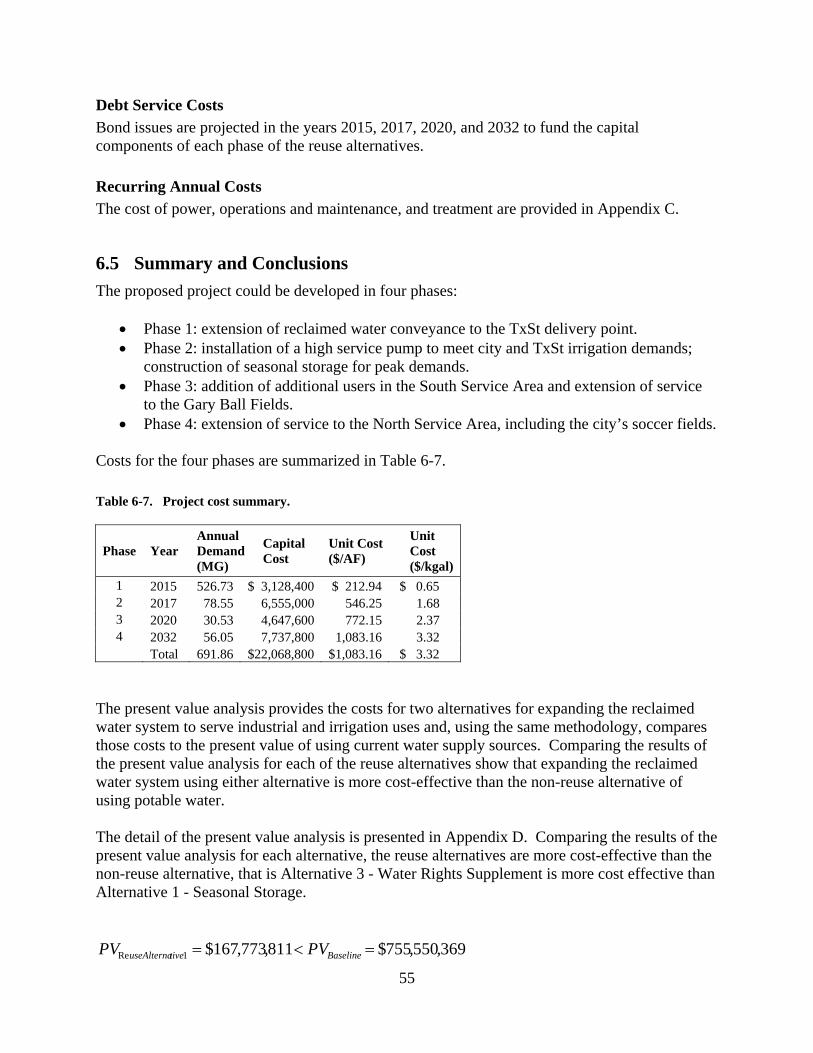
55
Debt Service Costs
Bond issues are projected in the years 2015, 2017, 2020, and 2032 to fund the capital components of each phase of the reuse alternatives.
Recurring Annual Costs
The cost of power, operations and maintenance, and treatment are provided in Appendix C.
6.5 Summary and Conclusions
The proposed project could be developed in four phases:
Phase 1: extension of reclaimed water conveyance to the TxSt delivery point. Phase 2: installation of a high service pump to meet city and TxSt irrigation demands;
construction of seasonal storage for peak demands. Phase 3: addition of additional users in the South Service Area and extension of service
to the Gary Ball Fields. Phase 4: extension of service to the North Service Area, including the city’s soccer fields.
Costs for the four phases are summarized in Table 6-7.
Table 6-7. Project cost summary.
Phase Year Annual Demand (MG)
Capital Cost
Unit Cost ($/AF)
Unit Cost ($/kgal)
1 2015 526.73 $ 3,128,400 $ 212.94 $ 0.65 2 2017 78.55 6,555,000 546.25 1.68 3 2020 30.53 4,647,600 772.15 2.37 4 2032 56.05 7,737,800 1,083.16 3.32
Total 691.86 $22,068,800 $1,083.16 $ 3.32 The present value analysis provides the costs for two alternatives for expanding the reclaimed water system to serve industrial and irrigation uses and, using the same methodology, compares those costs to the present value of using current water supply sources. Comparing the results of the present value analysis for each of the reuse alternatives show that expanding the reclaimed water system using either alternative is more cost-effective than the non-reuse alternative of using potable water. The detail of the present value analysis is presented in Appendix D. Comparing the results of the present value analysis for each alternative, the reuse alternatives are more cost-effective than the non-reuse alternative, that is Alternative 3 - Water Rights Supplement is more cost effective than Alternative 1 - Seasonal Storage.
369,550,755$811,773,167$1Re BaselinetiveuseAlterna PVPV

56
369,550,755$212,662,163$3Re BaselinetiveuseAlterna PVPV
In summary, if the projected annual costs of each alternative over thirty years were compared and “brought back to the current year” through discounting, expansion of the reclaimed water system to serve industrial and irrigation demands would be preferable to continued and expanded use of the potable water supply.
57
7 Recommended Alternative The previously described analysis indicates that expansion of the reclaimed water system will be cost effective in providing water supplies to meet many of the city and university industrial and irrigation water demands. Of the two viable alternatives for peak demand supply, Alternative 3 - Water Rights Supplement was found to have a lower capital cost as a result of building a 35 MG seasonal storage pond and river intake pump station instead of a 105 MG seasonal storage pond included in Alternative 1 - Seasonal Storage. Both peak demand supply alternatives will reduce water demands on the Edwards Aquifer and the Canyon Lake supplies, and both will allow higher volumes of spring flow to remain in the San Marcos River through the critical habitat areas. Even though Alternative 3 is the lowest cost alternative, implementation of the alternative will require completion of an interlocal agreement between the city and the university to establish a diversion point for the university’s industrial and municipal water rights at the WWTP that could be used to meet the peak demands of the reclaimed water system. Such an agreement will require a full review and vetting by both city and university management, as well as review by state and federal agencies in the context of the EARIP Habitat Conservation Plan (HCP). Besides a lower overall cost of reclaimed water, Alternative 3 presents certain other advantages in the university's water supply planning, such as further enhancement of the aquatic environment by allowing the university's entire municipal and industrial water rights to remain in the San Marcos River through the critical habitat area. But recognizing there are no changes to the conveyance system as a result of either alternative, the initial phases of construction of the expanded system are not controlled by a choice between Alternative 1 and Alternative 3. Proceeding with Alternative 1, for example, would afford the city with the fastest path to project implementation by allowing construction of the seasonal storage pond to be phased with an initial capacity of 35 MG. This would allow more time for the issues of water rights and diversion to be resolved concurrent with commencement of reclaimed water deliveries to the university thermal plants and potentially the city's parks. Recognizing the advantages of allowing development of the project to proceed, Alternative 1 is the recommended alternative in recognition of the additional time required to address the institutional issues related to the proposed use of university water rights. A change to the project to use San Marcos River water to meet the peak system demand could be made and the construction phasing modified to implement the peak demand supply alternative during the project design phase. Construction of the seasonal storage facility (Alternative 1) could be phased between 2015 and 2017, included as part of Phase 1, or included as part of Phase 2 (2017) with the addition of high service pumps to serve city and university irrigation demands.

58
This page is intentionally blank
59
8 Environmental Considerations This section provides an overview of potential environmental considerations that may be addressed as part of the identified alternative for expansion of the San Marcos reclaimed water system. The review does not include a detailed survey or detailed investigation of environmental features or of cultural resources. A more detailed investigation would be conducted at the time actual facility locations are determined and final design is initiated. The primary environmental features within the study area include the floodplain of the San Marcos River and its tributaries and the Edwards Aquifer Recharge Zone.
8.1 Potential Environmental Effects
Potential environmental effects of the project would be anticipated to occur primarily during construction. Construction activities such as trench construction would cause limited and temporary impacts. The activities would vary with the project components, with construction related to expansion of existing facilities having the least expected impact (e.g. pump station expansions at the WWTP). The sections below provide a brief discussion of the nature of construction and operational impacts of the project.
8.1.1 Project Construction
The potential impacts of project construction will be consistent with those of other utility construction project and will require the use of construction related Best Management Practices (BMPs) to manage potential impacts to local hydrology and water quality, biological resources, air quality, noise, and transportation. Pipeline extensions will follow the established procedures of delineating potential wetland areas and developing a project design that will avoid those areas by location or by alternative construction methods, such as trenchless construction.
8.1.2 Project Operation
Project operation includes the distribution and use of reclaimed and nonpotable water for industrial and irrigation uses. The production, distribution, and use of reclaimed water would be consistent with the existing state regulations regarding the provision and use of reclaimed water. The quality of reclaimed water supplied by the project will meet the quality parameters for Type I reclaimed water under 30 TAC 210. In accordance with state regulations, reclaimed water users will be prohibited from allowing reclaimed water to pond or to runoff during use. The use of reclaimed water for irrigation will provide improved vegetative buffers in recreational areas by enhancing and maintaining vegetation even during periods of dry weather. Industrial use of reclaimed water will reduce groundwater withdrawals by providing an alternative to the use of water from the Edwards Aquifer.
8.2 Endangered or Threatened Species
The Texas Parks and Wildlife Department (TPWD) Rare, Threatened, and Endangered Species database contains county level information about the habitat of species of special concern in the State of Texas. A review of the TPWD database for Hays County reveals that the habitats for
60
several federally listed threatened and endangered species in Hays County are found in the San Marcos River and in subterranean features of the Edwards Formation. During the project design phase, a survey of areas affected by the proposed project will be conducted to determine if habitats for any listed species exist within the project construction area and, if any are identified, for the project to be designed to avoid impacting those areas during construction. An onsite assessment of potential habitat for listed species would be conducted as part of the design process. Once completed and in service, the use of reclaimed water for irrigation of developed property and for industrial uses will be operated in accordance with state and federal regulations. State regulations (30 TAC 210) prohibit the release of reclaimed water, including irrigation practices that lead to reclaimed water runoff.
8.2.1 Edwards Aquifer
The Edwards Aquifer extends 180 miles from Brackettville in Kinney County to just north of San Marcos. The aquifer is the primary source of drinking water for over 2 million people in south central Texas and serves the domestic, agricultural, industrial, and recreational needs of the region. The Edwards Aquifer is also the source of the San Marcos springs, one of only two major springs remaining in Texas, and feed the flow of the San Marcos River. The decline in water levels the Edwards Aquifer due to increased groundwater use can affect spring flow of the San Marcos Springs and flow in the San Marcos River. The transition zone of the Edwards Aquifer is described as a thin strip of land south and southeast of the recharge zone from San Antonio to Austin where limestone that overlies the Edwards formation is faulted and fractured and where caves and sinkholes are fairly common. The boundary between the recharge and transition zones transects the San Marcos area just outside of the study area. The transition zone was established to regulate petroleum storage tanks. Since the proposed project will be located entirely outside of the Edwards Aquifer recharge zone and will be designed and operated to meet all regulations that apply to the transition zone, the proposed project will not create a potential for significantly impacting the Edwards Aquifer (Figure 8-1). With the proposed use of reclaimed water for irrigation being limited to the transition zone of the Edwards Aquifer, the use of reclaimed water in San Marcos will not affect endangered or threatened species habitats of the Edwards Aquifer. Expansion of the use of reclaimed water would reduce reliance on the Edwards Aquifer during drought periods. This would contribute to maintenance of springflow of the San Marcos Springs and protection of endangered species in the San Marcos River.
8.2.2 San Marcos River
The City of San Marcos and Texas State University are situated at the head waters of the San Marcos River which flows from San Marcos Springs. The San Marcos River provides habitat for four species listed by the USFWS as endangered. At the headwaters of the San Marcos River are a series of springs in Spring Lake located between Aquarena Springs Dr. and Ed JL Green Dr. in San Marcos. Habitats for Texas wild rice, the fountain darter, San Marcos salamander, and San Marcos gambusia depend on constant natural spring flow. The San Marcos Recovery plan for
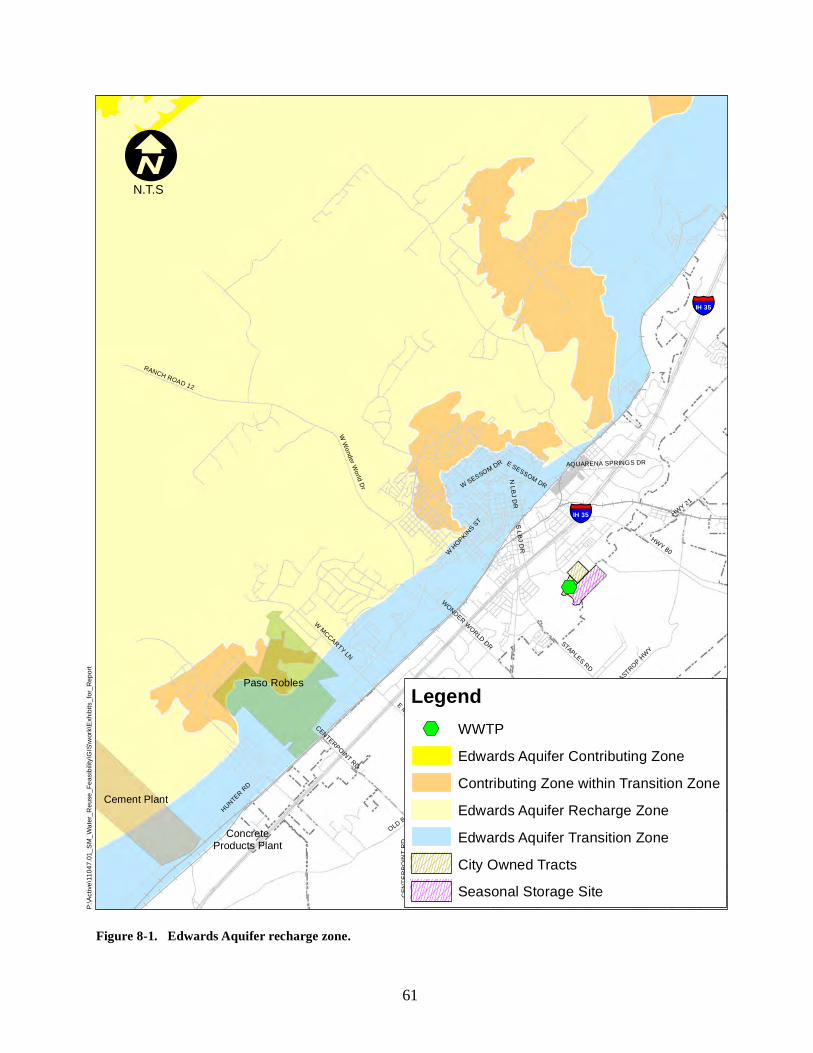
%,
Paso Robles
Cement Plant
ConcreteProducts Plant
HWY 1
23
HWY 80
HWY 21
§̈¦IH 35
§̈¦IH 35
FM 1978
FM 621
FM 19
79
HUNTER RD
OLD BASTROP HWY
STAPLES RD
REDWOOD RD
RANCH ROAD 12
N LBJ DR
W Wonder World Dr
E MCCARTY LN
W MCCARTY LN
CENTERPOINT RD
WONDER WORLD DR
S LBJ DR
W HOPKINS ST
CLOVIS BARKER RD
AQUARENA SPRINGS DR
W SESSOM DR E SESSOM DR
N OLD BASTROP HWY
RATTLER RD
REDWOOD RDCENT
ERPO
INT R
D
IN.T.S
P:\Ac
tive\1
1047
.01_S
M_Wa
ter_R
euse
_Fea
sibility
\GIS\
work\
Exhib
its_fo
r_Rep
ort
Legend%, WWTP
Edwards Aquifer Contributing ZoneContributing Zone within Transition Zone�Edwards Aquifer Recharge ZoneEdwards Aquifer Transition ZoneCity Owned TractsSeasonal Storage Site
Figure 8-1. Edwards Aquifer recharge zone.
61
62
San Marcos River Endangered and Threatened Species (USFWS, 1984) identified reduced flow from the San Marcos Springs, habitat modification and loss from human actions that affect the river, and the introduction of exotic species as the primary threats to the San Marcos River ecosystem. The areas of the San Marcos Springs and San Marcos River that are designated as critical habitat for threatened and endangered species is presented in Figure 8-2. Recommended recovery actions included managing the Edwards Aquifer to ensure continuation of the San Marcos Springs flow. Reduced diversions from the San Marcos River resulting from expanded use of reclaimed water will increase instream flows in the upper San Marcos River in the areas of critical habitat
8.2.3 Edwards Aquifer Habitat Conservation Plan
Eight species that are federally-listed as threatened or endangered depend directly on water in the Edwards Aquifer or on the water discharged from the San Marcos and Comal springs. The Edwards Aquifer Authority (EAA) was created by the Texas Legislature as a result of a 1991 lawsuit to enforce the Federal Endangered Species Act. The EAA was created to regulate pumping from the aquifer, implement critical period management restrictions, and pursue measures to ensure that springflows of the San Marcos and Comal springs are maintained to protect endangered and threatened species. In 2006, the US Fish and Wildlife Service (USFWS) implemented the Edwards Aquifer Recovery Implementation Program (EARIP), a collaborative process focused on developing a workable plan to contribute to the recovery of federally-listed species dependent on the aquifer. The following year, the Texas Legislature directed the EAA and certain other water agencies to participate in the EARIP and to prepare a USFWS approved plan for managing the aquifer to preserve the listed species at Comal and San Marcos springs. As directed by the Legislature, the Habitat Conservation Plan (HCP) includes recommendations regarding withdrawal adjustments during critical periods that ensure protection of the federally-listed species associated with the aquifer. Protection and supporting measures of the HCP that may be supported by expanded use of reclaimed water include:
Management of Recreation in Key Areas and Designation of Permanent Access Points/Bank Stabilization: To minimize the impacts of recreation, permanent access points will be combined with bank stabilization at various locations. These locations will provide entry and exit access to the river for canoeists, tubers, swimmers, etc., while stabilizing highly eroded banks. In these areas, the bank is eroding generally due to clearing of riparian vegetation and specifically due to intense recreational use. The City of San Marcos will stabilize banks in eroded areas, to include City Park, Hopkins Street Underpass, Bicentennial Park, Rio Vista Park, Ramon Lucio Park, and Cheatham Street Underpass. Permanent access will be located at dog beach, Lion’s Club Tube Rental, Bicentennial Park, Rio Vista Park, the Nature Center, and potentially other areas. As observed in the HCP, the increasing population of San Marcos and the region will result in an increase in the number of park visitors making irrigation of park vegetation in the parks that host the stabilized access points an important part of recreation management.
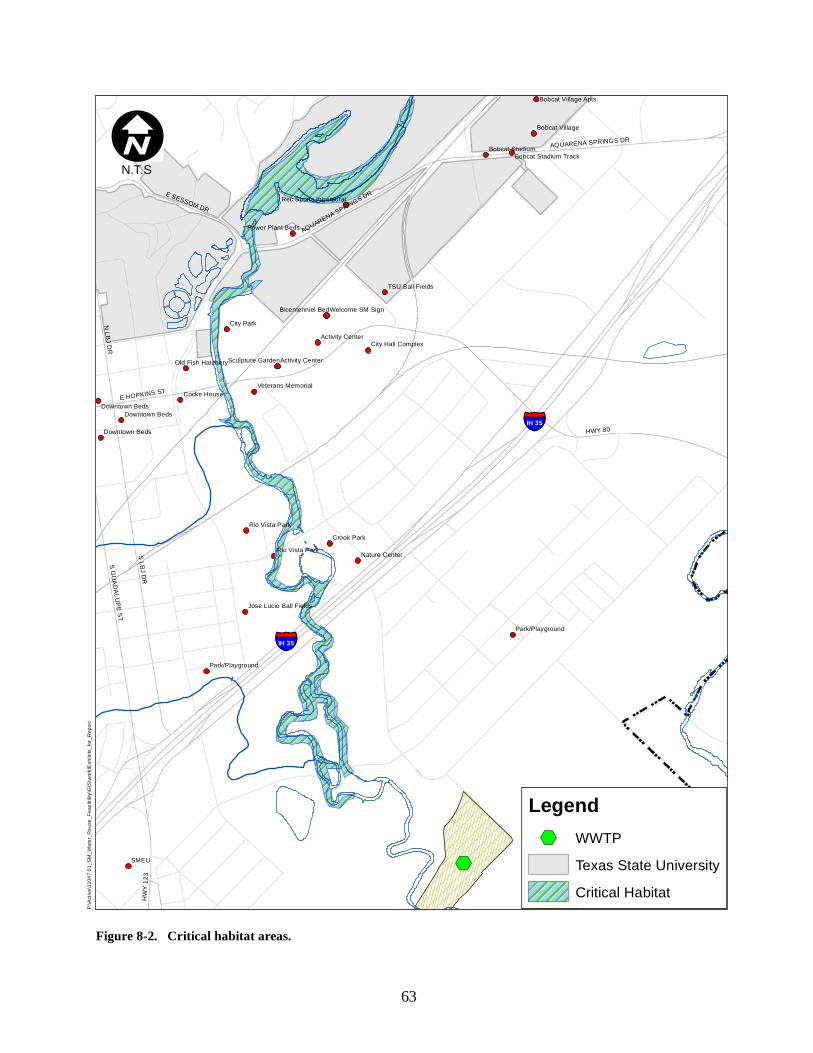
%,
HWY 80
HWY 1
23
§̈¦IH 35
§̈¦IH 35
S LBJ DR
E HOPKINS ST
S GUADALUPE STN LBJ DR
E SESSOM DR
AQUARENA SPRINGS DR
AQUARENA SPRINGS DR
SMEU
City Park
Crook Park
Cocke House
Downtown Beds
Nature Center
Downtown BedsDowntown Beds
Bobcat Village
Bobcat Stadium
Rio Vista Park
Rio Vista Park
TSU Ball Fields
Park/Playground
Park/Playground
Welcome SM Sign
Activity Center
Activity Center
Power Plant Beds
Sculpture Garden
Bicentenniel Bed
City Hall Complex
Veterans Memorial
Old Fish Hatchery
Bobcat Village Apts.
Bobcat Stadium Track
Rec Sports Intramural
Jose Lucio Ball Fields
P:\Ac
tive\1
1047
.01_S
M_Wa
ter_R
euse
_Fea
sibility
\GIS
\work
\Exh
ibits_
for_R
eport
IN.T.S
Legend%, WWTP
Texas State UniversityCritical Habitat
Figure 8-2. Critical habitat areas.
63
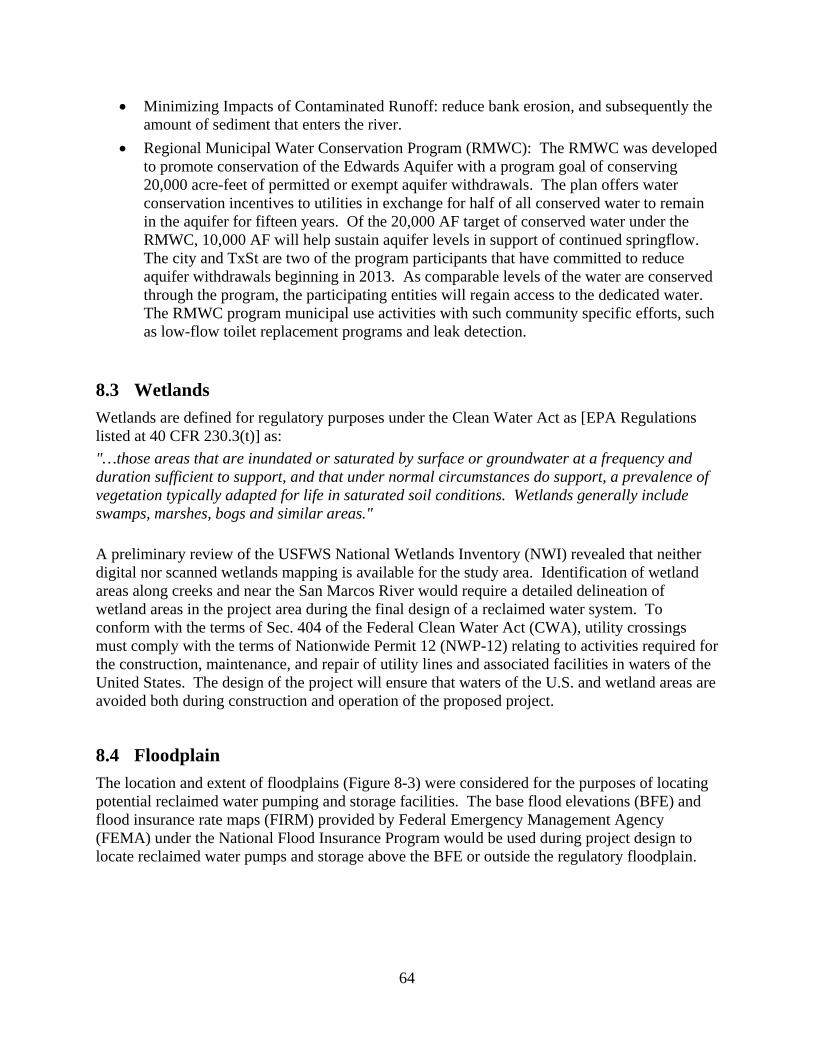
64
Minimizing Impacts of Contaminated Runoff: reduce bank erosion, and subsequently the amount of sediment that enters the river.
Regional Municipal Water Conservation Program (RMWC): The RMWC was developed to promote conservation of the Edwards Aquifer with a program goal of conserving 20,000 acre-feet of permitted or exempt aquifer withdrawals. The plan offers water conservation incentives to utilities in exchange for half of all conserved water to remain in the aquifer for fifteen years. Of the 20,000 AF target of conserved water under the RMWC, 10,000 AF will help sustain aquifer levels in support of continued springflow. The city and TxSt are two of the program participants that have committed to reduce aquifer withdrawals beginning in 2013. As comparable levels of the water are conserved through the program, the participating entities will regain access to the dedicated water. The RMWC program municipal use activities with such community specific efforts, such as low-flow toilet replacement programs and leak detection.
8.3 Wetlands
Wetlands are defined for regulatory purposes under the Clean Water Act as [EPA Regulations listed at 40 CFR 230.3(t)] as:
"…those areas that are inundated or saturated by surface or groundwater at a frequency and duration sufficient to support, and that under normal circumstances do support, a prevalence of vegetation typically adapted for life in saturated soil conditions. Wetlands generally include swamps, marshes, bogs and similar areas."
A preliminary review of the USFWS National Wetlands Inventory (NWI) revealed that neither digital nor scanned wetlands mapping is available for the study area. Identification of wetland areas along creeks and near the San Marcos River would require a detailed delineation of wetland areas in the project area during the final design of a reclaimed water system. To conform with the terms of Sec. 404 of the Federal Clean Water Act (CWA), utility crossings must comply with the terms of Nationwide Permit 12 (NWP-12) relating to activities required for the construction, maintenance, and repair of utility lines and associated facilities in waters of the United States. The design of the project will ensure that waters of the U.S. and wetland areas are avoided both during construction and operation of the proposed project.
8.4 Floodplain
The location and extent of floodplains (Figure 8-3) were considered for the purposes of locating potential reclaimed water pumping and storage facilities. The base flood elevations (BFE) and flood insurance rate maps (FIRM) provided by Federal Emergency Management Agency (FEMA) under the National Flood Insurance Program would be used during project design to locate reclaimed water pumps and storage above the BFE or outside the regulatory floodplain.
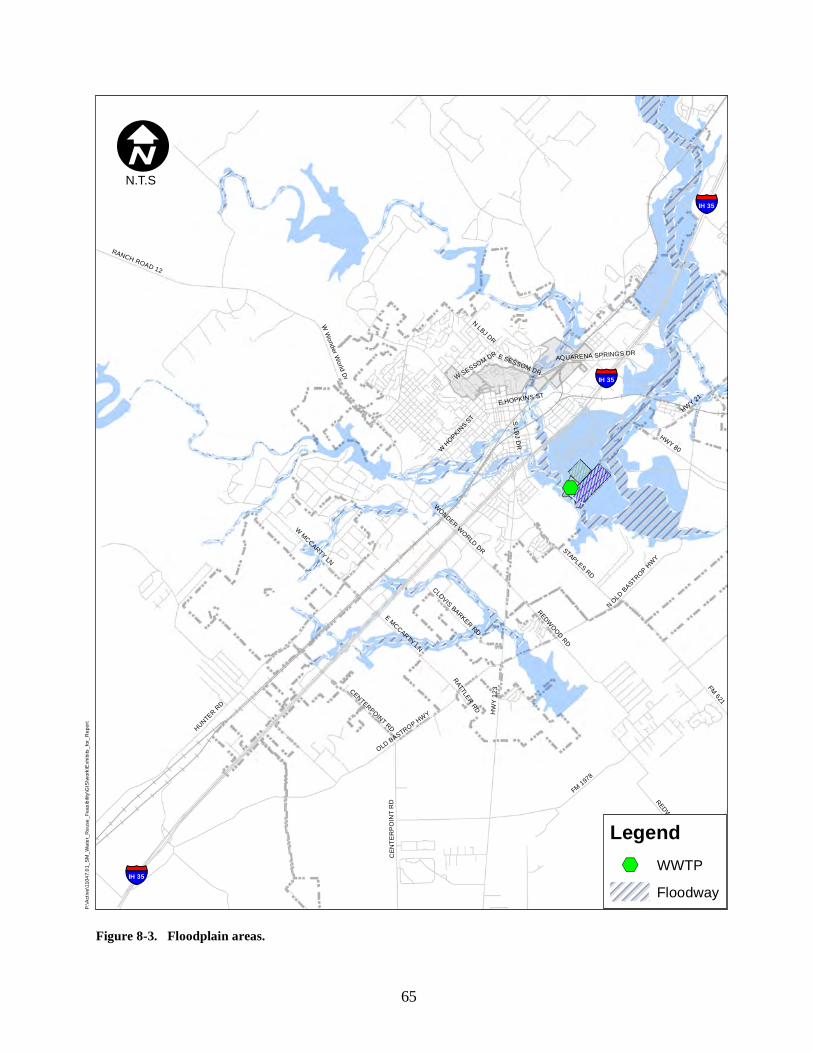
%,HW
Y 123
HWY 80
HWY 21
§̈¦IH 35
§̈¦IH 35
§̈¦IH 35
FM 1978
FM 19
79
FM 621
HUNTER RD
OLD BASTROP HWY
STAPLES RD
REDWOOD RDRANCH ROAD 12
N LBJ DR
W Wonder World Dr
E MCCARTY LN
W MCCARTY LN
CENT
ERPO
INT R
D
WONDER WORLD DR
S LBJ DR
W HOPKINS ST
E HOPKINS ST
CLOVIS BARKER RD
AQUARENA SPRINGS DR
W SESSOM DR E SESSOM DR
N OLD BASTROP HWY
RATTLER RD
REDWOOD RD
CENTERPOINT RD
P:\Ac
tive\1
1047
.01_S
M_Wa
ter_R
euse
_Fea
sibility
\GIS
\work
\Exh
ibits_
for_R
eport
IN.T.S
Legend%, WWTP
Floodway
Figure 8-3. Floodplain areas.
65
66
8.5 Archeological and Cultural Resources
Construction of the project must adhere to various state and federal regulations intended to ensure that historic and prehistoric resources are identified along the project route or will be identified through a reconnaissance. Since construction of the proposed project would take place in existing and future public rights-of-way and on developed property, it is unlikely that the project will have a significant impact on a site, structure, or object that is listed in or eligible for listing in the National Registry of Historic Places, affects a historic or cultural resource or traditional and sacred sites, or the loss or destruction of a significant scientific, cultural, or historic resources. While the proposed project should not impact historic properties or prehistoric sites, the city will, during the design phase, coordinate the project design with the State Historic Preservation Officer or secure the services of a qualified archeologist to ensure that the requirements of the Archeological and Historic Preservation Act of 1974; National Historic Preservation Act of 1966; and the Texas Antiquities Code are addressed prior to construction. Once completed and in service, the use of reclaimed water for irrigation of developed property and for cooling will not create a potential for significantly impacting cultural resources.
8.6 Public Health and Safety
Existing regulations regarding the use of reclaimed water are developed to ensure that the environment and the health and safety of the public are protected. Similarly, existing federal, state, and city construction safety and construction-phase storm water quality management requirements will ensure protection of the environment and public health and safety during the construction phase. Project construction will contribute to some increase in vehicular and truck traffic in the project area that may result in increased short-term air emissions and noise levels in and around the construction areas. Construction activities may involve the use of hazardous materials during construction; however the implementation of best management practices (BMPs) related to fueling, vehicle washing and the handling, use, and storage of chemicals will minimize risks to workers, the public, and the environment. Project implementation will incrementally increase the use of chemicals used for disinfection of reclaimed water. All treatment chemicals would be handled and stored in compliance with federal, state and local requirements.
8.7 Natural Resources
Natural resources are materials or substances such as minerals, forests, water, and fertile land that occur in nature and can be used for economic benefit. The construction and operation of a reclaimed water system for irrigation of existing landscaped areas and industrial uses will not significantly impact the natural resources of the project area except for the potential to reduce demands on the Edwards Aquifer.
8.8 Potentially Significant Environmental Effects
Potentially significant environmental effects related to construction are short term in nature and include potential impacts on soils, water resources, biological resources, traffic, aesthetics, and
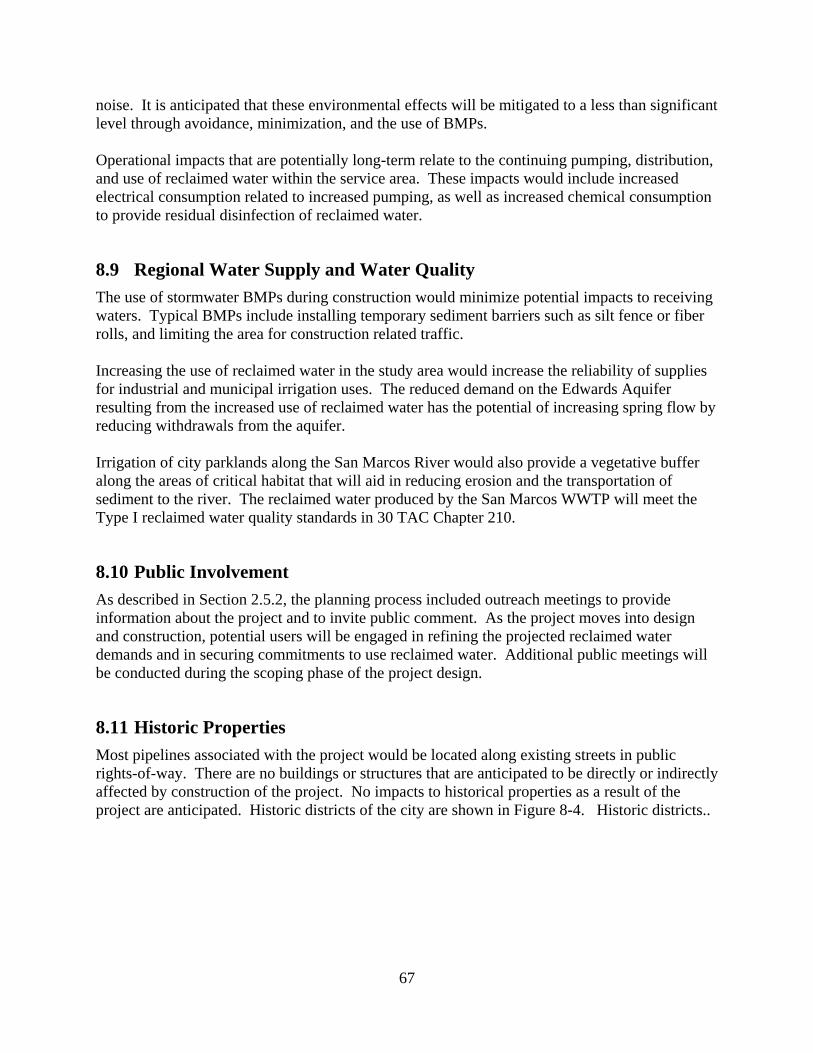
67
noise. It is anticipated that these environmental effects will be mitigated to a less than significant level through avoidance, minimization, and the use of BMPs. Operational impacts that are potentially long-term relate to the continuing pumping, distribution, and use of reclaimed water within the service area. These impacts would include increased electrical consumption related to increased pumping, as well as increased chemical consumption to provide residual disinfection of reclaimed water.
8.9 Regional Water Supply and Water Quality
The use of stormwater BMPs during construction would minimize potential impacts to receiving waters. Typical BMPs include installing temporary sediment barriers such as silt fence or fiber rolls, and limiting the area for construction related traffic. Increasing the use of reclaimed water in the study area would increase the reliability of supplies for industrial and municipal irrigation uses. The reduced demand on the Edwards Aquifer resulting from the increased use of reclaimed water has the potential of increasing spring flow by reducing withdrawals from the aquifer. Irrigation of city parklands along the San Marcos River would also provide a vegetative buffer along the areas of critical habitat that will aid in reducing erosion and the transportation of sediment to the river. The reclaimed water produced by the San Marcos WWTP will meet the Type I reclaimed water quality standards in 30 TAC Chapter 210.
8.10 Public Involvement
As described in Section 2.5.2, the planning process included outreach meetings to provide information about the project and to invite public comment. As the project moves into design and construction, potential users will be engaged in refining the projected reclaimed water demands and in securing commitments to use reclaimed water. Additional public meetings will be conducted during the scoping phase of the project design.
8.11 Historic Properties
Most pipelines associated with the project would be located along existing streets in public rights-of-way. There are no buildings or structures that are anticipated to be directly or indirectly affected by construction of the project. No impacts to historical properties as a result of the project are anticipated. Historic districts of the city are shown in Figure 8-4. Historic districts..
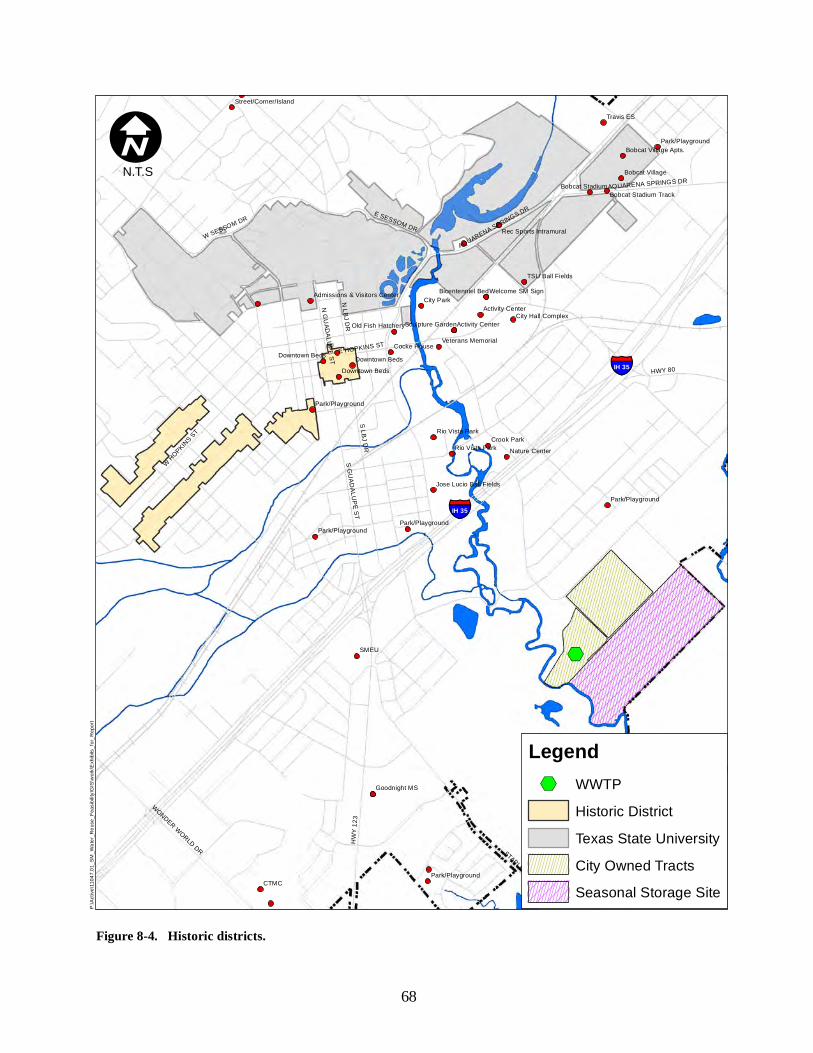
%,
HWY 1
23
HWY 80§̈¦IH 35
§̈¦IH 35
N LBJ DR
STAPLES RD
S LBJ DR
E HOPKINS ST
W HOPKINS ST
S GUADALUPE ST
WONDER WORLD DR
W SESSOM DRE SESSOM DR
N GUADALUPE ST
AQUARENA SPRINGS DR
AQUARENA SPRINGS DR
CTMC
SMEU
Travis ES
City Park
Crook Park
Cocke House
Goodnight MS
Downtown Beds
Nature Center
Downtown BedsDowntown Beds
Bobcat VillageBobcat Stadium
Rio Vista Park
Rio Vista Park
TSU Ball Fields
Park/Playground
Park/Playground
Park/Playground
Park/Playground
Welcome SM Sign
Activity Center
Activity Center
Park/Playground
Park/Playground
Sculpture Garden
Bicentenniel Bed
City Hall Complex
Veterans MemorialOld Fish Hatchery
Bobcat Village Apts.
Bobcat Stadium Track
Street/Corner/Island
Rec Sports Intramural
Jose Lucio Ball Fields
Admissions & Visitors Center
P:\Ac
tive\1
1047
.01_S
M_Wa
ter_R
euse
_Fea
sibility
\GIS
\work
\Exh
ibits_
for_R
eport
IN.T.S
Legend%, WWTP
Historic DistrictTexas State UniversityCity Owned TractsSeasonal Storage Site
Figure 8-4. Historic districts.
68
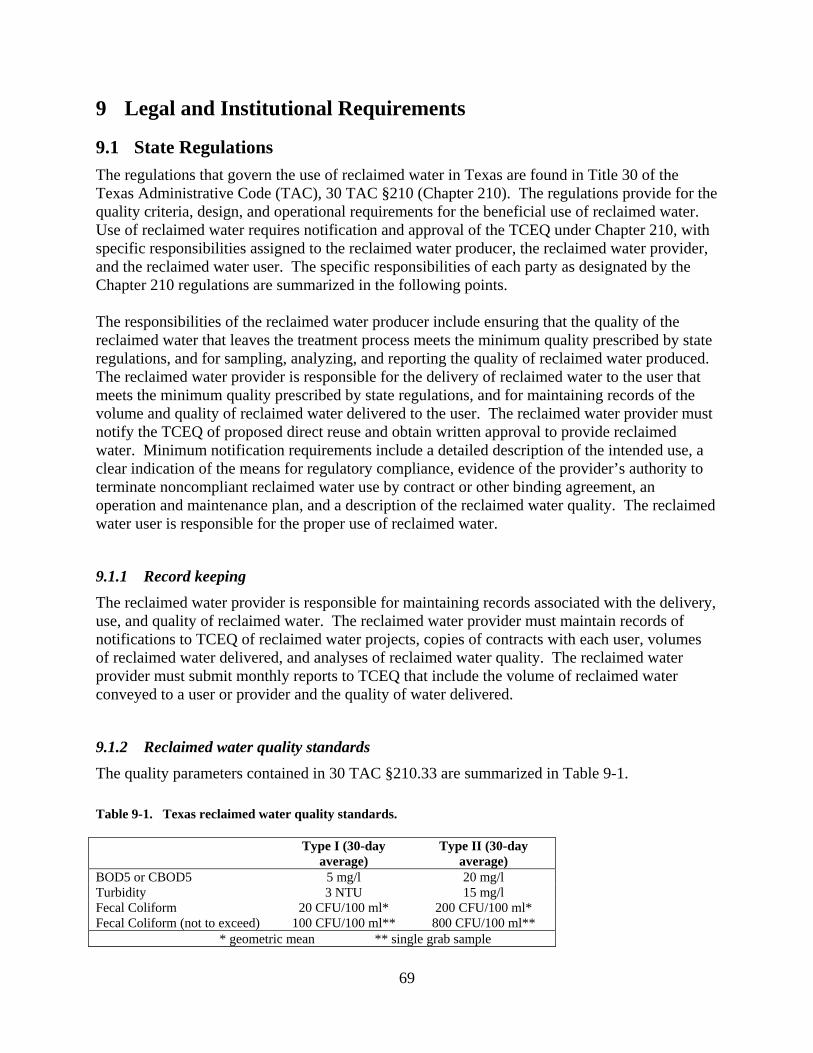
69
9 Legal and Institutional Requirements
9.1 State Regulations
The regulations that govern the use of reclaimed water in Texas are found in Title 30 of the Texas Administrative Code (TAC), 30 TAC §210 (Chapter 210). The regulations provide for the quality criteria, design, and operational requirements for the beneficial use of reclaimed water. Use of reclaimed water requires notification and approval of the TCEQ under Chapter 210, with specific responsibilities assigned to the reclaimed water producer, the reclaimed water provider, and the reclaimed water user. The specific responsibilities of each party as designated by the Chapter 210 regulations are summarized in the following points. The responsibilities of the reclaimed water producer include ensuring that the quality of the reclaimed water that leaves the treatment process meets the minimum quality prescribed by state regulations, and for sampling, analyzing, and reporting the quality of reclaimed water produced. The reclaimed water provider is responsible for the delivery of reclaimed water to the user that meets the minimum quality prescribed by state regulations, and for maintaining records of the volume and quality of reclaimed water delivered to the user. The reclaimed water provider must notify the TCEQ of proposed direct reuse and obtain written approval to provide reclaimed water. Minimum notification requirements include a detailed description of the intended use, a clear indication of the means for regulatory compliance, evidence of the provider’s authority to terminate noncompliant reclaimed water use by contract or other binding agreement, an operation and maintenance plan, and a description of the reclaimed water quality. The reclaimed water user is responsible for the proper use of reclaimed water.
9.1.1 Record keeping
The reclaimed water provider is responsible for maintaining records associated with the delivery, use, and quality of reclaimed water. The reclaimed water provider must maintain records of notifications to TCEQ of reclaimed water projects, copies of contracts with each user, volumes of reclaimed water delivered, and analyses of reclaimed water quality. The reclaimed water provider must submit monthly reports to TCEQ that include the volume of reclaimed water conveyed to a user or provider and the quality of water delivered.
9.1.2 Reclaimed water quality standards
The quality parameters contained in 30 TAC §210.33 are summarized in Table 9-1.
Table 9-1. Texas reclaimed water quality standards.
Type I (30-day average)
Type II (30-day average)
BOD5 or CBOD5 5 mg/l 20 mg/l Turbidity 3 NTU 15 mg/l Fecal Coliform 20 CFU/100 ml* 200 CFU/100 ml* Fecal Coliform (not to exceed) 100 CFU/100 ml** 800 CFU/100 ml** * geometric mean ** single grab sample
70
The Chapter 210 rules regulate the quality, place and manner of use of effluent from wastewater treatment facilities to protect public health by minimizing risks of infection and disease transmission. Depending on the potential for human contact, Texas regulations provide for two types of reclaimed water.
Type I Reclaimed Water Use
Type I reclaimed water can be used where human contact with the reclaimed water is likely. The potential uses for Type I reclaimed water include (30 TAC §210.32):
Residential irrigation, including landscape irrigation at individual homes.
Urban uses, including irrigation of public parks, golf courses with unrestricted public access, school yards, or athletic fields.
Use of reclaimed water for fire protection, either in internal sprinkler systems or external fire hydrants.
Irrigation of food crops where the applied reclaimed water may have direct contact with the edible part of the crop, unless the food crop undergoes a pasteurization process.
Irrigation of pastures for milking animals.
Maintenance of impoundments or natural water bodies where recreational activities, such as wading or fishing, are anticipated even though the water body was not specifically designed for such a use.
Toilet or urinal flush water.
Other similar activities where there is the potential for unintentional human exposure.
Type II Reclaimed Water Use
Type II reclaimed water can be used where human contact with the reclaimed water is unlikely. The potential uses for Type II reclaimed water include (30 TAC §210.32):
Irrigation of sod farms, silviculture, limited access highway rights of way, and other areas where human access is restricted or unlikely to occur. The restriction of access to areas under irrigation with reclaimed water could include the following:
The irrigation site is considered to be remote.
The irrigation site is bordered by walls or fences and access to the site is controlled by the owner/operator of the irrigation site.
The irrigation site is not used by the public during the times when irrigation operations are in progress. Such sites may include golf courses, cemeteries, and landscaped areas surrounding commercial or industrial complexes. The "syringing" or "wetting" of greens and tees on golf courses shall be allowable under Type II so long as the "syringing" is done with hand-held hoses as opposed to automatic irrigation equipment. The public need not be excluded from areas where irrigation is not taking place. For example, irrigation of golf course fairways at night would not prohibit the use of clubhouse or other facilities located a sufficient distance from the irrigation.
The irrigation site is restricted from public access by local ordinance or law with specific standards to achieve such a purpose.
71
Irrigation of food crops where the reclaimed water is not likely to have direct contact with the edible part of the crop, or where the food crop undergoes pasteurization prior to distribution for consumption.
Irrigation of animal feed crops other than pasture for milking animals.
Maintenance of impoundments or natural water bodies where direct human contact is not likely.
Soil compaction or dust control in construction areas where application procedures minimize aerosol drift to public areas.
Cooling tower makeup water. Use for cooling towers which produce significant aerosols adjacent to public access areas may have special requirements.
Irrigation or other non-potable uses of reclaimed water at a wastewater treatment facility.
Type I reclaimed water may be utilized for any of the listed Type II uses.
9.1.3 Reclaimed water system operations
The Design Criteria for Wastewater System (30 TAC§217) and Use of Reclaimed Water (30 TAC §210) contain the regulations affecting the design and operation of reclaimed water systems in Texas. The design, construction and operation of a reclaimed water conveyance system is addressed through 30 TAC§217.51. The reclaimed water system design criteria (§217.69) requires signs and color coding of pipes and appurtenances to indicate the presence of non-potable water and requires a minimum separation distance of 4.0 feet from potable water pipes. Pipe for non-potable systems are required to have a minimum pressure rating of 150 psi. The local regulations for reclaimed water systems should require purple pipe for all reclaimed water piping as an element of the city’s cross-connection control program. Chapter 210 regulations require that hose bibs, faucets, and exposed piping (interior and outside) used for reclaimed water be painted purple and labeled as non-potable. When converting existing buried potable water piping (such as irrigation piping) to reclaimed water, it is not typically required to replace existing piping provided that all visible features, such as irrigation heads, and valve boxes, are changed to purple (Centeno, 2012). Runoff of reclaimed water to waters of the state is to be prevented by the reclaimed water user (30 TAC §210.24), primarily by avoiding excessive irrigation and avoiding storage in ponds directly influenced by storm water runoff. Applying reclaimed water at the proper rate for the existing soil and atmospheric conditions is the principal means of avoiding runoff from irrigated sites. Maintenance of the irrigation system to correct sprinkler head and controller malfunctions is also an essential part of avoiding runoff from irrigated sites. Reclaimed water is virtually indistinguishable from potable water by sight and scent, making cross connection control an essential part of the development or expansion of a reclaimed water system. Chapter 86, Article 9 of the San Marcos Code of Ordinances establishes the regulations for preventing contaminants and pollutants from entering the city's potable water system. This section of the city's ordinances ensures effective cross-connection control, inspection of backflow prevention devices, and conformance with TCEQ reclaimed water regulations.
72
9.2 Water Rights Considerations
As the population of the state and nation grows, wastewater effluent makes up an increasing percentage of the water in streams and rivers. Some estimates suggest that as much as sixty percent of the water that is distributed through a municipal water system for use as potable water is returned to Texas’ streams and rivers as wastewater effluent (TWCA, 2004). These return flows can become part of the water to be appropriated from the watercourse or otherwise considered to be an important part of maintaining the aquatic environment. To appreciate the relationship between water reuse and water rights requires a review of some certain aspects of water law in Texas. It is important to note that once water is returned to a watercourse, it is considered waters of the state and subject to appropriation by the state. The regulatory definition of reuse (30 TAC §297.1) is the authorized use for one or more beneficial purposes that remains unconsumed after the water is used for the original purpose of use and before that water is either disposed of or discharged or otherwise allowed to flow into a watercourse, lake, or other body of state-owned water. Reuse projects are defined in terms of either indirect or direct reuse. Direct reuse is known as “flange-to-flange” reuse in that treated effluent is drawn from the plant before it is discharged to a watercourse. Indirect reuse is when treated effluent is captured downstream from the point at which it was discharged to a watercourse. The diversion and indirect reuse of return flows utilizing from surface water sources is considered to be a new appropriation of state water. The indirect reuse of return flows that are the product of groundwater has not been considered to be a new appropriation. The fundamental difference between direct and indirect water reuse in Texas is that direct reuse does not involve retrieving effluent from a stream or waterway, and thus avoids a new state surface water permitting process. Indirect reuse, on the other hand, does involve a permitting process that may consider the potential negative impacts on downstream water rights holders whose water rights may be based on an assumed reliability or continuation of return flows. Direct reuse, however, involves diversion of effluent for beneficial reuse without being released to a stream or waterway. The Texas Water Code provides the basis for utilities to reuse water without additional water rights permitting until that water is discharged from the wastewater treatment plants:
Except as specifically provided otherwise in the water right, water appropriated under a permit, certified filing, or certificate of adjudication may, prior to its release into a watercourse or stream, be beneficially used and reused by the holder of a permit, certified filing, or certificate of adjudication for the purposes and locations of use provided in the permit, certified filing, or certificate of adjudication. Once water has been diverted under a permit, certified filing, or certificate of adjudication and then returned to a watercourse or stream, however, it is considered surplus water and therefore subject to reservation for instream uses or beneficial inflows or to appropriation by others unless expressly provided otherwise in the permit, certified filing, or certificate of adjudication. [Texas Water Code 30 §11.046(c)]
But if the underlying water right contains limitations on the return of unused water, the reuse of water, either by direct or indirect reuse, can be limited (30 TAC§297.45(a)).
73
Presently, a number of issues related to the direct reuse of treated effluent are currently unresolved, not the least of which is how return flow volumes should be analyzed in the context of protecting existing downstream water rights. Unlike indirect reuse authorizations, direct reuse has historically been unaffected by the issue of downstream water rights.
9.3 Return Flows and Environmental Flows
Return flows are the portion of diverted waters of the state that are not consumed and are returned to a watercourse. Historically, the regulation of return flows has been limited to water quality standards established by the state. But since the passage of Senate Bill 1, the role of return flows in the aquatic environment of a watershed has become a consideration in the indirect reuse permitting process. Presently, since no surface water permitting process is required for direct reuse projects, environmental flows are not a regulatory consideration in defining direct reuse projects. However, the passage of Senate Bill 3 has established processes for each river basin in Texas to develop environmental flow standards specifying flow requirements to maintain a sound ecological environment at various locations within the river basins, as well as estuarine flow requirements for Texas’ coastal estuarine systems. Such standards have been developed and adopted for the Sabine, Neches, Trinity, San Jacinto, Colorado, Lavaca, Guadalupe, and San Antonio river basins, and are in the process of being developed elsewhere. The development of such environmental flow standards has largely been based on statistical analyses of historic hydrologic data in the component watersheds comprising these river basins. Depending upon the watershed and the process employed by the stakeholders and their scientific experts, the historic period of streamflow analyzed may be from conditions in the early 1900’s through recent hydrologic streamflow conditions. It is important to recognize that these historic flows include varying levels of historic return flows. As such, the specified environmental flow criteria within the standard may include an implicit assumption of some level of return flows. Consequently, the adopted environmental flow criteria may potentially impact the availability and reliability of indirect reuse water in a particular watershed. In March 2013, a U.S. District Court judge issued an opinion that the State's management of water rights in the Guadalupe Basin has adversely affected the critical habitat of whooping cranes in the Aransas National Wildlife Refuge on the Texas Gulf Coast (The Aransas Project v. Shaw, 2013). The ruling enjoined TCEQ from issuing new water permits in the Guadalupe River Basin until the State can assure the Court that permits will not violate the Endangered Species Act by "taking" whooping cranes. The court also ordered the TCEQ to seek a Habitat Conservation Plan (HCP) that could result in an incidental take permit. While the Court ruling is subject to appeal, current state and federal regulations affecting environmental flows in the San Marcos River remain in effect and do not affect the development or expansion of direct reuse projects.
9.4 Interlocal Agreements
Under Chapter 791 of the Texas Government Code, local governments are authorized to contract with agencies of the state for a broad range of governmental functions and services. An interlocal agreement (ILA) can include a broad range of administrative and governmental

74
functions and services in which the participating agencies share an interest. As presented in Section 7, development of a diversion point at the WWTP for university water rights presents the advantages of a lower cost of reclaimed water while meeting the maximum day demands of all users and would allow the maximum volume of water to remain in the San Marcos River through the areas of critical habitat during all sprinflow regimes. An ILA would provide the framework for the cooperative agreement between the city and university.
75
10 Implementation Strategy A plan to expand the reclaimed water system in the City of San Marcos would focus on optimizing the reclaimed water pipeline alignments to efficiently serve industrial, commercial, and public reclaimed water demands. The implementation strategy summarizes the various actions and a proposed schedule to develop a program for design, construction, and operation of an expanded reclaimed water system. Development of an expanded reclaimed water system will involve identifying viable alternatives for capital funding, implementation of appropriate policies and procedures and adoption or modification of existing ordinances. Expansion of reclaimed water service will require application of the management, operation, and maintenance procedures and processes presently in use in the city's water and wastewater utilities.
10.1 Financial Status of the City
This section summarizes the city's financial capability for undertaking a project that will expand the reclaimed water system. A more thorough analysis of the financial capacity of the city would be developed before the city prepares applications for grants or low interest loans. The city's economy remained relatively stable during the recession that began in 2008. According to the city's 2012 Comprehensive Annual Financial Report (CAFR), tourism, retail and construction activities continue to show signs of growth with the local community benefitting from a stable, diversified economic base that includes a major university, a regional retail center, and tourist destination. Low mortgage interest rates and new residential developments in San Marcos added more than $131 million (4.8%) in new valuations to the property tax roll in 2012 with $80 million of that total being new construction. The city maintains a targeted economic development effort that focuses on industry segments that complement the existing business mix. The city's underlying credit rating was confirmed by Standard & Poor’s in October 2012. The city’s bond rating for revenue bonds for its water and sewer utility operations is A1 by Moody's Investor Services and AA- by Standard & Poor's. The city's water and wastewater utility has gross revenues of approximately $28.1 million in FY 2012, with M&O expenses of $15.3 million. Revenue bond coverage for FY 2012 was 1.28 percent.
10.2 Implementation Schedule
Project implementation should proceed in a logical, step-by-step approach, beginning with a public and political consensus on the need for the project and the framework in which the project would be developed. The initial steps toward implementation should include:
1. Secure inclusion of the reclaimed water expansion project in the Region L Regional Water Plan and the State Water Plan.
76
2. Conduct a review of establishing a diversion point for TxSt water rights at the WWTP. The review should include TCEQ, USFWS, and EAA in addition to TxSt and the City of San Marcos.
3. Initiate meetings through youth sports leagues, HOAs, and civic associations to disseminate information regarding the purposes of reclaimed water and the project costs.
4. Negotiate commitments for reclaimed water with potential users.
5. Incorporate the project into the city’s CIP.
6. Seek funding opportunities and partnership with regional entities.
7. Public outreach should continue throughout the implementation process with the following key elements:
a. Involve the public throughout the project implementation with opportunities for comment. Managing expectations becomes more than answering whether the project is on budget and on schedule, it is also important to provide a clear reminder that the primary purpose of the project is to expand the city's water supply.
b. Address public concerns that arise with complete candor using all available scientific and regulatory information.
10.2.1 Project Implementation
The following summarizes the schedule for implementing the reclaimed water system expansion project:
2013
1. Conduct a review of the feasibility study with the City Council.
2. Disseminate public information and conduct public meetings on the findings of the feasibility study.
3. Outline additions and revisions to the code of ordinances and utility policies and procedures.
4. Negotiate commitments for reclaimed water use with public and private sector users.
5. Begin development of a project funding plan, including debt issuance schedule and application for state or federal grants and/or loans.
6. Initiate a request to amend the Region L Regional Water Plan and State Water Plan to include the reclaimed water system expansion as a recommended water management strategy for the City of San Marcos.
2014
1. Incorporate the reclaimed water system project and park irrigation systems into the CIP.
2. Disseminate public information regarding project schedule and funding.
3. Develop amendments to city ordinances, policies and procedures for reclaimed water use.
4. Complete project funding plan. Establish schedule for debt issuance and applications for state or federal grants and/or loans.
5. Complete negotiations for reclaimed water user commitments.
6. Complete the design of the Phase 1 extension to Texas State University.
77
7. Obtain TxDOT and railroad permits for pipeline crossings.
8. Complete environmental and cultural resources assessments.
9. Design Phase 1 facilities.
10. Obtain authorizations required under 30 TAC §210.
2015
1. Begin construction of Phase 1 facilities.
2. Develop funding plans for park irrigation systems.
2016
1. Design park irrigation systems for Phase 2.
2017
1. Begin installation of park irrigation systems to receive reclaimed water.
2. Install Phase 2 high service pump.
2019
1. Obtain TxDOT and railroad permits for pipeline crossings for Phase 3.
2. Complete environmental and cultural resources assessments.
3. Complete design of Phase 3 extension to Gary Ball Fields.
2020
1. Begin construction of Phase 3.
2030
1. Begin design of Phase 4 extension to the San Marcos soccer complex.
2. Obtain TxDOT and railroad permits for pipeline crossings for Phase 4.
3. Complete environmental and cultural resources assessments.
2031
1. Begin construction of Phase 4.
10.3 Project Funding Alternatives
This section presents a summary of potential funding opportunities for expansion of the reclaimed water system and a discussion of the administrative issues to be addressed as part of implementation planning. Implementation of the reclaimed water utility can occur in phases to take advantage of the full capacity of the existing system. The actual scope and timing of each phase will depend on development of user facilities and the availability of funding for construction of the necessary infrastructure. The terms “financial” and “economic” analysis are often used interchangeably when discussing project implementation. However, the terms describe very different aspects of project implementation in that a project can be economically viable, but due to lack of funds, financially infeasible. Economic analysis refers to the evaluation on a societal level of costs and benefits of a project. When benefits equal or exceed costs for a project, the project is deemed economically viable. To be financially viable, a project must have the funds necessary for implementation including construction, operation and maintenance (O&M), and recurring costs.
78
This summary of funding opportunities is intended to address the financial viability of a reclaimed water system by identifying and describing funding sources that can assist in funding the implementation of the project. It should be noted that timing is a significant factor when seeking multiple funding sources. Funding sources may not have available funds or the application dates may occur before a project has the necessary information available to submit an application. This section summarizes the major funding sources with potential for application in implementing recycled water projects. The local, state, and federal government funding mechanisms for reclaimed water projects are summarized below. Project funding mechanisms for capital projects typically involve:
Cash (collected as user fees or general revenue)
Bonds and Certificates of Obligation
State Revolving Fund (Loans)
Grants
These types of funding mechanisms are also applicable to reclaimed water projects. A brief description of these types of funding mechanisms is provided below. Cash: Cash includes revenues from operations and ad valorem taxes plus interest income minus operating expenses and debt service charges. The sources of revenues could include utility service charges and property taxes. Bonds and Certificates of Obligation: There are two types of bonds available to support reclaimed water projects. Revenue bonds are those funded by the service fees and charges paid by the city's utility customers. General obligation bonds that are guaranteed by the property taxing authority of the city are another common debt instrument. Under Chapter 271 of the Local Government Code, cities are authorized to issue certificates of obligation (CO) that are guaranteed by the taxing authority of the city. Loans: Loans are available from a variety of sources including the state Clean Water Revolving Fund (CWSRF) and the Water Infrastructure Fund (WIF). SRF loans are administered by the Texas Water Development Board and are intended to fund a variety of projects. SRF programs can offer low interest loans, as well as refinancing of existing debt under certain conditions. Grants: Grants are typically money from governmental agencies for specific projects and require no repayment. Potential State Funding Mechanisms The following sections describe specific state programs that may be available for implementing a reclaimed water system.
79
Texas Water Development Board (TWDB)
Clean Water State Revolving Fund and Drinking Water State Revolving Fund
Both the Clean Water State Revolving Fund (CWSRF) and Drinking Water State Revolving Fund (DWSRF) provide loans at below-market interest rates for planning, designing, and constructing wastewater and water utility infrastructure, including water reuse projects. Prospective loan applicants submit project information to TWDB that describes their existing facilities, facility needs, the nature of the project being considered, and project cost estimates. This information is used to rate each proposed project and place prospective projects in priority order on the project priority list in the Intended Use Plans. Fundable projects lists for the CWSRF and DRWSRF are established, and available funds are distributed in accordance with the funding order specified in the Intended Use Plans. All applicants on the fundable projects lists are notified and invited to submit complete applications within three months of the date of the invitation letter. Applicants are encouraged to schedule a pre-application conference that will guide them through the CWSRF and DRWSR application processes. The fundable projects lists are revised as projects decline or funding becomes available. Invitations are then sent to the next eligible applicant on the lists. The CWSRF offers fixed rate loans at subsidized interest rates with a maximum loan repayment period of 30 years from the completion of project construction. A cost-recovery loan origination fee of 1.85% is imposed to cover administrative costs of operating the Fund. Applicants have the option to finance the origination fee in their loan. The DWSRF offers similar loan arrangements, but with a maximum repayment period of 20 years and a 2.25% loan origination fee. The TWDB offers subsidies to applicants in the form of loan forgiveness (similar to grants) on a limited basis. In order to receive loan forgiveness, applicants must be included in the Intended Use Plan (IUP) as an eligible Green Project Reserve (GPR) project and be invited to apply for the subsidy. The GPR is intended to fund projects that:
utilize green or soft-path practices to complement and augment hard or gray infrastructure,
adopt practices that reduce the environmental footprint of water and wastewater treatment, collection, and distribution,
help utilities adapt to climate change,
promote innovative approaches to water management problems
The GPR can be used for planning, design, and/or construction activities that advance one or more of the objectives in the categories of Green Infrastructure, Water Efficiency, Energy Efficiency, and Environmentally Innovative. Water reuse is among the projects considered as categorically qualified for GPR funding. Categorically qualified projects must demonstrate at savings in energy, an increase in water efficiency, or utilize green stormwater practices that demonstrate new or innovative approaches to sustainable water management.
Water Infrastructure Fund (WIF)
Projects must be specifically recommended water management strategies in the most recent TWDB approved regional water plan or approved State Water Plan. A semi-annual priority
80
rating process applies. Loans for planning, design, and construction can be funded through the WIF. All loans through the WIF are offered at a subsidized interest rate that was most recently 100 basis points below the TWDB cost of funds. Repayment periods are a maximum of 20 years. Presently, the WIF has no available funds until appropriations are received from the Legislature
Water Development Fund II (DFund)
The DFund can be used for planning, acquisition and construction of water related infrastructure, including water supply, wastewater treatment, stormwater and nonpoint source pollution control, flood control, reservoir construction, storage acquisition, and agricultural water conservation projects, and municipal solid waste facilities. This is essentially a pure state loan program that does not receive Federal subsidies, and is the more streamlined of the agency programs. The interest rate on a Texas Water Development Fund loan varies depending on market conditions, with bonds sold by TWDB as needed to fund eligible projects. Currently, the lending rate scales are set 0.40 percent above the TWDB’s borrowing cost.
State Water Implementation Fund for Texas (SWIFT)
The SWIFT is part of a broad package of legislation from the 83rd Legislature developed to provide state funding for projects in the State Water Plan. Approved by voters on November 5, 2013 as an amendment to the Texas Constitution, initial funding of the SWIFT is by way of $2 billion from the economic stabilization fund. The legislation references funding projects on the 2011 regional water plan list, but the draft 2016 lists will be available about the same time the SWIFT funds become available. Adoption of the TWDB rules for SWIFT is expected by March 2015. The subsidy for the SWIFT will be established over the next 18 months. The subsidy is capped so that entities, such as local governments, will have to pay at least half of the interest rate for TWDB’s cost of funds. The regional water planning group (RWPG) stakeholder committee is scheduled to submit project prioritization criteria to the TWDB by December 1, 2013. Loan rates are yet to be determined, but could be similar to the WIF, that is 1 percent below the TWDB costs of funds.
Edwards Aquifer Authority (EAA)
Conservation Grants
The Authority's Groundwater Conservation Grant Program, introduced in 2009, is an annual program to improve water use efficiency across the region. Through this program, municipal Edwards Aquifer permit holders can apply to the Authority for grant funding to cover up to half the projected costs of qualified conservation programs and Best Management Practices (BMPs) that result in savings of Edwards groundwater. Funding has been limited to about $300,000 per year.
U.S. Bureau of Reclamation (Reclamation)
Reclamation Wastewater and Groundwater Study and Facilities (Title XVI)
Reclamation provides funding for both the planning and construction of water recycling projects. Planning funds may be made available for either appraisal or feasibility level study efforts.
81
Currently, Reclamation funds for water recycling and reuse are appropriated under the authority of the Reclamation Wastewater and Groundwater Study and Facilities Act of 1992 (Title XVI of Public Law 102-575 as amended). Reclamation funding for Title XVI is subject to the availability of congressionally appropriated funds. Generally, Title XVI authorizes the Federal government to fund up to 25 percent of the capital cost of authorized water recycling projects, up to a maximum of $20 million per project. Federal construction funds are provided only for projects specifically authorized by Congress pursuant to the various sections of Title XVI. Reclamation makes funding recommendations on construction of authorized projects in the President’s annual budget request to Congress. Projects not yet authorized for construction require specific congressional authorization before Congress can appropriate funds through the Title XVI program. Before Congress will authorize a project that meets the definition in Title XVI, the following prerequisites must be met:
A feasibility report that complies with the provision of Title XVI must be completed by Reclamation or the non-Federal project sponsor.
The Secretary of Interior has determined that the non-Federal project sponsor is financially capable of funding its share of the project costs.
Project compliance with the National Environmental Policy Act and other environmental laws.
The Secretary of Interior has approved a cost-sharing agreement with the non- Federal project sponsor that commits the non-Federal project sponsor to funding its proportionate share of the project construction costs on an annual basis.
Reclamation does not make recommendations to Congress on Title XVI project authorizations. Project sponsors must work with their local Congressional delegation to receive project authorization. When and if a project is authorized, project sponsors will be eligible to receive competitive grants under the WaterSMART program, contingent upon appropriations. Project sponsors should coordinate with their local Reclamation office to find out about the status of program funding. Depending on the number of funding requests, a delay of several years may be expected due to the Congressional pace and schedule. Continuation of funding from one fiscal year to the next may also be an issue as it is at the discretion of Congress. Also, due to limited budgets, not all projects may receive a full 25 percent federal participation. In accordance with Title XVI and other federal laws, priority will be given by Reclamation to projects that:
reduce, postpone, or eliminate development of new or expanded water supplies;
reduce or eliminate the use of existing diversions from natural watercourses;
reduce the demand on existing federal water supply facilities;
improve surface or groundwater quality, or the quality of effluent discharges, except where the purpose is to meet surface discharge requirements;
82
help fulfill Reclamation’s legal and contractual water supply obligations;
serve the federal environmental interests in restoring and enhancing habitats and providing water for federally threatened and endangered species;
promote and apply a regional or watershed perspective;
serve a small, rural, or economically disadvantaged community; and
provide significant economic benefits.
10.4 Project Implementation Considerations
This section discusses some of the additional administrative actions involved in expanding the reclaimed water system.
10.4.1 Chapter 210 Reclaimed Water Use Notification
Chapter 210 regulations (30 TAC §210) assign specific responsibilities to the reclaimed water producer, the reclaimed water provider, and the reclaimed water user. The specific responsibilities of each party as designated by the Chapter 210 regulations are summarized in the following points.
The responsibilities of the city as the reclaimed water producer include ensuring that the quality of the reclaimed water that leaves the treatment process meets the minimum quality prescribed by state regulations, and for sampling, analyzing, and reporting the quality of reclaimed water produced.
As the reclaimed water provider, the city is also responsible for the delivery of reclaimed water to the user that meets the minimum quality prescribed by state regulations and for maintaining records of the volume and quality of reclaimed water delivered to the user.
Each reclaimed water user is responsible for the proper use of reclaimed water.
10.4.2 Policies and Procedures
The current reclaimed water policies are codified in the city’s code of ordinances. The policies and procedures provide guidance for the installation, operation and maintenance of both city-owned facilities and customer facilities. The following list includes several additional policies and procedures to consider as part of the project implementation.
Reclaimed water system design specifications;
Site inspection authority;
Enforcement policies;
Cost recovery policies and pricing structure;
Reclaimed water system standard operating procedures;
System record keeping and reporting procedures;
Emergency procedures plan; and
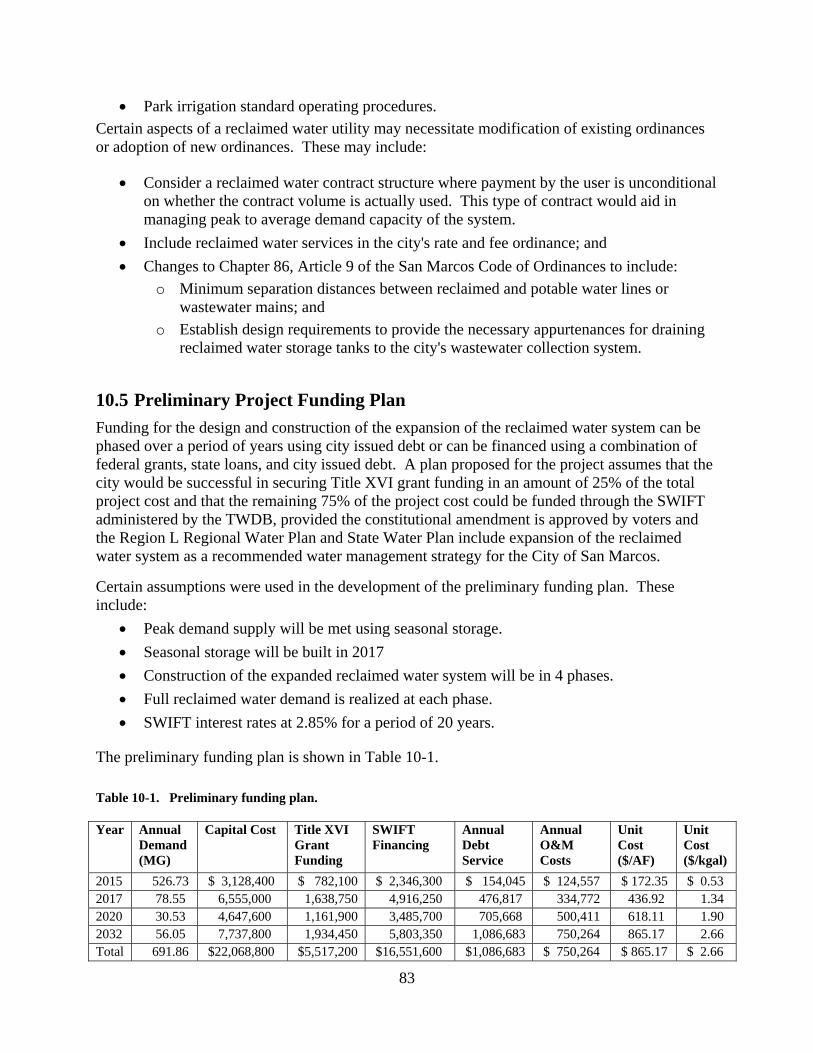
83
Park irrigation standard operating procedures.
Certain aspects of a reclaimed water utility may necessitate modification of existing ordinances or adoption of new ordinances. These may include:
Consider a reclaimed water contract structure where payment by the user is unconditional on whether the contract volume is actually used. This type of contract would aid in managing peak to average demand capacity of the system.
Include reclaimed water services in the city's rate and fee ordinance; and
Changes to Chapter 86, Article 9 of the San Marcos Code of Ordinances to include:
o Minimum separation distances between reclaimed and potable water lines or wastewater mains; and
o Establish design requirements to provide the necessary appurtenances for draining reclaimed water storage tanks to the city's wastewater collection system.
10.5 Preliminary Project Funding Plan
Funding for the design and construction of the expansion of the reclaimed water system can be phased over a period of years using city issued debt or can be financed using a combination of federal grants, state loans, and city issued debt. A plan proposed for the project assumes that the city would be successful in securing Title XVI grant funding in an amount of 25% of the total project cost and that the remaining 75% of the project cost could be funded through the SWIFT administered by the TWDB, provided the constitutional amendment is approved by voters and the Region L Regional Water Plan and State Water Plan include expansion of the reclaimed water system as a recommended water management strategy for the City of San Marcos.
Certain assumptions were used in the development of the preliminary funding plan. These include:
Peak demand supply will be met using seasonal storage.
Seasonal storage will be built in 2017
Construction of the expanded reclaimed water system will be in 4 phases.
Full reclaimed water demand is realized at each phase.
SWIFT interest rates at 2.85% for a period of 20 years.
The preliminary funding plan is shown in Table 10-1.
Table 10-1. Preliminary funding plan.
Year Annual Demand (MG)
Capital Cost Title XVI Grant Funding
SWIFT Financing
Annual Debt Service
Annual O&M Costs
Unit Cost ($/AF)
Unit Cost ($/kgal)
2015 526.73 $ 3,128,400 $ 782,100 $ 2,346,300 $ 154,045 $ 124,557 $ 172.35 $ 0.53 2017 78.55 6,555,000 1,638,750 4,916,250 476,817 334,772 436.92 1.34 2020 30.53 4,647,600 1,161,900 3,485,700 705,668 500,411 618.11 1.90 2032 56.05 7,737,800 1,934,450 5,803,350 1,086,683 750,264 865.17 2.66 Total 691.86 $22,068,800 $5,517,200 $16,551,600 $1,086,683 $ 750,264 $ 865.17 $ 2.66
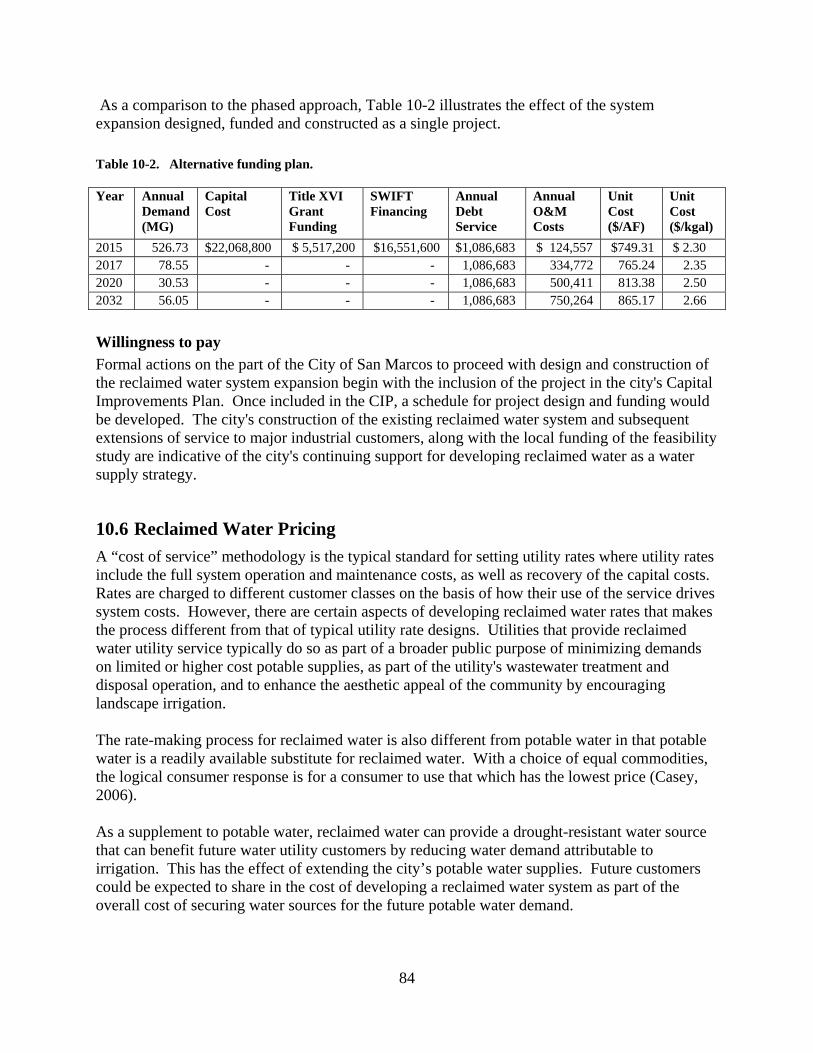
84
As a comparison to the phased approach, Table 10-2 illustrates the effect of the system expansion designed, funded and constructed as a single project.
Table 10-2. Alternative funding plan.
Year Annual Demand (MG)
Capital Cost
Title XVI Grant Funding
SWIFT Financing
Annual Debt Service
Annual O&M Costs
Unit Cost ($/AF)
Unit Cost ($/kgal)
2015 526.73 $22,068,800 $ 5,517,200 $16,551,600 $1,086,683 $ 124,557 $749.31 $ 2.30 2017 78.55 - - - 1,086,683 334,772 765.24 2.35 2020 30.53 - - - 1,086,683 500,411 813.38 2.50 2032 56.05 - - - 1,086,683 750,264 865.17 2.66
Willingness to pay
Formal actions on the part of the City of San Marcos to proceed with design and construction of the reclaimed water system expansion begin with the inclusion of the project in the city's Capital Improvements Plan. Once included in the CIP, a schedule for project design and funding would be developed. The city's construction of the existing reclaimed water system and subsequent extensions of service to major industrial customers, along with the local funding of the feasibility study are indicative of the city's continuing support for developing reclaimed water as a water supply strategy.
10.6 Reclaimed Water Pricing
A “cost of service” methodology is the typical standard for setting utility rates where utility rates include the full system operation and maintenance costs, as well as recovery of the capital costs. Rates are charged to different customer classes on the basis of how their use of the service drives system costs. However, there are certain aspects of developing reclaimed water rates that makes the process different from that of typical utility rate designs. Utilities that provide reclaimed water utility service typically do so as part of a broader public purpose of minimizing demands on limited or higher cost potable supplies, as part of the utility's wastewater treatment and disposal operation, and to enhance the aesthetic appeal of the community by encouraging landscape irrigation. The rate-making process for reclaimed water is also different from potable water in that potable water is a readily available substitute for reclaimed water. With a choice of equal commodities, the logical consumer response is for a consumer to use that which has the lowest price (Casey, 2006). As a supplement to potable water, reclaimed water can provide a drought-resistant water source that can benefit future water utility customers by reducing water demand attributable to irrigation. This has the effect of extending the city’s potable water supplies. Future customers could be expected to share in the cost of developing a reclaimed water system as part of the overall cost of securing water sources for the future potable water demand.

85
10.7 Research Needs
Expansion of the San Marcos reclaimed water system will not require additional research in order to implement the project. The proposed project is developed to rely on proven technologies for the treatment, pumping, and transmission of reclaimed water.

86
This page is intentionally blank
87
11 References
American Water Works Association. Planning for the Distribution of Reclaimed Water - M24, Third Edition, 2009, Denver, CO: American Water Works Association.
American Water Works Association. Water Reuse Rates and Charges Survey Results, 2008, Denver, CO; American Water Works Association.
Alan Plummer Associates, Inc. (APAI), 2003, Reclaimed Water Technical Memorandum, City of San Marcos.
Alan Plummer Associates, Inc. (APAI), 2004, Draft Reclaimed Water Distribution System Evaluation, City of San Marcos.
Bowdan, Joel and Rahimian-Pour, Ali. 2012, Going “Green” Utilizing a Pretreatment Process for Recycled Water Use in Cooling Towers, WateReuse, San Diego.
Casey, C., R. Schmalz, R. Lockridge, T. Cristiano. “The Grass is Always Greener…Building Consensus on Reclaimed Water Pricing for Jointly Operated Municipal Reclaimed Water Systems.” 2006, Water Environment Federation.
City of San Jose, San Jose/Santa Clara Water Pollution Control Plant, Guidelines for Managing Water in Cooling Systems for Owners, Operators, and Environmental Managers, July 2002
Centeno, J. TCEQ, May 3, 2012, telephone communication.
Crompton, J.L., 2010. Measuring the Economic Impact of Park and Recreation Services: National Recreation and Park Association.
LeSage, James P., September 2007, The Economic Impact of Texas State University-San Marcos, Department of Finance and Economics, Texas State University, San Marcos, Texas.
Turner Collie & Braden, Inc. (TCB), 2004, City of San Marcos Water Supply Master Plan.
Recon Environmental, Inc. et al. 2012. Habitat Conservation Plan. For the Edwards Aquifer Recover Implementation Program, November 2012.
Riley, Charles, 2008, Water Quality Assessment of the Use of Reclaimed Water for Evaporative Cooling Tower Makeup, NC AWWA-WEA.
South Central Texas Regional Water Planning Group (SCTRWPG), 2011 South Central Texas Regional Water Plan. September 2010.
Texas Administrative Code (TAC) Title 30, Part 1, Chapter 210, Use of Reclaimed Water.
Texas Administrative Code (TAC) Title 30, Part 1, Chapter 217. Design Criteria for Domestic Wastewater Systems.
Texas Administrative Code (TAC) Title 30, Part 1, Chapter 321, Subchapter P, Reclaimed Water Production Facilities.
Texas Administrative Code (TAC) Title 30, Part 1, Chapter 344, Subchapter F, Standards for Designing, Installing, and Maintaining Landscape Irrigation Systems
The Aransas Project v. Shaw, Et. al. U.S. District Court, Southern District of Texas, Corpus Christi Division. 11 Mar. 2013. Print.
88
Texas Water Conservation Association (TWCA), “Texas Water Rights and Wastewater Reuse,” Whitepaper, 2004.
Texas Water Development Board (TWDB), “Water Conservation Best Management Practices Guide,” Water Conservation Implementation Task Force, Report 362. November 2004.
U.S. Army Corps of Engineers (USACE), "Draft Biological Assessment, San Marcos Section 206 Aquatic Ecosystem Restoration Project," May 2013.
U.S. Environmental Protection Agency (EPA), “Water Recycling and Reuse: The Environmental Benefits.” Available at: http://www.epa.gov/region9/water/recycling/
U.S. Environmental Protection Agency (EPA), Municipal Support Division, Office of Wastewater Management, 2004, Guidelines for Water Reuse (EPA/625/R-04/108), Washington, DC: Technology Transfer and Support Division.
U.S. Fish and Wildlife Service (USFWS). 1984. "San Marcos River Recovery Plan." U.S. Fish and Wildlife Service, Albuquerque, New Mexico.
Walsh, P.M., M.E. Barrett, J.F. Malina, and R.J. Charbeneau, 1998, Use of Vegetative Controls for Treatment of Highway Runoff, Research Report 2954-2, Research Project 7-2954 Texas Department of Transportation. Prepared by Center for Transportation Research at The University of Texas at Austin.

89
12 Appendices

90
This page is intentionally blank
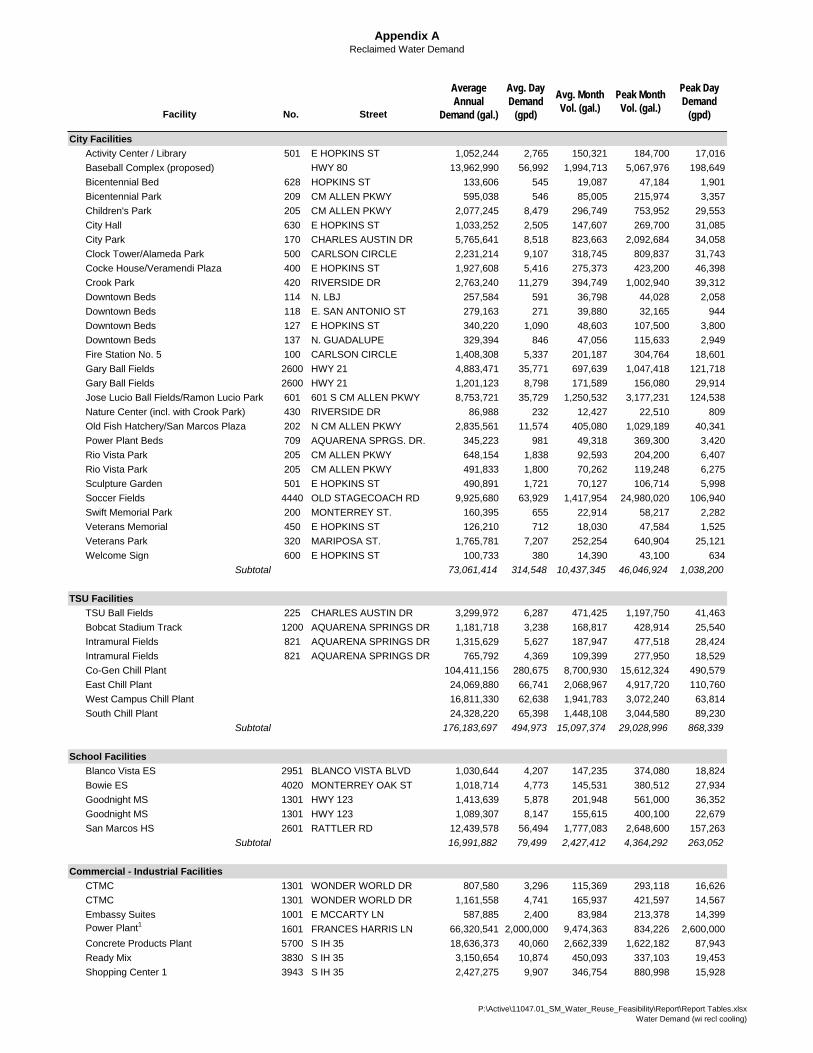
Appendix AReclaimed Water Demand
Facility No. Street
City Facilities
Activity Center / Library 501 E HOPKINS ST 1,052,244 2,765 150,321 184,700 17,016Baseball Complex (proposed) HWY 80 13,962,990 56,992 1,994,713 5,067,976 198,649Bicentennial Bed 628 HOPKINS ST 133,606 545 19,087 47,184 1,901Bicentennial Park 209 CM ALLEN PKWY 595,038 546 85,005 215,974 3,357Children's Park 205 CM ALLEN PKWY 2,077,245 8,479 296,749 753,952 29,553City Hall 630 E HOPKINS ST 1,033,252 2,505 147,607 269,700 31,085City Park 170 CHARLES AUSTIN DR 5,765,641 8,518 823,663 2,092,684 34,058Clock Tower/Alameda Park 500 CARLSON CIRCLE 2,231,214 9,107 318,745 809,837 31,743Cocke House/Veramendi Plaza 400 E HOPKINS ST 1,927,608 5,416 275,373 423,200 46,398Crook Park 420 RIVERSIDE DR 2,763,240 11,279 394,749 1,002,940 39,312Downtown Beds 114 N. LBJ 257,584 591 36,798 44,028 2,058Downtown Beds 118 E. SAN ANTONIO ST 279,163 271 39,880 32,165 944Downtown Beds 127 E HOPKINS ST 340,220 1,090 48,603 107,500 3,800Downtown Beds 137 N. GUADALUPE 329,394 846 47,056 115,633 2,949Fire Station No. 5 100 CARLSON CIRCLE 1,408,308 5,337 201,187 304,764 18,601Gary Ball Fields 2600 HWY 21 4,883,471 35,771 697,639 1,047,418 121,718Gary Ball Fields 2600 HWY 21 1,201,123 8,798 171,589 156,080 29,914Jose Lucio Ball Fields/Ramon Lucio Park 601 601 S CM ALLEN PKWY 8,753,721 35,729 1,250,532 3,177,231 124,538Nature Center (incl. with Crook Park) 430 RIVERSIDE DR 86,988 232 12,427 22,510 809Old Fish Hatchery/San Marcos Plaza 202 N CM ALLEN PKWY 2,835,561 11,574 405,080 1,029,189 40,341Power Plant Beds 709 AQUARENA SPRGS. DR. 345,223 981 49,318 369,300 3,420Rio Vista Park 205 CM ALLEN PKWY 648,154 1,838 92,593 204,200 6,407Rio Vista Park 205 CM ALLEN PKWY 491,833 1,800 70,262 119,248 6,275Sculpture Garden 501 E HOPKINS ST 490,891 1,721 70,127 106,714 5,998Soccer Fields 4440 OLD STAGECOACH RD 9,925,680 63,929 1,417,954 24,980,020 106,940Swift Memorial Park 200 MONTERREY ST. 160,395 655 22,914 58,217 2,282Veterans Memorial 450 E HOPKINS ST 126,210 712 18,030 47,584 1,525Veterans Park 320 MARIPOSA ST. 1,765,781 7,207 252,254 640,904 25,121Welcome Sign 600 E HOPKINS ST 100,733 380 14,390 43,100 634
Subtotal 73,061,414 314,548 10,437,345 46,046,924 1,038,200
TSU Facilities
TSU Ball Fields 225 CHARLES AUSTIN DR 3,299,972 6,287 471,425 1,197,750 41,463Bobcat Stadium Track 1200 AQUARENA SPRINGS DR 1,181,718 3,238 168,817 428,914 25,540Intramural Fields 821 AQUARENA SPRINGS DR 1,315,629 5,627 187,947 477,518 28,424Intramural Fields 821 AQUARENA SPRINGS DR 765,792 4,369 109,399 277,950 18,529Co-Gen Chill Plant 104,411,156 280,675 8,700,930 15,612,324 490,579East Chill Plant 24,069,880 66,741 2,068,967 4,917,720 110,760West Campus Chill Plant 16,811,330 62,638 1,941,783 3,072,240 63,814South Chill Plant 24,328,220 65,398 1,448,108 3,044,580 89,230
Subtotal 176,183,697 494,973 15,097,374 29,028,996 868,339
School Facilities
Blanco Vista ES 2951 BLANCO VISTA BLVD 1,030,644 4,207 147,235 374,080 18,824Bowie ES 4020 MONTERREY OAK ST 1,018,714 4,773 145,531 380,512 27,934Goodnight MS 1301 HWY 123 1,413,639 5,878 201,948 561,000 36,352Goodnight MS 1301 HWY 123 1,089,307 8,147 155,615 400,100 22,679San Marcos HS 2601 RATTLER RD 12,439,578 56,494 1,777,083 2,648,600 157,263
Subtotal 16,991,882 79,499 2,427,412 4,364,292 263,052
Commercial - Industrial Facilities
CTMC 1301 WONDER WORLD DR 807,580 3,296 115,369 293,118 16,626CTMC 1301 WONDER WORLD DR 1,161,558 4,741 165,937 421,597 14,567Embassy Suites 1001 E MCCARTY LN 587,885 2,400 83,984 213,378 14,399Power Plant1 1601 FRANCES HARRIS LN 66,320,541 2,000,000 9,474,363 834,226 2,600,000Concrete Products Plant 5700 S IH 35 18,636,373 40,060 2,662,339 1,622,182 87,943Ready Mix 3830 S IH 35 3,150,654 10,874 450,093 337,103 19,453Shopping Center 1 3943 S IH 35 2,427,275 9,907 346,754 880,998 15,928
Peak Day Demand
(gpd)
Average Annual
Demand (gal.)
Avg. Day Demand
(gpd)
Avg. Month Vol. (gal.)
Peak Month Vol. (gal.)
P:\Active\11047.01_SM_Water_Reuse_Feasibility\Report\Report Tables.xlsxWater Demand (wi recl cooling)
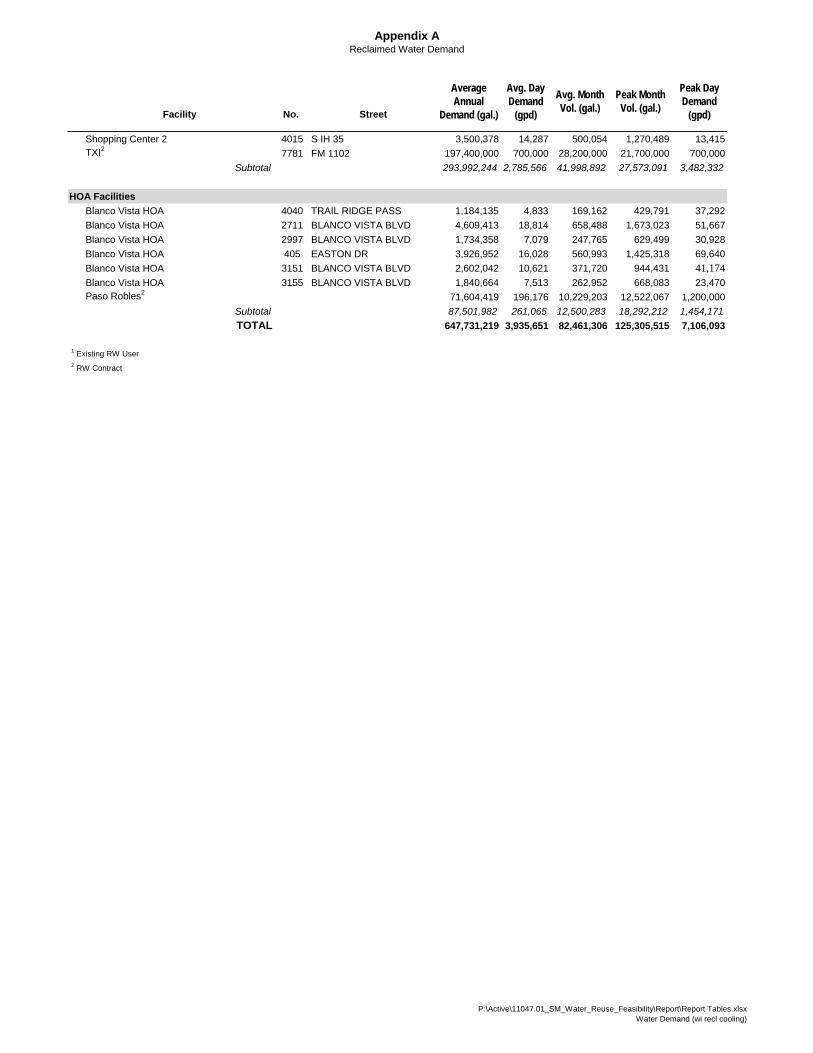
Appendix AReclaimed Water Demand
Facility No. Street
Peak Day Demand
(gpd)
Average Annual
Demand (gal.)
Avg. Day Demand
(gpd)
Avg. Month Vol. (gal.)
Peak Month Vol. (gal.)
Shopping Center 2 4015 S IH 35 3,500,378 14,287 500,054 1,270,489 13,415TXI2 7781 FM 1102 197,400,000 700,000 28,200,000 21,700,000 700,000
Subtotal 293,992,244 2,785,566 41,998,892 27,573,091 3,482,332
HOA Facilities
Blanco Vista HOA 4040 TRAIL RIDGE PASS 1,184,135 4,833 169,162 429,791 37,292Blanco Vista HOA 2711 BLANCO VISTA BLVD 4,609,413 18,814 658,488 1,673,023 51,667Blanco Vista HOA 2997 BLANCO VISTA BLVD 1,734,358 7,079 247,765 629,499 30,928Blanco Vista HOA 405 EASTON DR 3,926,952 16,028 560,993 1,425,318 69,640Blanco Vista HOA 3151 BLANCO VISTA BLVD 2,602,042 10,621 371,720 944,431 41,174Blanco Vista HOA 3155 BLANCO VISTA BLVD 1,840,664 7,513 262,952 668,083 23,470Paso Robles2 71,604,419 196,176 10,229,203 12,522,067 1,200,000
Subtotal 87,501,982 261,065 12,500,283 18,292,212 1,454,171
TOTAL 647,731,219 3,935,651 82,461,306 125,305,515 7,106,093
1 Existing RW User 2 RW Contract
P:\Active\11047.01_SM_Water_Reuse_Feasibility\Report\Report Tables.xlsxWater Demand (wi recl cooling)
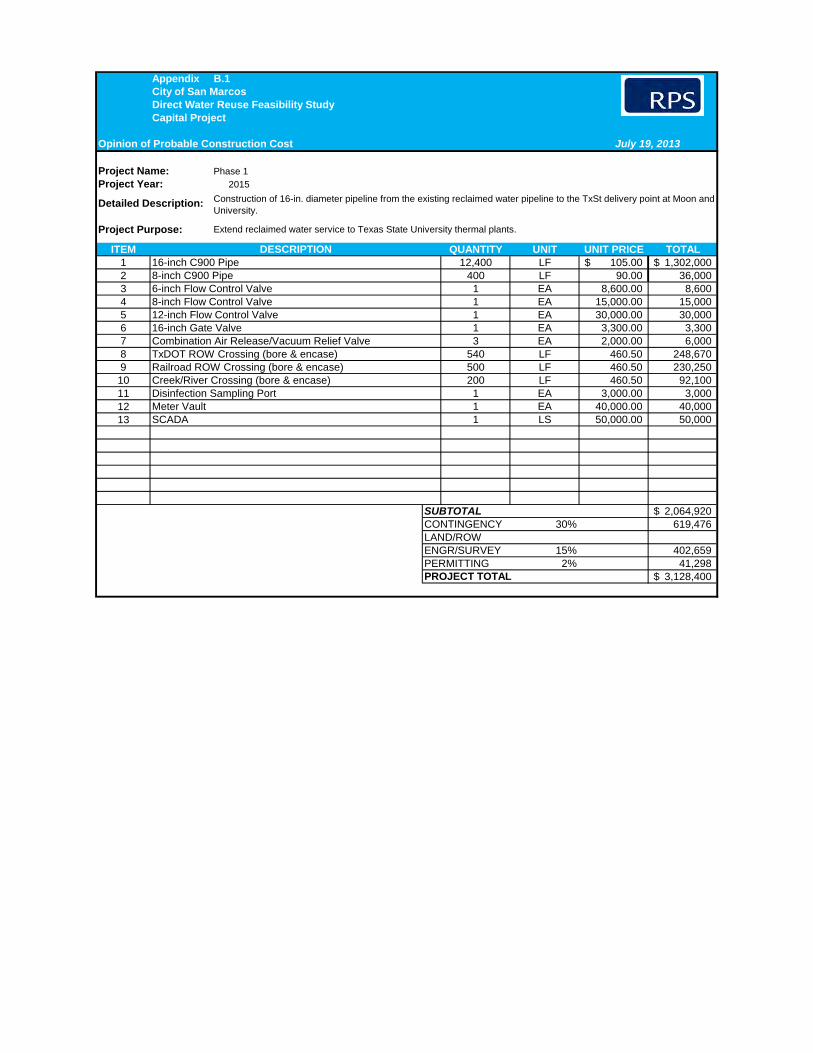
Appendix B.1
Project Name:Project Year: 2015
ITEM QUANTITY UNIT UNIT PRICE TOTAL1 12,400 LF 105.00$ 1,302,000$ 2 400 LF 90.00 36,000 3 1 EA 8,600.00 8,600 4 1 EA 15,000.00 15,000 5 1 EA 30,000.00 30,000 6 1 EA 3,300.00 3,300 7 3 EA 2,000.00 6,000 8 540 LF 460.50 248,670 9 500 LF 460.50 230,250 10 200 LF 460.50 92,100 11 1 EA 3,000.00 3,000 12 1 EA 40,000.00 40,000 13 1 LS 50,000.00 50,000
2,064,920$ 30% 619,476
15% 402,659 2% 41,298
3,128,400$
8-inch Flow Control Valve12-inch Flow Control Valve
LAND/ROWENGR/SURVEY
SCADA
Combination Air Release/Vacuum Relief Valve
PROJECT TOTAL
Meter Vault
TxDOT ROW Crossing (bore & encase)
16-inch Gate Valve
Disinfection Sampling Port
Railroad ROW Crossing (bore & encase)Creek/River Crossing (bore & encase)
PERMITTING
SUBTOTALCONTINGENCY
16-inch C900 Pipe
6-inch Flow Control Valve8-inch C900 Pipe
Phase 1
Detailed Description: Construction of 16-in. diameter pipeline from the existing reclaimed water pipeline to the TxSt delivery point at Moon and University.
Project Purpose: Extend reclaimed water service to Texas State University thermal plants.DESCRIPTION
City of San MarcosDirect Water Reuse Feasibility StudyCapital Project
Opinion of Probable Construction Cost July 19, 2013
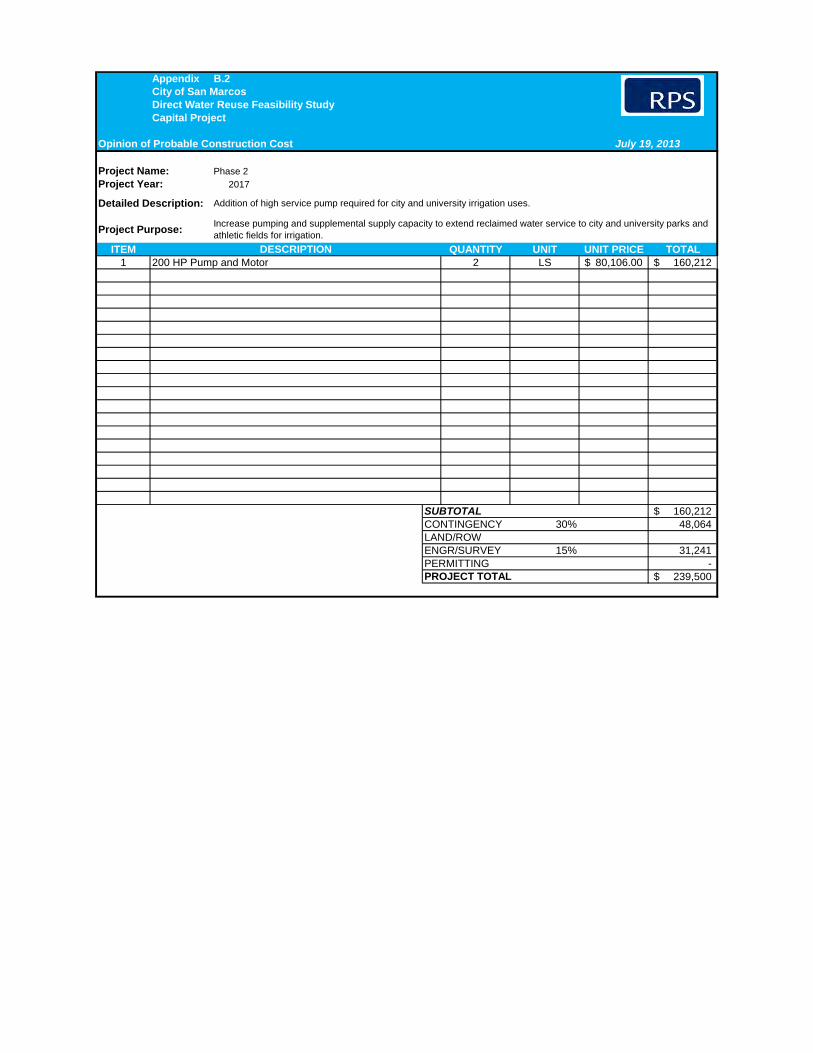
Appendix B.2
Project Name:Project Year: 2017
ITEM QUANTITY UNIT UNIT PRICE TOTAL1 2 LS 80,106.00$ 160,212$
160,212$ 30% 48,064
15% 31,241 -
239,500$
ENGR/SURVEYPERMITTINGPROJECT TOTAL
SUBTOTALCONTINGENCYLAND/ROW
200 HP Pump and Motor
Detailed Description: Addition of high service pump required for city and university irrigation uses.
Project Purpose:Increase pumping and supplemental supply capacity to extend reclaimed water service to city and university parks and athletic fields for irrigation.
DESCRIPTION
Phase 2
City of San MarcosDirect Water Reuse Feasibility StudyCapital Project
Opinion of Probable Construction Cost July 19, 2013
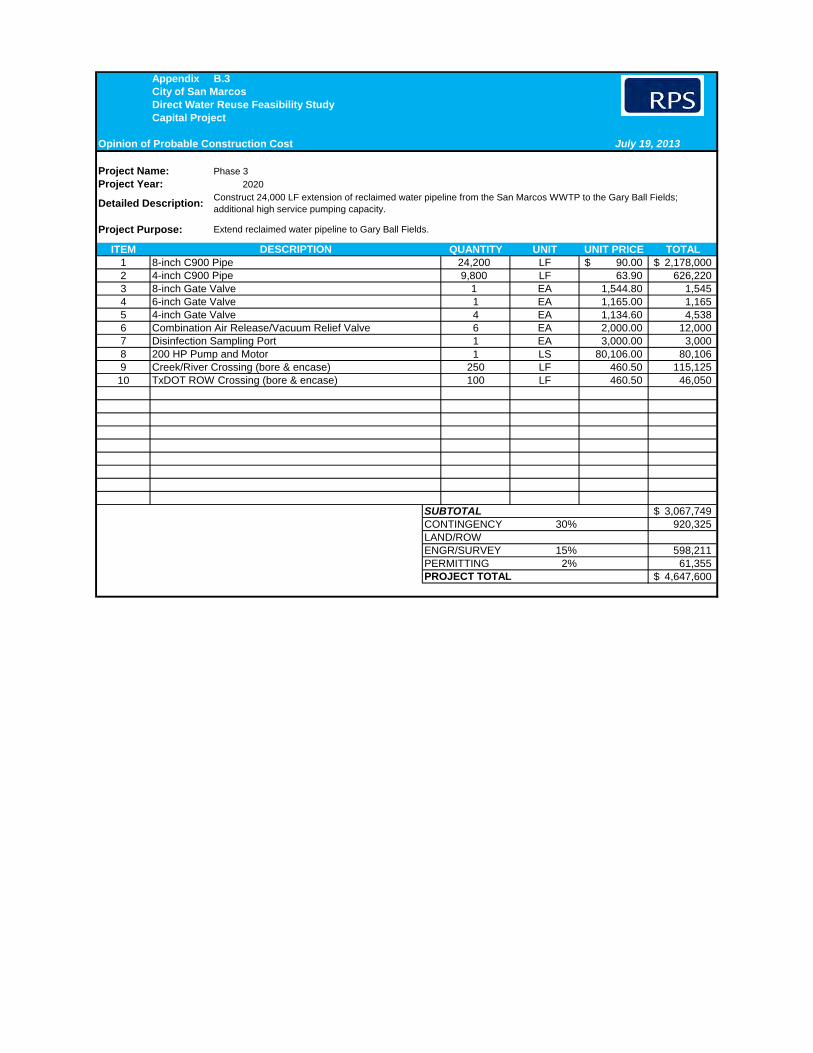
Appendix B.3
Project Name:Project Year: 2020
ITEM QUANTITY UNIT UNIT PRICE TOTAL1 24,200 LF 90.00$ 2,178,000$ 2 9,800 LF 63.90 626,220 3 1 EA 1,544.80 1,545 4 1 EA 1,165.00 1,165 5 4 EA 1,134.60 4,538 6 6 EA 2,000.00 12,000 7 1 EA 3,000.00 3,000 8 1 LS 80,106.00 80,106 9 250 LF 460.50 115,125 10 100 LF 460.50 46,050
3,067,749$ 30% 920,325
15% 598,211 2% 61,355
4,647,600$
ENGR/SURVEY
PROJECT TOTAL
SUBTOTALCONTINGENCYLAND/ROW
PERMITTING
Combination Air Release/Vacuum Relief ValveDisinfection Sampling Port200 HP Pump and Motor
TxDOT ROW Crossing (bore & encase)Creek/River Crossing (bore & encase)
4-inch C900 Pipe
6-inch Gate Valve4-inch Gate Valve
July 19, 2013
Phase 3
8-inch C900 Pipe
Project Purpose: Extend reclaimed water pipeline to Gary Ball Fields.DESCRIPTION
8-inch Gate Valve
City of San MarcosDirect Water Reuse Feasibility StudyCapital Project
Opinion of Probable Construction Cost
Detailed Description:Construct 24,000 LF extension of reclaimed water pipeline from the San Marcos WWTP to the Gary Ball Fields; additional high service pumping capacity.
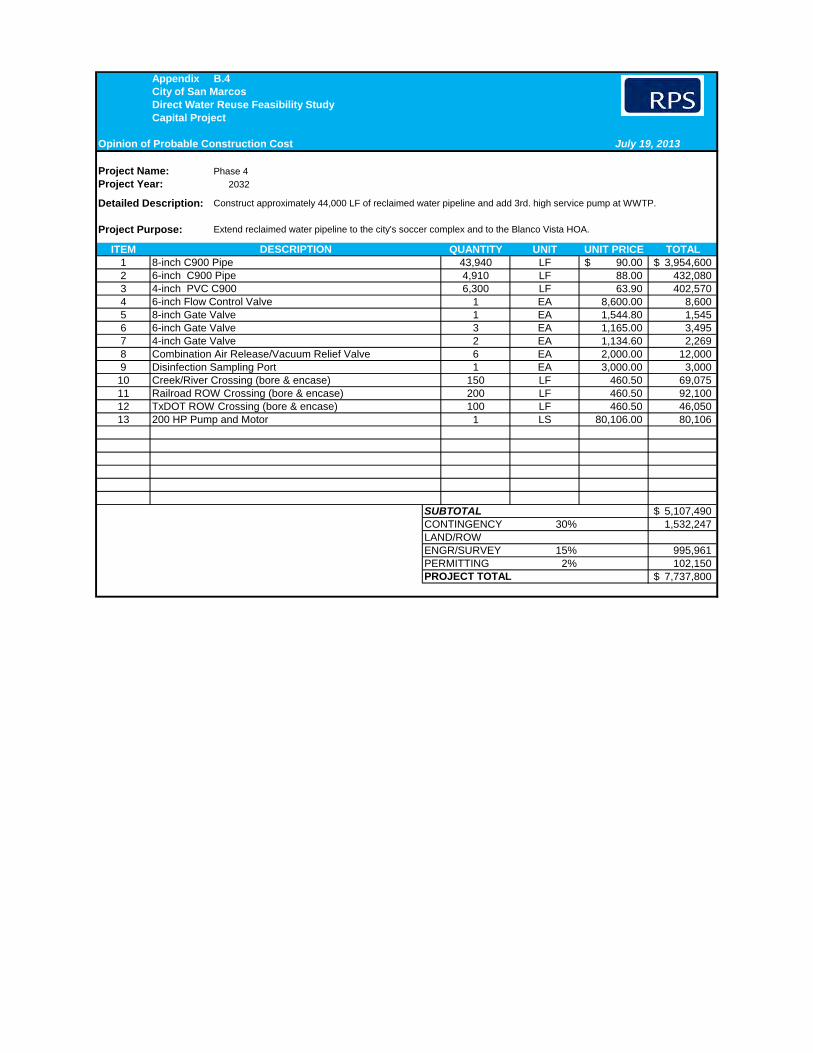
Appendix B.4
Project Name:Project Year: 2032
ITEM QUANTITY UNIT UNIT PRICE TOTAL1 43,940 LF 90.00$ 3,954,600$ 2 4,910 LF 88.00 432,080 3 6,300 LF 63.90 402,570 4 1 EA 8,600.00 8,600 5 1 EA 1,544.80 1,545 6 3 EA 1,165.00 3,495 7 2 EA 1,134.60 2,269 8 6 EA 2,000.00 12,000 9 1 EA 3,000.00 3,000 10 150 LF 460.50 69,075 11 200 LF 460.50 92,100 12 100 LF 460.50 46,050 13 1 LS 80,106.00 80,106
5,107,490$ 30% 1,532,247
15% 995,961 2% 102,150
7,737,800$ PROJECT TOTAL
Disinfection Sampling PortCombination Air Release/Vacuum Relief Valve
6-inch Gate Valve
CONTINGENCYLAND/ROWENGR/SURVEYPERMITTING
SUBTOTAL
Creek/River Crossing (bore & encase)Railroad ROW Crossing (bore & encase)
200 HP Pump and Motor
6-inch Flow Control Valve
TxDOT ROW Crossing (bore & encase)
8-inch Gate Valve
4-inch Gate Valve
8-inch C900 Pipe 6-inch C900 Pipe4-inch PVC C900
Detailed Description: Construct approximately 44,000 LF of reclaimed water pipeline and add 3rd. high service pump at WWTP.
Project Purpose: Extend reclaimed water pipeline to the city's soccer complex and to the Blanco Vista HOA.DESCRIPTION
Phase 4
City of San MarcosDirect Water Reuse Feasibility StudyCapital Project
Opinion of Probable Construction Cost July 19, 2013
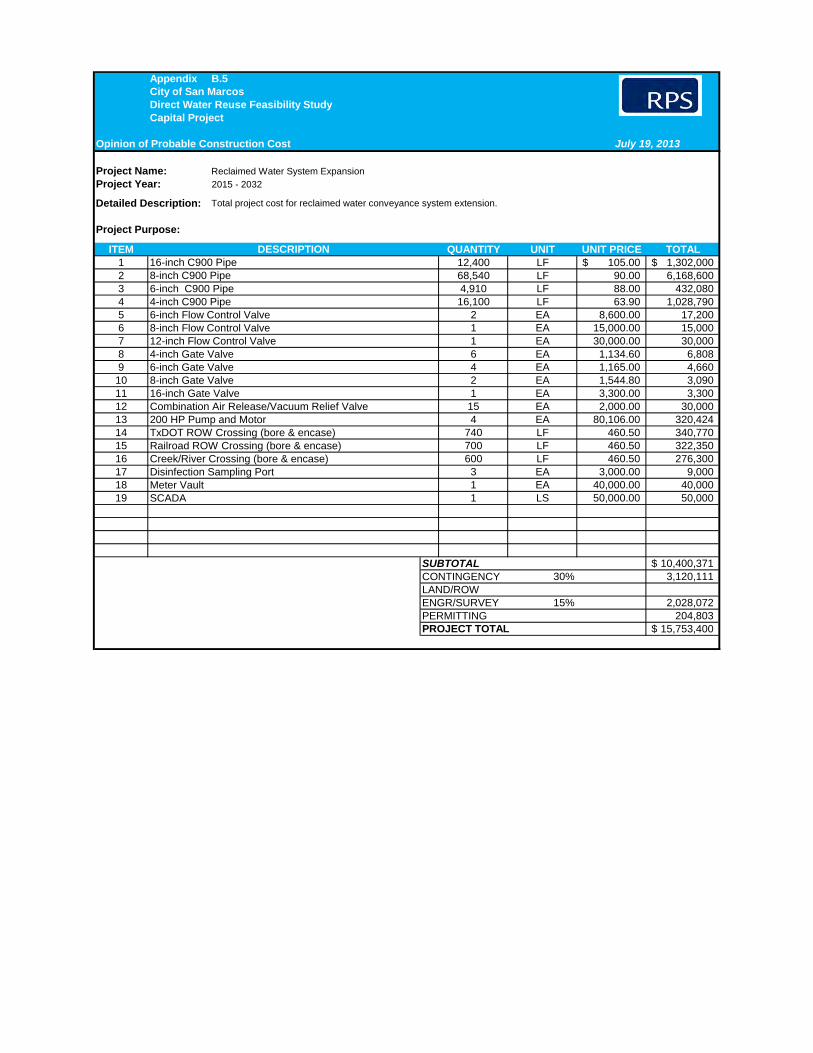
Appendix B.5
Project Name:Project Year: 2015 - 2032
ITEM QUANTITY UNIT UNIT PRICE TOTAL1 12,400 LF 105.00$ 1,302,000$ 2 68,540 LF 90.00 6,168,600 3 4,910 LF 88.00 432,080 4 16,100 LF 63.90 1,028,790 5 2 EA 8,600.00 17,200 6 1 EA 15,000.00 15,000 7 1 EA 30,000.00 30,000 8 6 EA 1,134.60 6,808 9 4 EA 1,165.00 4,660 10 2 EA 1,544.80 3,090 11 1 EA 3,300.00 3,300 12 15 EA 2,000.00 30,000 13 4 EA 80,106.00 320,424 14 740 LF 460.50 340,770 15 700 LF 460.50 322,350 16 600 LF 460.50 276,300 17 3 EA 3,000.00 9,000 18 1 EA 40,000.00 40,000 19 1 LS 50,000.00 50,000
10,400,371$ 30% 3,120,111
15% 2,028,072 204,803
15,753,400$
16-inch C900 Pipe8-inch C900 Pipe
Detailed Description: Total project cost for reclaimed water conveyance system extension.
Project Purpose:
DESCRIPTION
Reclaimed Water System Expansion
City of San MarcosDirect Water Reuse Feasibility StudyCapital Project
Opinion of Probable Construction Cost July 19, 2013
6-inch C900 Pipe
Disinfection Sampling PortMeter Vault
Railroad ROW Crossing (bore & encase)Creek/River Crossing (bore & encase)
12-inch Flow Control Valve8-inch Flow Control Valve6-inch Flow Control Valve
8-inch Gate Valve16-inch Gate Valve
200 HP Pump and MotorTxDOT ROW Crossing (bore & encase)
Combination Air Release/Vacuum Relief Valve
6-inch Gate Valve4-inch Gate Valve
4-inch C900 Pipe
PERMITTINGPROJECT TOTAL
CONTINGENCYLAND/ROWENGR/SURVEY
SUBTOTAL
SCADA
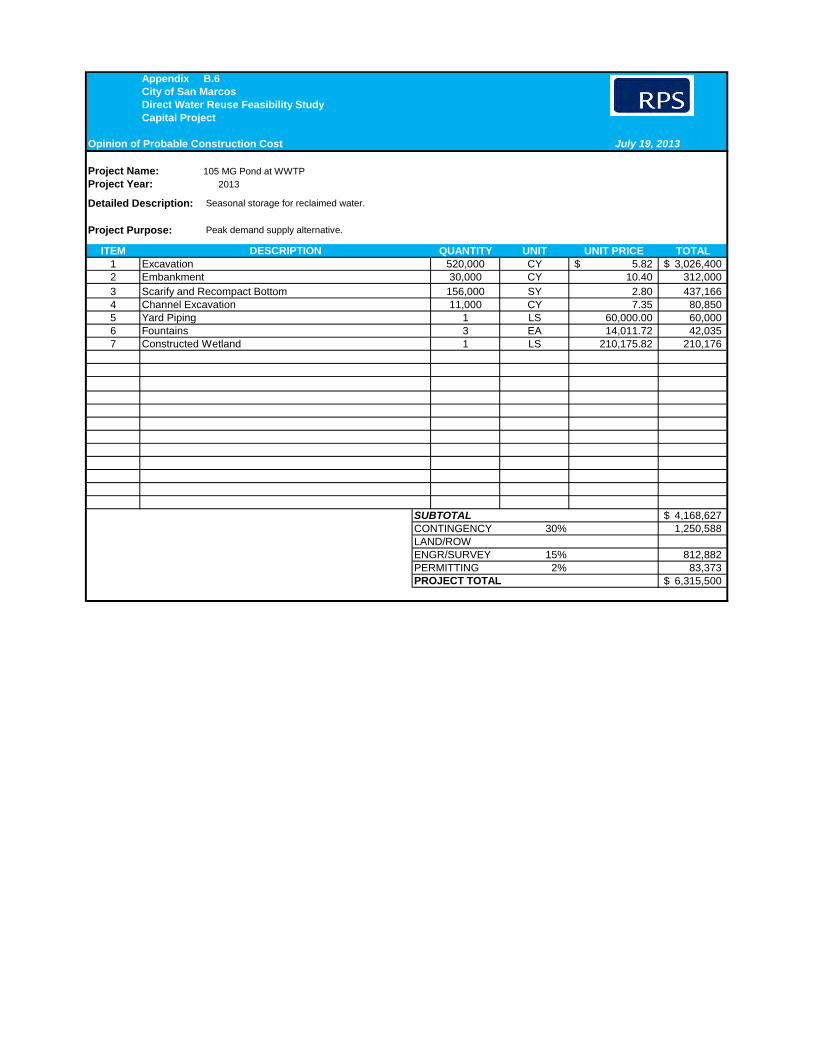
Appendix B.6
Project Name:Project Year: 2013
ITEM QUANTITY UNIT UNIT PRICE TOTAL1 520,000 CY 5.82$ 3,026,400$ 2 30,000 CY 10.40 312,000 3 156,000 SY 2.80 437,166 4 11,000 CY 7.35 80,850 5 1 LS 60,000.00 60,000 6 3 EA 14,011.72 42,035 7 1 LS 210,175.82 210,176
4,168,627$ 30% 1,250,588
15% 812,882 2% 83,373
6,315,500$
SUBTOTALCONTINGENCYLAND/ROWENGR/SURVEYPERMITTINGPROJECT TOTAL
FountainsConstructed Wetland
EmbankmentScarify and Recompact BottomChannel ExcavationYard Piping
Detailed Description: Seasonal storage for reclaimed water.
Project Purpose: Peak demand supply alternative.DESCRIPTION
Excavation
105 MG Pond at WWTP
City of San MarcosDirect Water Reuse Feasibility StudyCapital Project
Opinion of Probable Construction Cost July 19, 2013
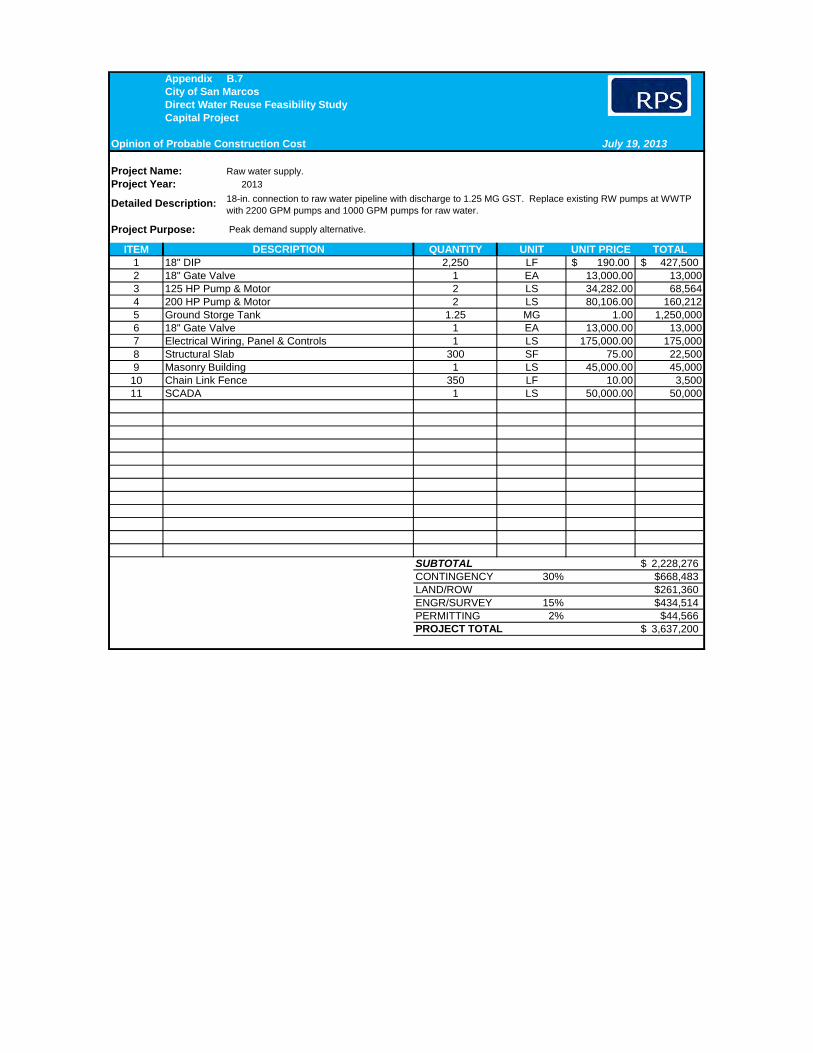
Appendix B.7
Project Name:Project Year: 2013
ITEM QUANTITY UNIT UNIT PRICE TOTAL1 2,250 LF 190.00$ 427,500$ 2 1 EA 13,000.00 13,0003 2 LS 34,282.00 68,5644 2 LS 80,106.00 160,2125 1.25 MG 1.00 1,250,0006 1 EA 13,000.00 13,0007 1 LS 175,000.00 175,0008 300 SF 75.00 22,5009 1 LS 45,000.00 45,00010 350 LF 10.00 3,50011 1 LS 50,000.00 50,000
2,228,276$ 30% $668,483
$261,36015% $434,514
2% $44,5663,637,200$
Raw water supply.
City of San MarcosDirect Water Reuse Feasibility StudyCapital Project
Opinion of Probable Construction Cost July 19, 2013
Electrical Wiring, Panel & Controls
Detailed Description: 18-in. connection to raw water pipeline with discharge to 1.25 MG GST. Replace existing RW pumps at WWTP with 2200 GPM pumps and 1000 GPM pumps for raw water.
Project Purpose: Peak demand supply alternative.DESCRIPTION
18" DIP18" Gate Valve125 HP Pump & Motor200 HP Pump & MotorGround Storge Tank18" Gate Valve
Structural SlabMasonry BuildingChain Link FenceSCADA
LAND/ROWENGR/SURVEYPERMITTINGPROJECT TOTAL
SUBTOTALCONTINGENCY
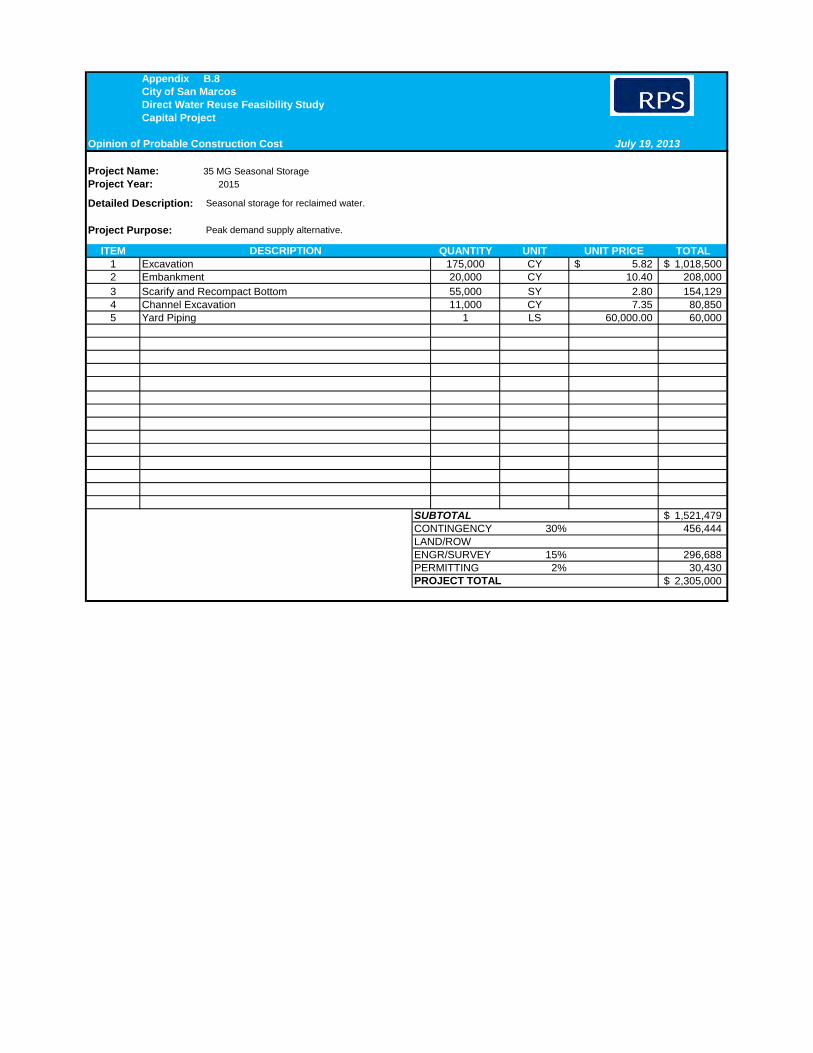
Appendix B.8
Project Name:Project Year: 2015
ITEM QUANTITY UNIT UNIT PRICE TOTAL1 175,000 CY 5.82$ 1,018,500$ 2 20,000 CY 10.40 208,000 3 55,000 SY 2.80 154,129 4 11,000 CY 7.35 80,850 5 1 LS 60,000.00 60,000
1,521,479$ 30% 456,444
15% 296,688 2% 30,430
2,305,000$
SUBTOTALCONTINGENCYLAND/ROWENGR/SURVEYPERMITTINGPROJECT TOTAL
Detailed Description: Seasonal storage for reclaimed water.
Project Purpose: Peak demand supply alternative.DESCRIPTION
ExcavationEmbankmentScarify and Recompact BottomChannel ExcavationYard Piping
35 MG Seasonal Storage
City of San MarcosDirect Water Reuse Feasibility StudyCapital Project
Opinion of Probable Construction Cost July 19, 2013
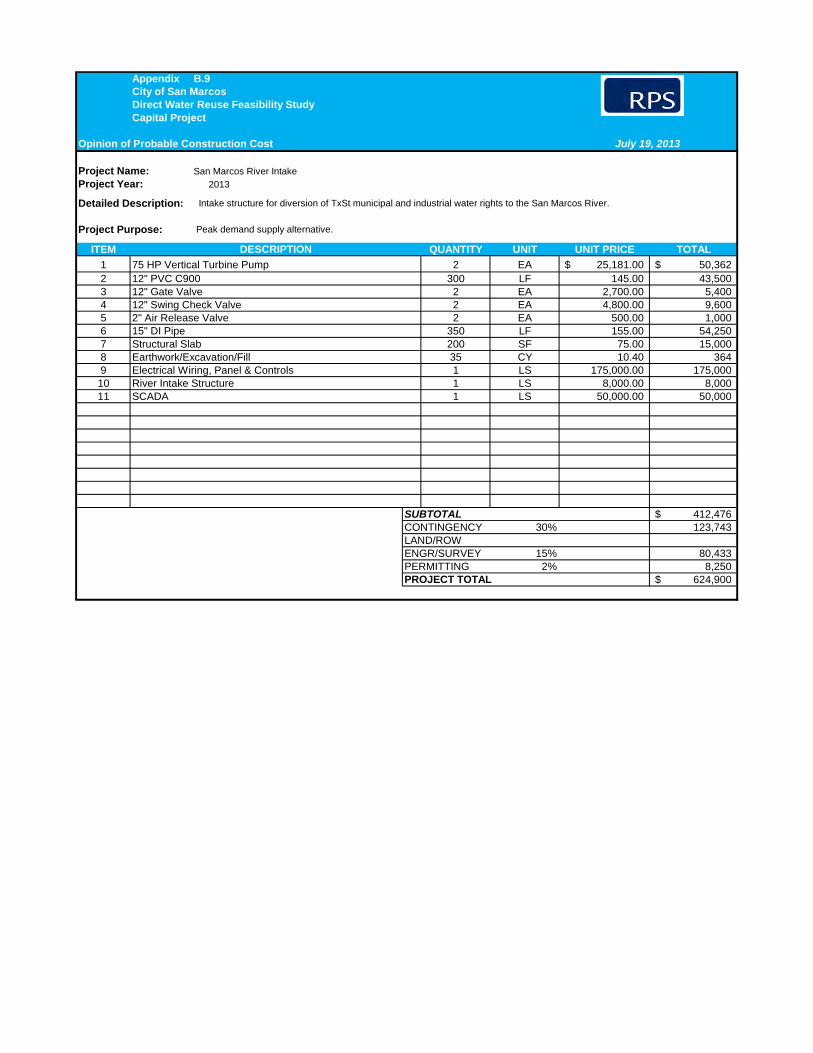
Appendix B.9
Project Name:Project Year: 2013
ITEM QUANTITY UNIT UNIT PRICE TOTAL
1 2 EA 25,181.00$ 50,362$ 2 300 LF 145.00 43,500 3 2 EA 2,700.00 5,400 4 2 EA 4,800.00 9,600 5 2 EA 500.00 1,000 6 350 LF 155.00 54,250 7 200 SF 75.00 15,000 8 35 CY 10.40 364 9 1 LS 175,000.00 175,000 10 1 LS 8,000.00 8,000 11 1 LS 50,000.00 50,000
412,476$ 30% 123,743
15% 80,433 2% 8,250
624,900$
City of San MarcosDirect Water Reuse Feasibility StudyCapital Project
Opinion of Probable Construction Cost July 19, 2013
15" DI Pipe
San Marcos River Intake
Detailed Description: Intake structure for diversion of TxSt municipal and industrial water rights to the San Marcos River.
Project Purpose: Peak demand supply alternative.DESCRIPTION
75 HP Vertical Turbine Pump12" PVC C900 12" Gate Valve12" Swing Check Valve2" Air Release Valve
Structural SlabEarthwork/Excavation/FillElectrical Wiring, Panel & ControlsRiver Intake StructureSCADA
PROJECT TOTAL
SUBTOTALCONTINGENCYLAND/ROWENGR/SURVEYPERMITTING

This page is intentionally blank
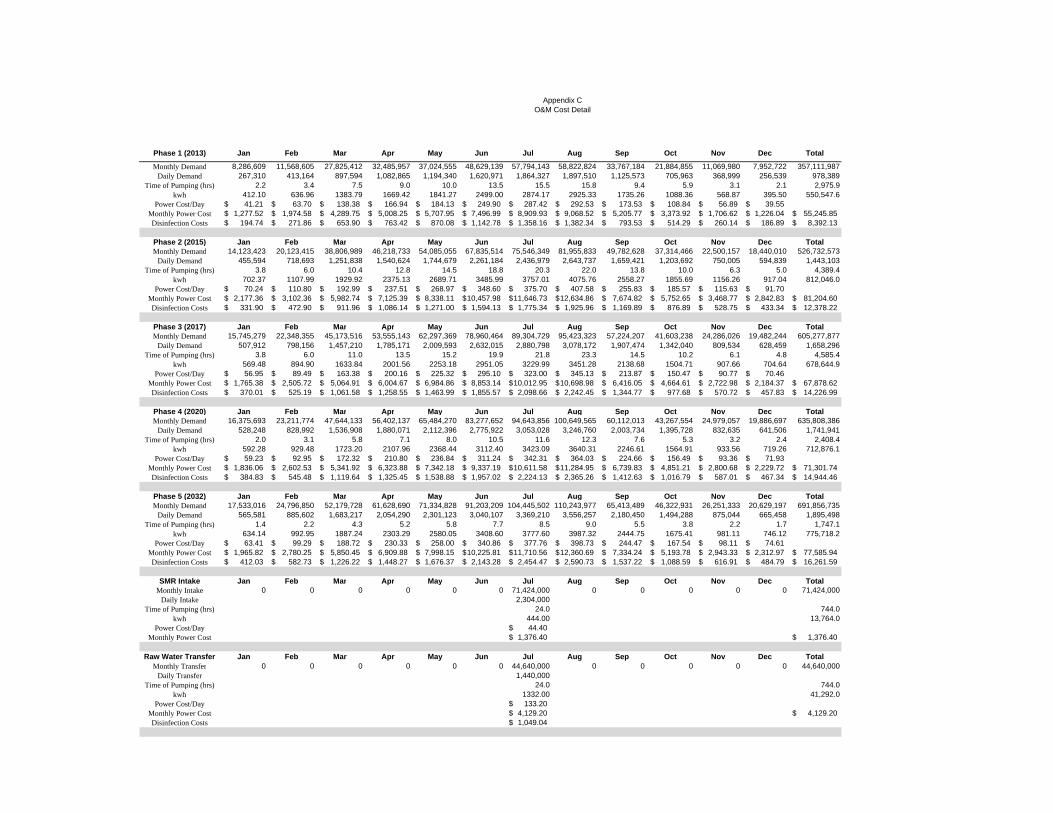
Appendix C O&M Cost Detail
Phase 1 (2013) Jan Feb Mar Apr May Jun Jul Aug Sep Oct Nov Dec Total
Monthly Demand 8,286,609 11,568,605 27,825,412 32,485,957 37,024,555 48,629,139 57,794,143 58,822,824 33,767,184 21,884,855 11,069,980 7,952,722 357,111,987Daily Demand 267,310 413,164 897,594 1,082,865 1,194,340 1,620,971 1,864,327 1,897,510 1,125,573 705,963 368,999 256,539 978,389
Time of Pumping (hrs) 2.2 3.4 7.5 9.0 10.0 13.5 15.5 15.8 9.4 5.9 3.1 2.1 2,975.9kwh 412.10 636.96 1383.79 1669.42 1841.27 2499.00 2874.17 2925.33 1735.26 1088.36 568.87 395.50 550,547.6
Power Cost/Day 41.21$ 63.70$ 138.38$ 166.94$ 184.13$ 249.90$ 287.42$ 292.53$ 173.53$ 108.84$ 56.89$ 39.55$ Monthly Power Cost 1,277.52$ 1,974.58$ 4,289.75$ 5,008.25$ 5,707.95$ 7,496.99$ 8,909.93$ 9,068.52$ 5,205.77$ 3,373.92$ 1,706.62$ 1,226.04$ 55,245.85$ Disinfection Costs 194.74$ 271.86$ 653.90$ 763.42$ 870.08$ 1,142.78$ 1,358.16$ 1,382.34$ 793.53$ 514.29$ 260.14$ 186.89$ 8,392.13$
Phase 2 (2015) Jan Feb Mar Apr May Jun Jul Aug Sep Oct Nov Dec TotalMonthly Demand 14,123,423 20,123,415 38,806,989 46,218,733 54,085,055 67,835,514 75,546,349 81,955,833 49,782,628 37,314,466 22,500,157 18,440,010 526,732,573
Daily Demand 455,594 718,693 1,251,838 1,540,624 1,744,679 2,261,184 2,436,979 2,643,737 1,659,421 1,203,692 750,005 594,839 1,443,103Time of Pumping (hrs) 3.8 6.0 10.4 12.8 14.5 18.8 20.3 22.0 13.8 10.0 6.3 5.0 4,389.4
kwh 702.37 1107.99 1929.92 2375.13 2689.71 3485.99 3757.01 4075.76 2558.27 1855.69 1156.26 917.04 812,046.0Power Cost/Day 70.24$ 110.80$ 192.99$ 237.51$ 268.97$ 348.60$ 375.70$ 407.58$ 255.83$ 185.57$ 115.63$ 91.70$
Monthly Power Cost 2,177.36$ 3,102.36$ 5,982.74$ 7,125.39$ 8,338.11$ 10,457.98$ 11,646.73$ 12,634.86$ 7,674.82$ 5,752.65$ 3,468.77$ 2,842.83$ 81,204.60$ Disinfection Costs 331.90$ 472.90$ 911.96$ 1,086.14$ 1,271.00$ 1,594.13$ 1,775.34$ 1,925.96$ 1,169.89$ 876.89$ 528.75$ 433.34$ 12,378.22$
Phase 3 (2017) Jan Feb Mar Apr May Jun Jul Aug Sep Oct Nov Dec TotalMonthly Demand 15,745,279 22,348,355 45,173,516 53,555,143 62,297,369 78,960,464 89,304,729 95,423,323 57,224,207 41,603,238 24,286,026 19,482,244 605,277,877
Daily Demand 507,912 798,156 1,457,210 1,785,171 2,009,593 2,632,015 2,880,798 3,078,172 1,907,474 1,342,040 809,534 628,459 1,658,296Time of Pumping (hrs) 3.8 6.0 11.0 13.5 15.2 19.9 21.8 23.3 14.5 10.2 6.1 4.8 4,585.4
kwh 569.48 894.90 1633.84 2001.56 2253.18 2951.05 3229.99 3451.28 2138.68 1504.71 907.66 704.64 678,644.9Power Cost/Day 56.95$ 89.49$ 163.38$ 200.16$ 225.32$ 295.10$ 323.00$ 345.13$ 213.87$ 150.47$ 90.77$ 70.46$
Monthly Power Cost 1,765.38$ 2,505.72$ 5,064.91$ 6,004.67$ 6,984.86$ 8,853.14$ 10,012.95$ 10,698.98$ 6,416.05$ 4,664.61$ 2,722.98$ 2,184.37$ 67,878.62$ Disinfection Costs 370.01$ 525.19$ 1,061.58$ 1,258.55$ 1,463.99$ 1,855.57$ 2,098.66$ 2,242.45$ 1,344.77$ 977.68$ 570.72$ 457.83$ 14,226.99$
Phase 4 (2020) Jan Feb Mar Apr May Jun Jul Aug Sep Oct Nov Dec TotalMonthly Demand 16,375,693 23,211,774 47,644,133 56,402,137 65,484,270 83,277,652 94,643,856 100,649,565 60,112,013 43,267,554 24,979,057 19,886,697 635,808,386
Daily Demand 528,248 828,992 1,536,908 1,880,071 2,112,396 2,775,922 3,053,028 3,246,760 2,003,734 1,395,728 832,635 641,506 1,741,941Time of Pumping (hrs) 2.0 3.1 5.8 7.1 8.0 10.5 11.6 12.3 7.6 5.3 3.2 2.4 2,408.4
kwh 592.28 929.48 1723.20 2107.96 2368.44 3112.40 3423.09 3640.31 2246.61 1564.91 933.56 719.26 712,876.1Power Cost/Day 59.23$ 92.95$ 172.32$ 210.80$ 236.84$ 311.24$ 342.31$ 364.03$ 224.66$ 156.49$ 93.36$ 71.93$
Monthly Power Cost 1,836.06$ 2,602.53$ 5,341.92$ 6,323.88$ 7,342.18$ 9,337.19$ 10,611.58$ 11,284.95$ 6,739.83$ 4,851.21$ 2,800.68$ 2,229.72$ 71,301.74$ Disinfection Costs 384.83$ 545.48$ 1,119.64$ 1,325.45$ 1,538.88$ 1,957.02$ 2,224.13$ 2,365.26$ 1,412.63$ 1,016.79$ 587.01$ 467.34$ 14,944.46$
Phase 5 (2032) Jan Feb Mar Apr May Jun Jul Aug Sep Oct Nov Dec TotalMonthly Demand 17,533,016 24,796,850 52,179,728 61,628,690 71,334,828 91,203,209 104,445,502 110,243,977 65,413,489 46,322,931 26,251,333 20,629,197 691,856,735
Daily Demand 565,581 885,602 1,683,217 2,054,290 2,301,123 3,040,107 3,369,210 3,556,257 2,180,450 1,494,288 875,044 665,458 1,895,498Time of Pumping (hrs) 1.4 2.2 4.3 5.2 5.8 7.7 8.5 9.0 5.5 3.8 2.2 1.7 1,747.1
kwh 634.14 992.95 1887.24 2303.29 2580.05 3408.60 3777.60 3987.32 2444.75 1675.41 981.11 746.12 775,718.2Power Cost/Day 63.41$ 99.29$ 188.72$ 230.33$ 258.00$ 340.86$ 377.76$ 398.73$ 244.47$ 167.54$ 98.11$ 74.61$
Monthly Power Cost 1,965.82$ 2,780.25$ 5,850.45$ 6,909.88$ 7,998.15$ 10,225.81$ 11,710.56$ 12,360.69$ 7,334.24$ 5,193.78$ 2,943.33$ 2,312.97$ 77,585.94$ Disinfection Costs 412.03$ 582.73$ 1,226.22$ 1,448.27$ 1,676.37$ 2,143.28$ 2,454.47$ 2,590.73$ 1,537.22$ 1,088.59$ 616.91$ 484.79$ 16,261.59$
SMR Intake Jan Feb Mar Apr May Jun Jul Aug Sep Oct Nov Dec TotalMonthly Intake 0 0 0 0 0 0 71,424,000 0 0 0 0 0 71,424,000
Daily Intake 2,304,000Time of Pumping (hrs) 24.0 744.0
kwh 444.00 13,764.0Power Cost/Day 44.40$
Monthly Power Cost 1,376.40$ 1,376.40$
Raw Water Transfer Jan Feb Mar Apr May Jun Jul Aug Sep Oct Nov Dec TotalMonthly Transfer 0 0 0 0 0 0 44,640,000 0 0 0 0 0 44,640,000
Daily Transfer 1,440,000Time of Pumping (hrs) 24.0 744.0
kwh 1332.00 41,292.0Power Cost/Day 133.20$
Monthly Power Cost 4,129.20$ 4,129.20$ Disinfection Costs 1,049.04$

This page is intentionally blank
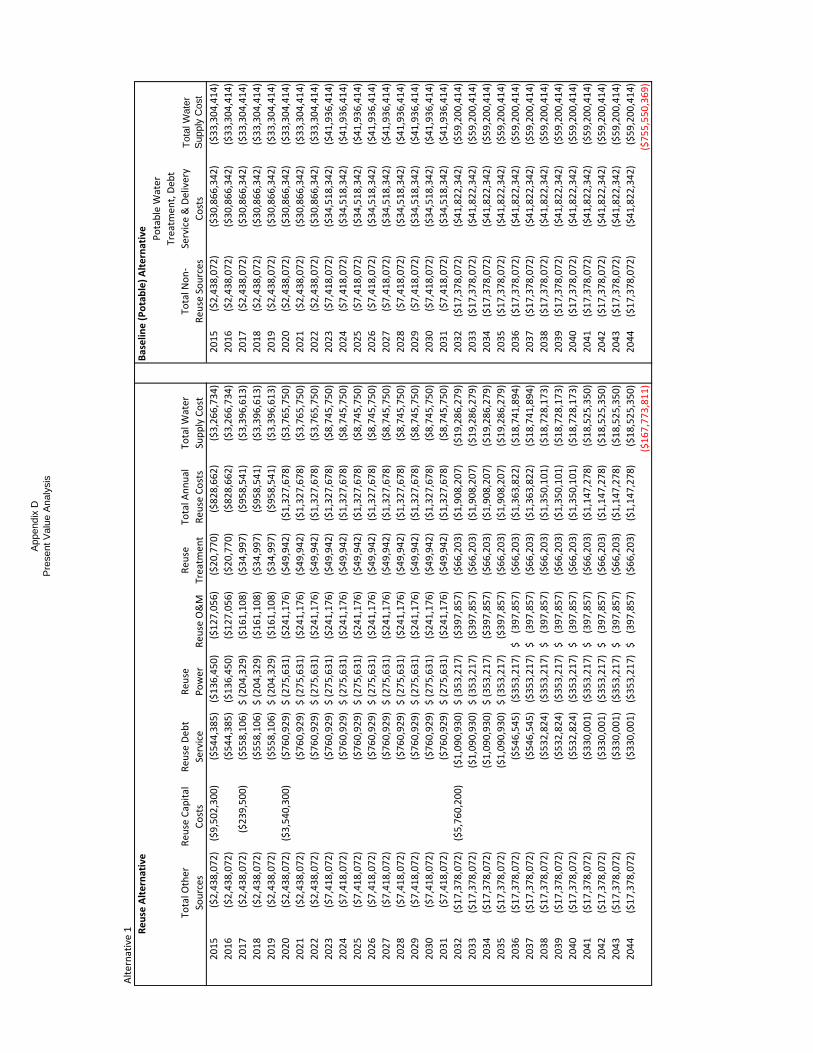
Appe
ndix
DPr
esen
t Valu
e Ana
lysis
Alternative 1 Reuse Alternative
Baselin
e (Potable) Alternative
Total O
ther
Sources
Reu
se Capital
Costs
Reu
se Deb
t
Service
Reu
se
Power
Reu
se O&M
Reu
se
Treatm
ent
Total A
nnual
Reu
se Costs
Total W
ater
Supply Cost
Total N
on‐
Reu
se Sources
Potable W
ater
Treatm
ent, Deb
t
Service & Delivery
Costs
Total
Wate
r Su
pply
Cost
2015
($2,438,072)
($9,502,300)
($544,385)
($136,450)
($127,056)
($20,770)
($828,662)
($3,266,734)
2015
($2,438,072)
($30,866,342)
($33,304,414)
2016
($2,438,072)
($544,385)
($136,450)
($127,056)
($20,770)
($828,662)
($3,266,734)
2016
($2,438,072)
($30,866,342)
($33,304,414)
2017
($2,438,072)
($239,500)
($558,106)
(204,329)
$
($161,108)
($34,997)
($958,541)
($3,396,613)
2017
($2,438,072)
($30,866,342)
($33,304,414)
2018
($2,438,072)
($558,106)
(204,329)
$
($161,108)
($34,997)
($958,541)
($3,396,613)
2018
($2,438,072)
($30,866,342)
($33,304,414)
2019
($2,438,072)
($558,106)
(204,329)
$
($161,108)
($34,997)
($958,541)
($3,396,613)
2019
($2,438,072)
($30,866,342)
($33,304,414)
2020
($2,438,072)
($3,540,300)
($760,929)
(275,631)
$
($241,176)
($49,942)
($1,327,678)
($3,765,750)
2020
($2,438,072)
($30,866,342)
($33,304,414)
2021
($2,438,072)
($760,929)
(275,631)
$
($241,176)
($49,942)
($1,327,678)
($3,765,750)
2021
($2,438,072)
($30,866,342)
($33,304,414)
2022
($2,438,072)
($760,929)
(275,631)
$
($241,176)
($49,942)
($1,327,678)
($3,765,750)
2022
($2,438,072)
($30,866,342)
($33,304,414)
2023
($7,418,072)
($760,929)
(275,631)
$
($241,176)
($49,942)
($1,327,678)
($8,745,750)
2023
($7,418,072)
($34,518,342)
($41,936,414)
2024
($7,418,072)
($760,929)
(275,631)
$
($241,176)
($49,942)
($1,327,678)
($8,745,750)
2024
($7,418,072)
($34,518,342)
($41,936,414)
2025
($7,418,072)
($760,929)
(275,631)
$
($241,176)
($49,942)
($1,327,678)
($8,745,750)
2025
($7,418,072)
($34,518,342)
($41,936,414)
2026
($7,418,072)
($760,929)
(275,631)
$
($241,176)
($49,942)
($1,327,678)
($8,745,750)
2026
($7,418,072)
($34,518,342)
($41,936,414)
2027
($7,418,072)
($760,929)
(275,631)
$
($241,176)
($49,942)
($1,327,678)
($8,745,750)
2027
($7,418,072)
($34,518,342)
($41,936,414)
2028
($7,418,072)
($760,929)
(275,631)
$
($241,176)
($49,942)
($1,327,678)
($8,745,750)
2028
($7,418,072)
($34,518,342)
($41,936,414)
2029
($7,418,072)
($760,929)
(275,631)
$
($241,176)
($49,942)
($1,327,678)
($8,745,750)
2029
($7,418,072)
($34,518,342)
($41,936,414)
2030
($7,418,072)
($760,929)
(275,631)
$
($241,176)
($49,942)
($1,327,678)
($8,745,750)
2030
($7,418,072)
($34,518,342)
($41,936,414)
2031
($7,418,072)
($760,929)
(275,631)
$
($241,176)
($49,942)
($1,327,678)
($8,745,750)
2031
($7,418,072)
($34,518,342)
($41,936,414)
2032
($17,378,072)
($5,760,200)
($1,090,930)
(353,217)
$
($397,857)
($66,203)
($1,908,207)
($19,286,279)
2032
($17,378,072)
($41,822,342)
($59,200,414)
2033
($17,378,072)
($1,090,930)
(353,217)
$
($397,857)
($66,203)
($1,908,207)
($19,286,279)
2033
($17,378,072)
($41,822,342)
($59,200,414)
2034
($17,378,072)
($1,090,930)
(353,217)
$
($397,857)
($66,203)
($1,908,207)
($19,286,279)
2034
($17,378,072)
($41,822,342)
($59,200,414)
2035
($17,378,072)
($1,090,930)
(353,217)
$
($397,857)
($66,203)
($1,908,207)
($19,286,279)
2035
($17,378,072)
($41,822,342)
($59,200,414)
2036
($17,378,072)
($546,545)
($353,217)
(397,857)
$
($66,203)
($1,363,822)
($18,741,894)
2036
($17,378,072)
($41,822,342)
($59,200,414)
2037
($17,378,072)
($546,545)
($353,217)
(397,857)
$
($66,203)
($1,363,822)
($18,741,894)
2037
($17,378,072)
($41,822,342)
($59,200,414)
2038
($17,378,072)
($532,824)
($353,217)
(397,857)
$
($66,203)
($1,350,101)
($18,728,173)
2038
($17,378,072)
($41,822,342)
($59,200,414)
2039
($17,378,072)
($532,824)
($353,217)
(397,857)
$
($66,203)
($1,350,101)
($18,728,173)
2039
($17,378,072)
($41,822,342)
($59,200,414)
2040
($17,378,072)
($532,824)
($353,217)
(397,857)
$
($66,203)
($1,350,101)
($18,728,173)
2040
($17,378,072)
($41,822,342)
($59,200,414)
2041
($17,378,072)
($330,001)
($353,217)
(397,857)
$
($66,203)
($1,147,278)
($18,525,350)
2041
($17,378,072)
($41,822,342)
($59,200,414)
2042
($17,378,072)
($330,001)
($353,217)
(397,857)
$
($66,203)
($1,147,278)
($18,525,350)
2042
($17,378,072)
($41,822,342)
($59,200,414)
2043
($17,378,072)
($330,001)
($353,217)
(397,857)
$
($66,203)
($1,147,278)
($18,525,350)
2043
($17,378,072)
($41,822,342)
($59,200,414)
2044
($17,378,072)
($330,001)
($353,217)
(397,857)
$
($66,203)
($1,147,278)
($18,525,350)
2044
($17,378,072)
($41,822,342)
($59,200,414)
($167,773,811)
($755,550,369)
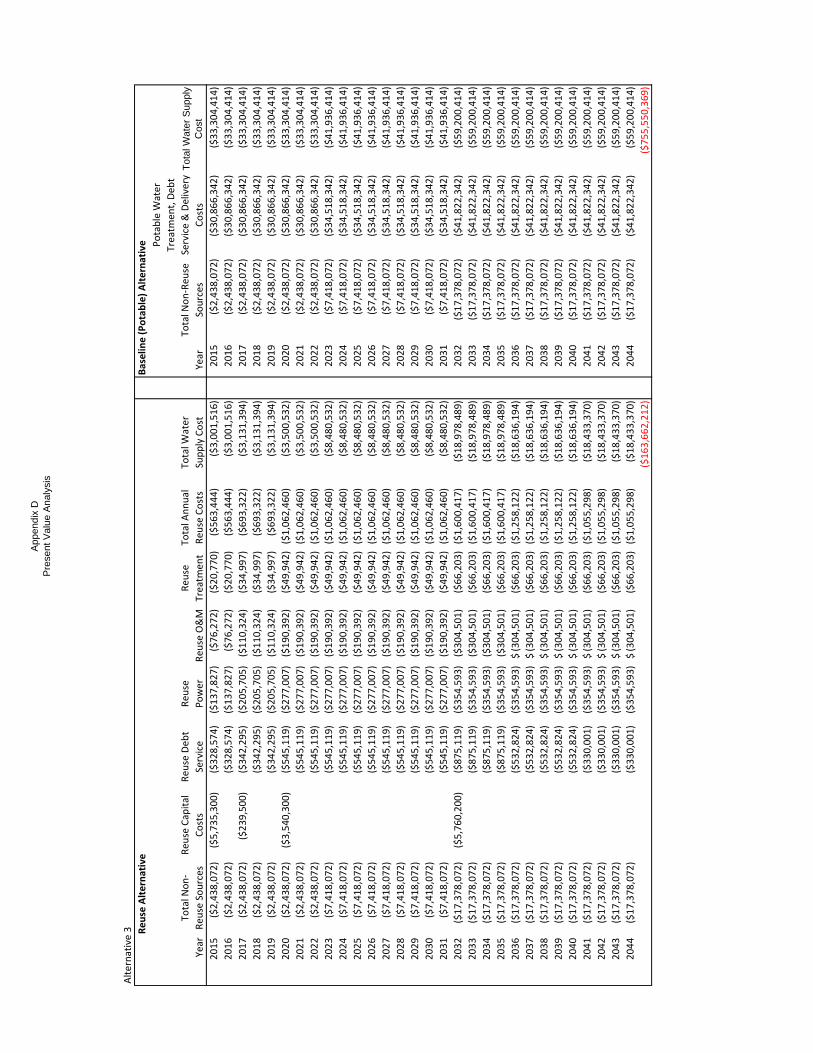
Appe
ndix
DPr
esen
t Valu
e Ana
lysis
Alternative 3 Reuse Alternative
Baselin
e (Potable) Alternative
Year
Total N
on‐
Reu
se Sources
Reu
se Capital
Costs
Reu
se Deb
t
Service
Reu
se
Power
Reu
se O&M
Reu
se
Treatm
ent
Total A
nnual
Reu
se Costs
Total W
ater
Supply Cost
Year
Total N
on‐Reu
se
Sources
Potable W
ater
Treatm
ent, Deb
t
Service & Delivery
Costs
Total
Wate
r Sup
ply
Cost
2015
($2,438,072)
($5,735,300)
($328,574)
($137,827)
($76,272)
($20,770)
($563,444)
($3,001,516)
2015
($2,438,072)
($30,866,342)
($33,304,414)
2016
($2,438,072)
($328,574)
($137,827)
($76,272)
($20,770)
($563,444)
($3,001,516)
2016
($2,438,072)
($30,866,342)
($33,304,414)
2017
($2,438,072)
($239,500)
($342,295)
($205,705)
($110,324)
($34,997)
($693,322)
($3,131,394)
2017
($2,438,072)
($30,866,342)
($33,304,414)
2018
($2,438,072)
($342,295)
($205,705)
($110,324)
($34,997)
($693,322)
($3,131,394)
2018
($2,438,072)
($30,866,342)
($33,304,414)
2019
($2,438,072)
($342,295)
($205,705)
($110,324)
($34,997)
($693,322)
($3,131,394)
2019
($2,438,072)
($30,866,342)
($33,304,414)
2020
($2,438,072)
($3,540,300)
($545,119)
($277,007)
($190,392)
($49,942)($1,062,460)
($3,500,532)
2020
($2,438,072)
($30,866,342)
($33,304,414)
2021
($2,438,072)
($545,119)
($277,007)
($190,392)
($49,942)($1,062,460)
($3,500,532)
2021
($2,438,072)
($30,866,342)
($33,304,414)
2022
($2,438,072)
($545,119)
($277,007)
($190,392)
($49,942)($1,062,460)
($3,500,532)
2022
($2,438,072)
($30,866,342)
($33,304,414)
2023
($7,418,072)
($545,119)
($277,007)
($190,392)
($49,942)($1,062,460)
($8,480,532)
2023
($7,418,072)
($34,518,342)
($41,936,414)
2024
($7,418,072)
($545,119)
($277,007)
($190,392)
($49,942)($1,062,460)
($8,480,532)
2024
($7,418,072)
($34,518,342)
($41,936,414)
2025
($7,418,072)
($545,119)
($277,007)
($190,392)
($49,942)($1,062,460)
($8,480,532)
2025
($7,418,072)
($34,518,342)
($41,936,414)
2026
($7,418,072)
($545,119)
($277,007)
($190,392)
($49,942)($1,062,460)
($8,480,532)
2026
($7,418,072)
($34,518,342)
($41,936,414)
2027
($7,418,072)
($545,119)
($277,007)
($190,392)
($49,942)($1,062,460)
($8,480,532)
2027
($7,418,072)
($34,518,342)
($41,936,414)
2028
($7,418,072)
($545,119)
($277,007)
($190,392)
($49,942)($1,062,460)
($8,480,532)
2028
($7,418,072)
($34,518,342)
($41,936,414)
2029
($7,418,072)
($545,119)
($277,007)
($190,392)
($49,942)($1,062,460)
($8,480,532)
2029
($7,418,072)
($34,518,342)
($41,936,414)
2030
($7,418,072)
($545,119)
($277,007)
($190,392)
($49,942)($1,062,460)
($8,480,532)
2030
($7,418,072)
($34,518,342)
($41,936,414)
2031
($7,418,072)
($545,119)
($277,007)
($190,392)
($49,942)($1,062,460)
($8,480,532)
2031
($7,418,072)
($34,518,342)
($41,936,414)
2032
($17,378,072)
($5,760,200)
($875,119)
($354,593)
($304,501)
($66,203)($1,600,417)
($18,978,489)
2032
($17,378,072)
($41,822,342)
($59,200,414)
2033
($17,378,072)
($875,119)
($354,593)
($304,501)
($66,203)($1,600,417)
($18,978,489)
2033
($17,378,072)
($41,822,342)
($59,200,414)
2034
($17,378,072)
($875,119)
($354,593)
($304,501)
($66,203)($1,600,417)
($18,978,489)
2034
($17,378,072)
($41,822,342)
($59,200,414)
2035
($17,378,072)
($875,119)
($354,593)
($304,501)
($66,203)($1,600,417)
($18,978,489)
2035
($17,378,072)
($41,822,342)
($59,200,414)
2036
($17,378,072)
($532,824)
($354,593)
(304,501)
$
($66,203)($1,258,122)
($18,636,194)
2036
($17,378,072)
($41,822,342)
($59,200,414)
2037
($17,378,072)
($532,824)
($354,593)
(304,501)
$
($66,203)($1,258,122)
($18,636,194)
2037
($17,378,072)
($41,822,342)
($59,200,414)
2038
($17,378,072)
($532,824)
($354,593)
(304,501)
$
($66,203)($1,258,122)
($18,636,194)
2038
($17,378,072)
($41,822,342)
($59,200,414)
2039
($17,378,072)
($532,824)
($354,593)
(304,501)
$
($66,203)($1,258,122)
($18,636,194)
2039
($17,378,072)
($41,822,342)
($59,200,414)
2040
($17,378,072)
($532,824)
($354,593)
(304,501)
$
($66,203)($1,258,122)
($18,636,194)
2040
($17,378,072)
($41,822,342)
($59,200,414)
2041
($17,378,072)
($330,001)
($354,593)
(304,501)
$
($66,203)($1,055,298)
($18,433,370)
2041
($17,378,072)
($41,822,342)
($59,200,414)
2042
($17,378,072)
($330,001)
($354,593)
(304,501)
$
($66,203)($1,055,298)
($18,433,370)
2042
($17,378,072)
($41,822,342)
($59,200,414)
2043
($17,378,072)
($330,001)
($354,593)
(304,501)
$
($66,203)($1,055,298)
($18,433,370)
2043
($17,378,072)
($41,822,342)
($59,200,414)
2044
($17,378,072)
($330,001)
($354,593)
(304,501)
$
($66,203)($1,055,298)
($18,433,370)
2044
($17,378,072)
($41,822,342)
($59,200,414)
($163,662,212)
($755,550,369)
Public Meeting Notice The City of San Marcos Public Services Department will hold a public meeting to discuss and obtain public input on a Water Reuse Feasibility Study. The Study will evaluate the feasibility of expanding the existing water reuse system to provide reclaimed water to City facilities, Texas State University and other private sector customers.
The Meeting will be held on
Monday, July 23, 2012 at
6:00 PM at
The San Marcos Activity Center 501 E. Hopkins
San Marcos, TX 78666
The City of San Marcos does not discriminate on the basis of disability in the admission or access to its services, programs, or activities. Individuals who require auxiliary aids and services for this meeting should contact the City of San Marcos ADA Coordinator at 805-2645 (voice) or 393-8229 (TDD), or call Relay Texas at 7-1-1. Requests can also be sent by e-mail to [email protected]. Jamie Lee Pettijohn, City Clerk Published July 18, 2012
Meeting Agenda
1. Introductions and project overview 2. What is water reuse and history of water reuse in San Marcos 3. Texas Water Development Board Facility Planning Program 4. Study objectives and timeline 5. Reclaimed water quality 6. Questions and comments
stephen.jenkins
Highlight
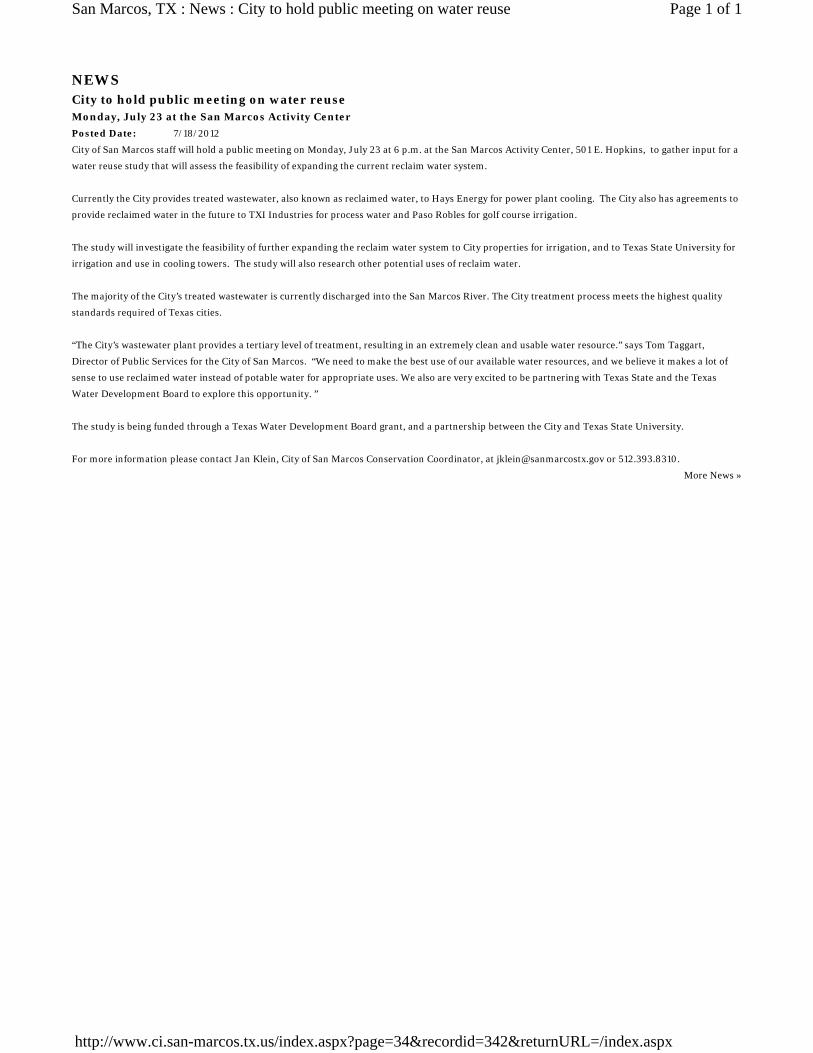
Posted Date: 7/18/2012
More News »
City to hold public meeting on water reuse
Monday, July 23 at the San Marcos Activity Center
City of San Marcos staff will hold a public meeting on Monday, July 23 at 6 p.m. at the San Marcos Activity Center, 501 E. Hopkins, to gather input for a
water reuse study that will assess the feasibility of expanding the current reclaim water system.
Currently the City provides treated wastewater, also known as reclaimed water, to Hays Energy for power plant cooling. The City also has agreements to
provide reclaimed water in the future to TXI Industries for process water and Paso Robles for golf course irrigation.
The study will investigate the feasibility of further expanding the reclaim water system to City properties for irrigation, and to Texas State University for
irrigation and use in cooling towers. The study will also research other potential uses of reclaim water.
The majority of the City’s treated wastewater is currently discharged into the San Marcos River. The City treatment process meets the highest quality
standards required of Texas cities.
“The City’s wastewater plant provides a tertiary level of treatment, resulting in an extremely clean and usable water resource.” says Tom Taggart,
Director of Public Services for the City of San Marcos. “We need to make the best use of our available water resources, and we believe it makes a lot of
sense to use reclaimed water instead of potable water for appropriate uses. We also are very excited to be partnering with Texas State and the Texas
Water Development Board to explore this opportunity. ”
The study is being funded through a Texas Water Development Board grant, and a partnership between the City and Texas State University.
For more information please contact Jan Klein, City of San Marcos Conservation Coordinator, at [email protected] or 512.393.8310.
NEWS
Page 1 of 1San Marcos, TX : News : City to hold public meeting on water reuse
http://www.ci.san-marcos.tx.us/index.aspx?page=34&recordid=342&returnURL=/index.aspx
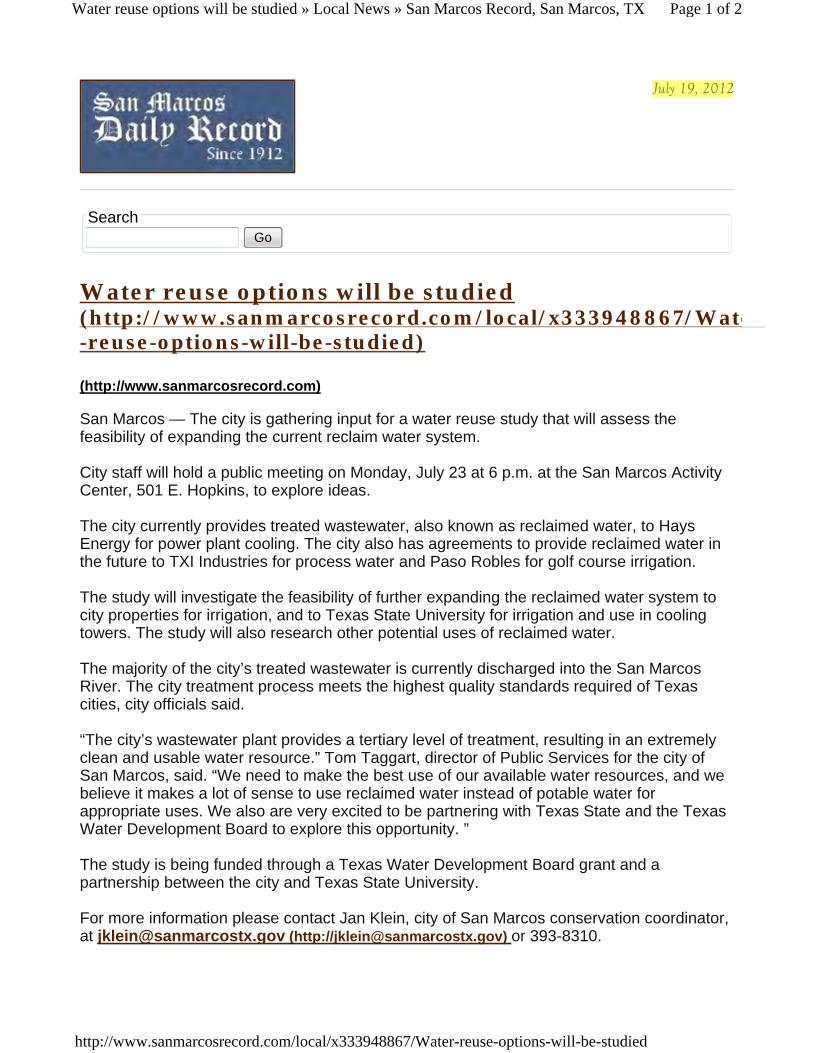
Search Go
Water reuse options will be studied (http://www.sanmarcosrecord.com/local/x333948867/Wate-reuse-options-will-be-studied)
(http://www.sanmarcosrecord.com)
San Marcos — The city is gathering input for a water reuse study that will assess the feasibility of expanding the current reclaim water system. City staff will hold a public meeting on Monday, July 23 at 6 p.m. at the San Marcos Activity Center, 501 E. Hopkins, to explore ideas. The city currently provides treated wastewater, also known as reclaimed water, to Hays Energy for power plant cooling. The city also has agreements to provide reclaimed water in the future to TXI Industries for process water and Paso Robles for golf course irrigation. The study will investigate the feasibility of further expanding the reclaimed water system to city properties for irrigation, and to Texas State University for irrigation and use in cooling towers. The study will also research other potential uses of reclaimed water. The majority of the city’s treated wastewater is currently discharged into the San Marcos River. The city treatment process meets the highest quality standards required of Texas cities, city officials said. “The city’s wastewater plant provides a tertiary level of treatment, resulting in an extremely clean and usable water resource.” Tom Taggart, director of Public Services for the city of San Marcos, said. “We need to make the best use of our available water resources, and we believe it makes a lot of sense to use reclaimed water instead of potable water for appropriate uses. We also are very excited to be partnering with Texas State and the Texas Water Development Board to explore this opportunity. ” The study is being funded through a Texas Water Development Board grant and a partnership between the city and Texas State University. For more information please contact Jan Klein, city of San Marcos conservation coordinator, at [email protected] (http://[email protected]) or 393-8310.
July 19, 2012
Page 1 of 2Water reuse options will be studied » Local News » San Marcos Record, San Marcos, TX
http://www.sanmarcosrecord.com/local/x333948867/Water-reuse-options-will-be-studied
stephen.jenkins
Highlight
1
Community Services Grant Harris, Jr. Bldg PARKS AND RECREATION DEPT. 401 East Hopkins PARKS BOARD San Marcos, Texas 78666 5:30 P.M.
Regular Meeting
Tuesday, January 22, 2013
I. Call to Order
II. Roll Call
III. Citizen Comment Period – (each individual will be limited to 3 minutes; no specific action may be taken on these items)
IV. Approval of the minutes from the December 11, 2012 meeting
V. Public Hearing – Reclaimed Water Usage – Stephen Jenkins, RPS Espey: Solicit public participation and input into
the city’s Direct Water Reuse Feasibility Study. This study is a cooperative effort of the City of San Marcos, Texas State University and the Texas Ware Development Board to evaluate the supply and additional uses of reclaimed water in San Marcos.
VI. Discussion – Planning Development Process – Matthew Lewis, Director of Development Services
VII. Discussion and/or Recommendation – Items for Upcoming Agenda: Members of the board may suggest items to be
placed on future agendas. The board may reach a consensus regarding which items will be placed on future agendas, but may not discuss the substance of the item or take any action on the item at this meeting.
VIII. Question and Answers with Press and Public
IX. Adjournment
Posted on the 18th day of January, 2013, at 3:48pm Notice of Assistance at the Public Meetings The San Marcos Parks and Recreation Department is wheelchair accessible. The entry ramp is located on the right side of the building. Accessible parking spaces are also available in that area. Sign interpretative services for meetings must be made 48 hours in advance of the meeting. Call the Parks and Recreation Department at 512-393-8400 for any special arrangements needed.
stephen.jenkins
Highlight
SAN MARCOS CITY COUNCIL AGENDA
CITY COUNCIL REGULAR MEETING
630 E. HOPKINS; CITY COUNCIL CHAMBERS
WEDNESDAY, OCTOBER 2, 2013
5:30 P.M.
1. Call To Order 2. Roll Call 3. Receive a Staff presentation and hold discussion regarding the Hunter Road Improvements
project from Wonder World Drive to Bishop Street, and provide direction to Staff. NOTE: The City Council may adjourn into Executive Session to consider any item listed on this agenda if a matter is raised that is appropriate for Executive Session discussion. An announcement will be made of the basis for the Executive Session discussion. The City Council may also publicly discuss any item listed on the agenda for Executive Session. 6:00PM 4. Invocation 5. Pledges Of Allegiance - United States And Texas 6. 30 Minute Citizen Comment Period CONSENT AGENDA THE FOLLOWING ORDINANCES, RESOLUTIONS AND OTHER ITEMS NUMBERED 7 - 15 MAY BE ACTED UPON BY ONE MOTION. NO SEPARATE DISCUSSION OR ACTION ON ANY OF THE ITEMS IS NECESSARY UNLESS DESIRED BY A COUNCIL MEMBER OR A CITIZEN, IN WHICH EVENT THE ITEM SHALL BE CONSIDERED IN ITS NORMAL SEQUENCE AFTER THE ITEMS NOT REQUIRING SEPARATE DISCUSSION HAVE BEEN ACTED UPON BY A SINGLE MOTION. 7. Consider approval of the September 13, 2013, Special Called Meeting Minutes and the
September 17, 2013, Regular Meeting Minutes. 8. Consider approval of Ordinance 2013-56, on the second of two readings, designating a No
Parking Tow-Away Zone at all times on both sides of Foxtail Run east of Hunter Road and amending the traffic register maintained under Section 82.067 of the San Marcos City Code to reflect such designation; and including procedural provisions.
9. Consider approval of Ordinance 2013-58, on the second of two readings, establishing a
Comprehensive Plan Oversight Committee; establishing the duties of the committee; including
stephen.jenkins
Highlight
procedural provisions; and providing an effective date. 10. Consider approval of Resolution 2013-147R authorizing the City Manager or his designee
to submit an application to the Edwards Aquifer Authority for a Conservation Grant in the amount of $200,000.00 to initiate engineering activities for expansion of the City’s reclaimed water system; authorizing the City Manager or his designee to accept the grant, if awarded, and to execute all contracts and documents as necessary to implement the grant; and declaring an effective date.
11. Consider approval of Resolution 2013-148R, approving the purchase of electric materials from
Techline, Inc. in connection with the Loop 82 Overpass Project in the estimated amount of $680,000.00 through the City’s Material Acquisition Services Agreement with the Lower Colorado River Authority; authorizing the Purchasing Manager to execute the appropriate purchasing documents on behalf of the Cityand declaring an effective date.
12. Consider approval of Resolution 2013-149R approving a contract between the City and the
Texas Department of State Health Services, Vital Statistics Unit, for the provision of on-line vital statistic computer services for the City; authorizing the City Manager or his designee to execute the agreement on behalf of the City; and declaring an effective date.
13. Consider approval of Resolution 2013-150R authorizing the City Manager to accept the
award of a Emergency Management Performance Grant from the Texas Department of Public Safety Division of Emergency Management (TDEM) for fiscal year 2013 (FY13) in the amount of $27,290.60, and declaring an effective date.
14. Consider approval of Resolution 2013-151R, approving a lease with Martin Marietta Materials
Southwest, Inc. leasing the City’s right to withdraw 450 acre feet of water from the Edwards Aquifer in exchange for payment to the city of $145,800 in lease payments and payment of Edwards Aquifer Management Fees on the City’s behalf in the sum of $37,800; and declaring an effective date.
15. Consider approval of Resolution 2013-152R, authorizing the City Manager to execute a fourth
amended and restated contract for collection and disposal of solid waste and recyclable materials with Texas Disposal Systems, Inc. providing for a change in the size of the Base-Rate Garbage Cart from 96 to 65 Gallon capacity; and declaring an effective date.
PUBLIC HEARINGS 16. 7:00PM Receive a Staff presentation and hold a Public Hearing to receive comments for or
against the Water Reuse Expansion Feasibility Study, and provide direction to Staff. NON-CONSENT AGENDA 17. Consider approval of Ordinance 2013-57, on the second of two readings, amending Chapter 34,
Article 5, Division 2 of the San Marcos City Code by adding provisions to prohibit smoking in the enclosed areas of all public places and workplaces; providing exceptions; providing penalties; providing for severability; and providing an effective date.
18. Consider approval of Ordinance 2013-59, on the first of two readings, amending Chapter
66, Article 2 – Residential and Multifamily Collection and Disposal, Section 66.028 by adding a monthly service fee for Residential Solid Waste Service for a Large Trash Cart
stephen.jenkins
Highlight
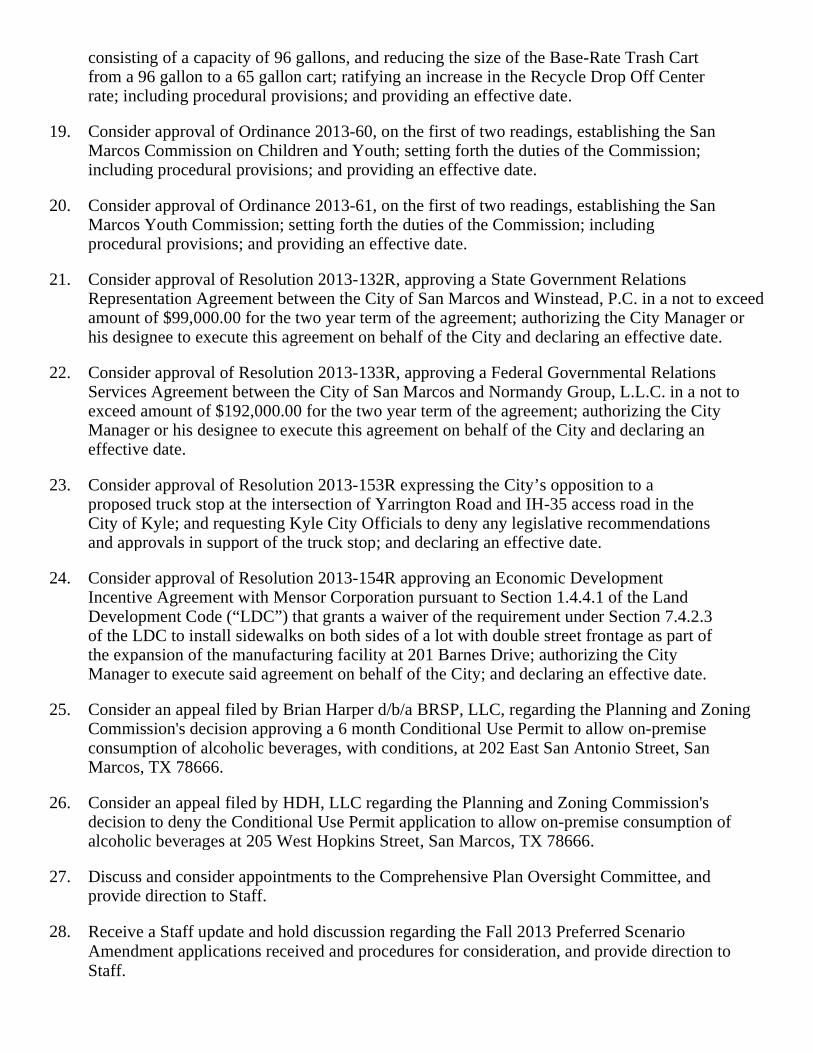
consisting of a capacity of 96 gallons, and reducing the size of the Base-Rate Trash Cart from a 96 gallon to a 65 gallon cart; ratifying an increase in the Recycle Drop Off Center rate; including procedural provisions; and providing an effective date.
19. Consider approval of Ordinance 2013-60, on the first of two readings, establishing the San
Marcos Commission on Children and Youth; setting forth the duties of the Commission; including procedural provisions; and providing an effective date.
20. Consider approval of Ordinance 2013-61, on the first of two readings, establishing the San
Marcos Youth Commission; setting forth the duties of the Commission; including procedural provisions; and providing an effective date.
21. Consider approval of Resolution 2013-132R, approving a State Government Relations
Representation Agreement between the City of San Marcos and Winstead, P.C. in a not to exceed amount of $99,000.00 for the two year term of the agreement; authorizing the City Manager or his designee to execute this agreement on behalf of the City and declaring an effective date.
22. Consider approval of Resolution 2013-133R, approving a Federal Governmental Relations
Services Agreement between the City of San Marcos and Normandy Group, L.L.C. in a not to exceed amount of $192,000.00 for the two year term of the agreement; authorizing the City Manager or his designee to execute this agreement on behalf of the City and declaring an effective date.
23. Consider approval of Resolution 2013-153R expressing the City’s opposition to a
proposed truck stop at the intersection of Yarrington Road and IH-35 access road in the City of Kyle; and requesting Kyle City Officials to deny any legislative recommendations and approvals in support of the truck stop; and declaring an effective date.
24. Consider approval of Resolution 2013-154R approving an Economic Development
Incentive Agreement with Mensor Corporation pursuant to Section 1.4.4.1 of the Land Development Code (“LDC”) that grants a waiver of the requirement under Section 7.4.2.3 of the LDC to install sidewalks on both sides of a lot with double street frontage as part of the expansion of the manufacturing facility at 201 Barnes Drive; authorizing the City Manager to execute said agreement on behalf of the City; and declaring an effective date.
25. Consider an appeal filed by Brian Harper d/b/a BRSP, LLC, regarding the Planning and Zoning
Commission's decision approving a 6 month Conditional Use Permit to allow on-premise consumption of alcoholic beverages, with conditions, at 202 East San Antonio Street, San Marcos, TX 78666.
26. Consider an appeal filed by HDH, LLC regarding the Planning and Zoning Commission's
decision to deny the Conditional Use Permit application to allow on-premise consumption of alcoholic beverages at 205 West Hopkins Street, San Marcos, TX 78666.
27. Discuss and consider appointments to the Comprehensive Plan Oversight Committee, and
provide direction to Staff. 28. Receive a Staff update and hold discussion regarding the Fall 2013 Preferred Scenario
Amendment applications received and procedures for consideration, and provide direction to Staff.

29. Receive an update from the Conditional Use Permit Subcommittee and hold discussion regarding the process, and provide direction to Staff.
30. Hold discussion regarding Grande Communications' recent digitizing of the City's cable channel,
and provide direction to Staff. 31. Question and Answer Session with Press and Public. This is an opportunity for the Press and
Public to ask questions related to items on this agenda. 32. Adjournment. Notice of Assistance at the Public Meetings The City of San Marcos does not discriminate on the basis of disability in the admission or access to its services, programs, or activities. Individuals who require auxiliary aids and services for this meeting should contact the City of San Marcos ADA Coordinator at 512-393-8000 (voice) or call Texas Relay Service (TRS) by dialing 7-1-1. Requests can also be faxed to 512-393-8074 or sent by e-mail to [email protected] I certify that the attached notice and agenda of items to be considered by the City Council was removed by me from the City Hall bulletin board on the _____________________________ day of _____________________________ _________________________________________________ Title: _________________________________________

This page is intentionally blank
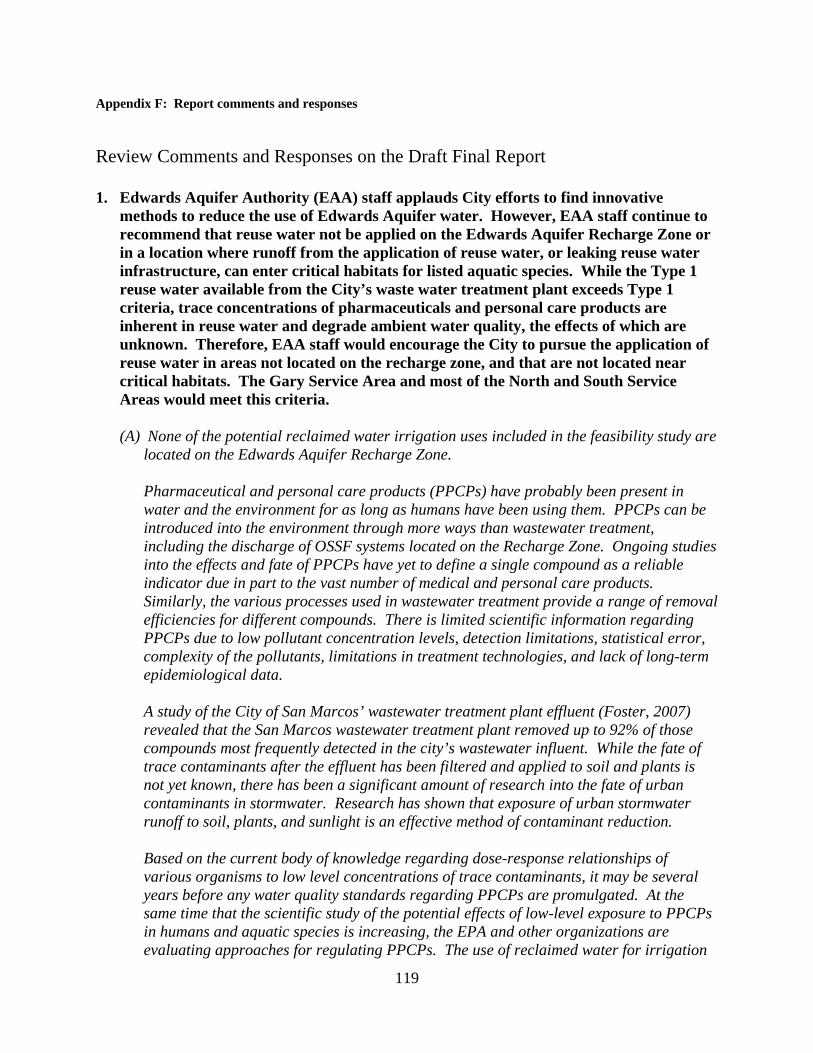
119
Appendix F: Report comments and responses
Review Comments and Responses on the Draft Final Report 1. Edwards Aquifer Authority (EAA) staff applauds City efforts to find innovative
methods to reduce the use of Edwards Aquifer water. However, EAA staff continue to recommend that reuse water not be applied on the Edwards Aquifer Recharge Zone or in a location where runoff from the application of reuse water, or leaking reuse water infrastructure, can enter critical habitats for listed aquatic species. While the Type 1 reuse water available from the City’s waste water treatment plant exceeds Type 1 criteria, trace concentrations of pharmaceuticals and personal care products are inherent in reuse water and degrade ambient water quality, the effects of which are unknown. Therefore, EAA staff would encourage the City to pursue the application of reuse water in areas not located on the recharge zone, and that are not located near critical habitats. The Gary Service Area and most of the North and South Service Areas would meet this criteria. (A) None of the potential reclaimed water irrigation uses included in the feasibility study are
located on the Edwards Aquifer Recharge Zone.
Pharmaceutical and personal care products (PPCPs) have probably been present in water and the environment for as long as humans have been using them. PPCPs can be introduced into the environment through more ways than wastewater treatment, including the discharge of OSSF systems located on the Recharge Zone. Ongoing studies into the effects and fate of PPCPs have yet to define a single compound as a reliable indicator due in part to the vast number of medical and personal care products. Similarly, the various processes used in wastewater treatment provide a range of removal efficiencies for different compounds. There is limited scientific information regarding PPCPs due to low pollutant concentration levels, detection limitations, statistical error, complexity of the pollutants, limitations in treatment technologies, and lack of long-term epidemiological data. A study of the City of San Marcos’ wastewater treatment plant effluent (Foster, 2007) revealed that the San Marcos wastewater treatment plant removed up to 92% of those compounds most frequently detected in the city’s wastewater influent. While the fate of trace contaminants after the effluent has been filtered and applied to soil and plants is not yet known, there has been a significant amount of research into the fate of urban contaminants in stormwater. Research has shown that exposure of urban stormwater runoff to soil, plants, and sunlight is an effective method of contaminant reduction. Based on the current body of knowledge regarding dose-response relationships of various organisms to low level concentrations of trace contaminants, it may be several years before any water quality standards regarding PPCPs are promulgated. At the same time that the scientific study of the potential effects of low-level exposure to PPCPs in humans and aquatic species is increasing, the EPA and other organizations are evaluating approaches for regulating PPCPs. The use of reclaimed water for irrigation
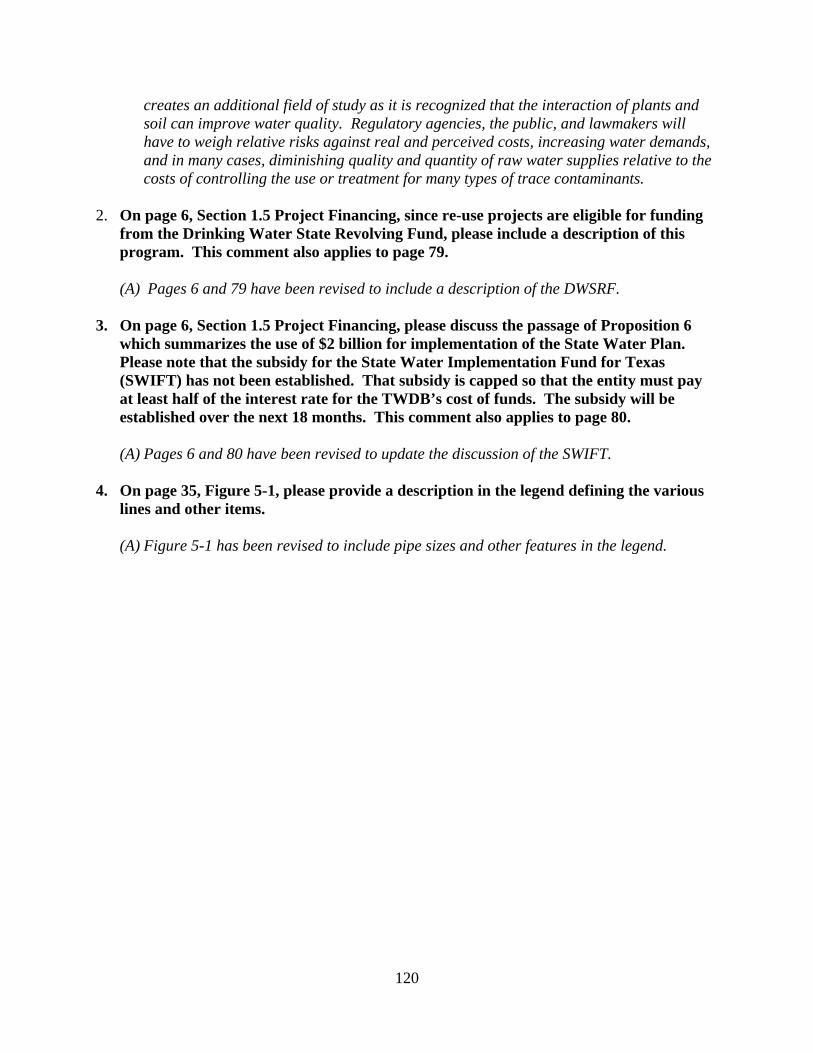
120
creates an additional field of study as it is recognized that the interaction of plants and soil can improve water quality. Regulatory agencies, the public, and lawmakers will have to weigh relative risks against real and perceived costs, increasing water demands, and in many cases, diminishing quality and quantity of raw water supplies relative to the costs of controlling the use or treatment for many types of trace contaminants.
2. On page 6, Section 1.5 Project Financing, since re-use projects are eligible for funding from the Drinking Water State Revolving Fund, please include a description of this program. This comment also applies to page 79. (A) Pages 6 and 79 have been revised to include a description of the DWSRF.
3. On page 6, Section 1.5 Project Financing, please discuss the passage of Proposition 6 which summarizes the use of $2 billion for implementation of the State Water Plan. Please note that the subsidy for the State Water Implementation Fund for Texas (SWIFT) has not been established. That subsidy is capped so that the entity must pay at least half of the interest rate for the TWDB’s cost of funds. The subsidy will be established over the next 18 months. This comment also applies to page 80.
(A) Pages 6 and 80 have been revised to update the discussion of the SWIFT.
4. On page 35, Figure 5-1, please provide a description in the legend defining the various
lines and other items. (A) Figure 5-1 has been revised to include pipe sizes and other features in the legend.