San Gabriel - Los Angeles County,...
12
45 San Gabriel County of Los Angeles Department of Mental Health 550 South Vermont Avenue, Los Angeles CA 90020 Prevention and Early Intervention, Mental Health Services Act PUMA REFERENCE MAP DEMOGRAPHIC PROFILE KEY INDICATORS SUMMARY 3 SERVICE AREA VULNERABLE COMMUNITIES IN LOS ANGELES COUNTY PREVENTION AND EARLY INTERVENTION SERVICE AREA EXECUTIVE SUMMARY
Transcript of San Gabriel - Los Angeles County,...

45
San Gabriel
County of Los Angeles Department of Mental Health 550 South Vermont Avenue, Los Angeles CA 90020
Prevention and Early Intervention, Mental Health Services Act
PUMA REFERENCE MAP
DEMOGRAPHIC PROFILE
KEY INDICATORS SUMMARY
3 SERVICE AREA
VULNERABLE COMMUNITIES IN LOS ANGELES COUNTY
PREVENTION AND EARLY INTERVENTION
SERVICE AREA EXECUTIVE SUMMARY
VULNERABLE COMMUNITIES IN LOS ANGELES COUNTY 46
§̈¦210
§̈¦10§̈¦605
MontereyPark-
Rosemead
HaciendaHeights
La Puente-S. El Monte
DiamondBar
Covina-Walnut
Glendora-Claremont-SanDimas-La Verne
BaldwinPark-Azusa-
Duarte
Arcadia-SanGabriel-TempleCity-San Marino
Alhambra-S.Pasadena
Altadena-Monrovia-
Sierra Madre
WestCovina Pomona
ElMonte
Pasadena
Map Created on 10-Mar-08Street data from Thomas Brothers, Site data from DMH, All Rights Reserved.
I2.5
Miles
City Boundaries
Los Angeles County
Los Angeles City
Other Cities (Other Colors)
PUMA
Service Area
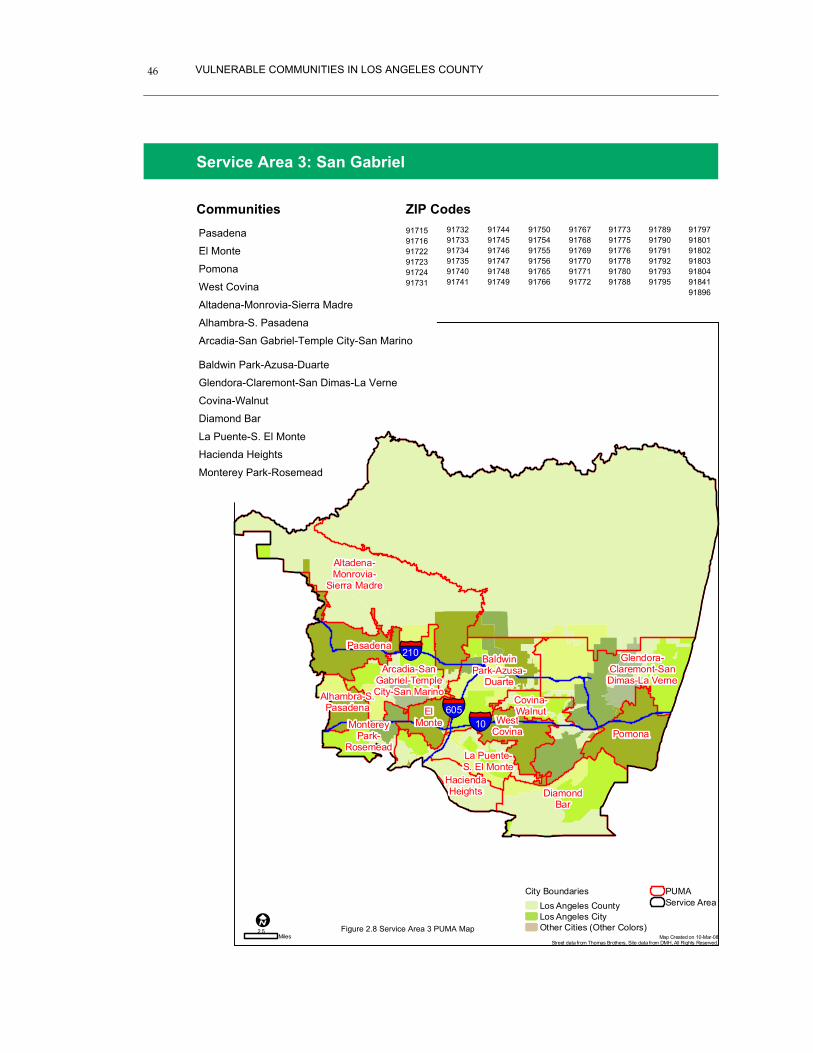
Pasadena
El Monte
Pomona
West Covina
Altadena-Monrovia-Sierra Madre
Alhambra-S. Pasadena
Arcadia-San Gabriel-Temple City-San Marino
Baldwin Park-Azusa-Duarte
Glendora-Claremont-San Dimas-La Verne
Covina-Walnut
Diamond Bar
La Puente-S. El Monte
Hacienda Heights
Monterey Park-Rosemead
ZIP Codes Communities
Service Area 3: San Gabriel
91715 91716 91722 91723 91724 91731
91732 91733 91734 91735 91740 91741
91744 91745 91746 91747 91748 91749
91750 91754 91755 91756 91765 91766
91767 91768 91769 91770 91771 91772
91773 91775 91776 91778 91780 91788
91789 91790 91791 91792 91793 91795
91797 91801 91802 91803 91804 91841 91896
Figure 2.8 Service Area 3 PUMA Map

47
Demographic Profile
Ethnic Diversity: Distinct Ethnic Communities Service Area 3 (SA3) includes a large number of cities: Pasadena, El Monte, Pomona, West Covina, Alhambra, South Pasadena, Arcadia, San Gabriel, Temple City, Baldwin Park, Azusa, Duarte, Glendora, Claremont, San Dimas, Covina, Walnut, Diamond Bar, La Puente, South El Monte, Monterey Park, and Rosemead. The total population of SA3 is 1.6 million. Latinos are the largest ethnic group in the area and account for 45% of the popu‐lation. This is followed by Asians (23.7%), Western European Whites (23.3%), and Afri‐can‐American (3.9%). Russian, Iranian, Ar‐menian, Other Middle Eastern, South Asian, American Indian, Pacific Islander, and Multi‐ethnic Individuals are other ancestry groups numbering over 1,000 individuals. As in other service areas, it is possible to identify areas where large numbers of ethnic groups have chosen to settle.
Latinos are a majority of the population in the following communities:
El Monte (64.9%)
Pomona (70.4%)
West Covina (52.5%)
Baldwin Park‐Azusa‐Duarte (73.3%)
La Puente‐South El Monte (83.9%)
Western European Whites are a majority in the community of Glendora‐Claremont‐San Dimas‐La Verne (57.7%).
Asians are a majority in Monterey Park‐Rosemead (58.4%) and over 40% of the popu‐lation in the following areas:
Alhambra‐South Pasadena (47.5%)
Arcadia‐San Gabriel‐Temple City‐San Marino (47.5%)
Diamond Bar (50.2%)
This is also reflected in the primary language spoken at home. About 39% of all house‐holds in the service area speak English; 32% speak Spanish at home. In general, in areas populated by Latinos, Spanish is reported as the language spoken at home. For the most part, the remaining non‐English/non‐
SERVICE AREA 3: SAN GABRIEL
VULNERABLE COMMUNITIES IN LOS ANGELES COUNTY 48
Spanish‐speaking households have an Asian language as their language spoken at home. The largest of these areas are found in the Diamond Bar area, where 10.4% speak Ko‐rean at home; in El Monte, where 11.3% of families speak Vietnamese at home; and in the Alhambra‐S. Pasadena area, where 17.1% of residents speak Chinese at home.
Age Distribution: Slightly Older Population Age‐wise, the service area closely resembles the countywide distribution of age groups, though there are, perhaps, slightly more older adults in this area than the county av‐erage. The largest number of young children live in the Baldwin Park‐Azusa‐Duarte area both in terms of actual numbers and relative percentage of the population. The Arcadia‐San Gabriel‐Temple City‐San Marino area is home to the largest numbers of older adults also in terms of actual numbers and relative percentage of the population.
Economic Diversity: Above‐average Incomes The median household income in the service area of $53,263 was higher than the county median of $48,282. Mean incomes were also higher than the county mean income. It is important to consider both median and mean statistics when examining incomes. The me‐dian or mid‐point gives a better indication of the typical level of income reported by indi‐viduals within the service area. The mean or arithmetic average, however, is a better sta‐tistic to compare different geographical ar‐eas, such as between and across service ar‐eas. Mean incomes ranged from the low of $45,644 in the La Puente‐S. El Monte area to $90,186 in the Glendora‐Claremont‐San Di‐
mas‐La Verne area. Home ownership of 61.3% was above the county average of 48.9%. The Diamond Bar, Covina‐Walnut, and Glendora‐Claremont‐San Dimas‐La Verne areas had home ownership rates ap‐proaching 80%.
In terms of household size, the El Monte, Pomona, Baldwin Park‐Azusa‐Duarte, and La Puente‐S El Monte areas had households that were larger than other parts of the ser‐vice area.
Memory and Educational Attainment: Lower Memory Problems, More College Graduates In terms of mental disability as measured by the ACS, 4.3% of individuals in Service Area 3 reported memory problems, lower than the countywide average of 4.6%. The Glendora‐Claremont‐San Dimas‐La Verne area had the lowest rates of memory problems reported at 2.6%, while the Pasadena community re‐ported the highest levels of memory prob‐lems (5.9%). Educationally, Service Area 3 had a college graduation rate of 29.0% (in adults 25+), slightly exceeding the county‐wide average of 27.8%. The community of Pasadena had the highest number of college graduates in the service area (49.1%), while the La Puente‐S. El Monte area had the few‐est college graduates (6.9%).
49
Underserved Cultural Populations
Ethnicity Within Service Area 3, Hispanics are the most populous ethnic group and comprise 45.0% of the area’s population; Asians and Western European Whites each account for 23% of the overall population. No other group has over 5% of the total service area population. Within the service area commu‐nities, Pomona and the aggregate of Baldwin Park‐Azusa‐Duarte, are among the largest Hispanic communities in the county. The San Gabriel Valley is home to the largest propor‐tion of Asians within the county with 33.6% of their entire population residing within its boundaries. Looking closer reveals four of the largest Asian communities are found within Service Area 3. The largest commu‐nity of Western European Whites may be found in the aggregate of Glendora‐Claremont‐San Dimas‐La Verne. Three other communities are home to relatively large groups of American Indians/Alaskan Natives and Pacific Islanders though these individu‐als make up less than 10% of their respective community populations (Glendora‐Claremont‐San Dimas‐La Verne, Arcadia‐San Gabriel‐Temple City‐San Marino, and La Puente‐S. El Monte areas).
Primary Language English (38.6%) is the most commonly listed Primary Language for the San Gabriel Valley followed by Spanish (31.7%) and Chinese (6.3%). The Service area has four language groups whose largest proportion of speakers
throughout the county resides there: Canton‐ese, Chinese, Mandarin, and Vietnamese. This is most evident when examining the service area composite communities of Al‐hambra‐S. Pasadena, Arcadia‐San Gabriel‐Temple City‐San Marino, Covina‐Walnut, Diamond Bar, and Monterey Park‐Rosemead. English speakers are the majority in two communities, Altadena‐Monrovia‐Sierra Madre and Glendora‐Claremont‐San Dimas‐La Verne, while Spanish speakers are the majority in three: Pomona, Baldwin Park‐Azusa‐Duarte, and La Puente‐S. El Monte. Other Asian language groups have relatively large communities, such as Korean speakers in the Diamond Bar area, Vietnamese speak‐ers in Monterey Park‐Rosemead area, and Tagalog speakers in the West Covina area.
Linguistic Isolation In terms of Linguistic Isolation, the San Gabriel Valley had an overall isolation score of 7.0%, which was a slightly below the county score of 7.8%. Drilling down into the composite communities of the service area indicated that three areas had Linguistic Iso‐lation scores in excess of 10%: the Alhambra‐S. Pasadena area (10.9%), largely Spanish and Chinese‐speaking; the Monterey Park‐Rosemead area (15.2%), largely Spanish, Chi‐nese, and Vietnamese‐speaking; and the El Monte area (17%), largely Spanish, Chinese, and Vietnamese‐speaking. It is especially important to review the community level data for the San Gabriel Valley because like the San Fernando Valley, the difference in neighborhoods is quite dramatic. One might
SERVICE AREA 3: SAN GABRIEL
Key Indicators: Summary and Excerpts

VULNERABLE COMMUNITIES IN LOS ANGELES COUNTY 50
be tempted to think that because the service area percentage is actually below the county percentage that isolated households are less commonly encountered there. Instead, the numbers clearly indicate that for these three communities, large numbers of Linguistically Isolated households do exist.
Individuals Experiencing Onset of Serious Psychiatric Illness
Serious Mental Illness Penetration Rate The overall Penetration Rate for Service Area 3 was 0.17, below the countywide rate of 0.34. Such a figure suggested that the local mental health resources may have a smaller reach into the SMI population than other parts of the county. Across ethnicities, Asians (0.04) were the least‐served by county mental health services. Following this, in order of Penetration Rates, were the White popula‐tion (0.12), the Latino population (0.16), the Native American population (0.38) and the African‐American population (0.52).
Depressive Disorders Age Groups Service Area 3 clients accounted for 11.4% of depressed clients in the county. No age group had a majority of depressed clients in the service area. Examining the relative dif‐ferences within each community indicated that some areas predominantly treated either children (0‐15) or adults (26‐59). Five areas, for example, had children as the majority of clients (the West Covina, Alhambra‐S. Pasa‐dena, Baldwin Park‐Azusa‐Duarte, Covina‐Walnut, and Hacienda Heights areas). Three communities treated a majority of adults (the Arcadia‐San Gabriel‐Temple City‐San Mar‐
ino, La Puente‐S. El Monte, and Monterey Park‐Rosemead areas). Across the service area, the largest proportion of clients (26.8%) were served in the Pasadena area.
Ethnicity Latinos were a majority of depressed clients served in Service Area 3 (53.3%). This was followed by White clients, 16.7%; African‐American clients; 12.0%, and Asian clients, 7.0%. Native American and Pacific Islander clients each accounted for less than 1% of the population served in the service area. Exam‐ining the composite communities in further detail showed that in nine communities, Lati‐nos were a majority of depressed clients served (the El Monte, Pomona, West Covina, Alhambra‐S. Pasadena, Baldwin Park‐Azusa‐Duarte, Glendora‐Claremont‐San Dimas‐La Verne, La Puente‐S. El Monte, and Hacienda Heights areas). Asians were the majority of depressed clients served in one area, Mon‐terey Park‐Rosemead. No other ethnic group constituted a majority of depressed clients in the service area.
Co‐occurring Disorders (COD) Age Groups Service Area 3 clients accounted for 8.1% of individuals with COD treated in the county’s mental health system. The majority of clients with a COD were adults (57.5%), followed by the TAY group (25.7%), children (14.4%), and older adults (2.5%). While most communities followed the countywide trend in treating a majority of adults, there were three excep‐tions to this. Two communities, the Alham‐bra‐S. Pasadena area and the Hacienda Heights area ,treated a majority of clients with COD who were children. One commu‐nity, the Baldwin Park‐Azusa‐Duarte area,
51
saw that a majority of their COD cases were youths from the TAY group. Eight communi‐ties saw the majority of their COD cases from the adult group (the El Monte, Pomona, West Covina, Altadena‐Monrovia‐Sierra Madre, Acadia‐San Gabriel‐Temple City‐San Marino, Covina‐Walnut, La Puente‐S. El Monte, and Monterey Park‐Rosemead areas). Across the service area, 31.5% of clients with a COD were treated in the Pasadena area. This was followed by the Arcadia‐San Gabriel‐Temple City‐San Marino area (24.0%) and the La Puente‐S. El Monte area (10.4%).
Ethnicity Latino clients accounted for 45.7% of the COD population treated in Service Area 3. This was followed by White clients (26.7%), African‐American clients (14.1%), and Asian clients (2.7%). Native American and Pacific Islander groups each accounted for less than 1% of the COD population in the service area. When compared with population esti‐mates for these groups, COD percentages were similar to population counts for Latinos and Whites. However, it was clear that Afri‐can‐Americans (4.6%) were overrepresented in the COD client counts, while Asians (24.4%) were underrepresented. In six com‐munities, Latinos were a majority of clients with a COD: the Alhambra‐S. Pasadena, Baldwin Park‐Azusa‐Duarte, Glendora‐Claremont‐San Dimas‐La Verne, Covina‐Walnut, La Puente‐S. El Monte, and Haci‐enda Heights areas. In one community, the Monterey Park‐Rosemead area, Asians were a majority of COD clients, but this particular area only accounted for 1.3% of the total COD population for the service area.
Children/Youth in Stressed Families
Poverty The overall poverty rate in Service Area 3, 34.4%, was below the county figure of 38.7%. Across the service area, the El Monte (56.3%) and La Puente‐S. El Monte areas (50.4%) had the highest rates of individuals living be‐neath the 200% FPL. Examining the ethnic groups within the service area indicated that the Hispanic population were a majority of the poverty population (61.6%). Over 50% of the Hispanic population in four communities in the San Gabriel Valley were living below the 200% FPL: the El Monte area (58.0%), the Pomona area (56.2%), the Baldwin Park‐Azusa‐Duarte area (57.1%), and the La Puente‐S. El Monte area (56.3%). In the El Monte community, 53.5% of the Asian popu‐lation were living below the 200% FPL. In four communities, over 50% of African‐Americans were living under this level, the Pasadena area (55.3%), the El Monte area (53.1%), the La Puente‐S. El Monte area (75.8%), and the Monterey Park‐Rosemead area (89.9%); in three communities, over 50% of the American Indian population were liv‐ing below this level, the El Monte area (100%), the Baldwin Park‐Azusa‐Duarte area (51.5%), and the La Puente‐S. El Monte area (100%). It should be noted that, in actual numbers, African‐Americans and American Indians living in poverty accounted for only 1.9% of the service area’s total population.
Unemployment Rate Service Area 3 had an overall self‐reported unemployment rate of 6.2, which was below the countywide average of 7.4%. Only one
SERVICE AREA 3: SAN GABRIEL

VULNERABLE COMMUNITIES IN LOS ANGELES COUNTY 52
community had an unemployment rate above 10%, the El Monte area (12.1%). Three communities had relatively low unemploy‐ment rates, the West Covina area (3.3%), the Alhambra‐S. Pasadena area (4.8%), and the aggregate Arcadia‐San Gabriel‐Temple City‐San Marino area (3.8%).
Disrupted Families Service Area 3 had an overall DF ratio of 2.7, which was higher than the countywide aver‐age of 2.7. Communities across the service area ranged widely in their DF scores. The West Covina area yielded the lowest DF ratio in the county (0.9) along with the West LA area in Service Area 5. A DF ratio less than 1 indicated that there were more single parent families in a given area than two parent families. Two other communities saw DF ratios below 2.0: the Pasadena area (1.3) and the Altadena‐Monrovia‐Sierra Madre area (1.8). On the other end of the spectrum, two communities, the Glendora‐Claremont‐San Dimas‐La Verne area and the Monterey Park‐Rosemead area, had a DF ratio equal to 5.0, or a 5:1 ratio of intact families to single‐parent families.
Safe Place to Play (Countywide Summary Only) Age Groups Across the three age groups reported, there appeared to be a trend in parent‐report. Par‐ents were more likely to report that a safe place to play was less available for older chil‐dren than for younger ones.
Ethnicity There did not appear to be any significant difference between parent reports across eth‐nicities.
Trauma-exposed Individuals
Child Abuse Child Abuse and Neglect Base Rates Service Area 3 had an overall CAN Rate of 1.01, which was slightly above the county rate. Across the service area, 23.1% of all SCAN reports were eventually substantiated. Two areas, Pomona (1.60) and El Monte (1.57), had CAN Rates greater than 84% or more of the county’s communities, (i.e., rates were in excess of one standard deviation from the mean).
Triage Response Acuity Service Area 3 had an overall Acuity score of 0.13, which was below the countywide score of 0.15. Four communities had Acuity scores that were at or above this figure: the El Monte area (0.19), the Pomona area (0.19), the Baldwin Park‐Azusa‐Duarte area (0.17), and the La Puente‐ S. El Monte area (0.15).
Ethnicity Across Service Area 3, 85.6% of SCAN Re‐ports involved three ethnic groups: African‐American, White, and Hispanic. Overall, Af‐rican‐American children accounted for 8.4% of SCAN Reports, White children, 14.0%, and Hispanic children, 63.2%. Only two other ethnic groups accounted for more than 1% of victimized children: Chinese, 2.3%, and Mexican, 2.3%. Hispanic children accounted for a majority of abuse reports in eleven com‐munities: the Pasadena area, the El Monte area, the Pomona area, the West Covina area, the Alhambra‐S. Pasadena area, the Baldwin Park‐Azusa‐Duarte area, the Covina‐Walnut area, the Diamond Bar area, the La Puente‐S. El Monte area, the Hacienda Heights area, and the Monterey Park‐Rosemead area.

53
Elder and Dependent Adult Abuse Service Area 3 had an APS Rate1 of 2.0, which was below the countywide rate. Within the service area, the Altadena‐Monrovia‐Sierra Madre aggregate (2.9) had the highest APS Rate1 followed by the Pomona Area (2.7).
Posttraumatic Stress Disorder (PTSD) Age Groups Service Area 3 accounted for 13.1% of the county’s PTSD cases. In terms of age groups, children (0‐15) accounted for a majority of PTSD cases treated in the service area (68.7%). This strong majority was seen in all but a few composite communities. Only the Arcadia‐San Gabriel‐Temple City‐San Mar‐ino area and the La Puente‐S. El Monte areas, which had majorities of Adult (26‐59) cases, were exceptions to this trend. Across the ser‐vice area, the Pasadena area accounted for 29.1% of the total PTSD cases seen in the San Gabriel Valley. This was followed by the Glendora‐Claremont‐San Dimas area, 14.1%; the remainder of cases was distributed fairly evenly across the remaining communities.
Ethnicity Latino clients accounted for 60.0% of the PTSD population treated in Service Area 3. This was followed by African‐American cli‐ents (15.2%), White clients (13.2%), and Asian clients (3.2%). Native American and Pacific Islander groups each accounted for less than 1% of the PTSD population in the service area. When compared with popula‐tion estimates for these groups, African‐Americans (4.6%) were over represented in the PTSD client counts, while Asians (24.4%), Latinos (45.0%), and Whites (24%) were un‐derrepresented. In ten communities, Latinos
were a majority of clients diagnosed with PTSD: the El Monte, Pomona, West Covina, Alhambra‐S. Pasadena, Altadena‐Monvovia‐Sierra Madre, Baldwin Park‐Azusa‐Duarte, Glendora‐Claremont‐San Dimas‐La Verne, Covina‐Walnut, La Puente‐S. El Monte, and Hacienda Heights areas. No other ethnic group accounted for a majority of PTSD cases within the composite communities be‐sides Latinos.
Homelessness Age Groups In Service Area 3, annual homeless estimates for 2007 indicated that the 25‐55 Age Group constituted a majority (65.2%) of the homeless population. This was followed by the Under 18 Age Group at 15.1%, the 56+ Age Group at 11.1%, and the 18‐24 Age Group at 8.7%.
Ethnicity Within Service Area 3, Hispanic or Latinos accounted for a majority of the homeless population (58.9%). Black/African‐Americans accounted for 20.5% of the homeless population; Whites, 16.6%, and Multi‐Racial or Others accounted for 4.0% of the homeless population.
Sub‐populations In Service Area 3, 31.1% of the homeless population reported that they had a mental illness; 31.3% of homeless individuals reported they were substance abusers; and 9.6% reported they were victims of domestic violence.
SERVICE AREA 3: SAN GABRIEL
VULNERABLE COMMUNITIES IN LOS ANGELES COUNTY 54
Children/Youth at Risk for School Failure
4‐year Dropout Rate (Countywide Summary Only) State figures indicated that over a quarter of all students in Los Angeles County drop out from high school over a four‐year period. Examining ethnic categories indicated that African‐American students were most at risk for not finishing high school followed by Pa‐cific Islander, American Indian/Alaska Na‐tive, and Hispanic or Latino Students. 15.5% of White students drop out from high school. Two ethnic groups had dropout rates below this: Asian, 7.4%, and Filipino, 12.8%.
High School Graduation Rates The San Gabriel Valley had the second high‐est graduation rate in the county, 86.8%. Across the service area, the Altadena‐Monrovia‐Sierra Madre aggregate had the lowest overall graduation rate of all commu‐nities, 66.3%. Three ethnic groups had very low graduation rates within this community: Pacific Islanders, Hispanics, and African‐Americans. Overall, across service area eth‐nic groups, American Indian or Alaskan Na‐tives had the lowest graduation rate (66.1%). In two communities, the Pasadena and Bald‐win Park‐Azusa‐Duarte areas, this figure was less than 50%, or less than one out of every two students.
English Fluency Service Area 3 had an overall fluency rate of 74.2% in its student population, which was above the countywide figure of 68.3%. Al‐though two communities, the El Monte area (57.6%) and the Pomona area (53.3%), had relatively low fluency rates, this did not ap‐
pear to impact the high school graduation rates noted above, which were relatively high. A majority of residents in the these two areas spoke Spanish as their primary lan‐guage.
3rd Grade Reading Level Overall, 36.5% of Service Area 3 third grad‐ers scored at or above the 50th percentile in standardized reading tests. The two lowest scores were found in the El Monte area (23.9%) and the Pomona area (20.8%) where English Fluency was low. Across ethnic groups, 13.9% of African‐American students scored at or above the 50th percentile (and this was the lowest score for African‐American students across all service areas). Filipino (9.0%), Korean (9.6%), and Vietnam‐ese (16.4%) student reading scores were very low in the third grade. Over 50% of White and Chinese third graders scored above the 50th percentile in reading. Examining high school graduation rates for Asian groups (though aggregated differently from the third grade data) appeared to be quite high. (This may either be due to these groups over‐coming their language barrier or the impact of aggregating the lower performing Asian groups with the more populous and higher performing Chinese group.)
Children/Youth at Risk of or Experiencing Juvenile Justice Involvement
School Discipline Service Area 3 had an overall suspension rate of 3.8%, which was close to the countywide rate of 3.7%. The Pomona area (5.9%) had the highest suspension rate throughout the ser‐
55
vice area., though this did not translate into the highest expulsion rates. That distinction was held jointly by the Alhambra‐Monrovia‐Sierra Madre and Glendora‐Claremont‐San Dimas‐La Verne areas at 0.5%, or one out of every two hundred students.
Juvenile Felony Arrests (Countywide Summary Only) Of the 23,787 youths arrested on felony charges during the reporting period, 84.2% were males, 15.8%, females. Ethnically, His‐panic youths were involved in the majority of felony arrests (57.2%), followed by Black/African‐American youths (30.3%), and Whites (9.1%). All other ethnicities combined accounted for less than 4% of the juvenile felony arrests.
Youths on Probation Camp Population Service Area 3 had a total of 278 youths sent to camp with the Pomona and Baldwin Park‐Azusa‐Duarte areas consigning the most numbers. Of these, 69.3% were Hispanic, 17.6% were African‐American, and 8.4% were White.
Supervised Youths Service Area 3 had over 3,000 youths under supervision and a majority of these were His‐panic (71.7%). This was followed by African‐American youth (12.2%) and White youth (9.9%). The largest Asian group, Chinese youth, accounted for 1% of the youths under supervision. Within the service area, the Baldwin Park‐Azusa‐Duarte area had the most numbers of youth under supervision, followed by the Pomona and El Monte areas.
Key Indicators of Stigma and Discrimination
Language Capacity of Mental Health Providers Across the service area, Chinese (1), Tagalog (6), and Vietnamese (5) speakers had the few‐est staffing resources available to them. Staff‐ing ratios for English speakers (42) was ex‐ceeded only by the staffing ratio for Russian speakers (82) in populations over 1,000 indi‐viduals. Within the service area communi‐ties, Spanish speakers saw low staffing ratios in the Pomona area (4), the Baldwin Park‐Azusa‐Duarte area (2), the Diamond Bar area (0), and the Hacienda Heights area (0). Can‐tonese speakers saw low staffing ratios in the communities of Covina‐Walnut (0) and Dia‐mond Bar (0). Chinese speakers saw low staffing ratios (below 5) in all communities with the exception of the Pasadena area. Mandarin speakers saw similarly low staff‐ing ratios in the Alhambra‐S. Pasadena area (3) and the Diamond Bar area (0). Korean speakers saw staffing ratios below 5 in the Pomona area (0), the Arcadia‐San Gabriel‐Temple City‐San Marino area (2), the Co‐vina‐Walnut area (4), the Diamond Bar area (0), and the Hacienda Heights area (0). Viet‐namese speakers saw staffing ratios below 5 in all large communities, (i.e., over 1,000 indi‐viduals), with the exception of the Monterey Park‐Rosemead area (7). Tagalog speakers saw low staffing ratios in the Pomona area (4), the West Covina area (2), the Arcadia‐San Gabriel‐Temple City‐San Marino area (0), the Baldwin Park‐Azusa‐Duarte area (0), the Diamond Bar area (0), and the Hacienda Heights area (0).
SERVICE AREA 3: SAN GABRIEL

VULNERABLE COMMUNITIES IN LOS ANGELES COUNTY 56
Key Indicators of Suicide Risk
Deaths by Suicide Overall, Service Area 3 had a suicide rate of 5.4, which was below the countywide rate of 7.0. Mirroring countywide trends, summary statistics indicated that Whites, Males, and Older Adults were at most risk for commit‐ting suicide. Whites (52.6) residing in the La Puente‐S. El Monte area had the highest rates in the service area. Whites also had a rela‐tively high rate in the Monterey Park‐Rosemead area (29.8). African‐Americans (26.7) were at risk in the Glendora‐Claremont‐San Dimas‐La Verne area. Adults and Older adults were at risk throughout the service area; seven areas had rates above 10/100,000 for either or both of these groups: the Alhambra‐S. Pasadena, Arcadia‐San Gabriel‐Temple City‐San Marino, Baldwin Park‐Azusa‐Duarte, Glendora‐Claremont‐San Dimas‐La Verne, Covina‐Walnut, and La Puente‐S. El Monte areas.
Mental Health Emergency Statistics Overall, Service Area 3 had a MHE‐Rate of 5.0, which was below the countywide rate of 5.9. Only one community, the aggregate of Glendora‐Claremont‐San Dimas‐La Verne, saw the number of psychiatric emergency calls placed exceed 1,000. Otherwise, based upon population, the highest MHE‐Rates were found in the El Monte area (7.2), the Altadena‐Monrovia‐Sierra Madre area (7.0), and the Glendora‐Claremont‐San Dimas‐La Verne (6.6) area.