San Diego County In-Home Supportive Services Process Analysis IHSS Process Analysis Report,...
117
San Diego County In-Home Supportive Services Process Analysis Presented to the San Diego County Health and Human Services Agency, with support from the Alliance Healthcare Foundation 2009 Prepared by Cobbweb Associates 8/18/2009 San Diego Taxpayers Educational Foundation
Transcript of San Diego County In-Home Supportive Services Process Analysis IHSS Process Analysis Report,...

San Diego County In-Home Supportive Services Process Analysis Presented to the San Diego County Health and Human Services Agency, with support from the Alliance Healthcare Foundation
2009
Prepared by Cobbweb Associates 8/18/2009
San Diego Taxpayers Educational Foundation

2
TABLE OF CONTENTS Acknowledgements ............................................................................................................... 4
Executive Summary ............................................................................................................... 5
Introduction ........................................................................................................................ 10
General Methodology .......................................................................................................... 18
IHSS Program Administration and Subpopulation Analysis ................................................... 19
Methodology ............................................................................................................................... 19
IHSS Program Administration Analysis: Management Statistics Summary: Cases, Hours, Payments 21
IHSS Program Administration Analysis: Recipient Summary Characteristic Listing .......................... 36 PCSP vs. IHSS CASES (combined Waiver and Residual programs)....................................................................... 36
IHSS Program Administration Analysis: Service Assessment Summary ........................................... 40
IHSS Program Administration Analysis: Application, Approval, Denial, Termination Report ............ 48
Subpopulation Analysis ................................................................................................................ 53
Fraud Analysis ..................................................................................................................... 59
Fraud Analysis Methodology ........................................................................................................ 59
MCI Fraud Process Map Analysis ................................................................................................... 59
Fraud Data Analysis ...................................................................................................................... 63
Fraud Rates and Fraud Detection Rates ......................................................................................... 68 Fraud Issues and Proposed Solutions by Governor and District Attorneys: July 6, 2009. .................................. 69
Areas of opportunity: San Diego County Fraud Efforts ................................................................... 70
San Diego County IHSS Process Mapping Analysis ................................................................ 77
Methodology ............................................................................................................................... 77
Results ......................................................................................................................................... 77
Referral, Application, and Assessment .......................................................................................... 78
Recertification .............................................................................................................................. 78 Medi-Cal Share of Cost ....................................................................................................................................... 79 Urgent Service ..................................................................................................................................................... 80 Appeals ............................................................................................................................................................... 81 Health Benefits ................................................................................................................................................... 81 Overpayment ...................................................................................................................................................... 82
Areas of Opportunity .................................................................................................................... 82 Process Maps Improvements .............................................................................................................................. 82

3
Call Center ........................................................................................................................................................... 83 CMIPS II ............................................................................................................................................................... 84
Discussion ........................................................................................................................... 85
Latest IHSS Reform from California Legislature .............................................................................. 88
Other IHSS Reform Ideas .............................................................................................................. 92
Conclusions ......................................................................................................................... 98
References......................................................................................................................... 101
Appendix A: California IHSS Report Comparison (1 of 4) ..................................................... 103
Appendix B: Fraud Process Map ......................................................................................... 108
Appendix C: Fraud Data Example ....................................................................................... 109
Appendix D: Complete IHSS Process Map ........................................................................... 117

4
ACKNOWLEDGEMENTS This project was directed by the San Diego Taxpayers Educational Foundation and funded by the Alliance Healthcare Foundation (AHF) of San Diego, California.
San Diego Taxpayers Educational Foundation subcontracted with Cobbweb Associates to design and conduct the analysis of the project.
Cobbweb Associates is a San Diego based registered veteran-owned small business specializing in healthcare research and process improvement services.
The authors wish to thank the following individuals and organizations for their support to this project:
• Nick Macchione, MS, MPH, FACHE, Director, Health and Human Services Agency • Ellen Schmeding, MFT, Operations Chief, Health and Human Services Agency, Aging
and Independence Services • Vickie Macedo, Social Worker Supervisor, Health and Human Services Agency, Aging
and Independence Services • Lani Lutar, President and CEO, San Diego County Taxpayers Association • Karma Bass, President and CEO, Alliance Healthcare Foundation

5
EXECUTIVE SUMMARY The In-Home Supportive Services (IHSS) program is an immediate priority of the San Diego
County Health and Human Services Agency (HHSA). On March 24, 2009 the San Diego
County Board of Supervisors directed the County’s Chief Administrative Officer to develop
a proposal to reform the In-Home Supportive Services (IHSS) program within 180 days.
This IHSS Process Analysis was conducted in parallel to the HHSA IHSS Reform Project,
independent of the County’s project activities.
Background
• IHSS was started in 1973 and provides assistance to low income disabled persons
and seniors as an alternative to out-of-home placement.
• The State of California sets the program guidelines and counties administer the
program.
• There are 440,000 IHSS enrollees in California with nearly 25,000 in San Diego
County.
• The cost to provide this service is over $5 billion statewide and $274 million in San
Diego County. In FY 2008- 2009, 16% of the County IHSS program’s total
expenditures (or $43 million) was paid for with County general fund dollars. The
County utilizes Social Services Realignment funding to meet the County share of
IHSS.
• IHSS was a minimum wage job prior to the mid 1990’s.
• After successful union drives, IHSS provider wages, which are set by each county,
have increased from $5.75 to $12.10 statewide, an increase of 110% in the last
decade.
• Annual caseload growth rate has been reported as 7% and costs have been reported
as increasing by over 9% each year.
• San Diego County officials report diverting funds to IHSS, mostly from children’s
programs.
6
General Methodology
• We reviewed approximately 50 San Diego County reports and documents.
• We examined Federal law, State of California IHSS legislation & regulations,
San Diego County IHSS program policy and procedures, and other documentation
relating to the program including a recent San Diego County audit of the IHHS
program.
• We conducted interviews with key IHSS staff as well as attended Management
Control Initiative (MCI) meetings.
• We evaluated a recent San Diego County IHSS program process mapping study.
• We conducted data analysis of IHSS program fraud including: Public Assistance
Fraud Division (PAFD) fraud referrals, prosecutions, and convictions.
• We conducted data analysis of San Diego County IHSS program from the Case
Management, Information and Payrolling System (CMIPS) system for the purpose of
subpopulation analysis.
• We did not report on the subpopulations and trends since smaller populations
would augment the effects of missing data, particularly missing data of unknown
origin and makeup. This could lead to misunderstanding of subpopulations and
trends in the population and provide County IHSS administrators spurious ‘facts’
and thus adversely influence their decision-making.
IHSS Program Administration and Subpopulation Analysis
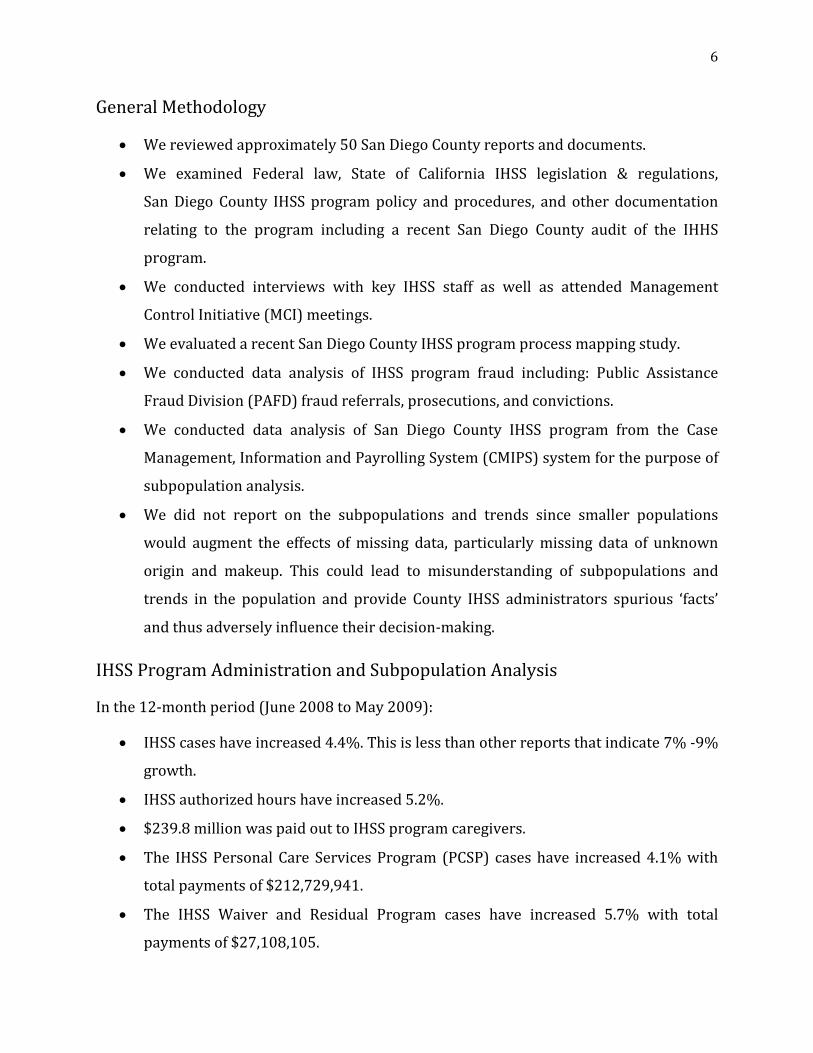
In the 12-month period (June 2008 to May 2009):
• IHSS cases have increased 4.4%. This is less than other reports that indicate 7% -9%
growth.
• IHSS authorized hours have increased 5.2%.
• $239.8 million was paid out to IHSS program caregivers.
• The IHSS Personal Care Services Program (PCSP) cases have increased 4.1% with
total payments of $212,729,941.
• The IHSS Waiver and Residual Program cases have increased 5.7% with total
payments of $27,108,105.

7
• Records report high variability between authorized hours and paid hours from
month to month.
• Records report paid hours less than authorized hours yet amount paid is
consistently higher. These findings may be associated with timesheets being
processed for services rendered in the prior month, though that does not explain
patterns seen between various programs. Number of cases in the subpopulation
data differed significantly from cases reported in management reports, due in part
but not wholly, to differing definitions between data sets and what is reported.
Fraud
• Allegations range from "rampant and out of control" to "one one-thousandth of
overall program spending".
• Numerical estimates are from 3% to 25% of total program expenditures; however, it
is unclear if any reliable data support these estimates.
• Fraud prevention is undoubtedly more cost-effective than fraud detection.
Process Maps
• Process maps were designed for the development of a new State IHSS data system
(CMIPS II). The project is 60% complete.
• The maps are a good framework for future refinement and process improvement.
• The County Call Center is presently underutilized.
• Ten suggestions for improving the process maps are listed.
Discussion
• Specific objectives of the IHSS program and metrics are associated with those
objectives are outlined.
o Quality of care and services
o Avoidance of institutionalization
• There is no available data to evaluate the IHSS program with respect to quality of
care and service.

8
• The State’s quality assurance program has more to do with administrative quality
than the service quality actually provided to the client.
• San Diego County records only one performance metric for the IHSS program, which
is the number of cases in compliance with IHSS quality assurance plan and costs.
• In fiscal year 2007-2008, the county reported that 99% (351 of 355) of sampled
cases complied with the State IHSS quality assurance plan, providing little room for
improvement in the County’s only performance measure.
• IHSS reform ideas include:
o New assessment forms
o Nurses assisting with assessment
o Cash and counseling programs
o Waivers to limit per diem costs
o Criminal background investigations for providers
o Fingerprinting and increased background checks for provider
o Improved integration of disparate data systems
• All reforms have associated costs.
Conclusions
In our two month experience with of the County IHSS program we observed that the
program seems to be well administered. IHSS staff is generally knowledgeable, but we
observed some variability in the understanding and communication of IHSS processes
between personnel.
The original goals and objectives of this project could not be fully realized because the data
sources, which are critical to objective analysis, could not be reconciled with County IHSS
reports. Thus, the single most important conclusion is that the connection between data
and reporting could not be resolved and County reports cannot be independently validated.
This may be due to a combination of internal data collection issues, data storage issues,
data labeling issues, reporting methodology, and data extraction problems. Unfortunately,
we cannot provide more definitive quantitative analysis and provide clear statistical
results.

9
From our investigation it appears there are several areas of opportunity of improvement
for the County IHSS program:
• More aggressive and systematic quality checks with respect to data and reporting
including program membership and financial reports. Much of this could be
coordinated with the CMIPS contractor, EDS.
• Fraud data cleanup and organization.
• Once the data and reporting are coordinated and validated, generally use data and
reporting more efficiently.
• Create a database, rather than an Excel spreadsheet, for recording fraud related
data. Set up validation data entry tools to improve quality and provide systematic
and periodic reporting.
• Implement scientific reporting of the present satisfaction report. Eliminate the
present ‘composite’ metric as it is scientifically invalid. Report on each and every
item in the survey and integrate into quality improvement and training programs.
• Improve and expand performance metrics for the IHHS program.. For example,
there could be query on IHSS clients concerning the actual services provided by the
Independent Provider, thus establishing a direct metric relating to the mission of
the IHSS program. Establish an efficiency metric of the IHSS program. For example,
quality of service per dollars spent.
• Implement improved quality reviews of process mapping, Standard Operating
Procedures and other process documentation.
• Consider a different vision for projects and initiatives. Leverage resources so a
project and initiative can benefit other related areas. Goals and objectives are
important but not necessarily at the exclusion of opportunity.
• Our report also provides many opportunities with respect to improving the IHSS
program both at the local and state level.

10
INTRODUCTION Project’s Goals
The In-Home Supportive Services (IHSS) program is an immediate priority of the San Diego County Health and Human Services Agency (HHSA). IHSS services were developed to permit individuals to remain safely in their homes and prevent institutionalization. IHSS services are intended to help persons who are unable to live at home safely without assistance and are blind or disabled or over 65 years of age, and whose assets are worth less than $2,000, excluding their house and car, or are receiving Supplemental Security Income/State Supplementary Payment. IHSS services include: housecleaning, meal preparation, laundry, grocery shopping, personal care services (such as bowel and bladder care, bathing, grooming and paramedical services), accompaniment to medical appointments, and protective supervision for the mentally impaired. The cost of the IHSS program is shared by counties, the state and federal government. San Diego County paid about $43 million (16.5%) of the total $260 million budget in 2008. Due to recent significant growth in the size and cost of the program, on March 24, 2009 County Supervisor Chair Dianne Jacob and Supervisor Pam Slater-Price issued the In-Home Supportive Services Reform directive to HHSA calling for a proposal to reform the IHSS program in 180 days.
In response to the Supervisors’ directive, the HHSA initiated the IHSS Reform Project to address the issues presented in the directive including escalating costs, growth in program, non-severely impaired population, timecard validation, lack of background checks, and risk to clients. At about the same time as the Supervisor’s directive, the San Diego Taxpayers Educational Foundation (SDTEF) and Alliance Healthcare Foundation (AHF) were in discussion with the HHSA to investigate the IHSS program. The SDTEF IHSS Process Analysis was conducted in parallel to the HHSA IHSS Reform Project, yet independent of the County’s project activities.
The IHSS Process Analysis goal is to provide an objective, data-driven, and fact-based analysis of specific aspects of the IHSS program as implemented at HHSA. The key objectives to the Analysis are: • Data analysis including detailed subpopulation, outlier, component programs, quality, training,
satisfaction, and trend analysis leveraging the existing HHSA data collection • Explore evidence-based performance metrics that include both costs and outcomes (i.e., cost-
effectiveness, cost-benefit, and cost-utility measures) as well as provide tools for improving process improvement. Thorough mapping and cause and effect analysis of all IHSS program processes to reveal potential areas for administrative impact on improvements to workflow, service coordination, and process efficiency with related healthcare programs. This work could potentially lay the foundation for future implementation of quality and efficiency initiatives, or advocacy efforts to secure regulatory or legislative change in the IHSS program.
• Conduct an analysis of IHSS program strengths, weaknesses, opportunities, and threats (SWOT) to assist in formulating a response to the County Supervisors’ IHSS directive.
History of California IHSS
Beginning in the 1950’s, the federal government addressed the needs of older adult blind and disabled individuals through the Old Age Assistance, Aid to the Blind, and Aid to the Totally Disabled programs. During this time, California established the Attendant Care program, funded by the State of California and the federal government. This program allowed for a cash grant to be

11
distributed directly to consumers who could then contract with their own caregivers. The 1957 Short-Doyle Act created the funding structure for the development of community-based mental health services1. The California Lanterman Act of 1969 provided services moving institutionalized persons into the community2. In the early 1970’s, the Homemaker program was added to the Attendant Care program. This program allowed consumers who could not hire or supervise their own provider to utilize homemakers employed by the counties. In 1979, the legislature eliminated the distinction between the two programs and identified the consumer as the employer, yet maintained the responsibility for IHSS provider payments and fiscal issues with the State. Today, three modes of service still remain, the individual provider mode (delivered by the IHSS Public Authority), the contract mode and the county homemaker mode. Currently, 95% of all IHSS consumers receive services through the individual provider mode.
In 1990, the federal government enacted the Americans with Disabilities Act that, which was strengthened by the US Supreme Court in 1999 via Olmstead v. L.C. and E.W. In the Olmstead ruling, the US Supreme Court established two legal principles with respect to health policy for persons with disabilities:
1. Medically unjustifiable institutionalization of disabled persons who desire to live in the community violates Title II of the Americans with Disabilities Act
2. States are legally obligated to affirmatively remedy discriminatory practices through public programs.
Thus, the IHSS program is not optional for the state and the legal aspects of the program cannot be ignored with respect to the funding and performance evaluation.3 In April 2002, the California Health and Human Services Agency (CHHSA) Long Term Care (LTC) Council directed its staff to develop an Olmstead Plan for California1. The vision statement of the LTC Council is: “A long-term care system that supports consumer dignity and independence, fosters appropriate home and community-based services, and is cost effective5.”
Prior to the 1990s, IHSS workers traditionally earned close to the minimum wage with no additional benefits. However, beginning with a Service Employees International Union (SEIU) organizing drive in Los Angeles, concerted efforts have been made by labor, client, and community groups to improve the wages and working conditions and quality of service in IHSS. In the early 1990s, following the successful efforts of a consumer-labor coalition, the state legislature passed three bills (SB 485, SB 35 and SB 1078) that allowed county supervisors to establish public authorities. Public Authorities were to serve as a vehicle for bringing together and giving voice to both consumers and workers in an effort to improve services. Another important provision of the legislation is that it provided tort immunity for the state and counties. In 1999, the Governor of California signed into law AB 1682 and SB 710, which added Section 12302.25 to the Welfare and Institutions Code (WIC). These laws required each county to establish an employer of record for IHSS care providers. The primary goal of all these bills was to increase wages and benefits for providers across the state through collective bargaining. Partly as a result, California is one of only five states that spend more than 50% of their Medicaid funds on home care rather than on nursing homes. California significantly reduced the number of state institutionalized individuals with 98% of persons with developmental disabilities living in the community.1

12
Concerns regarding IHSS spending have been raised for some time. The cost of the program nearly doubled from $1.39 billion in fiscal year 1998-99 to $2.63 billion in fiscal year 2002-03. The county share of the IHSS program doubled from $287 million to $562 million. Part of the increase was attributable to caseload increases. According to state data, authorized monthly cases increased 38% from 1995 to 2001 – from almost 190,000 to over 262,000. During this same period of time, California’s population growth was 10%. In addition, there appears to be a synergy between increased wages and utilization. For example, a consumer may have been authorized to receive 30 hours of service but could only find a provider for 20 hours. With improved wages, the IHSS workforce is more stable and the same consumer is able to find a provider for all 30 hours. In other words, the number of authorized hours is not changing, but the pool of people willing to work the number of authorized hours has changed, allowing consumers to receive services for the full number of authorized hours and increasing the cost to the program. A November 2002 report by the California State Association of Counties states, “As 2002 nears its end, the In-Home Supportive Services (IHSS) program is approaching a crossroads, and one of these roads leads California counties over a cliff.” 5
There have been attempts to limit State IHSS spending going back to at least 2001. Chapter 108, Statutes of 2000 (AB 2876, Aroner), authorizes the State to pay 65% of the non-federal cost of a series of wage increases for IHSS providers working in counties that have established public authorities. The wage increases began with $1.75 per hour in 2000-01. However, State participation in wage increases after 2000-01 is contingent upon General Fund revenue growth exceeding a 5% threshold. For 2001-02, revenue growth fell below that threshold. Nevertheless, State participation in a $1 wage increase to $8.50 per hour was provided, at a General Fund cost of approximately $23 million. Although revenue growth was anticipated to exceed 5% the next year, Governor Davis proposed to suspend the application of the trigger for the 2002-03 budget.6 For the 2004-05 budget, Governor Schwarzenegger proposed eliminating the residual (state-only) program, limiting State support for provider wages to the minimum wage, and reducing services for recipients living with able-bodied relatives. Together these proposals were estimated to result in net General Fund savings of $492 million in 2004-05--roughly 35% of total program costs based on the requirements of then current law.7 However, these proposals were not implemented by the legislature.
Despite efforts to limit spending, state IHSS expenditures continued to increase dramatically. In 2006, the California IHSS Report stated that the IHSS program is the fastest growing social services program through California’s General Fund Expenditures8. The primary cost drivers were identified as: caseload, hours of services provided, and provider wages. According to a March 2009 report by the California Senate Office of Oversight and Outcomes, the statewide average annual increase in IHSS costs over the last 10 years was 13% while the average annual increase in recipients was 7.4%.9 This year the Legislative Analyst’s Office (LAO) reported that between 1998 and 2009, IHSS caseload grew an average of 7.5% annually.10 Another LAO report this year on the General Fund budget spending growth rates for fiscal year 2009-2010 found that IHSS is the third largest social services program, just behind Supplemental Security Income/State Supplementary Payment and CalWORKs).11 IHSS has the fastest growing average annual rate with an average annual spending growth rate from 2001–02 through 2008–09 of over 11%.
13
In the Governor’s 2004 - 05 State Budget, the California Department of Social Services (CDSS) proposed an IHSS Quality Assurance (QA) Initiative. The proposal outlined a number of activities to be performed by CDSS, the counties, and the California Department of Health Services (DHS) to improve the quality of IHSS service need assessments, enhance program integrity, and detect and prevent program fraud and abuse. The proposal specifically requested:
1. State and county staffing augmentations specifically for QA activities 2. Funding to establish an ongoing State training component for IHSS workers 3. Funding for specified systems changes tied to QA and program integrity improvements.
The proposal was adopted and funding for new State and county QA staff, the IHSS training program, and systems changes was included in the FY 2004-05 Budget Act.12 The QA program was expected to result in savings, but the March 2009 Senate Office of Oversight and Outcomes IHSS report failed to substantiate those savings.
The State of California 2008-09 IHSS budget included over $5.5 billion ($1.9 billion from the General Fund) for the support of IHSS, an increase of $629 million (12.8%) compared to the estimated expenditures over the previous year. Cost drivers were attributed mostly to caseload growth (40%) followed by discretionary wage increases and minimum wage increases (each 25%) and other (10%). The annual cost growth rate is expected to increase by about 11% by 2014. Although there is some inconsistency in the magnitude of growth between the LAO reports, all reports indicate double digit growth in the IHSS program. The recession in 2008-09 further exacerbated the budget problem. As a result, the May 2009-10 Budget Revision contains proposals to cut IHSS spending by nearly $500 million, more than a quarter of the State’s $1.8 billion-share of IHSS funding.13
From 2001–02 through 2008–09, IHSS County of San Diego General Fund expenditures increased by over $940 million (110%), despite a federal waiver which increased federal financial participation in the program. During the same time period, the caseload increased by 61%. The remaining 49% of the spending increase is mostly due to higher wages paid to providers. A small portion of the increase is attributable to an increase in the average number of service hours authorized for recipients.
Between 2000 and 2008 population growth in California was 8.5% and for San Diego County 6.7%.14
Between 2000 and 2007 the California population age 85 or older grew by 37% while the number of IHSS cases grew by 66%. San Diego County population age 85 or older grew by 19% between 2000 and 2006; the proportion age five and over in disability status in San Diego County decreased by 42% in those 6 years.15 From 2000 to 2004 San Diego County caseload increased by 31%16. Thus, the impact of the elderly and disability has not been as severe for San Diego as other regions in California.
Between 1998-99 and 2008-09 the San Diego county share of the IHSS program more than tripled from $287 million to $970 million over the 10 year period, an average annual rate of increase of 13%6. Currently, counties pay an average of 17% of total IHSS costs, the State General Fund pays

14
34%, and Federal funds pay the balance. IHSS costs in San Diego County are $274 million of which the County pays $43 million (15.7%). County IHSS administrators indicate that San Diego County pays at least 17.5% of the cost of the IHSS program.10 See Appendix A for county comparisons.
IHSS Program Description
IHSS clients are permitted between one and 283 hours of services per month. Nearly 60% of the clients are authorized to receive less than 80 hours of service. The same percent of clients are over the age of 65 with more than half of the providers living in the same home. The IHSS Program includes a quality assurance program that includes state-mandated social worker training on Hourly Task Guidelines and other topics to ensure that IHSS hours are authorized consistently and accurately throughout the state. Providers are not required to document the actual hours that they work and there is no time limit for submitting timesheets. The California State Department of Social Services (DSS) manages the IHSS program. IHSS is split into three important subprograms:
1. Personal Care Services Program (PCSP) which provides paramedical, non-medical personal assistance services as well as domestic and related services.
2. Independence Plus Waiver program serves clients who receive care from a spouse or parent or are otherwise ineligible for PCSP. This 5-year federal waiver is due to expire on July 31, 2009. Prior to the 2004 federal waiver, approximately 80% of the IHSS participants were included in federal financial contribution. Currently, approximately 98% of the participants obtain federal funding. Approximately 75,000 individuals previously served in the residual program were transferred to the Waiver saving the state General Fund about $100 million annually.17
3. Residual Program, which lacks Federal funding and offers all available IHSS services to those clients who are not on Federal Financial Participation Medi-Cal.
All three programs offer the same services to the clients. The difference between programs is in who provides the service and the funding mechanism. The table below provides details on the aspects of these three programs.

15
Table I-1. Comparison of California IHSS Programs.18 The California State Department of Social Services (CDSS) and the counties share administrative responsibilities for the IHSS program. CDSS writes IHSS regulations and oversees the Case Management, Information and Payrolling System (CMIPS), which serves as the payroll agent for the IHSS providers. Counties perform local IHSS administration including determining participant’s eligibility, type of services needed, and the number of service hours needed. There are three IHSS servicing modalities:
1. Contract Mode - county contracts with a public/private entity to employ IHSS independent providers
2. Individual Provider Mode - the consumer hires and manages the independent provider (most common mode)
3. Homemaker Mode - county hires independent providers19 The program originally started as a program to serve people over the age of 65. In 2006, 40% of the participants were less than 65 years old—a 25% increase from 1987 and since the Olmstead decision. The majority (66%) of participants in 2006 were female, 57% were of ethnic minority, and 44% spoke a primary language other than English. The vast majority receives personal care and receives SSI support (85% and 86% respectively).19
IHSS Medi-Cal Personal Care Services Program (PCSP),
Welfare. & Institute. Code § 14132.95
IHSS Independence Plus Waiver (IPW) Program,
Welfare. & Institute. Code § 14132.951
IHSS Residual (IHSS-R) Program, Welfare. & Institute. Code § 12300 et
seq.
Eligibility
Beneficiary receives full-scope Medi-Cal with federal financial participation (FFP). Includes SSI beneficiaries; Section 1619 SSI beneficiaries (people who work even though disabled); Pickles; other Medi-Cal programs including A&D FPL; or Working Disabled; DD Waiver & NF Waiver people.
Beneficiary receives full-scope Medi-Cal with federal financial participation (FFP) but is not eligible for PCSP because of: 1. advance pay, or 2. parent or spouse provider, or 3. receiving restaurant meal allowance.
Recipient does not receive full-scope Medi-Cal or Recipient does not receive Medi-Cal with FFP. Includes individuals who receive state-only Medi-Cal, primarily lawful permanent residents and persons residing in the United States under color of law (PRUCOL) who are not eligible for full-scope Medi-Cal with FFP
Funding
Federal Medicaid 50%. Of remaining 50%, County pays 35% & State 65%
Federal Medicaid 50%. Of remaining 50%, County pays 35% & State 65%
County pays 35% & State 65% of total cost
Services and Providers
1. All Services except restaurant meal allowance 2. All providers except spouses and parents of minor children. 3. No advance pay
1. All Services including restaurant meal allowance 2. All providers including spouses and parents of minor children. 3. Advance pay
1. All Services including restaurant meal allowance 2. All providers including spouses and parents of minor children. 3. Advance pay
Impairment
Maximum 283 hours/month (except for Protective Supervision: 195 hours for non-severely impaired, 283 hours for severely impaired)
283 hours/month for severely impaired (needs 20 or more hours/week for personal care, paramedical and meal prep) or 195 hours/month non-severely impaired
283 hours/month for severely impaired (needs 20 or more hours/week for personal care, paramedical and meal prep) or 195 hours/month non-severely impaired
Can someone else supplement pay?
No, but can pay for hours not covered such as time in between tasks if pay provider directly; others can pay provider directly for share of cost.
No, but can pay for hours not covered such as time in between tasks if pay provider directly; others can pay provider directly for share of cost. Yes, if given directly to provider.
Spouse Provider Not covered because provider is a relative.
For nonmedical personal care services, paramedical services and, if prevented from working, protective supervision & transportation.
For nonmedical personal care services, paramedical services and, if prevented from working, protective supervision & transportation.
Parent Provider for Minor Not covered because provider is a relative,
All providers including spouses and parents of minor children.
Those eligible for full scope Medi-Cal but not with FFP.

16
The IHSS Public Authority (a quasi-governmental entity governed by the Board of Supervisors) serves as the employer of record for providers and negotiates wages, benefits and other terms and conditions of provider employment with United Domestic Workers of America. Governor Wilson established an “Employer of Record” system for IHSS providers to have collective bargaining and Governor Davis increased the number of counties utilizing Public Authorities by signing AB 1632, which established an “Employer of Record” system for IHSS providers to have collective bargaining.20 Public Authorities have the following responsibilities:
1. Maintaining independent provider registries 2. Giving IHSS consumers provider referrals 3. Providing training for both the independent provider and the recipient.
Counties are required to establish an advisory committee to assist with the implementation and oversight of public authorities. Currently, there is large variability between counties on the number of authorized IHSS provider hours per case7. A research project by the University of California, Berkeley determined that IHSS outcomes were similar across counties despite the number of authorized hours per case. Similarities include that In-Home Supportive Services are provided by independent providers and that the IHSS recipient is the employer of his other provider in terms of hiring and supervising the provider.21 Some county provider training programs are displayed in Table I-2. However, San Diego IHSS administrators did not know about the training program or where the data referenced in the report originated.
Imperial Los
Angeles Orange Riverside
San Bernardino
San Diego
Santa Barbara
Ventura
IHSS Eligibility & Regulations
20 60 40 40 40 14 20 8
IHSS Uniform
Assessment Process
20 8 40 8 8 3 4 4
Other 32 4 3 5 24 24 Table I-2. Berkeley Project County Provider Training Programs in Hours.
The 2004 study showed that San Diego County had the lowest number of training hours in the southern region22. The same report also reveals the average number of cases per social worker per county.
• Imperial—355 • Los Angeles—306 • Riverside—287 • Orange—271 • San Bernardino—250 • San Diego—248 • Santa Barbara—241 • Ventura—205

17
San Diego had a lower than average of cases per social worker as compared to other southern region counties. Although the above data is antiquated, they are provided for historical and comparative perspective. County IHSS administrators provided the Ventura County survey released in May 2009, which shows the following averages of cases per social worker per county:
• Imperial—360 (Combined case load 325) • Los Angeles—335 • Riverside—450 • Orange—not reported • San Bernardino—360 • San Diego— not reported (Combined case load 300) • Santa Barbara—265 • Ventura—207
San Diego continues to have a lower than average of cases per social worker as compared to other southern region counties.
The 2004 report also indicated the primary cost drivers for the southern counties. In that 2004 report, San Diego identified the following cost drivers: 22
• Caseload growth • General population growth • Provider wage increases • Addition of Provider benefits • Increased community outreach • Increase in Adult Protective Services (APS) cases referred to IHSS

18
GENERAL METHODOLOGY This report used a variety of techniques to examine the San Diego County IHSS program:
• Reviewed approximately 50 reports and documents using key phrases such as: California In-Home Supportive Services, California IHSS, In-Home Care, Homemaker Services, Personal Care Services, and Home Health Care
• Examined the San Diego County IHSS program policy and procedures and other documentation relating to the program
• Conducted interviews with key IHSS staff as well as attended the two Management Control Initiative (MCI) meetings
• Evaluated Federal law, State of California IHSS legislation & regulations, and San Diego County policies and procedures
• Compared and contrasted California and County reports on IHSS programs. • Evaluated a recent San Diego County audit of the IHSS program • Evaluated a recent San Diego County IHSS program Management Control Initiative (MCI)
focused on fraud • Evaluated a recent San Diego County IHSS program process mapping study • Performed analysis of IHSS program fraud data including: Public Assistance Fraud Division
(PAFD) fraud referrals, prosecutions, and convictions • Performed data analysis of San Diego County IHSS program from the CMIP system for the
purpose of subpopulation analysis • Examined areas of opportunity to leverage existing data and augmentation of metrics to
optimize processes.
While we conducted our analysis we remained vigilant to other concurrent activities (i.e., MCI, OAAS audit, and process mapping) to avoid redundancy of efforts as well as leverage the outcomes of these activities.
This report is divided into the three primary areas of investigation: subpopulation analysis, process mapping, and fraud, with each of those areas divided into three sections: methodology, results, and area of interest and opportunity. We conclude the report with a discussion of proposed legislation, the governor’s recent discussions on the IHSS program, interrelating issues as well as the latest information on the 2009-2010 budget and impact on the IHSS program.

19
IHSS PROGRAM ADMINISTRATION AND SUBPOPULATION ANALYSIS
METHODOLOGY Using County IHSS reports as well as requesting other statistical tables, we evaluated and analyzed various measures of the program. Specifically, we evaluated four monthly reports over a 12-month period (June 2008 to May 2009, or June 2009) including:
• Management Statistics Summary • Recipient Summary Characteristics Listing • Service Assessment Summary • Application, Approval, Denial, Termination Report
We calculated percent of change over the one year period for each metric by comparing the first month’s values (June 2008) and last month’s values (May 2009).
The CMIPS database is a product of EDS, a Hewlett-Packard Company, which also administrates CMIPS and generates reports. Because of the time constraints of the project as well as the Memorandum of Agreement restrictions on the confidentiality of client data, acquiring raw data from the CMIPS system was problematic. Instead, we requested summary tables from IHSS contractor EDS. Using the demographic and other variables that were presently being reported to the IHSS administrators we cross referenced the variables to produce metrics in the form of monthly summary tables for a one year period (June 2008 to May 2009)—the most recent data available at the time of our request. We then collated the data time series tables and plotted the trend of variables.
However, when we compared the summary data tables (see Table D-1) to the Management Statistics Summary, the count of IHSS cases did not match (as well as the other reports to which we had access). The data matrixes provided are inconsistent with cases reported in the Management Statistics Summary by varying degree, direction, and with respect to different measurements of cases in the Management Statistics Summary (see Table D-2). We consider this a significant integrity issue of the IHSS program but restricted to the data, reporting, and understanding of the program dynamics. It is significant since decision-making is based on such reports and understanding.

20
Management Statistics Summary:
Authorized/Paid Report Management Statistics Summary:
Wage and Benefit Report CMIPS Data Extract
Total PCSP Waiver & Residual Total PCSP
Waiver & Residual Total PCSP
Waiver & Residual
Jun-08 23,889 19,844 4,045 23,269 20,802 2,485 23,383 20,734 2,649
Jul-08 24,056 19,994 4,062 23,989 21,503 2,496 23,536 20,882 2,654
Aug-08 24,147 20,053 4,094 23,523 21,020 2,511 23,632 20,980 2,652
Sep-08 24,385 20,206 4,179 24,250 21,633 2,626 23,892 21,211 2,681
Oct-08 24,570 20,315 4,255 24,365 21,739 2,636 24,078 21,381 2,697
Nov-08 24,682 20,400 4,282 23,401 20,914 2,498 24,216 21,477 2,739
Dec-08 24,776 20,462 4,314 25,165 22,559 2,618 24,344 21,569 2,775
Jan-09 24,737 20,437 4,300 24,311 21,749 2,577 24,266 21,500 2,766
Feb-09 24,761 20,473 4,288 24,045 21,516 2,545 24,192 21,330 2,862
Mar-09 24,802 20,540 4,262 24,649 22,138 2,525 24,257 21,535 2,722
Apr-09 24,880 20,600 4,280 25,069 22,489 2,597 24,335 21,619 2,716
May-09 24,932 20,656 4,276 24,440 21,868 2,586 24,406 21,676 2,730 Table D-1. Comparison of Cases Across the Management Statistical Summary and CMIPS Data Extract.
Difference Wage and Benefit Report -
CMIPS Data Extract Difference Authorized/Paid Report- CMIPS
Data Extract
Difference
Total Difference
PCSP
Difference Waiver & Residual
Difference Total
Difference PCSP
Difference Waiver & Residual
Jun-08 -114 68 -164 506 -890 1,396
Jul-08 453 621 -158 520 -888 1,408
Aug-08 -109 40 -141 515 -927 1,442
Sep-08 358 422 -55 493 -1,005 1,498
Oct-08 287 358 -61 492 -1,066 1,558
Nov-08 -815 -563 -241 466 -1,077 1,543
Dec-08 821 990 -157 432 -1,107 1,539
Jan-09 45 249 -189 471 -1,063 1,534
Feb-09 -147 186 -317 569 -857 1,426
Mar-09 392 603 -197 545 -995 1,540
Apr-09 734 870 -119 545 -1,019 1,564
May-09 34 192 -144 526 -1,020 1,546 Table D-1. Difference in Cases Across the Management Statistical Summary and CMIPS Data Extract
According to the County, differences in case counts between the Management Statistics Report and extracted data are due to inclusion of non-eligible cases in the Management Statistics Report that were not included in the extracted data. The Management Statistics Report includes “Eligible”, “Ineligible”, “Terminated”, “Leave”, and “all other ‘Eligible’ cases with an eligibility segment in the report month”. It is unclear why the three categories “Ineligible”, “Terminated”, “Leave” would have significant impact on the number of paid hours in any given reporting month. From a research

21
perspective, the Management Statistics Report versus the data extraction issue will not be resolved until the County can identify the specific cases and hours that are reflected in the Management Statistics Report that are not reflected in the extracted data and provide reasons for why they are not included in the extracted data. The County has indicated that the Recipient Summary Characteristic Listing covers a different time period than the Management Statistics Report. This confirmation underscores the lack of coordination between reporting periods in IHSS reporting. From a metric utility perspective, we question the County/State methodology of reporting IHSS cases and hours that cannot be matched with any other report or data extraction.
Figure D-1 displays IHSS hour data from the Management Statistics Summary and compares to corresponding data extracted from the CMIPS database. Note the discrepancy between the hours reported as paid and the hours paid as extracted from the CMIPS database.
Figure D-1. Discrepancy in Hours for Management Statistics Summary and Data Extraction.
IHSS PROGRAM ADMINISTRATION ANALYSIS: MANAGEMENT STATISTICS SUMMARY: CASES, HOURS, PAYMENTS The Management Statistics Summary is broken down into three parts:
• Grand Total • PCSP • IHSS Independence Plus Waiver Program and Residual program combined (the CMIPS
system is not able to distinguish between these programs)
1,800,000
1,850,000
1,900,000
1,950,000
2,000,000
2,050,000
2,100,000
2,150,000
AUTH HOURS
PAID HOURS
DATA HOURS

22
There are three programs in IHSS which provide identical service:
• Personal Care Services Program (PCSP) which provides paramedical, non-medical personal, assistance services and serves about 83% of the San Diego County IHSS population,
• Independence Plus Waiver program serves clients who receive care from a spouse or parent or are otherwise ineligible for PCSP and serves about 17% of the County IHSS population and,
• Less than 400 County citizens are enrolled in the Residual Program, which lacks Federal funding and provides all IHSS services for those individuals not eligible to Federal Financial Participation Medi-Cal, domestic and related services, protective supervision, and restaurant/meal allowance, by a responsible relative.
Each of the above three sections is divided between severely impaired participants and non- severely impaired. The reports revealed the following in May 2009:
• There were a total of 24,932 participants (cases), which is the highest number of cases in the San Diego County IHSS program to date.
• Of the total 24,932 cases, 82.8% are enrolled in PCSP and 17.2% enrolled collectively in the Waiver and Residual program (although other documents indicate the Residual program has fewer than 400 cases).
• Of the total 24,932 cases, 80.0% fall under non-severely impaired and the remaining 20% severely impaired. For PCSP cases the portion that are severely impaired is slightly higher (20.4%) and for combined Waiver and Residual program the portion for severely impaired is somewhat less (18.1%).
Table D-3 displays the summary data for the period (June 2008 to May 2009). Although other reports indicate a growth in cases of 7 to 9%, the information from the Management Statistics Summary indicate an increase of 4.4%. The combined Waiver and Residual program is growing at a faster rate (5.7%) compared to the growth of PCSP (4.1%). However, overall authorized hours are increasing slightly faster than the case growth (5.2%). Note that combined Waiver and Residual program overall authorized hours is much larger (10.4%) as compared with PCSP (4.5%).

23
GRAND TOTAL
AUTH CASES AUTH HOURS PAID HOURS PAID AMOUNT
Total 294,617 24,816,358 24,263,555 $ 239,838,047.02 Monthly Average 24,551 2,068,030 2,021,963 $ 19,986,503.92
Percent Increase Cases 4.4%
Percent Increase Hours Authorized 5.2%
Percent Increase Hours Paid 5.1%
Percent Increase Paid Amount 5.2%
Average Percent Difference (ratio) Paid to Authorized 97.0%
PCSP TOTAL
AUTH CASES AUTH HOURS PAID HOURS PAID AMOUNT
Total 243,980 21,476,309 21,346,603 $ 212,729,941.47 Monthly Average 20,332 1,789,692 1,778,884 $ 17,727,495.12
Percent Increase Cases 4.1%
Percent Increase Hours Authorized 4.5%
Percent Increase Hours Paid 4.6%
Percent Increase Paid Amount 4.7%
Average Percent Difference (ratio) Paid to Authorized 98.3%
RESIDUAL TOTAL
AUTH CASES AUTH HOURS PAID HOURS PAID AMOUNT
Total 50,637 3,340,050 2,916,953 $ 27,108,105.55 Monthly Average 4,220 278,337 243,079 $ 2,259,008.80
Percent Increase Cases 5.7%
Percent Increase Hours Authorized 10.4%
Percent Increase Hours Paid 8.6%
Percent Increase Paid Amount 8.6%
Average Percent Difference (ratio) Paid to Authorized 88.5%
Table D-3: Summary of the Management Statistics Summary--Total (June 2008 to May 2009).
Figures D-2 to D-7 display the difference between the number of authorized hours and paid hours for each month as well as the amount authorized and amount paid.

24
Figure D-2: Total Population—Authorized and Paid Hours (June 2008 to May 2009).
There are several things to note in Figure D-2. First, the number of authorized hours increases each month although the amount of increase is variable. The increase is likely due to increases in case load impacting corresponding hours authorized, perhaps as increased hours per case.
The number of paid hours is always less than the amount authorized. In contrast to the number of authorized hours, the number of paid hours is much more variable-increasing and decreasing somewhat randomly. County IHSS administrators maintain this variability as related to IHSS regulations on time sheet submissions. IHSS regulations do not require time sheets to be submitted on a monthly basis (i.e., time sheets can be submitted for several months at once).
IHSS administrators have regularly experienced a surge of time sheets submitted in December and cite this as problematic in fraud detection. The data does indicate an increase in the number of hours in December as compared to November, but the difference is a modest 4.5% (as reported in the Management Statistics Summary) and 6.5% (as reported from data). The difference in hours between December and October is much less at29, 151 hours or 1.9% (as reported in the Management Statistics Summary). What this indicates is that is along with the modest surge in December there is decline in submissions in November which can readily be visualized in the Figure D-2. The relative difference between November and December may influence administrator’s perceptions more than the actual magnitude of increase in time sheets submitted in December. Because we did not have access to the number of time sheets submitted, we used the number of paid hours as a proxy. Since the December ‘surge’ seems to be an important issue for County IHSS administrators, future detailed analysis of the actual number of time sheets may have utility.
1,900,000
1,950,000
2,000,000
2,050,000
2,100,000
2,150,000
AUTH HOURS
PAID HOURS

25
Figure D-3: Total Population—Authorized and Paid Amount (June 2008 to May 2009).
Note that the paid amount exhibits corresponding variation with the paid hours. The amount paid exceeds the amount of authorized which reflects additional County Federal Insurance Contributions Act and unemployment insurance payments.
Figure D-4: PCSP—Authorized and Paid Hours (June 2008 to May 2009).
Figures D-4 and D-5 displays the hours and payment for the subpopulation PCSP. As would be expected since the bulk of the cases are enrolled in PCSP, Figures D-4 and D-5 displays similar behavior as the Total Population figures.
$18,000,000.00
$18,500,000.00
$19,000,000.00
$19,500,000.00
$20,000,000.00
$20,500,000.00
$21,000,000.00
Jun-
08
Jul-0
8
Aug
-08
Sep-
08
Oct
-08
Nov
-08
Dec
-08
Jan-
09
Feb-
09
Mar
-09
Apr
-09
May
-09
AUTH AMOUNT
PAID AMOUNT
1,700,000
1,720,000
1,740,000
1,760,000
1,780,000
1,800,000
1,820,000
1,840,000
AUTH HOURS
PAID HOURS

26
Figure D-5: PCSP—Authorized and Paid Amount (June 2008 to May 2009).
Figures D-6 and D-7 displays the cases and payment, respectively, for the combined Waiver and Residual program. We again see the increasing trend in the authorized hours although there was a dip in January and February 2009.
The percent difference between paid and authorized hours is much greater than in PCSP. At its greatest, the paid hours are 15.7% less than authorized hours and the average difference is 12.7% over the entire period.
Figure D-6: Waiver and Residual—Authorized and Paid Hours (June 2008 to May 2009).
$16,000,000.00
$16,500,000.00
$17,000,000.00
$17,500,000.00
$18,000,000.00
$18,500,000.00
Jun-
08
Jul-0
8
Aug
-08
Sep-
08
Oct
-08
Nov
-08
Dec
-08
Jan-
09
Feb-
09
Mar
-09
Apr
-09
May
-09
AUTH AMOUNT
PAID AMOUNT
220,000
230,000
240,000
250,000
260,000
270,000
280,000
290,000
300,000
AUTH HOURS
PAID HOURS

27
Figure D-7: Waiver and Residual—Authorized and Paid Amount (June 2008 to May 2009).
Note in Figure D-7 that for the Waiver and Residual program the amount paid is less than the amount authorized with is the opposite for PSCP. We found this curious since Waiver and Residual program also are paid a restaurant and meal allowance that PSCP does not. One explanation is that Waiver and Residual program utilize a smaller portion of the authorized hours.
In Figures D-8 to D-19 we examine the severely impaired and non-severely impaired cases with respect to the total IHSS program and components PSCP and the combined Waiver and Residual programs. Severity is assessed using the state’s Hourly Task Guidelines.
Figure D-8: Total Non-Severely Impaired Population—Authorized and Paid Hours (June 2008 to May 2009).
$2,100,000.00
$2,200,000.00
$2,300,000.00
$2,400,000.00
$2,500,000.00
$2,600,000.00
$2,700,000.00
Jun-
08
Jul-0
8
Aug
-08
Sep-
08
Oct
-08
Nov
-08
Dec
-08
Jan-
09
Feb-
09
Mar
-09
Apr
-09
May
-09
AUTH AMOUNT
PAID AMOUNT
1,200,000
1,220,000
1,240,000
1,260,000
1,280,000
1,300,000
1,320,000
1,340,000
AUTH HOURS
PAID HOURS

28
Figure D-9: Total Severely non-Severely Impaired Population—Authorized and Paid Amount (June 2008 to May 2009).
Figures D-8 and D-9 displays the total non-severely impaired population, which makes up about 80% of the total population. We generally see the same trends and behavior previously reported in the overall analysis, where the non-severely impaired represent about 80% of the cases, and account for 65% of the hours. This is also reflected in expense of the program.
Figures D-10 and D-11 display the total severely impaired population, which makes up about 20% of the total population. We generally see the same data trends and behavior previously reported in the non-severely impaired population.
Figure D-10: Total Severely Impaired Population—Authorized and Paid Hours (June 2008 to May 2009).
$11,500,000.00
$11,700,000.00
$11,900,000.00
$12,100,000.00
$12,300,000.00
$12,500,000.00
$12,700,000.00
$12,900,000.00
$13,100,000.00
$13,300,000.00
Jun-
08
Jul-0
8
Aug
-08
Sep-
08
Oct
-08
Nov
-08
Dec
-08
Jan-
09
Feb-
09
Mar
-09
Apr
-09
May
-09
AUTH AMOUNT
PAID AMOUNT
720,000
730,000
740,000
750,000
760,000
770,000
780,000
AUTH HOURS
PAID HOURS

29
Figure D-11: Total Severely Impaired Population—Authorized and Paid Amount (June 2008 to May 2009).
Figures D-12 and D-13 displays the PCSP cases that are non-severely impaired. The non-severely impaired population makes up about 80% of the total population. For the PCSP non-severely impaired population the paid hours are consistently higher than hours authorized as well as amount paid with respect to amount authorized.
Figure D-12: PCSP (non-Severely Impaired)—Authorized and Paid Hours (June 2008 to May 2009).
$6,800,000.00
$6,900,000.00
$7,000,000.00
$7,100,000.00
$7,200,000.00
$7,300,000.00
$7,400,000.00
$7,500,000.00
$7,600,000.00
Jun-
08
Jul-0
8
Aug
-08
Sep-
08
Oct
-08
Nov
-08
Dec
-08
Jan-
09
Feb-
09
Mar
-09
Apr
-09
May
-09
AUTH AMOUNT
PAID AMOUNT
1,090,000
1,110,000
1,130,000
1,150,000
1,170,000
1,190,000
1,210,000
AUTH HOURS
PAID HOURS

30
Figure D-13: PCSP (non-Severely Impaired)—Authorized and Paid Amount (June 2008 to May 2009).
Figures D-14 and D-15 display the PCSP severely impaired cases. In contrast to the PCSP non-severely impaired population the paid hours are consistently lower than the authorized hours. These data suggest that the severely impaired population under utilize their authorized hours as compared to the non-severely impaired population. However, if PCSP severely impaired participants were already maximizing their authorized hours then the reason for the relative difference between the earlier part of the year and latter part of the year isn’t as clear. Permit us to explain.
If the paid amount only reflected the hourly rate (i.e., no other employer payment like FICA and unemployment tax) then paid amounts should generally be less the authorized amounts (with the caveat that an influx of back-logged time sheets would produce a spike in a given month). However, as previously reported, the report does include employer payments (FICA and unemployment tax) so the paid amounts may, or may not, exceed the authorized amounts. Besides the occasional monthly spike due to submission of retro time sheets, the general relationship between the paid amount and authorized amount should be stable since the percent of FICA and unemployment tax is based on a percentage of the employee wages.
$10,000,000.00
$10,500,000.00
$11,000,000.00
$11,500,000.00
$12,000,000.00
$12,500,000.00
Jun-
08
Jul-0
8
Aug
-08
Sep-
08
Oct
-08
Nov
-08
Dec
-08
Jan-
09
Feb-
09
Mar
-09
Apr
-09
May
-09
AUTH AMOUNT
PAID AMOUNT

31
Figure D-14: PCSP (Severely Impaired)—Authorized and Paid Hours (June 2008 to May 2009).
Figure D-15: PCSP (Severely Impaired)—Authorized and Paid Amount (June 2008 to May 2009).
Figures D-16 and D-17 display the Waiver and Residual program for the non-severely impaired population. Paid hours are consistently lower than the authorized hours and paid amounts are consistently lower than authorized amounts.
590,000
600,000
610,000
620,000
630,000
640,000
650,000
660,000
670,000
AUTH HOURS
PAID HOURS
$5,800,000.00
$5,900,000.00
$6,000,000.00
$6,100,000.00
$6,200,000.00
$6,300,000.00
$6,400,000.00
Jun-
08
Jul-0
8
Aug
-08
Sep-
08
Oct
-08
Nov
-08
Dec
-08
Jan-
09
Feb-
09
Mar
-09
Apr
-09
May
-09
AUTH AMOUNT
PAID AMOUNT

32
Figure D-16: Waiver and Residual (non-Severely Impaired)—Authorized and Paid Hours (June 2008 to May 2009).
Figure D-17: Waiver and Residual (non-Severely Impaired)—Authorized and Paid Amount (June 2008 to May 2009).
Figures D-18 and D-19 displays the Waiver and Residual program for the severely impaired population. In contrast to the Non-Severely Impaired and PSCP non-severely impaired the paid hours are consistently higher than the authorized hours and paid amounts are consistently higher than authorized amounts.
100,000
110,000
120,000
130,000
140,000
150,000
160,000
170,000
180,000
190,000
AUTH HOURS
PAID HOURS
$-
$200,000.00
$400,000.00
$600,000.00
$800,000.00
$1,000,000.00
$1,200,000.00
$1,400,000.00
$1,600,000.00
$1,800,000.00
Jun-
08
Jul-0
8
Aug
-08
Sep-
08
Oct
-08
Nov
-08
Dec
-08
Jan-
09
Feb-
09
Mar
-09
Apr
-09
May
-09
AUTH AMOUNT
PAID AMOUNT

33
Figure D-18: Waiver and Residual (Severely Impaired)—Authorized and Paid Hours (June 2008 to May 2009).
Figure D-19: Waiver and Residual (Severely Impaired)—Authorized and Paid Amount (June 2008 to May 2009).
Going back to Figure D-15, that figure reveals that for the PSCP severely impaired cohort, prior to December 2008 the amount paid was less than or nearly equal to the amount authorized. In December 2008 the amount paid exceeded the authorized amount and remain higher until May 2009. There are several possible explanations. It could be that retro time sheets were being turned in from December 2008 through April 2009, but that would mean a ‘catch up’ of time sheets going
90,000
95,000
100,000
105,000
110,000
115,000
120,000
125,000
130,000
135,000
140,000
Jun-
08
Jul-0
8
Aug
-08
Sep-
08
Oct
-08
Nov
-08
Dec
-08
Jan-
09
Feb-
09
Mar
-09
Apr
-09
May
-09
AUTH HOURS
PAID HOURS
AUTH AMOUNT
PAID AMOUNT

34
back several months. In addition, that explanation would be restricted to only the PCSP program and non-severely impaired population.
Tables D-4 and D-5 summarize the findings in the Severely Impaired and non-Severely Impaired cohorts.
Total Severely Impaired
AUTH CASES
AUTH HOURS
PAID HOURS PAID AMOUNT
Total 59,261 9,169,003 9,011,799 $ 87,841,948.92
Average 4,938 764,084 750,983 $ 7,320,162.41
% Increase Cases 4.4%
% Increase Hours Authorized 5.2%
Average% Difference Paid to Authorized 97.7%
PCSP Severely Impaired
AUTH CASES
AUTH HOURS
PAID HOURS PAID AMOUNT
Total 50,168 7,860,676 7,424,558 $ 73,150,581.04
Average 4,181 655,056 618,713 $ 6,095,881.75
% Increase Cases 3.4%
% Increase Hours Authorized 3.9%
Average% Difference Paid to Authorized 93.4%
Waiver and Residual Severely Impaired
AUTH CASES
AUTH HOURS
PAID HOURS PAID AMOUNT
Total 9,093 1,308,326 1,587,241 $ 14,706,653.85
Average 758 109,027 132,270 $ 1,225,554.49
% Increase Cases (06/2008-05/2009) 10.2%
% Increase Hours Authorized (06/2008-05/2009) 10.0%
Average% Difference Paid to Authorized 125.1%
Table D-4: Summary of the Management Statistics Summary—Severely Impaired (June 2008 to May 2009).
Note that the Waiver and Residual non-severely impaired population are growing at the fastest rate—nearly three times the rate for PCSP non-severely impaired population. This growth is in both cases and hours.

35
Total non-Severely Impaired
AUTH CASES AUTH HOURS
PAID HOURS PAID AMOUNT
Total 235,356 15,647,356 15,251,756 $ 151,996,098.10
Average 19,613 1,303,946 1,270,980 $ 12,666,341.51
% Increase Cases 4.4%
% Increase Hours Authorized 5.5%
Average % Difference Paid to Authorized 96.5%
PCSP non-Severely Impaired
AUTH CASES AUTH HOURS
PAID HOURS PAID AMOUNT
Total 193,812 13,615,632 13,922,044 $ 139,594,646.40
Average 16,151 1,134,636 1,160,170 $ 11,632,887.20
% Increase Cases 4.3%
% Increase Hours Authorized 4.8%
Average% Difference Paid to Authorized 101.1%
Waiver and Residual non-Severely Impaired
AUTH CASES AUTH HOURS
PAID HOURS PAID AMOUNT
Total 41,544 2,031,723 1,329,712 $ 12,401,451.70
Average 3,462 169,310 110,809 $ 1,033,454.31
% Increase Cases (06/2008-05/2009) 4.8%
% Increase Hours Authorized (06/2008-05/2009) 10.7%
Average% Difference Paid to Authorized 65.2%
Table D-5: Summary of the Management Statistics Summary—non-Severely Impaired (June 2008 to May 2009).
The data shows that the Waiver and Residual severely impaired population hours are growing at the fastest rate—nearly two times the rate for PCSP severely impaired population. However the growth is primarily restricted to hours.
Note the interaction between the program type (PCSP and Combined Waiver and Residual programs) and Severely Impaired (Severely Impaired and non-Severely Impaired) with respect to average percent difference between paid amounts authorized amounts (See Figure D-20). With respect to severity of impairment there appears to be little difference in the paid amount and authorized amount. However, in the Combined Waiver and Residual programs there is a large difference. County IHSS administrators may have an explanation for this observation that we cannot provide.

36
Figure D-20: Interaction: Program Type vs. Severely Impaired with respect to average percent difference between actual payment to authorized payment (June 2008 to May 2009).
IHSS PROGRAM ADMINISTRATION ANALYSIS: RECIPIENT SUMMARY CHARACTERISTIC
LISTING The Recipient Summary Characteristic Listing reports several factors about the recipients of IHSS:
• Impairment status • Maximum payment cases • PCSP vs. IHSS CASES (combined Waiver and Residual programs) • Average functional status • Spouse availability • Parent availability
PCSP VS. IHSS CASES (COMBINED WAIVER AND RESIDUAL PROGRAMS) Prior to conducting our analysis on the Recipient Summary Characteristic Listing we compared the number of cases to the Management Statistics Summary. County IHSS administrators revealed that these reports are generated on different days of the month. This begs the question if State IHSS reports should be generated at the same time for consistency. We noticed minor discrepancies between the numbers of cases reported in the Management Statistics Summary compared to the Recipient Summary Characteristics Listing (Table D-6). The County notes that the Management Statistics Report includes a longer time period than the Recipient Summary Characteristics Listing data extract. We assume, to be verified by the County, that the Management Statistics Report reflects activities pertaining to a specific reporting month. Activity in month A is reported in the Management Statistics Summary for Month A even if the data was obtained after the end of month A. A historical data extract (assuming all population cohort inputs are equal) should match what is reported in the monthly reports.County IHSS administrators also stated that the Recipient
125.10%
65.20%
0.00%
20.00%
40.00%
60.00%
80.00%
100.00%
120.00%
140.00%
PCSP Waiver and Residual
non-Severely Impaired
Severely Impaired

37
Summary Characteristic Listing is not an activity report which implied that the Management Statistics Summary is an activity report However, the number of cases in the Management Statistics Summary does not appear to vary with respect to time sheet submissions. Therefore, we presume that reporting of the number of cases does not reflect activity but rather the present IHSS population. Thus, for reporting the number of cases, we maintain these reports should match more closely.
AUTH CASES
PCSP CASES Difference
AUTH CASES
IHSS CASES Difference
Jun-08 19,844 19826 18 4,045 4014 31 Jul-08 19,994 20021 -27 4,062 4064 -2
Aug-08 20,053 20078 -25 4,094 4081 13 Sep-08 20,206 20160 46 4,179 4163 -337 Oct-08 20,315 20356 -41 4,255 4225 30
Nov-08 20,400 20393 7 4,282 4263 19 Dec-08 20,462 20527 -65 4,314 4306 8 Jan-09 20,437 20516 -79 4,300 4306 -6 Feb-09 20,473 20501 -28 4,288 4277 393 Mar-09 20,540 20571 -31 4,262 4257 5 Apr-09 20,600 20688 -88 4,280 4264 16 May-09 20,656 20682 -26 4,276 4261 15
Table D-6: Discrepancy in Reports in Cases for IHSS Programs.
Impairment Status
We previously reported on the case growth trends so we examined the impairment data to determine if there was a difference in the distribution between severely impaired and not-severely impaired. In Figure D-21 the percentages of severely impaired and not-severely impaired are compared over time (June 2008 to May 2009) from the Recipient Summary Characteristic Listing. The distribution of severely impaired and not-severely impaired is stable (20.2% and 79.8% respectively).

38
Figure D-21: Impairment Distribution in Percent (June 2008 to May 2009).
Maximum Payment Cases
Maximum payment for non-severely impaired cases only represents 1.1% of the IHSS population (284 in May 2009). Maximum payment for severely impaired cases is very small—0.3% of the IHSS population (81 cases in May 2009). There does not appear to be an increase in the maximum payment for severely impaired cases.
However, the number of cases receiving maximum payment for the non-severely impaired in the 12-month period indicated a possibility of a slight increase from1.00% to 1.14% (see Figure D-21). Although very slight in this 12-month period ‘snap shot’, this may be an area for future monitoring consideration by IHSS administration.
0.0%
10.0%
20.0%
30.0%
40.0%
50.0%
60.0%
70.0%
80.0%
90.0%
Jun-
08
Jul-0
8
Aug
-08
Sep-
08
Oct
-08
Nov
-08
Dec
-08
Jan-
09
Feb-
09
Mar
-09
Apr
-09
May
-09
NON-SEVERLY IMPAIRED
NON-SEVERLY IMPAIRED

39
Figure D-22: Maximum Payment Distribution for Non-Severely Impaired in Percent (June 2008 to May 2009).
Average functional status The average monthly functional status analysis indicated an average of 2.69 over the 12-month period. No obvious trend is observed (See Figure D-23).
Figure D-23: Average Monthly Functional Status (June 2008 to May 2009).
Functional Hours
The average monthly functional hours assessed analysis indicated an average of 83.15 over the 12-month period. No obvious trend is observed (See Figure D-24).
1.00%0.99%
1.02%1.04%1.03%
1.04%
1.07%1.08%
1.14%
1.10%
1.13%1.14%
0.90%
0.95%
1.00%
1.05%
1.10%
1.15%
1.20%
2.8 2.7 2.7 2.7 2.7 2.8 2.7 2.72.6
2.82.6 2.6
0.00
0.50
1.00
1.50
2.00
2.50
3.00

40
Figure D-24: Average Monthly Functional Hours Assessed (June 2008 to May 2009).
IHSS PROGRAM ADMINISTRATION ANALYSIS: SERVICE ASSESSMENT SUMMARY The Service Assessment Summary reports on several IHSS services that are assessed hours and subsequently reimbursed. County IHSS administrators indicated the difference in hours assessed and hours authorized (as noted in the Management Statistics Summary) relate to resources that are available, such as an able and available spouse or adult day care. Assessments are conducted yearly; however, the assessments are conducted on individuals throughout the year. Thus, if there were changes in the overall population or how these assessments were being administered would be reflected in the trend analysis. Presented in Tables D-7 to D-12 are the summary statistics for these services for the period (June 2008 to May 2009).
• Domestic Services • Meal Preparation • Meals Clean • Up Laundry • Food Shopping • Shopping/Errand • Heavy Cleaning • Respiration • Bowel and Bladder • Feeding • Bed and Bath
• Dressing • Menstrual Care • Ambulation • Move in and out of Bed • Bathing/Hygiene • Rubbing Skin • Prosthesis Care • Accompany Medical • Protect and Supervision • Paramedical • Non-Essential
Note that the Service Assessment Summary did not provide definitions for these categories and are provided in this report without definition.
84.5 84.6 82.8 82.6 85.7 85.6 85.8 84.379.3
83.979.3 79.5
0.00
10.00
20.00
30.00
40.00
50.00
60.00
70.00
80.00
90.00
100.00

41
Moving a person in and out of bed demonstrated the greatest increase (13.6%) in hours assessed as well as the number of hours authorized (13.5%). Paramedical had the second highest greatest increase (8.8%) in hours assessed as well as the number of hours authorized (10.1%). Protective Supervision services had the third highest increase (8.6%) in hours assessed as well as the number of hours authorized (9.0%). County IHSS administrators revealed recently that state IHSS training “repositioning” and “helping in and out of chair” was reassigned to “move in and out of bed,” hence the increase is reflected in the statistics of the Service Assessment Summary reports.
Several services declined in the number of hours assessed and number of hours authorized; both domestic services and respiration declined 2.0% and 1.2%, respectively. Rubbing skin declined 1.7% and 1.6% and heavy cleaning declined by 0.5% for both hours assessed and hours authorized. County IHSS administrators recently revealed that IHSS training “rubbing of skin” was reassigned to “bathing” and hence the decline is reflected in the statistics of the Service Assessment Summary reports.
Every measure demonstrated noteworthy consistency in the percent difference between the number hours assessed and hours authorized. For the sake of brevity we did not include all of the graphics of these trends. In Figure D-25 we present the trend in the percent difference between assessed and authorized for moving a person in and out of bed. As noted before, although this is the fastest increasing service, in 10 of the 12 months, the percent difference is 99.3% and the other two months are 99.4%. The consistency could be indicative of well-controlled processes in the administration of IHSS in San Diego County.
Figure D-25: Moving In and Out of Bed (June 2008 to May 2009).
74,000
76,000
78,000
80,000
82,000
84,000
86,000
88,000
Jun-
08
Jul-0
8
Aug
-08
Sep-
08
Oct
-08
Nov
-08
Dec
-08
Jan-
09
Feb-
09
Mar
-09
Apr
-09
May
-09
HOURS ASSESSED
AUTHORIZED

42
Domestic Services
HOURS
ASSESSED AUTHORIZED PERCENT AMOUNT
Total 91,714 88,866 $ 822,029.00
Average 7,643 7,406 $ 68,502.42
Percent Increase Hours Assessed -2.0%
Percent Increase Hours Authorized -1.2% Average Percent Difference Authorized to Assessed 96.9%
Meal Preparation
Total 4,949,892 4,622,207 $ 42,755,642.00
Average 412,491 385,184 $ 3,562,970.17
Percent Increase Hours Assessed 4.7%
Percent Increase Hours Authorized 4.4% Average Percent Difference Authorized to Assessed 93.4%
Meals Clean Up
Total 1,098,527 1,032,748 $ 9,553,210.00
Average 91,544 86,062 $ 796,100.83
Percent Increase Hours Assessed 5.4%
Percent Increase Hours Authorized 5.0% Average Percent Difference Authorized to Assessed 94.0%
Laundry
Total 1,370,896 1,320,084 $ 12,210,680.00
Average 114,241 110,007 $ 1,017,556.67
Percent Increase Hours Assessed 3.9%
Percent Increase Hours Authorized 3.9% Average Percent Difference Authorized to Assessed 96.3%
Table D-7: IHSS Services—Domestic Services, Meal Preparation, Meals Clean Up, Laundry (June 2008 to May 2009).

43
Food Shopping
HOURS
ASSESSED AUTHORIZED PERCENT AMOUNT
Total 712,943 672,488 $ 6,220,263.00
Average 59,412 56,041 $ 518,355.25
Percent Increase Hours Assessed 3.6%
Percent Increase Hours Authorized 3.3% Average Percent Difference Authorized to Assessed 94.3%
Shopping/Errand
Total 509,561 483,277 $ 4,469,906.00
Average 42,463 40,273 $ 372,492.17
Percent Increase Hours Assessed 4.6%
Percent Increase Hours Authorized 4.2% Average Percent Difference Authorized to Assessed 94.8%
Heavy Cleaning
Total 302 302 $ 2,790.00
Average 25 25 $ 232.50
Percent Increase Hours Assessed -0.5
Percent Increase Hours Authorized -0.5 Average Percent Difference Authorized to Assessed 0.0
Respiration
Total 91,714 88,866 $ 822,029.00
Average 7,643 7,406 $ 68,502.42
Percent Increase Hours Assessed -2.0%
Percent Increase Hours Authorized -1.2% Average Percent Difference Authorized to Assessed 96.9%
Table D-8: IHSS Services—Food Shopping, Shopping/Errand, Heavy Cleaning, Respiration (June 2008 to May 2009).

44
Bowel and Bladder
HOURS
ASSESSED AUTHORIZED PERCENT AMOUNT
Total 2,332,764 2,274,170 $ 21,036,313.00
Average 194,397 189,514 $ 1,753,026.08
Percent Increase Hours Assessed 6.8%
Percent Increase Hours Authorized 6.8% Average Percent Difference Authorized to Assessed 97.5%
Feeding
Total 916,016 869,966 $ 8,047,245.00
Average 76,335 72,497 $ 670,603.75
Percent Increase Hours Assessed 4.2%
Percent Increase Hours Authorized 4.4% Average Percent Difference Authorized to Assessed 95.0%
Bed and Bath
Total 121,598 118,528 $ 1,096,399.00
Average 10,133 9,877 $ 91,366.58
Percent Increase Hours Assessed 6.9%
Percent Increase Hours Authorized 6.8% Average Percent Difference Authorized to Assessed 97.5%
Dressing
Total 1,481,678 1,470,123 $ 13,599,231.00
Average 123,473 122,510 $ 1,133,269.25
Percent Increase Hours Assessed 6.3%
Percent Increase Hours Authorized 6.4% Average Percent Difference Authorized to Assessed 99.2%
Table D-9: IHSS Services—Bowel and Bladder, Feeding, Bed and Bath, Dressing (June 2008 to May 2009).

45
Menstrual Care
HOURS
ASSESSED AUTHORIZED PERCENT AMOUNT
Total 27,221 26,931 $ 249,136.00
Average 2,268 2,244 $ 20,761.33
Percent Increase Hours Assessed 6.5%
Percent Increase Hours Authorized 6.7% Average Percent Difference Authorized to Assessed 98.9%
Ambulation
Total 955,714 951,262 $ 8,799,552.00
Average 79,643 79,272 $ 733,296.00
Percent Increase Hours Assessed 6.1%
Percent Increase Hours Authorized 6.1% Average Percent Difference Authorized to Assessed 99.5%
Move in and out of Bed
Total 979,499 972,760 $ 8,998,230.00
Average 81,625 81,063 $ 749,852.50
Percent Increase Hours Assessed 13.5%
Percent Increase Hours Authorized 13.4% Average Percent Difference Authorized to Assessed 99.3%
Bathing/Hygiene
Total 2,746,201 2,723,079 $ 25,188,748.00
Average 228,850 226,923 $ 2,099,062.33
Percent Increase Hours Assessed 4.9%
Percent Increase Hours Authorized 4.9% Average Percent Difference Authorized to Assessed 99.2%
Table D-10: IHSS Services--Menstrual Care, Ambulation, Move in and out of Bed, Bathing/Hygiene (June 2008 to May 2009).

46
Rubbing Skin
HOURS
ASSESSED AUTHORIZED PERCENT AMOUNT
Total 1,524,909 1,504,367 $ 13,915,604.00
Average 127,076 125,364 $ 1,159,633.67
Percent Increase Hours Assessed -1.6%
Percent Increase Hours Authorized -1.7% Average Percent Difference Authorized to Assessed 98.7%
Prosthesis Care
Total 728,976 723,004 $ 6,688,191.00
Average 60,748 60,250 $ 557,349.25
Percent Increase Hours Assessed 4.8%
Percent Increase Hours Authorized 4.9% Average Percent Difference Authorized to Assessed 99.2%
Accompany Medical
Total 650,764 633,099 $ 5,856,530.00
Average 54,230 52,758 $ 488,044.17
Percent Increase Hours Assessed 0.8%
Percent Increase Hours Authorized 0.5% Average Percent Difference Authorized to Assessed 97.3%
Protective Supervision
Total 12,681,019 3,430,449 $ 31,731,702.00
Average 1,056,752 285,871 $ 2,644,308.50
Percent Increase Hours Assessed 8.6%
Percent Increase Hours Authorized 9.0% Average Percent Difference Authorized to Assessed 27.1%
Table D-11: IHSS Services—Rubbing Skin Prosthesis Care Accompany Medical Protect and Supervision (June 2008 to May 2009).

47
Paramedical
HOURS
ASSESSED AUTHORIZED PERCENT AMOUNT
Total 820,059 778,632 $ 7,202,410.00
Average 68,338 64,886 $ 600,200.83
Percent Increase Hours Assessed 8.8%
Percent Increase Hours Authorized 10.1% Average Percent Difference Authorized to Assessed 94.9%
Non-Essential
Total 4,584,828 4,359,696 $ 40,326,881.00
Average 382,069 363,308 $ 3,360,573.42
Percent Increase Hours Assessed 4.0%
Percent Increase Hours Authorized 3.7% Average Percent Difference Authorized to Assessed 95.1%
Table D-12: IHSS Services—Paramedical, Non-Essential (June 2008 to May 2009).

48
IHSS PROGRAM ADMINISTRATION ANALYSIS: APPLICATION, APPROVAL, DENIAL, TERMINATION REPORT The Application, Approval, Denial, Termination Report reveals IHSS administration details concerning the application, approval, denial, termination of persons in the program. As in the previous reports we examined selected data from the monthly reports from June 2008 to May 2009. Figure D-26 displays the number of IHSS applications which demonstrates substantial variability from month to month. September has the most applications followed by October, falling to the fewest number in November.
Figure D-26: Applications (June 2008 to May 2009).
Figure D-27 displays the number of IHSS applications approval within 30 days which also demonstrates substantial variability from month to month as would be expected corresponding to the number of applications. By state law, IHSS applications are required to be processed within 30 days. An exception may be made for this requirement when a disability determination in accordance with the State’s Manual of Policies and Procedures, Division 30-759, section 30-771 has not been received in the 30 day period. It is important to note that the reports do not indicate the approvals and denials for the applications in the same month. Therefore, it is difficult to interpret the reports based on state law and the reports provide limited utility. This begs the question if the reports should be redesigned to provide greater utility or if there are other reports that we did not examine that report this aspect of the application process.
973 994 9781042 1038
783854
932
820895 883
930
0
200
400
600
800
1000
1200

49
Figure D-27: Application Approvals within 30 Days (June 2008 to May 2009).
In Figure D-28 we examined the percent difference in applications and approvals within 30 days during the period and noted a moderate amount of variability of approvals to applications.
Figure D-28: Percent Application Approvals within 30 Days (June 2008 to May 2009).
Figure D-29 displays the number of application denials. We again see considerable variability of denials from month to month and Figure D-30 displays the variability in terms of percent denials per applications.
447498
445
505535
365
427
326 346388 403
520
0
100
200
300
400
500
600
46%50%
46%48%
52%47%
50%
35%
42% 43%46%
56%
0%
10%
20%
30%
40%
50%
60%

50
Figure D-29: Percent Application Denials within 30 Days (June 2008 to May 2009).
Figure D-30: Percent Application Denials within 30 Days (June 2008 to May 2009).
Figure D-31 displays the number of IHSS applications approval after 30 days of receipt. The data reveal that on average, 5.6% of the application approvals are outside the 30 days processing requirement. County IHSS administrators revealed that this is actually a reporting design issue as share-of-cost cases do not have the 30-day requirement. We did not receive additional reporting that could have shed some light on this aspect of the application process. It again suggests that redesign of reports could provide greater utility.
160
194
168
131
201
110
153136
191
160
221
133
0
50
100
150
200
250
16%
20%17%
13%
19%
14%
18%
15%
23%
18%
25%
14%
0%
5%
10%
15%
20%
25%
30%

51
Figure D-31: Application Approvals After 30 Days of Receipt (June 2008 to May 2009).
Figure D-32 displays the number of IHSS applications denial after 30 days of receipt. The data reveal that on average, 27.1% of the application denials are outside the 30 days processing requirement. The difference in percent indicates applications that are finalized late are more apt to be denied. County reports do not indicate authorized exceptions to the state requirement.
Figure D-32: Application Denials After 30 Days of Receipt (June 2008 to May 2009).
Figure D-33 displays the number of IHSS terminations for the 12-month period. Note the dramatic low number in November 2008. Figure D-34 displays the percent of IHSS terminations with respect to the number of applications for the 12-month period. Note the dramatic low number in November 2008. This may indicate an IHSS administrative issue.
51 4944
60
4741
57
4347
57
67
56
0
10
20
30
40
50
60
70
80
244226
332
264
333
202
256231
185
248 247 245
0
50
100
150
200
250
300
350

52
Figure D-33: Terminations (June 2008 to May 2009).
Figure D-34: Percent Terminations (June 2008 to May 2009).
398
477 463
382437
340
413
500 518
426
509474
0
100
200
300
400
500
600
41%
48% 47%
37%
42%40%
48%
54%
63%
48%
58%
51%
0%
10%
20%
30%
40%
50%
60%
70%

53
SUBPOPULATION ANALYSIS Because of the time constraints of the project as well as the Memorandum of Agreement restrictions on the confidentiality of client data, acquiring raw data from the CMIPS system was problematic and hence not the optimal method of analysis. Instead, we requested summary data tables from IHSS contractor EDS. Using the demographic and other variables that were presently being reported to the IHSS administrators we cross-referenced the variables to produce analysis in the form of monthly summary tables for a one year period (June 2008 to May 2009)—the most recent data available at the time of our request. We then collated the data time series tables and the plotted the trend of variables.
We remind the reader of the caveat of the County IHSS administrator’s inability to reconcile the discrepancy between the data extracted and the County IHSS reports. We elected not to report our subpopulation analysis because of the uncertainty surrounding the data and reporting discrepancies. This is because as smaller populations are examined the effects of missing data, particularly of unknown origin and makeup, have a greater impact. This could lead to misunderstanding of subpopulations and trends in the population and provide County IHSS administrators spurious ‘facts’ and thus adversely influence their decision-making. In the future, and in the event the data and reporting issue is resolved, the County is encouraged to take the opportunity to consider investigating the subpopulations and trends of the IHSS population.
Total Population Demographics
Figure S-1 displays the distribution of gender in the IHSS program for the month of May 2009. Females comprise nearly a 2 to 1 majority over males in the program.
Figure S-1: Percent of Gender May 2009.
63.5%
36.5%
Female
Male

54
Figure S-2 displays the distribution of ethnicity in the IHSS program. Participants describing themselves as white comprise the greatest percent followed closely by Hispanics. “Other” is a surprising third highest. It should be noted that this group includes Pacific Islanders.
Figure S-2: Percent of Race May 2009.
Figure S-3 displays the percent of the two age categories—65 years old and below and above 65. The majority of the IHSS population is older than or equal to 65 years of age.
Figure S-3: Percent in Age Groups May 2009.
With respect to language, to simplify the analysis we grouped the languages with low representation into a group denoted as “Other”. Figure S-4 displays the language distribution of the IHSS program. English speakers comprise a slight majority followed by Spanish and Other. The
34.5%
30.2%
12.1%
4.5%
18.8%
White
Hispanic
Black
Asian
Other
44.4%
55.6%
<65
>=65

55
significant size of other speakers indicates a wide diversity of languages spoken by IHSS participants.
Figure S-4: Percent Language May 2009.
The percent of severity of disability is presented in Figure S-5 revealing a large percentage of the IHSS population is not severely disabled.
Figure S-5: Percent Severity of Disability May 2009.
Figure S-6 reveals the distribution of the relationship between caregivers (note that the CMIPS system uses the term “caregiver” in place of “independent provider”) and IHSS recipients. The largest percent are caregivers that are adult offspring revealing that many offspring are taking care of their parents. Relatives of the IHSS recipients make up 60.1% of the caregivers.
21.2%
6.1%
51.0%
3.1%
18.6%Spanish
Tagalog
English
Russian
Other
79.9%
20.1%
Not
Severe

56
Figure S-6: Caregiver relationship to IHSS participant in Percent May 2009.
Figure S-7 displays the percent of IHSS enrollees (per data extract) who receive Supplemental Security Income (SSI). The bulk of IHSS participants are SSI recipients.
Figure S-7: Percent Participants in ISS and non-ISS May 2009.
Figure S-8 displays the distribution of participation in the three IHSS programs.
4.0%
5.8%
8.6%
30.4%
15.1%
29.5%
6.6%
caregivers are spouses
caregivers are parents of minor children
caregivers are parents of adult children
caregivers are adult offspring
caregivers are other relatives
caregivers are non-related providers
Other
17.3%
82.7%
non SSI
SSI

57
Figure S-8: Percent Participants in IHSS Programs May 2009.
Independent Providers
In the distribution of independent providers, the category “Other” includes: neighbors, landlords, friends, housemates, housemate, live-in provider, Home Health Agency or some other business. Figure S-9 reveals a dramatic trend reversal in the number of hours for the independent provider “Other”. From June 2008 to October 2008 there was a marked decrease of hours followed by a rapid increase in hours. This increase in the hourly trend of the “Other” category was mirrored by a corresponding decrease in hours for caregivers that are adult offspring, caregivers that are non-related, and to a smaller extent, caregivers who are other relatives. Why “Other” caregivers would be experiencing such trend we do not know. It could be that recent recession has made IHSS care-giving a more attractive type of employment. However, a different explanation would be needed to account for the decrease in hours for non-related caregivers and spouses. County IHSS administrators suggest that the spike indicates changes in provider relationships for recipients already receiving services. However, there is little evidence in the County reports to support that claim.
9.8%
88.8%
1.4%
Waiver
PCSP
Residual

58
Figure 9. Independent Provider Trends.
Areas of Opportunity
In our review of IHSS reports, several reports examined yearly trends. However, no report we examined had conducted a report based on a specific12-month period. Although our analysis on the recent 12-month period has value, it is also important that a yearly analysis be conducted for policy decision-making. County IHSS administrators may also consider monthly analysis covering several years.
The primary finding of our analysis of County IHSS reports and data and areas of opportunity for improvement include:
• Redesign of reports to provide more useful information. o Relevant o Meaningful labels o Meaningful metrics o Actionable information
• Statistics (particularly counts) in reports should be able to be matched to other reports. Thus, reports should ‘pull’ from the same data tables and on or about the same time.
• Data (particularly counts) should match statistics (again, particularly counts) in reports.
0
100,000
200,000
300,000
400,000
500,000
600,000
700,000
Jun-
08
Jul-0
8
Aug
-08
Sep-
08
Oct
-08
Nov
-08
Dec
-08
Jan-
09
Feb-
09
Mar
-09
Apr
-09
May
-09
caregivers are spouses
Other
caregivers are parents of minor children
caregivers are parents of adult children
caregivers are adult offspring
caregivers are other relatives

59
FRAUD ANALYSIS This section of the report describes the County IHSS program’s fraud identification and prevention activities.
FRAUD ANALYSIS METHODOLOGY • Evaluated a recent San Diego County IHSS program Management Control Initiative (MCI)
focused on fraud • Performed data analysis of Public Assistance Fraud Division (PAFD)fraud referrals,
prosecutions, and convictions • Evaluated a recent San Diego County audit of the IHSS program • Conducted interviews with key IHSS staff • Reviewed relevant fraud reports and analysis
MCI FRAUD PROCESS MAP ANALYSIS As a result of an initiative launched by the Health and Human Services Agency, in collaboration with the County Office of Audits & Advisory Services, , Management Control Initiative (MCI) Workshops were conducted within HHSA. Preventing fraud in the San Diego IHSS program was identified as a topic for an MCI Workshop in Aging & Independent Services. The results would be included in a report to the County Board of Supervisors in response to their directive to develop ways to reform IHSS.
The MCI Workshop consisted of two meetings of key IHSS personnel over two days. According to IHSS administrators, the primary goal of the MCI Workshop was to ensure that IHSS employees at all levels have appropriate tools, controls, measures and motivation to effectively prevent fraud and meet objectives by the state. The methods used were process mapping, identifying and enhancing controls, and submission for consideration of implementation.
The MCI fraud process maps provided a good overview of the San Diego County IHSS fraud referral process. Social workers identify suspected fraud and submit the Public Assistance Fraud Division (PAFD) fraud referral to the Social Work Supervisor for review and approval. The SWS then forwards the referral to the Program Manager for approval. The referral is then sent to the Overpayment Account Clerk for inclusion into the Excel tracking log, and forwarded to PAFD. Should the IHSS Quality Control section suspect fraud, that section may contact the social worked assigned to the case or submit a referral directly to PAFD. In the event the fraud referral initiates from the Hot Line, the referral is forwarded to the social worker assigned to the case. All fraud referrals are forwarded to the PAFD, which is a division of County of San Diego’s Office of the District Attorney.
If PAFD confirms that fraud has been committed, the PAFD Investigator contacts the IHSS Overpayment unit for calculation of the amount of the fraud. Simultaneously to PAFD’s investigation, the IHSS Overpayment Account Clerks process the overpayment paperwork and forward to Revenue and Recovery for collection. In the event of a conviction, the court decides the amount of monies to be recovered. In the event that the overpayment is appealed, identical documentation is forwarded to the Quality Control section for appropriate internal process and procedure investigation.
The MCI fraud process map is presented in its entirety in Appendix D. Several areas of interest are described below. The areas of interest focus on the sources of risk and areas of proposed controls.

60
These areas will be discussed later in the document as areas of potential impact on IHSS fraud. In Figure F-1 we present the pre-referral and access/investigative portions of the MCI fraud process map.
Pre-Referral Assess/Investigate
Figure F-1. Fraud Process Map: Risks, Social Worker activities, and MCI suggested Controls.
Inputs to the locus, which receives info about suspected fraud, are incomplete. San Diego Fraud referrals can originate from three sources:
• External to IHSS—citizens referrals via San Diego County District Attorney Office Hot Line. • Interdepartmental referrals—including Quality Control section. • Social Worker referral—comparative analysis via time sheet, hospitalization, incarceration,
and through home visits.
However, systematic data collection and reporting in these areas are not currently being conducted by the County.
The fraud process chart begins with the social worker (coded in green) who “receives information about suspected fraud” (see Figure 1). The fraud process map is divided horizontally by a vertical grey line. To the left of the line is “pre-referral” and to the right is the “assessment/investigation” section. The “pre-referral” section is brief and information is restricted to the extreme lower left, “risk”, of the process map. Also under the category “pre-referral” (not displayed) are the risk of “fraudulent activities by providers” and “client misuse of the program”. Note the truncation of the item, “Fraudulent activities by providers/Client misuse of the…” which is problematic in all of the

61
County IHSS process maps. Note also there are no proposed controls associated with the above risks.
Two other risk categories under the “assessment/investigation” section in this portion of the fraud process map are included: “social worker training issues” and “social worker not knowing what to look for or what to do”.
There are three controls represented in this portion of the process map:
• Supervisor checklist of IP eligibility • Training: Fraud awareness and program integrity • Guidance/Training in IHSS Report Review
These seem reasonable but how the controls will be implemented will be critical to the success of limiting the associated risk.
Figure F-2 reveals another area of concern in the fraud process map. The item “Returns to supervisor” goes to some undefined process. County IHSS administrators assert that the goal of the MCI workshop did not include detailed process mapping of the fraud process but to identify gaps and risk.
Figure F-2. Fraud Process Map: Risks, Social Worker focus, and suggested Controls.
Figure F-3 displays the remaining risks and controls included in the MCI process map. The risks include: “disconnect with other agencies” (e.g., Appeals, PAFD, Medi-Cal) “lack of knowledge of providers with previous convictions”, and “appeals can reverse decisions”. Two controls are introduced: “tracking status of fraud investigations” and “MOA with the District Attorney’s office to investigate and prosecute fraud”.

62
Figure F-3. Fraud Process Map: Risks, PAFD, IHSS Management, and suggested Controls.
Although connected to the IHSS Administration and PAFD, the process map associating the controls and risks is not well documented. Note that Figure 3 reveals the fraud process map ending in undefined areas. The directional arrow for the control item “tracking status of fraud investigations” leads to the “disconnect with other agencies” and is connected to “lack of knowledge of providers with previous convictions” which leads to an undefined process. “MOA with the District Attorney’s

63
office to investigate and prosecute fraud” leads to an undefined process. “Appeals can reverse fraud decision” leads to an undefined process. We note that the “social worker fraud” risk was not addressed in the MCI process map. We will discuss these areas again later in this document. The discussion now moves to the fraud data analysis.
FRAUD DATA ANALYSIS Several studies 24 have reported fraud in the California IHSS system. The extent of the fraud in the program is highly contested ranging from Sen. Mark Leno’s(D-San Francisco) comment of fraud as "one one-thousandth of overall program spending", to the characterization by the Sacramento County Grand Jury as "rampant and out of control." The Grand Jury said "the small number of cases accepted for prosecution is not an indication of the magnitude of fraud”. 25 According to the County, thim San Diego County PAFD IHSS Fraud data were current to June 1, 2009 and contained 359 records. Only nine records were dated prior to 2003 and since those years were incomplete, the records were not included in our analysis leaving a total of 350 records.
There are several different ways of reporting fraud per year from the data obtained from the County:
• Number of fraud referrals by date of the overpayment. • Number of fraud referrals by date of the SW “sent” for processing. • Number of fraud referrals by date of the SW received for processing. • Number of fraud referrals by date of the referral to PAFD. • Number of fraud referrals by date NOA.
Thus, the metric depends on:
• If one is interested in SW submissions • If one is interested in submissions that actually reach PAFD • If one is interested in the year of the overpayment • The date of interest
These perspectives can create a myriad of metrics all of which may have utility depending upon the research question. We present three perspective below and note that we do not, necessarily, dispute any other perspective that the County may provide. Figure F-4 displays the number of referrals by social workers for processing by the year of the overpayment. This perspective attempted to examine the magnitude of fraud activity by year as submitted by the County IHSS social workers. The amount of overpayment detections and social worker submissions peaked in 2005. However this may be a reflection of data collection artifact as County IHSS administrators indicate there was no method of tracking referrals prior to 2005. This perspective can change retroactively as new cases are submitted since new cases could reflect overpayment of several years in the past.

64
Figure F-4. Number of Fraud Submissions by Social Workers by Year of Overpayment (from data).
Figure F-5 displays the number of fraud submission by social worker by the year they sent the case for review. The County also records data on the dates the submission was received. It is unclear why in some cases the difference of those dates is several years, although County IHSS administrators may be able to provide an explanation. This below perspective was an attempt to examine the detection and subsequent “raw” fraud investigation activity by social workers (not forwarded to PAFD). Again we find that fraud submissions peak in 2005 and decline in subsequent years. Note that this metric is not subject to retroactive adjustments as it reports social worker activity in the given calendar year. Since reporting of fraud contains at least two components, the actual fraud occurring and detection/reporting efforts, the interpretation of the data is unclear. Figure F-5 could be interpreted that fraud is decreasing, detection/reporting efforts are decreasing, or both.
Figure F-5. Number of Fraud Submissions by Social Workers by Year of Submissions--“Sent” (from data).
48
61
83
66
53
36
4
0
10
20
30
40
50
60
70
80
90
2003 2004 2005 2006 2007 2008 2009
50
60
73
5550
39
23
0
10
20
30
40
50
60
70
80
2003 2004 2005 2006 2007 2008 2009

65
Figure F-6 displays the number of fraud referrals to PAFD by year of referral. This perspective examines the activity of the IHSS processing of the social worker fraud submission and subsequent forwarding to PAFD—a referral. Note that this metric is not subject to retroactive adjustments as it reports IHSS referral activity in the given calendar year. This perspective indicates that referrals to PAFD peaked in 2007 and declined in 2008. The peak in 2007 may be linked to the peak in social worker fraud submissions in 2005 as observed in Figure F-5, indicating a several year lag in the referral process. The decline may be linked to changes in policy and procedure within and/or between the IHSS and PAFD organizations. In August of 2007 staff were given instructions increasing the minimum overpayment amount of $1500 was needed to send a referral to PAFD (previously the minimum was $500). This was a contributing factor to the decrease in the amount of referrals for 2008 but cannot fully explain the reduction of referrals since 2005. Thus, with so many potential factors involved, clear interpretation of these results is difficult.
Figure F-6. Number of Fraud Referrals to PAFD by Year of Referral (from data).
The data are recorded in a Microsoft Excel spreadsheet with no quality assurance (e.g., drop down lists) features. This partially explains the inconsistency of the recording of data items such as abbreviations for IHSS District Offices (e.g. Oceanside: OSC, OCS, 0SC) and required some clean up of the data for reporting. The data also indicate wide variability in the distribution of fraud referrals by district office as displayed in Figure F-7.
3944
69
90
42
24
0
10
20
30
40
50
60
70
80
90
100
2004 2005 2006 2007 2008 2009

66
Figure F-7. Number of Fraud Referrals to PAFD by District Office (all years from data).
Not all District Offices have the same number of social workers. Figure F-8 below reports the number of fraud referrals to PAFD per Social Worker by District Office.
Figure F-8. Number of Fraud Referrals to PAFD per Social Workers by District Office (all years from data).
Note that the distribution of referrals demonstrates high variability with respect to the ratio of referrals per social worker. Oceanside has 9 referrals per social worker while Hazards has less than 1.5 referrals per social worker.
Regarding the frequency of fraud referrals to individual clients and providers, no client had more than two referrals. One independent provider had six referrals with no other independent provider having more than two referrals.
72 30 12 54 146 360
20
40
60
80
100
120
140
160
El Cajon Escandido Hazards Oceanside South Bay Trolley Towers
3.8 3.3 1.5 9.0 3.7 3.30.0
1.0
2.0
3.0
4.0
5.0
6.0
7.0
8.0
9.0
10.0
El Cajon Escandido Hazards Oceanside South Bay Trolley Towers

67
Once the fraud is referred to PAFD, PAFD then investigates the case further, and if appropriate, subsequent prosecution is conducted through the District Attorney’s office. Table F-1 displays the number of fraud convictions and amount of overpayment by year as recorded in the data provided by the County.
2003 2004 2005 2006 2007 2008 2009 Total
Convictions 0 0 15 11 0 1 12 39
Overpayment $ - $ - $ 57,385.18 $ 71,120.57 $ - $12,490.20 $111,988.02 $252,983.97 Table F-3. Number of Fraud Convictions and Overpayment by Disposition Year (County IHSS data).
The percent of overpayment of convicted fraud cases over the entire period of data as compared to the total annual IHSS expenditures a miniscule, about a tenth of one percent of the annual ($252,983.97 of $249,532,666). The County auditor report states that nearly $78,000 was recovered from 1997 to 2008.26
A separate report obtained from County IHSS administers indicated different counts of referrals and outcomes. Table F-4 reports the number of Fraud Referrals Sent to PAFD, Reviewed/Investigated, Referred to Prosecution and Convictions in the last two years.
2007 2008
Fraud Referrals Sent to PAFD 93 44
Fraud Reviewed/Investigated 91 25 Referred to Prosecution 16 9 Convicted 3 3
Table F-4. Number of Fraud Referrals Sent to PAFD, Reviewed/Investigated, Referred to Prosecution and Convictions by Calendar Year (County IHSS internal report).
Note that the number of referrals, investigated, and prosecuted are significantly less in 2008 than in 2007. Note also that the numbers of convictions do not match what we observed in the data. This is because Table F-3 is reporting the number of convictions in the calendar year. The county internal report is reporting the convictions (and we assume all the other measures in Table F-4) from the perspective of referrals to PAFD. Thus the number of convictions reported in F-4 is NOT the number of convictions in that calendar year but the number of convictions of those referrals in the calendar year. Thus, the information in Table F-4 will change in the event that a new conviction occurs this year or subsequent years. On the other hand Table F-3 information will change only for year 2009. We confirmed the number of convictions in Table F-4 in Table F-5. This also underscores the need to clearly express metrics as different metrics provide different perspective—they are not necessarily “inaccurate”.
2001 2003 2003 2004 2005 2006 2007 2008 2009 No
Date
1 1 9 17 4 0 3 3 0 1 Table F-5. Number of Fraud Convictions by Year of Referral Sent to PAFD (County IHSS data).

68
The IHSS PAFD data recorded 97 different categories with respect to the outcome of a fraud referral. The large number of categories as well as the lack of systematic organization of the outcomes made analysis of the fraud referral outcomes challenging.
There are three IHSS programs in California – the Personal Care Services Program (PCSP), the IHSS Residual program, or the IHSS Plus Waiver. The PAFD data records only two categories PCSP and Residual and Waiver program combined. The majority of the fraud referrals, 90.2 percent, were of the PCSP program which is approximately proportional to the distribution of enrollment of the programs (83 percent PCSP).
In the event of a fraud conviction the Independent Provider is placed on the inactive list and prohibited from being an Independent Provider in the IHSS program for ten years. The data recording if the Independent Provider was currently on the active list were also not well recorded (e.g., Client (N0) & Client (NO), uncertain of the meaning of “NO/YES”). Additional fraud data inconsistencies are provided in Appendix C.
In the event of a fraud conviction the Independent Provider is placed on the inactive list and prohibited from being an Independent Provider in the IHSS program for ten years. According to IHSS officials, all convictions were forwarded to State officials and the providers have been excluded in San Diego County.
FRAUD RATES AND FRAUD DETECTION RATES During the 2007 California Department of Social Services (CDSS) IHSS Quality Assurance effort, 41 counties performed a random review of 23,823 cases and detected 1,043 cases (4.3%) that warranted further fraud investigation. Upon further investigation, slightly more than 1% (248 cases) involved fraudulent overpayment. 27
Several counties have released reports describing IHSS program fraud. The Fresno County IHSS Special Investigation Unit was created in 2003 to ferret out exactly what kind of fraud was being conducted. The unit has investigated more than 1,700 fraud cases and referred 330 of those cases for prosecution. The program has led to 243 convictions and recovered more than $1.2 million in restitution. Large discrepancies exist between recovery for Fresno and state mentioned later. County IHSS administrators indicated that sometime Counties include IHSS fraud along with Medi-Cal fraud. 28
Between January 2008 and September 2008, counties completed about 3,000 home visits and 17,500 targeted. As a result of these reviews, 218 cases were referred to DHCS for fraud. Between July 2005 and November 2008, DHCS investigated about 5,000 cases of fraud. They identified $6.1 million in overpayments and collected about $670,000 of that amount, an 11% recovery rate.11 According to a July 8, 2009 story in San Bernardino County, the grand jury found that there were about 60 fraud cases a year out of 19,798 IHSS recipients referred by investigators, a rate of 0.3%. Note that these were “referred” and not actual convictions. 29 Sacramento County reported that in fiscal year 2006-2007 there were 397 reports of suspected fraud out of 17,735 recipients, a rate of 2.2%. Of these, 31 were accepted for prosecution, a rate of 0.2% of prosecutable fraud. 25 In Los Angeles County, the district attorney recently said that, as the largest county with 200,000 In-Home Support Services consumers, L.A. had the largest amount of abuse. However, the Los Angeles Commission for Public Social Services reviewed a 2008 grand jury investigation and found it lacking in documentation, with "no evidence to support the allegations." The Senate Office of Oversight and Outcomes issued a report in March 2009 that enumerated the amount of funds counties and the state recoup under their current fraud and overpayment

69
structures. During the first half of 2008, counties referred 275 potential fraud cases to the DHCS totaling potentially overpayments of $1.03 million. Of that amount, counties reported collecting about $8,000. According to the Senate report, “the low incomes of workers and recipients make recouping money in IHSS fraud cases difficult.”11
FRAUD ISSUES AND PROPOSED SOLUTIONS BY GOVERNOR AND DISTRICT ATTORNEYS: JULY 6, 2009. On Jul 6, 2009 Governor Schwarzenegger conducted a roundtable where he, members of his staff, and selected district attorneys discussed IHSS fraud30. The panel indicated that the IHSS fraud was a significant issue.
Jan Scully, District Attorney Sacramento stated, “We have a huge caseload in Sacramento County. We had in my office about 1.6% of all those cases referred to us for fraud. And what we’ve told them is and I know you’ve used the figure and a lot of us agree with that, 25% fraud.”
District Attorney Gregory D. Totten Ventura County estimated the amount of IHSS fraud, “The current estimates range anywhere from on the low side, maybe 5 to 10% to 25% in terms of the fraud that occurs in this program. I think in the area of welfare fraud we have known for many, many years that early detection, early intervention, early assessment from the standpoint of fraud, pays huge dividends.”
Michael Groch, chief of the Economic Crimes Division in San Diego commented, “We have the P-100 program in San Diego, another fraud program and that's where we visit every applicant before they receive benefits and we've been able to stem a lot of fraud. By requiring fingerprints on those timesheets, that will virtually eliminate much of that fraud. Once the fraud occurs it takes a whole lot more resources to try and then go and prosecute the individual and the chances of getting restitution or that money put back into the system, next to zero. The whole idea is you prevent the fraud.” (San Diego County's Project 100% permits mandatory "walk through" inspections of their homes by agents from the District Attorney's office without a warrant for persons applying for public assistance. In 2007 the 9th Circuit Court of Appeals upheld the program citing a Supreme Court ruling which held that home visits to verify eligibility for benefits are not searches, because the purpose of the search is not a criminal investigation.31
Several areas were suggested in IHSS fraud prevention:
• Finger printing of all providers including family member providers. • Background checks of all providers including family member providers. • Unannounced visitations • Removing the $500 cap on fraud prosecutions • Access to county IHSS administrative funds to support fraud investigations.
Relationship between Recipients and Providers Independent providers can be family members. Gregory Totten, Ventura County district attorney, “In our county, only about 22% of the individuals who receive the services actually get those names from the registry. Typically, they’re going to

70
friends or family members and there can be a very unhealthy, almost conspiratorial relationship between those individuals that, again, disadvantages the law-abiding citizens who need this service,” [italics added by author]. Issues to consider:
• Preventing family members from becoming independent providers will not prevent friends or associates from becoming independent providers who could also partner in fraudulent activities.
Recipients of IHSS services do not know the independent provider.
Jan Scully at the Governor’s meeting with district attorneys stated, “Well, the upfront accountability and eligibility, we find clients, the recipients, do not really even know about some of their providers that are providing service.”
Issues to consider:
• So which is it? Should recipients know the provider or not know the provider? • If family members, friends, and strangers are all potential fraud problems who will perform
services for the recipients?
Improved Integration of Disparate Database Systems
John Spillane, “…sharing of computer information among the various providers, DPSS, Social Security, being able to share that information.”
Issues to consider:
• Person is in the hospital, yet time sheets for services are submitted for that period. Can CMIPS II be linked to Medi-Cal (MEDS) hospital discharge records as part of an automated process?
• Problem of separate funding for separate programs creates a system that is not well integrated and thus is inefficient.
• Department of Public Social Services (DPSS) database. • Monitor deaths. Integrate with Federal Social Security Administration (SSA) Master
Beneficiary Record (MBR), Medicare database, Medicare Advantage and Prescription Drug (MARx), and/or the Enrollment Database (EDB). After all, the Federal government contributes funds to the IHSS program as well and it would be in the Federal government’s best interest.
• Additional administrative costs which may or may not be cost-effective.
AREAS OF OPPORTUNITY: SAN DIEGO COUNTY FRAUD EFFORTS During the MCI, the heat map analysis indicated that IHSS supervisors and staff perceive the majority of fraud threats as moderate to high fraud likelihood and all fraud threats as moderate to high impact—only social worker fraud was thought to be “low”. In examining the County data, these

71
data reveal there is little fraud with respect to scope of the IHSS program (There were a total of 39 San Diego County IHSS fraud convictions from 2003 to June 2009.). Thus, there appears to be an inconsistency with County IHSS staff perceptions of the likelihood and impact of fraud and the actual fraud detected, reported, and prosecuted by the County.
It is reasonable to assume that the reporting of fraud is only as efficient as the detection of fraud. County fraud detection efforts appear to be less than optimal. Thus, the San Diego County data confirmed that fraud has taken place in the IHSS program, but the extent of that fraud remains unknown and not well documented—particularly the nature and method of the fraud.
The MCI identified 14 areas of threats to the program of which the following subset are directly related to fraud (summarized):
1. Clients Unable to Manage • Abuse of IHSS client and resulting in coercion by independent providers. • Client not capable of making decisions due to mental disability. • Lack of understanding how to report hours on timesheet. • Advance payments.
2. Lack of Provider Oversight • IP responsibilities not clear to IP and/or Client. • Client is the employer – Social Workers (SWs) don’t have leverage in putting a stop to
visible fraud (i.e. firing IP’s who aren’t doing the work). • Lack of staffing to provide regular (and frequent) oversight of providers.
3. No Verification of Identity/Background Checks of IP • Delay in reported provider changes result in overpayment. • No criminal background checks or history of abuse for providers. • Identity fraud, and identity theft, fraudulent documents, ID, Social Security numbers not
verified. Client/IP identification not verified. • Providers not legal to work. • Prior fraud of IHSS services (in another County). • Limited ability to determine IP previous convictions, and limitation of types of
convictions that can disqualify an IP. 4. Fraudulent Activity by Providers (and in some cases with cooperation with Client)
• Fraudulent hours reported on timesheets. • Time sheets not having actual times services were provided. • Signature verification of timesheets.
5. Physician Issues • Medical verification—fraudulent paperwork • Physicians lack of understand of the IHSS program requirements. • Some clients pressure physicians to complete medical forms in a specific way to obtain
IHSS services. 6. Misuse of the Program
• Clients having providers do non-IHSS services. • Client trades hours for other services that are not authorized. • Recipient receiving more services than necessary. • Clients fail to report changes that impact hours. • IPs and clients not clear on responsibilities (e.g. IHSS out-of-County).
7. Social Worker Fraud

72
• SWs not actually doing assessment/falsifying paperwork. • Internal fraud – supervisors • Internal fraud – SWs pay providers who don’t exist (e.g. family members) • Spec transactions done for fraudulent services.
8. SW Error/Training Issues • Lack of training to identify fraud, lack of investigative skills, and process orientation. • SWs have no medical expertise or sufficient ability to validate recipient’s limitations
related to medical condition. Lack clear expectations and guidance regarding fraud, including systematic process as to how to look for fraud during SW home visits.
• Insufficient unannounced visits. 9. Disconnect with Other Agencies (e.g., Appeals, PAFD)
• Appeals (ALJs) do not support SW determination. Perceived appeals process reversing decisions uncorrelated with evidence. ALJs – some not impartial, interpret rules and regulations (IHSS) differently. Appeals decisions invalidate current regulations.
• Appeal reversals on PAFD instructions. • “Double-dipping” users of multiple programs. People who cross-fraud in many
entitlement programs. • Fraud by IHSS recipients who have not been investigated or prosecuted. • Lack of communication between agencies (cross counties). • Poor communication with other waiver programs (e.g. IHO and Veterans) • Fraud under $1,500.00 not being investigated. • Appeals process: no limitations on the number of appeals a claimant can request, which
is costly. 10. Loss in Funding
• Poor economy has more people seeking ways to make money. • Decrease in IHSS Staff.
The root cause of all fraud is psychological, which is manifested in people performing fraudulent activities. In an often referenced study, Cressey postulates that fraud has three components: opportunity, pressure (usually financial problems), and rationalization. 32 One method of indirectly addressing the root cause of fraud is to eliminate the program which removes the manifestation by removing opportunity. However, that is often a drastic and undesirable solution as the ‘baby is thrown out with the bathwater”—the good of the program is also eliminated. Thus, the usual method of addressing fraud is through limiting opportunity and through deterrents. These can include establish threats and penalties, and designing and implementing a system that can effectively detect, identify, prosecute, and fine and sentence offenders. Just as in other forms of crime, deterrence is also accomplished by the high visibility of authority. Opportunity for fraud can be minimized through legislation, policy and procedure, and other forms of process control. Another way to minimize fraud is through education and training making the rationalization process more difficult. That is, providing training so that the actions and behaviors which constitute fraud are well understood. In observing an actual IHSS time sheet the hours for the 15 day period were recorded as 7.9—each and every day. When we queried this with several IHSS supervisors, it was revealed that this was what IHSS providers were trained to do – record and subsequently be reimbursed for maximum hours. County IHSS supervisors could not recall where this policy originated. County training documentation, In-Home Supportive Services Payroll Instructions, indicated that providers should record the number of hours they worked each day. Nevertheless, County IHSS administrators indicate, in practice, different instructions and it is reasonable to conclude that this undocumented policy could be sending the wrong message to IHSS recipients and providers.

73
However, not all fraud is intentional. Unintentional fraud can result when people are not aware of the often complex regulations of a program. Thus, the resulting ‘fraudulent’ behavior can be ‘errors in judgment’ to which more effective training and reminders can reduce these occurrences. The County IHSS MCI Action Plan reflects this reality. The items do not address the root cause, but rather focus on detection and deterrence as well as addresses the unintentional fraud through enhanced training of IPs and clients.
1. SPECIALIZED TRAINING, EXPECTATION SETTING, AND REDEPLOYMENT OF SOCIAL WORKERS • Establish clear expectations and guidance for Supervisors and SWs regarding the
handling of fraud. • Provide training on timely corrections of QA findings. • Provide training in case management strategies to expedite intake. • Provide training on roles and responsibilities re IHSS reports. • Separate Social Workers who conduct intake from those who do routine visits. • Assign cases to SWs with investigative skills, or designate SWs to serve in investigatory
role. • Redeploy investigative resources, such as co-location of PAFD and IHSS staff. • Increase the number/level of unannounced home visits.
2. ENHANCE FRAUD DETECTION CAPABILITIES
• Enhance detection/tracking of changes to authorized services. • Conduct additional review and verification of case documents. • Fully utilize fraud detection capabilities within CMIPS II: Use build-in alerts and cross-
checks, and consider a risk scoring tool.
3. EXPAND AUTHORITY AND IMPROVE ABILITY TO CHECK AND DETECT CRIMINAL BACKGROUND OF PROVIDERS • Enhance criminal background checks by exploring a variety of alternatives (MOUs with
DA, PAFD and Public Authority). • Advocate for legislation proposing broadening local authority and types of convictions
that providers would be ineligible to participate in program. • Automate the fraud referral system—as has been done in CalWIN in order to identify
foster care providers with criminal activity. • Seek better access/methods for verifying information and identification from variety of
data sources (INS, Social Security, CWS, and MEDS). Request greater frequency of State reports on possible fraudulent activities.
• Enhance MOA between IHSS and PAFD to improve timely communication of outcomes of fraud investigations to ensure timely notification to State re Suspended and Ineligible IHSS provider list.
4. CLARIFY EXPECTATIONS WITH CLIENTS, PROVIDERS AND PHYSICIANS • Develop and communication clear expectations for clients and providers alike, so they
are aware of the higher level of surveillance and oversight in the IHSS program. • Create a certification process for Physicians to inform them about the program and
reduce misuse.

74
Risks identified and submitted by the MCI without controls include:
• “Lack of provider oversight”— improvement in oversight via change in policy, regulation, and/or legislation.
• “No verification of identity/background checks of IP” — improvement in IP identity/background checks per policy, regulation, and/or legislation, as well as in automated IT systems.
• “Clients unable to manage”—assessment tool? Should there be separate programs for the competent and incompetent? Change in policy, regulation, and/or legislation.
• “Fraudulent activities by providers”—identify fraudulent activities by providers and change policy, regulation, and/or legislation. Improved detection and prosecution. Provide training.
• “Client misuse of the program”— identify fraudulent activities by clients and change policy, regulation, and/or legislation. Improved detection and prosecution. Provide training.
In 2009, the San Diego Auditor reported on IHSS fraud investigation activities in the county26. Below are the items in the Auditor’s report and recommendations:
• IHSS reports fraud convictions to the State but does not report suspect fraud for investigation as required. Recommended that all fraud investigations conducted by PADF are reported and monitored.
• Oversight of the fraud investigation contract with the Public Assistance Fraud Division (PAFD) needs improvement.
• Specific fraud awareness training provided to IHSS social workers should be improved. Recommended all social workers attend and complete State required training and focused training on fraud detection and high risk profiles. Require further review and verification of case documents to ensure data integrity and timely completion of required forms.
• Recommended actively monitor overpayment collections reports to ensure timely return of funds to State and ensure outstanding fund balance is properly returned to the State.
County Agency official response to the report was generally in agreement with the Auditor’s assessment. However, from our perspective, the response lacked awareness that specific enhancements in record-keeping, particularly in a formal database with standard data elements, data validation controls, and systematic reporting would address, at least in part, all of the recommendations of the Auditor’s report. Integrating all aspects of fraud-tracking into a single system would have advantages that the present piece-meal system lacks. Currently the state maintains the records of IHSS program training. However, the state doesn’t know who needs to attend since the state does not maintain county employment information. Thus, the county currently tracks the state training attendance for each social worker. Social worker supervisors also maintain staff training records. County training for new social workers is usually done in a classroom setting once a year.
Plans are presently being formulated for the San Diego County Program Support office to make IHSS program training available online, via the Learning Management System (LMS). LMS training will record the employee training information.

75
The opportunities for improved management controls in the IHSS report of San Diego IHSS program from the Office of Audits and Advisory Services (OAAS) included: 26
An area of opportunity for San Diego Fraud data collection and reporting referrals are in the origins of referrals. Number of referrals from the following sources:
• External to IHSS—citizens referrals via San Diego County District Attorney Office Hot Line. • Interdepartmental referrals—including Quality Control Department. • Social Worker referral—via time sheet analysis, hospitalization analysis, incarceration
analysis (not reported by potentially a source of fraud referrals), and home visitations.
The pilot CMIPS II can also be leveraged into exploring other integration with additional processes. San Diego has a unique system as compared to other counties with respect to fraud and PAFD. Because CMIPS II is being developed as a generic system for all California counties, the system will not be readily adapted to the PAFD process. Nevertheless, San Diego County could develop a more integrated system of fraud detection which could be a model for the CMIPS II system for adoption across the state. The simplistic Fraud database and reporting system described earlier (i.e., linking social worker fraud training, referrals, and prosecutions) could be adapted into an application like CMIPS II.
Reports indicate that fraud detection and prosecution does not appear to be a cost-effective solution. The evidence of such small amount of monies recovered from fraud convictions when considered with the costs of detection, investigation, prosecution would lead one to conclude that an ‘ounce of prevention is worth a pound of cure’. As we have indicated in this report, the amount of fraud detected is somewhere between less than a percent and less than 4 percent. The true amount of fraud remains unknown. In the absence of reliable metrics, discussion of the amount and financial impact of fraud is not evidence-based and thus provides little utility in improving the efficiency of the IHSS program. The County Grand Jury reports on fraud suggest it may be more efficient to formulate pro-active measures to deter fraud so long as those efforts do not overly inhibit valid persons from receiving the benefits of the program.26 Areas of opportunities for San Diego IHSS stakeholder consideration include:
• Enhancements in record-keeping, particularly in a formal database with standard data elements, data validation controls, and systematic reporting
• Integrating all aspects of fraud -tracking into a single system • Better tracking of social worker referrals of fraud to PAFD. Presently there are no data or
metrics presently being recorded for social worker submission of fraud referral • Through tracking of social worker referrals of fraud to PAFD, metrics can be obtained to
determine the distribution of referrals by social worker • Through those metrics, social worker can be identified that submit zero or potentially
‘underperform’ in fraud referral submission making them candidates for future fraud detection training
• The outcomes of social worker submissions could be recorded and monitored • Through those metrics, social workers that submit an abundance of referrals that were
determined not to be fraud -- potentially indicating ‘over submitting’ -- can be identified for future fraud detection training

76
• Utilization of Data. In order to prevent fraud, one must know the techniques of the fraud: Successful convictions—indentify information that was germane for past convictions. Tailor training material based on that necessary information. Train staff
• We note that the “social worker fraud” risk was not addressed in the MCI process map. County IHSS administers indicate social worker fraud prevention is conducted. However, we did not observe any discussion for improvement of social worker fraud prevention in the MCI workshop
• Establishment of a Fraud Hot Line • Review, for expansion and improvement , the present quality control and social worker
joint visit home for fact finding • Improved Performance Measures. Currently the only performance measure the County IHSS
reports is, “Cases in compliance with IHSS quality assurance program”. County IHSS administrators indicate the cases are randomly selected. We note that the goal for the next fiscal year is set below what was achieved in the prior year. The performance measure is also not linked to costs33
There are three controls represented in this portion of the MCI process map:
• Supervisor checklist of IP eligibility. • Training: Fraud awareness and program integrity. • Guidance/Training in IHSS Report Review.
These controls seem reasonable but how the controls will be implemented is critical to the success of controlling the associated risk.

77
SAN DIEGO COUNTY IHSS PROCESS MAPPING ANALYSIS The process maps were constructed by Curam Software, which is working with EDS (an HP Company that also developed CMIPS II) and the State of California. CMIPS is a state database for the IHSS program and the first version is currently in use in San Diego. The Business Process Review project was designed to identify gaps in local San Diego County IHSS processes with respect to the development of CMIPS II. The IHSS process maps are divided into several processing components:
• Referral, Application, and Assessment o Client Screening o Home Visit o Determine Eligibility/Grant or Deny o Medi-Cal Share of Cost
• Contact Agency Referral • Advance Pay • Status Changes • Recertification • Appeals • Payroll
o Employment Verification o Worker’s Compensation Referral o Health Benefits
• Fraud • Overpayment • Liens and Garnishments • Process Created • Activities Mapped • Problems Mapped (uncertain if this is still in progress)
County IHSS administrators indicated creating the maps was not the primary goal of the project and so the process maps may not be complete or in a format appropriate for other uses.
METHODOLOGY • Examined County IHSS process maps and evaluated for accuracy and completeness. • Met with and discussed process with IHSS supervisor and staff. • Observed a re-certification process performed during a home visitation by a social worker. • Met with Business Process Re-engineering team.
RESULTS We conducted an analysis of the process maps and determined them to be a good framework for future refinement and process improvement. Some general concerns include misspelling, truncated labels, and undefined termination points. The documents that were provided appear to be ‘works in progress’ rather than fully completed. For example, there are comments and notes scattered through the documents such as, “Mary will get info for next week.” And section “2. ICT in” is void of information. The documents state that the project is 60% complete with the following phases completed. In saying that, we recognize that our analysis is also incomplete and suggest our work

78
presented here be integrated into the continuing process mapping and CMIPS II efforts and activities.
In meeting with the Business Process Re-engineering team, it was revealed that many of the problems in the process maps were due to the BluePrint software which led to many problems in creating the visualization of the County IHSS process. Parallel processes, multiple start points within categories, and certain terminations, could not be depicted. There was no spell check within the application. The BluePrint software had crude exporting and printing functions.
We examined each section but will only describe areas where we discovered significant issues.
REFERRAL, APPLICATION, AND ASSESSMENT The process map describes the referral process from which potential IHSS clients are evaluated for eligibility and potentially enrolled into the program (See Figure M-1). The primary entry point for potential IHSS clients is through the Call Center Services (CCS) and to a lesser extent through Inter County Transfers.
The CCS is operated under the Aging and Independent Services (AIS). Prospective clients call CCS for various County services including IHSS services. Approximately 95% of all referrals are through CCS. County IHSS administrators offer slightly conflicting descriptions on the exact process in these maps. Thus, rather than documenting the processes, we have elected to omit our work so as to not choose between different administrator’s depictions of the process or provide misrepresentations of the IHSS processes.
RECERTIFICATION Recertification is nearly an identical process as the social worker’s initial assessment of the client. The recertification requires a social worker performing a home visit to the client. During our direct observation of a home visit recertification, we noted that the process involves numerous assessments, each requiring the social worker to make the appropriate annotations on the various forms. This included recording of medical conditions, medications, activities of daily living, and persons living at the home. The entire process was completed in about 40 minutes although the duration would likely be variable and depend on the specific circumstances of the client.
Figure M-1 displays a portion of the recertification process map. Note the loop that intersects another process line (red circle) which also terminates at “PSS logs & sends request to EDS” (not show in our figure). The entire looped line has no directional arrow. In process maps lines should connect with information boxes and not other lines and arrows are required to show direction of the process—no arrow, no direction and hence no information regarding the process.

79
Figure M-1. Process Map of Share of Cost (mislabeled in the County IHSS process map as Recertification).
MEDI-CAL SHARE OF COST In the event a client meets the IHSS program eligibility requirement but has income above the program threshold, the client is responsible for contributing the difference. The IHSS income criteria vary depending upon which Medi-Cal category the client is enrolled in. The share of cost process is provided in part, below in Figure M-2. Note that the category “Clerical enters in CMIPS” has an output to “Client calls SW due to IP unavailable. This is in error. The share of cost process ends with “Clerical enters in CMIPS”.

80
Figure M-2. Process Map of Ongoing Cases (mislabeled in County Process Map as Share of Cost).
URGENT SERVICE Urgent service is a situation where the client’s provider is not able to perform IHSS services. The line exiting from “SW faxes referral to Urgent Services” goes to Appeals (not shown as it is a far distance on the map). Note that the outcome of this process cannot be appealed, so in Figure M-3 below the line exiting from “SW faxes referral to Urgent Services” to the Appeals process is in error and should be deleted.
Figure M-3. Process Map of Urgent Care.

81
APPEALS In the event a client’s hours are reduced or IHSS is denied, the client can appeal the decision. The full process map is not present here, but we note that written requests are filed with the county welfare office in Figure M-4. The county then sends a copy to the state Administrative Adjudications Division which is not included in the process map. The process map does not describe the process where the appeal is made after the effective date or if the appeal is made after the deadline to submit the appeal. The process map terminates without describing the process for the outcomes of the hearing. For example, if the outcome is in the County’s favor what process is implemented, and if the outcome is in the client’s favor what process is implemented?
Figure M-4. Process Map of Appeals.
HEALTH BENEFITS A portion of the Health Benefits process map is provided below in Figure M-5. Note the process line below the word “Termination”. The line split actually refers to if health benefits are to be terminated (arrow to right) or newly implemented (line splitting off and down to Newly Eligible Report which is not shown in our report). Note also the misspellings which should be amended.
Figure M-5. Process Map of Health Benefits.

82
OVERPAYMENT The overpayment process map is presented in Figure M-6 below. The process item labeled “Activity” is performed by the Public Assistance Fraud Division (PAFD) which actually determines the decision of Fraud (Yes/No). Once again, note the numerous misspellings.
Figure M-6. Process Map of Overpayment.
AREAS OF OPPORTUNITY
PROCESS MAPS IMPROVEMENTS The implementation of CMIPS II provides an opportunity for the county to improve the overall performance of the IHSS program. The county is already aware that CMIPS II will require changes to the process maps and SOPs particularly at the start of the application process. Completing the present process could lead to new process maps and training could begin for a smooth transition. During our visits at the County IHSS departments, we did not see any process maps displayed. We suggest that process maps be publicly displayed in the appropriate departments for training, reminders, and continual quality improvement. Including markers will encourage employees to note improvements and comments which can then be integrated into documentation, training, and/or computer software programming. Thus, process maps can be used as a public forum or tool for continuous quality improvement efforts.
Our observation of this CMIPS II gap analysis project indicates that the goals and objectives are likely to be accomplished. However, these types of projects have greater opportunity for overall process efficiency if those goals and objectives were defined with a greater perspective. County IHSS administrators indicated that creating the maps was not the primary goal of the project and so the process maps may not be complete or in a format appropriate for other uses. We see this as a potential loss of opportunity. Some County IHSS administrators seem to be more concerned with accomplishing limited and restricted goals and objectives than optimizing opportunity and resources. Much of the work conducted in this initiative could be of greater value—particularly the project process maps. The project maps as created and in their present form are not suitable for other uses such as development of training and continuing process improvement. In the future, County IHSS administrators may want to consider a broader application of their projects and maximize opportunity from the expended resources in such projects. Had a more efficient and

83
opportunistic vision been considered by County IHSS administrators, many of the following opportunities would have already been realized:
• Convert the process maps using a different software that can depict the County HISS process, export, and print in an acceptable manner
• Make corrections and include additions noted above • Correct spelling. • Clean up truncated labels • Resolve areas where the connections are undefined • Better define and describe the terminals • Employment Verification mapping appears to be incomplete • Provider change (Client hires and/or fires provider) process is not included in process
maps • Although the CMIPS system determines which component of the IHSS program applies, such
an important aspect of the process seems reasonable to be included in the process maps (i.e., Personal Care Services Program, Waiver, and Residual)
• Public Authority is not included in process maps • Integrate the process maps in training documentation • Display the process maps in all departments for training and reminders, as well as a vehicle
of process improvement
CALL CENTER We visited the Aging and Independence Services (AIS) County Call Center to discuss the activities of the Call Center. In our discussion with the administrator, it was revealed that the County Call Center is presently under utilized as approximately 50% of the staffing capacity is presently being used at any given time. Although the office work stations were not being fully used at the center, the actual call processing capacity is unreported.
Numerous San Diego County outreach programs are presently being conducted via San Diego 211:
• Maintain and transmit resource database for the specified use by AIS call center and their public Network of Care website as well as the MHS public Network of Care website
• Outreach, eligibility prescreening and referrals for the following programs: o EITC/VITA o Community clinics o County Medical Services o Medi-Cal o PAI o Family Self-sufficiency programs o SNAP (Food Stamps) Current plans are to extend services to include application
completion and appointment scheduling. o County Mental health programs o Crisis/suicide calls
• Flu hotline • The County shall actively promote 211 as the dialing code for quick, free access to
information about community, health, human and disaster services • Maintain the Mental Health Board and Care vacancies (monthly) • Maintain the Homeless Shelter vacancies (daily)

84
San Diego 211 also is contracted with County Office of Emergency Services (OES) to perform the following services during County declared disasters:
• Public dissemination of information • Rumor control • Trend analysis • Coordination of other non-governmental organizations
It would be prudent for the county to evaluate the efficiency and cost-effectiveness in having both the Call Center and subcontracting tasks to San Diego 211.
CMIPS II The implementation of CMIPS II provides opportunity for the county to improve the overall performance of the IHSS program. The county is already aware that CMIPS II will require changes to the process maps and SOPs particularly at the start of the application process. Completing the present process could lead to new process maps and training could begin for a smooth transition. During our visits at the County IHSS departments, we did not see any process maps displayed. We suggest that process maps be publicly displayed in the appropriate departments for training, reminders, and continual quality improvement. Including markers will encourage employees to note improvements and comments which can then be integrated into documentation, training, and/or computer software programming. Thus, process maps can be used as a public forum or tool for continuous quality improvement efforts.

85
DISCUSSION Considerations for reform in any program must be made in the context of the goals and
objectives of the program. This begs the question: What are the specific objectives of the
IHSS program and what metrics are associated with those objectives? We suggest the
following three objectives, metrics, and potential efficiency metrics for consideration and
discussion:
1. Care of the blind, disabled, and disadvantaged elderly.
• Metric: Number of IHSS program qualified clients—in which case an
increase would be desirable regardless of costs.
• Proxy Metric: Amount of funds distributed to IHSS program qualified
clients—in which case increase could be desirable regardless of the number
of clients served.
• Efficiency Metric: No direct efficiency metric as the objective would be to
spare no amount for the care of as many persons possible.
2. Quality of care and services for the blind, disabled, and elderly. The metrics
could include:
• Metric: Quality of care for IHSS program qualified clients—in which case an
increase would be desirable (e.g., a measure of quality per cost).
• Efficiency Metric: Quality of care per distributed funds.
3. Avoidance of institutionalization. The metrics could include:
• Metric: Number of clients avoiding institutionalization—in which case an
increase would be desirable. (difficult to measure since avoiding
institutionalization can only be estimated, not directly measured)
• Efficiency Metric: Estimation of cost savings due to avoiding
institutionalization.
If the goal of the IHSS program is simply to care for the blind, disabled, and disadvantaged
elderly with no regard to costs, the present program could be said to be working as
designed since the number of persons served has increased steadily since the program’s
implementation. In short, the objective is the more, the better. However, this perspective
does not consider quality of care and ignores financial realities—particularly in this time of

86
state and local budget crises. Resources are not unlimited and monies must, at some point,
originate from individuals who are not receiving those services. Thus, it seems prudent to
consider quality of care as well as costs associated with the IHSS program. Concerning
quality of care, there appears to be no standard quality assessment of the program nor
have there been scientific studies conducted to evaluate the quality of care in the IHSS
program.
San Diego and other counties have a customer satisfaction survey instrument, but the
survey does not address the quality of care the participants receive from the provider—the
survey does not ask a single question regarding the quality of service the client receives from
the provider. County IHSS administrators indicated that they are limited by regulation as to
what they can survey. Thus, this is an area of opportunity for further consideration and
pursuit of more direct measures. The San Diego Customer Satisfaction Survey consists of
nine close-ended questions pertaining to the IHSS social worker and/or staff nurse and two
open-ended questions about what the client likes about the IHSS program and
improvements they suggest. According to San Diego IHSS administrators, the satisfaction
survey is ‘scored’ using a composite score based on ‘positive’ or ‘negative’ responses to the
close-ended questions. Respondents are said to be “satisfied” if either the ‘very satisfied’ or
‘somewhat satisfied’ portions of the survey outnumber the ‘not satisfied’ or ‘not at all
satisfied’ portions of the surveys. This method of reporting a customer satisfaction survey
is highly problematic. The first problem is that the survey questions do not all relate to
satisfaction but rather procedure, for example: “The Social Worker informed me of my right
to appeal.” Thus, the composite measure of satisfaction is contaminated with non-
satisfaction responses. The second problem is that composite reporting omits the results of
the individual items and thus misses an important quality assurance opportunity. The third
problem is that the scoring ignores the positivity bias in the survey response; that is, the
evidence that respondents are reluctant to give negative evaluations to other persons. 34
Thus the results inflate the degree of “satisfaction”. Over the last two and a half years,
“satisfaction” ranged from 95.5% to 100%. In addition to highly questionable scientific
validity, these results give the impression that there is almost no room for improvement.

87
The quality assurance program and metrics initiated by the state have more to do with
administrative quality than the service quality actually provided to the client. This has
much to do with the nature of the program—clients hire and manage their own provider,
so much of the responsibility for the quality of the care and service is placed on the
recipient. The County has little or no control over the quality of what occurs at the client’s
residence. In fact, the County has little or no control over whether services are even being
delivered—much is based on trust, rather than verification and accountability. The
assessment of the quality of care is left to the client by the design of the IHSS program.
However, the mental competency of clients is sometimes in question which contradicts the
basic premise of this aspect of the IHSS program. In the IHSS program there is a
disconnection between the County’s activities (which are basically a funding distribution
process) and the desired outcome of the legislation and regulation (which is to provide
care for disabled, blind, and elderly). Thus, there are little data, if any, to evaluate the IHSS
program with respect to quality of care and service, and therefore no efficiency metric for
the first two objectives presented above—scope of care and quality.
Avoidance of institutionalization is certainly one of the primary goals of the IHSS program
and is often mentioned as being a major success of the program. Comparing the costs of the
IHSS program to the alternative, institutionalization, is an important measure in the
context of reform consideration. A 2003 study on long term care in San Francisco found
that institutional care costs were three and a half times higher per consumer than home-
and community-based care costs.35 A second study estimated that state and county costs
would increase approximately three to five times higher if recipients are forced into
institutions.22 And finally, the California LAO estimated that the cost for each IHSS recipient
is about $13,000 per year whereas nursing home costs are approximately $55,000 per year.
However, a key component in any such evaluation is measuring the number of persons who
would actually enter an institution—it can only be estimated rather than measured. Thus,
the cost comparison per individual is important to consider but is not sufficient in
providing a reliable metric for IHSS program evaluation. Likewise any efficiency metric
associated with an estimate of institutionalization is also a weak and unreliable indicator of
overall success of the IHSS program.

88
San Diego County records only a single performance metric for the IHSS program—the
number of cases in compliance with the IHSS quality assurance plan and costs. The IHSS
Quality Assurance program is a state program that targeted the quality of the IHSS
assessments through training and retraining of social workers and developed the Hourly
Task Guidelines for assessing hours for each IHSS recipient task. The county reported, in
the 2007-2008 fiscal year, achieving compliance in 99% (351 of 355) of sampled cases for
State mandated In-Home Supportive Services (IHSS) according to the quality assurance
program, exceeding the target of 86%. According to County IHSS administrators the sample
is selected at random although the details of how that was conducted were not provided.
The goals for fiscal year 2008-2009 are stated as “Ensure 90% (estimate 315 of 350) of
sampled IHSS cases reviewed are in compliance with the State mandated IHSS quality
assurance program.” It seems odd that the county would adopt a performance metric that
was 9 percentage points lower than achieved in the previous year.33 County IHSS
administrators may want to consider opportunities for other performance metrics for the
IHSS program, particularly, quality metrics that reflect on the services provided to the
clients rather than restricting measure to internal processes.
The issue of objectives and measures is not inconsequential since the success of any
program reform that is implemented must have adequate measures for evaluation.
LATEST IHSS REFORM FROM CALIFORNIA LEGISLATURE According to the San Diego IHSS administrators, new legislation has either been approved
or “budget trailer legislation” is anticipated concerning the IHSS program. Thus, the
objective of the San Diego Supervisors’ IHSS reform initiative has been significantly
impacted by the State government. We present below our present understanding of the
new proposed State policy.37,38 Details of many of the items, including funding, are
presently unknown.

89
IHSS Program Reform Proposals:
• Independent provider orientation training and documentation of specific services
that can be delivered to the client receiving IHSS services.
• Face-to-face interviews for all independent providers.
Issues to consider:
o How would IHSS administration determine if the person is who they purport
to be?
o Couldn’t this interview be easily ‘gamed’ by a short rehearsal of the
interviewee prior to the interview?
o Added administrative cost which may or may not be cost-effective.
• Finger printing of clients receiving IHSS services and independent providers. Time
sheets will require finger prints of both clients receiving IHSS services and the
independent provider.
Issues to consider:
o Finger printing may deter fraudulent time sheet submissions because in the
event a recipient was in the hospital, some other facility, or deceased, the
provider would have to submit a fraudulent finger print of the recipient
which is more difficult than forging a signature.
o Finger printing would likely be best if both the recipient and provider are
required to provide the finger print:
o At initial application.
o On each time sheet.
o Finger printing of independent providers will not prevent independent
providers submitting fraudulent times sheet with someone else’s finger print.
Thus,
1. Fraud prevention tasks could be taken by IHSS administrators at
the time of the time sheet submission. The administrator could

90
check the finger print of the provider and recipient via computer
and verify the similarity of the finger print.
2. Electronic finger printing system that can match and detect the
appropriate finger print of provider and recipient during time
sheet processing.
3. Otherwise, the finger print would be only useful once the time
sheet was determined to be fraudulent (e.g., recipient in the
hospital or deceased) and used for prosecution.
o A finger printing system will add additional administrative cost to the
program. Would finger printing result in net cost saving?
o Alternative and or supplemental to such a finger print identification system,
would include hospitalization and death data to be linked to the CMIPS
database in order to identify a fraudulent time sheet (particularly #3).
o How would smudged or incomplete finger prints be processed by the IHSS
administrators processing time sheets?
o Time sheet would have to be redesigned.
o Additional administrative costs which may or may not be cost-effective.
• Background checks of all present and future independent providers. Includes all
independent providers whether or not in the Public Authority registry or not.
Issues to consider:
o It seems reasonable that recipients should have, even if they’re a relative, the
right to know the criminal background of the provider.
o It seems reasonable that persons convicted of fraud should be prohibited
from providing services in the IHSS program. However, is there evidence that
persons convicted of a crime other than fraud or elder abuse committing
IHSS fraud?
o What set of convictions would be applied?
o Is it ethical to deny a person convicted of a crime, other than fraud, a job after
he/she has paid the debt to society (e.g., DUI)?

91
o Is there anything inherently wrong with an ex-convict performing IHSS
services? If not, what employment is an ex-convict suited to perform?
o Additional administrative costs which may or may not be cost-effective.
• Time sheets will also include a notice of penalties for perjury.
• Checks for services will no longer be mailed to P.O. Boxes.
• Increase in unannounced visits.
Issues to consider:
o Random unannounced home visits.
o Unannounced home visits for suspected cases of fraud.
o Other surveillance of fraud suspects.
o San Diego County's Project 100% permits mandatory "walk through"
inspections of their homes by agents from the District Attorney's office
without a warrant for persons applying for public assistance.
o Additional administrative costs which may or may not be cost-effective.
• Funding for County level fraud prevention programs.
• Thirty-two new positions at the state level to address fraud, abuse, and program
integrity of the IHSS system.
• 46% cut to Public Authority budget. Elimination of Share of Cost buy-out by State
government. County IHSS administrators estimate about 80,000 present IHSS
persons state wide will be impacted. It looks like San Diego’s proportion would be
about 4,500 persons. These persons would have to pay for the cost of care the State
used to cover should they still desire IHSS services.
• Eligibility for the IHSS program will be restricted to functional impairment above
present levels (likely less than 2, on average for non SSI persons). County IHSS
administrators estimate about 4,000 persons will no longer be eligible for IHSS
services (of about 25,000 persons currently eligible).
• Specific hours for IHSS domestic services will be reduced by increasing the level of
function metric to 4. This will mean that a person who can physically perform the
task will no longer get IHSS assistance.

92
OTHER IHSS REFORM IDEAS
Elimination of the Residual Program
In 2004, elimination of the Residual program was proposed in an effort to provide cost
savings to the state budget. The net savings was reported to be $366 million. However, the
net savings calculations did not consider that many Residual Program recipients would
qualify for the IHSS PCSP and thus switch programs or seek institutionalization. The
California LAO report also was concerned with the costs associated with Olmstead-related
litigation.39
Elimination of the Health Benefits for Providers
Elimination of the health benefits for IHSS providers by the state could result in higher
costs to the state because some portion of IHSS providers could potentially enroll in
Medicaid and the state will lose the 17.5% IHSS financial contribution from the county. The
state is responsible for 49% of Medicaid coverage costs as compared to 31.5% of IHSS
health benefits costs.20 Obviously, if the state eliminated health benefits for IHSS providers,
the county could obtain those same costs savings. Furthermore, a portion of IHSS workers
would likely be enrolled in CALWORKS and food stamps that would offset the cost savings.
Cash & Counseling
Cash & Counseling is a national program initiated in 1995 by The Robert Wood Johnson
Foundation (RWJF) and the Office of the Assistant Secretary for Planning and Evaluation in
the United States Department of Health and Human Services (ASPE/DHHS).40 Cash and
Counseling is a consumer-directed approach to supportive services that enables consumers
to purchase individualized care rather than receiving it through an agency. The consumers
are given the flexibility to spend a cash allowance to hire their own providers or pay for
goods/materials that will improve quality of life.
Counseling: Consumers are also given counseling and fiscal assistance to help them manage
their cash allowance and responsibilities as employers. Consumers who are unable or
unwilling to manage their care themselves may designate a representative, such as a family

93
member, to help them or do it for them. Cash and Counseling requires consumers to
develop plans showing how they would use the allowance to meet their personal care
needs.
Mathematica Policy Research, Inc. made the following observations concerning Cash and
Counseling40:
• Cash and Counseling did not increase overall costs
• Across all three states, consumers were highly satisfied
• Most consumers hired family members or friends as independent providers
• Many consumers found the fiscal counseling helpful.
• There have been no major instances of fraud/abuse
• All three states have already decided that they want to make the program
permanently available to consumers
Issues to consider:
• Elimination of time sheets would significantly reduce administrative costs.
• Potential increase in fraud, although pilot study did not detect an increase in fraud.
• IHSS resources could be shifted to fraud deterrence and detection efforts.
• Potential reduction of administrative overhead costs.
Non-means tested tax-free payments
California and San Diego County are by no means alone in confronting cost pressures for
care of the elderly and disabled. Indeed, the problem is worldwide. For example, the
Department of Health (DoH) in the United Kingdom (UK) released a Green Paper,41
“Shaping the Future of Care Together,” on July 14, 2009. According to the DoH website,
“The Green Paper highlights the challenges faced by the current system and the need for
radical reform, to develop a National Care Service that is fair, simple and affordable for
everyone.” Currently, those with disabilities in the UK receive non-means tested tax-free
payments from the national government that they can spend as they see appropriate. One
alternative countenanced by the Green Paper is reallocation to means-tested social care

94
provision via local authorities. This proposal has led to widespread debate 42 & 43 where
many of the issues are the same as those faced by California and San Diego County such as
funding limits and the best mechanism for structuring benefits.
Assistive technologies
Assistive technologies (AT) such as wheelchairs, canes, walkers, and raised toilet seats may
be used to substitute for personal assistance in some instances. Hoenig, Taylor, and Sloan
found that among people with disability, those using assistive technology also used fewer
hours of personal assistance. 44 Agree, et al, reported that individuals with cognitive
impairment were less likely than others to substitute AT for personal assistance. AT must
be used judiciously but may provide a route to cost savings for some subpopulations.45
Time Sheets—recording actual times of service rather than hours, nearly unlimited time to
submit times sheets, linking hours of service to specific service tasks.
In order to receive payment for IHSS services, recipients and providers jointly sign and
return time cards to their counties for payment processing. The total number of service
hours that were provided each day of the pay period is required to be reported but not
actual times that were worked. This situation makes it difficult for county QA employees
and fraud investigators to determine whether those hours were actually provided. In
certain cases, fraud investigators may be aware, through case–monitoring efforts, that
hours have not been provided. However, this type of fraud can be very difficult to prove
because the provider can claim that he or she provided the services at times when the
investigator was not monitoring their activities.
The IHSS program time card covers a bi-monthly period; however, the present regulation
does not provide a time limit for providers to submit their time cards. As a result of this
policy, providers often submit all time sheets for processing at the end of the calendar year.
This means that counties are not able to monitor the use of IHSS hours on a regular basis.
Counties evaluate records of providers who are paid for delivering over 300 hours of
service each month (the equivalent of ten–hour days, seven days per week). Although
providers are allowed to work such a heavy schedule, it would be difficult for a provider to

95
actually work this many hours on an ongoing basis. The lack of any deadline for providers
to submit their time cards for payment undercuts these QA efforts. Providers who do not
submit their time cards until the end of the year are not detected in a timely manner and
often are able to avoid investigation. This is an example of fraudsters ‘gaming’ the IHSS
system.
To assist IHSS fraud investigators, increase program oversight, and hold providers
accountable for the services they provide, the LAO recommends requiring providers to
document on their time card the actual hours that they provide services and submit time
cards within one month of providing care.46
Issues to consider:
• Serves as a better record in the event of fraudulent activities during investigation as
well as prosecution.
• Develop a time sheet that can be scanned to rapidly record times of service
electronically and calculate the hours of service. Integrate scanning into CMIPS II—
the IHSS billing database.
• Surveillance of suspected fraud combined with the actual times service rather than
hours would provide greater evidence for fraud prosecution.
• What if clients/providers ‘gamed’ the system by recording service hours routinely
from midnight to 6 am and made verification of services more difficult (particularly
providers living in the same home as the recipient)?
• Additional administrative costs which may or may not be cost-effective.
• How would this deter fraud? Wouldn’t persons committing fraud simply “game” this
administrative process as well—list specific fraudulent service tasks.
• What will the IHSS administrators do with this additional information—match each
time sheet to the approved services?
• Is this fraud deterrence/detection or just more administrative activity?
• Additional administrative costs which may or may not be cost-effective.

96
Appeals
The Appeals form, NA 690, states:
“IF YOU REQUEST A STATE HEARING ANYTIME BEFORE THE EFFECTIVE DATE OF THE
COUNTY’S PROPOSED ACTION YOUR SERVICES MAY CONTINUE UNTIL THE HEARING. You
will not be liable for repayment of services monies received pending the hearing, even if
the result is a denial, provided your request is made in good faith.”
Presently clients are able to appeal reduced hours or elimination of all hours and continue
to receive payment based on the former rate during the appeals process which can take
several months—and even if the reduction of hours or termination of eligibility is
determined to be valid—the client keeps the “unauthorized” payment. This policy only
encourages frivolous appeals and spending of taxpayer money that isn’t justified as well as
needlessly increasing administrative costs and reducing monies for authorized persons.
Suggest change rules to appeals process—the reduced hours or elimination of all hours is
effective immediately. If the appeals process determines that the reduction of hours or
termination is invalid, then the client is reimbursed retroactively.
Cost savings—reduction of numbers of persons served and/or hours of service permitted.
Issues to consider:
• Decrease the income level for IHSS services.
• Increase the disability level for IHSS services.
• Make social judgment—deny or reduce IHSS service for self-induced disability (e.g.,
alcohol, drug and tobacco abuse, obesity.).
• Increase greater responsibility on family members who have the means to support
their disabled and elderly family members.
• Legal challenges to the reduction of services and additional legal costs. May or may
not be cost-effective.

97
Removal of $500 Fraud Cap.
Issues to consider:
• Would the added trivial fraud cases be cost-effective?
Independent providers billing more than 300 hours a month.
Issues to consider:
• Not necessarily evidence of fraud.
• Fraud “red or yellow flag” could trigger follow-up investigation.
Evaluation of Fraud Prevention Initiatives
One key to decision-making is to understand what you know and what you don’t know:
• All fraud measures are proxies of the true measures of fraud.
• There is no reliable baseline measure of fraud; therefore it will be difficult
(impossible?) to measure the success of any fraud prevention initiative.
Comprehensive and Integrated IHSS Reform.
Issues to consider:
• No one method of reform will likely be sufficient.
• Several methods of reform could be considered—but effectively integrated so the
whole is greater than the parts. This is very unlike the present discussions and
legislation presented today which addresses individual issues. For example, both
initial finger printing and finger printing on time sheets could be linked to
background checks as well as validation of the time sheets. The time sheet finger
printing validation could be done via a predefined sampling technique thus
improving the integrity of the IHSS program.

98
CONCLUSIONS In our two month experience with of the County IHSS program we observed that the
program seems to be well administered. IHSS staff is generally knowledgeable, but we
observed some variability in the understanding and communication of IHSS processes
between personnel.
The original goals and objectives of this project could not be fully realized because the data
sources, which are critical to objective analysis, could not be reconciled with County IHSS
reports. CMIPS data cases (total, PCSP, or combined program) could not be resolved with
the Management Statistics Summary. Fraud data is unorganized, difficult to report, and
lacks standard measures. Satisfaction data were unscientifically represented in County
reports.
We did not report on the subpopulations and trends since smaller populations would
augment the effects of missing data, particularly missing data of unknown origin and
makeup. This could lead to misunderstanding of subpopulations and trends in the
population and provide County IHSS administrators spurious ‘facts’ and thus adversely
influence their decision-making. In the future, and in the event the data and reporting issue
is resolved, the County is encouraged to take the opportunity to consider investigating the
subpopulations and trends of the IHSS population.
Thus, the single most important conclusion is that the connection between data and
reporting could not be resolved and that County reports cannot be independently
validated. This may be due to internal data collection issues, data storage issues, data
labeling issues, reporting methodology, data extraction problems, or a combination of
issues. At the present time we cannot verify the number of persons enrolled in the IHSS
program let alone any other measure. Unfortunately, and with regret, we cannot provide
more definitive quantitative analyses and provide clear statistical results.

99
From our investigation it appears there are several areas of opportunity for the County
IHSS program for consideration. As would be expected from our experience stated above,
much of the opportunity relates to the data and reporting:
• More aggressive and systematic quality checks with respect to data and reporting
including program membership, fraud, and financial reports. Much of this could be
coordinated with the CMIPS contractor, EDS.
• Once the data and reporting are coordinated and validated, generally use data and
reporting more efficiently. Link data to processes and generate meaningful reports
where the information can be of value in specific processes—process, data, training,
and reporting integration.
• Create a database, rather than an Excel spreadsheet, for recording fraud related
data. Set up validation data entry tools to improve quality and provide systematic
and periodic reporting.
• Implement scientific reporting of the present satisfaction report. Eliminate the
present ‘composite’ metric as it is scientifically invalid. Report on each and every
item in the survey and integrate in quality improvement and training programs.
• Improve and expand performance metrics for the IHSS program. For example, query
IHSS clients concerning the actual services provided by the Independent Provider,
thus establishing a direct metric relating to the mission of the IHSS program.
Establish an efficiency metric of the IHSS program. For example, quality of service
per dollar spent.
• Implement improved quality reviews of process mapping, SOPs, and other process
documentation.
• Consider a different vision for projects and initiatives. Leverage resources so a
project and initiative can benefit other related areas. Goals and objectives are
important but not necessarily at the exclusion of opportunity.
• Our report also provides many opportunities with respect to improving the IHSS
program both at the local and state level:

100
o Process Map Improvements
Resolve areas where connections are undefined
Better define and describe the terminals
Integrate process maps in training documentation
Fully implement CMIPS II and utilize this opportunity to make
changes to process maps
Publicly post process maps for training, reminders, and continual
quality improvement
o Aging and Independence Services County Call Center
Evaluate the efficiency and cost-effectiveness of maintaining the call
center while subcontracting tasks to San Diego 211
o Prevention and Detection of Fraud and Abuse
Integrate all aspects of fraud tracking into a single system
Better tracking of social worker referrals of fraud to PAFD
Improved performance measures
o Redesign of Reports
Create a formal database with standard data elements, data validation
controls, and systematic reporting
Label consistently
Define meaningful metrics

101
REFERENCES 1. California Health and Human Services Agency. “California Olmstead Plan” May 2003. 2. Department of Developmental Services. “A Consumer’s Guide to The Lanterman Act” June 2001. 3. http://www.law.cornell.edu/supct/html/98-536.ZS.html 4. http://economix.blogs.nytimes.com/2009/06/08/care-and-trembling-in-california 5. California State Association of Counties. 2002. In-Home Supportive Services: Counties at the
Crossroads. 6. http://www.lao.ca.gov/analysis_2002/health_ss/healthss_20_IHSS_anl02.htm#_Toc1355926 7. http://www.lao.ca.gov/analysis_2004/health_ss/hss_18_ihss_anl04.htm#_Toc64278331 8. Legislative Analyst’s Office. “Social Services Budget Background Materials”. October 26, 2006. 9. http://senweb03.senate.ca.gov/committee/standing/rules/publications/In_Home_Supportive_
Svcs_Report_03292009.pdf 10. Legislative Analyst’s Office. 2009. In-Home Supportive Services: Background and Caseload
Components. 11. http://www.lao.ca.gov/analysis_2009/ss/ss_anl09002.aspx 12. http://www.dss.cahwnet.gov/lettersnotices/entres/getinfo/acin05/pdf/I-64_05.pdf 13. http://www.chhs.ca.gov/initiatives/CAChildWelfareCouncil/Documents/MR_09-10-FINAL-
B.pdf 14. http://quickfacts.census.gov/qfd/states/06/06073.html 15. http://factfinder.census.gov/servlet/ADPTable?_bm=y&-geo_id=05000US06073&-
qr_name=ACS_2007_3YR_G00_DP3YR5&-ds_name=ACS_2007_3YR_G00_&-_lang=en&-_sse=on 16. http://pcwta.sdsu.edu/Documents/IHSSFINAL.pdf 17. Legislative Analyst’s Office. “Social Services Budget Background Materials”. October 26, 2006. 18. http://www.disabilityrightsca.org/pubs/547001-App-J.pdf 19. http://www.vpdca.org/eng/ihss.pdf 20. RTZ Associates, Inc. “The State of IHSS Health Benefits in California: A Survey of Counties” May
2005. 21. Legislative Analyst's Office, Major Milestones: 43 Years of Care and Treatment of the Mentally Ill
March 2, 2000. 22. Daly, Donna, Tucker-Tatlow, Jennifer, Gibson, Carrie. “In-Home Supportive Services:
Characteristics, Cost Drivers, and Cost Containment Strategies”. Southern Area Consortium of Human Services. June 2004.
23. Harwell, Kathy and Stammler, Egon. “In-Home Supportive Services: Descriptive Data, Costs and Cost-Containment Strategies/Alternative Programs” December 2004.
24. Donald W. Prange, Sr. Georgia Bastion, Michael Broderick, Russ Campbell, Robert Cervantes, Irene Cervantes, Richard Cochran, Robert Devoe, Ann Early, David Feldstein, Susan Husa, Patricia Gayman, Jerry Jaggers, Rosemary Kelley, Ramona Lavelle, Paul McAmis, James Monteton, Robert Segal, Robin Whiting. IHSS: For the Needy, Not the Greedy. March 23, 2009.
25. http://74.125.155.132/search?q=cache:GgrRRBwXB3sJ:www.sacgrandjury.org/reports/08-09/ihss-response.pdf+Sacramento+County+Grand+Jury+IHSS+fraud+2009&cd=1&hl=en&ct=clnk&gl=us
26. Office of Audits and Advisory Services. 2009. In-Home Support Services Program Audit. 27. http://www.camajorityreport.com/index.php?module=articles&func=display&ptid=9&aid=404
0 28. http://cssrc.us/web/14/publications.aspx?id=5900

102
29. http://crittercollectibles.com/blog2/2009/07/08/from-the-sun-governor-targeting-public-assistance-programs-for-fraud/
30. http://gov.ca.gov/speech/12687/ 31. http://www.signonsandiego.com/news/metro/20071126-1752-bn26welfare.html 32. http://www.journalofaccountancy.com/Issues/2001/Feb/WhyEmployeesCommitFraud 33. www.co.san-diego.ca.us/auditor/pdf/adoptedplan_08-10_csg.pdf 34. Tourangeau, R., Rips, L.J., Rasinski, K. 2000. The Psychology of Survey Response. Cambridge
Press. New York, New York. 35. Zawadski, R. & Hernandez, M. (2003). An analysis of Medicaid and IHSS services for the long
term care Medicaid population in San Francisco. Department of Aging and Adult Services, City and County of San Francisco.
36. pcwta.sdsu.edu/Documents/IHSSFINAL.pdf 37. www.aroundthecapitol.com/.../abx4_19_bill_20090724_amended_sen_v98.pdf 38. www.aroundthecapitol.com/.../abx4_19_bill_20090724_amended_sen_v98.pdf 39. Harwell, Kathy and Stammler, Egon. “In-Home Supportive Services: Descriptive Data, Costs and
Cost-Containment Strategies/Alternative Programs” December 2004. 40. IHSS Annual Report. Santa Clara, California, January 18, 2006. 41. http://www.dh.gov.uk/en/Publicationsandstatistics/Publications/PublicationsPolicyAndGuida
nce/DH_102338 42. http://www.benefitsandwork.co.uk/disability-living-allowance-(dla)/dla-aa-cuts 43. http://www.communitycare.co.uk/blogs/social-care-experts-blog/2009/07/adult-green-
paper-could-be-cat.html 44. Hoenig H, Taylor DH Jr, Sloan FA. Does assistive technology substitute for personal assistance
among the disabled elderly? Am J Public Health. 2003 Feb;93(2):330-7. 45. Agree EM, Freedman VA, Cornman JC, Wolf DA, Marcotte JE. Reconsidering substitution in long-
term care: when does assistive technology take the place of personal care? J Gerontol B Psychol Sci Soc Sci. 2005 Sep;60(5):S272-80.
46. http://www.lao.ca.gov/analysis_2009/ss/ss_anl09004003.aspx

103
APPENDIX A: CALIFORNIA IHSS REPORT COMPARISON (1 OF 4)
Item IHSS White Paper 2003
San Joaquin Report 2004
State Report 05/2005
San Diego County 2006
Santa Clara IHSS Report
01/2006 LOA 2006
California IHSS Report
10/2006
Counties All
Fresno, Kern, Kings, Madera, Mariposa,
Merced, San Joaquin, San Luis, Obispo,
Santa Barbara, Stanislaus, Tulare All
San Diego, Los Angeles, Orange,
Riverside, San Bernardino,
Imperial, Santa Barbara, Ventura All All
Objective of Report
Summarize studies of IHSS program in past; Describe present
state of IHSS program with
recommendations of facing
challenges; Discussion of future of the
IHSS Program
Descriptive Data, Costs and Cost-
Containment Strategies/Alternative
Programs
Survey of California IHSS Health Benefits; Negative impact
if withdrawn
Research and report on
following IHSS issues: 1) Program
characteristics, 2) Assessment process, 3)
Quality control issues, 4) Cost drivers, and 5) Cost control
strategies
IHSS Program & IHSS Public
Authority discussions about:
1) IHSS Plus Waiver Program, 2) Share of Cost
Changes; 3) Quality
Assurance/Quality Improvement, 4)
County Update, 5) Public Authority
Updates
Social Services Budget:
background, cost drivers,
and programs
Growth in Clients
286,953 through 58 California
counties
Growth% 2001-2004 & Total Participants
2004: Imperial (85%) 3,897; LA
(39) 136,001; Orange (28%)
10,336; Riverside (53%) 11,748; San Bernardino (60%) 14,762,
San Diego (31%) 19,611; Santa Barbara (31%) 2,270; Ventura
(26%) 2,679
11,500 IHSS recipients; 10,000
providers
(June 2006) 360,000 aged, 22,000 blind, and 844,000
disabled
Growth cost: Total
(from 2005-2007) $2,036,288,344 $145,717,825.76
FY 2005-2006 to 2006-2007: $70.4
million (5.6%) [$1.262 billion - $1.333 billion]
$542.40 (5.9%
increase)

104
Appendix A: California IHSS Report Comparison (2 of 4)
Item IHSS White
Paper San Joaquin Report 2004
State Report 05/2005
San Diego County 2006
Santa Clara IHSS Report
01/2006 LOA 2006
California IHSS Report
10/2006
Growth cost: Federal
Expenditures
$75,044,680 (Federal Financial
Participation is 51.5%)
Growth cost: State
Expenditures $45,172,526
(33.3%)
Growth cost: County
Expenditures
$0.88 billion in 1996-97 to $2.3 billion in 2002-03. Overall cost per authorized
case has increased 27% on a statewide level from FY 1996-97 to 98-99.: Change in
Consumer Type from
1996 to 1998: Aged (51.3-
48.8%), Disabled (44.9-47.5%), Blind
(no change 3.7%),
$25,500,620 (17.5%)
Cost Drivers: entitlement status
and caseload growth;
consumer-driven; mode of service
delivery; increased wages and benefits; and
variations in assessments
caseload, hours of service being
provided, and
provider wages

105
Appendix A: California IHSS Report Comparison (3 of 4)
Item IHSS White
Paper San Joaquin Report 2004
State Report 05/2005
San Diego County 2006
Santa Clara IHSS Report
01/2006 LOA 2006
California IHSS Report
10/2006
Demographic distribution:
Race
57% ethnic minorities, 44%
have primary language not
English
Whites (44%), Hispanics
(22%), Black (17%), Asian
(16%), American
Indian (1%)
(White, Black, Hispanic, Asian,
Other-in%) Imperial- 9, 1, 85, 5; LA- 30,
20, 20, 1, 20; Orange- 30, 5, 10, 38, 12;
Riverside- 40, 40, 15, 1, 5; San Bernardino- 40, 20, 30, 1, 9; San Diego- 40, 11, 29, 1, 19; Santa Barbara-
45, 5, 35, 5, 10; Ventura- 40, 5, 35, 1,
19
Demographic distribution:
Age
65 years or older (40%)
under 65 (60%)
65 years or older (59%), 18-54 (37%), 0-17 (4%)
County-Average Age: Imperial-70, LA-67,
Orange-67, Riverside-61, San
Bernardino-58, San Diego-63, Santa
Barbara-52
Language
English (57%), Other (42%) includes (in order of prevalence): Spanish, Armenian, Russian, Farsi, Vietnamese, Tagolag, Mandarin, Cambodian, Korean, Hmong
Types
Disabled (50%), Aged (47%), Blind (3%)
Severely Impaired/Aged: San Diego (19%/81%),
Los Angeles (19%/81%), Orange
(15%-85%), Riverside
(29%/79%), San Bernardino
(24%/76%), Imperial (20%/80%), Santa
Barbara (21%/79%), Ventura (26%/74%).
San Diego is the highest in IHSS Recipients on
MediCal who are SSI (92%)

106
Program
85% receive personal care services and 86% receive SSI benefits.
PCSP (approx. 74%) Residual (pprox.26%) San Diego
highest of all counties in% share of cost
(15%)
Fraud
CDSS and IHSS should create a fraud investigations
unit to keep the payroll system
honest
Up to 25% of authorized service
hours may be unnecessary or not actually provided; introduce a IHSS
Fraud Investigation Unit; reduce social worker to consumer
ratio
Quality Assurance Programs
CDSS with CDWA and
IHSS stakeholders should revise
the assessment tool in
monitoring the caregivers
State and county staffing
augmentations specifically for QA activities,
funding to establish an
ongoing State training
component for IHSS/PCSP workers, and funding for
specified systems changes tied to
QA and program integrity
improvements Appendix A: California IHSS Report Comparison (4of 4)
Item IHSS White
Paper San Joaquin Report 2004
State Report 05/2005
San Diego County 2006
Santa Clara IHSS Report
01/2006 LOA 2006
California IHSS Report
10/2006
Provider Details
Domestic Care Only (46%), Protective
Supervision (22%), Spouse
Providers (16%), Parent
Providers (14%),
Advance Pay (1%), Meal Allowance
(1%)
Individual Provider (88%) & Contact
Provider (12%) San Diego ranked third of three Southern Area counties with contact
providers

107
Provider Training Programs
specific-disease care, meeting special dietary needs, care for minor children,
and care for mental
impairments, CPR, First Aid,
lifting & transfer skills, personal care, nutrition,
stress management,
domestic services, universal
precautions, and mandated reporter
requirements
(IHSS Eligibility and Regulations, IHSS
Uniform Assessment Process, Other-in
Hours) Imperial- 20, 20 32; LA- 60, 8;
Orange- 40, 40 , 4; Riverside- 40, 8; San Bernardino- 40, 8, 3; San Diego- 14, 3, 5; Santa Barbara- 20, 4, 24; Ventura- 8, 4, 24
Assessment Training
Workgroup, State/County QA
Procedures Workgroup; The curriculum for
day one focused on
“Assessing Complex Needs”
while day 2 examined the
topic and practice of
“Authorizing Services.” Phase II scheduled for
2006
Provider Hourly Rate
$7.50/hr; up to $10.10
Imperial- $6.75; LA- $7.50; Orange-
$8.00; Riverside- $8.50; San
Bernardino- $8.00; San Diego- $8.50;
Santa Barbara- $8.00; Ventura-
$7.11 $11.50
$10.50 wage (plus $0.60/hr
towards healthcare benefits)
Provider Benefits
(Healthcare, Dental and/or Vision)
California state costs:
$75,044,680 53,846 covering (17%) Providers.
San Diego ranked 8th of 21
in total expenditures,
21st of 23 beneficiary
penetration rates across counties
surveyed & 38% eligible enrolled
providers in benefits & $215 provider co-pay
per month ranked 15th highest of
21 counties
Imperial- No; LA- Yes; Orange- Yes;
Riverside- Yes; San Bernardino- No; San Diego- Yes; Santa
Barbara- Yes; Ventura- No
Health, dental, and vision for working 35
hours/month for 2 contiguous
months. Growth 2004-2005: Health Plan
(26%), Dental & Vision (22%)

108
APPENDIX B: FRAUD PROCESS MAP

109
APPENDIX C: FRAUD DATA EXAMPLE
Group Total Cases Sum
06/23/04 RESCINDED PER IHSS 1
$ -
"PER SHIRLEY DOWNS, DO NOT PROCESS" 1
$ -
"REFERRED TO PROSECUTION / PAFD REPORT - DISMISSED TITUS, ISIAH / EDNA CHILDRES - CONVICTED" 1 $10,282.00
ALLEGATION UNFOUNDED 3 $ -
COLLECTION 2 $4,405.42
COLLECTIONS 76 $182,781.00
COLLECTIONS. PAID IN FULL 09/26/2006 1 $666.76
COLLECTONS - PER PAFD NEED TO REVISED TO INCLUDE ADDITONAL DATES 12/27/06 1 $1,210.50
CONVICTION REPORT 5/2008 - Conviction date 12-07 1 $2,168.74
CONVICTION REPORT 2008 (CONFIRMED 10/2008) PAID IN FULL 1 $12,490.20
EXPIRATION OF STATUTES 1 $41,828.20
FRAUD FOUND - NO $ IMPACT 1 $11,626.90
FRAUD REJECTED 1 $ -
INSUFFICIENT EVIDENCE 34 $135,208.00
N/A 2 $584.04
PAFD/IHSS REJECTED REFERRAL 1 $14,102.50
PAID $517.65 TO REVENUE & RECOVERY 1 $517.65
PAID AS OF 11/17/05 1 $522.89
PAID AS OF 12/08/04 1 $1,296.72
PAID IN FULL 1 $752.83
PAID IN FULL 01/06/08 1 $566.76

110
PAID IN FULL 04/11/05 1 $950.08
PAID IN FULL 05/10/07 1 $430.09
PENDING 81 $262,237.00
PER APPEAL-RESCIND 1 $1,530.72
PER APPEALS - RESCIND (02/09/07) 1 $3,548.59
PER APPEALS - RESCIND (11/02/04) 1 $1,805.40
PER APPEALS -RESCIND NOA 1 $67,052.60
PER APPEALS DECISION - RESCIND 2 $2,535.15
PER PAFD - RESCIND (02/02/06) 1 $1,116.90
PER PAFD -SUPERVISORY RESCIND (01/31/08) 1 $20,248.00
PER VICKIE - REFER TO QC REVIEW 1
$ -
REFERED COLLECTIONS 1 $14,738.70
REFERRAL FOR COLLECTION 1 $517.69
REFERRAL REJECTED 6 $9,555.55
REFERRAL REJECTED/PER MANAGER & SW 1
$ -
REFERRAL RETURNED 4 $11,879.80
REFERRAL RETURNED 1 $674.00
REFERRAL RETURNED/COLLECTION 2 $2,650.28
REFERRAL RETURNED/PAID IN FULL 1 $59.80
REFERRED FOR COLLECT 1 $5,570.76
REFERRED FOR COLLECTION 7 $52,325.40
REFERRED FOR COLLECTIONS 2 $2,241.88
REFERRED FOR COLLETION 1 $28,650.80
REFERRED FOR IHSS COLLECTION 1 $2,699.65
REFERRED FOR IHSS COLLECTIONS ONLY 1 $7,280.65
REFERRED TO COLLECTIONS 2 $5,223.00

111
REFERRED TO COLLECTIONS / PER REVENUE AND RECOVERY - PAID IN FULL 05/27/04 1 $525.47
REFERRED TO PROSECUTION 3 $46,669.80
REFERRED TO PROSECUTION (REVISED DATE (03/28/08) / PAFD REPORT - J. MARCUS CONVICTED - DUNCAN ALLEN PENDING 1 $7,798.67
REFERRED TO PROSECUTION / PAFD REPORT - PENDING 1 $4,616.88
REFERRED TO PROSECUTION / PAFD REPORT - REJECTED 1 $15,279.50
REFERRED TO PROSECUTION / PAFD REPORT - CONVICTED 6 $22,179.30
REFERRED TO PROSECUTION / PAFD REPORT - CONVICTED CLIENT & PROVIDER 1 $18,154.20

112
REFERRED TO PROSECUTION / PAFD REPORT - DISMISSED 3 $5,412.48
REFERRED TO PROSECUTION / PAFD REPORT - J. COLT - CONVIVTED P. LECHIEN DISMISSED 1 $6,897.97
REFERRED TO PROSECUTION / PAFD REPORT - PENDING 8 $117,628.00
REFERRED TO PROSECUTION / PAFD REPORT - REJECTED 7 $67,183.70
REFERRED TO PROSECUTION/CONVICTED MAKING PAYMENT 1 $7,829.02
REFERRED TO PROSECUTION/CONVICTED PAID IN FULL 1 $10,836.00
REFERRRAL RETURNED 1 $414.58
REJECTED 2 $14,718.60

113
REJECTED-RETURN TO IHSS/PARTIAL /PAYMENT 1 $1,827.53
REJECTED-RETURNED TO IHSS COLLECTIONS 1 $1,860.30
REJECTED-RETURNED TO IHSS 1 $407.67
REJECTED-RETURNED TO IHSS COLLECTIONS 1 $4,145.52
REJECTED - PER PAFD/SWS 1 $ -
REJECTED - RETURNED TO IHSS 1 $540.42
REJECTED - RETURNED TO IHSS COLLECTIONS 4 $20,015.40
REJECTED BY APPEAL 1 $ -
REJECTED FRAUD 1 $ -
REJECTED INSUFFICIENT EVDENCE 1
$ -
REJECTED/FOR COLLECTIONS 1 $1,940.00
RESCIND PER APPEALS 1 $7,110.14
RESCIND PER PAFD 2 $1,642.14

114
RESCIND PER PAFD - ALLEGATION UNFOUNDED 1 $771.88
RESCIND PER SUPERVISORY REVIEW 2 $26,368.50
RESCINDED FRAUD (09/26/07) - REJECTED 1 $5,886.16
RESCINDED PER APPEALS 3 $5,702.45
RETURNED TO IHSS 2 $796.02
RETURNED TO IHSS / COLLECTIONS 1 $800.63
RETURNED TO IHSS FOR COLLECTIONS 1 $2,145.57
RETURNED TO IHSS FOR COLLECTIONS M/PAYMENTS 1 $1,440.13
REVISED PER PAFD 1 $758.20
REVISED PER SUPERVISORY REVIEW 1 $150.45
SENENTENCING REPORT 2006 (FELONY) 1 $9,356.70

115
SENTENCING REPORT 2005 (MISDEMEANOR) 1 $1,984.75
SENTENCING REPORT 2005 (FELONY) 1 $20,272.70
SENTENCING REPORT 2005 (MISDEMEANOR) 3 $4,196.61
SENTENCING REPORT 2005 (MISEMEANOR) 1 $3,493.28
SENTENCING REPORT 2006 1 $1,157.00
SENTENCING REPORT 2006 (MISDEMEANOR) 1 $9,027.85
SENTENCING REPORT 2006 (CASE DISMISSED) 1 $907.15
SENTENCING REPORT 2006 (FELONY) 2 $9,603.05
SENTENCING REPORT 2006 (MISDEMEANOR) 8 $72,842.70

116
SENTENCING REPORT AUG. 2006 (FELONY) 1 $4,489.47
SENTENCING REPORT AUG. 2006 (MISDEMEANOR) 1 $3,616.12

117
APPENDIX D: COMPLETE IHSS PROCESS MAP
http://www.cobbwebassociates.com
This document was prepared by Cobbweb Associates, a registered veteran owned independent healthcare research small business.
Member: American Society for Quality (ASQ)
Herb Cobb, PhD. MA, CSSBB
Harry Parker Wetzler, MD, MSPH
& Jay Lee
Cobbweb Associates
P.O. Box 99044
San Diego, CA 92169
858.531.8855