SAN ANDRES FORMATION RESIDUAL OIL ZONES AND...
45
SAN ANDRES FORMATION RESIDUAL OIL ZONES AND THEIR RELATIONSHIP TO THE HORIZONTAL CARBONATE PLAY ON THE NORTHERN SHELF L. Stephen Melzer, Melzer Consulting SIPES # 1081 and Dr. Robert Trentham, UTPB and with invaluable contributions from David Vance, Arcadis April 20, 2016
Transcript of SAN ANDRES FORMATION RESIDUAL OIL ZONES AND...

SAN ANDRES FORMATION RESIDUAL OIL ZONES
AND THEIR RELATIONSHIP TO THE HORIZONTAL
CARBONATE PLAY ON THE NORTHERN SHELF
L. Stephen Melzer, Melzer Consulting
SIPES # 1081
and Dr. Robert Trentham, UTPB
and with invaluable contributions from
David Vance, Arcadis
April 20, 2016

2
Abstract
The new understanding of the origins of residual oil zones (ROZs) is providing insights as to the explanation for the growing number of commercial horizontal well exploitation projects in the San Andres formation of the northern shelf area in the Permian Basin. The case will be made that what started out as a tight carbonate play, using production concepts analogous to the shale plays, has morphed into a ‘greenfield’ ROZ play at considerable distances away from the San Andres fields and in places where the landscape has been dotted with dry or disappointing vertical wells over the course of 60 years.
To understand the targeted reservoir requires a study of the processes involved in the natural sweep (lateral water flood) of a huge paleo oil entrapment in the San Andres formation. The ROZ related studies began as an attempt to explain the abnormal thicknesses and properties of intervals of residual oil beneath main pay zones (MPZs) as in the Seminole and Wasson fields. The studies have now evolved to include the understanding that these residual oil resources exist in large fairways and can be made commercially attractive targets. It was first believed that enhanced oil recovery methods would be required to liberate the oil. And, to that end, several successful projects are underway in the Permian Basin proving the concept of using CO2 as the injectant to enliven and displace the oil via miscible flooding techniques. But more recently, the concept of depressuring the upper ROZ intervals has been introduced, is proving commercial at surprisingly low oil prices, and is offering insights into a process of recovery of immobile oil only conjectured in the past.
What is required for producing residual oil via depressuring are the technologies and commercial developments involved in horizontal drilling and completion methods. The same revolution that occurred in the unconventional shales is being extended into carbonates and into more conventional reservoirs with no mobile oil. An analogous process has been called dewatering in Oklahoma (e.g., Hunton, Mississippian Lime) but is called depressuring here in Texas. The play’s linkage to the ROZ studies in the San Andres formation has occurred and, for that reason, is being dubbed “Depressuring the Upper ROZ” or DUROZ.
The author suspects that the Oklahona plays were most generally categorized as producing the large volumes of water that freed up the mobile oil to move. Others believed the mobile oil existed in isolated reservoir compartments and that the horizontals intersected enough compartments to make the contacted rock volume commercial. Still others believed both mobile oil and water coexisted in the pore space but that the water moves first by the relative permeability nature of the two fluids. This latter concept can be reframed to the scientific principles involved with reservoir fluid depressuring and that solution gas expansion allows the hydrocarbons to expand in the pore and effectively liberate a portion of the oil and most of the gas. We believe that this scientific formulation, (as contrasted to the mathematical ‘rel perm’ one), forms the basis for explaining how gassy residual oil can be liberated.
Both the EOR and DUROZ projects currently underway and producing residual oil will be presented.

San Andres ROZs
• The Horizontal San Andres Play
• What Kind of a Play is it?
• ROZ Science – Some “New” Processes at
Work
• Two Ways to Exploit Residual Oil: Case
Histories
3

W. Yoakum San Andres Horizontal Wells(as of Jan ’16)
34599
Yoakum
Cochran
Lea
Gaines
Brahaney
Field

Oil Cumulatives of the First Wells in the N Shelf Play
5
0
10,000
20,000
30,000
40,000
50,000
60,000
70,000
1 2 3 4 5 6 7 8 9 10 11 12 13 14
Cu
m O
il P
rod
uct
ion
(b
o)
Months from 1st Oil
One Well Lease Depressuring (DUROZ) Horizontal Wells
Winbert What a Melon 1HBroken Spoke Clawater 2HHamilton 1H Higginbotham 5HGibson 1H What a Melon 4H

The ‘Players’
• NW Shelf
– Manzano, Walsh, Riley, Apache, ER Operating,
Henry, Silver Creek, Stewart, Element, Wishbone
• Andrews County
– Forge, Pacesetter

The ‘Big Five’ Operators*
Company bopd Mcfpd # Wells
Forge 3840 2385 71
Manzano 3070 3100 14
Walsh 2150 275 18
Riley 250 840 4
Pacesetter 510 220 7
TOTALS 9820 6820 114
* Stats as of Jan ‘16

0
20
40
60
80
100
120
0
2,000
4,000
6,000
8,000
10,000
12,000
May-1
0
Aug-1
0
Nov-1
0
Feb-1
1
May-1
1
Aug-1
1
Nov-1
1
Feb-1
2
May-1
2
Aug-1
2
Nov-1
2
Feb-1
3
May-1
3
Aug-1
3
Nov-1
3
Feb-1
4
May-1
4
Aug-1
4
Nov-1
4
Fe
b-1
5
May-1
5
Aug-1
5
Nov-1
5
Feb-1
6
Nu
mb
er
Acti
ve H
or
Well
s
Dail
y O
il &
Gas P
rod
ucti
on
-b
op
d,M
cfp
d
Mo-Yr
Growth in Production from San Andres Horizontal Wells
Oil-BPD
Gas Mcfpd
# Wells(Rt Scale)
Andrews and Yoakum Counties

What is this Play All About?
Is it Just the Carbonate Equivalent to the
Shales or Something Else?

10
The Next Few Slides May Test Your Imagination

11

The “Camps”
1. Compartmentalized Pods of Mobile Oil
(Main Payzones)
2. Tight Oil – Some Mobile Oil but
Low Perm Rocks
3. Depressuring a Residual Oil Zone
(Relative Permeability)
12
Which Camp are you in?

The ‘Mobile Oil Compartments’ Camp
• Everybody knows carbonates are badly
compartmentalized
• A horizontal well is perfectly suited for
connecting those compartments
• For Play success, we:
– Will need to mildly stimulate but in selective intervals
– Will see oil come quick with minimal water
– Do not need a gassy oil

The ‘Tight Oil’ Camp
• If we can get oil out of shales, why not out of
tight carbonates?
• For Play success, we:
– Need to find thick zones with same kind of shows
as the shales
– Need to fracture treat like the shales
– Will see the oil come right away
– Will see the oil and water deplete pretty rapidly

The ‘ROZ’ Camp
• All the Oil is Immobile!
• As Water is Removed and the Reservoir is
Depressured, the Gas in the Oil Expands and the Oil
and Gas Occupy Greater %age of the Pore Space
• Some of the Oil Becomes Mobile and Moves into the
Flowstream
• Water Dominates all the Production for a Period of Time
until the Pressures Fall Past a Threshold Level
• Works Best with a Gassy Oil & Oil- or Mixed-Wet Rocks
• Can be Modeled with Relative Permeability Curves

A Frame of ReferenceFractional (Water) Flow as a Function of Oil/Water Saturation
16
All Water
All Oil
No oil Moves if Oil
Saturation less
than this (30%)

150 Years of Looking for These Reservoirs!

Our Industry Has Moved Beyond the
“Conventional” Into Two “New” Camps
Camp #1 Camp #2 Camp #3

Fractional (Water) Flow as a Function of Oil/Water Saturation
19
All Water
All Oil
Really? Camp #3?
So what can cause the oil to start moving?
No oil Moves if Oil
Saturation less
than this (30%)

Depressuring Production Mechanics
Rock
Pore
Space
Pi = 2000 psi (in-situ)
Oil
Water
Pi = 2000 psi (in-situ)
The pore
Fluids
Oil
Water
Pn = 1000 psi (in-situ)
De-pressured
State

Fractional (Water) Flow as a Function of Oil/Water Saturation
21
All Water
All Oil
Oil now moves with
the water Since it
exceeds the critical
volume (30%)
Oil Begins to move as the Oil Volume Grows

Cautionary Note:
That Fractional Flow Curve was Idealized!
The Critical (“Irreducible”) Sor Value can Vary Due to
Variable Reservoir and Fluid Properties
In Other Words, Water Flooding Can Leave Behind a Lot
of Oil in the Swept Zone and the Sorw Values Left Will
be a Function of the Reservoir and Oil Properties
It is that Sorw that we are Targeting and, if it was Mother
Nature’s Water flood, the Oil has Never Been
Depressured
22

Back to this Slide
“The ROZ Camp”
• All the Oil is Immobile
• As Water is Removed and the Reservoir
Depressured, the Gas in the Oil Expands and the Oil
and Gas Occupy Greater %age of the Pore Space
• Some of the Oil becomes Mobile and Moves into the
Flowstream
• Water Dominates all the Production for a Period of
Time until the Pressures fall Past a Threshold Level
• Works Best in Gassy, Oil- or Mixed-Wet Rocks
• Can be Modeled with Relative Permeability Curves

Case History: Water Cut vs. Time
* North Shelf Discovery Well (Lea Co.)
Broken Spoke 2 State Case History*
0.0%
10.0%
20.0%
30.0%
40.0%
50.0%
60.0%
70.0%
80.0%
90.0%
100.0%
Mar
-14
Apr
-14
May
-14
Jun-
14
Jul-
14
Aug
-14
Sep-
14
Oct
-14
Nov
-14
Dec
-14
Jan-
15
Feb-
15
Mar
-15
Apr
-15
May
-15
Jun-
15
Jul-
15
Aug
-15
Sep-
15
Oct
-15
Nov
-15
Dec
-15
Mo-Yr
Cru
de
Oil
Cu
t in
Pe
rce
nt
Oil Cut - %

DUROZ WELLS: YOAKUM CO., TX
Well1 What A Melon 1H 1745 1225 1 mile 393 26 166
2 Well #2 2120 1315 1 mile 378 31 202
3 Well #3 1700 1270 1 mile 195 6 203
4 Well #4 1975 1090 1.5 mile 170 32 313
5 Well #5 2030 1200 1 mile 151 22 126
6 Well #6 2225 1150 1 mile 122 32 243
7 Well #7 2053 1260 1 mile 83 25 228
8 Well #8 2110 1635 1 mile 42 30 142
9 Well #9 1820 No Oil Cut Yet 1.5 mile 20
10 Well #10 2040 No Oil Cut Yet 1.5 mile 20
11 Well #11 1750 No Oil Cut Yet 1 mile 1
Days Until
First
Production
Ave BOPD
since 1st
Oil
Initial
Intake
Pressure
First Oil Cut Intake
Pressure
Lateral
Length Day
DUROZ Case Histories
Pressure Characteristics
Note Also the Trend to Longer Laterals – Some 2-mile Laterals now

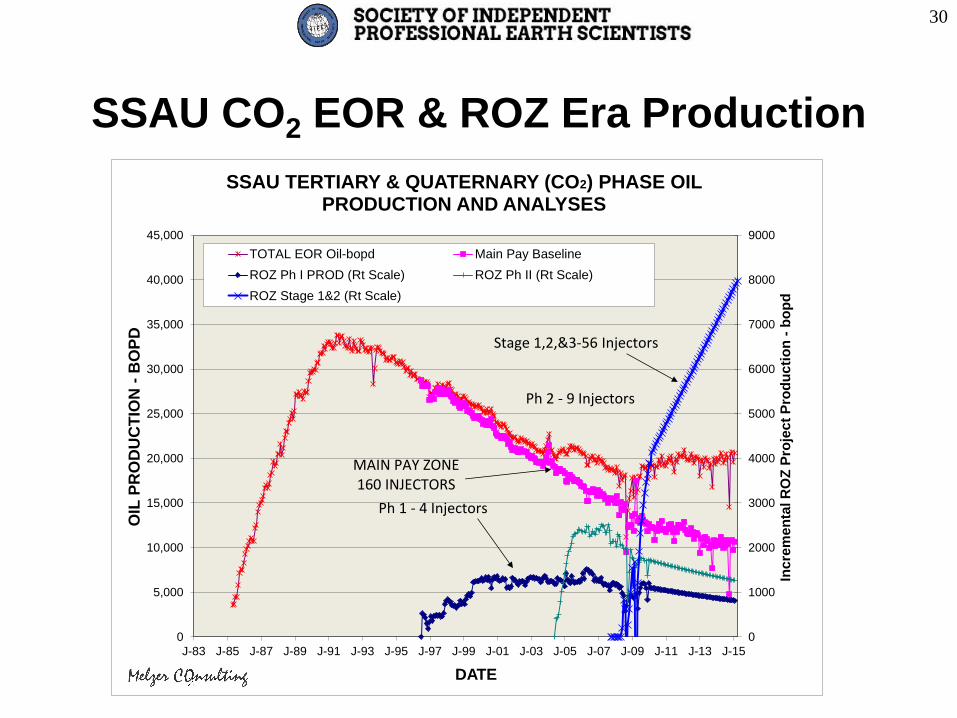
ROZs and EOR
A Progress Update

Horizontal
Depressuring
GEORGE ALLEN
Peripheral
Greenfield CO2 Flood
TALL COTTON
Greenfield
CO2 Flood
SEMINOLE
Brownfield
ROZ CO2 Flood
Lea County, NM
27

SSAU FIELD HISTORY
28
The ROZ Phase

Original & Post Waterflood Seminole Field Saturation Profile
29
SSAU CO2 EOR & ROZ Era Production
30
0
1000
2000
3000
4000
5000
6000
7000
8000
9000
0
5,000
10,000
15,000
20,000
25,000
30,000
35,000
40,000
45,000
J-83 J-85 J-87 J-89 J-91 J-93 J-95 J-97 J-99 J-01 J-03 J-05 J-07 J-09 J-11 J-13 J-15
Incre
men
tal R
OZ
Pro
ject
Pro
du
cti
on
-b
op
d
OIL
PR
OD
UC
TIO
N -
BO
PD
DATE
SSAU TERTIARY & QUATERNARY (CO2) PHASE OIL PRODUCTION AND ANALYSES
TOTAL EOR Oil-bopd Main Pay Baseline
ROZ Ph I PROD (Rt Scale) ROZ Ph II (Rt Scale)
ROZ Stage 1&2 (Rt Scale)
Ph 1 - 4 Injectors
Ph 2 - 9 Injectors
Stage 1,2,&3-56 Injectors
MAIN PAY ZONE160 INJECTORS


PB ROZ Research
Forming a ROZ
Greenfields and Fairways
32

Within a Hydrocarbon Basin
• First Stage
– Deposition and Burial
– Generation of Hydrocarbons, Expulsion
of Some Oil/Gas from the Source Rock
– Migration to a Trap
• Second Stage
– Moving Oil and Water Around within a Trap
(Mother Nature’s Waterflood)
• And Sometimes….third…fourth Stages
Is this all that
happens in a
Basin?

Types of Second Stage Adjustments
1. Basin-wide Tilt
2. Basement Readjustments and/or
‘Leaky Seals’
3. Asymmetric Uplift and Lateral Sweep
– Reservoir Outcrop and Meteoric Derived
Water Sweep (aka Lateral Sweep)
– Salt Diapirs

Source Waters
for Lateral
Sweep

San Andres Greenfield ROZ
Assessment Study
Kinder
Morgan’s
Tall Cotton
Project

Greenfield
ROZ
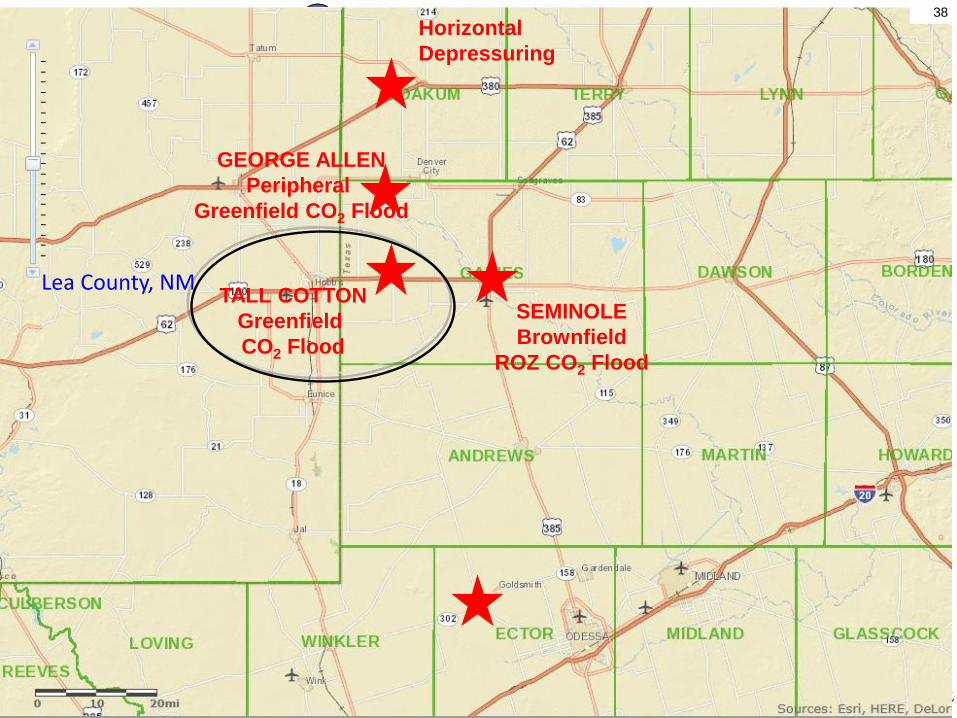
Horizontal
Depressuring
GEORGE ALLEN
Peripheral
Greenfield CO2 Flood
TALL COTTON
Greenfield
CO2 Flood
SEMINOLE
Brownfield
ROZ CO2 Flood
Lea County, NM
38
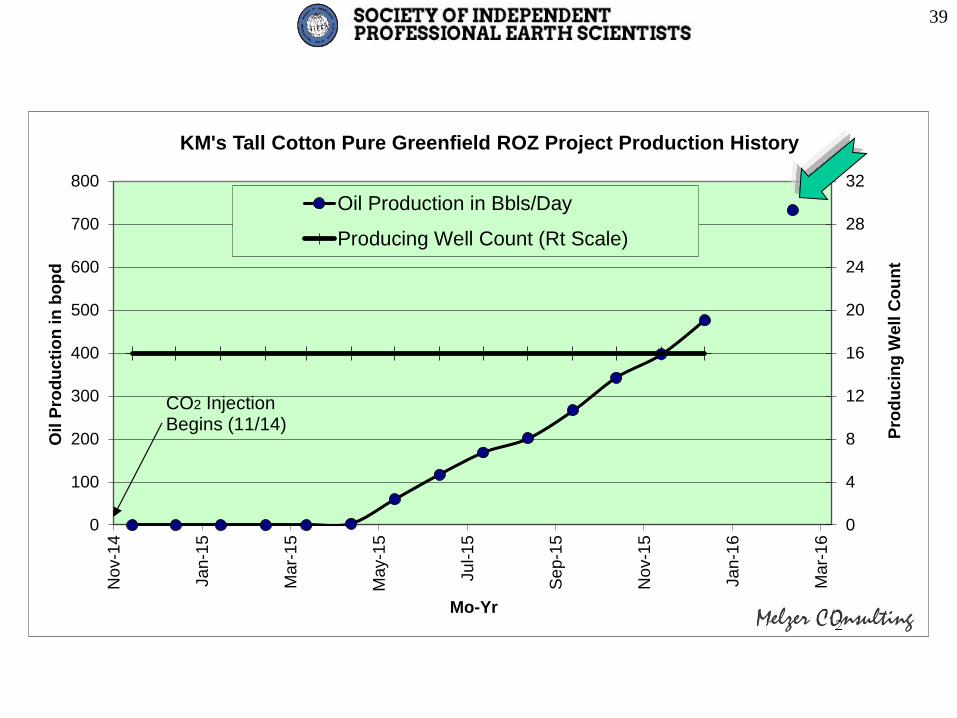
Tall Cotton Production
39
0
4
8
12
16
20
24
28
32
0
100
200
300
400
500
600
700
800
No
v-1
4
Ja
n-1
5
Mar-
15
May-1
5
Ju
l-1
5
Sep-1
5
No
v-1
5
Ja
n-1
6
Mar-
16
Pro
du
cin
g W
ell C
ou
nt
Oil
Pro
du
cti
on
in
bo
pd
Mo-Yr
KM's Tall Cotton Pure Greenfield ROZ Project Production History
Oil Production in Bbls/Day
Producing Well Count (Rt Scale)
CO2 Injection Begins (11/14)

Back to the Horizontals
40

The Upper Bow
41

W. Yoakum San Andres Horizontal Wells(as of Nov ’15)
34599
A
36127
36191
31933
A’
Yoakum
Cochran
Lea
Gaines

Manzano-Walsh Cross Section A-A’ (N-S)
-1500 msl
-1600 msl

San Andres Horizontals and the
“Camps”
44
Pods Tite Res ROZ
Prod Characteristic Camp 1 Camp 2 Camp 3 .
Offset Wells A new Variable Consistent
Ball Game Results
Onset of Oil Immediate Quick Delayed
Need for Gassy Oil No Yes Yes
Requires Dolomites No No Yes
Requires Sour Oil No No Yes
Resource* Play No No Yes
* My Definition – not SPEE’s

Thankyou
SAN ANDRES FORMATION RESIDUAL OIL ZONES
AND THEIR RELATIONSHIP TO THE HORIZONTAL
CARBONATE PLAY ON THE NORTHERN SHELF
L. Stephen Melzer
SIPES # 1081
April 20, 2016