Sampson Lecture 4 - Abbe School of Photonics
47
Lecture 4: Optical elastography Prospects in medicine for micro-imaging of tissue mechanical properties David Sampson Optical + Biomedical Engineering Laboratory School of Electrical, Electronic and Computer Engineering, & Centre for Microscopy, Characterisation & Analysis The University of Western Australia
Transcript of Sampson Lecture 4 - Abbe School of Photonics
Lecture 4: Optical elastography Prospects in medicine for micro-imaging
of tissue mechanical properties David Sampson
Optical + Biomedical Engineering Laboratory School of Electrical, Electronic and Computer Engineering,
& Centre for Microscopy, Characterisation & Analysis
The University of Western Australia

Abbe School of Photonics, 18 June 2013
Sampson, Optical elastography
Roadmap for what OBEL does • Medical microscopy
Optical coherence tomography
• What you can do on the surface “Atlas” studies: lymph nodes, parametric methods: attenuation, PS-OCT, lymph nodes, burns vasculature
• What you can do with catheters Human upper and lower airways
• What you can do with needles Needle design, OCT+fluorescence multimodality, animal airways, tumour margins: breast cancer
• Elastography – alternative contrast Emerging methods, phantoms, modelling, breast cancer

Abbe School of Photonics, 18 June 2013
Sampson, Optical elastography
• Elastography background Using tissue elasticity for diagnosis
• Optical elastography principles Optical system and mechanical property estimation
• Towards clinical application Cancer: preliminary results
Roadmap for optical elastography short course
• Mechanical properties of tissue Influence of materials and structure
• Towards accurate mechanical properties Elastogram artefacts
modality for screening the breasts of Chinesewoman. Most Chinese women have relativelysmall, dense breasts,4 and the median age ofthese patients with breast cancer is 47 years,which is 8 years younger than in Westernwomen,19 which limits the use of mammogra-phy. Bird et al20 stated that breast cancer wasless likely to be detected by mammography in
women with dense breasts and in womenyounger than 50 years. One of the various fac-tors leading to false-negative findings on mam-mography is the effect of breast density.5
Furthermore, breast density on mammographyis also associated with an increased risk ofbreast cancer.21 Meanwhile, dense glandulartissue usually has a hyperechoic appearanceon sonography, and mostly breast cancers arehypoechoic; carcinomas in this setting are eas-ily detected on sonography. In our study, wefound that UE was better than sonography fordetecting breast cancer in Chinese patients.Compared with mammography, the specificityof UE was higher, but there was no significantdifference between the sensitivity, accuracy,and positive and negative predictive values ofUE and mammography. However, mammogra-phy uses ionizing radiation, which itself is apotential carcinogen,22 and this limits the ageand frequency with which it can be used.23
Conversely, there is no such risk to patientswhen using UE. In addition, UE and sonogra-phy are much less expensive than mammogra-phy in China.
There is an overlap of the elasticity betweenbenign and malignant lesions in the breast,13
which limits the use of UE. In our study, 26 of87 cancers were missed by UE. Most false-neg-ative findings on UE were found in early stagesof invasive ductal carcinoma, which were all instages 1 and 2, and in noninvasive carcinoma,and some invasive soft tissue carcinomas suchas cystosarcoma phyllodes6 had large centralnecrosis (the lesions with large central necrosisall had false-negative findings). Consequently,large-scale necrosis may impair the diagnosticassessment in UE.15 Nine of 209 benign lesionswere misdiagnosed by UE. That rate was muchlower than those for mammography andsonography, which would decrease unneces-sary biopsies considerably. Among the false-positive diagnoses, 3 had calcifications, whichmight affect the diagnosis on UE, and 1 had adotted remote hemorrhage that had alreadybeen organized, which may have increased thehardness of the lesion. Therefore, when usingUE, one should pay attention to all the factorsthat would affect the stiffness of lesions andcause misleading results.
J Ultrasound Med 2007; 26:807–815 813
Zhi et al
B
A
Figure 4. Invasive ductal carcinoma in a 55-year-old woman. A, Mammogram showing several masses suspected to bebenign lesions. B, Right, Sonographic image. A hypoechoic masswith a round shape was suspected to be a benign lesion. Left,Ultrasound elastographic image. Both the entire hypoechoiclesion and its surrounding area were blue. The blue area on UEwas larger than the lesion area on sonography. It was scored 5and was diagnosed as a malignant lesion.
26.6.jum.online.q 5/16/07 2:15 PM Page 813
Sampson, Optical elastography

Abbe School of Photonics, 18 June 2013
Sampson, Optical elastography
• Elastography background Using tissue elasticity for diagnosis
• Optical elastography principles Optical system and mechanical property estimation
• Towards clinical application Cancer: preliminary results
Roadmap for optical elastography short course
• Mechanical properties of tissue Influence of materials and structure
• Towards accurate mechanical properties Elastogram artefacts
modality for screening the breasts of Chinesewoman. Most Chinese women have relativelysmall, dense breasts,4 and the median age ofthese patients with breast cancer is 47 years,which is 8 years younger than in Westernwomen,19 which limits the use of mammogra-phy. Bird et al20 stated that breast cancer wasless likely to be detected by mammography in
women with dense breasts and in womenyounger than 50 years. One of the various fac-tors leading to false-negative findings on mam-mography is the effect of breast density.5
Furthermore, breast density on mammographyis also associated with an increased risk ofbreast cancer.21 Meanwhile, dense glandulartissue usually has a hyperechoic appearanceon sonography, and mostly breast cancers arehypoechoic; carcinomas in this setting are eas-ily detected on sonography. In our study, wefound that UE was better than sonography fordetecting breast cancer in Chinese patients.Compared with mammography, the specificityof UE was higher, but there was no significantdifference between the sensitivity, accuracy,and positive and negative predictive values ofUE and mammography. However, mammogra-phy uses ionizing radiation, which itself is apotential carcinogen,22 and this limits the ageand frequency with which it can be used.23
Conversely, there is no such risk to patientswhen using UE. In addition, UE and sonogra-phy are much less expensive than mammogra-phy in China.
There is an overlap of the elasticity betweenbenign and malignant lesions in the breast,13
which limits the use of UE. In our study, 26 of87 cancers were missed by UE. Most false-neg-ative findings on UE were found in early stagesof invasive ductal carcinoma, which were all instages 1 and 2, and in noninvasive carcinoma,and some invasive soft tissue carcinomas suchas cystosarcoma phyllodes6 had large centralnecrosis (the lesions with large central necrosisall had false-negative findings). Consequently,large-scale necrosis may impair the diagnosticassessment in UE.15 Nine of 209 benign lesionswere misdiagnosed by UE. That rate was muchlower than those for mammography andsonography, which would decrease unneces-sary biopsies considerably. Among the false-positive diagnoses, 3 had calcifications, whichmight affect the diagnosis on UE, and 1 had adotted remote hemorrhage that had alreadybeen organized, which may have increased thehardness of the lesion. Therefore, when usingUE, one should pay attention to all the factorsthat would affect the stiffness of lesions andcause misleading results.
J Ultrasound Med 2007; 26:807–815 813
Zhi et al
B
A
Figure 4. Invasive ductal carcinoma in a 55-year-old woman. A, Mammogram showing several masses suspected to bebenign lesions. B, Right, Sonographic image. A hypoechoic masswith a round shape was suspected to be a benign lesion. Left,Ultrasound elastographic image. Both the entire hypoechoiclesion and its surrounding area were blue. The blue area on UEwas larger than the lesion area on sonography. It was scored 5and was diagnosed as a malignant lesion.
26.6.jum.online.q 5/16/07 2:15 PM Page 813

Abbe School of Photonics, 18 June 2013
Sampson, Optical elastography
• Elastography – imaging of tissue mechanical properties
• Based on imaging modality – Ultrasound or MRI or…
• For high resolution – use optics
Ultrasound elastogram
Elastography
Optical coherence elastogram
modality for screening the breasts of Chinesewoman. Most Chinese women have relativelysmall, dense breasts,4 and the median age ofthese patients with breast cancer is 47 years,which is 8 years younger than in Westernwomen,19 which limits the use of mammogra-phy. Bird et al20 stated that breast cancer wasless likely to be detected by mammography in
women with dense breasts and in womenyounger than 50 years. One of the various fac-tors leading to false-negative findings on mam-mography is the effect of breast density.5
Furthermore, breast density on mammographyis also associated with an increased risk ofbreast cancer.21 Meanwhile, dense glandulartissue usually has a hyperechoic appearanceon sonography, and mostly breast cancers arehypoechoic; carcinomas in this setting are eas-ily detected on sonography. In our study, wefound that UE was better than sonography fordetecting breast cancer in Chinese patients.Compared with mammography, the specificityof UE was higher, but there was no significantdifference between the sensitivity, accuracy,and positive and negative predictive values ofUE and mammography. However, mammogra-phy uses ionizing radiation, which itself is apotential carcinogen,22 and this limits the ageand frequency with which it can be used.23
Conversely, there is no such risk to patientswhen using UE. In addition, UE and sonogra-phy are much less expensive than mammogra-phy in China.
There is an overlap of the elasticity betweenbenign and malignant lesions in the breast,13
which limits the use of UE. In our study, 26 of87 cancers were missed by UE. Most false-neg-ative findings on UE were found in early stagesof invasive ductal carcinoma, which were all instages 1 and 2, and in noninvasive carcinoma,and some invasive soft tissue carcinomas suchas cystosarcoma phyllodes6 had large centralnecrosis (the lesions with large central necrosisall had false-negative findings). Consequently,large-scale necrosis may impair the diagnosticassessment in UE.15 Nine of 209 benign lesionswere misdiagnosed by UE. That rate was muchlower than those for mammography andsonography, which would decrease unneces-sary biopsies considerably. Among the false-positive diagnoses, 3 had calcifications, whichmight affect the diagnosis on UE, and 1 had adotted remote hemorrhage that had alreadybeen organized, which may have increased thehardness of the lesion. Therefore, when usingUE, one should pay attention to all the factorsthat would affect the stiffness of lesions andcause misleading results.
J Ultrasound Med 2007; 26:807–815 813
Zhi et al
B
A
Figure 4. Invasive ductal carcinoma in a 55-year-old woman. A, Mammogram showing several masses suspected to bebenign lesions. B, Right, Sonographic image. A hypoechoic masswith a round shape was suspected to be a benign lesion. Left,Ultrasound elastographic image. Both the entire hypoechoiclesion and its surrounding area were blue. The blue area on UEwas larger than the lesion area on sonography. It was scored 5and was diagnosed as a malignant lesion.
26.6.jum.online.q 5/16/07 2:15 PM Page 813
10 mm J Ultrasound Med, 26: 807, 2007
1 mm
Elastogram Ultrasound
Elastogram OCT

Abbe School of Photonics, 18 June 2013
Sampson, Optical elastography
Why is tissue elasticity important?
Diagnosis Injury mechanics Palpation Elastography Prosthetics
Treatment
Nanobiomechanics
Cell mechanics
Disease pathophysiology
1 nm 1 µm 1 mm 1 m Scale
Tissue development Optical elastography
Histology OCT OCE
Diagnosis Disease pathophysiology

Abbe School of Photonics, 18 June 2013
Sampson, Optical elastography
– Elastic modulus: describes resistance to axial deformation – This is the “stiffness” sensed by palpation
T.R. Cox and J.T. Erler, Disease Models and Mechanisms, 2011
What elastic property do we care about for tissue?

Abbe School of Photonics, 18 June 2013
Sampson, Optical elastography
Diagnosis using elasticity • Disease changes tissue elasticity
• Palpation: Used for centuries – low resolution, not depth resolved, highly subjective
• Elasticity can vary by up to four orders of magnitude1
2. T. A. Krouskop et al., “Elastic moduli of breast and prostate tissues under compression,” Ultrason. Imaging 20(4), 260–274 (1998)
Compression test on 142 breast tissue samples2
38 fat 31 glandular tissue 18 fibrous tissue 23 intraductal carcinoma 32 infiltrating ductal carcinoma
Example: Stiffness variation in breast tissue
1. F.A. Duck, Physical Properties of Tissue - A Comprehensive Reference Book, Academic Press, (1990)

Abbe School of Photonics, 18 June 2013
Sampson, Optical elastography
Mechanical load Image pre- and post-compression
Elastography – how it works
Image: Elastogram
Pre-compression Post-compression Ultrasound MRI
Mechanical property estimation
OCT
Stiffness 2
Stiffness 1

Abbe School of Photonics, 18 June 2013
Sampson, Optical elastography
Fibroadenoma
Invasive ductal carcinoma
Benign
H. Zhi et al., “Comparison of ultrasound elastography, mammography, and sonography in the diagnosis of solid breast lesions”, J. Ultrasound Med. (26) 807-815, (2007)
Results of study 296 solid lesions from 232 patients
• Sonography – 72.6% accuracy
• Elastography – 88.2% accuracy
Sonography
Elastography
Sonography
Elastography
Features of US elastography • Deeper penetration
• Poorer resolution • Commercially available
Benign
Benign
Malignant
Ultrasound elastography enhances breast cancer diagnosis
Abbe School of Photonics, 18 June 2013
Sampson, Optical elastography
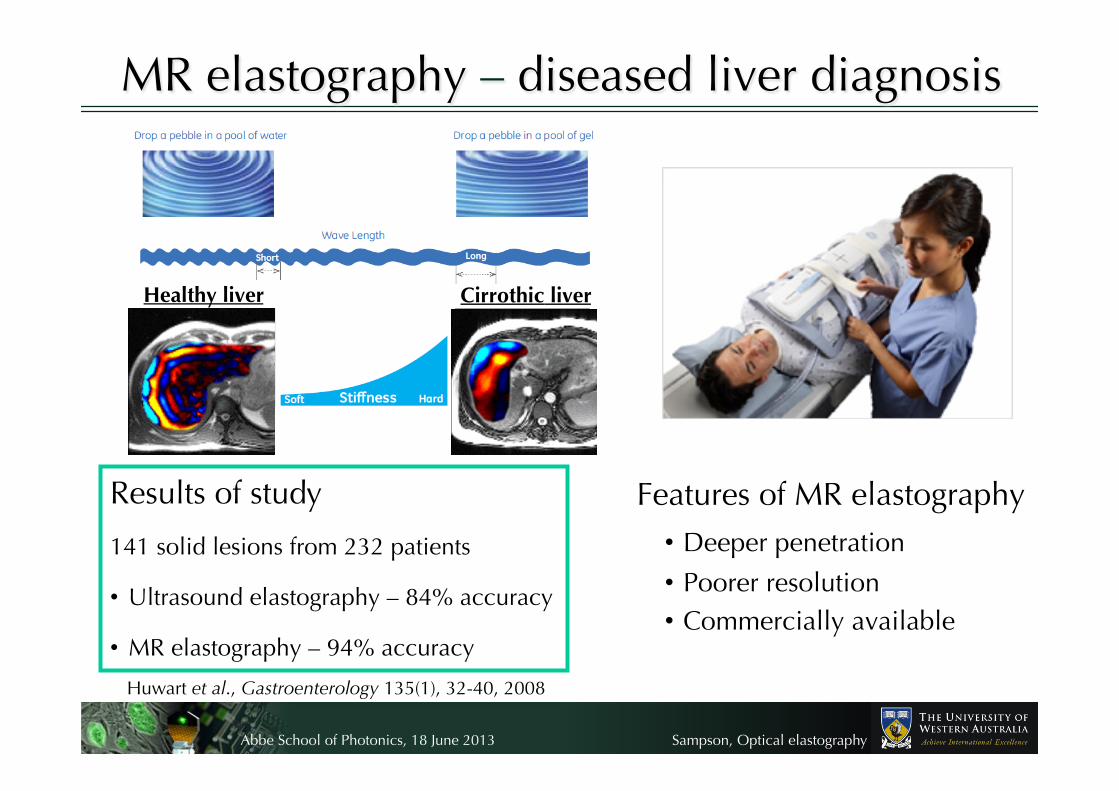
MR elastography – diseased liver diagnosis
Sonography
Elastography
Sonography
Elastography
Healthy liver
Cirrothic liver
Results of study
141 solid lesions from 232 patients
• Ultrasound elastography – 84% accuracy
• MR elastography – 94% accuracy
Huwart et al., Gastroenterology 135(1), 32-40, 2008
Features of MR elastography • Deeper penetration
• Poorer resolution • Commercially available

Abbe School of Photonics, 18 June 2013
Sampson, Optical elastography
(Non-optical) elastography through the years
Parker et al., Phys. Med. Biol. 56(1), 513, 2011 SMURF: spatially modulated ultrasound radiation force; CR: Crawling; ARFI: Acoustic radiation force impulse

Abbe School of Photonics, 18 June 2013
Sampson, Optical elastography
Elastography – keyword search in ISI Web of Knowledge
Elastography in the literature
Published items in each year Citations in each year
Date current on 13th May 2013 Important papers:
US – Ophir et al., Ultrasonic Imaging , 13 2, 111 (1991)
MR – Muthupillai et al., Science, 269 5232, 1854 (1995)
Optics – Schmitt et al., Optics Express, 3 6 199 (1998)

Abbe School of Photonics, 18 June 2013
Sampson, Optical elastography
Commercial ultrasound and MR elastography
US elastography
MR elastography

Abbe School of Photonics, 18 June 2013
Sampson, Optical elastography
Elastography – where is it used clinically?
Breast
Colon
Pancreas
Liver
Prostate
Thyroid
Liver
MR elastography
US elastography

Abbe School of Photonics, 18 June 2013
Sampson, Optical elastography
US and MR elastography – Summary
• Used for diagnostic imaging – disease correlates with stiffness
• Commercially available
• Suitable for clinical use
• Lower resolution than optics
- Probes disease at advanced stage
- Likely to miss small extensions of disease, e.g., tumour margins

Abbe School of Photonics, 18 June 2013
Sampson, Optical elastography
Why is tissue elasticity important?
Diagnosis Palpation Elastography
Nanobiomechanics
Cell mechanics
Disease pathophysiology
1 nm 1 µm 1 mm 1 m Scale
Tissue development
Injury mechanics Prosthetics Treatment
Optical elastography
Histology OCT OCE
Diagnosis Disease pathophysiology

Abbe School of Photonics, 18 June 2013
Sampson, Optical elastography
Nanobiomechanics
Cell mechanics
Pathophysiology
• Nanoscale forces: cell–cell and cell–extracellular matrix interactions
• Cells sense force through mechanoreceptors
• Cell-generated force – mechano-reciprocity • Loss of mechano-recipocity promotes disease progression, including
cancer, blood-borne diseases, liver fibrosis, atherosclerosis
Cancer cell division Malarial red blood cell Sickle cell anaemia

Abbe School of Photonics, 18 June 2013
Sampson, Optical elastography
Measuring elasticity at the nanoscale Atomic force microscope
Optical tweezers and trapping
• Laser tweezers – trap and control objects or particles in a medium
• Measures force required to deform particles
• Resolution – determined by imaging used, e.g., fluorescence or phase microscopy
• AFM – force sensor with piconewton resolution
• Tip mounted on cantilever senses sample surface
• Resolution – Lateral: 1 nm
Axial resolution: 1 Å

Abbe School of Photonics, 18 June 2013
Sampson, Optical elastography
Nanobiomechanics – Summary
• Important for understanding development of disease
• Elasticity measurements with exquisite spatial resolution
• Challenging for clinical diagnostics…
- Very small field-of-view
- Low temporal resolution
- Not suitable for compact imaging probes

Abbe School of Photonics, 18 June 2013
Sampson, Optical elastography
Why is tissue elasticity important?
Diagnosis Palpation Elastography
1 nm 1 µm 1 mm 1 m Scale
Nanobiomechanics
Cell mechanics
Disease pathophysiology
Tissue development
Injury mechanics Prosthetics Treatment
Optical elastography
Histology OCT OCE
Diagnosis Disease pathophysiology

Abbe School of Photonics, 18 June 2013
Sampson, Optical elastography
What does optics bring to elastography?
1. Higher spatial resolution
• 1-100 microns
• Scale on which many diseases progress
• Example – evaluating whether cancer has penetrated basement membrane of an epithelial tumour
2. Faster acquisition speed
• 2D acquisition rates >1 kHz avoids motion artefact
• Potential for 3D in vivo clinical diagnosis
• Example – handheld probe for tumour margin identification during surgery

Abbe School of Photonics, 18 June 2013
Sampson, Optical elastography
What does optics bring to elastography?
4. Higher mechanical contrast over optical contrast in imaging
• Young’s modulus of soft tissue Pa to tens of MPa
• Optical scattering coefficient in tissue 2 to 20 mm-1
• Apparent advantage in larger dynamic range of contrast
• Examples – differentiate low optical contrast targets such as cancer from stroma in breast tissue
3. Higher sensitivity
• Sub-nm (possibly tens pm) displacement sensitivity enables measurement of smaller changes in mechanical properties
• Potential to better differentiate subtle changes
• Example – differentiate benign/malignant tumours

Abbe School of Photonics, 18 June 2013
Sampson, Optical elastography
What does optics bring to elastography?
5. Lower imaging penetration
• Optics only penetrates millimetres from the probe
• Overcome by exploiting fibre optics in endoscopic and interstitial probes
• Provides microscopic resolution deep in the body
• Examples – diagnosis of cystic fibrosis, assessing atherosclerotic plaque vulnerability
aOCT

Abbe School of Photonics, 18 June 2013
Sampson, Optical elastography
OCE needle probe
Tumor
5 mm
Cardiology
Overlay of strain/OCT
B.F. Kennedy et al., Optics Express, 2011
Skin
Manapuram et al., J. Biomed. Optics, 2012
Ophthalmology
Breast cancer
Emerging applications of optical elastography
W. Qi et al., J. Biomed. Optics, 2012
S. K. Nadkarni et al., Circulation, 2005
Optical+Biomedical Engineering Laboratory, in preparation

Abbe School of Photonics, 18 June 2013
Sampson, Optical elastography
Optical elastography – keyword search in ISI Web of Knowledge
Optical elastography in the literature
10 mm J Ultrasound Med, 26: 807, 2007
Date current on 13th May 2013
Published items in each year Citations in each year
Abbe School of Photonics, 18 June 2013
Sampson, Optical elastography
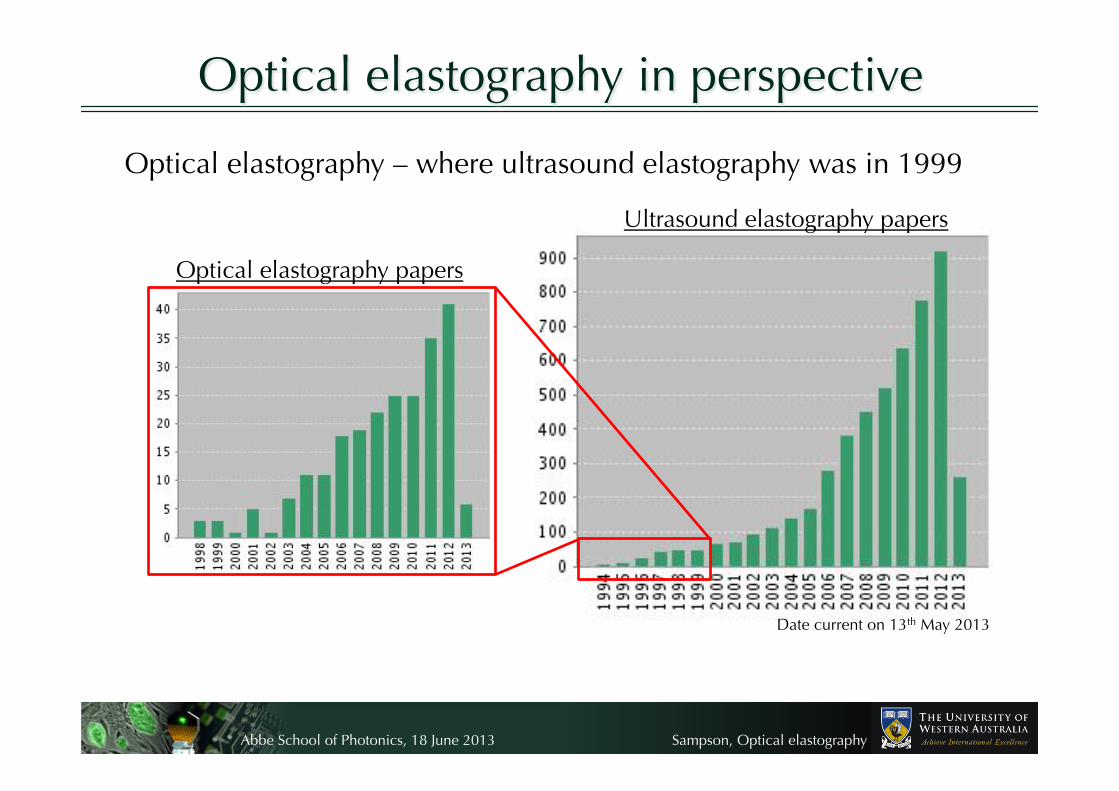
Optical elastography – where ultrasound elastography was in 1999
Optical elastography in perspective
Optical elastography papers
Ultrasound elastography papers
Date current on 13th May 2013

Abbe School of Photonics, 18 June 2013
Sampson, Optical elastography
Things are on the move in optical elastography….
Journal of Biomedical Optics Special Section
Photonics West subconference: Optical Elastography and Tissue Biomechanics

Abbe School of Photonics, 18 June 2013
Sampson, Optical elastography
• Elastography background Using tissue elasticity for diagnosis
• Optical elastography principles Optical system and mechanical property estimation
• Towards clinical application Cancer: preliminary results
Roadmap for optical elastography short course
• Mechanical properties of tissue Influence of materials and structure
• Towards accurate mechanical properties Elastogram artefacts
modality for screening the breasts of Chinesewoman. Most Chinese women have relativelysmall, dense breasts,4 and the median age ofthese patients with breast cancer is 47 years,which is 8 years younger than in Westernwomen,19 which limits the use of mammogra-phy. Bird et al20 stated that breast cancer wasless likely to be detected by mammography in
women with dense breasts and in womenyounger than 50 years. One of the various fac-tors leading to false-negative findings on mam-mography is the effect of breast density.5
Furthermore, breast density on mammographyis also associated with an increased risk ofbreast cancer.21 Meanwhile, dense glandulartissue usually has a hyperechoic appearanceon sonography, and mostly breast cancers arehypoechoic; carcinomas in this setting are eas-ily detected on sonography. In our study, wefound that UE was better than sonography fordetecting breast cancer in Chinese patients.Compared with mammography, the specificityof UE was higher, but there was no significantdifference between the sensitivity, accuracy,and positive and negative predictive values ofUE and mammography. However, mammogra-phy uses ionizing radiation, which itself is apotential carcinogen,22 and this limits the ageand frequency with which it can be used.23
Conversely, there is no such risk to patientswhen using UE. In addition, UE and sonogra-phy are much less expensive than mammogra-phy in China.
There is an overlap of the elasticity betweenbenign and malignant lesions in the breast,13
which limits the use of UE. In our study, 26 of87 cancers were missed by UE. Most false-neg-ative findings on UE were found in early stagesof invasive ductal carcinoma, which were all instages 1 and 2, and in noninvasive carcinoma,and some invasive soft tissue carcinomas suchas cystosarcoma phyllodes6 had large centralnecrosis (the lesions with large central necrosisall had false-negative findings). Consequently,large-scale necrosis may impair the diagnosticassessment in UE.15 Nine of 209 benign lesionswere misdiagnosed by UE. That rate was muchlower than those for mammography andsonography, which would decrease unneces-sary biopsies considerably. Among the false-positive diagnoses, 3 had calcifications, whichmight affect the diagnosis on UE, and 1 had adotted remote hemorrhage that had alreadybeen organized, which may have increased thehardness of the lesion. Therefore, when usingUE, one should pay attention to all the factorsthat would affect the stiffness of lesions andcause misleading results.
J Ultrasound Med 2007; 26:807–815 813
Zhi et al
B
A
Figure 4. Invasive ductal carcinoma in a 55-year-old woman. A, Mammogram showing several masses suspected to bebenign lesions. B, Right, Sonographic image. A hypoechoic masswith a round shape was suspected to be a benign lesion. Left,Ultrasound elastographic image. Both the entire hypoechoiclesion and its surrounding area were blue. The blue area on UEwas larger than the lesion area on sonography. It was scored 5and was diagnosed as a malignant lesion.
26.6.jum.online.q 5/16/07 2:15 PM Page 813

Abbe School of Photonics, 18 June 2013
Sampson, Optical elastography
What determines tissue mechanical properties?
• Tissue materials
− Solid and fluid content
• Tissue structure
− Organisation of structural elements
• Scale of measurement
− Cellular versus tissue level

Abbe School of Photonics, 18 June 2013
Sampson, Optical elastography
What determines tissue mechanical properties?
− Ceramics (e.g., bones)
− Polymers: (e.g., ligaments)
− Elastomers: (e.g., skin)
Wegst UGK, Ashby MF. Philosoph Mag 2004;84:2167–86
For elastic deformation:
MRTE ρ3
=ρ = Density R = Gas constant T = Temperature M = Weight of molecule between cross-links
Elastin ≈ 2 MPa
Collagen ≈ 6 GPa
Tissue elastic modulus E 1 kPa – 100 GPa
Elasticity of Some Materials • Tissue materials – solid content

Abbe School of Photonics, 18 June 2013
Sampson, Optical elastography
What determines tissue mechanical properties?
• Tissue materials – fluid content
• Tissue often considered as a solid
• More accurately described as poroelastic: solid with regions of fluid
• Fluid content: 60% of total body weight
• Mechanical properties strongly affected by hydration, e.g., skin
Mitchison et al., Stem Cell Dev. Biol., 2008
Poroelasticity
Skin hydration

Abbe School of Photonics, 18 June 2013
Sampson, Optical elastography
What determines tissue mechanical properties?
Tissue (hierarchical) structure
• Materials form tissue structural elements
• Structural elements also influence mechanical properties
Muscle
Tendon
Bone

Abbe School of Photonics, 18 June 2013
Sampson, Optical elastography
What determines tissue mechanical properties?
Tissue structure – organisation of fibres, cells’ ground substance
• Skin and tendon similar composition:
70-80% collagen, 4% elastin
*Agache et al., Arch Dermatol Res, 269, 221-232 (1980)
**Kubo et al., J Appl Physiol, 87, 2090-2096 (1999)
Tendon = 0.6-1.8 GPa**
Skin = 0.4-0.8 MPa*
Very different mechanical properties

Abbe School of Photonics, 18 June 2013
Sampson, Optical elastography
On the microscopic scale – Cancer cells are 10 times softer than
healthy cells
On the macroscopic scale – Cancerous tissue >10 times stiffer than
healthy tissue
Scale of measurement Elasticity depends on tissue material and structure at the scale being probed
Example: cancer cells versus cancerous tissue
So, how do we measure mechanical properties in elastography?
What determines tissue mechanical properties?
AFM of cancer cell

Abbe School of Photonics, 18 June 2013
Sampson, Optical elastography
• We need to make some assumptions:
• Take a complex block of tissue and break it up into homogeneous, small volumes
Assumption 1: Mechanically homogeneous over a resolution element
Imaging tissue deformation
Describe behaviour using continuum mechanics
How is a load realized in each small volume?

Abbe School of Photonics, 18 June 2013
Sampson, Optical elastography
Stress and Strain
€
Stress =ForceArea
€
ε xx =∂u∂x
ε yy =∂v∂y
ε zz =∂w∂z
• When any load (force) is applied, a stress results on each surface of each volume
• Stress causes a shape change • The spatial derivative of displacement (u, v, w)
in each axis is strain
x
y
z
σxx
σyy
σzz
τyx
τzx
τyz τxz
τxy
τzy
x
y
z
εxx
εyy
εzz
γyx
γzx
γyz γxz
γxy
γzy
σ: normal force τ: shear force ε: normal strain γ: shear strain

Abbe School of Photonics, 18 June 2013
Sampson, Optical elastography
Assumption 2: Isotropic (direction independent) properties
Relating stress and strain
€
σij =Cijklε ij
Reduces to two elastic constants, shear modulus, G, and bulk modulus, K
• Relate stress and strain through an elastic constant • 9 stress x 9 strain = 81 elastic constants to describe behaviour!
3D stress tensor – 9 stress components
x
y
z
σxx
σyy
σzz
τyx
τzx
τyz τxz
τxy
τzy
3D strain tensor – 9 strain components
x
y
z
εxx
εyy
εzz
γyx
γzx
γyz γxz
γxy
γzy

Abbe School of Photonics, 18 June 2013
Sampson, Optical elastography
Elastic moduli Shear Modulus, G – shear stress and strain Describes tendency to change in shape
Young’s Modulus, E – special case: longitudinal stress and strain, most commonly used to quantify stiffness
x
y
z
Poisson’s ratio, υ – relates change in shape to change in volume
€
E = 2G(1+υ)
€
υ =ε xxε zz
€
E ≈ 3G
Assumption 3: Tissue is incompressible (Volume is conserved)
€
≈ 0.5
Bulk Modulus, K – compressibility Describes tendency to change in volume
x
y
z
€
K =E
3(1−2υ)Relate E and G through geometry:
Relate E and K through geometry:
for tissue
€
G =τγ
€
E =σε

Abbe School of Photonics, 18 June 2013
Sampson, Optical elastography
So, which moduli for tissue?
How do we get to a modulus in elastography?
Assumption 4: Displacement can be related to modulus
Imaging system Algorithm Tissue motion Displacement Elastogram Modulus
Shear modulus (G) or Young’s modulus (E = 3G) has largest dynamic range in tissue
Abbe School of Photonics, 18 June 2013
Sampson, Optical elastography
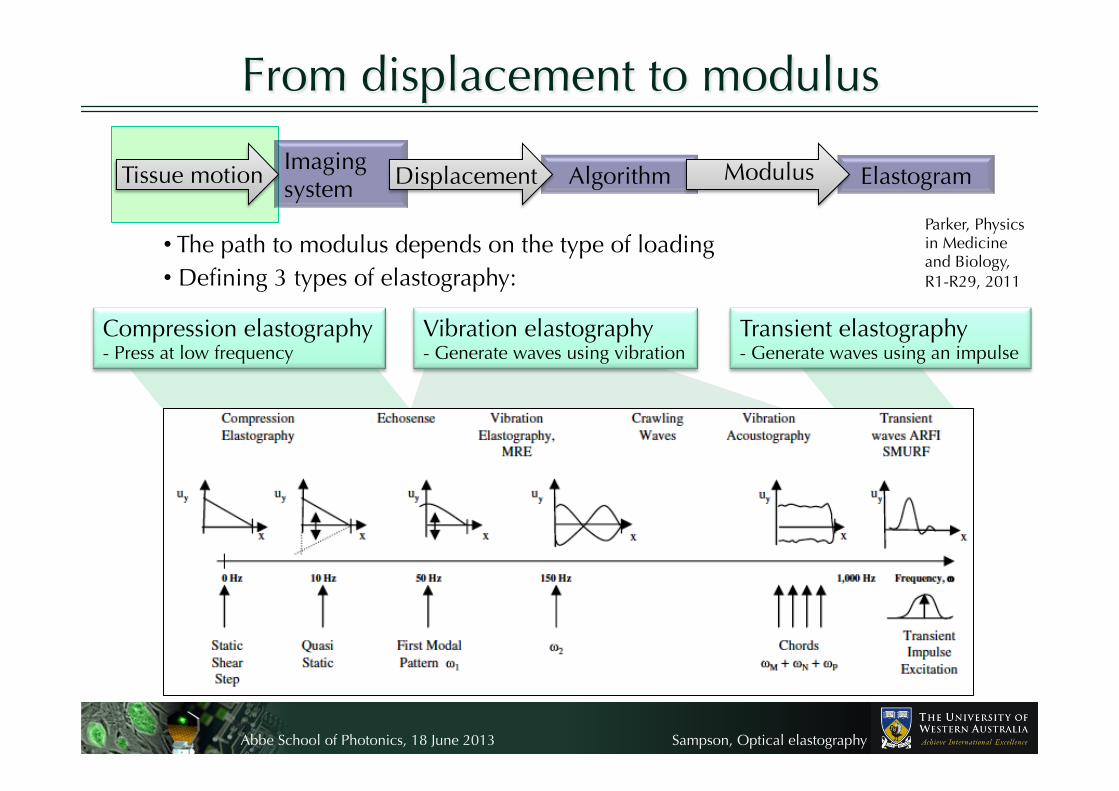
From displacement to modulus
• The path to modulus depends on the type of loading • Defining 3 types of elastography:
Parker, Physics in Medicine and Biology, R1-R29, 2011
Imaging system Algorithm Tissue motion Displacement Elastogram Modulus
Transient elastography - Generate waves using an impulse
Compression elastography - Press at low frequency
Vibration elastography - Generate waves using vibration

Abbe School of Photonics, 18 June 2013
Sampson, Optical elastography
Displacement to modulus – compression
z
Dis
plac
emen
t, u
0
Rigid base
z Dis
plac
emen
t, u
0
Rigid base
Hard
• Press at low frequency (<10 Hz) • Displacement strain ~ modulus
Ultrasound and strain images of invasive ductal carcinoma in human breast (Burnside et al., Radiology, 2007)
€
ε =dudz
=σE
Ophir J, Cespedes I, Ponnekanti H, Yazdi Y, Li X 1991, Elastography: A quantitative method for imaging the elasticity of biological tissues, Ultrason. Imaging 13 111–34 First paper
Abbe School of Photonics, 18 June 2013
Sampson, Optical elastography
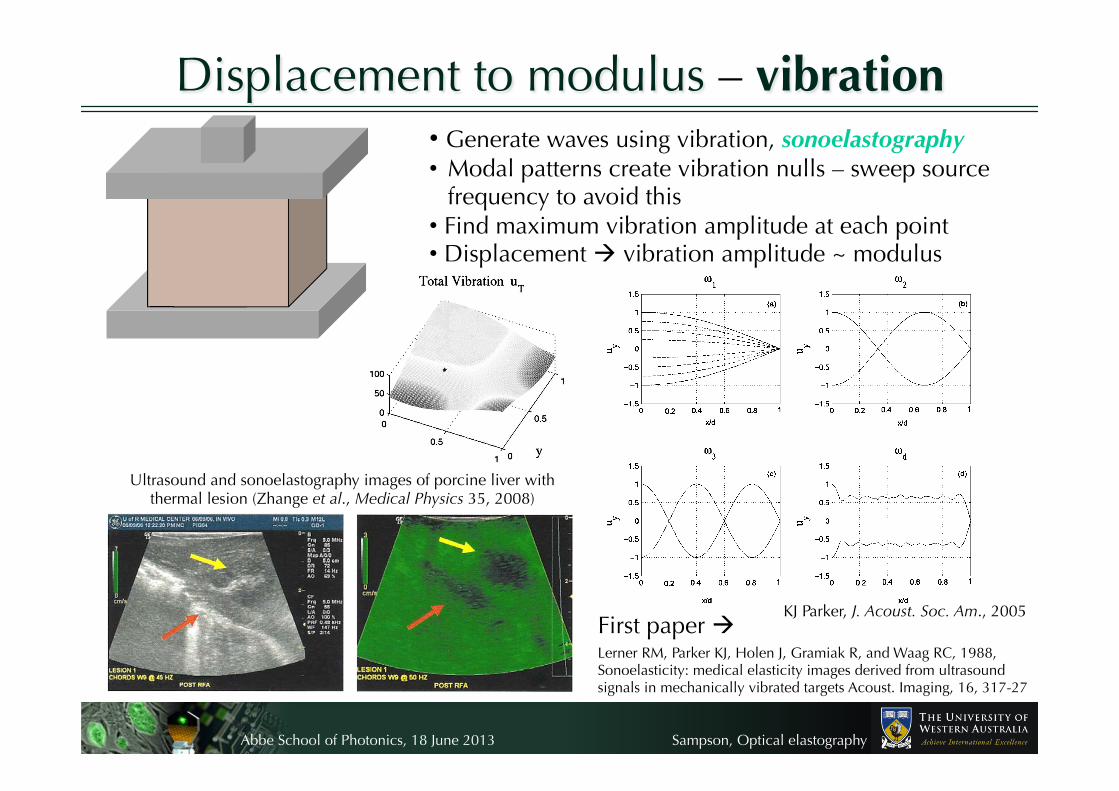
• Generate waves using vibration, sonoelastography • Modal patterns create vibration nulls – sweep source
frequency to avoid this • Find maximum vibration amplitude at each point • Displacement vibration amplitude ~ modulus
Displacement to modulus – vibration
Ultrasound and sonoelastography images of porcine liver with thermal lesion (Zhange et al., Medical Physics 35, 2008)
First paper Lerner RM, Parker KJ, Holen J, Gramiak R, and Waag RC, 1988, Sonoelasticity: medical elasticity images derived from ultrasound signals in mechanically vibrated targets Acoust. Imaging, 16, 317-27
KJ Parker, J. Acoust. Soc. Am., 2005

Abbe School of Photonics, 18 June 2013
Sampson, Optical elastography
Displacement to modulus – transient • Acoustic radiation force impulse • Generates shear waves
• Displacement shear wave speed ~ modulus
Sarvazyan A P, Rudenko O V, Swanson S D, Fowlkes J B and Emelianov S Y 1998 Shear wave elasticity imaging: a new ultrasonic technology of medical diagnostics Ultrasound Med. Biol. 24 1419–35
First paper
€
d2udx 2
=1cs2d2udt 2
Displacement to shear wave speed (the wave equation):
€
cs =E3ρ
Shear wave speed to modulus:
Ultrasound image and shear wave speed image of invasive ductal carcinoma in human breast (M. Tanter et al., Ultrasound Med. Biol., 2008)

Abbe School of Photonics, 18 June 2013
Sampson, Optical elastography
Is tissue purely elastic?
Relaxation – time-dependent stress Hysteresis – properties vary in loading versus unloading
• Young’s modulus defines elastic (linear, instantaneous) material behaviour
• But more commonly tissue is viscoelastic
• Viscosity is resistance to flow
• Viscoelastic behaviour is non-linear and time-dependent
Creep – time-dependent strain
In elastography, often…. − wait for stress relaxation before acquiring, OR − use acquisition speed >> tissue flow

Abbe School of Photonics, 18 June 2013
Sampson, Optical elastography
• Assumed in most elastography techniques to simply quantify stiffness
• But disease alters tissue viscoelasticity as well as stiffness
• Possibility for viscoelastic contrast in elastography – changes in time-dependent properties
• Study of viscous or viscoelastic properties is called rheology
Viscoelasticity in elastography
Coussot et al., IEEE Trans. Ultrason. Ferr., 2009
Creep response of breast tissue in compression elastography
Assumption 5: Tissue is linear elastic
Rheology of blood during clotting as measured by transient elastography
Gennisson et al., Phys. Med. Biol., 2006
Shear modulus Viscosity

Abbe School of Photonics, 18 June 2013
Sampson, Optical elastography
Mechanical properties of tissue – Summary • Tissue mechanical properties determined by content, structure,
and scale
• To form an image of these properties, make some assumptions:
1. Mechanical homogeneity within a resolution element
– Enables use of continuum mechanics to describe behaviour
2. Isotropic (direction-independent) properties
– Reduces 3D elasticity tensor to shear and bulk moduli
3. Incompressible (volume is conserved)
– Allows simple relation of shear and Young’s modulus (E = 3G)
4. Local displacement is related to elastic modulus
– Modulus is estimated from displacement in compression, vibration, and transient techniques
5. Linear elastic
– Simple model facilitates estimation of Young’s modulus (stiffness)
• More complex models of tissue behaviour (e.g., viscoelasticity) can provide further diagnostic information