![Index [assets.cambridge.org]assets.cambridge.org/97805217/31751/index/9780521731751_index.pdf · Index More information. ... 500 superlative, 134 too, 529, types, 41, 42 typical errors](https://static.fdocuments.in/doc/165x107/5b7816ab7f8b9ade6f8e5100/index-index-more-information-500-superlative-134-too-529-types.jpg)
S&P 500 Index Corporate Longevity
29
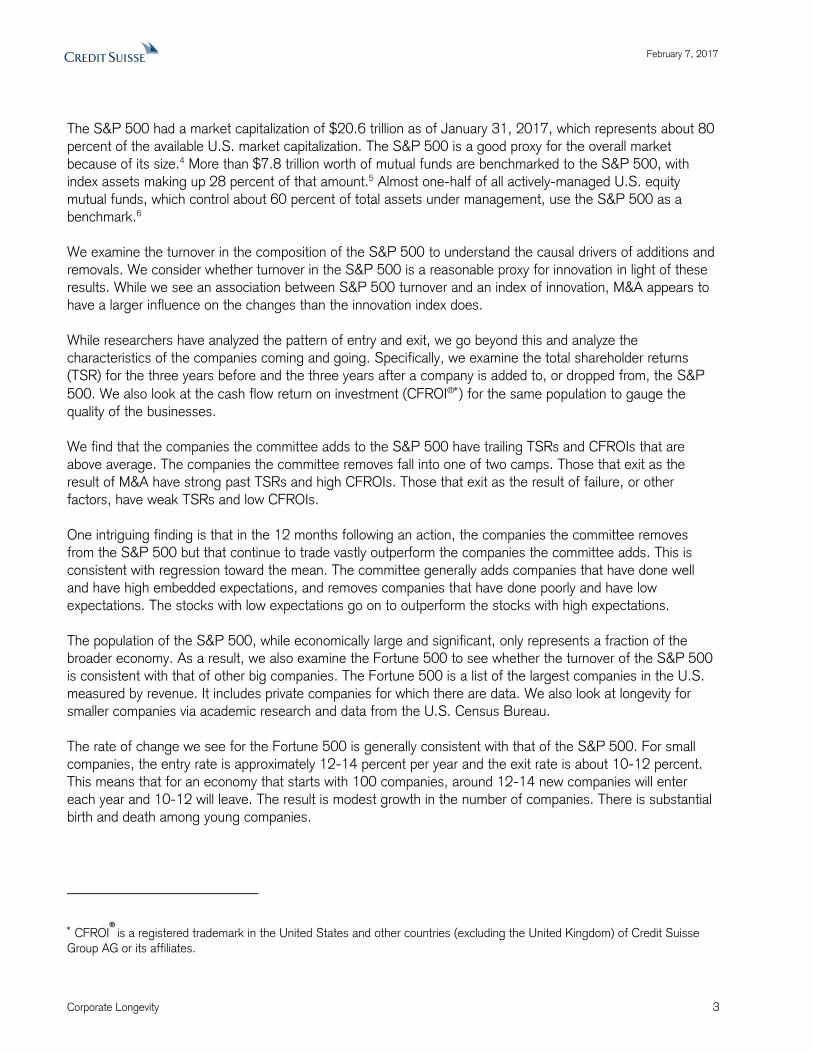
FOR DISCLOSURES AND OTHER IMPORTANT INFORMATION, PLEASE REFER TO THE BACK OF THIS REPORT. February 7, 2017 Authors Michael J. Mauboussin [email protected] Dan Callahan, CFA [email protected] Darius Majd [email protected] Source: Jeremy Siegel and Credit Suisse. Firms follow an “inexorable and irreversible movement towards the equilibrium of death.” Kenneth Boulding 1 Corporate longevity is an important consideration for investors as they assess valuation, position sizing within a portfolio, and the magnitude of sustainable competitive advantage. Turnover in the S&P 500 Index, a proxy for longevity, correlates to an index of innovation reasonably well but correlates to M&A activity even better. The trend for turnover in the S&P 500 and Fortune 500 is rising, but not dramatically. That turnover comes in waves better describes the data. Investors who compare their results to a benchmark need to appreciate how that benchmark changes. While most investors consider index funds to be passive, the indexes themselves vary quite a bit over time. The average total shareholder returns over the following year for the companies the committee removed from the S&P 500 but that continued to trade trounced those of the companies the committee added. The committee sells low and buys high. 0 10 20 30 40 50 60 0% 2% 4% 6% 8% 10% 12% 1958 1960 1962 1964 1966 1968 1970 1972 1974 1976 1978 1980 1982 1984 1986 1988 1990 1992 1994 1996 1998 2000 2002 2004 2006 2008 2010 2012 2014 2016 Number of Changes Turnover S&P 500 Index Average Trend line GLOBAL FINANCIAL STRATEGIES www.credit-suisse.com Corporate Longevity Index Turnover and Corporate Performance
Transcript of S&P 500 Index Corporate Longevity
FOR DISCLOSURES AND OTHER IMPORTANT INFORMATION, PLEASE REFER TO THE BACK OF THIS REPORT.
February 7, 2017
Authors
Michael J. Mauboussin
Dan Callahan, CFA
Darius Majd
Source: Jeremy Siegel and Credit Suisse.
Firms follow an “inexorable and irreversible movement towards the equilibrium
of death.”
Kenneth Boulding1
Corporate longevity is an important consideration for investors as they
assess valuation, position sizing within a portfolio, and the magnitude of
sustainable competitive advantage.
Turnover in the S&P 500 Index, a proxy for longevity, correlates to an
index of innovation reasonably well but correlates to M&A activity even
better.
The trend for turnover in the S&P 500 and Fortune 500 is rising, but not
dramatically. That turnover comes in waves better describes the data.
Investors who compare their results to a benchmark need to appreciate
how that benchmark changes. While most investors consider index funds
to be passive, the indexes themselves vary quite a bit over time.
The average total shareholder returns over the following year for the
companies the committee removed from the S&P 500 but that continued
to trade trounced those of the companies the committee added. The
committee sells low and buys high.
0
10
20
30
40
50
60
0%
2%
4%
6%
8%
10%
12%1
95
81
96
01
96
21
96
41966
196
81
97
01
97
21
97
41
97
61
97
81
98
01
98
21
98
41
98
61
98
81
99
01
99
21
99
41
99
61998
200
02
00
22
00
42
00
62
00
82
01
02
01
22
01
42
01
6
Num
ber of
Chan
ges
Turn
ove
r
S&P 500 Index
Average
Trend line
GLOBAL FINANCIAL STRATEGIES
www.credit-suisse.com
Corporate Longevity Index Turnover and Corporate Performance

February 7, 2017
Corporate Longevity 2
Introduction
Clark Kerr, the former president of the University of California, noted that of the Western institutions
established by 1520, only 85 existed almost a half millennium later. These include the Roman Catholic Church,
the British Parliament, several Swiss cantons, and 70 universities. Each of these institutions represents a
group of people who come together for a common purpose. Few companies, however, live a long time and
those that do are generally in the beverage or hospitality business.2 Why do cities and universities grow old
and companies die young? Further, is the rate of corporate longevity shrinking, stable, or expanding?
Corporate longevity is relevant for investors for a number of reasons. First, researchers frequently use
longevity as a proxy for the rate of innovation. Short corporate lives are associated with rapid innovation or
what the economist Joseph Schumpeter called the “perennial gale of creative destruction.”3 Corporate lives
are more fleeting if innovation is accelerating, which has implications for portfolio construction and the pattern
of value creation. We will show that while there is a link between innovation and longevity, the level of mergers
and acquisitions (M&A) explains longevity even better than innovation does.
Longevity also plays an important role in determining the size of the investable universe. The population of
public companies rises with spin-offs and initial public offerings (IPOs) and falls with M&A and delistings as
the result of bankruptcy. Because M&A has exceeded IPOs in the last two decades, the population of listed
companies in the U.S. has dropped to levels last seen in the 1970s.
Finally, investors generally measure the returns for active money managers versus a benchmark index. These
indexes change their composition as index committees add and subtract companies. Comparing the results of
an active investment manager to a benchmark index makes sense because investors consider the returns of
an index fund as an opportunity cost. Just as companies must earn a return on investment in excess of the
opportunity cost of capital to create value, investment managers must beat their benchmark to add value.
There is a general sense that the rate of change is accelerating and that corporate longevity is shrinking. This
assertion appears frequently in the business press. Our research shows a more nuanced picture. Indeed, a
common measure of corporate longevity, turnover of the companies in the S&P 500, shows that longevity has
lengthened in recent years. Here is a summary of the research:
Exhibit 1: Studies on Corporate Survival
Source: Credit Suisse. See endnotes for full list of sources.
Study Sample Survival
CS Global Financial
StrategiesS&P 500 Implied survival of 24 years (1958-2016)
CS Global Financial
StrategiesFortune 500 Implied survival of 16 years (1955-2015)
Stangler and
ArbesmanFortune 500 Implied survival of 16 years (1955-2011)
Daepp, Hamilton,
West, and BettencourtNorth American public companies
Typical half-life of 10 years, regardless of
age or business sector (1975-2009)
CS HOLTGlobal public companies with
$250M-plus market cap
Roughly one half survive 10 years (1965-
2015)
U.S. Census All U.S. establishmentsSurvival of roughly 75 percent for 1 year
and 50 percent for 5 years (1977-2014)
Dunne, Roberts, and
Samuelson
More than 250,000 U.S.
manufacturing firms
Survival of roughly 65 percent for 5 years
and 20 percent for 10 years (1963-1982)
February 7, 2017
Corporate Longevity 3
The S&P 500 had a market capitalization of $20.6 trillion as of January 31, 2017, which represents about 80
percent of the available U.S. market capitalization. The S&P 500 is a good proxy for the overall market
because of its size.4 More than $7.8 trillion worth of mutual funds are benchmarked to the S&P 500, with
index assets making up 28 percent of that amount.5 Almost one-half of all actively-managed U.S. equity
mutual funds, which control about 60 percent of total assets under management, use the S&P 500 as a
benchmark.6
We examine the turnover in the composition of the S&P 500 to understand the causal drivers of additions and
removals. We consider whether turnover in the S&P 500 is a reasonable proxy for innovation in light of these
results. While we see an association between S&P 500 turnover and an index of innovation, M&A appears to
have a larger influence on the changes than the innovation index does.
While researchers have analyzed the pattern of entry and exit, we go beyond this and analyze the
characteristics of the companies coming and going. Specifically, we examine the total shareholder returns
(TSR) for the three years before and the three years after a company is added to, or dropped from, the S&P
500. We also look at the cash flow return on investment (CFROI®) for the same population to gauge the
quality of the businesses.
We find that the companies the committee adds to the S&P 500 have trailing TSRs and CFROIs that are
above average. The companies the committee removes fall into one of two camps. Those that exit as the
result of M&A have strong past TSRs and high CFROIs. Those that exit as the result of failure, or other
factors, have weak TSRs and low CFROIs.
One intriguing finding is that in the 12 months following an action, the companies the committee removes
from the S&P 500 but that continue to trade vastly outperform the companies the committee adds. This is
consistent with regression toward the mean. The committee generally adds companies that have done well
and have high embedded expectations, and removes companies that have done poorly and have low
expectations. The stocks with low expectations go on to outperform the stocks with high expectations.
The population of the S&P 500, while economically large and significant, only represents a fraction of the
broader economy. As a result, we also examine the Fortune 500 to see whether the turnover of the S&P 500
is consistent with that of other big companies. The Fortune 500 is a list of the largest companies in the U.S.
measured by revenue. It includes private companies for which there are data. We also look at longevity for
smaller companies via academic research and data from the U.S. Census Bureau.
The rate of change we see for the Fortune 500 is generally consistent with that of the S&P 500. For small
companies, the entry rate is approximately 12-14 percent per year and the exit rate is about 10-12 percent.
This means that for an economy that starts with 100 companies, around 12-14 new companies will enter
each year and 10-12 will leave. The result is modest growth in the number of companies. There is substantial
birth and death among young companies.
CFROI
®
is a registered trademark in the United States and other countries (excluding the United Kingdom) of Credit Suisse
Group AG or its affiliates.

February 7, 2017
Corporate Longevity 4
The main question is, “Why do companies die?” Some die because of obsolescence, but most depart
gracefully through M&A. The companies that the S&P 500 committee discards that continue to trade appear
to present a small, but lucrative, investment opportunity.
What Causes S&P 500 Turnover?
Exhibit 2 shows the turnover in the constituents of the S&P 500 Index from 1958 to 2016. We use data from
FactSet for 1991 through 2016 and from Jeremy Siegel, a professor of finance at the Wharton School of the
University of Pennsylvania, for the prior years.7 Over this span, the average annual turnover rate was 4.2
percent, which means there were approximately 20 changes per year. The removal of one company and the
addition of its replacement constitute one change. Appendix A explains how we track deletions and additions.
Exhibit 2: Turnover in the S&P 500 Index, 1958-2016
Source: 1958-1990: Jeremy Siegel, “Long-Term Returns on the Original S&P 500 Companies,” Financial Analysts Journal, Vol. 62, No. 1,
January/February 2006, 18-31; 1991-2016: FactSet, S&P Dow Jones Indices, Credit Suisse.
The trend line in the annual turnover rate rises gently from the late 1950s and early 1960s, when the rate of
change was a modest 3 percent, to an average turnover rate of about 4 percent over the past 5 years.
Perhaps the most striking feature of exhibit 1 is that the turnover rate can swing wildly from year to year. For
example, the annual turnover rate was as low as 2 percent and as high as 11 percent from 1991 through
2016.
What is the source of turnover? The high turnover in some periods, such as the dot-com bubble in the late
1990s or the financial crisis in 2008-2009, makes sense and may be indicative of changes in the underlying
economy. But in most instances, the turnover tells us little about creative destruction.8
For instance, the huge spike in 1976 turnover was the result of the S&P committee removing 40 industrial,
transportation, and utility companies and replacing them with financial stocks. Starting around 1996, the S&P
committee started to manage the index more actively. Through much of the index’s history, the committee
only modified the list of companies when it had to remove a stock for reasons including bankruptcy or
acquisition. But over the past 20 years, the committee has been more proactive in removing firms that fail to
effectively represent the industry in which they compete, or that fail to characterize the U.S. market.9
0
10
20
30
40
50
60
0%
2%
4%
6%
8%
10%
12%
19
58
19
60
19
62
19
64
19
66
19
68
19
70
19
72
19
74
19
76
19
78
19
80
19
82
19
84
19
86
19
88
19
90
19
92
19
94
19
96
19
98
20
00
20
02
20
04
20
06
20
08
20
10
20
12
20
14
20
16
Num
ber of
Chan
ges
Turn
ove
r
Average
Trend line

February 7, 2017
Corporate Longevity 5
As a case in point, the index committee removed 7 companies in 2002 due to their “lack of representation.”
This distinction most commonly refers to companies with market capitalizations at the low end of range for the
index. In that same year, the committee replaced 7 non-U.S. companies because they failed to meet the
selection criteria at that time. This is despite the fact that some of the companies had been in the index and its
predecessors for 60 years. Without the change in methodology, 14 of the 23 total changes in 2002 would
have been unlikely.
This example reveals that the S&P committee’s more active approach to managing the index explains about
one-third of the turnover over the past 20 years. Exhibit 3 shows the hypothetical turnover for the S&P 500
assuming the S&P committee managed the index from 1996 to 2016 in the same way as it did from 1958
to1995. We assume the committee would not have removed companies for “lack of representation,” low
market capitalizations, failing to meet certain profit criteria, or being domiciled outside the U.S. We also
exclude the 40 changes in 1976 that were purely to change the industry makeup of the index.
Without these changes, the gentle rise in turnover in exhibit 2 gives way to a nearly flat trend line. So what
looks like evidence of creative destruction at first glance may simply be more proactive index management.
Exhibit 3: Hypothetical Turnover in the S&P 500 Index, 1958-2016
Source: Credit Suisse.
The change in the S&P committee’s approach to managing the index reveals the limitation of using turnover
as a simple proxy for innovation. Yet there is a good fit between “The Shift Index,” a measure of innovation
developed by consultants at Deloitte, and turnover in the S&P 500. Exhibit 4 shows the correlation between
the change in the Shift Index and the turnover in the S&P 500 from 1994 through 2015. The correlation
coefficient (r) is 0.65. The Shift Index has three component indexes. The “foundation index” captures public
policy, infrastructure penetration, and technology performance. The “flow index” reflects virtual and physical
flows, as well as amplifiers such as social media. The “impact index” takes into consideration markets, firms,
and people. The Shift Index combines these components in an attempt to quantify economic change.10
0
10
20
30
40
50
60
0%
2%
4%
6%
8%
10%
12%
19
58
19
60
19
62
19
64
19
66
19
68
19
70
19
72
19
74
19
76
19
78
19
80
19
82
19
84
19
86
19
88
19
90
19
92
19
94
19
96
19
98
20
00
20
02
20
04
20
06
20
08
20
10
20
12
20
14
20
16
Num
ber of
Changes
Turn
ove
r
Trend
line

February 7, 2017
Corporate Longevity 6
Exhibit 4: The Shift Index and Turnover in the S&P 500 Index, 1994-2015
Source: Deloitte analysis (see: https://dupress.deloitte.com/content/dam/dup-us-en/articles/3407_2016-Shift-Index/DUP_2016-Shift-Index.pdf);
FactSet; S&P Dow Jones Indices; Credit Suisse.
The question is whether anything explains turnover better than the Shift Index. To answer this, we examine
why the committee removed stocks from the S&P 500. Appendix B provides a detailed discussion of the basis
for additions to, and removals from, the index. Additions must meet specific criteria, but the committee has a
fair amount of discretion in the decision to remove a company.
The grounds for removal fall into one of three categories: “M&A,” “Failure,” and “Other.” M&A includes
mergers, acquisitions, and companies that go private. We exclude other strategic deals such as spin-offs to
shareholders or other forms of dividing a company.
Failure primarily includes companies the committee dropped from the index following a bankruptcy filing or for
failure to maintain a sufficient market capitalization.10
“Other” consists mostly of two groups. First are companies that realized a large decline in market capitalization
for reasons unrelated to performance, including special dividends or spin-offs. Second are companies that the
committee eliminated for having a domicile outside the U.S.
For 2000 through 2016, we categorize each removal from the index based on the information that S&P
provides. This reveals that M&A, not failures, drives the majority of turnover in the index. Exhibit 5 shows that
more than half the removals are the result of M&A, while only one-third are from failure. The other category is
just over one-tenth of the sample. Most failures are the consequence of a decline in market capitalization, not
bankruptcy. See Appendix C for a full log of these changes and the reasons for each removal.
0%
2%
4%
6%
8%
10%
12%
19
94
19
95
19
96
19
97
19
98
19
99
20
00
20
01
20
02
20
03
20
04
20
05
20
06
20
07
20
08
20
09
20
10
20
11
20
12
20
13
20
14
20
15
S&P 500 Index Shift Index

February 7, 2017
Corporate Longevity 7
Exhibit 5: Reasons for Removal from the S&P 500 Index, 2000-2016
Source: FactSet; S&P Dow Jones Indices; Credit Suisse.
Exhibit 6 compares U.S. M&A volume to index turnover from 1990 to 2016. There is a strong relationship
between the two, with a correlation coefficient (r) of 0.79. We see that index turnover over the last 27 years
peaks at the same time as M&A peaks in the late 1990s, again crests around the M&A wave in the mid-
2000s, and accelerates in recent years alongside resurgent M&A.
An extensive body of research links M&A activity to a wide variety of factors, including stock prices, business
sentiment, financing costs, tax rates, industry shocks, and even behavioral pressures on management
teams.11 While the rate of innovation certainly plays a role in M&A as well, it appears to be one among a
handful of essential drivers.
Exhibit 6: S&P 500 Turnover and U.S. M&A Volume, 1990-2016
Source: Thomson Reuters; S&P Dow Jones Indices; Credit Suisse.
0
10
20
30
40
50
60
20
00
20
01
20
02
20
03
20
04
20
05
20
06
20
07
20
08
20
09
20
10
20
11
20
12
20
13
20
14
20
15
20
16
Num
ber
of
Rem
ova
lsM&A
Failure
Other
Total Percentage
M&A 237 55%
Failure 139 32%
Other 52 12%
0%
2%
4%
6%
8%
10%
12%
0.0
0.5
1.0
1.5
2.0
2.5
199
0
199
1
199
2
199
3
199
4
199
5
199
6
199
7
199
8
199
9
200
0
200
1
200
2
200
3
200
4
200
5
200
6
200
7
200
8
200
9
201
0
201
1
201
2
201
3
201
4
201
5
201
6
Annual
Turn
ove
r
Volu
me (
Tril
lions
of
20
15 U
.S D
olla
rs)
U.S. M&A Volume
S&P 500 Turnover

February 7, 2017
Corporate Longevity 8
These categories reveal the limitations of simply associating turnover with creative destruction. For example, it
is inaccurate to say that a company “failed” if the S&P committee removed it following a divestiture that shrunk
the company’s market capitalization below a threshold level. Likewise, it is hard to say that creative destruction
was the reason the committee removed a company after it was acquired for its strong growth and profitability.
The Characteristics of Companies Added to, and Removed from, the S&P 500
The next step of our study was an analysis of the characteristics of the companies the committee added and
removed from the S&P 500 Index. We focused on two measures. The first is three- and one-year total
shareholder return (TSR), relative to the S&P 500, before the change and one and three years following the
change. TSR is the return an investor earns for a stock given the change in price and assuming that all
dividends are reinvested.
The second measure is the three- and one-year cash flow return on investment (CFROI) before the change
and one and three years following the change. CFROI is a measure of the return a company earns on the
cash it invests in its business. Because CFROI is adjusted for inflation, you can compare it over time without
fear of distortion. Appendix D provides detail on the sample sizes of the various categories.
Exhibit 7 summarizes our observations about TSR.12 The S&P committee tends to add companies that have
realized strong past stock returns. The companies added from 2000-2016 had an average relative TSR of 23
percent per year for the 3 years before inclusion, and 41 percent for the year prior to inclusion. The median
returns, while more modest, are similarly high. The committee’s behavior is consistent with other investors:
They buy high.13
Exhibit 7: Trailing and Future TSRs for Additions and Removals from the S&P 500, 2000-2016
Source: FactSet and S&P Dow Jones Indices.
The companies the committee removed had three-year returns that lagged the S&P 500 and one-year returns
that were essentially equal to the index. Naturally, the TSRs reflect the reason the committee had to drop a
company. (See exhibit 8.) For example, the companies that left as the result of M&A had average relative
returns of 4 percent per year for three years and 28 percent for one year.
Companies that failed fared poorly prior to exclusion. Those companies had average relative TSRs of -32
percent per year for three years and -41 percent for one year. Companies that left the index for other reasons
had returns roughly in line with that of the S&P 500. For each type, the median returns prior to removal are
similar to those for the mean. Companies that were acquired had excellent relative TSRs, those that failed had
poor TSRs, and the other companies performed about in line with the market.
-3 Year
CAGR -1 Year +1 Year
+3 Year
CAGR
Added 23% 41% -2% -3%
Removed -9% 3% 28% 3%
Added 16% 26% -3% 0%
Removed -5% 7% 4% 2%
Mean
Median
TSR Relative to S&P 500

February 7, 2017
Corporate Longevity 9
Exhibit 8: Trailing and Future TSRs for Types of Removals from the S&P 500, 2000-2016
Source: FactSet and S&P Dow Jones Indices.
However, the past is not prologue. Exhibit 9 shows that the average TSRs over the following year for the
companies the committee removed but that continued to trade trounced those of the companies the
committee added.14 One year after a change, the average relative TSR for the companies the committee
added was -2 percent while the relative TSR for the companies removed was 28 percent. Despite the sharp
divergence in the first year, the disparity does contract over three years. These results are consistent with prior
research examining changes to the S&P 500 and Dow Jones Industrial Average.15 The S&P 500 Index
committee buys high and sells low.
Exhibit 9: Relative TSRs Following Addition and Removal from the S&P 500, 2000-2016
Source: FactSet and S&P Dow Jones Indices.
Exhibit 10 shows the results for CFROI. The committee adds companies to the S&P 500 that have CFROIs
well above the average. For the three years prior to addition these companies have an average CFROI of 15
percent, while the CFROI is an even higher 16 percent for the year prior to addition. These figures compare to
an average CFROI of 9.2 percent for all U.S. companies during that period. The S&P 500 committee adds
companies that have stock market returns and quality that are well above average.
-3 Year
CAGR -1 Year +1 Year
+3 Year
CAGR
M&A 4% 28%
Failure -32% -41% 33% 3%
Other -4% 3% 20% 2%
Universe -9% 3% 28% 3%
M&A 4% 25%
Failure -30% -48% 2% 2%
Other -3% 1% 8% 1%
Universe -5% 7% 4% 2%
Mean
Median
TSR Relative to S&P 500
-5%
0%
5%
10%
15%
20%
25%
30%
+1 Year +3 Year CAGR
Added Removed

February 7, 2017
Corporate Longevity 10
The CFROIs of the deleted companies are the mirror image: They are below average. The mean CFROI for
the three years prior to removal was 10 percent, and the CFROI in the year before removal was an even lower
8 percent. But, the average CFROIs for the removed companies belie the results based on why they were
removed.
Exhibit 10: Trailing and Future CFROIs for Additions and Removals from the S&P 500, 2000-2016
Source: FactSet; S&P Dow Jones Indices; Credit Suisse HOLT®.
Companies removed as the result of M&A had trailing three-year average CFROIs above the rest of the
market. (See exhibit 11.) This is consistent with prior research that suggests firms with large free cash flows
are attractive takeover targets.16 Companies removed because of failure had CFROIs below the average. The
CFROIs for these companies in the one year and three years following removal, at around five percent
(medians), are subpar businesses.
Exhibit 11: Trailing and Future CFROIs for Removals from the S&P 500, 2000-2016
Source: FactSet; S&P Dow Jones Indices; Credit Suisse HOLT®.
The S&P 500 committee adds stocks of companies that have achieved good recent TSRs and that are of
above-average quality. Those companies continue to earn high CFROIs, but their stocks, on average,
generate TSRs roughly in line with the market in the one and three years following addition.
There are two tales for the companies that the committee removes. The stocks of companies that are involved
in M&A, which is a majority of removals, have TSRs and CFROIs that are well above the market prior to
leaving the S&P.
-3 Year
Avg -1 Year +1 Year
+3 Year
Avg
Added 15% 16% 16% 15%
Removed 10% 8% 1% 2%
Added 12% 13% 13% 13%
Removed 9% 8% 5% 5%
CFROI
Mean
Median
-3 Year
Avg -1 Year +1 Year
+3 Year
Avg
M&A 12% 11%
Failure 7% 3% -3% 1%
Other 9% 9% 5% 4%
Universe 10% 8% 1% 2%
M&A 9% 9%
Failure 7% 6% 5% 5%
Other 10% 10% 6% 4%
Universe 9% 8% 5% 5%
Mean
Median
CFROI

February 7, 2017
Corporate Longevity 11
The stocks of the companies categorized as failures, slightly below one-third of our sample, have abysmal
TSRs prior to removal but superb TSRs after removal. The quality of these businesses, as measured by
CFROI, is substandard throughout the period we measure.
The stocks of the smallest group, companies categorized as “other,” have average quality prior to removal and
earn TSRs roughly equivalent to that of the market before removal and better than the market after removal.
Evidence from the Fortune 500 Corroborates the S&P Experience
The S&P 500 includes many large companies in the Unites States and accurately reflects the broad stock
market. To expand our analysis of longevity, we also examined the changes in the Fortune 500 over time.
Published annually by Fortune magazine, the list includes the 500 largest U.S. companies ranked by revenues.
Because it includes public, private, and mutual insurance companies, the Fortune 500 is a more complete list
of America’s largest companies.17 We estimate that roughly 315 companies are in both the S&P 500 and the
Fortune 500.
Exhibit 12 shows annual turnover in the Fortune 500 since 1955, the year Fortune first published the list. We
see a pattern of turnover that is consistent with that of the S&P 500. On average, there are 32 changes per
year, representing turnover of roughly 6 percent, above the S&P 500 at about 4 percent. Similar to the S&P
500, we see evidence of a modest rise in turnover. But the trend is down over the past 30 years.
Exhibit 12: Fortune 500 Turnover
Source: Fortune and Credit Suisse.
Exhibit 13 presents another view of longevity for the companies on the list.18 We select five starting years—
1955, 1965, 1975, 1985, and 1995—and track what number of the original 500 companies for those years
remain on the list annually for subsequent years.19 For example, 362 of 500 companies on the 1955 list
remained there 10 years later. After 15 years, only 294 of the 500 were still on the list. After 35 years, just
170 of the 500 made the list. The steeper the slope of the line’s decline, the more rapidly companies
disappear from the list. The lines that start at more recent dates do appear to drop faster, showing that there
is indeed acceleration in turnover for the Fortune 500. It’s harder to remain among the ranks of the largest
companies today than it was in past generations.
0
10
20
30
40
50
60
0%
2%
4%
6%
8%
10%
12%
19
55
19
57
19
59
19
61
19
63
19
65
19
67
19
69
19
71
19
73
19
75
19
77
19
79
19
81
19
83
19
85
19
87
19
89
19
91
19
93
19
95
19
97
19
99
20
01
20
03
20
05
20
07
20
09
20
11
20
13
20
15
Num
ber of
Chan
ges
Turn
ove
r
Average
Trend line

February 7, 2017
Corporate Longevity 12
Exhibit 13: Fortune 500 Longevity
Source: Fortune and Credit Suisse.
Exhibit 14 shows that Fortune 500 turnover, similar to S&P 500 turnover, tracks the M&A cycle closely.
However, the correlation is not as high for the Fortune 500 as it is for the S&P 500. Since 1990, the annual
turnover for the Fortune 500 had a correlation (r) to U.S. M&A volume of 0.58, which compares to 0.79 for
S&P 500 turnover.
Exhibit 14: Turnover for the Fortune 500 and S&P 500 and U.S. M&A Volume
Source: Fortune; Thomson Reuters; S&P Dow Jones Indices; Credit Suisse.
0
50
100
150
200
250
300
350
400
450
500
0 5 10 15 20 25 30 35 40
Num
ber of
Orig
inal
Com
pan
ies
Rem
ainin
g
Number of Years from Base Year
1955
1965
1975
1985
1995
0%
2%
4%
6%
8%
10%
12%
0.0
0.5
1.0
1.5
2.0
2.5
1990
199
1
1992
1993
1994
1995
1996
1997
1998
1999
2000
2001
2002
2003
2004
2005
2006
2007
2008
2009
2010
2011
2012
2013
2014
2015
2016
Annual
Turn
ove
r
Volu
me (
Tril
lions
of
20
15 U
.S. D
olla
rs)
U.S. M&A Volume
S&P 500 Turnover
Fortune 500 Turnover

February 7, 2017
Corporate Longevity 13
Broadening the Sample—From Big to Small
We have focused on big corporations because they reflect the overall economy and represent a large fraction
of the investable universe. Investors focus on those companies with good reason. In the U.S. today, there are
5.1 million total firms and only roughly 4,400 stocks trade on major exchanges.21
Timothy Dunne, Mark Roberts, and Larry Samuelson, a trio of economists, did a sweeping study of corporate
longevity, including entry and exit rates. Their analysis of more than 250,000 U.S. manufacturing firms
showed that roughly 35 percent of firms that enter an industry exit within 5 years, and that about 80 percent
of entrants exit within 10 years.22
Exhibit 15 shows the rate of entry and exit for U.S. establishments across all industries from 1977-2014,
using the U.S. Census’s Business Dynamics Statistics (BDS). Most studies on corporate demography use
establishments, a rough proxy for firms, as the unit of analysis because that is the way the Census Bureau
collects and reports the data.
A useful way to think about entry and exit is to imagine an industry with 100 firms today. Based on the
average annual rates over the past decade, roughly 12-14 new firms will enter the industry and 10-12 firms
will leave in one year. This leads to modest growth in the total number of firms on average. Because entry
rates typically exceed exit rates, the number of establishments in the U.S. increases over time.
The most recent data disclosed by the BDS show that approximately 25 percent of establishments fail within
the first year and just over one-half fail within five years.23 Mortality rates are high for young companies and
decline for companies that reach adolescence.
Exhibit 15: Establishment Entry and Exit Rates, 1977-2014 (United States)
Source: U.S. Census Bureau; Center for Economic Studies; Business Dynamics Statistics; Credit Suisse.
6%
8%
10%
12%
14%
16%
18%
197
71
97
81
97
91
98
01
98
11
98
21
98
31
98
41
98
51
98
61
98
71
98
81
98
91
99
01
99
11
99
21
99
31
99
41
99
51
99
61
99
71
99
81
99
92
00
02
00
12
00
22
00
32
00
42
00
52
00
62
00
72
00
82
00
92
01
02
01
12
01
22
01
32
01
4
Entry Rate
Exit Rate

February 7, 2017
Corporate Longevity 14
Why Companies Die (and Cities and Universities Live)
Imagine an ant colony with a nearby source of food. Foragers find the food source and use chemical signals to
tell the other ants where to go to find the food. Call this exploitation. But some ants leave the chemical trail
and wander around seemingly aimlessly. Call this exploration. Why would an ant ever leave the main trail to
the food? If another rich food source appears, the colony wants to have a mechanism to find it. Ant colonies
balance exploitation with exploration. But it gets even better: The rate of exploration is roughly correlated with
the rate of change in the environment.
Our speculation is that a similar model can help explain why companies die. Successful companies generally
have a core source of profits. For many reasons, corporate leaders tend to dedicate too many resources to
exploitation of profits and not enough to exploration. Commonly, exploration requires a different structure than
exploitation, causing companies to stumble. The best companies are those that can skillfully balance
exploitation and exploration.24
By contrast, cities and universities have less pressure to optimize, and hence are more capable of evolving and
skirting failure. From a societal point of view, the rise and fall of individual companies may be healthy. But for
an individual who is involved with a company on the decline, the pain is real.
Conclusion
Corporate longevity is important for investors for a handful of reasons. First, if longevity is contracting then
investors need to rethink valuation, position sizing within a portfolio, and the magnitude of sustainable
competitive advantage. Our analysis shows that while turnover in the S&P 500, a proxy for longevity, is
reasonably well correlated to an index of innovation, the turnover is even better correlated to M&A activity.
That innovation and M&A are linked makes sense, but we also know that other factors, including capital
availability, stock prices, and the institutional imperative, influence M&A waves.
On balance, turnover for the S&P 500 and Fortune 500 is rising, but not at a dramatic rate. A better
description is that turnover comes in waves. Further, changes in criteria contaminate the turnover results.
Another reason that investors need to understand longevity is to assess the risk of failure for stocks within
their portfolio. This is especially pertinent for investors in value and small capitalization stocks. About one-third
of the removals from the S&P 500 over time have been companies we categorize as failures. These
companies have poor TSRs and below-average CFROIs. Since these stocks are often inexpensive, they can
represent value traps. The data also show that young companies, which are generally small and private, tend
to have a higher mortality rate than companies that make it to adolescence.
Finally, investors who have their results compared to a benchmark need to appreciate how that benchmark
changes. While most investors consider index funds to be passive, the indexes themselves change quite a bit
over time. Note that the S&P beats roughly 60 percent of active managers in an average year and does so
without any trading, macro forecasting, or limits on position or sector size.
The S&P 500 committee presents a very attractive trading strategy. Using historical numbers, investors who
bought the stocks that the committee removed from the S&P 500 (that still traded) and who sold short the
stocks entering the S&P 500 would have earned a tidy excess return. It appears the S&P 500 committee
behaves in a way that many investors do: It buys high and sells low.

February 7, 2017
Corporate Longevity 15
Appendix A
Methodology for tracking deletions from, and additions to, the S&P 500
Deletion: Stock’s CUSIP is not a part of index in Year (t0) but that CUSIP was a part of index in Year (t-1)
Addition: Stock’s CUSIP is a part of index in Year (t0) but that CUSIP was not a part of index in Year (t-1)
Because many companies change their stock tickers and names following structural transformations such as
acquisitions and break-ups, or even for purely cosmetic reasons, we need a way to identify changes to the
index that are not based solely on a company’s ticker or name. So, to identify additions and deletions to the
index, we compare the CUSIPs of all members in one year to the CUSIPs in the following year. A stock’s
CUSIP allows us to trace a stock’s lineage even if it has changed its name or ticker.
Determining the changes in the index range from the simple to the complex. For our period of analysis, some
CUSIPs, such as that of Johnson & Johnson, were in the index every year and were tied to the same ticker
and corporate name the whole time. Then there were examples like the CUSIP for Apple, Inc., which was tied
to Apple Computer until the company changed its name in 2007. And finally, there were more complex
examples that not only demonstrate the dynamic elements of our economy, but also show how the S&P
committee tries to capture and reflect such change.
A merger is a good example. In December 1999, Monsanto and Pharmacia & Upjohn agreed to merge and
form Pharmacia Corporation. In March 2000, S&P announced that it was going to remove Monsanto and
Pharmacia & Upjohn from the S&P 500 Index and replace them with Pharmacia Corporation and Linear
Technology. While this appears to be two changes to the index (i.e., two add/remove events), we only count it
as one because Monsanto’s CUSIP lived on in the combined entity. So, the only change is the replacement of
Pharmacia & Upjohn (71694110) with Linear Technology Corporation (53567810).
Removed: Monsanto Company (71713U10) and Pharmacia & Upjohn (71694110)
Added: Pharmacia Corp (71713U10) and Linear Technology (53567810)
Treatment of Multiple Share Classes
We do not count the inclusion of additional trading lines of a company’s stock as a change in the index. In
March 2014, S&P revised how they treat companies with more than one class of common stock. Historically,
companies could only be represented once in the index. The new methodology allows for multiple trading lines
of a company’s stock to be included in the index provided the lines meet certain requirements for liquidity and
materiality. So, while there are still only 500 companies in the S&P 500, the index can now have more than
500 share lines. There are 505 share lines in the index as of February 6, 2017.25
Determining Fiscal Years When Calculating Trailing and Future CFROIs
With knowledge of the month and year of the S&P’s announcement, we estimate the most recent fiscal year
for which results would have been known. That fiscal year constitutes the trailing “-1 year,” and we base the
other measurement periods off of that.

February 7, 2017
Corporate Longevity 16
Appendix B
Here’s a look at how S&P constructs and oversees the index. The criteria for additions are more
straightforward than the grounds for removal. While the committee has some discretion in the companies they
select, additions must satisfy a list of criteria for eligibility including standards for market capitalization, liquidity,
domicile, public float, and earnings quality. Here are the attributes as of January 2017:26
Universe: Domiciled in the U.S.
Market Capitalization: $5.3 billion or greater.
Public Float: A minimum of 50 percent of shares outstanding available for trading.
Financial Viability: Positive reported earnings in the most recent quarter and over the most
recent four quarters (in aggregate).
Liquidity and Price: Highly tradable stocks with active and deep markets. More specifically, “the
ratio of annual dollar value traded to float-adjusted market capitalization
should be 1.00 or greater, and the stock should trade a minimum of 250,000
shares in each of the six months leading up to the evaluation date.”
The grounds for removal, except in the case of M&A, are not as clear. For example, the committee may leave
alone an index constituent that violates one of the criteria for addition, as meeting all the criteria is not
necessary for continued membership. Through much of the index’s history, the S&P committee only modified
the list of companies when it had to remove a stock for reasons including bankruptcy or acquisition. But over
the past 20 years or so, the committee started to manage the index more actively by removing firms that no
longer effectively represented the U.S. market or the industry in which it operated.
S&P’s primer on methodology reveals a tension between a passive and an active approach. On the one hand,
S&P states that “turnover in index membership should be avoided when possible.” On the other hand, S&P
says it intends the index “to reflect the U.S. equity markets and . . . the U.S. economy” and to include “leading
companies in leading industries.” The S&P 500 Index does not simply include only the largest companies in
the U.S., though, and many of its constituents are not in the top 500 as measured by either market
capitalization or sales. To meet the goal of having the top companies, some turnover is clearly inevitable and
prompts the S&P committee to continually revise the index.

February 7, 2017
Corporate Longevity 17
Appendix C
Exhibit 16 is a log of all the changes in the S&P 500 Index from 2000-2016. When S&P announces multiple
changes on one day, it generally does not necessarily pair a specific addition with a specific removal.
Exhibit 16: Changes to S&P 500 Index, 2000-2016
Announced Implemented Addition Removal Removal Type Reason for Removal
12/29/1999 1/5/2000 Young & Rubicam General Instrument Corp M&A Acquisition by Motorola
1/24/2000 1/28/2000 Harley-Davidson Fleetwood Enterprises Failure Lack of representation
1/24/2000 1/28/2000 Biogen, Inc Foster Wheeler Failure Lack of representation
1/26/2000 1/28/2000 Conexant Systems Consolidated Natural Gas M&A Bought by Dominion Resources
3/8/2000 3/15/2000 Sabre Holdings Corp Serv ice Corp. International Failure Lack of representation
3/27/2000 3/31/2000 Linear Technology Corp Pharmacia & Upjohn, Inc M&A Merger with Monsanto
3/29/2000 3/31/2000 Veritas Software Pep Boys Failure Lack of representation
4/12/2000 4/17/2000 Altera Corp Atlantic Richfield M&A Acquisition by BP Amoco
4/12/2000 6/5/2000 Convergys Corp Times Mirror M&A Acquisition by Tribune Company
5/1/2000 5/4/2000 Siebel Systems, Inc CBS Corp M&A Acquisition by Viacom
5/2/2000 5/9/2000 Maxim Integrated Products Jostens Inc M&A Acquisition by Investcorp
5/3/2000 5/4/2000 Sapient Corp Reynolds Metals M&A Acquisition by Alcoa
5/11/2000 6/16/2000 MedImmune Inc Central & South West M&A Acquisition by American Electric Power
5/25/2000 6/2/2000 Agilent Technologies NACCO Ind. Cl. A Failure Lack of representation
5/25/2000 6/21/2000 Sanmina Corp Warner-Lambert M&A Acquisition by Pfizer
5/26/2000 5/31/2000 American Power Conversion Mirage Resorts M&A Acquisition by MGM Grand
6/5/2000 6/7/2000 Starbucks Corp Shared Medical Systems M&A Acquisition by Siemens
6/13/2000 6/20/2000 Tiffany & Co Silicon Graphics Other Spins off large interest in MIPS Technologies
6/13/2000 6/16/2000 Novellus Systems Champion International M&A Acquisition by International Paper
6/15/2000 6/16/2000 Charter One Financial MediaOne Group Inc M&A Acquisition by AT&T Corp
6/19/2000 6/30/2000 Broadcom Corporation GTE Corp M&A Merger with Bell Atlantic
6/21/2000 6/28/2000 Visteon Corp IKON Office Solutions Failure Lack of representation
6/21/2000 6/28/2000 Mercury Interactive Milacron Inc Failure Market cap changes
6/27/2000 6/30/2000 Qwest Communications Int'l US West Inc M&A Merger with Qwest
7/6/2000 7/12/2000 Stilwell Financial Kansas City Southern Ind Other Spins off Stilwell Financial
7/6/2000 7/14/2000 CIT Group, Inc Union Pacific Resources Group M&A Acquisition by Anadarko Petroleum
7/19/2000 7/26/2000 JDS Uniphase Corp Rite Aid Failure Lack of representation
7/20/2000 7/27/2000 Palm Inc 3Com Corp Other Spins off large interest in Palm
8/7/2000 8/21/2000 KeySpan Corp New Century Energies M&A Acquisition by Northern States Power
8/23/2000 8/29/2000 Devon Energy Corp Great A & P Failure Market cap changes
9/25/2000 9/29/2000 Avaya Inc. Owens Corning Failure Lack of representation
9/25/2000 10/2/2000 Dynegy Inc BestFoods Inc M&A Acquisition by Unilever
9/27/2000 10/3/2000 King Pharmaceuticals Young & Rubicam M&A Acquisition by WPP Group
10/3/2000 10/18/2000 Nabors Industries Mallinckrodt Inc M&A Acquisition by Tyco International
10/12/2000 10/16/2000 Power-One Inc Unicom Corp M&A Acquisition by PECO Energy
10/16/2000 10/23/2000 BroadVision Inc PaineWebber Group M&A Acquisition by UBS
10/25/2000 11/1/2000 NiSource Inc Columbia Energy Group M&A Acquisition by NiSource
10/31/2000 11/1/2000 EOG Resources Eastern Enterprises M&A Acquisition by KeySpan Energy
11/14/2000 11/21/2000 Forest Laboratories Seagate Technology M&A Acquisition by Veritas
11/15/2000 11/16/2000 Starwood Hotels & Resorts Armstrong World Failure Lack of representation
11/20/2000 11/24/2000 Chiron Corp Fort James Corp M&A Acquisition by Georgia Pacific
11/27/2000 11/30/2000 Calpine Corp Florida Progress M&A Acquisition by CP&L Energy
11/29/2000 12/11/2000 MetLife Inc Seagram Co. Ltd M&A Acquisition by Vivendi
12/1/2000 12/1/2000 Robert Half International Associates First Capital M&A Acquisition by Citigroup
12/4/2000 12/8/2000 Allegheny Energy Inc Bethlehem Steel Failure Lack of representation
12/4/2000 12/8/2000 Ambac Financial Group Crown Cork & Seal Failure Lack of representation
12/4/2000 12/8/2000 Intuit, Inc Owens-Illinois Failure Lack of representation
12/4/2000 12/8/2000 Symbol Technologies Grace (W.R.) & Co. (New) Failure Lack of representation
2000

February 7, 2017
Corporate Longevity 18
Announced Implemented Addition Removal Removal Type Reason for Removal
12/5/2000 12/11/2000 QLogic Corp Polaroid Corp Failure Market cap changes
12/5/2000 12/11/2000 Stryker Corp Russell Corp Failure Market cap changes
12/5/2000 12/11/2000 Vitesse Semiconductor Springs Industries Inc Failure Market cap changes
12/7/2000 12/13/2000 Aetna Inc. (New) Aetna Inc. (Old) OtherAetna (old) sells financials business, spins off U.S.
healthcare div ision, which becomes Aetna (new)
12/8/2000 12/12/2000 Kinder Morgan Inc Nabisco Group Hldgs M&A Acquisition by RJ Reynolds
12/12/2000 12/21/2000 Fluor Corp. Massey Energy Other Spins off Fluor
12/19/2000 12/29/2000 Applied Micro Circuits Morgan (J.P.) & Co M&A Acquisition by Chase Manhattan
12/19/2000 1/12/2001 Noble Drilling Corp Time Warner Inc M&A Acquisition by AOL
12/27/2000 1/30/2001 Jabil Circuit Coastal Corp M&A Acquisition by El Paso
2/5/2001 2/7/2001 Univ ision Communications Union Carbide M&A Acquisition by Dow Chemical
2/21/2001 2/26/2001 Citizens Communications U.S. Bancorp M&A Acquisition by Firstar
2/27/2001 2/28/2001 Cintas Corporation Summit Bancorp M&A Acquisition by FleetBoston Financial Corp.
3/26/2001 3/30/2001 Concord EFS Inc Ceridian Corp Other Splits into Ceridian and Arbitron
3/27/2001 4/2/2001 Mirant Corporation Briggs & Stratton Failure Market cap changes
3/27/2001 3/30/2001 FIserv Inc Old Kent Financial M&A Acquisition by Fifth Third Bancorp
5/7/2001 5/11/2001 Pepsi Bottling Group Adaptec, Inc Other Spins off Roxio
5/22/2001 6/4/2001 TMP Worldwide CIT Group, Inc M&A Acquisition by Tyco International
5/30/2001 6/27/2001 John Hancock Financial Harcourt General Inc M&A Tender offer from Reed Elsev ier
6/19/2001 6/22/2001 Zions Bancorp ALZA Corp. Cl. A M&A Acquisition by Johnson & Johnson
6/25/2001 6/29/2001 Rockwell Collins Longs Drug Stores Failure Market cap changes
6/27/2001 7/6/2001 AT&T Wireless Serv ices Potlatch Corp Failure Market cap changes
7/30/2001 8/3/2001 Family Dollar Stores Cabletron Systems Other Spins off large interest in Riverstone Networks
7/31/2001 8/6/2001 Zimmer Holdings Timken Co Failure Market cap changes
8/1/2001 8/2/2001 PMC-Sierra Inc Quaker Oats M&A Acquisition by PepsiCo
8/22/2001 8/30/2001 CIENA Corp American General M&A Acquisition by AIG
8/27/2001 8/29/2001 AmerisourceBergen Corp ONEOK Inc Failure Market cap changes
8/27/2001 9/4/2001 XL Capital Wachovia Corp M&A Acquisition by First Union Corp
8/29/2001 8/31/2001 International Game Technology BroadVision Inc Failure Lack of representation
9/17/2001 9/20/2001 Immunex Corp Tosco Corp M&A Acquisition by Philips Petroleum
10/3/2001 10/9/2001 Equity Office Properties Texaco Inc M&A Acquisition by Chevron
10/4/2001 10/9/2001 TECO Energy Global Crossing Ltd Failure Lack of representation
11/1/2001 11/6/2001 Health Management Assoc GPU Inc M&A Acquisition by FirstEnergy Corp.
11/27/2001 11/30/2001 Equity Residential Prop Tr National Serv ice Ind Other Spins off Acuity Brands
11/28/2001 11/29/2001 NVIDIA Corp Enron Corp Failure Lack of representation
12/10/2001 12/14/2001 Jones Apparel Group Homestake Mining M&A Acquisition by Barrick Gold
12/12/2001 12/12/2001 Genzyme Corp Ralston-Ralston Purina Gp M&A Acquisition by Nestle
12/27/2001 12/31/2001 Waters Corporation FMC Corp Other Spins off FMC Technologies
1/16/2002 1/16/2002 Plum Creek Timber Co. Kmart Failure Lack of representation
1/23/2002 1/29/2002 ACE Limited Mead Corp M&A Merger with Westvaco
1/23/2002 1/31/2002 Rational Software Niagara Mohawk Power M&A Acquisition by National Grid Group
2/6/2002 2/8/2002 Marshall & Ilsley Corp. Willamette Industries M&A Acquisition by Weyerhaeuser
5/2/2002 5/3/2002 First Tennessee National COMPAQ Computer M&A Acquisition by Hewlett-Packard
5/10/2002 5/10/2002 American Standard Sapient Corp Failure No longer meets standards of inclusion
5/13/2002 5/14/2002 BJ Serv ices USAirways Group Inc Failure Lack of representation
5/13/2002 5/14/2002 Apollo Group WorldCom Inc.-WorldCom Group Failure Lack of representation
6/20/2002 6/26/2002 Simon Property Group, Inc Conexant Systems Other Reorganization
7/9/2002 7/19/2002 Prudential Financial Alcan Inc Other Not U.S. company
7/9/2002 7/19/2002 United Parcel Serv ice Barrick Gold Corp Other Not U.S. company
7/9/2002 7/19/2002 eBay Inc. Inco, Ltd Other Not U.S. company
7/9/2002 7/19/2002 Electronic Arts Nortel Networks Corp Hldg Co Other Not U.S. company
7/9/2002 7/19/2002 SunGard Data Systems Placer Dome Inc Other Not U.S. company
7/9/2002 7/19/2002 Goldman Sachs Group Royal Dutch Petroleum Other Not U.S. company
7/9/2002 7/19/2002 Principal Financial Group Unilever N.V Other Not U.S. company
7/12/2002 7/16/2002 North Fork Bancorporation Immunex Corp M&A Acquisition by Amgen
7/24/2002 7/24/2002 Anthem, Inc. Conseco Inc Failure Market cap changes
8/7/2002 8/13/2002 Monsanto Co. Palm Inc. Failure Market cap changes
8/14/2002 8/20/2002 Travelers Property Casualty Corp Vitesse Semiconductor Failure Market cap changes
8/30/2002 9/3/2002 RJ Reynolds Tobacco Conoco Inc M&A Merger with Philips
11/13/2002 11/18/2002 AT&T Comcast Corp. Comcast Class A Special M&AAT&T spins off broadband unit, merges it w/ Comcast to
form AT&T Comcast
12/4/2002 12/11/2002 Quest Diagnostics TRW Inc M&A Acquisition by Northrop Grumman
2001
2002

February 7, 2017
Corporate Longevity 19
Announced Implemented Addition Removal Removal Type Reason for Removal
2/19/2003 2/21/2003 AutoNation Inc. Rational Software M&A Acquisition by IBM
3/11/2003 3/13/2003 Apartment Investment & Management Co AMR Corp. Failure Market cap changes
3/19/2003 3/20/2003 McCormick & Company HEALTHSOUTH Corp. Failure Allegations company v iolated securities laws
3/25/2003 3/28/2003 Symantec Corp. Household International M&A Acquisition by HSBC Holdings
4/9/2003 4/15/2003 Federated Investors Inc. Pharmacia Corp. M&A Acquisition by Pfizer
7/15/2003 7/16/2003 ProLogis Mirant Corp Failure Bankruptcy
8/13/2003 8/19/2003 Medco Health Solutions Inc. McDermott International Failure Market cap changes
9/23/2003 9/25/2003 Express Scripts Quintiles Transnational M&A Taken private
11/6/2003 11/12/2003 BIOGEN IDEC Biogen Inc. M&A Merger w/ IDEC becoming BIOGEN IDEC
2/23/2004 2/26/2004 M&T Bank Corp. Concord EFS Inc. M&A Acquisition by First Data Corp
3/16/2004 3/24/2004 Caremark Rx Tupperware Corp. Failure Market cap changes
3/25/2004 3/31/2004 E*Trade Financial FleetBoston Financial M&A Acquisition by Bank of America
3/29/2004 4/1/2004 Affiliated Computer Serv ices Travelers Property Casualty M&A Acqusition by St. Paul Companies
4/19/2004 4/22/2004 Mylan Laboratories Sprint PCS Other Sprint Corp eliminated Sprint PCS tracking stock
4/19/2004 4/28/2004 Valero Energy John Hancock Financial Serv ices M&A Acquisition by Manulife Financial Corp
4/26/2004 4/30/2004 Hospira Inc. American Greetings Failure Market cap changes
6/24/2004 6/30/2004 Sovereign Bancorp Union Planters Corporation M&A Merger with Regions Financial
6/26/2004 6/30/2004 Gilead Sciences Bank One Corp. M&A Acquisition by JP Morgan Chase
7/26/2004 8/2/2004 Fisher Scientific Thomas & Betts Failure Market cap changes
8/26/2004 8/31/2004 Coach Inc. Charter One Financial M&A Acquisition by Royal Bank of Scotland
10/25/2004 10/29/2004 Laboratory Corp of America Holdings South Trust Corp. M&A Acquisition by Wachovia
10/25/2004 10/26/2004 CIT Group AT&T Wireless M&A Acquisition by Cingular Wireless
11/10/2004 11/30/2004 L-3 Communications Holdings WellPoint Health Networks M&A Acquisition by Anthem
11/29/2004 12/2/2004 Freescale Semiconductor Inc. Winn-Dixie Failure Market cap changes
12/8/2004 12/17/2004 Archstone-Smith Trust Crane Co. Failure Market cap changes
12/8/2004 12/17/2004 News Corp. Deluxe Corp. Failure Market cap changes
12/8/2004 12/17/2004 Compass Bancshares Worthington Industries Failure Market cap changes
12/21/2004 12/28/2004 XTO Energy PeopleSoft Inc. M&A Acquisition by Oracle
3/7/2005 3/11/2005 National Oilwell Varco Power-One Failure Market cap changes
3/21/2005 3/24/2005 Sears Holdings Corp. Sears Roebuck & Co. M&A Merger with Kmart (creating Sears Holdings)
6/22/2005 7/1/2005 D.R. Horton Veritas Software M&A Acquisition by Symantec
6/28/2005 7/1/2005 Constellation Brands Great Lakes Chemical M&A Acquisition by Crompton Corp
7/12/2005 7/21/2005 Weatherford Int'l Toys "R" US M&A Taken private
7/26/2005 8/11/2005 Vornado Realty Trust SunGard Data Systems M&A Taken private
8/4/2005 8/12/2005 Murphy Oil Nextel Communications M&A Acquisition by Sprint
8/4/2005 8/10/2005 Tyson Foods Unocal Corp. M&A Acquisition by Chevron
8/15/2005 8/18/2005 Public Storage Delta Air Lines Failure Market cap changes
8/29/2005 8/29/2005 Coventry Health Care Inc. May Dept. Stores M&A Acquisition by Federated Department Stores
9/26/2005 9/30/2005 Ameriprise Financial Prov idian Financial M&A Acquisition by Washington Mutual
9/30/2005 10/3/2005 Lennar Corp. Gillette Co. M&A Acquisition by Procter & Gamble
10/7/2005 10/10/2005 Patterson Companies Inc. Delphi Corp. Failure Bankruptcy
11/14/2005 11/18/2005 Amazon.com AT&T Corp. M&A Acquisition by SBC Communications
11/29/2005 12/1/2005 Genworth Financial Inc. Calpine Corp. Failure Market cap changes
12/8/2005 12/15/2005 E.W. Scripps Georgia-Pacific Group M&A Acquisition by Koch Industries
12/27/2005 12/30/2005 Viacom Inc. (New) Visteon Corp. Failure Market Cap changes
12/27/2005 12/30/2005 Whole Foods Market MBNA Corp. M&A Acquisition by Bank of America
1/3/2006 1/4/2006 Estee Lauder Mercury Interactive Failure Delisting by Nasdaq
1/25/2006 1/31/2006 VeriSign Inc. Reebok Int'l M&A Acquisition by Adidas-Salomon
1/25/2006 1/31/2006 Harman Int'l Siebel Systems Inc. M&A Acquisition by Oracle
2/21/2006 2/24/2006 Barr Pharmaceuticals Inc. Scientific-Atlanta M&A Acquisition by Cisco
3/1/2006 3/2/2006 Chesapeake Energy Corp. Dana Corp. Failure Market cap changes
3/26/2006 3/31/2006 Google Inc. Burlington Resources Inc. M&A Acquisition by ConocoPhillips
3/28/2006 4/3/2006 Kimco Realty Corp. Jefferson-PilotCorp. M&A Acquisition by Lincoln National
3/28/2006 3/31/2006 Boston Properties Cinergy Corp. M&A Acquisition by Duke Energy
3/29/2006 3/31/2006 Dean Foods Maytag Corp. M&A Acquisition by Whirlpool
4/11/2006 4/21/2006 Legg Mason Guidant Co. M&A Acquisition by Boston Scientific
4/19/2006 4/19/2006 SanDisk Corp. Chiron Corp. M&A Acquisition by Novartis
5/10/2006 5/17/2006 Embarq Corp. Applied Micro Circuits Corp. Failure Market cap changes
5/25/2006 6/1/2006 Juniper Neworks Inc. Albertson's Inc. M&A Acquisition by SuperValu
5/31/2006 6/5/2006 Commerce Bancorp Engelhard Corp. M&A Acquisition by BASF
6/22/2006 6/27/2006 CONSOL Energy Inc. Knight-Ridder Inc. M&A Acquisition by McClatchy
2006
2003
2004
2005

February 7, 2017
Corporate Longevity 20
Announced Implemented Addition Removal Removal Type Reason for Removal
7/11/2006 7/17/2006 Windstream Corp. Cooper Tire & Rubber Co. Failure Market cap changes
7/24/2006 7/31/2006 Realogy Corp. Gateway Inc. Failure Market cap changes
7/24/2006 7/31/2006 Wyndham Worldwide Corp. Cendant Corp. Other Cendant spins off Wyndham and Realogy
8/3/2006 8/10/2006 Chicago Mercantile Exchange Holdings Kerr-McGee Corp. M&A Acquisition by Anadarko Petroleum
9/25/2006 9/29/2006 Western Union Co. Andrew Corp. Failure Market cap changes
9/27/2006 9/29/2006 Smith International Golden West Financial M&A Acquisition by Wachovia
10/30/2006 11/3/2006 Celgene Corp. AmSouth Bancorp M&A Acquisition by Regions Financial
11/2/2006 11/9/2006 Fidelity National Information Serv ices Louisiana-Pacific Corp. Failure Market cap changes
11/6/2006 11/9/2006 CB Richard Ellis Group Fisher Scientific M&A Acquisition by Thermo Electron Corp
11/13/2006 11/16/2006 Cognizant Technology Solutions Alberto-Culver Co. (old) Other Splits up
11/15/2006 11/17/2006 Peabody Energy Corp HCA Inc. M&A Taken private
11/21/2006 12/1/2006 DirecTV Group Inc. Freescale Semiconductor Inc. M&A Taken private
11/22/2006 11/30/2006 IAC/InterActive Corp. Lucent Technologies M&A Acquisition by Alcatel
11/23/2006 11/30/2006 Questar Corp. North Fork Bancorp. Inc. M&A Acquisition by Capital One Financial
12/15/2006 12/19/2006 Terex Corp. Navistar International Failure Delisting by NYSE
12/20/2006 12/29/2006 Spectra Energy Corp. Parametric Technology Failure Market cap changes
1/2/2007 1/3/2007 ENSCO International BellSouth Corp. M&A Acquisition by AT&T
1/3/2007 1/9/2007 AvalonBay Communities Symbol Technologies M&A Acquisition by Motorola
1/31/2007 2/1/2007 Polo Ralph Lauren Corp. Comverse Technology Failure Delisting by Nasdaq
2/5/2007 2/14/2007 Hudson City Bancorp. American Power Conversion M&A Acquisition by Schneider Electric
2/7/2007 2/21/2007 Integrys Energy Group Inc. Peoples Energy M&AAcquisition by WPS Resources, which changes its name
to Integrys
2/7/2007 2/9/2007 Varian Medical Systems Equity Office Properties M&A Acquisition by Blackstone Group
2/26/2007 3/1/2007 C.H. Robinson Worldwide Health Management Assoc. Other Market cap changes (after payout of special div idend)
3/12/2007 3/19/2007 Host Hotels & Resorts Phelps Dodge M&A Acquisition by Freeport-McMoRan Copper & Gold
3/16/2007 3/20/2007 Developers Diversified Realty Caremark Rx Inc. M&A Acquisition by CVS
3/22/2007 3/30/2007 Kraft Foods Inc Sabre Holding Corp. M&A Taken private
3/27/2007 3/28/2007 Abercrombie & Fitch Co. Univ ision Communications M&A Taken private
4/2/2007 4/9/2007 Assurant Inc. Realogy Corp. M&A Taken private
5/22/2007 5/30/2007 MEMC Electronic Materials Kinder Morgan M&A Taken private
5/30/2007 5/31/2007 Precision Castparts MedImmune Inc. M&A Acquisition by AstraZeneca
6/21/2007 6/29/2007 Tyco Electronics PMC-Sierra Failure Market cap changes
6/21/2007 6/29/2007 Covidien Ltd. Sanmina-SCI Corp. Failure Market cap changes
6/21/2007 6/29/2007 Discover Financial Serv ices ADC Telecomm. Inc. Failure Market cap changes
6/25/2007 6/29/2007 General Growth Properties Mellon Financial M&A Merger with Bank of New York
7/2/2007 7/6/2007 American Capital Strategies Dollar General M&A Taken private
7/9/2007 7/11/2007 Akamai Technologies Biomet Inc. M&A Taken private
8/16/2007 8/24/2007 Leucadia National Corp. Keyspan Energy M&A Acquisition by National Grid Plc
8/30/2007 9/7/2007 Microchip Technology Compass Bancshares M&A Acquisition by Banco Bilbao Vizcaya Argentaria
9/24/2007 9/26/2007 Tesoro Petroleum Co. Maxim Integrated Products Failure Delisting by Nasdaq
9/24/2007 9/28/2007 Teradata Corp. NCR Corp. Other Spins off Teradata
9/24/2007 10/1/2007 Expedia Inc. Solectron Corp. M&A Acquisition by Flextronics
9/24/2007 9/25/2007 IntercontinentalExchange Inc. First Data Corp. M&A Taken private
10/1/2007 10/5/2007 Noble Energy Inc. Archstone-Smith Trust M&A Taken private
10/8/2007 10/9/2007 Expeditors Int'l. TXU Corp. M&A Taken private
10/18/2007 10/26/2007 Titanium Metals Corp. Bausch & Lomb Inc. M&A Taken private
10/18/2007 10/24/2007 NYSE Euronext Hilton Hotels M&A Taken private
10/23/2007 10/25/2007 Jacobs Engineering Group Avaya Inc. M&A Taken private
11/1/2007 11/8/2007 Pepco Holdings Inc. Manor Care Inc. M&A Taken private
11/8/2007 11/16/2007 American Tower Corp. ALLTEL Corp. M&A Taken private
11/8/2007 11/15/2007 Manitowoc Co. Tektronix Inc. M&A Acquisition by Danaher
12/5/2007 12/13/2007 GameStop Corp. Dow Jones & Co. Inc. M&A Acquisition by News Corp
12/19/2007 12/28/2007 Washington Post Co. Temple-Inland Inc. Other Splits up
12/19/2007 12/31/2007 Total System Serv ices Synovus Financial Other Spins out Total System Serv ices
12/20/2007 12/20/2007 Range Resources Corp. Tribune Co. M&A Taken private
2007

February 7, 2017
Corporate Longevity 21
Announced Implemented Addition Removal Removal Type Reason for Removal
1/17/2008 1/28/2008 Cameron International Harrah's Entertainment M&A Taken private
3/20/2008 3/28/2008 Phillip Morris International Inc. Circuit City Stores Inc. Failure Fails to meet consistent profit criteria
3/20/2008 3/31/2008 HCP Inc. Commerce Bancorp M&A Acquisition by Toronto-Dominion Bank
5/22/2008 6/2/2008 Intuitive Surgical Inc. The Bear Stearns Companies Inc. M&A Acquisition by JP Morgan
5/27/2008 6/5/2008 Southwestern Energy Co. Trane Inc. M&A Acquisition by Ingersoll-Rand
6/3/2008 6/10/2008 Lorillard Inc. Ambac Financial Group Inc. Failure Market cap changes
6/12/2008 6/20/2008 Massey Energy Co. OfficeMax Inc. Failure Market cap changes
6/12/2008 6/20/2008 Cabot Oil & Gas Corp. Brunswick Corp. Failure Market cap changes
6/24/2008 6/30/2008 Scripps Networks Interactive E.W. Scripps Other Splits up
6/26/2008 6/30/2008 AK Steel Holding Corp. Countrywide Financial Corp. M&A Acquisition by Bank of America
7/10/2008 7/17/2008 MasterCard Inc. ACE Ltd. Other Redomesticates to Switzerland
7/24/2008 7/30/2008 DaVita Inc. Clear Channel Communications Inc. M&A Taken private
8/13/2008 8/20/2008 Invesco Ltd. IAC/InterActiveCorp. Other Splits up
8/25/2008 8/26/2008 CF Industries Electronics Data Systems M&A Acquisition by Hewlett-Packard
9/9/2008 9/10/2008 Salesforce.com Federal Home Loan Mortgage Corp. Failure Market cap changes (placed into conservatorship)
9/9/2008 9/10/2008 Fastenal Co.Federal National Mortgage
AssociationFailure Market cap changes (placed into conservatorship)
9/15/2008 9/19/2008 Harris Corp. Lehman Brothers Holdings Inc. Failure Bankruptcy
9/22/2008 9/26/2008 Amphenol Corp. Wendy's International Inc. FailureMarket cap changes (too small even after acquisition by
Triarc)
9/22/2008 9/22/2008 Pioneer Natural Resources Co. Safeco Corp. M&A Acquisition by Liberty Mutual Group
9/26/2008 9/29/2008 Flowserve Corp. Washington Mutual Inc. Failure Placed into receivership
9/29/2008 10/3/2008 Dr. Pepper Snapple Group Inc. Wm. Wrigley Jr. Company M&A Acquisition by Mars
10/16/2008 10/21/2008 NASDAQ OMX Group Inc. Dillard's Inc. Failure Market cap changes
10/28/2008 10/30/2008 Wisconsin Energy Corp. MGIC Investment Failure Market cap changes
10/30/2008 11/5/2008 J.M. Smucker Co. Terex Corporation Failure Market cap changes
11/7/2008 11/10/2008 People's United Financial Inc. Unisys Corp. Failure Market cap changes
11/10/2008 11/13/2008 DENTSPLY International Inc. Hercules Inc. FailureMarket cap changes (too small even after acquisition by
Ashland)
11/10/2008 11/13/2008 Wynn Resorts Ltd. Ashland Inc. FailureMarket cap changes (too small even after it acquired
Hercules)
11/11/2008 11/12/2008 Cephalon Inc. General Growth Properties Inc. Failure Market cap changes
11/17/2008 11/21/2008 Life Technologies Corp. Applied Biosystems Inc. M&A Acquisition by Inv itrogen forms Life Technologies
11/17/2008 11/18/2008 Stericycle Inc. Anheuser-Busch M&A Acquisition by InBev
11/26/2008 12/1/2008 The Dun & Bradstreet Corp. Liz Claiborne Inc. Failure Market cap changes
11/26/2008 12/3/2008 Republic Serv ices Inc. Allied Waste Industries Inc. M&A Acquisition by Republic Serv ices
12/11/2008 12/18/2008 Equitable Resources Inc. Transocean Inc. Other Redomesticates to Switzerland
12/18/2008 12/22/2008 McAfee Inc. Barr Pharmaceuticals Inc. M&A Acquisition by Teva
12/23/2008 12/31/2008 FLIR Systems Inc National City Corp. M&A Acquisition by PNC Financial Serv ices Group
12/23/2008 12/31/2008 Owens-Illinois Inc Wachovia Corp. (New) M&A Acquisition by Wells Fargo
12/23/2008 12/31/2008 SCANA Corp Merrill Lynch M&A Acquisition by Bank of America
12/29/2008 1/5/2009 Iron Mountain Inc. UST Inc. M&A Acquisition by Altria
1/22/2009 1/29/2009 Health Care REIT Sovereign Bancorp. M&A Acquisition by Banco Santander
2/13/2009 2/25/2009 Diamond Offshore Drilling Inc. Weatherford International Ltd. Other Redomesticates to Switzerland
2/24/2009 3/3/2009 Ventas Inc. Jones Apparel Group Inc. Failure Market cap changes
2/24/2009 3/3/2009 Hormel Foods Corp. American Capital Ltd. Failure Market cap changes
3/5/2009 3/16/2009 Northeast Utilities Tyco International Ltd. Other Redomesticates to Switzerland
3/18/2009 3/27/2009 Time Warner Cable Inc. Developers Diversified Realty Corp. Failure Market cap changes
3/18/2009 3/26/2009 O'Reilly Automotive Inc. Noble Corp. Other Redomesticates to Switzerland
3/25/2009 4/1/2009 Denbury Resources Inc. Rohm and Haas Co. M&A Acquisition by Dow Chemical
5/21/2009 6/30/2009 Western Digital Embarq Corp. M&A Acquisition by CenturyTel
5/28/2009 6/4/2009 FMC Technologies Inc. Covidien Ltd. Other Redomesticates to Ireland
6/1/2009 6/2/2009 DeVry Inc. General Motors Corp. Failure Bankruptcy
6/4/2009 6/30/2009 Quanta Serv ices Inc. Ingersoll-Rand Company Ltd. Other Redomesticates to Ireland
6/22/2009 6/25/2009 MetroPCS Communications Inc. Tyco Electronics Ltd. Other Redomesticates to Switzerland
7/17/2009 7/24/2009 Red Hat Inc. CIT Group Inc. Failure Market cap changes
8/11/2009 8/18/2009 FMC Corp. Centex Corp. M&A Acquisition by Pulte Homes
8/24/2009 8/31/2009 CareFusion Corp. The Manitowoc Company Inc. Failure Market cap changes
8/28/2009 9/8/2009 Airgas Inc Cooper Industries Ltd. Other Redomesticates to Ireland
10/1/2009 10/15/2009 First Solar Inc Wyeth M&A Acquisition by Pfizer
10/29/2009 11/3/2009 Priceline.com Schering-Plough Corp. M&A Acquisition by Merck & Co.
2008
2009

February 7, 2017
Corporate Longevity 22
Announced Implemented Addition Removal Removal Type Reason for Removal
12/11/2009 12/18/2009 Cliffs Natural Resources Inc KB Home Failure Market cap changes
12/11/2009 12/18/2009 Mead Johnson Nutrition Co MBIA Inc. Failure Market cap changes
12/11/2009 12/18/2009 Ross Stores Inc Dynegy Inc. Failure Market cap changes
12/11/2009 12/18/2009 SAIC Inc Convergys Corp. Failure Market cap changes
12/11/2009 12/18/2009 Visa Inc Ciena Corp. Failure Market cap changes
12/15/2009 12/22/2009 Roper Industries Inc ENSCO Int'l Other Redomesticates to U.K.
1/21/2010 1/28/2010 NRG Energy Sun Microsystems Inc M&A Acquisition by Oracle
1/26/2010 2/12/2010 Berkshire Hathaway B Burlington Northern Santa Fe Co M&A Acquisition by Berkshire Hathaway
1/29/2010 2/8/2010 Urban Outfitters Affiliated Computer Serv ices M&A Acquisition by Xerox
2/16/2010 2/26/2010 Discovery Communications Inc Pepsi Bottling Group Inc M&A Acquisition by PepsiCo
2/22/2010 2/26/2010 Helmerich & Payne Inc IMS Health Inc M&A Taken private
3/3/2010 3/12/2010 ONEOK Inc Black & Decker Corp M&A Acquisition by The Stanley Works
3/18/2010 4/29/2010 Cerner Corp. BJ Serv ices Company M&A Acquisition by Baker Hughes Inc.
6/22/2010 6/25/2010 CarMax, Inc. XTO Energy Inc. M&A Acquisition by ExxonMobil Inc.
6/23/2010 6/30/2010 QEP Resources Inc Questar Corp. Other Spins off QEP Resources
7/8/2010 7/14/2010 Ace Limited Millipore Inc. M&A Acquisition by Merck KGaA
8/19/2010 8/26/2010 Tyco International Ltd. Smith International Inc. M&A Acquisition by Schlumberger Ltd.
11/10/2010 11/16/2010 Ingersoll-Rand Plc Pactiv Corporation M&A Acquisition by Reynolds Group Holdings
12/9/2010 12/17/2010 F5 Networks Inc. The New York Times Co. Failure Market cap changes
12/9/2010 12/17/2010 Netflix Inc. Office Depot Inc. Failure Market cap changes
12/9/2010 12/17/2010 Newfield Exploration Co. Eastman Kodak Co. Failure Market cap changes
12/9/2010 12/17/2010 Cablev ision Systems Corp. King Pharmaceuticals Inc. M&A Acquisition by Pfizer Inc.
12/22/2010 1/3/2011 Motorola Mobility Holdings, Inc Meredith Corp Failure Market cap changes
1/11/2011 1/14/2011 Noble Corp QLogic Corp Failure Market cap changes
1/26/2011 2/28/2011 Covidien Plc McAfee Inc. M&A Acquisition by Intel Corp.
2/16/2011 2/25/2011 Joy Global Inc. Allegheny Energy Inc. M&A Acquisition by First Energy
3/24/2011 3/31/2011 Edwards Lifesciences Qwest Communications M&A Acquisition by CenturyLink
3/29/2011 4/1/2011 BlackRock Genzyme Corp. M&A Acquisition by Sanofi-Aventis
4/20/2011 4/27/2011 Chipotle Novell, Inc. M&A Taken private
5/24/2011 6/1/2011 Alpha Natural Resources, Inc. Massey Energy Company M&A Acquisition by Alpha Natural Resources
5/26/2011 6/2/2011 ProLogis Inc. ProLogis M&AAcquisition by AMB Property (then renamed ProLogis
Inc.)
6/23/2011 6/30/2011 Marathon Petroleum Corp RadioShack Corp. Failure Market cap changes
6/27/2011 7/5/2011 Accenture plc Marshall & Ilsley Corp. M&A Acquisition by Bank of Montreal
9/21/2011 9/23/2011 The Mosaic Company National Semiconductor Corp. M&A Acquisition by Texas Instruments
10/11/2011 10/14/2011 TE Connectiv ity Ltd. Cephalon Inc. M&A Acquisition by Teva Pharmaceutical Industries
10/24/2011 10/31/2011 Xylem Inc. ITT Corp. Other Spins off Xylem
11/18/2011 11/22/2011 Cooper Industries Janus Capital Group Failure Market cap changes
12/8/2011 12/16/2011 BorgWarner Inc. AK Steel Holding Corp. Failure Market cap changes
12/8/2011 12/16/2011 Perrigo Co. Monster Worldwide Inc. Failure Market cap changes
12/8/2011 12/16/2011 Dollar Tree Inc. MEMC Electronic Materials Inc. Failure Market cap changes
12/8/2011 12/12/2011 AGL Resources Inc. Nicor Inc. M&A Acquisition by AGL Resources
12/14/2011 12/20/2011 TripAdvisor Inc. Tellabs Inc. Failure Market cap changes
12/22/2011 12/30/2011 WPX Energy Inc. Compuware Corp Failure Market cap changes
3/12/2012 3/13/2012 Crown Castle International Corp. Constellation Energy Group M&A Acquisition by Exelon Corp.
4/2/2012 4/3/2012 Fossil, Inc. Medco Health Solutions Inc. M&A Acquisition by Express Scripts
4/23/2012 4/23/2012 Phillips 66 Supervalu Inc. Failure Market cap changes
5/10/2012 6/5/2012 Lam Research Novellus Systems M&A Acquisition by Lam Research
5/17/2012 5/24/2012 Kinder Morgan El Paso Corp. M&A Acquisition by Kinder Morgan
5/21/2012 5/24/2012 Alexion Pharmaceuticals Motorola Mobility M&A Acquisition by Google
6/21/2012 6/29/2012 Monster Beverage Sara Lee Corp. Other Splits up
6/25/2012 6/29/2012 Seagate Technology Progress Energy Inc M&A Acquisition by Duke Energy
7/26/2012 7/30/2012 Ensco plc Goodrich Corporation M&A Acquisition by United Technologies
8/29/2012 9/4/2012 LyondellBasell Sears Holdings Corporation Other Below public float threshold
9/24/2012 10/1/2012 ADT Corp Lexmark Int'l Inc Failure Market cap changes
9/24/2012 9/28/2012 Pentair Ltd. DeVry, Inc. Failure Market cap changes
9/25/2012 10/1/2012 Kraft Foods Group Alpha Natural Resources Failure Market cap changes
10/1/2012 10/4/2012 PetSmart, Inc. Sunoco Inc. M&A Acquisition by Energy Transfer Partners
11/26/2012 11/30/2012 Dollar General Cooper Industries M&A Acquisition by Eaton Corp.
12/5/2012 12/11/2012 Garmin Ltd. R.R. Donnelley Failure Market cap changes
12/18/2012 12/21/2012 Delphi Automotive Titanium Metals M&A Acquisition by Precision Castparts
12/20/2012 12/31/2012 AbbVie Inc. Federated Investors Inc B Failure Market cap changes
2010
2012
2011
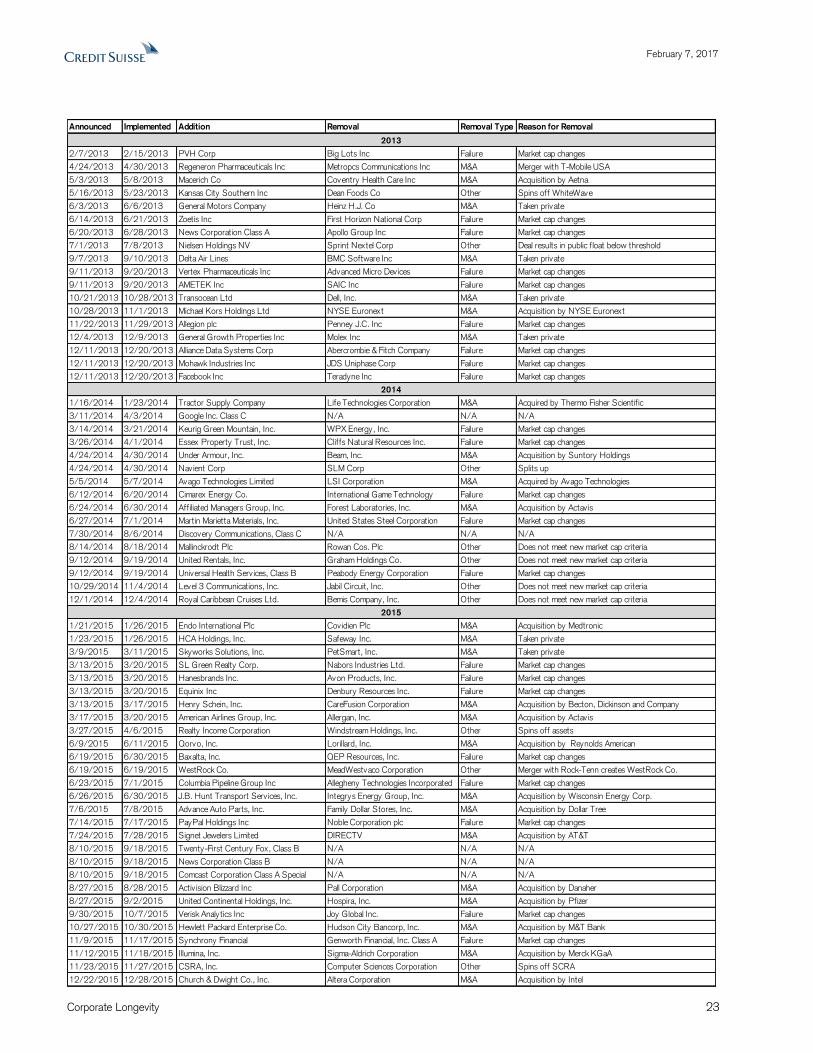
February 7, 2017
Corporate Longevity 23
Announced Implemented Addition Removal Removal Type Reason for Removal
2/7/2013 2/15/2013 PVH Corp Big Lots Inc Failure Market cap changes
4/24/2013 4/30/2013 Regeneron Pharmaceuticals Inc Metropcs Communications Inc M&A Merger with T-Mobile USA
5/3/2013 5/8/2013 Macerich Co Coventry Health Care Inc M&A Acquisition by Aetna
5/16/2013 5/23/2013 Kansas City Southern Inc Dean Foods Co Other Spins off WhiteWave
6/3/2013 6/6/2013 General Motors Company Heinz H.J. Co M&A Taken private
6/14/2013 6/21/2013 Zoetis Inc First Horizon National Corp Failure Market cap changes
6/20/2013 6/28/2013 News Corporation Class A Apollo Group Inc Failure Market cap changes
7/1/2013 7/8/2013 Nielsen Holdings NV Sprint Nextel Corp Other Deal results in public float below threshold
9/7/2013 9/10/2013 Delta Air Lines BMC Software Inc M&A Taken private
9/11/2013 9/20/2013 Vertex Pharmaceuticals Inc Advanced Micro Devices Failure Market cap changes
9/11/2013 9/20/2013 AMETEK Inc SAIC Inc Failure Market cap changes
10/21/2013 10/28/2013 Transocean Ltd Dell, Inc. M&A Taken private
10/28/2013 11/1/2013 Michael Kors Holdings Ltd NYSE Euronext M&A Acquisition by NYSE Euronext
11/22/2013 11/29/2013 Allegion plc Penney J.C. Inc Failure Market cap changes
12/4/2013 12/9/2013 General Growth Properties Inc Molex Inc M&A Taken private
12/11/2013 12/20/2013 Alliance Data Systems Corp Abercrombie & Fitch Company Failure Market cap changes
12/11/2013 12/20/2013 Mohawk Industries Inc JDS Uniphase Corp Failure Market cap changes
12/11/2013 12/20/2013 Facebook Inc Teradyne Inc Failure Market cap changes
1/16/2014 1/23/2014 Tractor Supply Company Life Technologies Corporation M&A Acquired by Thermo Fisher Scientific
3/11/2014 4/3/2014 Google Inc. Class C N/A N/A N/A
3/14/2014 3/21/2014 Keurig Green Mountain, Inc. WPX Energy, Inc. Failure Market cap changes
3/26/2014 4/1/2014 Essex Property Trust, Inc. Cliffs Natural Resources Inc. Failure Market cap changes
4/24/2014 4/30/2014 Under Armour, Inc. Beam, Inc. M&A Acquisition by Suntory Holdings
4/24/2014 4/30/2014 Navient Corp SLM Corp Other Splits up
5/5/2014 5/7/2014 Avago Technologies Limited LSI Corporation M&A Acquired by Avago Technologies
6/12/2014 6/20/2014 Cimarex Energy Co. International Game Technology Failure Market cap changes
6/24/2014 6/30/2014 Affiliated Managers Group, Inc. Forest Laboratories, Inc. M&A Acquisition by Actav is
6/27/2014 7/1/2014 Martin Marietta Materials, Inc. United States Steel Corporation Failure Market cap changes
7/30/2014 8/6/2014 Discovery Communications, Class C N/A N/A N/A
8/14/2014 8/18/2014 Mallinckrodt Plc Rowan Cos. Plc Other Does not meet new market cap criteria
9/12/2014 9/19/2014 United Rentals, Inc. Graham Holdings Co. Other Does not meet new market cap criteria
9/12/2014 9/19/2014 Universal Health Serv ices, Class B Peabody Energy Corporation Failure Market cap changes
10/29/2014 11/4/2014 Level 3 Communications, Inc. Jabil Circuit, Inc. Other Does not meet new market cap criteria
12/1/2014 12/4/2014 Royal Caribbean Cruises Ltd. Bemis Company, Inc. Other Does not meet new market cap criteria
1/21/2015 1/26/2015 Endo International Plc Covidien Plc M&A Acquisition by Medtronic
1/23/2015 1/26/2015 HCA Holdings, Inc. Safeway Inc. M&A Taken private
3/9/2015 3/11/2015 Skyworks Solutions, Inc. PetSmart, Inc. M&A Taken private
3/13/2015 3/20/2015 SL Green Realty Corp. Nabors Industries Ltd. Failure Market cap changes
3/13/2015 3/20/2015 Hanesbrands Inc. Avon Products, Inc. Failure Market cap changes
3/13/2015 3/20/2015 Equinix Inc Denbury Resources Inc. Failure Market cap changes
3/13/2015 3/17/2015 Henry Schein, Inc. CareFusion Corporation M&A Acquisition by Becton, Dickinson and Company
3/17/2015 3/20/2015 American Airlines Group, Inc. Allergan, Inc. M&A Acquisition by Actav is
3/27/2015 4/6/2015 Realty Income Corporation Windstream Holdings, Inc. Other Spins off assets
6/9/2015 6/11/2015 Qorvo, Inc. Lorillard, Inc. M&A Acquisition by Reynolds American
6/19/2015 6/30/2015 Baxalta, Inc. QEP Resources, Inc. Failure Market cap changes
6/19/2015 6/19/2015 WestRock Co. MeadWestvaco Corporation Other Merger with Rock-Tenn creates WestRock Co.
6/23/2015 7/1/2015 Columbia Pipeline Group Inc Allegheny Technologies Incorporated Failure Market cap changes
6/26/2015 6/30/2015 J.B. Hunt Transport Serv ices, Inc. Integrys Energy Group, Inc. M&A Acquisition by Wisconsin Energy Corp.
7/6/2015 7/8/2015 Advance Auto Parts, Inc. Family Dollar Stores, Inc. M&A Acquisition by Dollar Tree
7/14/2015 7/17/2015 PayPal Holdings Inc Noble Corporation plc Failure Market cap changes
7/24/2015 7/28/2015 Signet Jewelers Limited DIRECTV M&A Acquisition by AT&T
8/10/2015 9/18/2015 Twenty-First Century Fox, Class B N/A N/A N/A
8/10/2015 9/18/2015 News Corporation Class B N/A N/A N/A
8/10/2015 9/18/2015 Comcast Corporation Class A Special N/A N/A N/A
8/27/2015 8/28/2015 Activ ision Blizzard Inc Pall Corporation M&A Acquisition by Danaher
8/27/2015 9/2/2015 United Continental Holdings, Inc. Hospira, Inc. M&A Acquisition by Pfizer
9/30/2015 10/7/2015 Verisk Analytics Inc Joy Global Inc. Failure Market cap changes
10/27/2015 10/30/2015 Hewlett Packard Enterprise Co. Hudson City Bancorp, Inc. M&A Acquisition by M&T Bank
11/9/2015 11/17/2015 Synchrony Financial Genworth Financial, Inc. Class A Failure Market cap changes
11/12/2015 11/18/2015 Illumina, Inc. Sigma-Aldrich Corporation M&A Acquisition by Merck KGaA
11/23/2015 11/27/2015 CSRA, Inc. Computer Sciences Corporation Other Spins off SCRA
12/22/2015 12/28/2015 Church & Dwight Co., Inc. Altera Corporation M&A Acquisition by Intel
2013
2014
2015
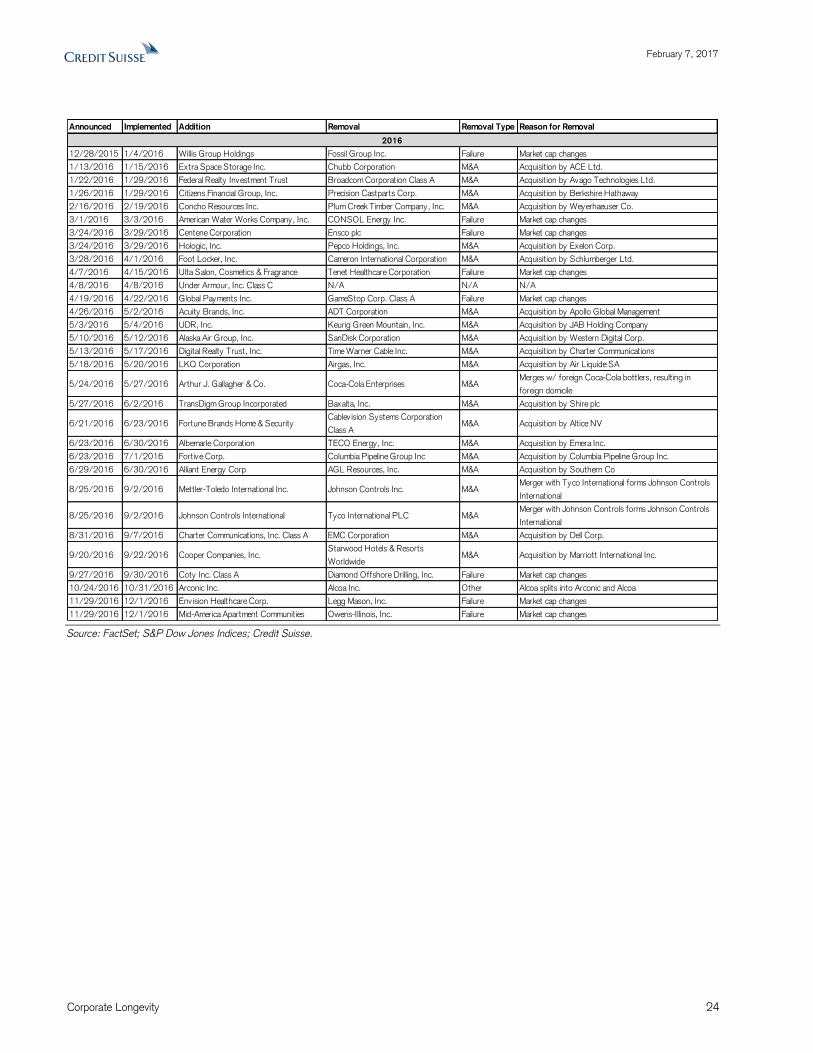
February 7, 2017
Corporate Longevity 24
Source: FactSet; S&P Dow Jones Indices; Credit Suisse.
Announced Implemented Addition Removal Removal Type Reason for Removal
12/28/2015 1/4/2016 Willis Group Holdings Fossil Group Inc. Failure Market cap changes
1/13/2016 1/15/2016 Extra Space Storage Inc. Chubb Corporation M&A Acquisition by ACE Ltd.
1/22/2016 1/29/2016 Federal Realty Investment Trust Broadcom Corporation Class A M&A Acquisition by Avago Technologies Ltd.
1/26/2016 1/29/2016 Citizens Financial Group, Inc. Precision Castparts Corp. M&A Acquisition by Berkshire Hathaway
2/16/2016 2/19/2016 Concho Resources Inc. Plum Creek Timber Company, Inc. M&A Acquisition by Weyerhaeuser Co.
3/1/2016 3/3/2016 American Water Works Company, Inc. CONSOL Energy Inc. Failure Market cap changes
3/24/2016 3/29/2016 Centene Corporation Ensco plc Failure Market cap changes
3/24/2016 3/29/2016 Hologic, Inc. Pepco Holdings, Inc. M&A Acquisition by Exelon Corp.
3/28/2016 4/1/2016 Foot Locker, Inc. Cameron International Corporation M&A Acquisition by Schlumberger Ltd.
4/7/2016 4/15/2016 Ulta Salon, Cosmetics & Fragrance Tenet Healthcare Corporation Failure Market cap changes
4/8/2016 4/8/2016 Under Armour, Inc. Class C N/A N/A N/A
4/19/2016 4/22/2016 Global Payments Inc. GameStop Corp. Class A Failure Market cap changes
4/26/2016 5/2/2016 Acuity Brands, Inc. ADT Corporation M&A Acquisition by Apollo Global Management
5/3/2016 5/4/2016 UDR, Inc. Keurig Green Mountain, Inc. M&A Acquisition by JAB Holding Company
5/10/2016 5/12/2016 Alaska Air Group, Inc. SanDisk Corporation M&A Acquisition by Western Digital Corp.
5/13/2016 5/17/2016 Digital Realty Trust, Inc. Time Warner Cable Inc. M&A Acquisition by Charter Communications
5/18/2016 5/20/2016 LKQ Corporation Airgas, Inc. M&A Acquisition by Air Liquide SA
5/24/2016 5/27/2016 Arthur J. Gallagher & Co. Coca-Cola Enterprises M&AMerges w/ foreign Coca-Cola bottlers, resulting in
foreign domicile
5/27/2016 6/2/2016 TransDigm Group Incorporated Baxalta, Inc. M&A Acquisition by Shire plc
6/21/2016 6/23/2016 Fortune Brands Home & SecurityCablev ision Systems Corporation
Class AM&A Acquisition by Altice NV
6/23/2016 6/30/2016 Albemarle Corporation TECO Energy, Inc. M&A Acquisition by Emera Inc.
6/23/2016 7/1/2016 Fortive Corp. Columbia Pipeline Group Inc M&A Acquisition by Columbia Pipeline Group Inc.
6/29/2016 6/30/2016 Alliant Energy Corp AGL Resources, Inc. M&A Acquisition by Southern Co
8/25/2016 9/2/2016 Mettler-Toledo International Inc. Johnson Controls Inc. M&AMerger with Tyco International forms Johnson Controls
International
8/25/2016 9/2/2016 Johnson Controls International Tyco International PLC M&AMerger with Johnson Controls forms Johnson Controls
International
8/31/2016 9/7/2016 Charter Communications, Inc. Class A EMC Corporation M&A Acquisition by Dell Corp.
9/20/2016 9/22/2016 Cooper Companies, Inc.Starwood Hotels & Resorts
WorldwideM&A Acquisition by Marriott International Inc.
9/27/2016 9/30/2016 Coty Inc. Class A Diamond Offshore Drilling, Inc. Failure Market cap changes
10/24/2016 10/31/2016 Arconic Inc. Alcoa Inc. Other Alcoa splits into Arconic and Alcoa
11/29/2016 12/1/2016 Envision Healthcare Corp. Legg Mason, Inc. Failure Market cap changes
11/29/2016 12/1/2016 Mid-America Apartment Communities Owens-Illinois, Inc. Failure Market cap changes
2016
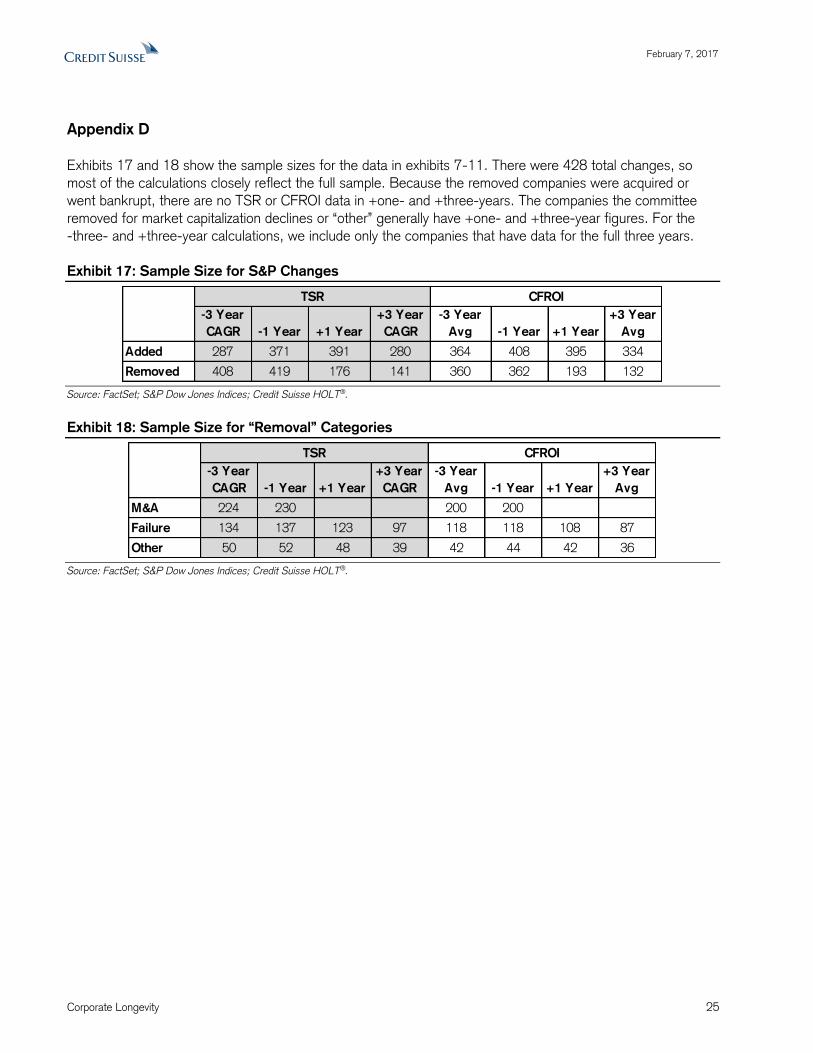
February 7, 2017
Corporate Longevity 25
Appendix D
Exhibits 17 and 18 show the sample sizes for the data in exhibits 7-11. There were 428 total changes, so
most of the calculations closely reflect the full sample. Because the removed companies were acquired or
went bankrupt, there are no TSR or CFROI data in +one- and +three-years. The companies the committee
removed for market capitalization declines or “other” generally have +one- and +three-year figures. For the
-three- and +three-year calculations, we include only the companies that have data for the full three years.
Exhibit 17: Sample Size for S&P Changes
Source: FactSet; S&P Dow Jones Indices; Credit Suisse HOLT®.
Exhibit 18: Sample Size for “Removal” Categories
Source: FactSet; S&P Dow Jones Indices; Credit Suisse HOLT®.
-3 Year
CAGR -1 Year +1 Year
+3 Year
CAGR
-3 Year
Avg -1 Year +1 Year
+3 Year
Avg
Added 287 371 391 280 364 408 395 334
Removed 408 419 176 141 360 362 193 132
TSR CFROI
-3 Year
CAGR -1 Year +1 Year
+3 Year
CAGR
-3 Year
Avg -1 Year +1 Year
+3 Year
Avg
M&A 224 230 200 200
Failure 134 137 123 97 118 118 108 87
Other 50 52 48 39 42 44 42 36
TSR CFROI

February 7, 2017
Corporate Longevity 26
Endnotes
1 Kenneth E. Boulding, A Reconstruction of Economics (New York: John Wiley & Sons, 1950), 38. 2 Clark Kerr, The Uses of the University: Fifth Edition (Cambridge, MA: Harvard University Press, 2001), 115. 3 Joseph A Schumpeter, Capitalism, Socialism and Democracy (New York: Harper & Row, 1942). 4 Ebenezer Asem and Shamsul Alam, “The Role of the S&P 500 Index Constituents in Tracking the U.S.
Equity Market,” International Journal of Economics and Finance, Vol. 4, No. 12, December 2012, 15-22. 5 See http://us.spindices.com/indices/equity/sp-500. 6 Martijn Cremers, Antti Petajisto, and Eric Zitzewitz, "Should Benchmark Indices Have Alpha? Revisiting
Performance Evaluation," Critical Finance Review, Vol. 2, No. 1, 2012, 1-48. 7 Jeremy Siegel, “Long-Term Returns on the Original S&P 500 Companies,” Financial Analysts Journal, Vol.
62, No. 1, January/February 2006, 18-31. 8 Richard Foster and Sarah Kaplan, authors of the book Creative Destruction, are among the most prominent
proponents of the point of view that turnover reflects creative destruction. The authors examine the average
tenure of a company in the S&P 500 over time and conclude that the rate of churn has accelerated. Their
study spans from the late 1920s through the late 1990s. Because the S&P 500 wasn’t formed until 1957,
they use the S&P 90 as a proxy in the early years. They show that turnover increased from about 1.5 percent
in the 1920s and 1930s, an average lifespan of about 65 years, to nearly 10 percent in 1998, an average
lifespan of 10 years.
Foster and Kaplan attribute this increase in the rate of change to Peter Drucker’s notion of the “Age of
Discontinuity” and Joseph Schumpeter’s theory of creative destruction. These frameworks, the authors argue,
show how markets promote discontinuity by having new, more innovative entrants replace old, weaker
companies. See Richard Foster and Sarah Kaplan, Creative Destruction: Why Companies That Are Built to
Last Underperform the Market—And How to Successfully Transform Them (New York: Random House,
2001). 9 Messod D. Beneish and Robert E. Whaley, “S&P 500 Index Replacements: A new game in town,” Journal
of Portfolio Management, Vol. 29, No. 1, 51-60, Fall 2002. 10 “2016 Shift Index: The Paradox of Flows: Can Hope Flow from Fear?” Deloitte Center for the Edge, 2016.
See https://dupress.deloitte.com/content/dam/dup-us-en/articles/3407_2016-Shift-Index/DUP_2016-
Shift-Index.pdf. 11 Peter Clark and Roger Mills argue that merger waves generally pick up steam alongside an improving
economy, in large part because this increases the availability of financing. The authors attribute the biggest
flurry of activity to behavioral factors, or what Warren Buffett likes to call the “institutional imperative.” CEOs
see their peers doing deals and feel compelled to do deals of their own, even if valuations have already risen
beyond levels that are attractive. See: Peter J. Clark and Roger W. Mills, Masterminding the Deal:
Breakthroughs in M&A strategy and analysis (London: KoganPage, 2013); Jarrod Harford attributes merger
waves to industry shocks, an increase in capital liquidity, and a reduction in financing constraints. See Jarrod
Harford, “What Drives Merger Waves?” Journal of Financial Economics, Vol. 77, No. 3, September 2005,
529-560. Researchers also demonstrate a link between merger activity and share prices. See Ralph L.
Nelson, Merger Movements in American Industry: 1895-1956 (Princeton: Princeton University Press, 1959),
and Roger Clarke and Christos Ioannidis, “On the relationship between aggregate merger activity and the
stock market: some further empirical evidence,” Economics Letters, Vol. 53, No. 3, December 1996, 349-
356. 12 To minimize the impact of the announcement on the stock price, we measure TSR as follows: For trailing
returns, our ending point is one full day before the announcement (e.g., the trailing one-year return would be
366 days before the announcement through 1 day before the announcement). For future returns, our starting
point is 1 day after the announcement. 13 Scott D. Stewart, CFA, John J. Neumann, Christopher R. Knittel, and Jeffrey Heisler, CFA, “Absence of
Value: An Analysis of Investment Allocation Decisions by Institutional Plan Sponsors,” Financial Analysts

February 7, 2017
Corporate Longevity 27
Journal, Vol. 65, No. 6, November/December 2009, 34-51; Andrea Frazzini and Owen A. Lamont, “Dumb
Money: Mutual Fund Flows and the Cross-Section of Stock Returns,” Journal of Financial Economics, Vol. 88,
No. 2, May 2008, 299-322; and Amit Goyal and Sunil Wahal, “The Selection and Termination of Investment
Management Firms by Plan Sponsors,” The Journal of Finance, Vol. 63, No. 4, August 2008, 1805-1847. 14 Beneish and Whaley observed a similar pattern when they examined the trailing TSRs of stocks deleted
from and added to the S&P 500 Index from 1996-2001. They found that stocks deleted from the index had
average abnormal returns of -77 percent over the two years prior to removal, while stocks added to the index
saw average abnormal returns of 290 percent for the two years prior to their introduction. 15 Kalok Chan, Hung Wan Kot, and Gordon Tang examined changes in the S&P 500 from 1962 to 2003 and
found that added and deleted stocks both delivered strong long-term results and that the average abnormal
return for the deleted stocks exceeded those of the added stocks. They attribute the positive results for added
stocks to “increases in institutional ownership, liquidity, and analyst coverage, and a decrease in the long-term
shadow cost,” and for deleted stocks to “a rebound in institutional ownership and liquidity after stock deletion.”
They note that “the long-term operating performance declines for added stocks and increases slightly for
deleted stocks subsequent to the year of stock addition or deletion (year t),” suggesting that “firms are added
to the index during their peak performance stage and cannot sustain this performance in the long-run. In
contrast, firms are deleted from the index during their worst performance stage but tend to recover somewhat
in the long term.” See: Kalok Chan, Hung Wan Kot, Gordon Y.N. Tang, “A comprehensive long-term analysis
of S&P 500 index additions and deletions,” Journal of Banking & Finance, Vol. 37, No. 12, December 2013,
4920-4930. Anita Arora, Lauren Capp, and Gary Smith found similar results for the Dow Jones Industrial
Average. The authors examined all additions and deletions to the Dow since 1928, excluding changes due to
M&A or due purely to a name change. They created two portfolios, one of added stocks and one of deleted
stocks, and then tracked their performance, accounting for changes to the Dow over time. The authors found
the deleted stocks, with annual returns of 15.9 percent, handily beat the added stocks, with annual returns of
11.5 percent. The authors conclude that the results are statistically significant and cannot be explained by
Carhart’s four-factor model (CAPM, size, valuation, and momentum). See Anita Arora, Lauren Capp, and Gary
Smith, “The Real Dogs of the Dow,” Journal of Wealth Management, Vol. 10, No. 4, Spring 2008, 64-72. 16 Michael C. Jensen, “Agency Costs of Free Cash Flow, Corporate Finance, and Takeovers,” American
Economic Review, Vol. 76, No. 2, May 1986, 323-329. 17 Full for a full description of how Fortune chooses the list, see: http://beta.fortune.com/global500/.
The years in our chart reflect the year of the financial results, not the year that Fortune published the list. For
example, we count the 2016 Fortune 500 to be 2015 because the list published in 2016 largely reflects
financial results for the year 2015. We exclude 1994 because Fortune changed its methodology that year,
which led to a significantly high turnover number. To better represent changes in the U.S. economy, Fortune
began to include service firms in its Fortune 500 list instead of listing them separately. 18 We follow the presentation of Dane Stangler and Sam Arbesman, “What Does Fortune 500 Turnover
Mean?” Ewing Marion Kauffman Foundation, June 2012. 19 We are only able to track nine years following 1985 because Fortune changed its methodology in 1994 by
expanding beyond industrial, energy, and manufacturing firms to include service firms as well.
20 Leslie Hannah, “Marshall's ‘Trees’ and the Global ‘Forest’: Were ‘Giant Redwoods’ Different?” in Naomi R.
Lamoreaux, Daniel M. G. Raff and Peter Temin (eds.), Learning by Doing in Markets, Firms, and Countries
(Chicago: The University of Chicago Press, 1999), 253-293. 21 U.S. Census Business Dynamics Statistics (September 2016 release containing data through 2014) and
The World Bank (data through 2015). 22 Timothy Dunne, Mark J. Roberts, and Larry Samuelson, “Patterns of firm entry and exit in U.S.
manufacturing industries,” RAND Journal of Economics, Vol. 19, No. 4, Winter 1988, 495-515 and Timothy
Dunne, Shawn D. Klimek, Mark J. Roberts, and Daniel Yi Xu, “Entry, Exit, and the Determinants of Market
Structure,” RAND Journal of Economics, Vol. 44, No. 3, Fall 2013, 462-487.

February 7, 2017
Corporate Longevity 28
23 Brian Headd, Alfred Nucci, and Richard Boden, “What Matters More: Business Exit Rates or Business
Survival Rates?” BDS Statistical Brief, U.S. Census Bureau, 2010. 24 Charles A. O’Reilly, III and Michael L. Tushman, Lead and Disrupt: How to Solve the Innovator’s Dilemma
(Stanford, CA: Stanford University Press, 2016). 25 S&P Dow Jones Indices, “S&P Dow Jones Indices Announces Changes in Treatment of Multiple Share
Classes in U.S. Indices and Revises Previously Announced Treatment of Google Stock Split,” March 11, 2014.
See https://www.spice-indices.com/idpfiles/spice-
assets/resources/public/documents/81745_multisharecgoogle2.pdf. 26 S&P Dow Jones Indices, “S&P U.S. Indices: Methodology,” January 2017. For the latest methodology, see
http://www.spindices.com/documents/methodologies/methodology-sp-us-indices.pdf.
Sources for exhibit 1: Credit Suisse; Credit Suisse HOLT; Dane Stangler and Sam Arbesman, “What Does
Fortune 500 Turnover Mean?” Ewing Marion Kauffman Foundation, June 2012. Madeleine I. G. Daepp,
Marcus J. Hamilton, Geoffrey B. West, and Luís M. A. Bettencourt, “The mortality of companies,” The Royal
Society Publishing, Vol. 12, No. 106, April 1, 2015; U.S. Census Bureau, Center for Economic Studies,
Business Dynamics Statistics; Timothy Dunne, Mark J. Roberts, and Larry Samuelson, “Patterns of firm entry
and exit in U.S. manufacturing industries,” RAND Journal of Economics, Vol. 19, No. 4, Winter 1988, 495-
515 and Timothy Dunne, Shawn D. Klimek, Mark J. Roberts, and Daniel Yi Xu, “Entry, Exit, and the
Determinants of Market Structure,” RAND Journal of Economics, Vol. 44, No. 3, Fall 2013, 462-487.

Important information
This document was produced by and the opinions expressed are those of Credit Suisse as of the date of writing and are subject to change. It has been
prepared solely for information purposes and for the use of the recipient. It does not constitute an offer or an invitation by or on behalf of Credit Suisse
to any person to buy or sell any security. Nothing in this material constitutes investment, legal, accounting or tax advice, or a representation that any
investment or strategy is suitable or appropriate to your individual circumstances, or otherwise constitutes a personal recommendation to you. The price
and value of investments mentioned and any income that might accrue may fluctuate and may fall or rise. Any reference to past performance is not a
guide to the future.
The information and analysis contained in this publication have been compiled or arrived at from sources believed to be reliable but Credit Suisse does
not make any representation as to their accuracy or completeness and does not accept liability for any loss arising from the use hereof. A Credit Suisse
Group company may have acted upon the information and analysis contained in this publication before being made available to clients of Credit Suisse.
Investments in emerging markets are speculative and considerably more volatile than investments in established markets. Some of the main risks are
political risks, economic risks, credit risks, currency risks and market risks. Investments in foreign currencies are subject to exchange rate fluctuations.
Before entering into any transaction, you should consider the suitability of the transaction to your particular circumstances and independently review
(with your professional advisers as necessary) the specific financial risks as well as legal, regulatory, credit, tax and accounting consequences. This
document is issued and distributed in the United States by Credit Suisse Securities (USA) LLC, a U.S. registered broker-dealer; in Canada by Credit
Suisse Securities (Canada), Inc.; and in Brazil by Banco de Investimentos Credit Suisse (Brasil) S.A.
This document is distributed in Switzerland by Credit Suisse AG, a Swiss bank. Credit Suisse is authorized and regulated by the Swiss Financial Market
Supervisory Authority (FINMA). This document is issued and distributed in Europe (except Switzerland) by Credit Suisse (UK) Limited and Credit Suisse
Securities (Europe) Limited, London. Credit Suisse Securities (Europe) Limited, London and Credit Suisse (UK) Limited, authorised by the Prudential
Regulation Authority (PRA) and regulated by the Financial Conduct Authority (FCA) and PRA, are associated but independent legal and regulated
entities within Credit Suisse. The protections made available by the UK‘s Financial Services Authority for private customers do not apply to investments
or services provided by a person outside the UK, nor will the Financial Services Compensation Scheme be available if the issuer of the investment fails
to meet its obligations. This document is distributed in Guernsey by Credit Suisse (Guernsey) Limited, an independent legal entity registered in
Guernsey under 15197, with its registered address at Helvetia Court, Les Echelons, South Esplanade, St Peter Port, Guernsey. Credit Suisse
(Guernsey) Limited is wholly owned by Credit Suisse and is regulated by the Guernsey Financial Services Commission. Copies of the latest audited
accounts are available on request. This document is distributed in Jersey by Credit Suisse (Guernsey) Limited, Jersey Branch, which is regulated by the
Jersey Financial Services Commission. The business address of Credit Suisse (Guernsey) Limited, Jersey Branch, in Jersey is: TradeWind House, 22
Esplanade, St Helier, Jersey JE2 3QA. This document has been issued in Asia-Pacific by whichever of the following is the appropriately authorised
entity of the relevant jurisdiction: in Hong Kong by Credit Suisse (Hong Kong) Limited, a corporation licensed with the Hong Kong Securities and
Futures Commission or Credit Suisse Hong Kong branch, an Authorized Institution regulated by the Hong Kong Monetary Authority and a Registered
Institution regulated by the Securities and Futures Ordinance (Chapter 571 of the Laws of Hong Kong); in Japan by Credit Suisse Securities (Japan)
Limited; elsewhere in Asia/Pacific by whichever of the following is the appropriately authorized entity in the relevant jurisdiction: Credit Suisse Equities
(Australia) Limited, Credit Suisse Securities (Thailand) Limited, Credit Suisse Securities (Malaysia) Sdn Bhd, Credit Suisse AG,Singapore Branch,and
elsewhere in the world by the relevant authorized affiliate of the above.
This document may not be reproduced either in whole, or in part, without the written permission of the authors and CREDIT SUISSE.
HOLT®
With respect to the analysis in this report based on the Credit Suisse HOLT methodology, Credit Suisse certifies that (1) the views expressed in this
report accurately reflect the Credit Suisse HOLT methodology and (2) no part of the Firm's compensation was, is, or will be directly related to the
specific views disclosed in this report.
The Credit Suisse HOLT methodology does not assign recommendations to a security. It is an analytical tool that involves use of a set of proprietary
quantitative algorithms and warranted value calculations, collectively called the Credit Suisse HOLT valuation model, that are consistently applied to all
the companies included in its database. Third-party data (including consensus earnings estimates) are systematically translated into a number of default
variables and incorporated into the algorithms available in the Credit Suisse HOLT valuation model. The source financial statement, pricing, and
earnings data provided by outside data vendors are subject to quality control and may also be adjusted to more closely measure the underlying
economics of firm performance. These adjustments provide consistency when analyzing a single company across time, or analyzing multiple companies
across industries or national borders. The default scenario that is produced by the Credit Suisse HOLT valuation model establishes the baseline
valuation for a security, and a user then may adjust the default variables to produce alternative scenarios, any of which could occur. Additional
information about the Credit Suisse HOLT methodology is available on request.
The Credit Suisse HOLT methodology does not assign a price target to a security. The default scenario that is produced by the Credit Suisse HOLT
valuation model establishes a warranted price for a security, and as the third-party data are updated, the warranted price may also change. The default
variables may also be adjusted to produce alternative warranted prices, any of which could occur. Additional information about the Credit Suisse HOLT
methodology is available on request.
© 2017 CREDIT SUISSE GROUP AG and/or its affiliates. All rights reserved


![INDEX [assets.cambridge.org]assets.cambridge.org/97805217/66883/index/9780521766883_index.pdf · Index More information. Index 666 Alentejo, 488 , 491 , 495 , 500 , 502 Alto, 556](https://static.fdocuments.in/doc/165x107/5aae497d7f8b9a22118bcaf2/index-more-information-index-666-alentejo-488-491-495-500-502-alto.jpg)