SAMPLING AND QUALITY ASSURANCE PROJECT PLAN FOR …
113
SAMPLING AND QUALITY ASSURANCE PROJECT PLAN FOR COMPLIANCE MONITORING WHATCOM WATERWAY CLEANUP IN PHASE 1 SITE AREAS Prepared for Port of Bellingham 1801 Roeder Avenue Bellingham, Washington 98227 Prepared by Anchor QEA, LLC 720 Olive Way, Suite 1900 Seattle, Washington 98101 March 2016
Transcript of SAMPLING AND QUALITY ASSURANCE PROJECT PLAN FOR …

SAMPLING AND QUALITY ASSURANCE PROJECT PLAN FOR COMPLIANCE MONITORING WHATCOM WATERWAY CLEANUP IN PHASE 1 SITE AREAS
Prepared for Port of Bellingham
1801 Roeder Avenue
Bellingham, Washington 98227
Prepared by Anchor QEA, LLC
720 Olive Way, Suite 1900
Seattle, Washington 98101
March 2016

Compliance Monitoring Sampling and Quality Assurance Project Plan March 2016 Whatcom Waterway Cleanup in Phase 1 Site Areas i 080007-01.04
TABLE OF CONTENTS 1 INTRODUCTION ................................................................................................................ 1
1.1 Project Overview .............................................................................................................1
1.2 Study Area ........................................................................................................................3
1.3 Project Schedule ...............................................................................................................4
1.4 Contaminants of Concern ................................................................................................4
1.5 Cleanup and Screening Levels .........................................................................................6
1.6 Document Organization ..................................................................................................6
2 PERFORMANCE (YEAR 0) MONITORING ....................................................................... 7
2.1 Sampling Design ...............................................................................................................7
2.1.1 Sediment .....................................................................................................................7
2.1.2 Crab Tissue ..................................................................................................................7
2.1.3 Clam Tissue .................................................................................................................8
2.1.4 Porewater Monitoring – Co-Located With Clam Tissue .........................................8
2.1.5 Physical Surveys .........................................................................................................8
2.2 Performance Monitoring Sample Collection and Processing ........................................8
2.2.1 Sediment .....................................................................................................................9
Surface Sediment Collection .............................................................................................. 9
Surface Sediment Processing ............................................................................................ 10
Analysis of Post-Dredge Samples (Prior to Cap Placement) – Units 2A and 3B ........... 11
Analysis of Post-Dredge Samples (Prior to Cover Placement) – Unit 1C ..................... 12
Analysis of Post-Dredge Samples (After Cover Placement) – Unit 1C .......................... 13
2.2.2 Physical Surveys .......................................................................................................14
2.2.3 Crab Tissue ................................................................................................................14
Crab Tissue Collection ...................................................................................................... 14
Crab Tissue Processing ..................................................................................................... 15
2.2.4 Clam Tissue ...............................................................................................................16
Caged Clam Preparation and Deployment ...................................................................... 16
Clam Tissue Collection and Processing ........................................................................... 17
2.2.5 Co-Located Porewater ..............................................................................................17
Co-Located Porewater Collection .................................................................................... 18
Co-Located Porewater Processing ................................................................................... 20

Table of Contents
Compliance Monitoring Sampling and Quality Assurance Project Plan March 2016 Whatcom Waterway Cleanup in Phase 1 Site Areas ii 080007-01.04
3 CONFIRMATION MONITORING (YEAR 1–30) .............................................................. 21
3.1 Sampling Design .............................................................................................................21
3.1.1 Surface Sediment ......................................................................................................21
3.1.2 Subsurface Sediment ................................................................................................21
3.1.3 Crab Tissue ................................................................................................................21
3.1.4 Clam Tissue ...............................................................................................................22
3.1.5 Benthic Fish Tissue ...................................................................................................22
3.1.6 Pelagic Fish Tissue ....................................................................................................22
3.1.7 Porewater in Unit 4 (Log Pond) ..............................................................................23
3.1.8 Porewater Monitoring – Co-Located With Clam Tissue .......................................23
3.1.9 Physical Surveys .......................................................................................................23
3.2 Confirmation Monitoring Sample Collection and Processing .....................................24
3.2.1 Surface Sediment ......................................................................................................24
Surface Sediment Collection ............................................................................................ 24
Surface Sediment Processing ............................................................................................ 25
3.2.2 Subsurface Sediment ................................................................................................27
Subsurface Sediment Collection ...................................................................................... 27
Subsurface Sediment Processing ...................................................................................... 28
3.2.3 Physical Surveys .......................................................................................................28
3.2.4 Crab Tissue ................................................................................................................29
Crab Tissue Collection ...................................................................................................... 30
Crab Tissue Processing ..................................................................................................... 30
3.2.5 Clam Tissue ...............................................................................................................31
Caged Clam Preparation and Deployment ...................................................................... 32
Clam Tissue Collection and Processing ........................................................................... 32
3.2.6 Co-Located Porewater ..............................................................................................32
Co-Located Porewater Collection .................................................................................... 33
Co-Located Porewater Processing ................................................................................... 35
3.2.7 Benthic Fish ..............................................................................................................35
Benthic Fish Collection Methods..................................................................................... 36
Benthic Fish Processing Methods .................................................................................... 37
3.2.8 Pelagic Fish ...............................................................................................................38
Frequency 39

Table of Contents
Compliance Monitoring Sampling and Quality Assurance Project Plan March 2016 Whatcom Waterway Cleanup in Phase 1 Site Areas iii 080007-01.04
Sampling and Analysis Approach .................................................................................... 40
3.2.9 Unit 4 (Log Pond) Porewater Monitoring ..............................................................40
Porewater Collection ........................................................................................................ 41
Porewater Processing ....................................................................................................... 43
4 GENERAL SAMPLING METHODS .................................................................................. 44
4.1 Station and Sample Identification .................................................................................44
4.2 Navigation .......................................................................................................................45
4.3 Permitting and Approvals ..............................................................................................45
4.4 Sample Handling Requirements ....................................................................................45
4.4.1 Decontamination Procedures ..................................................................................46
4.4.2 Investigation-Derived Waste ...................................................................................46
4.4.3 Sample Custody and Shipping Requirements .........................................................47
4.5 Laboratory Analytical Methods – Chemistry ...............................................................48
4.5.1 Surface Sediment ......................................................................................................49
4.5.2 Subsurface Sediment ................................................................................................49
4.5.3 Tissue .........................................................................................................................49
4.5.4 Porewater ..................................................................................................................49
4.6 Laboratory Analytical Methods – Toxicity ...................................................................49
4.6.1 10-Day Acute Toxicity Amphipod Test ..................................................................50
4.6.2 20-Day Juvenile Polychaete Growth Test ...............................................................51
4.6.3 Larval Bivalve Development Test ............................................................................52
4.7 Quality Assurance and Quality Control .......................................................................53
4.8 Instrument/Equipment Testing, Inspection, and Maintenance Requirements ..........53
4.8.1 Field Instruments/Equipment ..................................................................................53
4.8.2 Laboratory Instruments/Equipment ........................................................................54
4.9 Inspection/Acceptance of Supplies and Consumables .................................................54
4.10 Non-Direct Measurements ............................................................................................54
5 PROJECT MANAGEMENT ............................................................................................... 55
5.1 Data Quality Objectives .................................................................................................55
5.1.1 Precision ....................................................................................................................55
5.1.2 Accuracy ...................................................................................................................55
5.1.3 Representativeness ...................................................................................................55

Table of Contents
Compliance Monitoring Sampling and Quality Assurance Project Plan March 2016 Whatcom Waterway Cleanup in Phase 1 Site Areas iv 080007-01.04
5.1.4 Comparability ...........................................................................................................55
5.1.5 Completeness ............................................................................................................56
5.1.6 Sensitivity .................................................................................................................56
5.2 Special Training Requirements/Certifications ..............................................................56
5.3 Documentation and Records .........................................................................................56
5.3.1 Field Records ............................................................................................................56
5.3.2 Analytical Records....................................................................................................57
5.3.3 Data Reduction .........................................................................................................59
6 ASSESSMENTS AND OVERSIGHT ................................................................................... 60
6.1 Compliance Assessments ...............................................................................................60
6.2 Response and Corrective Actions ..................................................................................60
6.2.1 Field Activities ..........................................................................................................60
6.2.2 Laboratory .................................................................................................................60
6.3 Reports to Management .................................................................................................61
7 DATA VALIDATION AND USABILITY ........................................................................... 62
7.1 Data Review, Validation, and Verification ...................................................................62
7.2 Validation and Verification Methods ...........................................................................62
7.3 Reconciliation with User Requirements .......................................................................63
8 REPORTING ...................................................................................................................... 65
9 REFERENCES .................................................................................................................... 66
List of Tables Table 1 Site Cleanup Levels for Surface Sediment Table 2 Interpretive Framework for Compliance Monitoring Program Table 3 Sampling Design Summary Table 4 Sediment Sampling Locations and Methods – Performance Monitoring Table 5 Tissue and Co-Located Porewater Sampling Locations and Methods –
Performance and Confirmation Monitoring Table 6 Sediment Sampling Locations and Methods – Confirmation Monitoring Table 7 Guidelines for Sample Handling and Storage

Table of Contents
Compliance Monitoring Sampling and Quality Assurance Project Plan March 2016 Whatcom Waterway Cleanup in Phase 1 Site Areas v 080007-01.04
Table 8 Sediment Parameters, Analytical Methods, and Quantitation Limits Table 9 Tissue Parameters, Analytical Methods, and Quantitation Limits Table 10 Porewater Parameters, Analytical Methods, and Target Quantitation Limits Table 11 Toxicity Testing – SMS Biological Effects Criteria for Puget Sound Marine
Sediments Table 12 Field and Laboratory QA/QC Requirements Table 13 Data Quality Objectives
List of Figures Figure 1 Construction Project for Phase 1 Areas Figure 2 Performance Monitoring Surface Sediment Sampling Locations – Unit 1C Figure 3 Performance Monitoring Surface Sediment Sampling Locations – Units 2A and 3B Figure 4 Proposed Locations for Tissue and Co-Located Porewater Monitoring Figure 5 Reference Area Sampling Locations Figure 6 Porewater Piezometer Schematic Figure 7 Confirmation (Long-term) Monitoring Sampling Locations
List of Appendices Appendix A Field Forms

Compliance Monitoring Sampling and Quality Assurance Project Plan March 2016 Whatcom Waterway Cleanup in Phase 1 Site Areas 080007-01.04
LIST OF ACRONYMS AND ABBREVIATIONS AFDW ash-free dry weight
ASTM American Society for Testing Materials
CLP Contract Laboratory Program
cm centimeter
CMCRP Compliance Monitoring and Contingency Response Plan
COC chain-of-custody
D/F dioxin/furans
DGPS Differential Global Positioning System
DO dissolved oxygen
DQO data quality objective
Ecology Washington State Department of Ecology
EDL estimated detection limit
EDR Engineering Design Report
GP Georgia-Pacific
GPS Global Positioning System
HAZWOPER Hazardous Waste Operations and Emergency Response
L liter
MDL method detection limit
mL milliliter
MLLW mean lower low water
mm millimeter
MNR monitored natural recovery
MRL method reporting limit
MTCA Model Toxics Control Act
NMDS nylon mesh diffusion sampler
PAH polycyclic aromatic hydrocarbon
PDCR Preliminary Design Conceptual Report

List of Acronyms and Abbreviations
Compliance Monitoring Sampling and Quality Assurance Project Plan March 2016 Whatcom Waterway Cleanup in Phase 1 Site Areas i 080007-01.04
Port Port of Bellingham
PRDI pre-remedial design investigation
Project Whatcom Waterway Cleanup in Phase 1 Site Areas
PSEP Puget Sound Estuary Program
PVC polyvinyl chloride
QA/QC quality assurance/quality control
RI/FS Remedial Investigation and Feasibility Study
Site Whatcom Waterway Site
SMARM Sediment Management Annual Review Meeting
SMS Sediment Management Standards
SOP standard operating procedure
SQAPP Sampling and Quality Assurance Project Plan
SQS Sediment Quality Standard
TOC total organic carbon
USACE U.S. Army Corps of Engineers
USEPA U.S. Environmental Protection Agency
USGS U.S. Geological Survey
WDFW Washington Department of Fish and Wildlife

Compliance Monitoring Sampling and Quality Assurance Project Plan March 2016 Whatcom Waterway Cleanup in Phase 1 Site Areas 1 080007-01.04
1 INTRODUCTION
The Whatcom Waterway Cleanup in Phase 1 Site Areas (Project) is to be conducted by the Port of Bellingham (Port) to implement the cleanup of the Whatcom Waterway Site (Site) as required by Consent Decree (No. 07-2-02257-7) as amended (Ecology 2007 and 2011). The Project includes dredging, upland disposal, and capping in Phase 1 site areas. Cleanup activities are described in detail in the Engineering Design Report (EDR; Anchor QEA 2015a). This cleanup action is being performed in compliance with the requirements of the Model Toxics Control Act (MTCA) and Sediment Management Standards (SMS) regulations. Compliance requirements include monitoring during and after the cleanup action in Phase 1 site areas. As such, a Compliance Monitoring and Contingency Response Plan (CMCRP) was included as Appendix G of the EDR (Anchor QEA 2015b), which describes performance and confirmation monitoring and associated contingency response actions that will be implemented in support of cleanup activities within Phase 1 areas of the Site. This Sampling and Quality Assurance Project Plan (SQAPP) describes the sampling and analysis plan for compliance monitoring to be conducted during and immediately following cleanup construction actions (performance monitoring) as well as long-term (confirmation) monitoring at the Site. This SQAPP describes data quality objectives (DQOs), sampling and analytical methods, quality assurance/quality control (QA/QC) procedures, and data management for sediment, porewater, and tissue performance and confirmation monitoring. Compliance monitoring and contingency response actions within Phase 2 areas of the Site, described in the Preliminary Design Conceptual Report (PDCR; Anchor QEA 2012), will be addressed in a future separate document. Phase 1 construction water quality protection monitoring will be performed as described in the Water Quality Monitoring Plan (EDR Appendix L, Anchor QEA 2015c).
1.1 Project Overview
A combination of recent source control efforts and natural recovery has improved conditions such that Site cleanup levels are currently being met in surface sediment in a large portion of

Introduction
Compliance Monitoring Sampling and Quality Assurance Project Plan March 2016 Whatcom Waterway Cleanup in Phase 1 Site Areas 2 080007-01.04
the Site. However, where this layer of clean sediment is subject to potential disturbance from wind and wave events, navigational traffic, and planned future maintenance dredging, active remediation is required to prevent exposure to contaminants in subsurface sediment. Major activities within these areas include dredging, capping, containment wall installation, structure removal, structure replacement, and ancillary nearshore habitat improvements. In summary, the net environmental effects of the Project include the following:
• Removing up to 158,900 cubic yards of contaminated sediment • Placing up to 126,600 cubic yards of clean capping and residuals management
materials to prevent potential erosion and recontamination • Removing approximately 263 tons of creosote-treated timber (e.g., piling and
bulkheads) from the Site • Removing manmade debris from 46,950 square feet of shoreline and intertidal areas
within the Waterway, including concrete waste, asphalt rubble, and other miscellaneous debris
• Providing a net reduction of more than 4,300 square feet of overwater cover by removing unused existing structures
• Eliminating existing vertical bulkheads and providing new slopes at 2 horizontal to 1 vertical (2H:1V) or flatter in various shoreline areas
• Increasing the quantity and quality of intertidal and shallow subtidal habitat within the Project area and significantly improving habitat connectivity for a variety of fish and invertebrate species, including Endangered Species Act-listed Chinook salmon
Compliance monitoring includes water quality, performance (during and immediately following construction), and confirmation (long-term) monitoring to address overall project compliance objectives, including the following:
• Water Quality Monitoring: described in the Water Quality Monitoring Plan included as Appendix L of the EDR (Anchor QEA 2015c)
• Performance Monitoring: described in this SQAPP including collection and analysis of the following:
− Surface Sediment in Phase 1 cleanup areas − Physical Surveys in Phase 1 cleanup areas

Introduction
Compliance Monitoring Sampling and Quality Assurance Project Plan March 2016 Whatcom Waterway Cleanup in Phase 1 Site Areas 3 080007-01.04
− Crab Tissue in monitored natural recovery (MNR) areas − Juvenile Crab Tissue from Log Pond areas − Clam Tissue and Co-located Porewater in MNR areas
• Confirmation Monitoring: described in this SQAPP including collection and analysis of the following:
− Surface Sediment in Phase 1 cleanup and MNR areas − Subsurface Sediment in MNR areas − Physical Surveys in Phase 1 cleanup areas − Crab Tissue in MNR areas − Juvenile Crab Tissue from Log Pond areas − Clam Tissue and Co-located Porewater in MNR areas − Benthic Fish Tissue in MNR areas − Porewater in Phase 1 cleanup areas
Performance and confirmation monitoring is described in detail in this SQAPP.
1.2 Study Area
The Project is located along the Bellingham City waterfront in Whatcom County, Washington, including Bellingham Bay and adjacent areas. Adjacent MTCA cleanup sites include the Central Waterfront, GP West, I&J Waterway, Cornwall Avenue landfill, former South State Street Manufactured Gas Plant, and R.G. Haley sites. Industrial activities adjacent to the Site, dating back to the late 1800s, have resulted in sediment contamination. Additionally, the shorelines are generally devoid of vegetation and over-steepened because of manmade structures (e.g., creosote-treated timber bulkheads) or armored with concrete, asphalt, or other manmade debris. The Site also contains a number of derelict structures, including creosote-treated bulkheads, piles, and dolphins and overwater structures that limit habitat conditions and connectivity. The combination of contaminated sediments, over-steepened and armored shorelines, and derelict structures has resulted in the severely degraded habitat conditions within the Site.

Introduction
Compliance Monitoring Sampling and Quality Assurance Project Plan March 2016 Whatcom Waterway Cleanup in Phase 1 Site Areas 4 080007-01.04
The Site is broken into units by geographic area and required cleanup action within each unit; Phase 1 cleanup units are shown in Figure 1. Compliance monitoring will be conducted within Phase 1 cleanup units as well as in MNR areas within Bellingham Bay.
1.3 Project Schedule
Phase 1 cleanup activities are anticipated to be completed by March 2016. Performance monitoring will be conducted during cleanup activities and immediately following completion of construction (Year 0). Confirmation monitoring will be conducted over the long term (Years 1, 3, 5, 10, 20, and 30).
1.4 Contaminants of Concern
The Site includes sediments that have been impacted by contaminants historically released from industrial waterfront activities, including mercury discharges from the former Georgia-Pacific (GP) chlor-alkali plant. The chlor-alkali plant was located on a portion of the adjacent GP West mill site and operated between 1965 and 1999, when it was permanently closed. The chlor-alkali plant discharged mercury-containing wastewater into the Waterway, primarily during the late 1960s and 1970s. The Site boundary shown in Figure 1 was determined based on the extent of potentially significant surface and subsurface mercury contamination in sediments as determined during the Remedial Investigation and Feasibility Study (RI/FS; Hart Crowser 2000) process and during subsequent pre-remedial design investigations (PRDI) conducted during 2008 (Anchor QEA 2010). Other site-associated contaminants include wood waste and degradation products from historical log rafting activities and phenolic compounds from pulp mill wastewater discharges. Some contaminants (hydrocarbon compounds and heavy metals) associated with the Central Waterfront site are commingled with subsurface contamination in shoreline areas along the northern portion of the Waterway and are being remediated as part of the Site cleanup action described in this report. Soil and groundwater contaminants of concern for that

Introduction
Compliance Monitoring Sampling and Quality Assurance Project Plan March 2016 Whatcom Waterway Cleanup in Phase 1 Site Areas 5 080007-01.04
portion of the Central Waterfront site are described in the draft RI Report (Anchor QEA, 2015d) prepared for that site. Likewise, mercury and other contaminants are present in soils groundwater in portions of the GP West Mill Site along the southern shoreline of the Whatcom Waterway. Soil and groundwater contaminants of concern for the GP West site are described in the Final RI Report (Aspect, 2013) prepared for that site. Dioxin/furan compounds (D/F) are also known to be present in surface and subsurface sediments throughout most of Bellingham Bay. The full range of sources for these compounds in Bellingham Bay may include former combustion sources, former GP pulp and paper mill operations, former wood-treating facilities, historic and ongoing stormwater and wastewater discharges, and atmospheric deposition. The Washington State Department of Ecology (Ecology) has conducted sampling and issued a final data report documenting the regional background concentrations of D/F in Bellingham Bay from these multiple sources. Regional background concentrations are reported in that document to be 15 nanograms per kilogram (Ecology 2015). In addition, Ecology has revised the SMS regulations to consider regional background concentrations when establishing sediment cleanup levels. These Ecology efforts could result in a future amendment to the Consent Decree/Cleanup Action Plan (Ecology 2007) addressing D/F within the Site. Until then, reasonable and prudent measures to address D/F as part of the monitoring plan have been incorporated into the cleanup action and associated monitoring requirements. Compliance monitoring includes testing for the following:
• Site-related contaminants: mercury, copper, zinc, polycyclic aromatic hydrocarbons (PAH), and phenolic compounds
• Regional co-contaminants: D/F

Introduction
Compliance Monitoring Sampling and Quality Assurance Project Plan March 2016 Whatcom Waterway Cleanup in Phase 1 Site Areas 6 080007-01.04
1.5 Cleanup and Screening Levels
Table 1 defines cleanup levels and screening levels applicable to compliance monitoring. • Cleanup levels for the Site were documented in the Consent Decree (Ecology 2007). • Additional screening levels were developed as part of the EDR for use in evaluation of
potential groundwater-associated recontamination risks for sediments in Unit 4 (Log Pond) (Anchor QEA 2015a). These screening levels (Table 2) are more stringent than levels protective of marine aquatic species.
In addition to the foregoing, Ecology has defined regional background concentrations for D/F in Bellingham Bay as 15 nanograms per kilogram (Ecology 2015). Detailed response actions for each type of monitoring are provided in the CMCRP (Anchor QEA 2015b). The results of compliance monitoring will be reviewed by the Port and Ecology in the context of that document.
1.6 Document Organization
The remainder of this document is organized as follows:
• Section 2, Performance Monitoring: This section summarizes the sampling design, and sampling and processing methods for performance monitoring.
• Section 3, Confirmation Monitoring: This section summarizes the sampling design, and sampling and processing methods for confirmation monitoring.
• Section 4, General Sampling Methods: This section summarizes general procedures for sample handling and chain-of-custody procedures, laboratory analytical methods, and QA/QC procedures.
• Section 5, Project Management: This section describes DQOs, special training requirements, and documentation.
• Section 6, Assessments and Oversight: This section includes compliance assessments, response and corrective actions, and reports to management.
• Section 7, Data Validation and Usability: This section describes data validation and verification methods and criteria for usability of data.
• Section 7, References: This section presents relevant citations or reference material.

Compliance Monitoring Sampling and Quality Assurance Project Plan March 2016 Whatcom Waterway Cleanup in Phase 1 Site Areas 7 080007-01.04
2 PERFORMANCE (YEAR 0) MONITORING
2.1 Sampling Design
The overall compliance monitoring sampling design is summarized in Table 3 and includes the anticipated schedule based on current knowledge of the construction schedule. The sampling design is described in detail in subsequent sections. Performance monitoring includes the collection and analysis of sediment, tissue, and porewater as well as physical surveys. Performance monitoring will be conducted during Year 0 during and immediately after construction.
2.1.1 Sediment
Performance monitoring will include the collection of sediment at six locations during two events:
• Post-dredge in Unit 1C (prior to sand placement): sediment will be collected targeting two sample intervals.
− The residuals layer will be sampled to verify thickness and composition of dredging residuals
− The underlying (native) sediment layer will be sampled to verify dredging has achieved full removal of target sediments
• Post-dredge in Unit 1C (after sand placement): surface sediment from the biologically active zone will be collected to ensure sediment quality was achieved after placement of residuals management cover.
• Post-dredge in Units 2A and 3B (prior to sand placement): sediment will be collected from the layer of non-dredged sediment (underlying the residuals layer) to supplement existing data documenting chemical concentrations in the sediments being capped.
2.1.2 Crab Tissue
Crab tissue will be collected during performance monitoring to assess temporal impacts associated with Phase 1 construction and provide resource agencies, the Lummi Nation, and stakeholders with information on potential Site-related effects on crab tissue quality.

Performance (Year 0) Monitoring
Compliance Monitoring Sampling and Quality Assurance Project Plan March 2016 Whatcom Waterway Cleanup in Phase 1 Site Areas 8 080007-01.04
Performance monitoring will include the collection of adult crab tissue at three MNR locations and two reference locations, as well as juvenile crab tissue at two locations in Log Pond and one reference location. Crab tissue will be collected in Year 0, immediately following construction in Phase 1 cleanup areas.
2.1.3 Clam Tissue
Clam tissue will be collected during performance monitoring to assess temporal impacts associated with Phase 1 construction and provide resource agencies, the Lummi Nation, and stakeholders with information on potential Site-related effects on clam tissue quality. Performance monitoring will include the collection of clam tissue at five MNR locations and five reference locations in Year 0, immediately following construction in Phase 1 cleanup areas.
2.1.4 Porewater Monitoring – Co-Located With Clam Tissue
Porewater will be collected during performance monitoring to document mercury concentrations in sediment bioactive zone samples from areas used for clam testing and to supplement (along with bulk sediment data) results of clam tissue quality. Monitoring will include the collection of porewater at all clam tissue locations (five MNR locations and five reference locations) in Year 0.
2.1.5 Physical Surveys
Performance monitoring includes bathymetric surveys to verify 1) dredging has achieved target elevations as defined in the EDR; and 2) the effectiveness of residuals cover in Unit 1C and cap placement within Unit 4 (Log Pond) and Units 2A and 3B (Inner Waterway). Bathymetric surveys will be conducted during and immediately after construction.
2.2 Performance Monitoring Sample Collection and Processing
This section describes activities, methods, and procedures for sample collection and processing for performance monitoring. A list of station identifications, sampling locations, sample type and method, and analytical testing is provided in Tables 4 and 5. Station locations are shown in Figures 2, 3, and 4. Field forms are provided in Appendix A.

Performance (Year 0) Monitoring
Compliance Monitoring Sampling and Quality Assurance Project Plan March 2016 Whatcom Waterway Cleanup in Phase 1 Site Areas 9 080007-01.04
2.2.1 Sediment
Sediment will be collected using either a hydraulic or gravity-driven Van Veen grab sampler onboard a vessel equipped with an A-frame and sufficient deck space for staging of gear and sample processing. Three separate sampling events will be conducted:
• Samples will be collected at six locations in Unit 1C (Figure 2 and Table 4) following the completion of dredging and prior to cap placement.
• Samples will be collected from the same six locations in Unit 1C (Figure 2 and Table 4) after cap placement.
• Samples will be collected in Units 2A and 3B (Figure 3 and Table 4) following the completion of dredging and prior to cap placement.
More than one grab may be necessary at each station to provide sufficient sediment for chemical analyses, potential re-analysis, and contingent bioassays. The following field forms (provided in Appendix A) will be completed for surface sediment monitoring:
• Daily Log • Surface Sediment Grab Log
Surface Sediment Collection
Samples will be collected in the following manner in accordance with Puget Sound Estuary Program (PSEP) protocols (PSEP 1997):
• Vessel will maneuver to proposed station. • Van Veen will be decontaminated. • Van Veen will be deployed at an approximate speed of 0.3 foot per second. • The winch cable to the grab sampler will be drawn taut and as near vertical as
possible. • Station location will be measured and recorded. • The Van Veen will be closed to collect the sediment sample to a penetration depth of
between 10 and 30 centimeters (cm), depending upon sediment type and location-specific sampling interval.
• The sediment sample will be retrieved aboard the vessel and evaluated against the following PSEP acceptability criteria:

Performance (Year 0) Monitoring
Compliance Monitoring Sampling and Quality Assurance Project Plan March 2016 Whatcom Waterway Cleanup in Phase 1 Site Areas 10 080007-01.04
− Grab sampler is not overfilled (i.e., sediment surface is not against the top of the sampler).
− Sediment surface is relatively flat, indicating minimal disturbance or winnowing. − Overlying water is present, indicating minimal leakage. − Overlying water has low turbidity, indicating minimal sample disturbance. − Penetration depth consistent with PSEP protocols and project objectives is achieved.
Grab samples not meeting these criteria will be rejected, and the sample collection steps will be repeated until the acceptance criteria are met. Deployments will be repeated within a 25-foot radius of the proposed sample location. If adequate penetration is not achieved after three attempts, less penetration may be accepted or an alternate station will be identified in conjunction with the project manager. Any deviations will be noted on the daily log (Appendix A).
Surface Sediment Processing
The following protocols will be used to process accepted surface sediment samples:
• Siphon Water: Siphon off water overlying the sediment, taking care not to remove sediment.
• Photograph Grab: Take digital photographs of each grab with project, sample station, and date labeled on a white board, or similar.
• Sample Logging: Record the sample description on the surface sediment log (Appendix A), including, but not limited to, the following observations, as appropriate:
− Physical soil description in accordance with the Unified Soil Classification System (American Society for Testing Materials [ASTM] Method D2488; includes soil type, density/consistency, and color)
− Substantial product and sheens − Odor (e.g., hydrogen sulfide or petroleum) − Vegetation − Human-made debris − Biological activity (e.g., shells, tubes, bioturbation, or organisms) − Any other distinguishing characteristics or features

Performance (Year 0) Monitoring
Compliance Monitoring Sampling and Quality Assurance Project Plan March 2016 Whatcom Waterway Cleanup in Phase 1 Site Areas 11 080007-01.04
• Remove Debris: Materials in the sample more than 2 inches in diameter and debris will not be placed into sample containers.
Different depth intervals will be targeted for chemical analyses for each of the two performance monitoring events; further sample processing details are described in the following sections.
Analysis of Post-Dredge Samples (Prior to Cap Placement) – Units 2A and 3B
Performance monitoring conducted prior to cap placement in Units 2A and 3B will include the collection of surface sediment from one depth interval, the apparent undredged sediment layer (excluding the dredging residuals layer). The dredging residuals layer is expected to be approximately 6 cm thick and consist of thick, poorly consolidated materials; the thickness of this layer will be judged visually by the field team and removed to expose the underlying sediment. Samples will be collected from the underlying sediment layer, and the depth of this layer will be measured and noted on field logs. Processing for all target intervals will proceed as follows:
• Homogenize Sediment Layer: Collect sediment samples from the appropriate depth interval from inside the grab sampler, without touching the sidewalls, using a decontaminated stainless steel trowel or equivalent. Place the sediment into a single decontaminated stainless steel bowl and homogenize until uniform color and texture is achieved.
• Fill Sample Containers: Using a decontaminated stainless steel spoon, homogenized sediment will be placed into appropriate pre-labeled sample containers and stored in a cooler equipped with ice or another cold source to keep the samples cool prior to final packing for transport to the analytical laboratory following the handling and chain-of-custody (COC) protocols described in Section 2.7.
Surface sediment samples will be analyzed for the following parameters (see Table 8):
• Mercury • Copper • Zinc

Performance (Year 0) Monitoring
Compliance Monitoring Sampling and Quality Assurance Project Plan March 2016 Whatcom Waterway Cleanup in Phase 1 Site Areas 12 080007-01.04
• Semi-volatile organic compounds (including PAHs and phenolic compounds) • D/F • Total solids • Total organic carbon (TOC)
Analysis of Post-Dredge Samples (Prior to Cover Placement) – Unit 1C
Performance monitoring conducted prior to sand cover placement in Unit 1C will include the collection of surface sediment from two depth intervals, the dredging residuals layer and the underlying (native, non-dredged) layer. The dredging residuals layer is expected to be approximately 6 cm thick and consist of thick, poorly consolidated materials; the thickness of this layer will be judged visually by the field team. The underlying sediment will consist of sediment from the base of sampler. To ensure the collection of undisturbed sediments underlying the residuals, the samples will be collected from a 10-cm interval beginning 10 cm beneath the apparent residuals layer (e.g., assuming 6 cm of residuals, the sample would be collected between 16 and 26 cm below mudline). The depth of each layer collected will be measured and noted on field logs. The dredging residuals layer will be collected first and then sediment will be removed until the underlying sediment layer is encountered. Processing for both target intervals will proceed as follows:
• Homogenize Sediment Layer: Collect sediment samples from the appropriate depth interval from inside the grab sampler, without touching the sidewalls, using a decontaminated stainless steel trowel or equivalent. Place the sediment into a single decontaminated stainless steel bowl and homogenize until uniform color and texture is achieved.
• Fill Sample Containers: Using a decontaminated stainless steel spoon, homogenized sediment will be placed into appropriate pre-labeled sample containers and stored in a cooler equipped with ice or another cold source to keep the samples cool prior to final packing for transport to the analytical laboratory following the handling and chain-of-custody (COC) protocols described in Section 2.7.
Surface sediment samples will be analyzed for the following parameters (see Table 8):

Performance (Year 0) Monitoring
Compliance Monitoring Sampling and Quality Assurance Project Plan March 2016 Whatcom Waterway Cleanup in Phase 1 Site Areas 13 080007-01.04
• Mercury • D/F • Total solids • Total organic carbon (TOC)
Analysis of Post-Dredge Samples (After Cover Placement) – Unit 1C
Performance monitoring conducted after sand cover placement will include the collection of surface sediment from one depth interval, 0 to 12 cm (biologically active zone). Processing will proceed as follows:
• Homogenize Grab: Collect sediment samples from the 0- to 12-cm depth interval from inside the grab sampler, without touching the sidewalls, using a decontaminated stainless steel trowel or equivalent. Place the sediment into a single decontaminated stainless steel bowl and homogenize until uniform color and texture is achieved.
• Fill Sample Containers: Using a decontaminated stainless steel spoon, homogenized sediment will be placed into appropriate pre-labeled sample containers and stored in a cooler equipped with ice or another cold source to keep the samples cool prior to final packing for transport to the analytical laboratory following the handling and COC protocols described in Section 2.7.
Surface sediment samples will be analyzed for the following parameters (see Table 8):
• Mercury • D/F • Total solids • TOC
In addition, contingent bioassays will be conducted if site cleanup levels for sediment are exceeded (see Table 1). If required, contingent bioassays will include three standard Puget Sound Estuary Program (PSEP) tests:
• 10-day amphipod test • 20-day juvenile polychaete growth test • Larval development test

Performance (Year 0) Monitoring
Compliance Monitoring Sampling and Quality Assurance Project Plan March 2016 Whatcom Waterway Cleanup in Phase 1 Site Areas 14 080007-01.04
Further information regarding bioassay testing is provided in Section 4.6.
2.2.2 Physical Surveys
Performance monitoring will include multi-beam bathymetric surveys conducted in dredged, residual, and capped areas (see Figure 1). Surveys will be conducted by a licensed surveyor and will meet or exceed the accuracy standards for a U.S. Army Corps of Engineers (USACE) Navigation and Dredging Support Survey as referenced in the USACE Hydrographic Survey Manual, April 2004 Revision (USACE 2004). Multiple surveys will be conducted over each transect to ensure accurate results. Surveys will be conducted after dredging, and results will be used to compare current mudline elevations against previous surveys to confirm target elevations have been achieved. Additionally, bathymetric surveys will be conducted after cap placement to provide a baseline for comparison purposes to determine cap integrity and track changes to the cap (e.g., settling, sedimentation) over the long term.
2.2.3 Crab Tissue
Performance monitoring will include the collection of Dungeness crab tissue during Year 0 between April and June immediately following construction. Crab tissue will be collected using crab pots deployed and retrieved from a vessel equipped with sufficient deck space for staging of gear. Adult crabs will be collected at three locations within the Site and two reference areas in Samish Bay; juvenile crabs will be collected in the Log Pond and at a reference location near Brant and Portage Islands (Figures 4 and 5, Table 5). The following field forms (provided in Appendix A) will be completed for crab tissue monitoring:
• Daily Log • Crab Log
Scientific collection permits will be obtained from the Washington Department of Fish and Wildlife (WDFW) prior to crab collection.
Crab Tissue Collection
Crab traps will be baited and deployed for the collection of adult Dungeness crabs at each sampling location. Cages will be soaked in clean seawater overnight or pressure washed with

Performance (Year 0) Monitoring
Compliance Monitoring Sampling and Quality Assurance Project Plan March 2016 Whatcom Waterway Cleanup in Phase 1 Site Areas 15 080007-01.04
fresh water prior to deployment. Cages will be affixed with a rope and buoy to aid in recovery. Juvenile crabs will be collected from the intertidal zone using ring nets. Global Positioning System (GPS) locations will be recorded on field forms. Adult male Dungeness crabs with a minimum carapace width of 16.5 cm will be targeted for collection at MNR and reference locations; retention of female and soft-shell crabs is not allowed. Two to three crab traps will be placed for 24 to 48 hours at each of the five sampling locations. If no crabs are caught in the first attempt, the crab traps will be replaced for an additional 24 hours. The target locations of the crab traps may be moved around each sampling location if necessary. At a minimum, one adult male crab will be collected at each sampling location (from any of the replicate cages). If, after 24 hours, few or none of the male crabs collected are larger than 16.5 cm, then adult male crabs smaller than 16.5 cm may be retained for analysis, per the best professional judgment of field staff conducting the crab sampling. Juvenile Dungeness crabs with a target carapace width of 5 to 8 cm (maximum width of 12 cm) will be collected along the shoreline in the Log Pond area and at the reference location near Brant Island; crabs may be collected anywhere within the buffer zone shown in Figure 4 to create one composite for analysis. Two to three juvenile crabs will be collected at each station to create station composites. However, a minimum tissue volume of 20 grams is needed for analyses, and the number of crabs needed may vary amongst the stations.
Crab Tissue Processing
Upon retrieval of the traps, the crab species and sex will be identified. The carapace width of the crabs will be measured with calipers. Crabs will be collected based on target width requirements depending on the station location (discussed above). Upon retrieval of crab traps, retained crabs’ claws may be rubber banded, and crabs from each station will be separately placed on ice within a labeled cooler. Crabs will be transported to the chemical laboratory, where they will be frozen at -20°C until processing. Adult crabs will be thawed and weighed, and the carapace width of each will be

Performance (Year 0) Monitoring
Compliance Monitoring Sampling and Quality Assurance Project Plan March 2016 Whatcom Waterway Cleanup in Phase 1 Site Areas 16 080007-01.04
measured again. The muscles of the sternal plates, legs, and claws will be dissected from each crab and individually weighed (to the nearest gram). Muscle tissues of one crab will be pooled for each sampling location and placed into pre-cleaned glass jars. Juvenile crabs will be analyzed as whole-body composites. Samples will be stored frozen until analyzed for the following parameters (see Table 9):
• Lipids • Mercury
2.2.4 Clam Tissue
Performance monitoring will include the collection of clam tissue from a vessel at five locations within the Site and five locations in the Samish Bay reference area (Figures 4 and 5, Table 5). Caged clams will be placed at locations in April or May immediately following construction and left in situ for 30 days in accordance with ASTM Method E2122-02. The following field forms (provided in Appendix A) will be completed for clam tissue monitoring:
• Daily Log • Clam Log
Caged Clam Preparation and Deployment
Cages will be constructed of wire mesh consistent with ASTM Method E2122-02 and affixed with a rope and buoy to facilitate identification and recovery. Cages will be soaked in clean seawater overnight or pressure washed with fresh water prior to use. The target clam species for monitoring is Venerupis japonica (manila clam), which will be purchased from a local shellfish supplier. 30 clams will be placed in each of three replicate cages per station at all 10 stations (5 site locations and 5 reference locations) to provide adequate tissue volume for analyses. Cages will be pushed slightly into the sediment surface by divers and anchored in place. GPS coordinates will be logged on field forms. Cages will be left in situ for 30 days.

Performance (Year 0) Monitoring
Compliance Monitoring Sampling and Quality Assurance Project Plan March 2016 Whatcom Waterway Cleanup in Phase 1 Site Areas 17 080007-01.04
Clam Tissue Collection and Processing
Cages will be retrieved by divers from a vessel. Clams from replicate cages will be kept separate, labeled, and placed in a cooler on ice. Processing will occur at the analytical laboratory. Clams will be depurated in clean saltwater for 24 hours; shells will be scrubbed free of debris and measured for shell length. Clams will be shucked using a clean stainless steel shucking knife on a clean surface (Alconox® scrubbed and rinsed). Clam tissue will not contact the work surface during preparation, and only clams collected live will be selected for analysis. Clam tissue will be weighed in a clean aluminum weigh boat. Soft body tissue samples will be composited from each cage separately and then an overall station composite will be created. For each station, clam tissue composite samples from each of the three cages deployed will be archived in the event additional analyses are necessary. Composited tissue samples will be stored in glass containers until laboratory analyses are conducted (see Table 9). In addition, tissue samples from clams obtained from the supplier and not exposed to sediments will also be submitted for analyses to measure background contaminant levels that may be present. Tissue will be analyzed for the following parameters:
• Lipids • Mercury
2.2.5 Co-Located Porewater
Performance monitoring will include the collection of porewater co-located at clam monitoring locations (five locations within the Site and five locations in the Samish Bay reference area; Figures 4 and 5, Table 5). Sediment porewater will be collected near clam cages using either nylon mesh diffusion samplers (NMDS) or temporary mini-piezometers. NMDS is the preferred method due to ease of use in all sediment types (sand and silts/clay) and reliability and consistency of data obtained using this method. The following field forms (provided in Appendix A) will be completed for clam tissue and co-located porewater monitoring:
• Daily Log • Well Installation Log (if mini-piezometer is used) • Porewater Collection Log (if mini-piezometer is used)

Performance (Year 0) Monitoring
Compliance Monitoring Sampling and Quality Assurance Project Plan March 2016 Whatcom Waterway Cleanup in Phase 1 Site Areas 18 080007-01.04
Co-Located Porewater Collection
Option 1 (preferred): Nylon-mesh Diffusion Samplers
Porewater may be collected using NMDS following methods used by the U.S. Geological Survey and U.S. Environmental Protection Agency (USGS and USEPA 2003). NMDS are a type of passive sampler that can be used in both course and fine sediments, provide a comparable measure with which to compare clam exposure over the duration of the incubation period, and limit the introduction of confounding factors (such as erroneously drawing surface water or sediment into the sample). NMDS consist of 250-milliliter (mL) polypropylene jars and screw-on lids. NMDS are constructed prior to the field effort using the following procedures:
• Remove the center of the lid so that just the rim remains. • Place all equipment in buckets/tubs with deionized water that has been purged of
oxygen via aerating with nitrogen for at least 1 hour. Continue aerating with nitrogen while assembling the NMDS.
• Place a piece of 120-micron nylon screen mesh over the top of the jar and screw on the lid rim.
• Store jars in the assembly buckets with lids firmly sealed and under nitrogen headspace to prevent contamination until deployment.
NMDS will be deployed by divers near clam cages using the following procedures:
• Attach a small buoy to each NMDS using an electrical tie and rope. • A small shovel-like device made from polyvinyl chloride (PVC) may be used to create
a hole in the sediment in which the samplers will reside (see USGS and USEPA 2003 for details).
• Bury jars 6 to 12 cm in the sediment placed on their sides to prevent the mesh from being punctured during deployment and retrieval.
• Cover the NMDS with sediment. • Record GPS coordinates on field forms. • NMDS will be left in situ for a minimum of 4 days to equilibrate.
NMDS will be retrieved using GPS coordinates and the buoys in the following manner:

Performance (Year 0) Monitoring
Compliance Monitoring Sampling and Quality Assurance Project Plan March 2016 Whatcom Waterway Cleanup in Phase 1 Site Areas 19 080007-01.04
• Gently pull the samplers to the surface using the rope attached to each NMDS. Caution will be used while removing samplers from the sediment to avoid damaging the nylon mesh.
• Once on board the vessel, any sediment remaining on the top of the mesh will be gently removed to minimize the loss of water from the sampler.
• Porewater will be extracted using a 60-mL disposable syringe:
− For dissolved mercury analysis, a 13-gage, 8.9-cm hypodermic needle and a 25-millimeter (mm), 0.45-micron filter unit mounted between the syringe and needle (see USGS and USEPA 2003 method for a picture of the assembly) will be used to collect the sample.
− For total mercury analysis, the filter will be removed, and the hypodermic needle connected directly to the syringe to collect the sample.
• For each sample (total and dissolved), the syringe assembly will be pushed into the mesh and 100 mL will be drawn in the syringe.
• The filter and hypodermic needle will be removed from the syringe and the sample volume gently pushed into the sample container. The sample container will be tightly sealed.
Option 2: Mini-piezometers
Alternatively, porewater may be collected using diver-assisted push-point mini-piezometers. A mini-piezometer is a mini well point constructed of a stainless-steel rod with a screened end at the tip. The design includes a probe with a heavier-weight stainless-steel construction, approximately 2-inch screened (0.5-mm slot) interval with a smaller aperture size near the tip of the probe, and a base plate attachment that sits at the mudline elevation to minimize drawdown from the overlying surface water. A schematic of the porewater sampling device is shown on Figure 6. Larger screen (4- and 6-inch) intervals will be used if the screen becomes clogged due to fine-grained sediment. If used, mini-piezometers will be placed by divers and driven approximately 6 to 12 cm into the sediment. Clean polyethylene tubing will be connected to the end (opposite end of screened portion) of the mini-piezometer and extended through the water column to the deck of the sampling vessel and into a peristaltic pump or similar type pumping device. Samples for total mercury

Performance (Year 0) Monitoring
Compliance Monitoring Sampling and Quality Assurance Project Plan March 2016 Whatcom Waterway Cleanup in Phase 1 Site Areas 20 080007-01.04
analysis will be collected directly into sample containers; samples for dissolved mercury analysis will be filtered through a 0.45-mm cartridge as the sample is pumped directly into sample containers.
Co-Located Porewater Processing
Porewater sample containers will be appropriately labeled and stored in coolers with ice at approximately 4°C until delivery to the laboratory. Samples will be analyzed for the following parameters (see Table 10):
• Total and dissolved mercury

Compliance Monitoring Sampling and Quality Assurance Project Plan March 2016 Whatcom Waterway Cleanup in Phase 1 Site Areas 21 080007-01.04
3 CONFIRMATION MONITORING (YEAR 1–30)
3.1 Sampling Design
The overall compliance monitoring sampling design is summarized in Table 3 and includes the anticipated schedule. The sampling design is described in detail in subsequent sections. Confirmation monitoring includes the collection and analysis of surface and subsurface sediment, tissue, and porewater as well as physical surveys. Confirmation monitoring will be conducted in Years 1, 3, 5, 10, 20, and 30. Additional monitoring may be required to assess the effectiveness of any necessary contingency actions.
3.1.1 Surface Sediment
Surface sediment will be collected during confirmation monitoring to document the effectiveness of remediation in maintaining cleanup levels for site contaminants. Confirmation monitoring will include the collection of surface sediment at 11 locations within Phase 1 remediation areas and 11 MNR locations throughout Bellingham Bay during the summer season in Years 1, 3, 5, 10, 20, and 30.
3.1.2 Subsurface Sediment
Subsurface sediment will be collected during confirmation monitoring to assess changes over time in the thickness of a clean sediment cover overlying subsurface sediments containing elevated mercury concentrations. Confirmation monitoring will include the collection of subsurface sediment at five stations co-located with MNR surface sediment stations in Bellingham Bay during the summer season in Years 1, 10, 20, and 30.
3.1.3 Crab Tissue
Confirmation monitoring will be conducted to evaluate mercury tissue concentrations over time and provide resource agencies, the Lummi Nation, and stakeholders with information on potential Site-related effects on crab tissue quality. Crab tissue monitoring will be conducted between April and June during Years 1, 3, 5, and 10 unless mercury concentrations in Site samples are not statistically different than reference sample concentrations for two consecutive sampling rounds. At that point, crab tissue monitoring will be discontinued.

Confirmation Monitoring (Year 1–30)
Compliance Monitoring Sampling and Quality Assurance Project Plan March 2016 Whatcom Waterway Cleanup in Phase 1 Site Areas 22 080007-01.04
3.1.4 Clam Tissue
Confirmation monitoring will be conducted to evaluate mercury tissue concentrations over time and provide resource agencies, the Lummi Nation, and stakeholders with information on potential Site-related effects on clam tissue quality. Clam tissue monitoring will be conducted between April and June during Years 1, 3, 5, and 10 unless mercury concentrations in Site samples are not statistically different than reference sample concentrations for two consecutive sampling rounds. At that point, clam tissue monitoring will be discontinued.
3.1.5 Benthic Fish Tissue
Benthic fish tissue will be collected during confirmation monitoring to: 1) measure mercury and D/F concentrations in benthic fish tissue within the Site compared to those in fish collected from reference areas; 2) evaluate mercury tissue concentrations and trends over time; 3) provide resource agencies, the Lummi Nation, and stakeholders with information on potential Site-related effects on benthic fish tissue quality; and 4) provide D/F data to Ecology to support the understanding of regional conditions in Bellingham Bay. Confirmation monitoring will include the collection of benthic fish tissue along trawl lines within Site and Samish Bay (reference) areas in Year 3. Benthic fish will be collected between March 1 and July 15. Additionally, benthic fish tissue may be collected in Years 5 and 10 if fish mercury concentrations are significantly elevated in comparison to fish tissue collected from clean reference sites during the previous monitoring event, as confirmed by a statistical comparison.
3.1.6 Pelagic Fish Tissue
Pelagic fish tissue monitoring will only be conducted if analysis of benthic fish tissue indicates a potential for Site-related sediment contamination to measurably impact tissue mercury concentrations in pelagic species. If required, confirmation monitoring will include the collection of pelagic fish tissue within Site as well as Samish Bay (reference) areas between March 1 and July 15. If collected, data will be used to: 1) evaluate concentrations of mercury in pelagic fish (i.e., salmon) caught from within the Site; 2) compare pelagic fish tissue data quality with tissue from a clean reference site and available literature data;

Confirmation Monitoring (Year 1–30)
Compliance Monitoring Sampling and Quality Assurance Project Plan March 2016 Whatcom Waterway Cleanup in Phase 1 Site Areas 23 080007-01.04
3) inform resource agencies, the Lummi Nation, and stakeholders regarding potential Site-related effects on pelagic fish tissue quality; and 4) if confirmation monitoring indicates elevated concentrations of Site-related mercury in pelagic fish tissue concentrations, evaluate long-term trends in mercury concentrations in pelagic fish caught from within the Site.
3.1.7 Porewater in Unit 4 (Log Pond)
Porewater will be collected during confirmation monitoring in Unit 4 to assess groundwater as a source of potential sediment recontamination and ensure protection of marine aquatic species. Monitoring will include the collection of porewater at two locations during years 1, 3, 5, and 10.
3.1.8 Porewater Monitoring – Co-Located With Clam Tissue
Porewater will be collected during confirmation monitoring to document mercury concentrations in sediment bioactive zone samples from areas used for clam testing and to supplement (along with bulk sediment data) results of clam tissue quality. Monitoring will include the collection of porewater at all clam tissue locations (five MNR locations and five reference locations) during any clam tissue collection events during subsequent monitoring periods.
3.1.9 Physical Surveys
Confirmation monitoring includes bathymetric and visual surveys in Years 1, 3, 5, and 10 to assess the long-term physical integrity of capped areas. Bathymetric surveys will be used to 1) verify cap integrity is being maintained and not being adversely affected by natural and anthropogenic forces in Phase 1 capping areas (Units 2A, 3B, 4, and the transition cap between Unit 1C and 2C); and 2) document conditions in the natural recovery area at the head of Whatcom Waterway (Unit 3A). Visual monitoring will be conducted in parallel with bathymetry surveys along shoreline areas of the Inner Waterway (Units 2A and 3B) and Log Pond (Unit 4). Visual monitoring will be used to document the condition of the bank armoring materials and exposed portions of containment structures and bulkheads above the line of Ordinary High Water and to look for indications of settlement, seepage, or other conditions (outside of the anticipated conditions).

Confirmation Monitoring (Year 1–30)
Compliance Monitoring Sampling and Quality Assurance Project Plan March 2016 Whatcom Waterway Cleanup in Phase 1 Site Areas 24 080007-01.04
3.2 Confirmation Monitoring Sample Collection and Processing
This section describes activities, methods, and procedures for sample collection and processing. A list of station identifications, sampling locations, sample type and method, and analytical testing is provided in Tables 5 and 6. Station locations are shown in Figures 4, 5, and 7. Field forms are provided in Appendix A.
3.2.1 Surface Sediment
Confirmation monitoring will include the collection of surface sediment using either a hydraulic or gravity-driven Van Veen grab sampler onboard a vessel equipped with an A-frame and sufficient deck space for staging of gear and sample processing. Samples will be collected at 22 locations (11 locations within Phase 1 remediation areas and 11 MNR locations throughout Bellingham Bay; Figure 7 and Table 6). More than one grab may be necessary at each station to provide sufficient sediment for chemical analyses, potential re-analysis, and contingent bioassays. Surface sediment will be collected in Years 1, 3, 5, 10, 20, and 30. The following field forms (provided in Appendix A) will be completed for surface sediment monitoring:
• Daily Log • Surface Sediment Grab Log
Surface Sediment Collection
Samples will be collected in the following manner in accordance with PSEP protocols (1997):
• Vessel will maneuver to proposed station. • Van Veen will be decontaminated. • Van Veen will be deployed at an approximate speed of 0.3 foot per second. • The winch cable to the grab sampler will be drawn taut and as near vertical as
possible. • Station location will be measured and recorded. • The Van Veen will be closed to collect the sediment sample to a penetration depth of
approximately 20 cm, depending upon sediment type.

Confirmation Monitoring (Year 1–30)
Compliance Monitoring Sampling and Quality Assurance Project Plan March 2016 Whatcom Waterway Cleanup in Phase 1 Site Areas 25 080007-01.04
• The sediment sample will be retrieved aboard the vessel and evaluated against the following PSEP acceptability criteria:
− Grab sampler is not overfilled (i.e., sediment surface is not against the top of the sampler).
− Sediment surface is relatively flat, indicating minimal disturbance or winnowing. − Overlying water is present, indicating minimal leakage. − Overlying water has low turbidity, indicating minimal sample disturbance. − Penetration depth consistent with PSEP protocols and project objectives is
achieved. Grab samples not meeting these criteria will be rejected, and the sample collection steps will be repeated until the acceptance criteria are met. Deployments will be repeated within a 25-foot radius of the proposed sample location. If adequate penetration is not achieved after three attempts, less penetration may be accepted or an alternate station will be identified in conjunction with the project manager. Any deviations will be noted on the daily log (Appendix A).
Surface Sediment Processing
One depth interval will be collected for all samples, 0 to 12 cm, with one exception:
• PICM-11-SS will have 2 sample intervals: 0 to 2 cm (to provide information on potential recent sedimentation because the location is near an outfall) and 0 to 12 cm (used to assess cleanup).
The following protocols will be used to process accepted surface sediment samples:
• Siphon Water: Siphon off water overlying the sediment, taking care not to remove sediment.
• Photograph Grab: Take digital photographs of each grab with project, sample station, and date labeled on a white board, or similar.
• Sample Logging: Record the sample description on the surface sediment log (Appendix A), including, but not limited to, the following observations, as appropriate:

Confirmation Monitoring (Year 1–30)
Compliance Monitoring Sampling and Quality Assurance Project Plan March 2016 Whatcom Waterway Cleanup in Phase 1 Site Areas 26 080007-01.04
− Physical soil description in accordance with the Unified Soil Classification System (ASTM Method D2488; includes soil type, density/consistency, and color)
− Substantial product and sheens − Odor (e.g., hydrogen sulfide or petroleum) − Vegetation − Human-made debris − Biological activity (e.g., shells, tubes, bioturbation, or organisms) − Any other distinguishing characteristics or features
• Remove Debris: Materials in the sample more than 2 inches in diameter and debris will not be placed into sample containers.
• Homogenize Sediment Layer: Collect sediment samples from the appropriate depth interval (0 to 12 cm except station PICM-11-SS, which includes two intervals, 0 to 2 cm and 0 to 12 cm) from inside the grab sampler, without touching the sidewalls, using a decontaminated stainless steel trowel or equivalent. Place the sediment into a single decontaminated stainless steel bowl and homogenize until uniform color and texture is achieved.
• Fill Sample Containers: Using a decontaminated stainless steel spoon, homogenized sediment will be placed into appropriate pre-labeled sample containers and stored in a cooler equipped with ice or another cold source to keep the samples cool prior to final packing for transport to the analytical laboratory following the handling and COC protocols described in Section 2.7.
Surface sediment samples will be analyzed for the following parameters (see Table 8):
• Mercury • Copper • Zinc • PAH • Phenolic compounds • D/F • Total solids • TOC

Confirmation Monitoring (Year 1–30)
Compliance Monitoring Sampling and Quality Assurance Project Plan March 2016 Whatcom Waterway Cleanup in Phase 1 Site Areas 27 080007-01.04
In addition, contingent bioassays will be conducted at each station where site cleanup levels for sediment are exceeded (see Table 1). If required, contingent bioassays will include three standard Puget Sound Estuary Program (PSEP) tests:
• 10-day amphipod test • 20-day juvenile polychaete growth test • Larval development test
Further information regarding bioassay testing is provided in Section 4.6.
3.2.2 Subsurface Sediment
Subsurface sediment will be collected using a vibracore onboard a vessel equipped with an A-frame and sufficient deck space for staging of gear and sample processing. Samples will be collected at five locations in MNR areas (Figure 7 and Table 6). Subsurface sediment will be collected in Years 1, 10, 20, and 30. The following field forms (provided in Appendix A) will be completed for subsurface sediment monitoring:
• Daily Log • Sediment Core Collection Log • Sediment Core Processing Log
Subsurface Sediment Collection
Sediment cores will be collected using a vibracore. A new core tube (or liner) will be used for sampling at each station to eliminate the possibility of cross contamination among stations. The vibracore will be deployed from the vessel using the A-frame and hydraulic winch. The vibracore will be energized as it nears the bottom and supported upright with the winch line during penetration into the sediment. The vibracore will penetrate into the sediment to the target core depth of 3 feet below the sediment water interface or refusal, whichever comes first. Upon completing penetration at a station, the vibracore will be shut down, the position recorded, and the sampler recovered. After the core is on deck, the liner containing sediment will be extracted onto a core tray. Refusal will be defined as less than 5 cm of penetration per minute. If refusal is encountered, the vessel will be slightly moved and a second core attempted, then, if needed, a third

Confirmation Monitoring (Year 1–30)
Compliance Monitoring Sampling and Quality Assurance Project Plan March 2016 Whatcom Waterway Cleanup in Phase 1 Site Areas 28 080007-01.04
attempt. If refusal is encountered after the third attempt, additional cores will not be attempted unless operational problems are suspected. The longest of the three cores will be retained for analysis.
Subsurface Sediment Processing
Cores will be processed onboard the sampling vessel. Core tubes will be cut open using electric shears. Each core will be photographed and visually characterized according to the Unified Soils Classification System (ASTM Method D2488) and visually examined for evidence of deposition/erosion. Sub-samples will be collected in 0.5-foot sections using clean stainless-steel spoons, homogenized in stainless-steel bowls, and placed into appropriate sample containers for subsequent analyses of chemical and physical parameters. Sample containers will be appropriately labeled and stored in coolers on ice until delivery to the laboratory (see Section 2.7). Subsurface sediment samples will be analyzed for the following parameters (see Table 8):
• Mercury • Total solids
3.2.3 Physical Surveys
Confirmation monitoring will include multi-beam bathymetric surveys and visual surveys to verify the physical integrity of capped areas (see Figure 1) over the long term. Bathymetry and visual surveys will be conducted in parallel for capping in Units 2A, 3B, and 4. In addition, a bathymetric survey will be conducted in the capped transition area between Unit 1C and Unit 2C. Bathymetric surveys will be conducted by a licensed surveyor and will meet or exceed the accuracy standards for a USACE Navigation and Dredging Support Survey as referenced in the USACE Hydrographic Survey Manual, April 2004 Revision (USACE 2004). Multiple surveys will be conducted over each transect to ensure accurate results. Survey results will be used to evaluate changes in mudline elevations in comparison to previous surveys. Changes in mudline elevations over time will be compared with anticipated cap

Confirmation Monitoring (Year 1–30)
Compliance Monitoring Sampling and Quality Assurance Project Plan March 2016 Whatcom Waterway Cleanup in Phase 1 Site Areas 29 080007-01.04
settlement/consolidation parameters defined in the EDR and area sedimentation rates defined during the RI/FS. Visual surveys will be conducted by field staff from a vessel to document the condition of the bank armoring materials and exposed portions of containment structures above the line of Ordinary High Water. The following field form will be used during visual surveys:
• Daily Log • Visual Observations Log
3.2.4 Crab Tissue
Confirmation monitoring will include the collection of adult Dungeness crab tissue in Year 1; adult crab tissue monitoring may also be conducted in Years 3, 5, and 10 depending upon whether elevated tissue concentrations are measured during the previous monitoring events. Adult crab tissue monitoring will be discontinued once contaminant concentrations in Site tissues are not statistically elevated above reference tissue concentrations for two consecutive monitoring events. Confirmation monitoring will also include the collection of juvenile Dungeness crab tissue in Year 3. Adult crab tissue will be collected using crab pots deployed and retrieved from a vessel equipped with sufficient deck space for staging of gear. Samples will be collected at three locations within the Site and two reference areas in Samish Bay (Figures 4 and 5, Table 5). Juvenile crab tissue will be collected from the intertidal zone using ring nets. Samples will be collected from the Log Pond and from the reference location near Portage and Brant Islands (Figures 4 and 5, Table 5). The following field forms (provided in Appendix A) will be completed for crab tissue monitoring:
• Daily Log • Crab Log
Scientific collection permits will be obtained from WDFW prior to crab collection.

Confirmation Monitoring (Year 1–30)
Compliance Monitoring Sampling and Quality Assurance Project Plan March 2016 Whatcom Waterway Cleanup in Phase 1 Site Areas 30 080007-01.04
Crab Tissue Collection
Crab traps will be baited and deployed for the collection of adult Dungeness crabs at each sampling location. Cages will be soaked in clean seawater overnight or pressure washed with fresh water prior to deployment. Cages will be affixed with a rope and buoy to aid in recovery. Juvenile crabs will be collected from the intertidal zone using ring nets. GPS locations will be recorded on field forms. Adult male Dungeness crabs with a minimum carapace width of 16.5 cm will be targeted for collection at MNR and reference locations; retention of female and soft-shell crabs is not allowed. Two to three crab traps will be placed for 24 to 48 hours at each of the five sampling locations. If no crabs are caught in the first attempt, the crab traps will be replaced for an additional 24 hours. The target locations of the crab traps may be moved around each sampling location if necessary. At a minimum, one adult male crab will be collected at each sampling location (from any of the replicate cages). If, after 24 hours, few or none of the male crabs collected are larger than 16.5 cm, then adult male crabs smaller than 16.5 cm may be retained for analysis, per the best professional judgment of field staff conducting the crab sampling. Juvenile Dungeness crabs with a target carapace width of 5 to 8 cm (maximum of 12 cm) will be collected within the Log Pond and at the reference location on Brant Island; crabs may be collected anywhere within the buffer zone shown in Figure 4. The number of juvenile crabs needed will be dependent upon the size of crabs attained. A minimum tissue volume of 20 grams is needed for analyses.
Crab Tissue Processing
Upon retrieval of the traps or net, the crab species and sex will be identified. The carapace width of the crabs will be measured with calipers. Crabs will be collected based on target width requirements depending on the station location (discussed above). Upon retrieval, retained crabs’ claws may be rubber banded, and crabs from each station will be separately placed on ice within a labeled cooler.

Confirmation Monitoring (Year 1–30)
Compliance Monitoring Sampling and Quality Assurance Project Plan March 2016 Whatcom Waterway Cleanup in Phase 1 Site Areas 31 080007-01.04
Crabs will be transported to the chemical laboratory, where they will be frozen at -20°C until processing. Adult crabs will be thawed and weighed, and the carapace width of each will be measured again. The muscles of the sternal plates, legs, and claws will be dissected from each crab and individually weighed (to the nearest gram). Muscle tissues of one crab will be pooled for each sampling location and placed into pre-cleaned glass jars. Juvenile crabs will be analyzed as whole-body composites. Samples will be stored frozen until analyzed for the following parameters (see Table 9):
• Lipids • Mercury
3.2.5 Clam Tissue
Confirmation monitoring will include the collection of co-located clam tissue and porewater in Year 1. Clam tissue and co-located porewater monitoring may also be conducted in Years 3, 5, and 10 dependent upon whether elevated concentrations are measured during the previous monitoring events. Clam tissue and co-located porewater monitoring will be discontinued once contaminant concentrations in Site tissues are not statistically elevated above reference tissue concentrations for two consecutive monitoring events. Clams and co-located porewater will be deployed and retrieved from a vessel at five locations within the Site and five locations in the Samish Bay reference area (Figures 4 and 5, Table 5). Caged clams will be placed at locations and left in situ for 30 days in accordance with ASTM Method E2122-02. Temporary mini-piezometers will be used to collect sediment porewater near clam cages. The following field forms (provided in Appendix A) will be completed for clam tissue and co-located porewater monitoring:
• Daily Log • Clam Log • Well Installation Log • Porewater Collection Log

Confirmation Monitoring (Year 1–30)
Compliance Monitoring Sampling and Quality Assurance Project Plan March 2016 Whatcom Waterway Cleanup in Phase 1 Site Areas 32 080007-01.04
Caged Clam Preparation and Deployment
Cages will be constructed of wire mesh consistent with ASTM Method E2122-02 and affixed with a rope and buoy to facilitate identification and recovery. Cages will be soaked in clean seawater overnight or pressure washed with fresh water prior to use. The target clam species for monitoring is Venerupis japonica (manila clam), which will be purchased from a local shellfish supplier. Thirty clams will be placed in each of three replicate cages per station to provide adequate tissue volume for analyses. Cages will be pushed slightly into the sediment surface by divers and anchored in place. GPS coordinates will be logged on field forms. Cages will be left in situ for 30 days.
Clam Tissue Collection and Processing
Cages will be retrieved by divers from a vessel. Clams from replicate cages will be kept separate, labeled, and placed in a cooler on ice. Processing will occur at the analytical laboratory. Clams will be depurated in clean saltwater for 24 hours; shells will be scrubbed free of debris and measured for shell length. Clams will be shucked using a clean stainless steel shucking knife on a clean surface (Alconox® scrubbed and rinsed). Clam tissue will not contact the work surface during preparation, and only clams collected live will be selected for analysis. Clam tissue will be weighed in a clean aluminum weigh boat. Soft body tissue samples will be composited from each cage separately and then an overall station composite will be created. For each station, clam tissue composite samples from each of the three cages deployed will be archived in the event additional analyses are necessary. Composited tissue samples will be stored in glass containers until the following analyses (see Table 9) are conducted:
• Lipids • Mercury
3.2.6 Co-Located Porewater
Confirmation monitoring will include the collection of porewater co-located at clam monitoring locations (five locations within the Site and five locations in the Samish Bay reference area; Figures 4 and 5, Table 5). Sediment porewater will be collected near clam cages

Confirmation Monitoring (Year 1–30)
Compliance Monitoring Sampling and Quality Assurance Project Plan March 2016 Whatcom Waterway Cleanup in Phase 1 Site Areas 33 080007-01.04
using either NMDS or temporary mini-piezometers. NMDS is the preferred method due to ease of use in any sediment type (sand and silts/clay) and reliability and consistency of data obtained using this method. The following field forms (provided in Appendix A) will be completed for clam tissue and co-located porewater monitoring:
• Daily Log • Well Installation Log (if mini-piezometer is used) • Porewater Collection Log (if mini-piezometer is used)
Co-Located Porewater Collection
Option 1 (preferred): Nylon-mesh Diffusion Samplers
Porewater may be collected using NMDS following methods used by the U.S. Geological Survey and U.S. Environmental Protection Agency (USGS and USEPA 2003). NMDS are a type of passive sampler that can be used in both course and fine sediments, provide a comparable measure with which to compare clam exposure over the duration of the incubation period, and limit the introduction of confounding factors (such as erroneously drawing surface water or sediment into the sample). NMDS consist of 250-mL polypropylene jars and screw-on lids. NMDS are constructed prior to the field effort using the following procedures:
• Remove the center of the lid so that just the rim remains. • Place all equipment in buckets/tubs with deionized water that has been purged of
oxygen via aerating with nitrogen for at least 1 hour. Continue aerating with nitrogen while assembling the NMDS.
• Place a piece of 120-micron nylon screen mesh over the top of the jar and screw on the lid rim.
• Store jars in the assembly buckets with lids firmly sealed and under nitrogen headspace to prevent contamination until deployment.
NMDS will be deployed by divers near clam cages using the following procedures:
• Attach a small buoy to each NMDS using an electrical tie and rope. • A small shovel-like device made from PVC may be used to create a hole in the
sediment in which the samplers will reside (see USGS and USEPA 2003 for details).

Confirmation Monitoring (Year 1–30)
Compliance Monitoring Sampling and Quality Assurance Project Plan March 2016 Whatcom Waterway Cleanup in Phase 1 Site Areas 34 080007-01.04
• Bury jars 6 to 12 cm in the sediment placed on their sides to prevent the mesh from being punctured during deployment and retrieval.
• Cover the NMDS with sediment. • Record GPS coordinates on field forms. • NMDS will be left in situ for a minimum of 4 days to equilibrate.
NMDS will be retrieved using GPS coordinates and the buoys in the following manner:
• Gently pull the samplers to the surface using the rope attached to each NMDS. Caution will be used while removing samplers from the sediment to avoid damaging the nylon mesh.
• Once on board the vessel, any sediment remaining on the top of the mesh will be gently removed to minimize the loss of water from the sampler.
• Porewater will be extracted using a 60-mL disposable syringe.
− For dissolved mercury analysis, a 13-gage, 8.9-cm hypodermic needle and a 25-mm, 0.45-micron filter unit mounted between the syringe and needle (see USGS and USEPA 2003 method for a picture of the assembly) will be used to collect the sample.
− For total mercury analysis, the filter will be removed, and the hypodermic needle connected directly to the syringe to collect the sample.
• For each sample (total and dissolved), the syringe assembly will be pushed into the mesh and 100 mL will be drawn in the syringe.
• The filter and hypodermic needle will be removed from the syringe and the sample volume gently pushed into the sample container. The sample container will be tightly sealed.
Option 2: Mini-piezometers
Alternatively, porewater may be collected using diver-assisted push-point mini-piezometers. A mini-piezometer is a mini well point constructed of a stainless-steel rod with a screened end at the tip. The design includes a probe with a heavier-weight stainless-steel construction, approximately 2-inch screened (0.5-mm slot) interval with a smaller aperture size near the tip of the probe, and a base plate attachment that sits at the mudline elevation to minimize drawdown from the overlying surface water. A schematic of the porewater

Confirmation Monitoring (Year 1–30)
Compliance Monitoring Sampling and Quality Assurance Project Plan March 2016 Whatcom Waterway Cleanup in Phase 1 Site Areas 35 080007-01.04
sampling device is shown on Figure 6. Larger screen (4- and 6-inch) intervals will be used if the screen becomes clogged due to fine-grained sediment. If used, mini-piezometers will be placed by divers and driven approximately 6 to 12 cm into the sediment. Clean polyethylene tubing will be connected to the end (opposite end of screened portion) of the mini-piezometer and extended through the water column to the deck of the sampling vessel and into a peristaltic pump or similar type pumping device. Samples for total mercury analysis will be collected directly into sample containers; samples for dissolved mercury analysis will be filtered through a 0.45-mm cartridge as the sample is pumped directly into sample containers.
Co-Located Porewater Processing
Porewater sample containers will be appropriately labeled and stored in coolers with ice at approximately 4°C until delivery to the laboratory. Samples will be analyzed for the following parameters (see Table 10):
• Total and dissolved mercury
3.2.7 Benthic Fish
Confirmation monitoring will include the collection of benthic fish tissue in Year 3 and 5 and potentially in Year 10 if tissue concentrations of mercury measured in Years 3 or 5 are significantly elevated in comparison to fish collected in reference areas. Benthic fish tissue monitoring will be discontinued once contaminant concentrations in Site tissues are not statistically elevated above reference tissue concentrations for two consecutive monitoring events. Benthic fish tissue will be collected via trawling from a vessel equipped with sufficient deck space for staging of gear. Methods will be in accordance with Ecology and PSEP protocols. Samples will be collected at Site and reference locations; three approximate target trawl lines for within the Site and three within Samish Bay (reference area) are shown in Figures 5 and 7. Coordinates are provided in Table 5. Final trawl locations will be determined in coordination with the captain of the sampling vessel, and additional trawls may be conducted to acquire sufficient numbers of fish.

Confirmation Monitoring (Year 1–30)
Compliance Monitoring Sampling and Quality Assurance Project Plan March 2016 Whatcom Waterway Cleanup in Phase 1 Site Areas 36 080007-01.04
The following field forms (Appendix A) will be completed for fish tissue monitoring:
• Daily Log • Fish Log
Scientific collection permits will be obtained from WDFW prior to benthic fish collection.
Benthic Fish Collection Methods
The target benthic fish species for monitoring is English sole (Parophrys vetulus; family: Pleuronectidae). If insufficient English sole are caught, starry flounder (Platichthys stellatus) will be collected as an alternate species. Benthic fish will be collected using a high-rise otter trawl. A pre-trawl survey will be conducted to determine if the site is suitable for trawling. The pre-trawl survey will consist of examining the seafloor for obstructions using a fathometer. The sampling site will be abandoned after three unsuccessful pre-trawl attempts, and the sampling site will either be moved or attempts will be made at the other target locations. Once a pre-trawl survey has been conducted and the area is found suitable for trawling, the trawl net will be prepared using the following procedures:
• Nets will be inspected for holes prior to deployment and repaired as needed. The net should be laid out and stacked on the stern of the vessel in the same configuration that it will be deployed: cod-end to the stern, floats up, and foot rope down.
• The trawl net should be checked to make sure that the cod-end is tied correctly, the doors should be connected properly to the leg lines, and the bridles should be securely fastened to the doors and to the tow wire.
Once prepared, the trawl net will be deployed using the following procedures:
• While the vessel is underway, the net and doors will be placed in the water. It is important that the floats skim the surface and that the net is not entangled (e.g., crossed leg lines, bunched or hooked portions of the net) prior to paying out the bridles.

Confirmation Monitoring (Year 1–30)
Compliance Monitoring Sampling and Quality Assurance Project Plan March 2016 Whatcom Waterway Cleanup in Phase 1 Site Areas 37 080007-01.04
• The bridles should be paid out by personnel on either side of the net, so as to avoid becoming entangled in the rigging during deployment.
• Use of the proper scope (i.e., length of hydrowire paid out versus the water depth) is important for successful trawls.
• After the net touches the bottom, a sufficient length of hydrowire (towing wire) should be paid out to ensure that the net is pulled from a horizontal rather than a vertical position. (Insufficient scope will prevent the net from consistently fishing the bottom and will result in a no-catch or a short-catch situation.)
• The trawl is towed at a speed of 1.0 meter per second for 5 to 10 minutes. • At the end of the prescribed trawl, the net will be retrieved and brought onboard the
vessel, the cod-end will be opened, and the catch will be deposited into a tub or holding tank. The catch will subsequently be released to the scientific crew for processing.
The Site trawl samples will be collected first so that it is possible to match the fish sample size classes with those collected from the Samish Bay reference area.
Benthic Fish Processing Methods
Once the catch is onboard the vessel, the targeted species will be identified and separated for subsequent processing. Only English sole, pleuronectid flatfish, and starry flounder will be retained. As required by WDFW, specimens of non‐target species will be identified to the lowest practical taxon and their numbers estimated. Special care will be taken to return non-target organisms to the water quickly, with minimal handling. Specimens of target species that do not meet size requirements will be counted, their lengths will be approximated, and they will be returned to the water. Target fish will be temporarily held in a live well on the boat until all three trawls are completed. Individual fish of the selected target species will be rinsed in water from the collection location to remove any foreign material from the external surface. Target fish will be measured for length and physically dispatched after wrapping the fish in aluminum foil. Each fish will be placed in a re-sealable plastic bag and placed on ice. A unique sample ID tag will be placed into the bag and the sample ID will also be written on the outside of the bag.

Confirmation Monitoring (Year 1–30)
Compliance Monitoring Sampling and Quality Assurance Project Plan March 2016 Whatcom Waterway Cleanup in Phase 1 Site Areas 38 080007-01.04
Five composite samples will be prepared for each test area (e.g., Site or reference). English sole can live more than 10 years, and fish age and size can affect tissue chemical concentrations (Hart Crowser 2000). To help account for this confounding factor, the composite samples will be created to contain fish of similar sizes. The composite samples will be prepared at the laboratory after review of the species and size data. The goal is to obtain enough fish to create five composite samples of five fish each. If fewer than 25 fish are collected at the Site or reference area, composites will be prepared using the available fish. The composite samples will consist of skin-off fillets prepared in the laboratory. Benthic fish tissue will be analyzed for the following parameters (see Table 9):
• Lipids • Mercury • D/F (Year 3 only)
3.2.8 Pelagic Fish
Although not anticipated, confirmation monitoring may include the collection of pelagic fish tissue if benthic fish tissue concentrations are elevated. If required, an addendum will be provided detailing sampling and analysis methods based on methods outlined in the CMCRP (provided below for context) and in conjunction with WDFW. Pelagic fish, including salmon, may occur near the Site. However, the tissue quality in pelagic fish species is typically influenced less by localized sediment contamination than for benthic fish or shellfish due to differences in lifecycle, on-Site residence time, home range, and foraging behavior. The home range of salmon species is very extensive relative to the localized nature of the Whatcom Waterway Site. In addition, historical comparisons of fish returning to the Nooksack River versus other regional rivers have found no difference in tissue mercury concentrations (Hart Crowser 2000). At other Puget Sound cleanup sites, such as the Lower Duwamish Waterway (LDW) in Seattle, it was determined that returning adult salmon were exposed to site-related

Confirmation Monitoring (Year 1–30)
Compliance Monitoring Sampling and Quality Assurance Project Plan March 2016 Whatcom Waterway Cleanup in Phase 1 Site Areas 39 080007-01.04
contaminants for a relatively short duration (de minimus on-site residence time) as juveniles during out-migration and that the contribution of this short-term exposure to total adult body burdens is likely insignificant (O’Neill et al. 1998). Adult salmon were not considered receptors of concern for the LDW risk assessment conducted under the joint oversight of the U.S. Environmental Protection Agency and Ecology. Based on these considerations and the similarity of salmon tissue mercury concentrations between fish from the Nooksack River and other watersheds (Hart Crowser 2000), the analysis of pelagic fish tissue will be implemented only if the Year 3 results of the benthic fish tissue monitoring show mercury concentrations statistically significantly elevated above reference area benthic fish tissue concentrations. If concentrations in benthic fish tissue are significantly elevated, Ecology may require monitoring of salmon tissue if that information (in conjunction with available data regarding the lifecycle, home range, and feeding behavior of salmon) suggests that the Site conditions could result in a potentially significant and measurable impact on pelagic fish tissue mercury concentrations. If monitoring of salmon is performed, the sampling would consist of the collection of salmon using hook and line or net methods (i.e., purse seine). The WDFW SalmonScape1 tool documents the presence of fall Chinook salmon (Oncorhynchus tshawytscha), coho salmon (O. kisutch), and sockeye salmon (O. nerka) in the Lummi River, the Nooksack River, Whatcom Creek, and the Samish River. The selected species and sampling method would depend on fish availability and location at the time of sampling. Testing of sockeye salmon is preferred because these salmon make up a significant portion of the diets of local tribal seafood consumers as reported during recent surveys conducted by the Lummi Nation, and potential bycatch of Chinook salmon can be minimized.
Frequency
Monitoring of pelagic fish tissue will be conducted at up to three monitoring events, potentially including Years 3, 5, and 10. Confirmation monitoring of pelagic fish during Year 3 will be conducted if benthic fish tissue mercury concentrations during Year 3 are found to be statistically significantly elevated above reference area benthic fish tissue
1 SalmonScape is available at http://apps.wdfw.wa.gov/salmonscape/map.html.

Confirmation Monitoring (Year 1–30)
Compliance Monitoring Sampling and Quality Assurance Project Plan March 2016 Whatcom Waterway Cleanup in Phase 1 Site Areas 40 080007-01.04
concentrations, and if Ecology determines that the benthic tissue concentrations suggest that the Site could significantly impact salmon tissue mercury concentrations (in consideration of available data regarding the lifecycle, home range, and feeding behavior of salmon). The determination of the need for pelagic monitoring in subsequent years will also be made relative to benthic fish tissue results. If benthic fish monitoring is terminated because tissue mercury concentrations from the Site are not statistically significantly greater than reference area tissue mercury concentrations, then pelagic fish monitoring will also be discontinued.
Sampling and Analysis Approach
Pelagic fish tissue monitoring, if performed, will be conducted by collecting five tissue composites from salmon collected within the Site. Five composite samples of salmon tissue will be similarly collected from Samish Bay. Five composite samples from each area (Whatcom Waterway and Samish Bay) will be prepared by combining tissue from each of three fish. If fewer than 15 fish are collected at the Site or reference area, composites will be prepared using the available fish. The composite samples will consist of skin-off fillets prepared in the laboratory. Laboratory analysis of the samples will consist of percent moisture, percent lipid content, and total mercury (see Table 9). All methods will be in accordance with Ecology and PSEP protocols. All work will be conducted pursuant to the requirements of a scientific collection permit obtained from WDFW prior to collection of fish.
3.2.9 Unit 4 (Log Pond) Porewater Monitoring
Confirmation monitoring will include the collection of porewater in Years 1, 3, 5, and 10. Sediment porewater will be collected at two sampling locations in Unit 4 (Figure 3 and Table 6) using either temporary mini-piezometers or nylon mesh diffusion samplers (NMDS). The following field forms (Appendix A) will be completed for porewater monitoring:
• Daily Log • Well Installation Log

Confirmation Monitoring (Year 1–30)
Compliance Monitoring Sampling and Quality Assurance Project Plan March 2016 Whatcom Waterway Cleanup in Phase 1 Site Areas 41 080007-01.04
• Porewater Collection Log
Porewater Collection
Option 1 (Preferred): Nylon-mesh Diffusion Samplers
Alternatively, porewater may be collected using NMDS following methods used by USGS and USEPA (2003). NMDS are a type of passive sampler that can be used in both course and fine sediments, provide a comparable measure with which to compare clam exposure over the duration of the incubation period, and limit the introduction of confounding factors (such as erroneously drawing surface water or sediment into the sample). NMDS consist of 250-mL polypropylene jars and screw-on lids. NMDS are constructed prior to the field effort using the following procedures:
• Remove the center of the lid so that just the rim remains. • Place all equipment in buckets/tubs with deionized water that has been purged of
oxygen via aerating with nitrogen for at least 1 hour. Continue aerating with nitrogen while assembling the NMDS.
• Place a piece of 120-micron nylon screen mesh over the top of the jar and screw on the lid rim.
• Store jars in the assembly buckets with lids firmly sealed and under nitrogen headspace to prevent contamination until deployment.
NMDS will be deployed at low tide by field technicians with knee-high boots or waders using the following procedures:
• Attach a small buoy to each NMDS using an electrical tie and rope. • A small shovel-like device made from PVC may be used to create a hole in the
sediment in which the samplers will reside (see USGS and USEPA 2003 for details). • Bury jars 1 foot in the sediment placed on their sides to prevent the mesh from being
punctured during deployment and retrieval. • Cover the NMDS with sediment. • Record GPS coordinates on field forms. • NMDS will be left in situ for a minimum of 4 days to equilibrate.

Confirmation Monitoring (Year 1–30)
Compliance Monitoring Sampling and Quality Assurance Project Plan March 2016 Whatcom Waterway Cleanup in Phase 1 Site Areas 42 080007-01.04
NMDS will be retrieved using GPS coordinates and the buoys in the following manner: • Gently remove the samplers from the sediment using caution to avoid damaging the
nylon mesh. • Once recovered, any sediment remaining on the top of the mesh will be gently
removed to minimize the loss of water from the sampler. • Porewater will be extracted using a 60-mL disposable syringe.
− For dissolved mercury analysis, a 13-gage, 8.9-cm hypodermic needle and a 25-mm, 0.45-micron filter unit mounted between the syringe and needle (see USGS and USEPA 2003 method for a picture of the assembly) will be used to collect the sample.
− For total mercury analysis, the filter will be removed, and the hypodermic needle connected directly to the syringe to collect the sample.
• For each sample (total and dissolved), the syringe assembly will be pushed into the mesh and 100 mL will be drawn in the syringe.
• The filter and hypodermic needle will be removed from the syringe and the sample volume gently pushed into the sample container. The sample container will be tightly sealed.
Option 2: Mini-piezometers
Porewater may be collected using push-point mini-piezometers. A mini-piezometer is a mini well point constructed of a stainless-steel rod with a screened end at the tip. The design includes a probe with a heavier-weight stainless-steel construction, approximately 2-inch screened (0.5-mm slot) interval with a smaller aperture size near the tip of the probe, and a base plate attachment that sits at the mudline elevation to minimize drawdown from the overlying surface water. A schematic of the porewater sampling device is shown on Figure 6. Larger screen (4- and 6-inch) intervals will be used if the screen becomes clogged due to fine-grained sediment. If used, mini-piezometers will be driven approximately 1 foot into the sediment at low tide by field technicians with knee-high boots or waders. Clean polyethylene tubing will be connected to the end (opposite end of screened portion) of the mini-piezometer and extended through the water column to the deck of the sampling vessel and into a peristaltic pump or similar type pumping device. Samples for total mercury

Confirmation Monitoring (Year 1–30)
Compliance Monitoring Sampling and Quality Assurance Project Plan March 2016 Whatcom Waterway Cleanup in Phase 1 Site Areas 43 080007-01.04
analysis will be collected directly into sample containers; samples for dissolved mercury analysis will be filtered through a 0.45-mm cartridge as the sample is pumped directly into sample containers.
Porewater Processing
Porewater samples will be stored in coolers on ice until delivery to the analytical laboratory. Samples will be analyzed for the following parameters (see Table 10):
• Total and dissolved mercury

Compliance Monitoring Sampling and Quality Assurance Project Plan March 2016 Whatcom Waterway Cleanup in Phase 1 Site Areas 44 080007-01.04
4 GENERAL SAMPLING METHODS
This section describes general sampling methods and procedures that apply to both performance and confirmation monitoring programs.
4.1 Station and Sample Identification
Station and sample identifications are provided in Tables 4 through 6. Each sample will be assigned a unique alphanumeric identifier. The identifier will have the format of “Project Identifier-Station ID-Species or Media Code-Sample Interval-Date.” Samples will be identified according to the following procedure:
• The project designator will be WW to denote Whatcom Waterway. • The station ID will correspond to sample locations shown in Figures 2, 3, 4, 5, and 7. • Species/media codes are as follows:
− RE = residuals layer (collected from a sediment grab sampler) − UD = underlying sediment layer (collected from a sediment grab sampler) − SS = surface sediment grab (confirmation monitoring) − SC = subsurface sediment core − CM = crab tissue − CL = clam tissue − PW = porewater − BF = benthic fish tissue − PF = pelagic fish tissue
• Sample interval will be the depth at which the sample is collected in feet below the mudline. For tissue, 0 feet will be used.
• Date of collection, in the form of YYMMDD. • As an example, a Dungeness crab muscle tissue sample collected on August 24, 2015,
from station MNR-4 will have an ID of WW-MNR-4-CM-0-150824. Each sample will have an adhesive plastic or waterproof paper label affixed to the container or baggie and will be labeled at the time of collection. The following information will be recorded on the container label at the time of collection:
• Project name

General Sampling Methods
Compliance Monitoring Sampling and Quality Assurance Project Plan March 2016 Whatcom Waterway Cleanup in Phase 1 Site Areas 45 080007-01.04
• Sample identifier • Date and time of sample collection • Analysis to be performed
4.2 Navigation
A vessel-mounted Differential Global Positioning System (DGPS) will be used to navigate to the desired sampling location. GPS coordinates for sampling stations are provided in Tables 4 through 6. Collection at the sampling location will be guided by the navigation system with an accuracy of ±10 feet. The coordinates will be recorded, when positioned at the sampling location, in latitude and longitude in decimal degrees (to 5 decimal places). Positions will be relative to the Washington State Plane Coordinates, North, North American Datum of 1983. Vertical positioning will be achieved using the vessel’s fathometer or a lead line and converted to MLLW elevation. Tidal elevations will be determined after sample collection using the National Oceanic and Atmospheric Administration’s tide station (ID 9449211) located in Bellingham, Washington.
4.3 Permitting and Approvals
Scientific collection permits are required for collection of crab and fish tissue samples; these will be obtained from WDFW prior to collection.
4.4 Sample Handling Requirements
Sample container requirements, holding times, and preservation requirements are outlined in Table 7. Sample containers, instruments, working surfaces, technician protective gear, and other items that may come into contact with sample material must meet high standards of cleanliness. All equipment and instruments that will be used and are in direct contact with various media collected for chemical analyses must be made of glass, stainless steel, high density polyethylene, or polytetrafluoroethylene and will be cleaned prior to each day’s use and between sampling or compositing events.

General Sampling Methods
Compliance Monitoring Sampling and Quality Assurance Project Plan March 2016 Whatcom Waterway Cleanup in Phase 1 Site Areas 46 080007-01.04
4.4.1 Decontamination Procedures
The following general decontamination procedures will be followed for field sampling equipment:
1. Pre-wash rinse with tap or site water 2. Wash with solution of tap water or site water and phosphate-free soap (e.g., Alconox) 3. Rinse three times with distilled water 4. Cover (no contact) all decontaminated items with aluminum foil 5. Store in a clean, closed container for next use
Cages and associated equipment (mesh, ropes, anchors, etc.) will be pressure-washed with fresh water or soaked in saltwater for 24 hours prior to use and kept clean until deployment.
4.4.2 Investigation-Derived Waste
All disposable sampling materials and personal protective equipment used in sample collection and processing (e.g., disposable gloves and paper towels) will be placed in heavy-duty garbage bags for disposal as non-hazardous solid waste. No hazardous materials requiring disposal will be used during fieldwork for this study. Sediment recovered in grab samples from MNR and cap areas not retained for chemical analysis will be returned to the target sampling location. Sediment recovered in post-dredging grab samples from the Inner Waterway stations (presumed to contain elevated contaminant levels) will be retained as investigation-derived waste and will be managed by subtitle D landfill disposal. Core samples will be processed at the analytical laboratory or alternative upland location. Samples of coring sample sediment not retained for chemical analysis will be stored in buckets or drums at the processing location. Core samples not used for analysis will be retained and will be managed as investigation-derived waste. This material will be managed by subtitle D landfill disposal in compliance with applicable regulations. Tissue samples will be processed in the laboratory. Expired animals identified at the point of collection and not retained for chemical analysis will be returned to the water in the middle

General Sampling Methods
Compliance Monitoring Sampling and Quality Assurance Project Plan March 2016 Whatcom Waterway Cleanup in Phase 1 Site Areas 47 080007-01.04
of the bay. Expired animals or dissection materials not retained for chemical analysis will be disposed of in accordance with applicable regulations. Any porewater waste generated during the purging process and sample collection will be collected in 5-gallon buckets or similar and disposed of in accordance with applicable regulations.
4.4.3 Sample Custody and Shipping Requirements
COC procedures will be followed for all samples throughout the collection, handling, and analysis process. The principal document used to track possession and transfer of samples is the COC form. Each sample will be represented on a COC form the day it is collected. All manual data entries will be made using an indelible ink pen. Corrections will be made by drawing a single line through the error, writing in the correct information, and then dating and initialing the change. Blank lines and spaces on the COC form will be lined out, dated, and initialed by the individual maintaining custody. Electronic COC forms generated from a custom field application will be emailed directly to the laboratory and QA managers. A COC form will accompany each shipment of samples to the analytical laboratory. Each person in custody of samples will sign the COC form and ensure the samples are not left unattended unless properly secured. Copies of all COC forms will be retained in the project files. All samples will be shipped or hand delivered to the analytical laboratory no later than 1 day after collection. Samples collected on Friday may be held until the following Monday for shipment, provided that this delay does not jeopardize any holding time requirements. Specific sample shipping procedures are as follows:
• Each cooler or container containing samples for analysis will be shipped via overnight delivery to the laboratory. In the event that Saturday delivery is required, the field coordinator will contact the analytical laboratory before 3 p.m. on Friday to ensure that the laboratory is aware of the number of containers shipped and the airbill tracking numbers for those containers. Following each shipment, the field

General Sampling Methods
Compliance Monitoring Sampling and Quality Assurance Project Plan March 2016 Whatcom Waterway Cleanup in Phase 1 Site Areas 48 080007-01.04
coordinator will call the laboratory and verify that the shipment from the day before has been received and is in good condition.
• Coolant ice will be sealed in separate plastic bags and placed in the shipping containers.
• Individual sample containers will be placed in a sealable plastic bag, packed to prevent breakage, and transported in a sealed ice chest or other suitable container.
• Glass jars will be separated in the shipping container by shock-absorbent material (e.g., bubble wrap) to prevent breakage.
• The shipping containers will be clearly labeled with sufficient information (name of project, time and date container was sealed, person sealing the container, and consultant’s office name and address) to enable positive identification.
• The shipping waybill number will be documented on all chain-of-custody forms accompanying samples.
• A sealed envelope containing COC forms will be enclosed in a plastic bag and taped to the inside lid of the cooler.
• A minimum of two signed and dated custody seals will be placed on adjacent sides of each cooler prior to shipping.
• Each cooler will be wrapped securely with strapping tape, labeled “Glass – Fragile” and “This End Up,” and will be clearly labeled with the laboratory’s shipping address and the consultant’s return address.
Upon transfer of sample possession to the analytical laboratory, the person(s) transferring custody of the sample container will sign the COC form. Upon receipt of samples at the laboratory, the custody seals will be broken, and the receiver will record the condition of the samples on a sample receipt form. COC forms will be used internally in the laboratory to track sample handling and final disposition.
4.5 Laboratory Analytical Methods – Chemistry
Chemical analyses will be conducted at a laboratory accredited through the State of Washington’s Department of Ecology Laboratory Accreditation Program.

General Sampling Methods
Compliance Monitoring Sampling and Quality Assurance Project Plan March 2016 Whatcom Waterway Cleanup in Phase 1 Site Areas 49 080007-01.04
4.5.1 Surface Sediment
Surface sediment samples for performance monitoring will be analyzed for total solids, TOC, mercury, PAH, phenolic compounds, and D/F. Surface sediment samples for confirmation monitoring will be analyzed for mercury, copper, zinc, total solids, TOC, PAH, phenolic compounds, and D/F. A complete list of surface sediment parameters, analytical methods, and target quantitation limits is provided in Table 8.
4.5.2 Subsurface Sediment
Subsurface sediment samples for confirmation monitoring will be analyzed for total solids and mercury. Subsurface sediment parameters, analytical methods, and target quantitation limits are listed in Table 8.
4.5.3 Tissue
Tissues to be analyzed during performance and confirmation monitoring include crab, clam, benthic fish, and contingent pelagic fish. All tissues will be analyzed for percent moisture, and mercury. These results will be reported on a wet weight basis. Benthic fish will also be analyzed for lipids and D/F in Year 3, with results for D/F reported on both a wet weight and lipid-normalized basis. Tissue parameters, analytical methods, and target quantitation limits are listed in Table 9.
4.5.4 Porewater
Porewater collected during performance and confirmation monitoring will be analyzed for total and dissolved mercury. Analytical methods and target quantitation limits are listed in Table 10.
4.6 Laboratory Analytical Methods – Toxicity
Contingent toxicity testing will be conducted if analytical chemistry results indicate a Sediment Quality Standard (SQS) exceedance for mercury or other contaminants. Toxicity testing will include three standard bioassays, the 10-day amphipod survival test, the 20-day juvenile polychaete growth test, and the larval bivalve development test. Testing will be conducted in accordance with PSEP (1995) methods and Sediment Management Annual

General Sampling Methods
Compliance Monitoring Sampling and Quality Assurance Project Plan March 2016 Whatcom Waterway Cleanup in Phase 1 Site Areas 50 080007-01.04
Review Meeting (SMARM) updates. Test results will be compared to SMS Biological Effects Criteria for Puget Sound marine waters. Test performance standards, SQS, and Cleanup Screening Levels are provided in Table 11.
4.6.1 10-Day Acute Toxicity Amphipod Test
The amphipod bioassay will be performed using the amphipod E. estuarius, R. abronius, or A. abdita. Species selection will be determined in coordination with Ecology and based upon grain size, salinity, and collection season prior to test initiation. Control sediment will consist of native amphipod sediment. Amphipods will be exposed to sediments for 10 days under static conditions with continuous light. Test chambers will be 1-liter (L) glass jars with approximately 2 cm of sediment and 900 mL of overlying seawater. Water quality parameters including pH, temperature, dissolved oxygen (DO), and salinity will be measured daily during testing. Overlying ammonia and sulfides will be measured at test initiation and termination. There will be five replicates per treatment. At test initiation, 20 organisms will be placed in each replicate. Test chambers will be randomized and gently aerated during testing. Organisms will not be fed for the duration of the test. After 10 days, organisms will be sieved from the sediment and survivorship will be recorded. Test acceptability will be evaluated by survivorship in the control, which should be at least 90%. If the test does not meet control acceptability criteria, it should be repeated. The relative sensitivity of each batch of amphipods will be assessed by conducting a 96-hour, water-only reference toxicant test using cadmium chloride. Ammonia is not a contaminant of concern but may be responsible for confounding toxicity test results, which is especially true with the amphipod test. Interstitial ammonia concentrations will be measured on project sediments prior to testing. If ammonia concentrations are elevated, the bioassay laboratory will contact the consultant project manager prior to setting up the tests to discuss the necessity of ammonia reduction procedures.

General Sampling Methods
Compliance Monitoring Sampling and Quality Assurance Project Plan March 2016 Whatcom Waterway Cleanup in Phase 1 Site Areas 51 080007-01.04
4.6.2 20-Day Juvenile Polychaete Growth Test
The polychaete bioassay will be performed using Neanthes arenaceodentata. N. arenaceodentata are cultured from a laboratory population; therefore, native control sediment is not available. Consequently, the amphipod control sediment will be used in the polychaete test. Tests will be conducted using juvenile organisms. Polychaetes will be exposed to sediments for 20 days with a 16-hour light and 8-hour dark photoperiod. Test chambers will be 1-L glass jars with approximately 2 cm of sediment and 900 mL of overlying seawater. Water quality parameters including pH, temperature, DO, and salinity will be measured daily during testing. Overlying ammonia will be measured at test initiation and termination. There will be five replicates per treatment. At test initiation, five organisms will be placed into each replicate. In addition, ‘time zero’ samples will be collected, dried, and weighed. Test chambers will be randomized and gently aerated during testing. Organisms will be fed a slurry composed of Tetramin fish feed and seawater as needed at test initiation and every other day until test termination. Water renewals will be conducted every third day. After 20 days, organisms will be sieved from the sediment and survivorship will be recorded. The ash-free dry weight (AFDW; Gardiner 2010 method will be used to determine growth rate. Polychaetes will be placed in a drying oven at 60 degrees and then dry weights will be recorded. Polychaetes will then be placed in a muffle furnace to remove organic material, and the remaining material will be weighed and recorded as the ashed weight. Growth rate will be calculated by comparing AFDWs of test organisms against ‘time zero’ AFDWs. Test acceptability will be evaluated by survivorship in the control, which should be at least 90%. If the test does not meet control acceptability criteria, it should be repeated. The relative sensitivity of each batch of polychaete will be assessed by conducting a 96-hour, water-only reference toxicant test using cadmium chloride.

General Sampling Methods
Compliance Monitoring Sampling and Quality Assurance Project Plan March 2016 Whatcom Waterway Cleanup in Phase 1 Site Areas 52 080007-01.04
4.6.3 Larval Bivalve Development Test
The larval bivalve survival and development test will be conducted with either Mytilus galloprovincialis or Dendraster excentricus. Species selection will be determined in coordination with Ecology and based on spawning season prior to test initiation. Control sediment will consist of native amphipod sediment. Test chambers will be 1-L glass jars with 18 grams of sediment weighed into each test chamber and approximately 900 mL of clean seawater. Resuspension will be ensured by mixing vigorously for 10 seconds. Sediments will be allowed to settle for 4 hours prior to test initiation. Adult organisms will be induced to spawn. Resulting embryos will be exposed to sediments until formation into the larval stage occurs in 90% of the control organisms (typically 48 to 96 hours). Tests will be conducted under static conditions with a 14-hour light/10-hour dark photoperiod. Water quality parameters including pH, temperature, DO, and salinity will be measured daily during testing. Overlying ammonia and sulfides will be measured at test initiation and termination. There will be five replicates per treatment. At test initiation, a pre-determined aliquot of embryos (in solution) will be placed in each replicate chamber. Test chambers will be randomized; no aeration is required unless DO levels fall below the acceptable tolerance limit. Organisms will not be fed during the test. The resuspension method (Gardiner 2010) will be used at approximately 42 hours after initiation to free any larvae trapped in fine sediments or the flocculent layer; this method consists of using a perforated plunger to gently homogenize the water, larvae, and settled sediment. At test termination (development stage reached in controls), three 10-mL aliquots will be removed from each test chamber, placed in screw cap vials, and preserved with 5% buffered formalin. The number of alive, normally developed, and abnormal larvae will be enumerated under a microscope. Test acceptability will be evaluated by normal development in the control, which should be at least 70%. If the test does not meet control acceptability criteria, it should be repeated. The relative sensitivity of each batch of larvae will be assessed by conducting a 96-hour, water-only reference toxicant test using cadmium or copper chloride, dependent upon the test species selected.
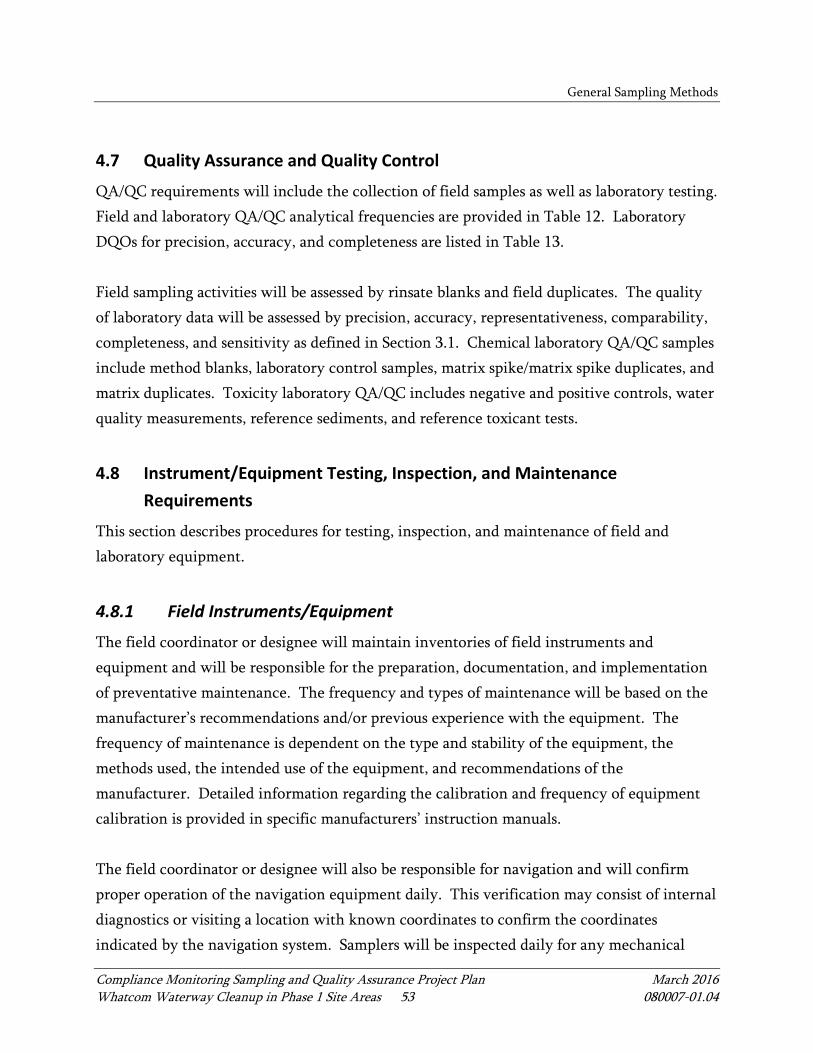
General Sampling Methods
Compliance Monitoring Sampling and Quality Assurance Project Plan March 2016 Whatcom Waterway Cleanup in Phase 1 Site Areas 53 080007-01.04
4.7 Quality Assurance and Quality Control
QA/QC requirements will include the collection of field samples as well as laboratory testing. Field and laboratory QA/QC analytical frequencies are provided in Table 12. Laboratory DQOs for precision, accuracy, and completeness are listed in Table 13. Field sampling activities will be assessed by rinsate blanks and field duplicates. The quality of laboratory data will be assessed by precision, accuracy, representativeness, comparability, completeness, and sensitivity as defined in Section 3.1. Chemical laboratory QA/QC samples include method blanks, laboratory control samples, matrix spike/matrix spike duplicates, and matrix duplicates. Toxicity laboratory QA/QC includes negative and positive controls, water quality measurements, reference sediments, and reference toxicant tests.
4.8 Instrument/Equipment Testing, Inspection, and Maintenance Requirements
This section describes procedures for testing, inspection, and maintenance of field and laboratory equipment.
4.8.1 Field Instruments/Equipment
The field coordinator or designee will maintain inventories of field instruments and equipment and will be responsible for the preparation, documentation, and implementation of preventative maintenance. The frequency and types of maintenance will be based on the manufacturer’s recommendations and/or previous experience with the equipment. The frequency of maintenance is dependent on the type and stability of the equipment, the methods used, the intended use of the equipment, and recommendations of the manufacturer. Detailed information regarding the calibration and frequency of equipment calibration is provided in specific manufacturers’ instruction manuals. The field coordinator or designee will also be responsible for navigation and will confirm proper operation of the navigation equipment daily. This verification may consist of internal diagnostics or visiting a location with known coordinates to confirm the coordinates indicated by the navigation system. Samplers will be inspected daily for any mechanical

General Sampling Methods
Compliance Monitoring Sampling and Quality Assurance Project Plan March 2016 Whatcom Waterway Cleanup in Phase 1 Site Areas 54 080007-01.04
problems, and problems will be noted in the field logbook and corrected prior to continuing sampling operations.
4.8.2 Laboratory Instruments/Equipment
Analytical instrument testing, inspection, maintenance, setup, and calibration will be conducted by each laboratory in accordance with the requirements identified in the laboratory’s standard operating procedures (SOPs) and manufacturer instructions. In addition, each of the specified analytical methods provides protocols for proper instrument setup, tuning, and critical operating parameters. Instrument maintenance and repair will be documented in the maintenance log or record book.
4.9 Inspection/Acceptance of Supplies and Consumables
The quality of supplies and consumables used during sample collection and laboratory analysis can affect the quality of the project data. All equipment that comes into contact with the samples and extracts must be sufficiently clean to prevent detectable contamination, and the analyte concentrations must be accurate in all standards used for calibration and QC purposes. Reagents of appropriate purity and suitably cleaned laboratory equipment will be used for all stages of laboratory analyses. Details of acceptance requirements for supplies and consumables at the laboratories are provided in the laboratory SOPs. All supplies will be obtained from reputable suppliers with appropriate documentation or certification.
4.10 Non-Direct Measurements
Existing chemical data from previous investigations will be used to guide this SQAPP.

Compliance Monitoring Sampling and Quality Assurance Project Plan March 2016 Whatcom Waterway Cleanup in Phase 1 Site Areas 55 080007-01.04
5 PROJECT MANAGEMENT
This section provides a description of DQOs, special training needed to perform the tasks, and documentation procedures.
5.1 Data Quality Objectives
The overall DQO for field sampling and laboratory analysis is to produce data of known and appropriate quality to support the project objectives. DQOs for the project are provided in Table 13. The quality of laboratory data is assessed by precision, accuracy, representativeness, comparability, completeness, and sensitivity. The definitions for the data quality indicators are as follows.
5.1.1 Precision
Precision is the ability of an analytical method or instrument to reproduce its own measurement. It is a measure of the variability, or random error, in sampling, sample handling, and laboratory analysis.
5.1.2 Accuracy
Accuracy is a measure of the closeness of an individual measurement (or an average of multiple measurements) to the true or expected value.
5.1.3 Representativeness
Representativeness expresses the degree to which data accurately and precisely represent an environmental condition.
5.1.4 Comparability
Comparability expresses the confidence with which one dataset can be evaluated in relation to another dataset. For this program, comparability of data will be established through the use of standard analytical methodologies and reporting formats and the use of common traceable calibration and reference materials.

Project Management
Compliance Monitoring Sampling and Quality Assurance Project Plan March 2016 Whatcom Waterway Cleanup in Phase 1 Site Areas 56 080007-01.04
5.1.5 Completeness
Completeness is a measure of the amount of data that is determined to be valid in proportion to the amount of data collected.
5.1.6 Sensitivity
Sensitivity is related to the instrument calibration low-level standard, method detection limits (MDLs) and/or estimated detection limits (EDLs). Analytical methods will be selected to achieve reporting limits that comply with, or are close to, target detection limits.
5.2 Special Training Requirements/Certifications
A technical team will be assembled with the requisite experience and technical skills to successfully complete the sampling for this monitoring program. Personnel involved in sample collection will have extensive environmental sampling experience. All sampling personnel will be required to have 40-hour Hazardous Waste Operations and Emergency Response (HAZWOPER) training and the 8-hour refresher course, as necessary, to meet the 29 Code of Federal Regulations 1910.120 Occupational Safety and Health Administration regulations. The training provides employees with knowledge and skills that enable them to perform their jobs safely and with minimum risk to their personal health. Documentation of course completion will be maintained in personnel files.
5.3 Documentation and Records
Records will be maintained documenting all activities and data related to sample collection and laboratory analyses. Results of data verification and validation activities will also be documented. Procedures for documentation of these activities are described in this section.
5.3.1 Field Records
Field samples will be documented using a custom field application or field collection logs. Additionally, the field coordinator or designee will keep a daily record of significant events, observations, and measurements on a daily log. Entries for each day will begin on a new page. The person recording information must enter the date and time and initial each entry.

Project Management
Compliance Monitoring Sampling and Quality Assurance Project Plan March 2016 Whatcom Waterway Cleanup in Phase 1 Site Areas 57 080007-01.04
In general, sufficient information will be recorded during sampling to reconstruct the event without relying on the memory of the field personnel. The daily log will contain the following information, at a minimum:
• Project name • Field personnel on site • Site visitors • Weather conditions • Field observations • Maps and/or drawings • Sample collection date and time • Sample collection method and description of activities • Deviations from this SQAPP • Conferences associated with field sampling activities
5.3.2 Analytical Records
Analytical data records (bookmarked PDF and electronic data deliverable formats) will be generated by the laboratory and submitted to the QA manager upon completion. If files are too large to be emailed, a notification email with download instructions will be sent to the project data management team. Level IV data reports will be provided by the laboratory. The analytical laboratory will be required to report the following, where applicable:
• Case Narrative: This summary will discuss problems encountered during any aspect of analysis, if any. It should discuss, but is not limited to, QC issues, sample shipment, sample storage, and analytical difficulties. Any problems encountered, actual or perceived, and their resolutions will be documented in as much detail as appropriate. Analytical QC samples that exceed project performance criteria and/or laboratory performance criteria should also be discussed in the case narrative.
• Chain-of-Custody Records: Legible copies of chain-of-custody forms will be provided as part of the data package. This documentation will include the time of receipt and condition of each sample received by the laboratory. Additional internal tracking of sample custody by the laboratory will also be documented on a sample receipt form.

Project Management
Compliance Monitoring Sampling and Quality Assurance Project Plan March 2016 Whatcom Waterway Cleanup in Phase 1 Site Areas 58 080007-01.04
The form must include all sample shipping container temperatures measured at the time of sample receipt.
• Sample Results: The data package will summarize results for each sample analyzed. The summary will include the following information when applicable:
− Field sample identifier and corresponding laboratory identification code − Sample matrix − Date and time of sample extraction − Date and time of analysis − Final concentration volumes and dilution factors − Instrument and analyst identification − Method reporting limits (MRLs) and MDLs accounting for sample-specific factors
(e.g., dilution and total solids) − Analytical results with reporting units identified − Data qualifiers and their definitions − Raw data including instrument printouts, chromatograms, and bench sheets
(required for full data packages)
• QA/QC Summaries: Contract Laboratory Program (CLP)-like form summaries should be generated for all required laboratory QC components and samples (i.e., method blanks, instrument daily tunes, surrogate spikes, internal standards, and laboratory control samples). These summaries should include spike volumes, parent sample concentrations, percent recoveries, relative percent differences, area counts, and laboratory control limits as applicable. For full data packages, associated raw data files should be included.
• Instrument Calibration Data: CLP-like form summaries of calibration data (i.e., initial calibration, initial calibration verification, and continuing calibration verification) should be included in all data packages. For full data packages, associated raw data files should be included.
All instrument data shall be fully restorable at the laboratory from electronic backup. The laboratory will be required to maintain all records relevant to project analyses for a minimum of 5 years.

Project Management
Compliance Monitoring Sampling and Quality Assurance Project Plan March 2016 Whatcom Waterway Cleanup in Phase 1 Site Areas 59 080007-01.04
5.3.3 Data Reduction
Data reduction is the conversion of raw data to final results. Methods or procedures for data reduction shall be documented. The following procedures will be implemented to verify the accuracy of data reduction:
• Technical staff will document, review, and QC their own work to ensure accuracy. • Major calculations will be subject to an independent senior technical review to ensure
that both the methods and the calculations are correct and consistent with the approved work plan.
• The project manager will be responsible for ensuring that data reduction is conducted in a manner that produces high quality data via review and approval of concepts, methods, assumptions, and calculations.

Compliance Monitoring Sampling and Quality Assurance Project Plan March 2016 Whatcom Waterway Cleanup in Phase 1 Site Areas 60 080007-01.04
6 ASSESSMENTS AND OVERSIGHT
Once data are received from the laboratory, a number of QC procedures will be followed to provide an accurate evaluation of the data quality. Specific procedures will be followed to assess data precision, accuracy, and completeness.
6.1 Compliance Assessments
Laboratory and field performance audits consist of on-site reviews of QA systems and equipment for sampling, calibration, and measurement. Audits will not be conducted as part of this study. However, laboratory audit reports will be made available to the project QA manager upon request. The laboratory is required to have written procedures addressing internal QA/QC. When these procedures have been submitted, the project QA manager will review them to ensure compliance with this SQAPP. The laboratory must ensure that personnel engaged in sampling and analysis tasks have appropriate training. As part of the audit process, the laboratory will provide the consultant with written details of any method modifications planned.
6.2 Response and Corrective Actions
The project manager, QA manager, and field coordinator will work together to determine actions to be taken in the event of an error, problem, or nonconformance to protocols identified in this SQAPP.
6.2.1 Field Activities
The field coordinator will be responsible for correcting equipment malfunctions during the field sampling effort. The QA manager will be responsible for resolving situations identified by the field coordinator that may result in noncompliance with the SQAPP. All corrective measures will be immediately documented in the field logbook.
6.2.2 Laboratory
The laboratories are required to comply with their SOPs. The laboratory managers will be responsible for ensuring that appropriate corrective actions are initiated as required for

Assessments and Oversight
Compliance Monitoring Sampling and Quality Assurance Project Plan March 2016 Whatcom Waterway Cleanup in Phase 1 Site Areas 61 080007-01.04
conformance with this SQAPP. All laboratory personnel will be responsible for reporting problems that may compromise quality data. The laboratory managers will be notified if any QC sample grossly exceeds the laboratory in-house control limits. The analyst will identify and correct the anomaly before continuing with the sample analysis. If the anomaly cannot be corrected, the laboratory manager will notify the QA manager. A narrative describing the anomaly, steps taken to identify and correct the anomaly, and the treatment of the relevant sample batch (i.e., recalculation, reanalysis, and re-extraction) will be submitted with the data package.
6.3 Reports to Management
QA reports to project management will include verbal status reports, written reports on field sampling activities and laboratory processes, data validation reports, and final project reports. These reports shall be the responsibility of the project manager.

Compliance Monitoring Sampling and Quality Assurance Project Plan March 2016 Whatcom Waterway Cleanup in Phase 1 Site Areas 62 080007-01.04
7 DATA VALIDATION AND USABILITY
Data generated in the field and at the laboratories will be verified and validated according to methods and procedures described in this section.
7.1 Data Review, Validation, and Verification
During the validation process, analytical data will be electronically and/or manually evaluated for method and laboratory QC compliance, and their validity and applicability for program purposes will be determined. Based on findings of the validation process, data validation qualifiers may be assigned. Validated project data, including qualifiers, will be entered into the project database, thus enabling this information to be retained or retrieved as needed.
7.2 Validation and Verification Methods
Field and laboratory data for this task will undergo a formal verification and validation process. All entries into the database will be verified. All errors found during the verification of field data, laboratory data, and the database will be corrected prior to release of the final data. Data verification includes a review for completeness and accuracy by the field coordinator and laboratory manager, review by the data manager for outliers and omissions, and the use of performance criteria to identify laboratory QC sample outliers. Data verification will be conducted manually by the project consultant or an external validator. For this program, Stage 2B validation (USEPA 2009) will be conducted following National Functional Guidelines for data validation (USEPA 1999, 2004, 2005, 2008), this SQAPP, and by using professional judgment. Data will be reviewed with regard to the following, as appropriate to the particular analysis:
• Completeness • Holding times • MRLs, MDLs, and EDLs

Data Validation and Usability
Compliance Monitoring Sampling and Quality Assurance Project Plan March 2016 Whatcom Waterway Cleanup in Phase 1 Site Areas 63 080007-01.04
• Laboratory control samples • Matrix spike/matrix spike duplicates • Standard reference materials • Surrogate recoveries • Method blanks • Field QC samples • Initial calibration data • Continuing calibration data • Instrument performance check
A data validation report will be generated to document any issues with data quality and any qualifications applied to data. All validated data will be entered into the database established for this program, and a final data file will be exported. Verification of the database export against the PDF data report will be performed by the QA manager or designee. Any errors found in the data file export will be corrected in the database and reviewed for systemic reporting errors. Once all discrepancies are resolved, the database will be established. The QA manager will be responsible for the final review of all data validation reports.
7.3 Reconciliation with User Requirements
The QA manager will review data at the completion of the task to determine if DQOs have been met. If data do not meet the project’s specifications, the QA manager will review the errors and determine if the problem is due to calibration/maintenance, sampling techniques, or other factors and will suggest corrective action, if appropriate. It is expected that the problem would be able to be corrected by retraining, revising techniques, or replacing supplies/equipment; if not, the DQOs will be reviewed for feasibility. If specific DQOs are not achievable, the QA manager will recommend appropriate modifications. If matrix interference is suspected to have attributed to the exceedance, adequate laboratory documentation must be presented to demonstrate that instrument performance and/or laboratory technique did not bias the result. In cases where the DQOs have been exceeded and corrective actions did not resolve the outlier, data will be qualified per USEPA National Functional Guidelines (1999, 2004, 2005, 2008). In these instances, the usability of data will

Data Validation and Usability
Compliance Monitoring Sampling and Quality Assurance Project Plan March 2016 Whatcom Waterway Cleanup in Phase 1 Site Areas 64 080007-01.04
be determined by the extent of the exceedance. Rejected data will be assigned an “R” qualifier and will not be used for any purposes.

Compliance Monitoring Sampling and Quality Assurance Project Plan March 2016 Whatcom Waterway Cleanup in Phase 1 Site Areas 65 080007-01.04
8 REPORTING
All monitoring data from a given year will be summarized in a compliance monitoring report to be prepared and submitted to Ecology. Monitoring data will also be entered into EIM. The report will include copies of final survey data and any validated analytical data and will include the following sections:
• Site background and context for the current report • Monitoring objective(s) and methods • Method deviations in sampling and/or analysis from this SQAPP • Results of monitoring, including data validation, bathymetric survey results, and
sediment, porewater, and/or tissue testing results • Comparison of monitoring results to site cleanup levels and previous testing results • Identification of any areas of concern, including any recommended contingency
response measures (as defined in the CMCRP; Anchor QEA 2015b) or areas for supplemental testing

Compliance Monitoring Sampling and Quality Assurance Project Plan March 2016 Whatcom Waterway Cleanup in Phase 1 Site Areas 66 080007-01.04
9 REFERENCES
Anchor QEA (Anchor QEA, LLC), 2010. Pre-Remedial Design Investigation Data Report – Whatcom Waterway Cleanup Site. Prepared for Port of Bellingham.
Anchor QEA, 2012. Preliminary Design Concept Report – Whatcom Waterway Site. Prepared for Port of Bellingham.
Anchor QEA, 2015a. Final Engineering Design Report. Whatcom Waterway Cleanup in Phase 1 Site Areas. Prepared for Port of Bellingham. February 2015.
Anchor QEA, 2015b. Compliance Monitoring and Contingency Response Plan. Appendix G, Final Engineering Design Report, Whatcom Waterway Cleanup in Phase 1 Site Areas. Prepared for Port of Bellingham. February 2015.
Anchor QEA, 2015c. Water Quality Monitoring Plan. Appendix L, Final Engineering Design Report, Whatcom Waterway Cleanup in Phase 1 Site Areas. Prepared for Port of Bellingham. February 2015.
Anchor QEA, 2015d. Draft Remedial Investigation Report for the Central Waterfront Site. Prepared for Port of Bellingham. May 2015.
Aspect, 2013. Remedial Investigation Report for the Georgia Pacific West Site. Prepared for the Port of Bellingham. August 2013.
Ecology (Washington State Department of Ecology), 2007. Exhibit B to Consent Decree: Cleanup Action Plan, Whatcom Waterway Site, Bellingham, Washington. 2007.
Ecology, 2011. First Amendment to Consent Decree. 2011.
Ecology, 2007. Consent Decree No. 07-2-022577-7 for the Whatcom Waterway Site (with Exhibits). Available online at: https://fortress.wa.gov/ecy/gsp/CleanupSiteDocuments.aspx?csid=219
Ecology, 2015. Bellingham Bay Regional Background Sediment Characterization Final Data Evaluation and Summary Report. Publication No. 15-09-044. February 2015.
Gardiner, W., 2010. Bioassay Testing Issues. Public Issue Paper presented by Mr. William Gardiner (NewFields, Inc.) at 2010 Sediment Management Annual Review Meeting, Federal Center South.

References
Compliance Monitoring Sampling and Quality Assurance Project Plan March 2016 Whatcom Waterway Cleanup in Phase 1 Site Areas 67 080007-01.04
Hart Crowser, 2000. Remedial Investigation/Feasibility Study. Whatcom Waterway Site, Bellingham, Washington. July 25, 2000.
O’Neill, S.M., J.E. West, and J.C. Hoeman, 1998. Spatial trends in the concentration of polychlorinated biphenyls (PCBs) in chinook (Oncorhynchus tshawytscha) and coho salmon (O. kisutch) in Puget Sound and factors affecting PCB accumulation: results from the Puget Sound Ambient Monitoring Program. In: Puget Sound Research ’98 Proceedings, Puget Sound Water Quality Action Team, Olympia, Washington. 312–328.
PSEP (Puget Sound Estuary Program), 1995. Recommended Guidelines for Conducting Laboratory Bioassays on Puget Sound Sediments. Prepared for the U.S. Environmental Protection Agency, Region 10, Seattle, Washington, and Puget Sound Water Quality Authority, Olympia, Washington, by King County Environmental Lab, Seattle, Washington. 1995.
PSEP, 1997. Puget Sound Estuary Program: Recommended Guidelines for Sampling Marine Sediment, Water Column, and Tissue in Puget Sound. Prepared for USEPA Region 10 and the Puget Sound Water Quality Authority. Puget Sound Water Quality Authority, Olympia, Washington.
USACE (U.S. Army Corps of Engineers), 2004 Revision. Engineering and Design - Hydrographic Surveying. Publication number: EM 1110-2-1003. CECW-EE and CECW-OD. April 1, 2004.
USEPA (U.S. Environmental Protection Agency), 1999. USEPA Contract Laboratory Program National Functional Guidelines for Organic Data Review. U.S. Environmental Protection Agency, Office of Emergency Response. EPA 540/R-99/008. October 1999.
USEPA, 2004. USEPA Contract Laboratory Program National Functional Guidelines for Inorganic Data Review. U.S. Environmental Protection Agency, Office of Superfund Remediation and Technology Innovation (OSRTI). EPA 540-R-04-004. October 2004.
USEPA, 2005. USEPA Contract Laboratory Program National Functional Guidelines for Chlorinated Dibenzo-p-Dioxins (CDDs) and Chlorinated Dibenzofurans (CDFs) Data

References
Compliance Monitoring Sampling and Quality Assurance Project Plan March 2016 Whatcom Waterway Cleanup in Phase 1 Site Areas 68 080007-01.04
Review. U.S. Environmental Protection Agency, Office of Superfund Remediation and Technology Innovation (OSRTI). EPA 540-R-05-001. September 2005.
USEPA, 2008. Contract Laboratory Program National Functional Guidelines for Superfund Organic Methods Data Review. Office of Superfund Remediation and Technical Innovation. EPA 540-R-08-01. June 2008.
USEPA, 2009. Guidance for Labeling Externally Validated Laboratory Analytical Data for Superfund Use. EPA 540-R-08-005. January 2009.
USGS (U.S. Geological Survey) and USEPA, 2003. Field Tests of Nylon-Screen Diffusion Samplers and Pushpoint Samplers for Detection of Metals in Sediment Pore Water, Ashland and Clinton, Massachusetts.

TABLES

Table 1Site Cleanup Levels for Surface Sediment
Compliance Monitoring Sampling and Quality Assurance Project PlanWhatcom Waterway Cleanup in Phase 1 Site Areas 1 of 1
October 2015080007-01.02
Benthic Protection1 Other2
Copper 390Mercury 0.41 1.2Zinc 410
Polycyclic Aromatic Hydrocarbons, µg/kg organic carbon Total LPAH 5,200Naphthalene 2,100Acenaphthylene 560Acenaphthene 500Fluorene 540Phenanthrene 1,500Anthracene 9602-Methylnaphthalene 670Total HPAHs 12,000Fluoranthene 1,700Pyrene 2,600Benzo(a)anthracene 1,300Chrysene 1,400Total benzo(b,j,k)fluoranthenes 3,200Benzo(a)pyrene 1,600Indeno(1,2,3-cd)pyrene 600Dibenz(a,h)anthracene 230Benzo(g,h,i)perylene 670Phenols, µg/kg dry weightPhenol 4202-Methylphenol 634-Methylphenol 6702,4-Dimethylphenol 29
Notes: 1.
2.cm = centimeterHPAH = high-molecular-weight polycyclic aromatic hydrocarbonLPAH = low-molecular-weight polycyclic aromatic hydrocarbonµg/kg = microgram per kilogrammg/kg = milligram per kilogramng/kg = nanogram per kilogramSVOC = semivolatile organic compound
These criteria were defined based on the Sediment Quality Standards (SQS). Exceedances of these values are subject to confirmational bioassay testing provisions. Site-specific bioaccumulation screening level (BSL)
SVOCs
Parameter
Metals, mg/kg dry weight
Cleanup Levels Defined in Consent Decree for Surface Sediment (0-12 cm)
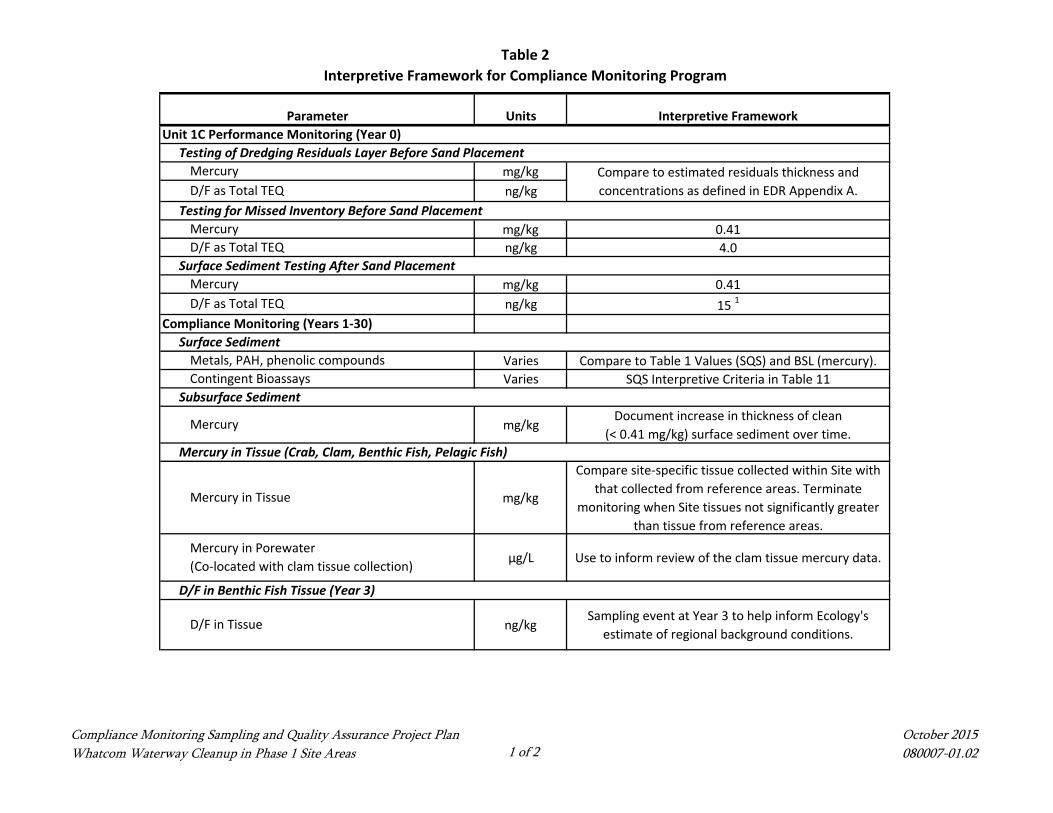
Table 2Interpretive Framework for Compliance Monitoring Program
Compliance Monitoring Sampling and Quality Assurance Project PlanWhatcom Waterway Cleanup in Phase 1 Site Areas 1 of 2
October 2015080007-01.02
Unit 1C Performance Monitoring (Year 0)Testing of Dredging Residuals Layer Before Sand Placement
mg/kgng/kg
Testing for Missed Inventory Before Sand Placementmg/kg 0.41ng/kg 4.0
mg/kg 0.41ng/kg 15 1
Compliance Monitoring (Years 1-30)
Varies Compare to Table 1 Values (SQS) and BSL (mercury).Varies SQS Interpretive Criteria in Table 11
mg/kgDocument increase in thickness of clean
(< 0.41 mg/kg) surface sediment over time.
mg/kg
Compare site-specific tissue collected within Site with that collected from reference areas. Terminate
monitoring when Site tissues not significantly greater than tissue from reference areas.
µg/L Use to inform review of the clam tissue mercury data.
ng/kgSampling event at Year 3 to help inform Ecology's
estimate of regional background conditions.
Surface Sediment Testing After Sand Placement
Parameter Units Interpretive Framework
MercuryD/F as Total TEQ
MercuryD/F as Total TEQ
Compare to estimated residuals thickness and concentrations as defined in EDR Appendix A.
MercuryD/F as Total TEQ
Mercury in Tissue (Crab, Clam, Benthic Fish, Pelagic Fish)
Mercury in Tissue
Surface Sediment
Subsurface Sediment
Mercury in Porewater (Co-located with clam tissue collection)
Metals, PAH, phenolic compoundsContingent Bioassays
Mercury
D/F in Benthic Fish Tissue (Year 3)
D/F in Tissue

Table 2Interpretive Framework for Compliance Monitoring Program
Compliance Monitoring Sampling and Quality Assurance Project PlanWhatcom Waterway Cleanup in Phase 1 Site Areas 2 of 2
October 2015080007-01.02
Parameter Units Interpretive Framework
µg/L
0.0594Value expected to be protective of sediment quality at the SQS (0.41 mg/kg) in the Log Pond area. Value is less
than the water quality reference values protective of marine aquatic organisms under acute and chronic
toxicity thresholds. 2
Notes:
1.
2.
D/F = dioxin/furansµg/L = microgram per litermg/kg = milligram per kilogramng/kg = nanogram per kilogramTEQ = toxicity equivalent
Refer to Appendix G of the EDR (Anchor QEA 2015) for a discussion of contingencies that may be employed in response to exceedances of the criteria listed in this table.
Reference value protective of aquatic organisms under acute exposures is 1.8 µg/L as dissolved mercury (WAC 173-201a-240(3)). Reference value protective of aquatic organisms under chronic exposures is 0.94 µg/L as total mercury (EPA 2015, National Reccomended Water Quality Criteria).
Assessment of anti-degradation provisions based on final data report documenting regional background concentration of dioxin/furans in Bellingham Bay (Ecology 2015).
Mercury in Log Pond Pore-Water
Mercury – Dissolved

Table 3 Sampling Design Summary
Compliance Monitoring Sampling and Quality Assurance Project PlanWhatcom Waterway Cleanup in Phase 1 Site Areas 1 of 2
October 2015080007-01.02
2017 (Year 1) 2019 (Year 3)During
DredgingPost
DredgingPost
ConstructionSpring Spring
Residuals Verify residuals assumptions Post-dredging in Unit 1C Hg, D/F, TS, TOC XUnderlying Sediment Verify lack of missed inventory Prior to sand placement in Unit 1C Hg, D/F, TS, TOC X
Underlying SedimentCharacterize sediment quality prior to
cappingPrior to capping in Units 2A and 3B
Cu, Hg, Zn, phenolic compounds, D/F, TS, TOC
X
Surface Sediment Surface sediment quality Years 1, 3, 5, 10, 20, 30Cu, Zn, PAH, phenolic compounds,
Hg ,D/F, TS, TOC, Contingent Bioassays1
X X
Subsurface Sediment Subsurface sediment quality Years 1, 10, 20, 30 Hg, TS XPost-dredge bathymetric surveys to
verify removal to target depthsAt completion of required dredging in material removal
areasBathymetry X
Post-placement surveys to confirm placement of residuals cover and caps
to required thicknessesAt completion of material placement Bathymetry X
Confirmation surveys to document long-term cap integrity
Years 1, 3, 5, 10 Bathymetry X X
Visual SurveysVisual surveys to verify integrity of
intertidal caps and above-water components of containment walls
Years 0, 1, 3, 5, 10Visual inspections for cap erosion,
wall integrity, groundwater seepage
X X X
Adult Dungeness Crab Tissue
Monitor in Years 0 and 1 and potentially in Years 3, 5, and 10. Discontinue when mercury in Site samples not
significantly different than reference samples after 2 consecutive sampling events.
Hg, lipids X X Contingent
Juvenile Dungeness Crab Tissue Monitor in Years 0 and 3. Hg, lipids X X
Caged Clam Tissue and Co-Located Pore-water
Monitor in Years 0 and 1 and potentially in Years 3, 5, and 10. Discontinue when mercury in Site samples not
significantly different than reference samples after 2 consecutive sampling events.
Tissue Hg, lipidsand Porewater Hg (total and
dissolved)X X Contingent
Benthic FishMonitor in Year 3 and potentially in Years 5 and 10.
Discontinue when mercury in Site samples not significantly different than reference samples.
Hg, lipids(D/F in Year-3)
X
Pelagic Fish
Implement only if Year 3 benthic fish monitoring shows mercury concentrations significantly elevated above reference area benthic fish tissue concentrations and
Ecology determines testing is required. Catch methods to be defined in SQAPP addendum.
Hg, lipids Contingent
Log Pond PorewaterAssess potential recontamination risks
associated with groundwaterYears 1, 3, 5, 10 Total and dissolved Hg X X
Notes:1. Contingent bioassays include 3 standard PSEP tests: 10-day acute amphipod, 20-day juvenile polychaete growth, and larval development. Details are provided in Section 2.9. Cu = copper TOC = total organic carbonD/F = dioxin/furans TS = total solidsHg = mercury Zn = zincPAH = polycyclic aromatic hydrocarbon
Bathymetric Surveys
Tissue
Monitoring Type
Confirmation
Monitoring Objective Frequency Parameters
Performance2015-2016 (Year 0)

Table 3 Sampling Design Summary
Compliance Monitoring Sampling and Quality Assurance Project PlanWhatcom Waterway Cleanup in Phase 1 Site Areas 2 of 2
October 2015080007-01.02
Residuals Verify residuals assumptions Post-dredging in Unit 1C Hg, D/F, TS, TOCUnderlying Sediment Verify lack of missed inventory Prior to sand placement in Unit 1C Hg, D/F, TS, TOC
Underlying SedimentCharacterize sediment quality prior to
cappingPrior to capping in Units 2A and 3B
Cu, Hg, Zn, phenolic compounds, D/F, TS, TOC
Surface Sediment Surface sediment quality Years 1, 3, 5, 10, 20, 30Cu, Zn, PAH, phenolic compounds,
Hg ,D/F, TS, TOC, Contingent Bioassays1
Subsurface Sediment Subsurface sediment quality Years 1, 10, 20, 30 Hg, TSPost-dredge bathymetric surveys to
verify removal to target depthsAt completion of required dredging in material removal
areasBathymetry
Post-placement surveys to confirm placement of residuals cover and caps
to required thicknessesAt completion of material placement Bathymetry
Confirmation surveys to document long-term cap integrity
Years 1, 3, 5, 10 Bathymetry
Visual SurveysVisual surveys to verify integrity of
intertidal caps and above-water components of containment walls
Years 0, 1, 3, 5, 10Visual inspections for cap erosion,
wall integrity, groundwater seepage
Adult Dungeness Crab Tissue
Monitor in Years 0 and 1 and potentially in Years 3, 5, and 10. Discontinue when mercury in Site samples not
significantly different than reference samples after 2 consecutive sampling events.
Hg, lipids
Juvenile Dungeness Crab Tissue Monitor in Years 0 and 3. Hg, lipids
Caged Clam Tissue and Co-Located Pore-water
Monitor in Years 0 and 1 and potentially in Years 3, 5, and 10. Discontinue when mercury in Site samples not
significantly different than reference samples after 2 consecutive sampling events.
Tissue Hg, lipidsand Porewater Hg (total and
dissolved)
Benthic FishMonitor in Year 3 and potentially in Years 5 and 10.
Discontinue when mercury in Site samples not significantly different than reference samples.
Hg, lipids(D/F in Year-3)
Pelagic Fish
Implement only if Year 3 benthic fish monitoring shows mercury concentrations significantly elevated above reference area benthic fish tissue concentrations and
Ecology determines testing is required. Catch methods to be defined in SQAPP addendum.
Hg, lipids
Log Pond PorewaterAssess potential recontamination risks
associated with groundwaterYears 1, 3, 5, 10 Total and dissolved Hg
Notes:1. Contingent bioassays include 3 standard PSEP tests: 10-day acute amphipod, 20-day juvenile polychaete growth, and larval development. Details are provided in Section 2.9. Cu = copper TOC = total organic carbonD/F = dioxin/furans TS = total solidsHg = mercury Zn = zincPAH = polycyclic aromatic hydrocarbon
Bathymetric Surveys
Tissue
Monitoring Type Monitoring Objective Frequency Parameters
2021 (Year 5) 2026 (Year 10) 2036 (Year 20) 2046 (Year 30)
Spring Spring Spring Spring
X X X X
X X X
X X
X X
Contingent Contingent
Contingent Contingent
Contingent Contingent
Contingent Contingent
X X
Confirmation

Table 4Sediment Sampling Locations and Methods – Performance Monitoring
Compliance Monitoring Sampling and Quality Assurance Project PlanWhatcom Waterway Cleanup in Phase 1 Site Areas 1 of 2
October 2015080007-01.02
Analytical TestingEasting Northing Chemistry
WW-P1PM-01 1239591.9 641253.6 Van Veen
grab Apparent Residuals
Layer (Typically 0–6 cm)WW-P1PM-01-RE
Underlying (native) sediment (10–20 cm below apparent
residuals layer)WW-P1PM-01-US Hg, D/F, TS, TOC 8-oz.
WW-P1PM-02 1239701.7 641144.5 Van Veen
grab Apparent Residuals
Layer (Typically 0–6 cm)WW-P1PM-02-RE
Underlying (native) sediment (10–20 cm below apparent
residuals layer)WW-P1PM-02-US Hg, D/F, TS, TOC 8-oz.
WW-P1PM-03 1239736.2 641390.7 Van Veen
grab Apparent Residuals
Layer (Typically 0–6 cm)WW-P1PM-03-RE
Underlying (native) sediment (10–20 cm below apparent
residuals layer)WW-P1PM-03-US Hg, D/F, TS, TOC 8-oz.
WW-P1PM-04 1239839.3 641277.0 Van Veen
grab Apparent Residuals
Layer (Typically 0–6 cm)WW-P1PM-04-RE
Underlying (native) sediment (10–20 cm below apparent
residuals layer)WW-P1PM-04-US Hg, D/F, TS, TOC 8-oz.
WW-P1PM-05 1239875.2 641528.1 Van Veen
grab Apparent Residuals
Layer (Typically 0–6 cm)WW-P1PM-05-RE
Underlying (native) sediment (10–20 cm below apparent
residuals layer)WW-P1PM-05-US Hg, D/F, TS, TOC 8-oz.
WW-P1PM-06 1239983.3 641423.1 Van Veen
grab Apparent Residuals
Layer (Typically 0–6 cm)WW-P1PM-06-RE
Underlying (native) sediment (10–20 cm below apparent
residuals layer)WW-P1PM-06-US Hg, D/F, TS, TOC 8-oz.
WW-P1PM-07 1241514.6 642837.3 Van Veen
grab
Apparent undredged sediment (excluding
residuals layer)2WW-P1PM-07-UD -- --
Cu, Hg, Zn, phenolic compounds, PAHs, D/F, TS,
TOC8-oz.
WW-P1PM-08 1241343.7 642989.4 Van Veen
grab
Apparent undredged sediment (excluding
residuals layer)2WW-P1PM-08-UD -- --
Cu, Hg, Zn, phenolic compounds, PAHs, D/F, TS,
TOC8-oz.
WW-P1PM-09 1241146.6 642800.0 Van Veen
grab
Apparent undredged sediment (excluding
residuals layer)2WW-P1PM-09-UD -- --
Cu, Hg, Zn, phenolic compounds, PAHs, D/F, TS,
TOC8-oz.
WW-P1PM-10 1241712.8 643039.0 Van Veen
grab
Apparent undredged sediment (excluding
residuals layer)2WW-P1PM-10-UD -- --
Cu, Hg, Zn, phenolic compounds, PAHs, D/F, TS,
TOC8-oz.
WW-P1PM-11 1241562.6 643186.2 Van Veen
grab
Apparent undredged sediment (excluding
residuals layer)2WW-P1PM-11-UD -- --
Cu, Hg, Zn, phenolic compounds, PAHs, D/F, TS,
TOC8-oz.
ArchiveAdditional Subsurface TestingSample ID
Unit 2A and 3B Sampling – After Dredging and Before Placement of Residuals Cover
Station IDProposed Coordinates1
Sample Method Surface Sampling Sample ID
3B
2A
Unit 1C Sampling – After Dredging and Before Placement of Residuals Cover
1C

Table 4Sediment Sampling Locations and Methods – Performance Monitoring
Compliance Monitoring Sampling and Quality Assurance Project PlanWhatcom Waterway Cleanup in Phase 1 Site Areas 2 of 2
October 2015080007-01.02
Analytical TestingEasting Northing Chemistry ArchiveAdditional Subsurface TestingSample IDStation ID
Proposed Coordinates1Sample Method Surface Sampling Sample ID
WW-P1PM-01 1239591.9 641253.6 Van Veen
grab 0 to 12 cm WW-P1PM-01-SS -- -- Hg, D/F, TS, TOC
Contingent Bioassays3
WW-P1PM-02 1239701.7 641144.5 Van Veen
grab 0 to 12 cm WW-P1PM-02-SS -- -- Hg, D/F, TS, TOC
Contingent Bioassays3
WW-P1PM-03 1239736.2 641390.7 Van Veen
grab 0 to 12 cm WW-P1PM-03-SS -- -- Hg, D/F, TS, TOC
Contingent Bioassays3
WW-P1PM-04 1239839.3 641277.0 Van Veen
grab 0 to 12 cm WW-P1PM-04-SS -- -- Hg, D/F, TS, TOC
Contingent Bioassays3
WW-P1PM-05 1239875.2 641528.1 Van Veen
grab 0 to 12 cm WW-P1PM-05-SS -- -- Hg, D/F, TS, TOC
Contingent Bioassays3
WW-P1PM-06 1239983.3 641423.1 Van Veen
grab 0 to 12 cm WW-P1PM-06-SS -- -- Hg, D/F, TS, TOC
Contingent Bioassays3
Notes:1. NAD 83/98 (Washington State Plane NAD 83 Lambert Conformal North Zone Grid, Per the 1998 Adjustment)
cm = centimeter PAH = polycyclic aromatic hydrocarbonCu = copper TOC = total organic carbonD/F = dioxin/furans TS = total solidsHg = mercury Zn = zinc
Unit 1C Sampling – After Placement of Residuals Cover
1C
2. Actual thickness of this layer will vary dependent upon penetration of grab sampler and thickness of dredging residuals layer.3. Contingent bioassays include 3 standard PSEP tests: 10-day acute amphipod, 20-day juvenile polychaete growth, and larval development. Details are provided in Section 2.9.

Table 5Tissue and Co-Located Porewater Sampling Locations and Methods – Performance and Confirmation Monitoring
Compliance Monitoring Sampling and Quality Assurance Project PlanWhatcom Waterway Cleanup in Phase 1 Site Areas 1 of 1
October 2015080007-01.02
Analytical Testing
Easting Northing Chemistry2
Clam Tissue Clam cage 1 composite (created from at
least 3 tissue samples) WW-P1CM-01-CL Hg, lipids Clam tissue
Porewater NMDS samplers or mini-piezometers
6-12 cm below mudline WW-P1CM-01-PW Total and dissolved Hg --
Clam Tissue Clam cage 1 composite (created from at
least 3 tissue samples) WW-P1CM-07-CL Hg, lipids Clam tissue
Porewater NMDS samplers or mini-piezometers
6-12 cm below mudline WW-P1CM-07-PW Total and dissolved Hg --
4 WW-P1CM-12 1240846.6 642752.9Juvenile
Dungeness Crab Tissue
Ring net 5 composited tissue samples WW-P1CM-12-CM Hg, lipidsIndividual crab tissue
Male Dungeness Crab Muscle
Crab traps 2 composites (each created
from at least 3 tissue samples) WW-MNR-07-CM Hg, lipids
Individual crab tissue
Clam Tissue Clam cage 1 composite (created from at
least 3 tissue samples) WW-MNR-07-CL Hg, lipids Clam tissue
Porewater NMDS samplers or mini-piezometers
6-12 cm below mudline WW-MNR-07-PW Total and dissolved Hg --
Male Dungeness Crab Muscle
Crab traps 2 composites (each created
from at least 3 tissue samples) WW-MNR-03-CM Hg, lipids
Individual crab tissue
Clam Tissue Clam cage 1 composite (created from at
least 3 tissue samples) WW-MNR-03-CL Hg, lipids Clam tissue
Porewater NMDS samplers or mini-piezometers
6-12 cm below mudline WW-MNR-03-PW Total and dissolved Hg --
Male Dungeness Crab Muscle
Crab traps 2 composites (each created
from at least 3 tissue samples) WW-MNR-04-CM Hg, lipids
Individual crab tissue
Clam Tissue Clam cage 1 composite (created from at
least 3 tissue samples) WW-MNR-04-CL Hg, lipids Clam tissue
Porewater NMDS samplers or mini-piezometers
6-12 cm below mudline WW-MNR-04-PW Total and dissolved Hg --
Benthic Fish Trawls 5 composites of 3 fish fillets
collected from the Site (any of the 3 trawl lines)
WW-PICM-COMP-BF Hg, lipids, D/F 2,3 Individual fish tissue
Male Dungeness Crab Muscle
Crab traps 3 composites (each created
from at least 3 tissue samples) WW-REF-01-CM Hg, lipids
Individual crab tissue
Clam Tissue Clam cage 1 composite (created from at
least 3 tissue samples) WW-REF-01-CL Hg, lipids Clam tissue
Porewater NMDS samplers or mini-piezometers
6-12 cm below mudline WW-REF-01-PW Total and dissolved Hg --
Clam Tissue Clam cage 1 composite (created from at
least 3 tissue samples) WW-REF-02-CL Hg, lipids Clam tissue
Porewater NMDS samplers or mini-piezometers
6-12 cm below mudline WW-REF-02-PW Total and dissolved Hg --
Clam Tissue Clam cage 1 composite (created from at
least 3 tissue samples) WW-REF-03-CL Hg, lipids Clam tissue
Porewater NMDS samplers or mini-piezometers
6-12 cm below mudline WW-REF-03-PW Total and dissolved Hg --
Clam Tissue Clam cage 1 composite (created from at
least 3 tissue samples) WW-REF-04-CL Hg, lipids Clam tissue
Porewater NMDS samplers or mini-piezometers
6-12 cm below mudline WW-REF-04-PW Total and dissolved Hg --
Male Dungeness Crab Muscle
Crab traps 3 composites (each created
from at least 3 tissue samples) WW-REF-05-CM Hg, lipids
Individual crab tissue
Clam Tissue Clam cage 1 composite (created from at
least 3 tissue samples) WW-REF-05-CL Hg, lipids
Individual clam tissue
Porewater NMDS samplers or mini-piezometers
6-12 cm below mudline WW-REF-05-PW Total and dissolved Hg --
Benthic Fish Trawls 5 composites of 3 fish fillets
collected from the Samish Bay (any of the 3 trawl lines)
WW-REF-COMP-BF Hg, lipids, D/F 2,3 individual fish tissue
Ref WW-REF-06 1207176.3 634851.1Juvenile
Dungeness Crab Tissue
Ring net 5 composited tissue samples WW-REF-06-CM Hg, lipidsIndividual crab tissue
Notes:1. North American Datum 1983 (NAD83)/1998 (Washington State Plane NAD 83 Lambert Conformal North Zone Grid, Per the 1998 Adjustment)
D/F = dioxin/furansHg = mercury
2. Chemical testing: total and dissolved mercury will be analyzed using low level mercury methods (modified 7470).
WW-REF-04 1232822 583482.7
WW-REF-05 1236802.7 587226.8
Ref
Reference Areas (Other)
1232815.4 585637.6
WW-REF-02 1228771.6 580602.7
WW-REF-03
Reference Areas (Samish Bay)
Site Areas
WW-REF-01 1228731.9 581840.5
1241343.7 642989.4
9
WW-MNR-03 1237324.4 643041.7
WW-MNR-04 1237147.5 639909.2
5A WW-MNR-07 1238791.5 641463.6
3. Testing for D/F to be performed during Year 3 to help inform Ecology's ongoing evaluation of D/F regional conditions in Bellingham Bay.
Reference Areas
Sample ID Archive
1C WW-P1CM-01 1239693.5 641212.3
Site Unit Station ID
Proposed Coordinates1
Sample Media Sample Method Sampling Interval
2A WW-P1CM-07

Table 6Sediment Sampling Locations and Methods – Confirmation Monitoring
Compliance Monitoring Sampling and Quality Assurance Project PlanWhatcom Waterway Cleanup in Phase 1 Site Areas 1 of 2
October 2015080007-01.02
Analytical Testing
Easting Northing Chemistry2,3
WW-P1CM-01 1239693.5 641212.3 Surface Sediment Van Veen grab 0 to 12 cm WW-P1CM-01-SSHg, Cu, Zn, PAH, phenolic
compounds, TS, TOCContingent Bioassays 4
WW-P1CM-02 1239872.1 641378.8 Surface Sediment Van Veen grab 0 to 12 cm WW-P1CM-02-SSHg, Cu, Zn, PAH, phenolic compounds, D/F, TS, TOC
Contingent Bioassays 4
WW-P1CM-06 1241514.6 642837.3 Surface Sediment Van Veen grab 0 to 12 cm WW-P1CM-06-SSHg, Cu, Zn, PAH, phenolic compounds, D/F, TS, TOC
Contingent Bioassays 4
WW-P1CM-07 1241343.7 642989.4 Surface Sediment Van Veen grab 0 to 12 cm WW-P1CM-07-SSHg, Cu, Zn, PAH, phenolic
compounds, TS, TOCContingent Bioassays 4
WW-P1CM-08 1241146.6 642800.0 Surface Sediment Van Veen grab 0 to 12 cm WW-P1CM-08-SSHg, Cu, Zn, PAH, phenolic compounds, D/F, TS, TOC
Contingent Bioassays 4
WW-P1CM-09 1241712.8 643039.0 Surface Sediment Van Veen grab 0 to 12 cm WW-P1CM-09-SSHg, Cu, Zn, PAH, phenolic
compounds, TS, TOCContingent Bioassays 4
WW-P1CM-10 1241562.6 643186.2 Surface Sediment Van Veen grab 0 to 12 cm WW-P1CM-10-SSHg, Cu, Zn, PAH, phenolic compounds, D/F, TS, TOC
Contingent Bioassays 4
WW-P1CM-03 1240532.8 641249.1 Surface Sediment Van Veen grab 0 to 12 cm WW-P1CM-03-SSHg, Cu, Zn, PAH, phenolic
compounds, TS, TOCContingent Bioassays 4
WW-P1CM-04 1240693.4 641391.5 Surface Sediment Van Veen grab 0 to 12 cm WW-P1CM-04-SSHg, Cu, Zn, PAH, phenolic compounds, D/F, TS, TOC
Contingent Bioassays 4
WW-P1CM-05 1240815.9 641874.5 Surface Sediment Van Veen grab 0 to 12 cm WW-P1CM-05-SSHg, Cu, Zn, PAH, phenolic
compounds, TS, TOCContingent Bioassays 4
WW-P1CM-03 1240532.8 641249.1 Porewater NMDS samplers
or mini-piezometers
6-12 cm below mudline
WW-P1CM-03-PW Hg (total and dissolved) --
WW-P1CM-04 1240693.4 641391.5 Porewater NMDS samplers
or mini-piezometers
6-12 cm below mudline
WW-P1CM-04-PW Hg (total and dissolved) --
Surface Sediment Van Veen grab 0 to 2 cm WW-P1CM-11-SS-0-2Hg, Cu, Zn, PAH, phenolic compounds, D/F, TS, TOC
--
Surface Sediment Van Veen grab 0 to 12 cm WW-P1CM-11-SS-0-12Hg, Cu, Zn, PAH, phenolic compounds, D/F, TS, TOC
Contingent Bioassays 4
WW-MNR-10 1241817.6 643425.6 Surface Sediment Van Veen grab 0 to 12 cm WW-MNR-10-SSHg, Cu, Zn, PAH, phenolic
compounds, TS, TOCContingent Bioassays 4
WW-MNR-11 1241959.2 643284.6 Surface Sediment Van Veen grab 0 to 12 cm WW-MNR-11-SSHg, Cu, Zn, PAH, phenolic compounds, D/F, TS, TOC
Contingent Bioassays 4
WW-MNR-06 1239218.4 642296.7 Surface Sediment Van Veen grab 0 to 12 cm WW-MNR-06-SSHg, Cu, Zn, PAH, phenolic
compounds, TS, TOCContingent Bioassays 4
WW-MNR-07 1238791.5 641463.6 Surface Sediment Van Veen grab 0 to 12 cm WW-MNR-07-SSHg, Cu, Zn, PAH, phenolic compounds, D/F, TS, TOC
Contingent Bioassays
0-0.5 foot WW-MNR-07-SC-0-0.5 Hg, TS --0.5-1 foot WW-MNR-07-SC-0.5-1 Hg, TS --1-1.5 feet WW-MNR-07-SC-1-1.5 Hg, TS --1.5-2 feet WW-MNR-07-SC-1.5-2 Hg, TS --2-2.5 feet WW-MNR-07-SC-2-2.5 Hg, TS --2.5-3 feet WW-MNR-07-SC-2.5-3 Hg, TS --
6C WW-MNR-09 1240195.7 640238.4 Surface Sediment Van Veen grab 0 to 12 cm WW-MNR-09-SSHg, Cu, Zn, PAH, phenolic compounds, D/F, TS, TOC
Contingent Bioassays 4
7 WW-MNR-05 1237855.1 638100.7 Surface Sediment Van Veen grab 0 to 12 cm WW-MNR-05-SSHg, Cu, Zn, PAH, phenolic compounds, D/F, TS, TOC
Contingent Bioassays 4
WW-MNR-01 1236589.3 641690.4 Surface Sediment Van Veen grab 0 to 12 cm WW-MNR-01-SSHg, Cu, Zn, PAH, phenolic
compounds, TS, TOCContingent Bioassays 4
WW-MNR-02 1236335.6 636672.7 Surface Sediment Van Veen grab 0 to 12 cm WW-MNR-02-SSHg, Cu, Zn, PAH, phenolic
compounds, TS, TOCContingent Bioassays 4
WW-MNR-03 1237324.4 643041.7 Surface Sediment Van Veen grab 0 to 12 cm WW-MNR-03-SSHg, Cu, Zn, PAH, phenolic compounds, D/F, TS, TOC
Contingent Bioassays 4
WW-MNR-04 1237147.5 639909.2 Surface Sediment Van Veen grab 0 to 12 cm WW-MNR-04-SSHg, Cu, Zn, PAH, phenolic compounds, D/F, TS, TOC
Contingent Bioassays 4
WW-MNR-08 1239014.4 639146.3 Surface Sediment Van Veen grab 0 to 12 cm WW-MNR-08-SSHg, Cu, Zn, PAH, phenolic
compounds, TS, TOCContingent Bioassays 4
0-0.5 foot WW-MNR-02-SC-0-0.5 Hg, TS --0.5-1 foot WW-MNR-02-SC-0.5-1 Hg, TS --1-1.5 feet WW-MNR-02-SC-1-1.5 Hg, TS --1.5-2 feet WW-MNR-02-SC-1.5-2 Hg, TS --2-2.5 feet WW-MNR-02-SC-2-2.5 Hg, TS --2.5-3 feet WW-MNR-02-SC-2.5-3 Hg, TS --0-0.5 foot WW-MNR-03-SC-0-0.5 Hg, TS --0.5-1 foot WW-MNR-03-SC-0.5-1 Hg, TS --1-1.5 feet WW-MNR-03-SC-1-1.5 Hg, TS --1.5-2 feet WW-MNR-03-SC-1.5-2 Hg, TS --2-2.5 feet WW-MNR-03-SC-2-2.5 Hg, TS --2.5-3 feet WW-MNR-03-SC-2.5-3 Hg, TS --0-0.5 foot WW-MNR-04-SC-0-0.5 Hg, TS --0.5-1 foot WW-MNR-04-SC-0.5-1 Hg, TS --1-1.5 feet WW-MNR-04-SC-1-1.5 Hg, TS --1.5-2 feet WW-MNR-04-SC-1.5-2 Hg, TS --2-2.5 feet WW-MNR-04-SC-2-2.5 Hg, TS --2.5-3 feet WW-MNR-04-SC-2.5-3 Hg, TS --
9
Subsurface Sediment
Vibracore
WW-MNR-07
WW-MNR-03 643041.7
1237667.4 642701.6
Proposed Coordinates1
Sample ID
1C
2A
Sample MethodSampling Interval
Phase 1 Construction Areas
4
Vibracore
1237324.4
642752.9
WW-MNR-02 1236335.6 636672.7Subsurface Sediment
639909.2
Vibracore
5A
Archive4Site Unit Station ID Sample Media
Subsurface Sediment
Subsurface Sediment
WW-MNR-04 1237147.5
3B
3A
Monitored Natural Recovery Areas
Vibracore
WW-P1CM-115C 1240846.6

Table 6Sediment Sampling Locations and Methods – Confirmation Monitoring
Compliance Monitoring Sampling and Quality Assurance Project PlanWhatcom Waterway Cleanup in Phase 1 Site Areas 2 of 2
October 2015080007-01.02
Analytical Testing
Easting Northing Chemistry2,3
Proposed Coordinates1
Sample IDSample MethodSampling Interval
Archive4
Site Unit Station ID Sample Media
0-0.5 foot WW-MNR-08-SC-0-0.5 Hg, TS --0.5-1 foot WW-MNR-08-SC-0.5-1 Hg, TS --1-1.5 feet WW-MNR-08-SC-1-1.5 Hg, TS --1.5-2 feet WW-MNR-08-SC-1.5-2 Hg, TS --2-2.5 feet WW-MNR-08-SC-2-2.5 Hg, TS --2.5-3 feet WW-MNR-08-SC-2.5-3 Hg, TS --
Notes:1. NAD 83/98 (Washington State Plane NAD 83 Lambert Conformal North Zone Grid, Per the 1998 Adjustment)2. Total and dissolved mercury will be analyzed using low level mercury methods (modified 7470).3. D/F will be analyzed at a subset of surface sediment sample locations.
cm = centimeter Hg = mercury TS = total solidsCu = copper PAH = polycyclic aromatic hydrocarbon Zn = zincD/F = dioxin/furans TOC = total organic carbon
WW-MNR-08 Vibracore Subsurface Sediment
1238791.5 641463.6
4. Contingent bioassays include 3 standard PSEP tests: 10-day acute amphipod, 20-day juvenile polychaete growth, and larval development. Details are provided in Section 2.9.

Table 7Guidelines for Sample Handling and Storage
Compliance Monitoring Sampling and Quality Assurance Project PlanWhatcom Waterway Cleanup in Phase 1 Site Areas 1 of 1
October 2015080007-01.02
Sample SizeContainer Size and
Type2 Holding Time Preservative
6 months Cool/4° C2 years; 28 days for mercury Freeze1/-18° C
14 days Cool/4° C6 months Freeze/-18° C
14 days until extraction Cool/4° C1 year until extraction Freeze/-18° C
40 days after extraction Cool/4° C14 days until extraction Cool/4° C1 year until extraction Freeze/-18° C
Chemistry archive 500 g 16-oz Glass 1 year until extraction Freeze/-18° C
2 gallon2-gallon
HDPE buckets2 56 days Cool/4°C
25 g 28 days Cool/4° C or Freeze1/-18° C14 days until extraction Cool/4° C1 year until extraction Freeze/-18° C
10 g 1 year Freeze/-18° C
100 mL 500 mL HDPE 28 days pH≤2 with HNO3
100 mL 500 mL HDPE28 days (dissolved fraction is field
filtered)pH≤2 with HNO3
Notes:1. Metals include copper, zinc, and mercury. Samples will be analyzed for mercury immediately or frozen.2. All sample containers will have lids with Teflon inserts. Note, in some instances the sample size volume needed is less than the container size. In these instances, only the required material volume will be collected. D/F = dioxin/furans mL = milliliterg = gram PAH = polycyclic aromatic hydrocarbonsHDPE = high density polyethylene TOC = total organic carbonHg = mercury TS = total solids
Contingent bioassays
ParameterSediments
D/F 100 g 8-oz Amber Glass
100 g
50 g
Total metals1 50 g4-oz Glass
Dissolved Hg (field filtered)
Total Hg (not filtered)
Tissues
1 x 16-oz Glass
50 g
Waters
Hg1
4-oz Glass
Lipids
PAH, phenolic compounds
D/F
TS/TOC

Table 8Sediment Parameters, Analytical Methods, and Target Quantitation Limits
Compliance Monitoring Sampling and Quality Assurance Project PlanWhatcom Waterway Cleanup in Phase 1 Site Areas 1 of 2
October 2015080007-01.02
Conventional Parameters, %Total solids SM2540G 0.1Total organic carbon Plumb 1981 0.1
Metals, mg/kg dry weightCopper 6010C/6020 10Mercury 7471A 0.05Zinc 6010C/6020 15
Semivolatile Organic Compounds (SVOCs)Polycyclic Aromatic Hydrocarbons, µg/kg dry weight
Total LPAH1 calculated ---Naphthalene 8270D 20.0Acenaphthylene 8270D 20.0Acenaphthene 8270D 20.0Fluorene 8270D 20.0Phenanthrene 8270D 20.0Anthracene 8270D 20.02-Methylnaphthalene 8270D 20.0Total HPAHs2 calculated ---Fluoranthene 8270D 20.0Pyrene 8270D 20.0Benzo(a)anthracene 8270D 20.0Chrysene 8270D 20.0Total benzo(b,j,k)fluoranthenes 8270D 40.0Benzo(a)pyrene 8270D 20.0Indeno(1,2,3-cd)pyrene 8270D 20.0Dibenz(a,h)anthracene 8270D SIM 5.0Benzo(g,h,i)perylene 8270D 20.0
Phenols, µg/kg dry weightPhenol 8270D SIM 52-Methylphenol 8270D SIM 54-Methylphenol 8270D SIM 102,4-Dimethylphenol 8270D SIM 25Pentachlorophenol 8270D SIM 20
Dioxin/Furans, ng/kg dry weightDioxins
2,3,7,8-TCDD 1613B 1.01,2,3,7,8-PeCDD 1613B 1.01,2,3,4,7,8-HxCDD 1613B 2.51,2,3,6,7,8-HxCDD 1613B 2.51,2,3,7,8,9-HxCDD 1613B 2.51,2,3,4,6,7,8-HpCDD 1613B 2.5OCDD 1613B 5
Furans2,3,7,8-TCDF 1613B 1.01,2,3,7,8-PeCDF 1613B 2.52,3,4,7,8,-PeCDF 1613B 1.01,2,3,4,7,8-HxCDF 1613B 2.5
ParameterAnalytical Method Quantitation Limit

Table 8Sediment Parameters, Analytical Methods, and Target Quantitation Limits
Compliance Monitoring Sampling and Quality Assurance Project PlanWhatcom Waterway Cleanup in Phase 1 Site Areas 2 of 2
October 2015080007-01.02
ParameterAnalytical Method Quantitation Limit
1,2,3,6,7,8-HxCDF 1613B 2.51,2,3,7,8,9-HxCDF 1613B 2.52,3,4,6,7,8-HxCDF 1613B 2.51,2,3,4,6,7,8-HpCDF 1613B 2.51,2,3,4,7,8,9-HpCDF 1613B 2.5OCDF 1613B 5Total TEQ 1613B 4
Notes:1.
2.
µg/kg = microgram per kilogrammg/kg = milligram per kilogramng/kg = nanogram per kilogram
Total low-molecular-weight polycyclic aromatic hydrocarbons (LPAH) consists of the sum of naphthalene, acenaphthylene, acenaphthene, fluorene, phenanthrene, and anthracene. Total high-molecular-weight polycyclic aromatic hydrocarbons (HPAH) consists of the sum of fluoranthene, pyrene, benz(a)anthracene, chrysene, benzo(b,j,k)fluoranthenes, benzo(a)pyrene, indeno(1,2,3,-c,d)pyrene, dibenzo(a,h)anthracene, and benzo(g,h,i)perylene.

Table 9Tissue Parameters, Analytical Methods, and Target Quantitation Limits
Compliance Monitoring Sampling and Quality Assurance Project PlanWhatcom Waterway Cleanup in Phase 1 Site Areas 1 of 1
October 2015080007-01.02
Conventional Parameters, %Lipids Mod. Bligh and Dyer 1959 0.1Moisture content SM 2540G 0.1
Metals, mg/kg wet weightMercury 7471B 0.005
Dioxin/Furans, ng/kg dry weightDioxins
2,3,7,8-TCDD 1613B 1.01,2,3,7,8-PeCDD 1613B 5.01,2,3,4,7,8-HxCDD 1613B 5.01,2,3,6,7,8-HxCDD 1613B 5.01,2,3,7,8,9-HxCDD 1613B 5.01,2,3,4,6,7,8-HpCDD 1613B 5.0OCDD 1613B 10
Furans2,3,7,8-TCDF 1613B 1.01,2,3,7,8-PeCDF 1613B 5.02,3,4,7,8,-PeCDF 1613B 5.01,2,3,4,7,8-HxCDF 1613B 5.01,2,3,6,7,8-HxCDF 1613B 5.01,2,3,7,8,9-HxCDF 1613B 5.02,3,4,6,7,8-HxCDF 1613B 5.01,2,3,4,6,7,8-HpCDF 1613B 5.01,2,3,4,7,8,9-HpCDF 1613B 5.0OCDF 1613B 10
Notes:Final quantitation limit values may differ slightly based on sample dry weight correction, adjustment for sample size and sample dilution due to matrix interference, or non-target analytes.
ng/kg = nanogram per kilogramSM = standard method
ParameterAnalytical Method Quantitation Limit
mg/kg = milligram per kilogram

Table 10Porewater Parameters, Analytical Methods, and Target Quantitation Limits
Compliance Monitoring Sampling and Quality Assurance Project PlanWhatcom Waterway Cleanup in Phase 1 Site Areas 1 of 1
October 2015080007-01.02
Total and Dissolved Metals, µg/LMercury USEPA 7470A 0.02
Notes:Final quantitation limit values may differ slightly based on volume of sample collected and sample dilution due to matrixinterference, or non‐target analytes.
ParameterAnalytical Method Quantitation Limit
µg/L = microgram per liter

Table 11Toxicity Testing – SMS Biological Effects Criteria for Puget Sound Marine Sediments
Compliance Monitoring Sampling and Quality Assurance Project PlanWhatcom Waterway Cleanup in Phase 1 Site Areas 1 of 1
October 2015080007-01.02
Biological Test Test Performance Standards Sediment Cleanup Objectives1 Cleanup Screening Levels, or Minimum Cleanup Levels2
AmphipodMean mortality in control sediment <10% and mean mortality in reference sediment <25%.
The test sediment has a significantly higher (t‑test, P ≤ 0.05) mean mortality than the reference sediment, and the test sediment mean mortality is 25% greater on an absolute basis than the reference sediment mean mortality.
The test sediment has a significantly higher (t‑test, P ≤ 0.05) mean mortality than the reference sediment, and the test sediment mean mortality is more than 30% greater on an absolute basis than the reference sediment mean mortality.
Larval
Mean normal survivorship in seawater control >70% at time final. Reference normal survivorship must be >65% of the normal survivorship in the control.
The test sediment has a mean survivorship of normal larvae that is significantly less (t-test, P ≤0.1) than the mean normal survivorship in the reference sediment, and the mean normal survivorship in the test sediment is less than 85% of the mean normal survivorship in reference sediment.
The test sediment has a mean survivorship of normal larvae that is significantly less (t-test, P ≤0.1) than the mean normal survivorship in the reference sediment, and the mean normal survivorship in the test sediment is less than 70% of the mean normal survivorship in the reference sediment.
Juvenile polychaete
Mean mortality in control sediment <10%, Mean individual growth rate >0.72 mg/ind/day. Control growth rates below 0.38 mg/ind/day will be considered a QA/QC failure. Mean individual growth rate in reference sediment ≥80% of mean individual growth rate in control.
The mean individual growth rate of polychaetes in the test sediment is less than 70% of the mean individual growth rate of the polychaetes in the reference sediment, and the test sediment mean individual growth rate is statistically different (t-test, P ≤ 0.05) from the reference sediment mean individual growth rate.
The mean individual growth rate of polychaetes in the test sediment is less than 50% of the mean individual growth rate of the polychaetes in the reference sediment, and the test sediment mean individual growth rate is statistically different (t‑test, P ≤0.05) from the reference sediment mean individual growth rate.
Notes:Source: Ecology (2008)1. The Sediment Quality Standards (SQS) are exceeded if one test fails the listed criteria [Washington Administrative Code (WAC) 173-204-320(3)].2. The cleanup screening level (CSL), or minimum cleanup level is exceeded if one test fails the listed sediment impact zone maximum level, CSL, or minimum cleanup level criteria [WAC 173-204-420(3)] or if two tests fail the SQS criteria of WAC 173-204-320(3). mg/ind/day = milligrams per individual per dayQA/QC = quality assurance/quality control

Table 12Field and Laboratory QA/QC Requirements
Compliance Monitoring Sampling and Quality Assurance Project PlanWhatcom Waterway Cleanup in Phase 1 Site Areas 1 of 1
October 2015080007-01.02
Rinsate Blank
Field Duplicates
Initial Calibration
Ongoing Calibration Replicates5
Laboratory Control Sample/ Ongoing Precision and Recovery Matrix Spikes Matrix Spike Duplicates Method Blanks
Surrogate Spikes
Sediments
NA 1 per event Each batch2 NA1 per 20 samples or 1 per batch,
whichever is more frequentNA NA NA NA NA
NA 1 per event Daily or each
batch1 per 10 samples
1 per 20 samples or 1 per batch, whichever is more frequent
1 per 20 samples or 1 per batch, whichever is more frequent
1 per 20 samples or 1 per batch, whichever is more frequent
NA1 per 20 samples or 1 per batch,
whichever is more frequentNA
1 per event 1 per event Daily1 per 10 samples
1 per 20 samples or 1 per batch, whichever is more frequent
1 per 20 samples or 1 per batch, whichever is more frequent
1 per 20 samples or 1 per batch, whichever is more frequent
NA1 per 20 samples or 1 per batch,
whichever is more frequentNA
1 per event 1 per event As needed 3Every 12
hoursNA
1 per 20 samples or 1 per batch, whichever is more frequent
1 per 20 samples or 1 per batch, whichever is more frequent
1 per 20 samples or 1 per batch, whichever is more frequent
1 per 20 samples or 1 per batch, whichever is more frequent
Every sample
1 per event 1 per event As needed 3Every 12
hours1 per 20 samples or 1 per batch,
whichever is more frequent1 per 20 samples or 1 per batch,
whichever is more frequent NA5 NA5 1 per 20 samples or 1 per batch, whichever is more frequent
Every sample5
Tissues
NA NA Each batch2 NA1 per 20 samples or 1 per batch,
whichever is more frequentNA NA NA NA NA
1 per event NA Daily1 per 10 samples
1 per 20 samples or 1 per batch, whichever is more frequent
1 per 20 samples or 1 per batch, whichever is more frequent
1 per 20 samples or 1 per batch, whichever is more frequent
NA1 per 20 samples or 1 per batch,
whichever is more frequentNA
1 per event NA As needed2 Every 12 hours
1 per 20 samples or 1 per batch, whichever is more frequent
1 per 20 samples or 1 per batch, whichever is more frequent NA4 NA4 1 per 20 samples or 1 per batch,
whichever is more frequentEvery
sample5
Porewater6
1 per event 1 per event Daily1 per 10 samples
1 per 20 samples or 1 per batch, whichever is more frequent
1 per 20 samples or 1 per batch, whichever is more frequent
1 per 20 samples or 1 per batch, whichever is more frequent
NA1 per 20 samples or 1 per batch,
whichever is more frequentNA
Notes:1. Metals include copper, zinc, and mercury.2. Initial calibration verification and calibration blank must be analyzed at the beginning of each batch.3. Initial calibrations are considered valid until the ongoing continuing calibration no longer meets method specifications. At that point, a new initial calibration is performed.4. Isotope dilution with labeled compounds required in every sample.5. Matrix spike duplicate may be used for data evaluation instead of replicate.6. QC samples may be limited by available porewater volume. If this occurs, a matrix spike may be used for data evaluation instead of replicate.D/F = dioxin/furansHg = mercuryNA = not applicablePAH = polycyclic aromatic hydrocarbonTOC = total organic carbonTS = total solids
Lipids
PAH, phenolic compounds
Field Quality Assurance Laboratory Quality Control Elements
TS
TOC
Analysis Type
Hg
D/F
Hg
D/F
Metals1

Table 13Data Quality Objectives
Compliance Monitoring Sampling and Quality Assurance Project PlanWhatcom Waterway Cleanup in Phase 1 Site Areas 1 of 1
October 2015080007-01.02
Precision Accuracy CompletenessSediments
Total organic carbon ± 30% RPD 65% – 135% R 95%Total metals ± 30% RPD 75% – 125% R 95%D/F ± 50% RPD 50% – 150% R 95%Semivolatile organic compounds ± 50% RPD 50% – 150% R 95%
TissuesLipids ± 30% RPD NA 95%Mercury ± 30% RPD 75% – 125% R 95%D/F ± 50% RPD 50% – 150% R 95%
PorewatersMercury ± 25% RPD 75% – 125% R 95%
Notes:NA = not applicableR = recoveryRPD = relative percent difference
Parameter

FIGURES

0 400
Scale in Feet
Oct
12,
201
5 10
:13a
m e
pipk
in
T:\
CAD\
Proj
ects
\000
7-Po
rt o
f Bel
lingh
am\W
hatc
om W
ater
way
Cle
anup
Inne
r Wtr
\EDR
\007
-RP-
008-
EDR.
dwg
SQAP
P
SOURCE: Figure 6-5 of Exhibit 1 of the FirstAmendment to the Whatcom Waterway Site ConsentDecree (2011).HORIZONTAL DATUM: Washington State Plane North,NAD 83 Feet.VERTICAL DATUM: Mean Lower Low Water (MLLW).
Dredge and Cap
Stabilize and Cap Shoreline
Dredge with Upland Landfill Disposal
Cap
LEGEND:
Existing dock or wharf
Sediment Site Unit
Figure 1
Construction Project for Phase 1 Areas
Compliance Monitoring Sampling and Quality Assurance Project Plan
Whatcom Waterway Cleanup in Phase 1 Site Areas

!(Ð
!(Ð
!(Ð
!(Ð
!(Ð
!(Ð
WW-P1PM-01
WW-P1PM-02
WW-P1PM-03
WW-P1PM-04
WW-P1PM-05
WW-P1PM-06
Figure 2Performance Monitoring Surface Sediment Sampling Locations
Compliance Monitoring Sampling and Quality Assurance Project PlanWhatcom Waterway Cleanup in Phase 1 Site Areas
0 40 80 120 160Feet [Notes:
1. Sediment Site Units and boundaries source: Figure 4-6, Cleanup Action Plan, Whatcom Waterway Site, September 2007.2. Horizontal datum: Washington State Plane North, NAD 27/98.3. Aerial photo taken in 2004.
Legend
!(Ð Surface Sediment Sample Location
Sediment Site Unit
Residuals Management Cover Area
Unit 1C

#7
#7#7 #7
#7
WW-P1PM-09 WW-P1PM-08 WW-P1PM-11
WW-P1PM-07 WW-P1PM-10
Whatcom Waterway
Figure 3Performance Monitoring Surface Sediment Sampling Locations - Units 2A and 3B
Compliance Monitoring Sampling and Quality Assurance Project PlanWhatcom Waterway Cleanup in Phase 1 Site Areas
Q:\J
obs\
0800
07-0
1_W
hatc
om_W
ater
way
\Map
s\20
14_1
1\Fi
g3_S
QA
PP_
Sur
fSed
_Mon
itorin
g_Lo
cs.m
xd e
pipk
in 1
0/12
/201
5 1
1:34
:46
AM
0 75 150 225 300
Feet
[
LEGEND#7 Surface Sediment Sample Location
Sediment Site Unit
Unit 2C Unit 3B Unit 3A
Unit 2A

!(
!5
!(!(
!(
!(!(
!5!5
!(
!( !(
!( !(
!(
!(
!(!(
!(
!(
!(
!(
"/
#*
#*
WW-MNR-06
WW-MNR-12
WW-MNR-05WW-MNR-09
WW-MNR-03
WW-MNR-07
WW-MNR-11
WW-MNR-10
WW-MNR-02 WW-MNR-08
WW-MNR-04
WW-MNR-01
WW-P1CM-06
WW-P1CM-07WW-P1CM-11
WW-P1CM-08
WW-P1CM-09WW-P1CM-05
WW-P1CM-04
WW-P1CM-03
WW-P1CM-02WW-P1CM-01
WW-P1CM-10
Chlor-Alkali Remedial Action Unit
Pulp/Tissue Mill Remedial Action Unit
Figure 4Proposed Locations for Tissue and Co-Located Porewater Monitoring Compliance Monitoring Sampling and Quality Assurance Project Plan
Whatcom Waterway Cleanup in Phase 1 Site Areas
Q:\J
obs\
0800
07-0
1_W
hatc
om_W
ater
way
\Map
s\20
14_1
1\Fi
g3_S
QA
PP_
Pro
pose
d_Ti
ssue
Por
ewat
er_M
onito
ring_
Locs
.mxd
epi
pkin
9/2
1/20
15 2
:49:
30 P
M
0 500 1,000Feet
[
NOTES:1. Site units are shown based on those in Figure 2-3 Cleanup Action Plan, Whatcom Waterway Site, September 2007. Unit 9 boundary updated based on Pre-remedial Design Investigation findings.2. Horizontal datum: Washington State Plane North, North American Datum 1983 (NAD83) Feet.3. Vertical datum: Mean Lower Low Water (MLLW).4. Unit 2B was established in the Cleanup Action Plan based on the anticipated marina access channel location. This location will be adjusted during final design.5. These stations represent target areas in which fish will be collected. Actual locations will be dependent upon abundance and collection methods at the time of sampling. Otter trawl methods will beused for benthic fish tissue (i.e., English sole or starry flounder).6. Contingent collection of pelagic fish (sockeye salmon) will be performed at a location within the site boundary.7. Remedial Action Unit (RAU) boundaries were defined in the Final Cleanup Action Plan for the GP West Pulp and Tissue Remedial Action Unit (Aspect 2014).
OUTER WHATCOM WATERWAY INNER WHATCOM WATERWAY
AREAS OFFSHORE OF ASB
AERATED STABILIZATIONBASIN (ASB)
REMAINING AREAS OF THE SITE
LOG POND
STARR ROCK
BARGEDOCKAREA BELLINGHAM
SHIPPINGTERMINAL
I & J STREET WATERWAY
EEL GRASS BED
"SHOULDER"OF ASB
FEDERAL CHANNEL
CURRENT FEDERALWATERWAY BOUNDARY
7
9
5B5A
6B
4
8
1B1A 1C 2C 3A3B
2B2A
5C
FUTURE ACCESSCHANNEL (NOTE 4)
CORNWALL AVELANDFILL SITE R.G. HALEY SITE
!
FORMER SOUTH STATE STREET MGP SITE(BOULEVARD PARK)
CENTRAL WATERFRONT SITE
!
I & J STREET WATERWAY SEDIMENT SITE
GP WEST SITE6C6A
LEGEND
#* Phase I Clam Tissue and Porewater Station"/ Juvenile Crab Tissue Station
!5 Adult Crab Tissue, Clam Tissue, Fish Tissue5, and Porewater Station!( Other Confirmation Monitoring Station (see Figure 7)
Juvenile Crab AreaTrawl LineRemedial Action Unit BoundariesSediment Site UnitMonitored Natural Recovery AreaPhase 1 Dredging or CappingPhase 2 Dredging or CappingExisting Dock or Wharf
Approximate Location of Separate MTCA Cleanup Site

!5
#*
#*
#*
!5
WW-REF-01
WW-REF-02
WW-REF-03
WW-REF-04
WW-REF-05
Figure 5Reference Area Sampling Locations
Compliance Monitoring Sampling and Quality Assurance Project PlanWhatcom Waterway Cleanup in Phase 1 Site Areas
Q:\J
obs\
0800
07-0
1_W
hatc
om_W
ater
way
\Map
s\20
14_1
1\Fi
g5_S
amis
h_B
ay_R
efer
ence
_Loc
s.m
xd e
pipk
in 9
/29/
2015
12:
05:0
9 P
M
0 0.5 1Miles
[NOTES:1. Site units are shown based on those in Figure 2-3 Cleanup Action Plan, Whatcom Waterway Site, September 2007. Unit 9boundary updated based on Pre-remedial Design Investigation findings.2. Horizontal datum: Washington State Plane North, North American Datum 1983 (NAD83) Feet.3. Vertical datum: Mean Lower Low Water (MLLW).4. Fish trawl locations are approximate. Actual locations will be dependent upon abundances observed during the monitoring effort.5. Crab station locations may be adjusted based on field conditions encountered.
"/WW-REF-06
Legend#* Clam Tissue and Porewater Station
!5 Adult Crab Tissue, Clam Tissue, and Porewater Station
"/ Juvenile Crab Tissue Station
Fish Trawl Station5
Reference Station Map 1
Reference Station Map 2
Reference Station Map 1 Reference Station Map 2
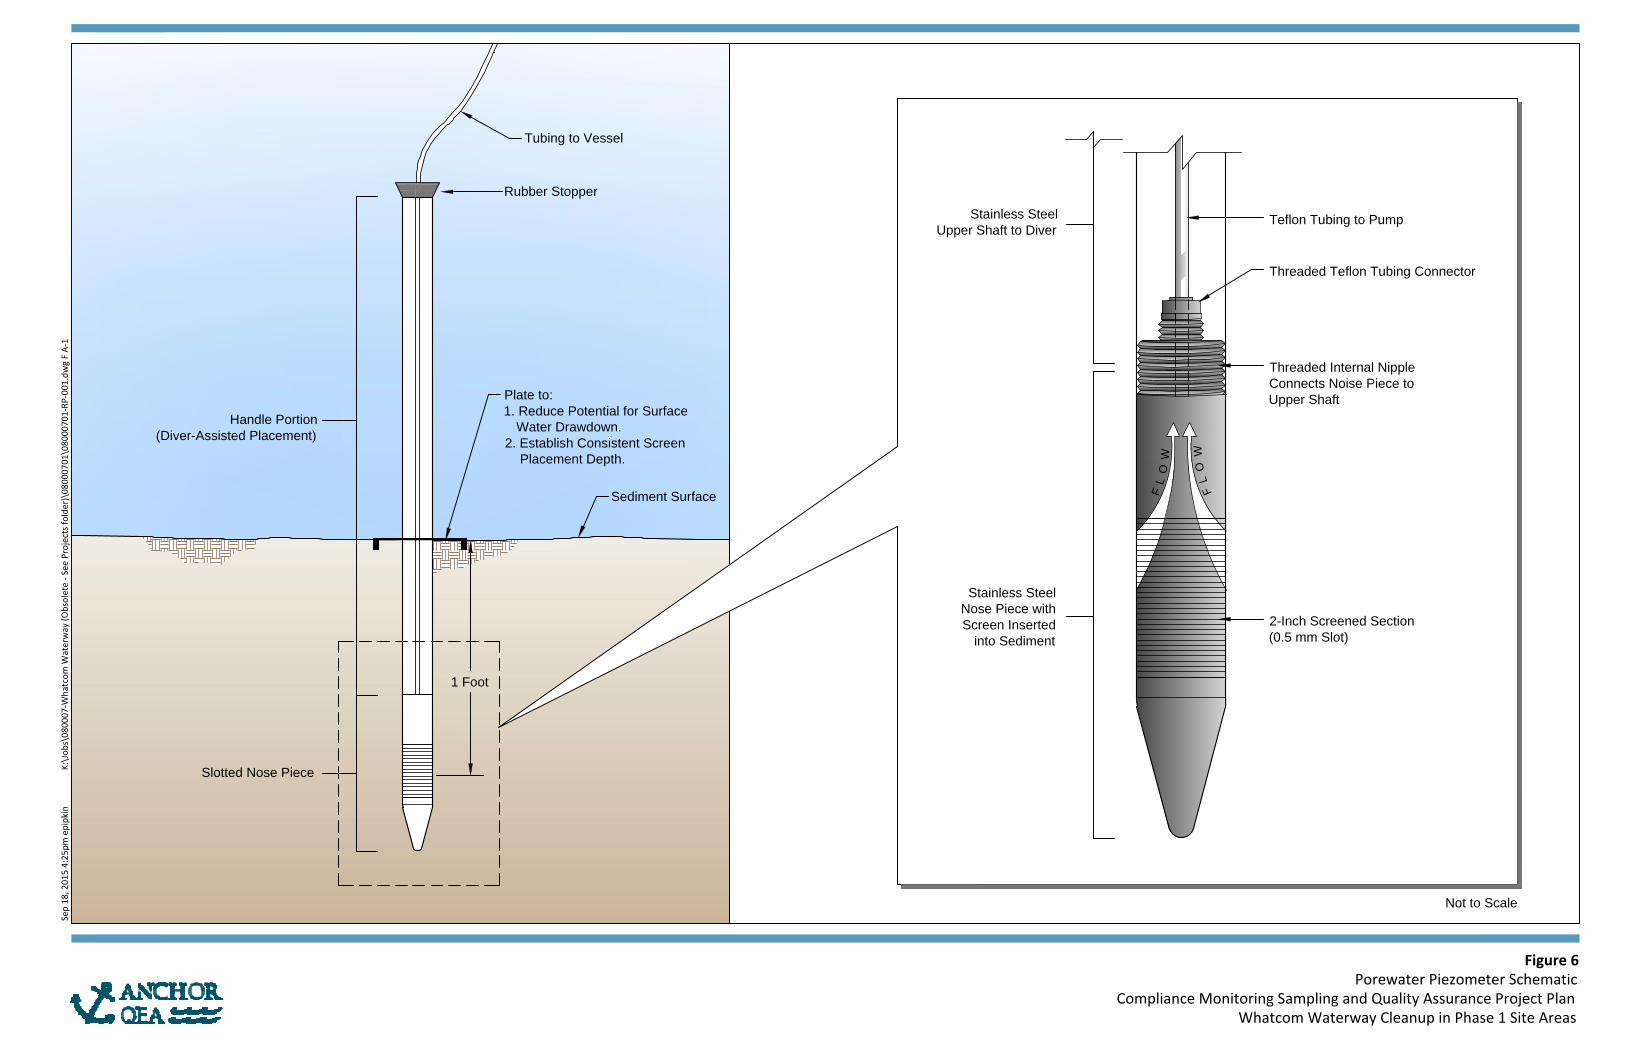
Stainless Steel
Nose Piece with
Screen Inserted
into Sediment
F
L
O
W
F
L
O
W
Stainless Steel
Upper Shaft to Diver
Threaded Internal Nipple
Connects Noise Piece to
Upper Shaft
Teflon Tubing to Pump
2-Inch Screened Section
(0.5 mm Slot)
Threaded Teflon Tubing Connector
Tubing to Vessel
Rubber Stopper
Slotted Nose Piece
Handle Portion
(Diver-Assisted Placement)
Sediment Surface
Plate to:
1. Reduce Potential for Surface
Water Drawdown.
2. Establish Consistent Screen
Placement Depth.
1 Foot
Not to Scale
Figure 6Porewater Piezometer Schematic
Compliance Monitoring Sampling and Quality Assurance Project PlanWhatcom Waterway Cleanup in Phase 1 Site Areas
Sep
18,
201
5 4:
25pm
epi
pkin
K
:\Jo
bs\0
8000
7-W
hatc
om W
ater
way
(Obs
olet
e - S
ee P
roje
cts f
olde
r)\0
8000
701\
0800
0701
-RP-
001.
dwg
F A-
1

5
!.
!.!.
5
5
5
!.
!.
5
7 7
#* #*
7
7
777
7
7
5
WW-MNR-06
WW-MNR-05WW-MNR-09
WW-MNR-03
WW-MNR-07
WW-MNR-11
WW-MNR-10
WW-MNR-02 WW-MNR-08
WW-MNR-04
WW-MNR-01
WW-P1CM-06
WW-P1CM-07WW-P1CM-11
WW-P1CM-08
WW-P1CM-09WW-P1CM-05
WW-P1CM-04
WW-P1CM-03
WW-P1CM-02
WW-P1CM-01
WW-P1CM-10
Chlor-Alkali Remedial Action Unit
Pulp/Tissue Mill Remedial Action Unit
Figure 7Confirmation (Long-Term) Monitoring Sampling Locations
Compliance Monitoring Sampling and Quality Assurance Project PlanWhatcom Waterway Cleanup in Phase 1 Site Areas
Q:\Jo
bs\08
0007
-01_W
hatco
m_Wa
terwa
y\Map
s\201
4_11
\Fig6
_SQA
PP_C
onfirm
_Lon
gterm
_Mon
itorin
g_Lo
cs.m
xd e
pipkin
9/18
/2015
4:36
:04 PM
0 300 600 900 1,200Feet
[
NOTES:1. Site units are shown based on those in Figure 2-3 Cleanup Action Plan, Whatcom Waterway Site, September 2007. Unit 9 boundaryupdated based on PRDI findings.2. Horizontal datum: Washington State Plane North, NAD 83 Feet.3. Vertical datum: Mean Lower Low Water (MLLW).4. Unit 2B was established in the Cleanup Action Plan based on the anticipated marina access channel location. This location will beadjusted during final design.5. Refer to Figure 4 for tissue monitoring and co-located porewater monitoring stations.6. Remedial Action Unit (RAU) boundaries were defined in the Final Cleanup Action Plan for the GP West Pulp and Tissue RemedialAction Unit (Aspect 2014).
OUTER WHATCOM WATERWAY INNER WHATCOM WATERWAY
AREAS OFFSHORE OF ASB
AERATED STABILIZATIONBASIN (ASB)
REMAINING AREAS OF THE SITE
LOG POND
STARR ROCK
BARGEDOCKAREA BELLINGHAM
SHIPPINGTERMINAL
I & J STREET WATERWAY
EEL GRASS BED
"SHOULDER"OF ASB
FEDERAL CHANNEL
CURRENT FEDERALWATERWAY BOUNDARY
7
9
5B5A
6B
4
8
1B1A 1C 2C 3A3B
2B2A
5C
FUTURE ACCESSCHANNEL (NOTE 4)
CORNWALL AVELANDFILL SITE R.G. HALEY SITE
!
FORMER SOUTH STATE STREET MGP SITE(BOULEVARD PARK)
CENTRAL WATERFRONT SITE
!
I & J STREET WATERWAY SEDIMENT SITE
GP WEST SITE6C6A
LEGEND
5 MNR Surface Sediment Station!. MNR Surface Sediment and Subsurface Sediment Station7 Phase 1 Surface Sediment Station#* Phase 1 Surface Sediment and Porewater Station
Sediment Site UnitRemedial Action Unit BoundariesMonitored Natural Recovery AreaPhase 1 Dredging or CappingPhase 2 Dredging or CappingExisting Dock or Wharf
Approximate Location of Separate MTCA Cleanup Site

APPENDIX A FIELD FORMS

Daily LogAnchor QEA, LLC720 Oive Way, Suite 1900Seattle, Washington 98101Phone 206.287.9130 Fax 206.287.9131
PROJECT NAME: DATE:SITE ADDRESS: PERSONNEL:
WEATHER: WIND FROM: N NE E SE S SW W NW LIGHT MEDIUM HEAVYSUNNY CLOUDY RAIN ? TEMPERATURE: ° F . ° C
[Circle appropriate units]
TIME COMMENTS
Signature:

Surface Sediment Field Log
Long:Water Height Tide MeasurementsDTM Depth Sounder: Time: 1) Overlying water is present
2) Water has low turbidity
DTM Lead Line: Height: 3) Sampler is not overfilled
4) Surface is flat
5) Desired penetration depth
Mudline Elevation (datum):Notes:
NAD 83 (N) NAD 83 (W)
Sample Description:
Grab Notes:
Sample containers:
Job: Station: Job No: Date:
surface cover, (density), moisture, color, minor modifier, MAJOR modifier, other constituents, odor, sheen, layering, anoxic layer, debris, plant matter, shells, biota
Contractor: Proposed Coordinates : Lat:
Sample Acceptability Criteria:
Grab # TimeConfirmed Coordinates
(datum)Sample
Accept (Y/N)Recovery Depth
(cm)Comments: jaws close, good seal, winnowing
Field Staff: Sample Method: Van Veen Grab

Sample Containers:
Analyses:
Number of crabs recovered:
Station Coordinates:Crab Log
Field Staff:
Crab ID Time Carapace Length (cm)
Whole Organism Weight (g)
Total Muscle Weight (g)
Job: Job No:
Date Notes
Station ID:Replicate:

Sample Containers:
Analyses:
Field Staff:
DateClam ID
Station Coordinates:Clam Log
Job: Job No:
Number of clam recovered alive: Station ID:Replicate:
Time NotesShell Length (cm)
Tissue Wet Weight (not including shell or water in
shell)

Project Number: Boring/Well No.: Client Name: Top of Casing Elev.: Project Name: Ground Surface Elev.: Location: Installation Date: Driller: Permit/Start Card No.:
Installed by:
Reviewed by:
Date:
WELL DETAILS FLUSH MOUNT
EXPLORATORY BORING A. Total depth: ft. B. Diameter in. Drilling method:
WELL CONSTRUCTION C. Well casing length: ft. Well casing material: D. Well casing diameter: in. E. Well screen length: ft. Well screen type: Well screen slot size: in. F. Well sump/end cap length: ft. G. Surface seal thickness: ft. H. Surface seal material: I. Annular seal thickness: ft. J. Annular seal material: K. Filter pack seal thickness: ft. L. Filter pack seal material: M. Sand pack thickness: ft. N. Sand pack material: O. Bottom material thickness: ft. P. Bottom material: Q. Vault box type: Well centralizer depths: ft.
NOTES:

PROJECT NAME: WELL ID:SITE ADDRESS: BLIND ID:
DUP ID: NAWIND FROM: N NE E SE S SW W NW LIGHT MEDIUM HEAVY
WEATHER: SUNNY CLOUDY RAIN ? TEMPERATURE: ° F . ° C [Circle appropriate units]
HYDROLOGY/LEVEL MEASUREMENTS (Nearest 0.01 ft) [Product Thickness] [Water Column] [Water Column x Gal/ft]
Date Time DT-Bottom DT-Product DT-Water DTP-DTW DTB-DTW Volume (gal)
/ / : . . . . . X 1 . / / : . . . . X 3 .Gal/ft = (dia./2)2 x 0.163 1" = 0.041 2" = 0.163 3" = 0.367 4" = 0.653 6" = 1.469 10" = 4.080 12" = 5.875
§ METHODS: (A) Submersible Pump (B) Peristaltic Pump (C) Disposable Bailer (D) PVC/Teflon Bailer (E) Dedicated Bailer (F) Dedicated Pump (G) Other =
GROUNDWATER SAMPLING DATA (if product is detected, do NOT sample) Sample Depth: [Ö if used]
Bottle Type Date Time Method § Amount & Volume mL Preservative [circle] Ice Filter pH Ö
VOA Glass / / : 3 40 ml HCl YES NO
Amber Glass / / : 250, 500, 1L (None) (HCl) (H2SO4) YES NO
White Poly / / : 250, 500, 1L None YES NO NA
Yellow Poly / / : 250, 500, 1L H2SO4 YES NO
Green Poly / / : 250, 500, 1L NaOH YES NO
Red Total Poly / / : 250, 500, 1L HNO3 YES NO
Red Diss. Poly / / : 250, 500, 1L HNO3 YES YES
/ / : 250, 500, 1L YES
Total Bottles (include duplicate count):
BOTTLE TYPE TYPICAL ANALYSIS ALLOWED PER BOTTLE TYPE (Circle applicable or write non-standard analysis below)
VOA - Glass (8021) (8260B) (BTEX) (NWTPH-G)
AMBER - Glass (PAH) (TPH-HCID) (NWTPH-Dx) (TPH-418.1) (Oil &Grease) (8081A)
WHITE - Poly (pH) (Conductivity) (TDS) (TSS) (BOD) (Turbidity) (Alkalinity) (HCO3/CO3) (Cl) (SO4) (NO3) (NO2) (F)
YELLOW - Poly (COD) (TOC) (Total PO4 ) (Total Keldahl Nitrogen) (NH3) (NO3/NO2)
GREEN - Poly (Cyanide)
RED TOTAL - Poly (As) (Sb) (Ba) (Be) (Ca) (Cd) (Co) (Cr) (Cu) (Fe) (Pb) (Mg) (Mn) (Ni) (Ag) (Se) (Tl) (V) (Zn) (Hg) (K) (Na)
RED DISSOLVED - Poly (As) (Sb) (Ba) (Be) (Ca) (Cd) (Co) (Cr) (Cu) (Fe) (Pb) (Mg) (Mn) (Ni) (Ag) (Se) (Tl) (V) (Zn) (Hg) (K) (Na) (Hardness) (Silica)
WATER QUALITY DATA Pump/Bailer Inlet Depth:
Meas. Method § Purged (gal) Sal (ppt) E Cond (mS) °F Temp °C pH Diss O2 (mg/l) Water Quality
4 . . . . .3 . . . . .2 . . . . .1 . . . . .0 0.00 . . . .
[Casing] [Select A-G] [Cumulative Totals] [Circle units] [Clarity, Color]
SAMPLER:(PRINTED NAME) (SIGNATURE)
Porewater Collection Form
Purge Start Time: :
Ana
lysi
s A
llow
edpe
r Bot
tle T
ype

Page __ of __
Job: Station ID:Job No: Attempt No.Field Staff: Date:Contractor: Logged By:Vertical Datum: Horizontal Datum:
Field Collection Coordinates:Lat/Northing: Long/Easting:
A. Water Depth B. Tide Measurements C. Mudline ElevationDTM Depth Sounder: Time: (-A+B=C)DTM Lead Line: Height:
Core Collection Recovery Details:Core Accepted: Yes / NoCore Tube Length:Drive Penetration:Headspace Measurement:Recovery Measurement:Recovery Percentage:Total Length of Core To Process:
Drive Notes:
Samples Collected (i.e. rinsate blank)
Core Field Observations and Description: Sediment type, moisture, color, minor modifier, MAJOR modifier, other constituents, odor, sheen, layering, anoxic layer, debris, plant matter, shells, biota
Sediment Core Collection Log
Cor
e Tu
be L
engt
h
Rec
over
y H
eads
pace

Sediment Core Processing Log COC ID #
Job: Date Logged:Job No.: Core Pushed By:
Core Logged By:Type of Core: Vibracore Piston Core Other
No. of Sections: Diameter of Core (inches):Water Depth/Elevation of Core: Core Quality: Good Fair Poor DisturbedCored Length (feet; from log): Average % Compaction =Core Recovery (feet): Internal Composite Received on:
Size
% F
Sum
mar
y Sk
etch Classification and Remarks
(Moisture content, density/consistency/ color, minor contituent, MAJOR constituent, amount, shape of minor constituent, sheen, odor)
Core Sections
Page 1 of ____
Station ID:
Theo
retic
al
Depth in
( ) Actu
al
Size
% G
Size
% S

Species:Total # of fish collected at station:
Sample Containers:
Analyses:
Station ID: Trawl start time:
Fish LogJob:Job No:
Trawl start coordinates:
Time NotesFish Length (cm) Whole fish wet weight (blotted, grams)
Field Staff:
Fish ID Date
Trawl end coordinates:
Trawl end time: