
Sampling and Analysis Plan and Quality Assurance Project ...

i
Quality Assurance Project Plan/ Sampling and Analysis Plan
Upper Uncompahgre River Site
Lake Como Surface Water Characterization
San Juan County Colorado
July 2016 – November, 2016
Prepared by:
Colorado Department of Reclamation, Mining and Safety
Grand Junction Field Office 101 South 3rd, Suite 301
Grand Junction, CO 81501
In Cooperation with:
U.S. Environmental Protection Agency - Region 8 Assessment and Revitalization Program
1595 Wynkoop Street Denver, CO 80202
June 2016
Rev. 01

iii
A.2 Table of Contents A.3 Distribution List ......................................................................................................vi A.4 Project/Task Organization .................................................................................... vii A.5 Problem Definition ................................................................................................. 1
A.5.1 Introduction ............................................................................................. 1 A.5.2 Background ............................................................................................. 1
A.6 Project/Task Description ....................................................................................... 2 A.7 Quality Objectives and Criteria .............................................................................. 3
A.7.1 Planning Team and Stakeholders ........................................................... 3 A.7.1.1 Table 1: DQO Planning Team ................................................................. 3 A.7.1.2 Decision Making Authority ....................................................................... 3 A.7.1.3 Stakeholders ........................................................................................... 3 A.7.2 Data Quality Objectives ........................................................................... 4 A.7.2.1 Step 1: State the Problem ....................................................................... 4 A.7.2.2 Step 2: Identify the Goals of the Study .................................................... 4 A.7.2.3 Step 3: Identify Information Inputs ........................................................... 5 A.7.2.4 Step 4: Define the Boundaries of the Study ............................................ 5 A.7.2.5 Step 5: Develop the Analytic Approach ................................................... 6 A.7.2.6 Step 6: Specify Performance or Acceptance Criteria .............................. 6 A.7.2.7 Step 7a: Develop a Plan to Collect the Data ........................................... 7 A.7.2.8 Step 7b: Sample Locations ..................................................................... 7 A.7.3 Criteria, Action Limits, and Laboratory Detection Limits .......................... 7 A.7.4 Precision, Accuracy, Representativeness, Completeness, Comparability,
and Sensitivity ......................................................................................... 8 A.8 Special Training/Certifications ............................................................................... 9 A.9 Documentation and Records ............................................................................... 9
B. DATA GENERATION AND ACQUISITION ........................................................... 10 B.1 Sampling Design ............................................................................................... 10
B.1.1 Surface Water Sampling ....................................................................... 11 B.2 Sampling Methods ............................................................................................ 12
B.2.1 Field Measurements .............................................................................. 13 B.2.2 Surface Water Sampling ....................................................................... 13 B.2.3 Sample Preservation and Shipping ....................................................... 14 B.2.4 Summary of Equipment and Support Facilities ..................................... 15
B.3 Sample Handling and Custody .......................................................................... 15 B.3.1 Sample Location Documentation .......................................................... 15 B.3.2 Field Logbook Documentation............................................................... 15 B.3.3 Sample Custody .................................................................................... 16
B.4 Analytical Methods ............................................................................................ 17 B.5 Quality Control .................................................................................................. 18 B.6 Instrument/Equipment Testing, Inspection, and Maintenance ........................... 19 B.7 Instrument/Equipment Calibration and Frequency ............................................ 19 B.8 Inspection/Acceptance for Supplies and Consumables .................................... 20 B.9 Use of Existing Data (Non-Direct Measurements) ............................................. 20 B.10 Data Management ............................................................................................. 20

iv
C. ASSESSMENT AND OVERSIGHT ........................................................................ 22 C.1 Assessment and Response Actions .................................................................. 22
C.1.1 Field Sampling Assessments ................................................................ 22 C.1.2 Laboratory Assessments ....................................................................... 23 C.1.3 Field Corrective Actions ........................................................................ 23
C.2 Reports to Management .................................................................................... 24 D. DATA VALIDATION AND USABILITY .................................................................. 24
D.1 Data Review, Verification, and Validation ......................................................... 24 D.2 Verification and Calibration Methods ................................................................. 24 D.3 Reconciliation with User Requirements ............................................................. 25 D.4 Reconciliation with DQOs.................................................................................. 25
E. REFERENCES....................................................................................................... 27
LIST OF TABLES Table 1. DQO Planning Team Table 2. Upper Uncompahgre River Site – Water Quality Characteristics for
Select Adits (2008) Table 3. 2016 Sample Locations and Descriptions-July and September Table 4. 2016 QC Sample Summary, Preparation, Preservative and Holding Time
Requirements Table 5. Dissolved Metals - Target Analyte List and Minimum Reporting Limits Table 6. Total Metals - Target Analyte List and Minimum Reporting Limits Table 7 Alkalinity and Anions – Target Analyte List and Minimum Reporting Limits Table 8 Laboratory Analytical Instrumentation and Methods QC Criteria Table 9 QA/QC Calculation Algorithms
FIGURES Figure 1: Upper Uncompahgre River/Lake Como – Area Overview Figure 2: Upper Uncompahgre River/Lake Como – 2014 Results Figure 3: Upper Uncompahgre River/Lake Como – 2016 Sample Locations
ATTACHMENT
Attachment A. EPA Region 8 QA Crosswalk Attachment B. EPA Standard Operating Procedures (available upon request) Attachment C. 2016 Analytical Services Request-Upper Uncompahgre River/Lake Como

v
List of Abbreviations and Acronyms AGS American Geological Services, Inc. AWQC Ambient Water Quality Criteria CDPHE Colorado Department of Public Health and Environment CERCLA Comprehensive Environmental Response, Compensation and
Liability Act CFCs Chlorofluorocarbons CGS Colorado Geological Survey CLP Contract Laboratory Program DQO Data quality objective DRMS Colorado Division of Reclamation Mining and Safety EDD Electronic Data Delivery Report EPA United States Environmental Protection Agency ESAT Environmental Services Assistance Team HASP Health and Safety Plan IDW Investigation Derived Waste LCS Laboratory control sample MDL Method detection limit MS Matrix spike MSD Matrix spike duplicate OSHA Occupational Safety and Health Administration QA/QC Quality assurance/quality control QAPP Quality Assurance Project Plan RL Reporting Limit RPD Relative percent difference SAP Sampling and Analysis Plan SOP Standard operating procedures SSO Site Safety Officer TAL Target Analyte List TVS Table Value Standard USFS United States Forest Service USFWS United States Fish and Wildlife Service USGS UWP
United States Geological Survey Uncompahgre Watershed Partnership

vi
A.3 Distribution List
The following is a distribution list of personnel who will receive an electronic copy of the Quality Assurance Project Plan/Sampling and Analysis Plan (QAPP/SAP for the sampling events scheduled for 2016 at the Upper Uncompahgre River Site. The QAPP/SAP with original signatures will be placed in the EPA Records Center. Agency and/or contractor affiliations are also listed for each individual: Victor Ketellapper USEPA [email protected] Dan Wall USEPA [email protected] William Schroeder USEPA [email protected] Don Goodrich USEPA [email protected] Jean Wyatt USEPA [email protected] Brent Lewis BLM [email protected] Lisa Richardson BLM [email protected] Linda Lanham USFS [email protected] Robyn Blackburn USFWS [email protected] Jeff Litteral DRMS [email protected] Mark Rudolph CDPHE [email protected] Skip Feeney CDPHE [email protected] Agnieszka Przeszlowska UWP [email protected]

vii
A.4 Project/Task Organization The following is a list of involved project personnel, respective agency/contract affiliation, and general responsibilities. Managers Organization Responsibilities Victor Ketellapper USEPA Project oversight/project
management/ Document Control Brent Lewis BLM Project oversight/project management Dan Wall USEPA ESAT Contract Manager Nikki MacDonald ESAT/TechLaw Lab QA management and document
review Jeff Litteral DRMS Project Manager, QAPP/SAP
development/field implementation Jean Wyatt USEPA Delegated QA Authorized/QA Review Field Team Organization Responsibilities Jeff Litteral DRMS Field Lead, sample collection, field
documentation Victor Ketellapper USEPA Sample collection, field documentation Bill Schroeder USEPA Sample collection, field documentation Lisa Richardson BLM Sample collection, field documentation Agnieszka Przeszlowska
UWP Sample collection, field documentation
Robyn Blackburn USFWS Field Coordination, sample collection, field documentation, reporting
ESAT Contract Field Personnel
ESAT/TechLaw, Inc
Field assistance, field and sample equipment preparation, sample collection/management, field documentation, sample maintenance and transport, and reporting
Laboratory Team Organization Responsibilities Don Goodrich USEPA ESAT Contract – Lab Coordination Scott Walker ESAT/TechLaw Sample analysis, analytical report
preparation, report review, laboratory QA officer

viii
Project Organization and Responsibilities Field Managers/Field Coordination
The sampling events addressed in this QAPP/SAP will be conducted by the, Colorado Department of Reclamation, Mining and Safety (DRMS), US Bureau of Land Management (BLM) and US Environmental Protection Agency Region 8, in collaboration with the State of Colorado. The DRMS and EPA Project Managers are responsible for study design, planning, and have collaborated on components of the study, project scope, reporting, and budget. Changes to the field plan will be addressed jointly by the DRMS and EPA Project Managers. Field work will be conducted by representative staff from multi-agencies, including the BLM, USEPA, DRMS, US Fish and Wildlife Service (USFWS), Uncompahgre Watershed Partnership (UWP) and field support will provided by the Region 8 EPA Environmental Services Assistance Team (ESAT) Contractor. The field manager or designated representatives and field staff are responsible for following the Quality Assurance/Quality Control (QA/QC) procedures outlined in the QAPP/SAP. EPA and DRMS or their assigned designees will provide assessment and oversight of field sampling activities and implementation of the QAPP/SAP will include oversight of field sampling activities and sample handling and chain of custody procedures. If minor problems are identified they will be addressed on site prior to resuming work. If more significant problems are identified then work will be suspended until the Project Manager or designee can resolve the problem. The EPA, BLM, and DRMS Project Managers are: EPA Site Assessment Manager BLM Project Manager Victor Ketellapper Brent Lewis U.S. EPA Region 8 BLM Colorado State Office 1595 Wynkoop Street 2850 Youngfield Street Denver, Colorado 80202-1129 Lakewood, CO 80215 (303) 312-6578 (303) 239-3711 DRMS Project Manager Jeff Litteral P.O. Box 2058 160 Amelia St. Bsmt Unit 2 Ridgway, CO 81432 (970)216-1330
ix
Analytical Laboratories Analytical work is provided to the USEPA via agreements between Region 8 USEPA ESAT Contract Laboratory and the EPA Contract Laboratory Program. The Contract Laboratory Program (CLP) is administered by the Office of Superfund Remediation and Technology Innovation Analytical Services Branch, Regional CLP Project Officers (CLP POs), and Regional Sample Control Center Coordinators. Each of these facilities has laboratory-specific Quality Assurance Management Plans. The designated project manager from each laboratory is responsible for assuring that all analyses performed by their respective facility meet study and data quality objectives. These are outlined in: 1) this QAPP or the associated analytical methods, 2) laboratory SOPs, and 3) the facility’s internal QA plans. The analytical facility and project manager are: EPA Region 8 ESAT Contractor – ESAT Laboratory Mark McDaniel EPA Region 8 ESAT Contract 16194 W. 45th Drive Golden, CO 80403 Phone: (303) 312-7708 EPA Contract Laboratory Program – Region 8 Project Officer Don Goodrich U.S. EPA Region 8, EPR-PS 1595 Wynkoop Street Denver, Colorado 80202-1129 (303) 312-6687
x
Quality Assurance
The USEPA and DRMS Project Managers are responsible for the preparation of this QAPP/SAP. It is the responsibility of the Project Managers to implement the field QA/QC requirements of this document for the study being conducted. The final copy of the approved QAPP/SAP will be filed in the EPA Document Control/Records System. The Project Managers will work closely with the field team members to ensure that study activities are consistent with data quality objectives. The EPA Laboratory Contract Manager will be responsible for overseeing analytical procedures for samples submitted to the EPA ESAT or CLP laboratories, coordinating with analytical laboratory personnel, and overseeing analytical work to ensure that it meets the QA/QC requirements of this document. In addition, the DRMS and the EPA QA Manager will coordinate to ensure that overall project and data quality objectives are met. The designated EPA QA Manager and DRMS QA Manager are: EPA Site Assessment Manager Jean Wyatt USEPA, Region 8 1595 Wynkoop Street, Denver, CO 80202 (303) 312-6578 BLM Abandoned Mines Coordinator Brent Lewis BLM Colorado State Office 2850 Youngfield Street Lakewood, CO 80215 (303) 239-3711
xi
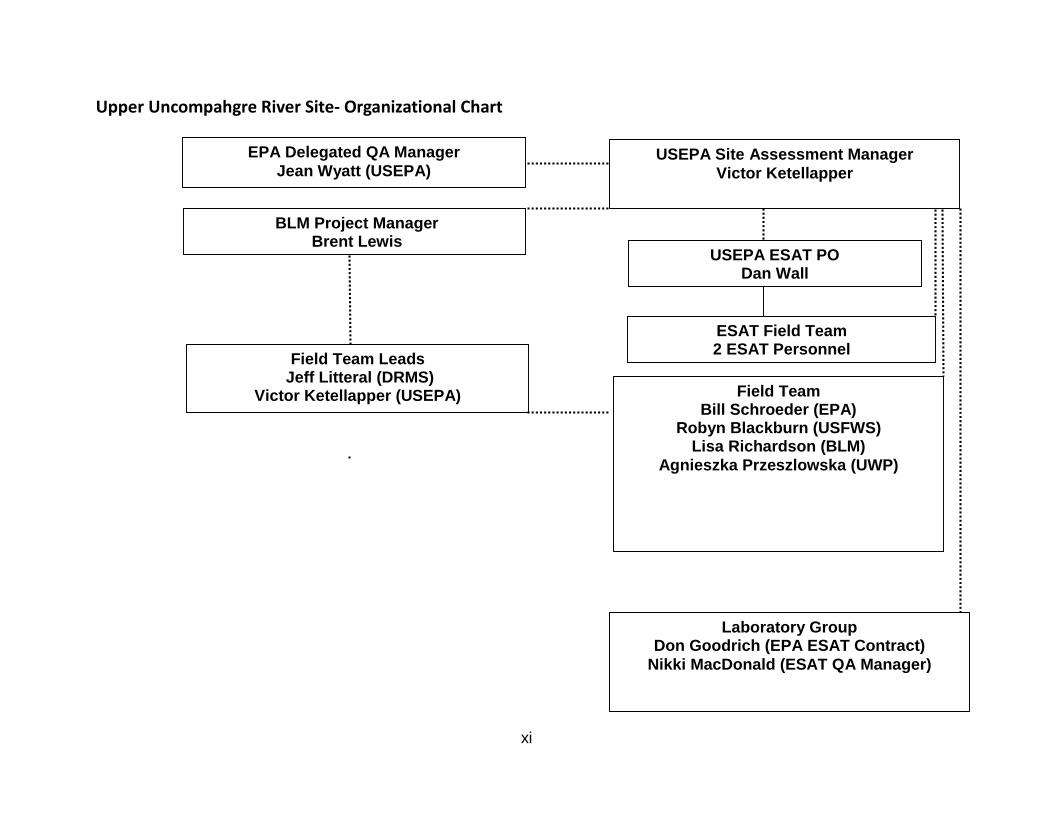
Upper Uncompahgre River Site- Organizational Chart
Field Team Bill Schroeder (EPA)
Robyn Blackburn (USFWS) Lisa Richardson (BLM)
Agnieszka Przeszlowska (UWP)
Field Team Leads Jeff Litteral (DRMS)
Victor Ketellapper (USEPA)
BLM Project Manager Brent Lewis
USEPA Site Assessment Manager Victor Ketellapper
EPA Delegated QA Manager Jean Wyatt (USEPA)
Laboratory Group Don Goodrich (EPA ESAT Contract)
Nikki MacDonald (ESAT QA Manager)
ESAT Field Team 2 ESAT Personnel
USEPA ESAT PO Dan Wall

1
A.5 Problem Definition A.5.1 Introduction This QAPP/SAP, Upper Uncompahgre River Site, Lake Como Surface Water Characterization is focused on identifying sources of elevated zinc levels found in the Lake Como area of the Upper Uncompahgre River. The Lake Como area is the headwaters of the Upper Uncompahgre River site. The Lake Como portion of the site is located above 11,500 feet and includes both private and BLM managed federal lands. Sampling conducted by the Colorado Division of Reclamation and Mine Safety (DRMS) in 2014 and 2015 found zinc concentrations in the surface water greater than 1,000 ug/l, which exceeds Table Value Standards (TVS) for aquatic life. The primary purpose of this surface water investigation is to sample several mine sites in close proximity of Lake Como to identify the primary sources of the zinc loading. This information will be used to determine the need, extent, and priority for cleanups in this portion of the watershed. A.5.2 Background Metals loading into the Upper Uncompahgre River San Juan County, Colorado has been investigated over the past 2 years by DRMS (Figure 2). Results of these studies have found elevated levels of zinc entering and discharging from Lake Como. Representative metals loading from historical investigations have indicated the following results:
Table 2: Historical Surface Water Results – 2008 Upper Uncompahgre River/Lake Como Area
Total Concentration
Lake Como West Inlet
Lake Como Effluent
Load Value
Aluminum (ug/L) 3800 1300 Aluminum (lbs/day) 13.19 Copper (ug/L) 41 47 Copper (lbs/day) 0.5 Iron (ug/L) 8 20 Iron (lbs/day) 0.21 Lead (ug/L) 3.2 5.2 Lead (lbs/day) 0.06 Zinc (ug/L) 2900 1000 Zinc (lbs/day) 10.69 Manganese (ug/L) 4200 1700 Manganese (lbs/day) 18.18 Cadmium (ug/L) 33 9.4 Cadmium (lbs/day) 0.1

2
A.6 Project/Task Description The overall objective for this project is to assess water quality as it relates to mine workings and mine discharges of heavy metals and impacts to the headwaters of the Upper Uncompahgre River (Figure 1). While acid rock drainage has altered the water chemistry in tributaries within downstream portions of this watershed, evaluating in the background conditions and mining related sources in the headwaters is necessary to determine if mine reclamation is warranted. Samples collected as part of this QAPP/SAP will be used to support decisions being considered jointly by the DRMS, BLM and EPA. The water quality data being collected in order to establish conditions related to the relative seasonal (high flow/low flow) significance of different sources on water quality, and potential adverse effects on aquatic communities. This sampling event will include collection of water quality samples to be used to assess physicochemical field parameters (pH, temperature, specific conductance, and dissolved oxygen) and heavy metals concentrations related to: 1) high and low flow discharges associated with the Lake Como area of the Upper Uncompahgre River., Adit water and surface water associated with several abandoned mine areas in the Upper Uncompahgre/Lake Como area will be collected and submitted for laboratory analysis of total and dissolved metals, alkalinity, and select anions. Field parameters will be collected with hand-held multi-probe water quality meters will be collected at each location. Conditions permitting, stream and adit flow measurements will be collected during both the high and low flow sampling events in July and September. Adit discharge and stream flow measurements will be collected in areas which are thought to contribute to degraded water quality in the watershed. Schedule: The high flow sampling event will take place on or about July 26-27, 2016, and low flow sampling event will be conducted on or about September 21-22, 2016 (subject to change depending on weather and other conditions at the site).

3
A.7 Quality Objectives and Criteria A.7.1 Planning Team and Stakeholders The following section lists the members of the Data Quality Objectives (DQO) planning team, primary decision makers, and parties who may be impacted by the results of this study or who may use the data generated as a result of the DQO process. The following table includes the DQO planning team members, respective organizations, and affiliation with that organization. In addition, the table below lists the impacted organizations/stakeholders, the individuals representing those organizations, and their area of technical expertise. A.7.1.1 Table 1: DQO Planning Team Name Organization Area of Expertise Jeff Litteral DRMS Abandoned Mine
Assessment/Clean-up Victor Ketellapper USEPA – Region 8 Site Assessment Manager Lisa Richardson BLM Abandoned Mine
Assessment/Clean up Robyn Blackburn USFWS Liaison to
USEPA Ecological Risk Assessment/Site Characterization/Data Collection
A.7.1.2 Decision Making Authority The decision-makers have the ultimate authority for making final decisions based on the recommendations of the DQO planning team. The overall decision-makers for this project are Jeff Litteral, DRMS Inactive Mines Reclamation Program, Project Manager, and Victor Ketellapper, EPA Site Assessment Manager. A.7.1.3 Stakeholders Stakeholders are parties who may be affected by the results of the study and/or persons who may later use the data resulting from this DQO process. The table below lists the impacted organizations/stakeholders and the individuals representing those organizations or the concerns of stakeholders.
Stakeholders Organization Representative BLM Brent Lewis/Lisa Richardson DRMS Jeff Litteral Uncompahgre Watershed Partnership Agnieszka Przeszlowska

4
A.7.2 Data Quality Objectives The DQO process specifies project decisions, the data quality required to support those decisions, specific data types needed, data collection requirements, and analytical techniques necessary to generate the specified data quality. The process also ensures that resources required to generate the data are justified. The DQO process consists of seven steps. The output from each step influences the choices to be made later in the process. These steps are as follows: Step 1: State the problem Step 2: Identify the goal of the study Step 3: Identify information inputs Step 4: Define the boundaries of the study Step 5: Develop the analytic approach Step 6: Specify performance or acceptance criteria Step 7: Develop the plan for obtaining data The first six steps of the process consist of developing decision performance criteria that will be used to develop the data collection design. The final step of the process involves developing the data collection design based on the DQOs. The following sections briefly discuss these steps and their application to the project. A.7.2.1 Step 1: State the Problem The overall objectives for this project are to analyze regional hydrogeology as it relates to background conditions, mine workings, and flowing mine adits that discharge significant heavy metal loads and metals concentrations into the Lake Como area headwaters of the Uncompahgre River. A.7.2.2 Step 2: Identify the Goals of the Study The purpose of this step is to identify the principle study questions that this investigation is intended to address, along with alternative actions that may arise based on the answers to these questions. The Principle Study Questions (PQS) and alternative actions (AA) derived from the problem statement above are as follows: Q1: Are abandoned mine features in the Lake Como Area of the Upper Uncompahgre River Site a significant source of metals contamination. Q2: Are contaminant concentrations in the Upper Uncompahgre River/Lake Como Area elevated enough to result in human health risks or adverse health impacts on aquatic biota? AA1: Based on the results of Q1, if the answer to Q2 is positive take steps to reduce exposure or toxicity and contaminant loads entering receiving water bodies. AA2: Based on the results of Q1, if the answer to Q2 is negative (or the data are inconclusive) collect additional data to further evaluate spatial and temporal trends in water quality. AA3: Based on the results of Q1, if the answer to Q2 is negative, take no further action.

5
Decision statements combine the PSQs to arrive at one or more decisions that express the choices to be made among AAs. The Decision Statement (DS) for this investigation is as follows: DS: Determine whether abandoned mines within the Lake Como Area of the Upper Uncompahgre River Site are a significant source of metals loading; and determine if these sources are likely to result in impacts to human or aquatic health. A.7.2.3 Step 3: Identify Information Inputs The purpose of this step is to identify the data required to answer the PSQs listed above and to determine which inputs require environmental measurements. Required data to answer the PSQs as follows:
• Historical and current analytical results for metals in surface water and adit water, as well as calculated hardness values, alkalinity and selected anions,
• Historical and current field chemistry data (pH, conductivity, temperature, dissolved oxygen),
• Historical and current stream flow data Tables 3 and 4 summarize the data collection activities, analytes being collected, analytical methods, sample volumes, detection and reporting limits, and holding times. Tables 6-8 provide a comparison of method detection limits with corresponding benchmarks for each media to ensure Data Quality Objectives can be met. A.7.2.4 Step 4: Define the Boundaries of the Study This objective of this step is to clarify the site characteristics that the environmental measurements are intended to represent. The spatial conditions associated with the releases at the site that define locations that should be sampled, and the temporal aspects that will govern the timeframe that samples should be collected. Spatial: The spatial boundaries identified for this investigation includes historic mining features located in the Lake Como Area of the Upper Uncompahgre River Site. Sampling will occur within the Uncompahgre river watershed above the BLM/Forest service boundary. Temporal: Concentrations in surface water vary depending on the flow and water level associated with spring snowmelt/run-off and levels in the Uncompahgre River. Metals concentrations in water bodies may be diluted during high flow or flooding conditions. In order to capture conditions that represent both high flow and the undiluted or low flow, samples be collected during July and September 2016. The timing of the sampling may be re-scheduled if weather or other access conditions suggest that the sampling is not safe.

6
A.7.2.5 Step 5: Develop the Analytic Approach This step DQO Process involves developing an analytical approach that will guide how data from the investigation results will be analyzed and used to draw conclusions from the data. For decision making purposes, results from this investigation will be evaluated against the following risk-based benchmarks and aquatic water quality standards:
• Detected concentrations of metals in water will be compared to upstream (unimpacted) and historical concentrations
• Colorado water quality standards –TVS for aquatic life, both chronic and acute effect levels.
• Species-specific toxicity benchmarks • Relevant human health and eco-toxicological benchmarks and standards
A.7.2.6 Step 6: Specify Performance or Acceptance Criteria The purpose of this step is to specify the tolerable limits on decision errors, which are used to establish performance goals for the data collection design; and discuss how decision errors will be addressed. Performance criteria for the project are set in order to minimize the possibility of either making erroneous conclusions or failing to keep uncertainty in estimates to within acceptable levels. For this project, the number of samples and sampling locations are selected based on judgmental strategies and logistical constraints that consider spatial coverage, source location, habitat, and upstream reference areas that are considered to be unimpacted by Site related contamination. Sample collection methods will follow established standard operating procedures (SOPs) and quality assurance (QA) procedures to minimize the potential for false positive and/or false negative errors associated with field sampling. This effort includes consistency in the way data are collected in the field and laboratory; collecting duplicate samples (and subsequent analysis using relative percent difference [RPD] statistics), implementing a decontamination procedure (which includes using disposable sampling equipment), and using field blanks. Duplicate samples will be collected to determine sampling precision and the correlation between samples. According to the USEPA Contract Laboratory Program (CLP) National Functional Guidelines for Inorganic Data Review (USEPA 2004), a control limit of 20% for water for the RPD which shall be used for original and duplicate sample values that are ≥ 5 times the Contract Required Quantitation Limit. These requirements are laboratory guidelines which may not apply to all field situations. RPD values will be calculated using the following equation: RPD = 100*│Sample Result – Duplicate Result│/0.5 * (Sample Result + Duplicate Result) For laboratory analysis of samples, quality assurance/quality control (QA/QC) steps (such as using laboratory controls, matrix spikes/matrix spike duplicates [MS/MSD], blanks, etc.) will be consistent with EPA CLP Region 8 requirements.

7
Step 7. Sample Plan and Design A.7.2.7 Step 7a: Develop a Plan to Collect the Data A judgmental sampling design as described in Guidance for Choosing a Sampling Design for Environmental Data Collection, December 2002 (EPA QA/G-5S) will be used to assist with identification and verification of the presence of contamination at the site. Sample locations were either identified from the historical sample locations and will also be determined in the field based on observations of habitat and contamination migration pathway assessment. Data collected from this event will assist with identifying whether site conditions or historical analytical concentrations have changed since the last sampling event and whether potential for risk at the site or in adjacent media are of concern to local receptors. Specific media, analytes, and criteria are discussed in Section A.7.and are summarized in Tables 5-8. Analytical methods for the events are described in Section B.4 and management of the data is presented in Section B.10 of this document. A.7.2.8 Step 7b: Sample Locations Up to 14 mine adit and surface water samples are proposed to be collected during this event (Figure 3). The sample locations are based on several considerations:
• The need to obtain current ambient water quality conditions and identify potential impacts to receiving water bodies capable of supporting fish.
• The need to assess the extent of contamination derived from various abandoned mine site features located in the upper watershed.
• The need for data to that will support the future evaluation of clean-up options in the watershed.
• Historical knowledge of the physical and biological characteristics of the Upper Uncompahgre watershed based on previous investigations.
A summary of sampling scheduled for this field event are listed in Table 3. All sample locations will be recorded using Trimble GPS handheld devices. A detailed description of each sample location will be recorded in the field notebook for each site sampled. Information will consist of sample location identification number, date, time, access information, geographical observations, and other pertinent information that will be useful in identifying the sampling location in the future. In addition, a detailed description and photographic documentation of the habitat or surrounding conditions will be completed at each site. A.7.3 Criteria, Action Limits, and Laboratory Detection Limits Tables 5-8 provide the method detection limits (MDLs), practical quantitation limits (PQLs), and the corresponding benchmarks. In every case, the MDLs and PQLs for chemicals of interest

8
at this site are below the available screening benchmarks, indicating that the analytical methods will be able to measure contaminant levels in the water samples with the required sensitivity. A.7.4 Precision, Accuracy, Representativeness, Completeness, Comparability, and
Sensitivity The documentation of the data evaluation effort will be in the form of the work sheets prepared during validation. These worksheets will be an appendix to the Data Summary Report (DSR). The DSR will be prepared to identify problems that may affect data usability or require that the data be qualified. The DSR report will discuss all Precision, Accuracy, Representativeness, Completeness, Comparability, and Sensitivity (PARCCS) parameter results from the data validation and overall usability of the data for project objectives, include the following: •Bias – a systematic or persistent distortion of a measurement process that causes errors in one direction. The extent of bias will be determined by evaluating the laboratory initial calibration/continuing calibration verification, laboratory control spike/laboratory control spike duplicates, blank spikes, MS/MSD, and method blanks. •Sensitivity – the ability of a method or instrument to discriminate between small differences in analyte concentration, and generally discussed as detection limits. The detection limits of the field and laboratory methods are within the range of previous detections found at the site. •Precision – the measure of agreement among repeated measurements of the same property under identical, or substantially similar, conditions and which is expressed as the RPD between the sample pairs. An acceptable RPD for water samples is 20% (EPA, 2010). •Representativeness – the measure of the degree to which data accurately and precisely represent a characteristic of a population parameter, variations at a sampling point, a process condition, or an environmental condition. •Completeness – a measure of the amount of valid data obtained from a measurement system. The actual percentage of completeness is less important than the effect of completeness on the dataset. Completeness will be assessed by comparing the total number of samples collected to the number of samples in the SAP/QAPP. •Comparability – the qualitative term that expresses the confidence that two datasets can contribute to common interpretation and analysis; comparability is used to describe how well samples within a dataset, as well as two independent data sets, are interchangeable. Uncertainty of validated data will be evaluated by the PM or their designee to determine if the DQOs were met. In the event that the DQOs were not met, they will be reviewed to determine if they are achievable and may be revised if necessary, and the data may be further evaluated to determine the impact to the project. Data usability and limitations will be evaluated by the PM with input from technical staff.

9
A.8 Special Training/Certifications Members of the Multi-Agency Project Team field staff have completed the Occupational Safety and Health Administration (OSHA) 40-hour or 24 hour Health and Safety Course for Hazardous Waste Site Worker Training in accordance with Sections e and p of OSHA 29 Code of Federal Register (CFR) 1910.120 and maintain this certification with annual eight-hour Hazardous Waste Site Operations Refresher Training as required by Sections e and q of OSHA 29 CFR 1910.120. Representative members of the field staff have completed American Red Cross Standard First Aid and Adult CPR Training and maintain this certification annually for Adult CPR and every two years for Standard First Aid. The BLM/EPA and DRMS Project Managers are responsible for maintaining training records and ensuring that federal employee field staff members have completed training requirements as required by OSHA (or other governing agency as required). Field personnel (as applicable) are required to have training appropriate to their sampling tasks, including the following:
• Site-specific health and safety training (based on the Health and Safety Plan) • Operation and maintenance of field chemistry meters • Standard Operating Procedures for performing mine discharge and surface water
sampling • Operation of handheld Trimble Global Positioning Systems (GPS) units • Chain of Custody procedures
The designated Site Safety Officer (SSO) will have had the required OSHA 40-hour health, safety and emergency response training, and the annual 8-hour refresher course, as applicable. All on-site supervisory personnel will have had 8 hours of site supervisory experience. A.9 Documentation and Records The Final SAP/QAPP will be sent electronically to the individuals at email addresses identified in Section A.3. Field sampling documentation and record keeping requirements will be completed as outlined in Section B.3.2 and in accordance with EPA SOPs SOP 16-DAT-01.00 (EPA 2014) and SOP FLD-12.00 (EPA 2012). . Sample locations will be documented in the field with GPS, recorded in field logbooks with a brief description of site name and other required information. Field data sheets and records will include detailed location-specific field documentation, as well as habitat descriptions and photographs of each sample location and will be collected at the time of data collection. The field data recorded on sheets or notebooks will be scanned and stored electronically and presented in a trip report to be provided to the EPA PM and BLM, and maintained in project files in accordance with EPA ESAT Contractor requirements. At the conclusion of the project, all paper/hard copy files including: field notebooks, chain-of-custody forms, and other forms used for the field event, work plans, and data reports, will be provided to the EPA Project Manager and filed in the EPA Records Center. A copy of the documentation will also be stored in accordance with EPA ESAT Contractor requirements.

10
The EPA ESAT Contractor (or other CLP laboratory as designated) will submit to EPA an Electronic Data Delivery (EDD) report containing all the analytical results for this sampling effort. The report will contain a case narrative that briefly describes the number of samples, analyses, and any analytical difficulties or QA/QC issues associated with the samples. The data report will also include signed chain-of-custody forms, analytical data, a QA/QC package, and raw data. Additional reporting requirements are outlined in the EPA ESAT and CLP laboratory contract and Quality Management Plan. The documentation of the data evaluation efforts will be in the form of the work sheets prepared during validation. These worksheets will be provided by the ESAT or CLP Laboratory as an appendix in the post sampling trip report to be prepared by the EPA ESAT Contractor after completion of the field event. The EDD will identify problems that may affect data usability or require that the data be qualified. The EDD will discuss all precision, accuracy, representativeness, completeness, comparability, and sensitivity parameter results from the data validation and overall usability of the data for project objectives. Peer review of the data package, at a 100% frequency of reported versus raw data, will be performed by the analytical laboratory. The final report of the abbreviated data validation will be in a standard CLP format, including all laboratory and instrument QC results. B. DATA GENERATION AND ACQUISITION This section describes data generation and acquisition activities associated with these events, including process design, sampling and analytical methods, sample handling and custody, QC, equipment, and data use and management. B.1 Sampling Design Sampling covered under this SAP is designed to identify and characterize adit discharges into Upper Uncompahgre River/Lake Como. These events are intended to characterize water quality during high and low flow periods of the annual hydrograph. All results will be used in order to: 1) assess whether metals loading from mine features are at levels of concern and potentially effecting for aquatic life, and 2) establish baseline prior to any clean up actions associated with mine wastes and draining adits. The 2016 Upper Uncompahgre River/Lake Como Site sample locations and descriptions are listed in Table 3. Sample identification and analyte collection requirements, including QA/QC samples, are described in Tables 4 through 5, and locations are shown on Figure 3. The following types of data will be collected during this sampling event:
• Field water quality measurements – pH, conductivity, dissolved oxygen, temperature • Global Positioning Satellite (GPS) locations – new and non-historical sample sites • Stream flows (depending on site safety during high flow) – using FlowTracker (or
Marsh-McBirney) flow meters and flumes, as determined by the type of flow • Surface water from Upper Uncompahgre/Lake Como and water from seeps and adit
discharges – to be analyzed for dissolved metals, total recoverable metals, anions, and alkalinity.
11
B.1.1 Surface Water Sampling Two types of surface water sampling will be conducted for this effort: 1) field measurements including flow, pH, DO, temperature, and specific conductance, and 2) surface water sampling to be submitted for laboratory analyses of total and dissolved metals, alkalinity, and selected anions. Surface water sampling will progress from downstream to upstream to eliminate sediment disturbance in subsequent samples. Surface water samples will be collected by immersing sample bottle several inches beneath the water surface with the mouth of the sample bottle facing upstream. A separate surface sample may be collected if immiscible fluids are ever observed. To collect such a sample, the sample container will be inverted, lowered to the approximate sample depth and held at approximately a 45-degree angle with the mouth of the bottle facing downstream. In the event a sample cannot be directly collected in the sample bottle, water will be suctioned out of the shallow water using a syringe and dedicated tubing. The syringe will be carefully inserted into the shallow water care will be taken to avoid disturbing the sediment while obtaining the sample. Water samples to be submitted for metals analyses will be preserved at a pH of 2 with nitric acid. In-field measurements of pH, conductivity, temperature, and flow will be made at locations as outlined on Table 3. All samples will be maintained on ice and during transport to the ESAT Laboratory at EPA Region 8 laboratory in Golden, Colorado. Measures have been taken to minimize the amount of in-field equipment decontamination required for the sampling events. All bottles and containers will be factory sealed and certified clean prior to the sample events. Equipment such as filters and syringes, bottles, etc. will not be reused, and no decontamination will be required in the field, with the exception of field meter probes. Nature of Data Collected As indicated in Section A.6, a variety of data will be collected during the 2016 fall and spring field sampling events, some of which are critical to achieve the established DQOs and project objectives, and some of which are primarily for informational purposes or which will be used to supplement critical data. The following chart specifies each data type and its purpose: Data Type Purpose Mine adit water and surface water (field parameters, total/dissolved metals/mercury, hardness and anions)
Critical
GPS coordinates Critical Photolog Informational General field observations noted in logbook Informational
Every effort will be made to satisfy the need for completeness when implementing this SAP. Access to field sampling locations is not expected to be problematic and the ability to achieve 100% completeness is anticipated. However, in the event sampling locations are deemed

12
inaccessible (due to physical site characteristics, biological hazards, or weather conditions), alternate sampling locations may be selected by the multi-agency project managers or their technical advisors. If a location is not sampled, the reason will be documented and reported. B.2 Sampling Methods This section describes surface water and mine adit discharge sampling methods that will be employed during these sampling events as well as applicable SOPs, necessary equipment and support facilities. EPA-approved standard operating procedures (SOPs) will be used during this sampling event in order to ensure industry standard practices are employed and ensure consistency in sampling technique associated with other future events that may be completed at the site. In the event that samples cannot be collected in accordance with SOPs due to site conditions or problems with instrumentation or equipment, the field team will confer with EPA or the State QA and Project Managers to determine if an alternate method or slight deviation from the SOP are within acceptable limits. If approved, any changes to sample collection methods will be documented in the field logbook at the time of sample collection. All field activities for this event will be conducted in accordance with:
• U.S. Environmental Protection Agency (2012) General Field Sampling Protocols. SOP FLD-12.00
• U.S. Environmental Protection Agency (2014) Data Management for Field Operations • and Analytical Support. SOP 16-DAT-01.00 • TechLaw Inc, Standard Operating Procedure FLD-08, Flow Tracker Operation. EPA
Field Sampling Protocols (TechLaw, 2011) • U.S. Environmental Protection Agency (2012) Water Quality Measurements with the
In-Situ® Multi-Parameter Meter. SOP FLD-09.00 • U.S. Environmental Protection Agency (2012) Surface Water Sampling. SOP FLD-
01.00 • U.S. Environmental Protection Agency (2012) Sample Preservation and Packaging
and Shipping, ESAT FLD SOP#3. (ESAT 2012) • U.S. Environmental Protection Agency (2012) Soil Sampling. SOP FLD-05.00 • U.S. Environmental Protection Agency (2012) Shallow Stream Sediment Sampling.
SOP FLD-06.00 • U.S. Environmental Protection Agency (2012) Global Positioning System (GPS) – • Trimble GeoXT 2008 series. SOP FLD-07.00 • U.S. Environmental Protection Agency (2012) Sample Custody and Labeling. SOP
FLD-11.00 • U.S. Environmental Protection Agency (2015) Sample Receipt, Custody, Storage and
LIMS Entry of Samples. SOP LAB 05.04 In addition, media-specific field and laboratory SOPs are described in the following sections. All EPA-approved SOPs cited in the following sections for use in this field event are provided in Attachment B.

13
B.2.1 Field Measurements In-situ field measurements of surface water include the use of In-Situ® Multi-Parameter Meter (or equivalent devices) to record and measure pH, temperature, DO, and specific conductance. Field meter probes will be decontaminated prior to the sampling event and in between each sample location using deionized water. Field meter calibration and data collection will be carried out in accordance with manufacturers operating manual and EPA ESAT FLD-9.00. Field calibration and maintenance activities will be documented in a logbook dedicated to each piece of equipment. Logbook entries will be signed and dated by the individual performing calibration or maintenance, or the individual responsible for coordination (such as the field task lead) if equipment is shipped to a manufacturer for repair and/or maintenance.
Flow measurements will be collected in accordance with FlowTracker SOP and manufacturer specifications and as outlined in TechLaw Inc, Standard Operating Procedure FLD-08, “Flow Tracker Operation. EPA Field Sampling Protocols (Techlaw, 2011). Surface water flow measurements and field parameters will be taken at the same approximate time that water samples are collected.
Field measurements include the use of the Insitu or Hydrolab multi-probe (or similar equipment) to measure and record pH, temperature, DO, and specific conductance at all adit and surface water locations (Table 3). Field instrument calibration and field parameters will be collected in accordance with manufacturers operating manual and EPA ESAT SOPs listed above. B.2.2 Surface Water Sampling Surface water and adit water will be sampled in accordance with EPA ESAT FLD SOP#1.00 – Surface Water Sampling. Individual grab samples of surface water will be collected at proposed sample locations listed on Table 3 and as indicated on Figure 3. Extreme care will be given to ensure that: 1) all surface water sampling is completed in downstream to upstream progression to avoid sediment disturbance prior to collection of water, and 2) water sample containers are not permitted to interact with or otherwise disturb bottom sediment during water sampling. Surface Water: 250 ml volume of sample will be collected for both dissolved and total metals analysis and preserved with 0.5 ml nitric acid in the field. Samples for alkalinity, and anions (sulfate, chloride, and fluoride) analyses will be collected in 250 ml containers and chilled at 4 oC for preservation. Samples to be analyzed for dissolved metals will be field-filtered using a 0.45 micron filter directly into the attached 250 mL sample container prior to preservation. All samples will be maintained in coolers and on ice after collection and during transport to the EPA Region 8 Laboratory in Golden, Colorado. Sediment (September event only): Four ounces volume of sample will be collected for total metals analysis, including mercury, and will be collected in four ounce glass containers and chilled at 4 oC for preservation. All samples will be maintained in coolers and on ice after collection and during transport to the EPA Region 8 Laboratory in Golden, Colorado

14
All supplies for this event will be purchased by the EPA ESAT Contractor from approved vendors, and stored in the field sampling room. The week prior to the sampling event, an ESAT sampling team member will gather needed supplies and consumables, which will subsequently be verified by an ESAT team member. Supplies and consumables will be inspected upon receipt, accepted, tracked, and inventoried by appropriate ESAT personnel at the Region 8 Laboratory. Preservation of both surface water and mine adit water require storing samples at 4ºC after sampling, during transport, and storage until analysis. In addition, after collection, water samples will be immediately preserved in the field using nitric acid as indicated for each analyses type. Table 4 summarizes the required sample volume and preservation needed for the scheduled analyses. Dedicated sampling equipment will be used for surface water and adit water collection, therefore, no on-site decontamination of sampling equipment will be required. In-situ field measurements of surface water include the use of In-Situ® Multi-Parameter Meter (or equivalent devices) to record and measure pH, temperature, DO, and specific conductance. Field meter probes will be decontaminated prior to the sampling event and in between each sample location using deionized water. Field meter calibration and data collection will be carried out in accordance with manufacturers operating manual and EPA SOP 720. Field calibration and maintenance activities will be documented in a logbook dedicated to each piece of equipment. Logbook entries will be signed and dated by the individual performing calibration or maintenance, or the individual responsible for coordination (such as the field task lead) if equipment is shipped to a manufacturer for repair and/or maintenance.
Flow measurements will be collected in accordance with FlowTracker SOP and manufacturer specifications and as outlined in TechLaw Inc, Standard Operating Procedure FLD-08, “Flow Tracker Operation. Surface water flow measurements and field parameters will be taken at the same approximate time that water samples are collected.
Field measurements include the use of the Hydrolab multi-probe (or similar equipment) to measure and record pH, temperature, DO, and specific conductance at all adit and surface water locations (Table 4). Field instrument calibration and field parameters will be collected in accordance with manufacturers operating manual and ESAT SOPs listed above.
Up to 14 surface water and sediment samples (sediment to be collected during the September 2016 event only) will be collected and submitted for laboratory analyses of metals (total samples to be collected is dependent on field conditions at the time of sampling). Two types of water sampling will be conducted for this effort: 1) Field measurements including flow, pH, DO, temperature, and specific conductance; and, 2) surface water/mine adits/seeps to be analyzed for total and dissolved metals, alkalinity, and selected anions. B.2.3 Sample Preservation and Shipping All samples will be immediately stored in coolers on ice and kept at or below 4ºC prior to and during shipping as in accordance with EPA ESAT FLD SOP#3, Sample Preservation (ESAT

15
2012) and Packaging and Shipping, (ESAT 2012). Water samples will be acidified in the field using ultra-pure acid depending on analysis type and as indicated on Table 4. The minimum water sample holding time is 14 days for anions (metals holding time is up to 6 months after preservation). All samples will be transported on the same day or within 1 day from collection in order to allow for sample processing within required holding time limits. Specific sample preservation and holding times for each analyte group and media type are presented on Table 4. All samples will be shipped with respect to holding times to ensure the laboratory receives samples prior to and with adequate time to enable sample processing to avoid holding exceedances. B.2.4 Summary of Equipment and Support Facilities Equipment that will be needed in order to conduct the field activities described in this plan is outlined in sampling requirements under the EPA ESAT Statement of Work for this sampling event. Support facilities required during field activities include government four-wheel drive vehicles equipped with the specified sampling equipment and supplies. B.3 Sample Handling and Custody B.3.1 Sample Location Documentation The sample designation will consist of a series of letters and numbers to indicate the site name, the sample location name, and the sample media type. The specific features for the sample locations anticipated for this event are outlined below. It is expected that sample locations will be identified based on site conditions observed during the field event, and will be labeled as follows:
• PG Poughkeepsie Gulch • PGET Poughkeepsie Gulch East Tributary • LC Lake Como • ALBREF Alaska Basin Reference • PGW Poughkeepsie Gulch Wall Road Drainage
A code denoting sample media type will be part of the sample identification, along with the site designation. Codes to be used for sample media type are as follows:
• SW Surface water • Sed Sediment
B.3.2 Field Logbook Documentation All field measurements and observations will be recorded in a bound notebook or on appropriate data sheets by the field personnel at the time they are performed. The personnel doing the recording will initial and date each logbook. Corrections to logbook entries will be

16
made by drawing a single line through the error accompanied by the date and the initials of the person performing the correction, followed by the proper entry. Upon return to the Region 8 laboratory, all data hand entered into field notebooks and/or datasheets will be transferred to electronic spreadsheets (such as Microsoft® Excel) by ESAT contract staff in preparation for uploading to a SCRIBE project. Prior to uploading to SCRIBE, ESAT field personnel will perform a 100% verification of spreadsheet entries against hand-entered field logbook/datasheet entries. Original field notebooks and data sheets will be stored at the Region 8 EPA Laboratory, suite A127 until relinquished to EPA in accordance with ESAT Region 8 contract requirements. Non-SCRIBE electronic files generated as a part of this process (i.e., spreadsheets) will be stored on the ESAT Region 8 contractor G drive. B.3.3 Sample Custody A sample is under a person's custody if it is in their actual possession. A sample in a designated and secure area is under the custody of the person responsible for the security of that area. Sample custody is critical to ensuring the integrity of field sampling and laboratory analysis. In the field, all sample labeling, packing, transportation, and Chain of Custody (COC) procedures will follow strict sample handling protocol. All field activities must be documented. Laboratory receipt of samples, proper storage and preservation, holding times, and extraction of samples (if necessary) must also be documented. ESAT Contract personnel have been assigned and have prepared sample-specific labels for sample locations shown on Table 3 of this SAP. The pre-printed labels will adhered to designated sample containers and provided for each location at the time sampling. Each sample will be logged into the laboratory system by assigning it a unique sample number. This laboratory number and the field sample identification number will be recorded on the laboratory report. Samples will be stored and analyzed according to specified methods. The Laboratory Project Coordinator or designee will provide the contractor Project Chemist with a report upon receipt of samples which includes, at a minimum, laboratory sample identification numbers, field identification numbers, condition of samples upon receipt and the projected date of completion of the specified analyses. ESAT Contract personnel have been directed and will maintain a pre-printed chain of custody (COC) form to include sample locations on Table 3 for this field event. A COC record will be completed for each shipment of samples to track the movement of samples to provide a written record of persons handling the samples and specify sample analyses. A COC record will accompany the field samples during shipment to and at through the laboratory. The information provided on the COC record will include the following:
• Project name • Signature of the samplers • Sampling station number or sample number • Date and time of collection • Grab or composite designation • Signature of individuals involved in the sample transfer

17
• Time and date of sample receipt • Type of matrix • Preservatives used • Sample analysis methods required
COC records initiated in the field will be placed in a plastic bag and taped to the inside of the lid of the shipping containers used for sample transport from the field to the laboratory. The completed COC will be provided to the EPA Project Manager as part of the site-specific Sampling Activities Report to be submitted within 30 days of the field event. B.4 Analytical Methods The Analytical Services Request (ASR) submitted for laboratory analyses and summarizes the analyses to be conducted for this project is provided in Attachment C. Tables 4 and 5 summarize and indicate the media and specific analyses to be performed on each sample. Laboratory turn-around time for analyses associated with this project is expected to be 45 days. A total of 14 surface water samples will be collected and analyzed in July and approximately 1 co-located surface water and sediment samples will be collected in September event to be analyzed for dissolved and total metals, alkalinity, and selected anions for water, total metals only for sediment. Analytical methods are performed in accordance with requirements as outlined in the laboratory-specific QMP and described in Section B.6. Sample disposal of potentially hazardous waste will follow protocol defined in Collection, Analysis and Disposal of ESAT Laboratory Waste SOP LAB01.01 (ESAT, 2012). Analytical Parameters: Target Analyte List (TAL) metals, risk-based screening benchmarks, laboratory methods, procedures and requirements are listed in Tables 5 through 8. All samples will be sent to the EPA Region 8 ESAT Laboratory at USEPA Region 8 Laboratory in Golden, CO, for the following analyses:
• Total Metals (Method 200.7/200.8) • Dissolved Metals (Method 200.7/200.8) • Alkalinity and Anions (Method 300.0, 310.1) • Hardness (Calculated - Method 200.7)

18
B.5 Quality Control Field Quality Control The following types of samples will be provided for QA/QC purposes:
• Field Blank. One duplicate water matrix sample will be collected per 20 samples shipped to determine accuracy and precision associated with sample collection procedures.
• MS/MSD. One sample per 20 water samples will be selected by the laboratory to
perform matrix spike and matrix spike duplicate (MS/MSD) to allow for a check of laboratory quality control procedures.
• Acid Blank. A blank sample to assess acid used in the field to preserve metals (HNO3)
samples will be prepared using acid provided by the laboratory mixed into distilled water. The results will be used to determine if there is contamination in acids used in the field. Acid blanks will be submitted for analyses of metals.
• No rinsate or filter blanks will be taken, as all sampling equipment is pre-cleaned,
sealed, and one-use disposable. The calibration procedures for the field measurements to be performed using the Horiba/YSI Multi-Parameter Meter are detailed in the In-Situ® Multi-Parameter Meter, ESAT FLD SOP 09 (provided in Attachment B of this SAP/QAPP). If other Multi-probes are used for this sampling event, the field sampling team will calibrate the probe according to the manufacturer’s specifications listed in the owner’s manual. The SOPs and procedures appended to this document also detail the associated QA and/or QC criteria for the field analyses and equipment. Laboratory Quality Control The testing and maintenance procedures of laboratory instrumentation will be conducted in accordance with specific laboratory contract requirements as designated in Laboratory Quality Assurance Program Plans. The laboratory controls quality primarily through the batching process, where QC samples are run periodically or at minimum frequencies. Frequency and acceptance requirements of the QC sample results are defined within the specific analytical method SOPs. Laboratory QC criteria for ESAT and EPA Region 8 are included in Table 9 and calculations used for verification of instrument QA/QC are included in Table 10. The sample selection for laboratory QC will be determined by the laboratory staff. Where a specific QC criteria table is not provided, the method’s QC requirements are met or exceeded by ESAT’s and EPA’s analytical process. The sample selection for laboratory QC will be determined by the laboratory staff, and will depend on the sample volumes provided (i.e., in the event samples are provided with limited volume, those samples will more than likely not be used for QC Verification).

19
The testing and maintenance procedures of laboratory instrumentation are included in SOPs maintained at each analytical laboratory. Equipment maintenance is performed in accordance with the manufacturer’s recommendations and per the requirements of the individual laboratories. B.6 Instrument/Equipment Testing, Inspection, and Maintenance The following chart includes the equipment that will be used during execution of this SAP that requires testing, inspection and/or maintenance. Equipment/Instrument Requirement Schedule
Insitu Multi-Parameter Meter
Calibration, routine maintenance, scheduled service
In accordance with manufacturer’s specifications, user’s manual and applicable SOPs
Trimble®GeoXT™GPS Service As needed depending on equipment Performance
Laboratory analytical Instrumentation
Calibration, routine maintenance, scheduled service
In accordance with laboratory QMP, manufacturer’s specifications, user’s manual and applicable SOPs
Periodic maintenance and servicing schedules as well as applicable testing criteria are included in the applicable user’s manuals as well as SOPs. Note that most spare parts for each piece of equipment are required to be maintained at the CLP Laboratory, including parts for field equipment as well as laboratory instrumentation. Spare parts are routinely available and are ordered during periodic maintenance activities to ensure they are on hand when needed. Services agreements are in place for all laboratory instrumentation to address equipment maintenance, service, parts and repair needs as they arise. Field Equipment and instrument calibration requirements and frequencies are detailed in the applicable SOPs and user’s manuals (Attachment 1 of this document). Field equipment will be inspected, tested and routine maintenance performed prior to deployment in the field by EPA contractor/laboratory personnel knowledgeable of equipment operation and maintenance requirements. Any equipment deficiencies and or maintenance requirements will be identified and mitigated (i.e., parts replaced, alternate equipment deployed, etc.). After mitigation, equipment will be re-inspected and the effectiveness of any repairs will be verified. Any repair and/or maintenance activities performed will be documented in the applicable equipment/instrument logbook. Back-up equipment will be deployed during these events in case of equipment/instrument failure in the field. B.7 Instrument/Equipment Calibration and Frequency As indicated in Section B.6, some laboratory instrumentation (analytical instrumentation) and field equipment (such as water quality meters and flow meters) will require periodic

20
calibration to verify function. Calibration requirements, procedures, testing criteria and deficiency resolution procedures are included in applicable SOPs and user’s manuals, each of which are included in Attachment B of this document (for field equipment). SOPs and user’s manuals for laboratory analytical instrumentation are on file and readily available at the CLP Laboratory. Any variations or inability to calibrate a piece of equipment or instrument will be noted in the relevant logbook, and appropriate mitigation procedures will be followed, or replacement equipment will be obtained. Recalibration of any instrument that requires mitigation of a deficiency will be performed prior to use or deployment. B.8 Inspection/Acceptance for Supplies and Consumables All supplies for this event will be purchased, inspected, and stored by the EPA ESAT Contractor from approved vendors and in accordance EPA ESAT Contract requirements. The week before the sampling event the EPA contractor sampling team member will gather needed supplies and consumables. Supplies and consumables will be ordered, inspected upon receipt, accepted, tracked, and inventoried by the EPA contractor. Acceptance of supplies and consumables will be based on contract requirements and the specification of the end user based on project-specific data needs. B.9 Use of Existing Data (Non-Direct Measurements) Non-direct measurements were used to prepare for project implementation. These measurements include historical data and information as available from DRMS. These data were used to generate verify or identify sample locations, identify chemicals of potential ecological concern, or to identify data gaps. All non-direct measurements were used as qualified in previous reports. None of the historical data that were considered questionable or unusable by this or other agencies, therefore, were considered during development of this SAP. B.10 Data Management Data management of all information collected during field activities including field equipment calibration/maintenance entries, field logbook entries, Chain of Custodies (COCs), electronically entered/logged data (such as GPS locations, flow measurements, etc.), and analytical data. Field equipment calibration and maintenance logs– All field equipment calibration and maintenance activities will be documented in a logbook dedicated to each piece of equipment. Logbook entries will be signed and dated by the individual performing calibration or maintenance, or the individual responsible for coordination (such as the field task lead) if equipment is shipped to a manufacturer for repair and/or maintenance. Field logbooks will be stored with the appropriate piece of equipment until relinquished to EPA in accordance with ESAT Region 8 contract requirements. Field logbook/datasheet entries - All field measurements and observations will be recorded in a bound notebook or on appropriate data sheets by the field personnel at the time they are performed. The personnel doing the recording will initial and date each logbook. Corrections to logbook entries will be made by drawing a single line through the error accompanied by the

21
date and the initials of the person performing the correction, followed by the proper entry. Upon return to the Region 8 laboratory, all data hand entered into field notebooks and/or datasheets will be transferred to electronic spreadsheets (such as Microsoft® Excel) by ESAT contract staff in preparation for uploading to a SCRIBE project. Prior to uploading to SCRIBE, ESAT field personnel will perform a 100% verification of spreadsheet entries against hand-entered field logbook/datasheet entries. Original field notebooks and data sheets will be stored at the Region 8 EPA Laboratory, suite A127 until relinquished to EPA in accordance with ESAT Region 8 contract requirements. Non-SCRIBE electronic files generated as a part of this process (i.e., spreadsheets) will be stored on the ESAT Region 8 contractor G drive. Chain of Custody forms - will be filled out during the time of collection and will follow protocol provided in “Sample Custody and Labeling” SOP FLD-11.00 (ESAT, 2012) and as described in Section B.3.3. Upon receipt, samples will be logged into a Laboratory Information Management System (LIMS) upon receipt at the laboratory by an analytical chemist and all analytical data will be entered into the SCRIBE database for permanent storage/archiving. The ESAT Contract Laboratory will submit to EPA a data report containing analytical results for all media sent in for analysis. Data will be submitted in the form of an electronic data deliverable and loaded into the SCRIBE database. The data report will contain a case narrative that briefly describes the number of samples, analyses, and any analytical difficulties or QA/QC issues associated with the samples. The data report will also include signed chain-of-custody forms, analytical data, a QA/QC package, and raw data. Additional reporting requirements are outlined in the ESAT laboratory contract. Field Measurements - All field measurements and observations will be recorded in dedicated bound field logbook by the field personnel at the time they are performed. The personnel doing the recording will initial and date all measurements, observations, and any other notations made. Corrections will be performed by drawing a single line through the error accompanied by the date and the initials of the person performing the correction, followed by the proper entry. Field notebooks, COC’s, bench sheets, and other forms used for the site investigation will be maintained by the ESAT contractor and recorded in a Sampling Activities Report provided to the EPA Project Manager for ultimate distribution to each participating agency. Global Positioning System (GPS) records will be maintained of the actual sample locations and the sample points will be accurately located on topographic maps and mine maps using the measured latitude/longitude or survey stationing. Procedures will provide documentation of changes in sample locations as they occur in the field due to unanticipated site conditions. Sample locations and sample collection procedures will also be documented through the keeping of a field notebook and photographs. Analytical Data - Samples will be logged into a Laboratory Information Management System (LIMS) upon receipt at the Region 8 Laboratory by an analytical chemist. All analytical results will be uploaded into the LIMS in accordance with SOP LAB-05.02 Sample Receipt, Custody, Storage and LIMS Entry of Samples (ESAT, 2012). Peer review of the data package, at a 100% frequency of reported versus raw data, will be performed by the
22
analytical laboratory prior to releasing a final report. The final report will be in a standard Contract Laboratory Program format, including all laboratory and instrument QC results. After generation of the final report, the laboratory electronic data deliverable will immediately be uploaded into a SCRIBE project for permanent electronic storage/archiving. Hard copies of data reports (including bench sheets) will be stored at the Region 8 Laboratory, suite A127 until relinquished to EPA in accordance with ESAT Region 8 contract requirements. SCRIBE project generation – As indicated above, all data generated as a part of field investigation activities will be uploaded into a SCRIBE project (or update to a SCRIBE project) and subsequently published to Scribe.net. It is anticipated that additional data may be collected in the field that supersedes existing or historical data that has already been published (such as GPS locations, etc.) for a specific site. Therefore, prior to publishing SCRIBE projects or updates to SCRIBE projects, ESAT personnel will perform a 100% verification of each SCRIBE project against data collected in the field (hand entered logbook data, electronic forms and/or data logs) prior to publishing the project on Scribe.net. Verified SCRIBE projects will be published within one week of delivery of analytical EDD when possible. In the event that conditions preclude publication within that time period, the EPA project manager will be immediately notified and an alternate publication date will be established.
C. ASSESSMENT AND OVERSIGHT C.1 Assessment and Response Actions C.1.1 Field Sampling Assessments Assessment and oversight of field sampling activities and implementation of the QAPP/SAP will include the following: • Oversight of field sampling activities • Oversight of sample handling and chain of custody procedures The following individuals or their designees are authorized to perform the assessments listed above: • DRMS and EPA Project Managers (or Technical Representative as delegated) • EPA ESAT Contractor QA Official Assessment of field activities may occur at any time and without prior notice, and will be documented in the field logbook as well as the Sampling Activities Report. At a minimum, one assessment will occur per day and follow-up assessments may occur if potential issues are identified. Only authorized individuals may conduct the assessments and it is their role to issue any corrective action or response action to the situation. Minor problems will be addressed on site prior to resuming work. Significant problems may result in a stop work order issued by the TOPO until the project manager or designee can resolve the problem.

23
C.1.2 Laboratory Assessments System assessments of the designated laboratory may be performed by EPA or EPA Contractor. The quality assurance officer (QAO), or a designee, may perform a laboratory inspection. Routine assessments will be conducted at least once a year, in accordance with EPA CLP requirements. However, the frequency of the laboratory system assessments will also be based on the level of use and performance of individual designated laboratories. Assessment may include examination of the laboratory documentation on sample receiving, sample log-in, sample storage, chain-of-custody procedures, sample preparation and analysis, instrument operating records, etc. Routine assessments are required to be performed before a laboratory is added to the approved laboratory list. Should one-time specialty analysis be requested, the need for on-site assessments will be evaluated and discussed with EPA Laboratory or QA staff before an audit. Performance assessments will require preparing blind QC samples and submitting them along with project samples to the laboratory for analysis. The analytical results of the QC sample analyses are evaluated by the QAO to ensure that the laboratory maintains acceptable QC performance. Performance assessments may be requested by EPA. Performance evaluation (PE) samples will be prepared by and obtained from vendors. The QAO will designate if a PE sample shall be submitted. PE samples should be submitted if a laboratory has not recently passed an outside PE sample or as requested by EPA. Response Actions Corrective action may be required at two phases corresponding to the two activities of data generation: 1) field activities (data gathering phase); and 2) laboratory activities (data analysis phase). Corrective Actions required as a result of the data analysis phase are initiated by the EPA CLP QAO when analytical data are found to be outside the limits of acceptability, as specified in the laboratory SOPs. C.1.3 Field Corrective Actions Corrective Actions required as a result of the field data collection phase is initiated by the EPA Project Manager or designated field team leader and may result from log reports or field assessments. QC needs to be implemented both during the development of the SAP and during sampling activities to ensure that Corrective Actions will not be required. Corrective Actions are initiated by EPA if weaknesses or problems are uncovered as a result of field activities. The Corrective Actions will depend on the nature or severity of the problem and the level at which the problem is detected, and may include, but shall not be limited to: • Modifications to sampling procedures • Recalibration (or replacement) of field instruments • Additional training of field personnel • Reassignment of staff personnel • Re-sampling
24
C.2 Reports to Management The results of all laboratory assessments will be submitted in accordance with EPA ESAT and CLP requirements to the EPA and BLM PMs and EPA QA personnel, if requested. An external assessment of the designated laboratory may also be conducted by EPA, at the Region’s discretion.
D. DATA VALIDATION AND USABILITY D.1 Data Review, Verification, and Validation Verification will be completed on 100% of the analytical results for data that is electronically uploaded directly from the analytical instrumentation into the designated laboratory LIMS. This review will be performed to ensure that data were produced in accordance with procedures outlined in this project plan. Peer review of the data package, at a 100% frequency of reported versus raw data, will be performed by the analytical laboratory prior to releasing a final report. Laboratory data validation and verification will begin at the sample log-in stage where a sample log-in technician or chemist will compare received samples against chain-of-custody forms and document sample condition (e.g., damage, cooler temperature). Validation and verification of data will be performed by QA/QC personnel following USEPA National Functional Guidance for Inorganic Data (EPA, 2002) in order to determine if the DQOs were met. Sample data deemed outside the expected range will be investigated, communicated to the analytical chemistry staff, flagged (if needed) and potentially re-sampled to verify or discredit the data. Data that have proven to be incorrect may be flagged, further reviewed, or invalidated. The cause of incorrect data will be investigated and appropriate response actions will be taken, including communication of any issues to the user in the data report. D.2 Verification and Calibration Methods Analytical data will be initially validated 10% of the results by either the EPA Region 8 Laboratory QA Officer or by a designated EPA contractor Quality Assurance officer in accordance with EPA CLP and ESAT Contracts. The validation will include reviewing 10% of the samples for 100% of the analytical analysis performed and reported. The following elements will be reviewed for compliance as part of the abbreviated data validation: • Holding times • Calibration • Blanks • Spikes • Duplicates • LCSs • Reporting limits • Analyte identification • Analyte quantification • Comparison of hardcopy results to electronic data deliverable

25
D.3 Reconciliation with User Requirements If necessary, the analytical data will be qualified in order to convey the outcome of the data validation process to the end users to help them determine how the data may be applied in subsequent interpretations. The following definitions provide brief explanations of the national qualifiers assigned to results in the data review process. If additional qualifiers are needed, then a complete explanation of those other qualifiers will be included in the data review: U The analyte was analyzed for, but was not detected above the level of the
reported sample quantitation limit.
J The result is an estimated quantity. The associated numerical value is the approximate concentration of the analyte in the sample.
J+ The result is an estimated quantity, but the results may be biased high.
J- The result is an estimated quantity, but the results may be biased low. R The data are unusable. The sample results are rejected due to serious
deficiencies in meeting QC criteria. The analyte may or may not be presented in the sample.
UJ The analyte was analyzed for, but was not detected. The reported quantitation limit is approximate and may be inaccurate or imprecise.
D.4 Reconciliation with DQOs Information obtained from the field investigation will be evaluated through the data quality assessment (DQA) process to determine if the data are of adequate quality and quantity to support their intended use. The DQA process consists of five steps, as summarized below (USEPA, 2006): 1) Review the project’s objectives and sampling design: Review the objectives defined during the systematic planning to assure that they are still applicable. If objectives have not been deployed, specify them before evaluating the data for the projects objectives. Review the sampling design and data collection documentation for consistency with the project objectives observing any potential discrepancies. 2) Conduct a preliminary data review: Review QA reports (when possible) for the validation of data, calculate basic statistics, and generate graphs of the data. Use this information to learn about the structures of the data and identify patterns, relationships, or potential anomalies. 3) Select the statistical method: Select the appropriate procedures for summarizing and analyzing the data based on the review of the performance and acceptance criteria associated with the project objectives, the sampling design, and the preliminary data review. Identify the key underlying assumptions associated with the statistical tests.

26
4) Verify the assumptions of the statistical method: Evaluate whether the underlying assumptions hold, or whether departures are acceptable, given the actual data and other information about the study. 5) Draw conclusion from the data: Perform the calculations necessary to draw reasonable conclusions from the data. If the design is to be used again, evaluate the performance of the sampling design. Uncertainty of validated data will be evaluated by the EPA PM, in consultation with the EPA Contractor QA Manager or EPA QA Program Staff, to determine if the DQOs were met. In the event that the DQOs were not met, they will be reviewed to determine if they are achievable and may be revised if necessary, and the data may be further evaluated to determine the impact to the project. Data usability and limitations will be evaluated and determined by the representative agency project managers for this site. .

27
E. REFERENCES Colorado Department of Public Health and the Environment (CDPHE). 2000. Quality Assurance Project Plan and Standard Operating Procedures. January 2000. U.S. Environmental Protection Agency (EPA). 1994. Office of Research and Development. Guidance for the Data Quality Objectives Process. EPA QA/G-4. EPA/600/E-96/055. September 1994. U.S Environmental Protection Agency (EPA). 1994. “Determination of Metals and Trace Elements in Water and Wastes by Inductively Coupled Plasma-Atomic Emission Spectrometry”, Method 200.7 Revision 4.4, May 1994 U.S Environmental Protection Agency (EPA). 1994b “Determination of Trace Elements in Waters and Wastes by Inductively Coupled Plasma-Mass Spectrometry” Method 200.8 Revision 5.4, May 1994 U.S Environmental Protection Agency (EPA). 1998b EPA “Test Methods for Evaluating Solid Waste, Physical/Chemical Methods”, SW-846, Method 7473, Revision 0, January 1998 U.S. Environmental Protection Agency (EPA). 2002. Choosing a Sampling Design for Environmental Data Collection (EPA QA/G-5S). December 2002. U.S Environmental Protection Agency (EPA). 2002. “Guidance for Quality Assurance Project Plans” (EPA QA/G-5) U.S. Environmental Protection Agency (EPA) 2002. “National Functional Guidance for Inorganic Data” U.S Environmental Protection Agency (EPA). 2006. “Guidance on Systematic Planning Using the Data Quality Objectives Process” (EPA QA/G-4) United States Environmental Protection Agency. 2013. Quality Assurance Project Plan for U.S. EPA Region 8 CERCLA Site Assessment, Prepared by Weston Solutions, Inc. Contract No. EP-S8-13-01, Technical Direction Document No.: 1305-02. July 2013.

28
Standard Operating Procedures: Standard Operating Procedures: U.S. Environmental Protection Agency (2014) Data Management for Field Operations and Analytical Support. SOP 16-DAT-01.00 U.S. Environmental Protection Agency (2012) Surface Water Sampling. SOP FLD-01.00 U.S. Environmental Protection Agency (2012) Soil Sampling. SOP FLD-05.00 U.S. Environmental Protection Agency (2012) Shallow Stream Sediment Sampling. SOP FLD-06.00 U.S. Environmental Protection Agency (2012) Global Positioning System (GPS) – Trimble GeoXT 2008 series. SOP FLD-07.00 U.S. Environmental Protection Agency (2012) Water Quality Measurements with the In- Situ® Multi-Parameter Meter. SOP FLD-09.00 U.S. Environmental Protection Agency (2012) Sample Custody and Labeling. SOP FLD- 11.00 U.S. Environmental Protection Agency (2012) General Field Sampling Protocols. SOP FLD-12.00 U.S. Environmental Protection Agency (2016) Laboratory Waste Management. SOP LAB 01.01 U.S. Environmental Protection Agency (2015) Sample Receipt, Custody, Storage and LIMS Entry of Samples. SOP LAB 05.04 TechLaw (2013) Field Procedures - Analytical Support and Laboratory Selection. SOP# 02-06-06

1
TABLES

2
*NO Sediment samples will be collected during July Sampling Event
Table 3: Upper Uncompahgre River Site – JULY 2016 - Sampling Locations and Descriptions Locations are shown from downstream to upstream – indicates the order that sampling will occur
Surface Water Sediment*
Location Identification
Latitude
Longitude Elev Description Field Parameters (pH, DO, Temp, SpC)
TM/DM
Anions
Total Metals
PG-04 TBD TBD TBD Poughkeepsie Gulch downstream of study area.
X X X NA
PGW-01 TBD TBD TBD Poughkeepsie Gulch along wall road drainage X X X NA AB-REF-01 TBD TBD TBD Alaska Basin below lake. This is a reference
location. Exact location to be determined in the field.
X X X NA
PG-05 TBD TBD TBD The Uncompahgre River at the discharge of Lake Como
X X X NA
LC-01 TBD TBD TBD The Uncompahgre River at the inlet to Lake Como. Exact location to be determined in the field.
X X X NA
LC-02 TBD TBD TBD West drainage into Lake Como. Exact location to be determined in the field.
X X X NA
ST-MD-01 TBD TBD TBD Drainage from the Seven-Thirty Mine X X X NA BM-MD-01 TBD TBD TBD Drainage from the Bonanza Mine NA CC-MD-02 TBD TBD TBD Drainage from the Como Mine X X X NA RR-MD-03 TBD TBD TBD Drainage from the Red Rogers Mine X X X NA RM-MD-04 TBD TBD TBD Drainage from the Rollo Mine X X X NA PG-REF-02 TBD TBD TBD Poughkeepsie Gulch upstream of mining
impacts. This is a reference location. X X X NA
PGE-01 TBD TBD TBD Poughkeepsie Gulch East Tributary X X X NA TOTAL 12 12 12 0

3
*Co-located surface water and sediment samples
Table 3: Upper Uncompahgre River Site – September 2016 - Sampling Locations and Descriptions Locations are shown from downstream to upstream – indicates the order that sampling will occur
Surface Water Sediment*
Location Latitude Longitude Elev Description Field Parameters (pH, DO, Temp, SpC)
TM/DM
Anions
Total Metals
PG-04 TBD TBD TBD Poughkeepsie Gulch downstream of study area. X X X X PGW-01 TBD TBD TBD Poughkeepsie Gulch along wall road drainage X X X X AB-REF-01
TBD TBD TBD Alaska Basin below lake. This is a reference location. Exact location to be determined in the field.
X X X X
PG-05 TBD TBD TBD The Uncompahgre River at the discharge of Lake Como
X X X X
LC-01 TBD TBD TBD The Uncompahgre River at the inlet to Lake Como. Exact location to be determined in the field.
X X X X
LC-02 TBD TBD TBD West drainage into Lake Como. Exact location to be determined in the field.
X X X X
ST-MD-01
TBD TBD TBD Drainage from the Seven-Thirty Mine X X X X
BM-MD-01
TBD TBD TBD Drainage from the Bonanza Mine X X X X
CC-MD-02
TBD TBD TBD Drainage from the Como Mine X X X X
RR-MD-03
TBD TBD TBD Drainage from the Red Rogers Mine X X X X
RM-MD-04
TBD TBD TBD Drainage from the Rollo Mine X X X X
PG-REF-02
TBD TBD TBD Poughkeepsie Gulch upstream of mining impacts. This is a reference location.
X X X X
PGE-01 TBD TBD TBD Poughkeepsie Gulch East Tributary X X X X TOTAL 12 12 12 12

4
TABLE 4 Upper Uncompahgre River Site
2016 QC Sample Summary, Preparation, Preservative and Holding Time Requirements
QC Samples Added Analytical Parameter
Matrix* Container Type
Preservative Holding Times
Subtotal Samples
Rinsate Blanks1
Duplicate/ Trip Blanks2
Lab QC Samples3
Total Field QC Samples
Total Field Samples
JULY SEPT June/Sept June/Sept June/Sept June/Sept TAL Metals – dissolved
Surface Water
250 mL HNO3 to pH < 2,
Ice to 4ºC 6 months
12 12 0 2 dup/2 dup 1 Acid
1 MS/MSD 2 QC – June/ 2 QC – Sept
14 total/ 14 total
TAL Metals - total
Surface Water
250 mL HNO3 to pH < 2,
Ice to 4ºC 6 months
12 12
0 2 dup/2 dup 1 MS/MSD 2 QC – June/ 2 QC – Sept
14 total/ 14 total
Alkalinity Anions
Surface Water
250 mL
Ice to 4ºC 14 days1 28 days
12 12
0 2 dup/4 dup
1 MS/MSD 2 QC – June/ 2 QC - Sept
14 total/ 14 total
Total Metals Sediment 4 oz jar Ice to 4ºC 6 months
9 1 1 duplicates 1 MS/MSD 2 QC 10 total
Anions Sediment 4 oz jar Ice to 4ºC 6 months
9 1 1 duplicates 1 MS/MSD 2 QC 10 total
Mercury Sediment Analyze with metals aliquot
Ice to 4ºC 6 months
9 1 1 duplicates 1 MS/MSD 2 QC 10 total
1. Dedicated sampling tools will be used so rinsate blanks are not required for the aqueous matrix. 2. Duplicate samples at a rate of 10% will be collected for all matrices. Aqueous trip blanks are prepared with distilled/deionized
water. No soil trip blanks are required for this event. 3. Ensure that sufficient volume of environmental sample is collected for lab spiking (fill jars completely/no extra volume
required). All analyses conducted at the Region 8 ESAT lab require a matrix spike samples at a frequency of 1 per 20 samples.

5
Table 5. Upper Uncompahgre River Site: 2016 Water Quality Samples - Dissolved Metals Target Analyte List and Reporting Limits
Variable, Units Method Container Type and Preservative Holding Time
Required Reporting Limits
Risk-Based Benchmarksa
(ug/L)
Aluminum, µg/l EPA 200.7 125 ml HDPE Bottle, HNO3 to pH 2 6 months 200 µg/l NA
Arsenic, µg/l EPA 200.8 125 ml HDPE Bottle, HNO3 to pH 2 6 months 1 µg/l 150NAb
Antimony, µg/l EPA 200.8 125 ml HDPE Bottle, HNO3 to pH 2 6 months 2 µg/l 160Ba
Barium, µg/l EPA 200.7 125 ml HDPE Bottle, HNO3 to pH 2 6 months 10 µg/l NA
Beryllium, µg/l EPA 200.7 125 ml HDPE Bottle, HNO3 to pH 2 6 months 1 µg/l NA
Cadmium, µg/l EPA 200.8 125 ml HDPE Bottle, HNO3 to pH 2 6 months 1 µg/l 0.42
Calcium, mg/l EPA 200.7 125 ml HDPE Bottle, HNO3 to pH 2 6 months 5000 µg/l NA
Chromium, µg/l EPA 200.7 125 ml HDPE Bottle, HNO3 to pH 2 6 months 2 µg/l 74b
Copper, µg/l EPA 200.7 125 ml HDPE Bottle, HNO3 to pH 2 6 months 2 µg/l 8.96
Colbalt, µg/l EPA 200.7 125 ml LDPE Bottle HNO3 to pH 2 6 months 1 µg/l NA
Iron, µg/l EPA 200.7 125 ml HDPE Bottle, HNO3 to pH 2 6 months 100 µg/l NA
Lead, µg/l EPA 200.8 125 ml HDPE Bottle, HNO3 to pH 2 6 months 1 µg/l 2.52
Magnesium, mg/l EPA 200.7 125 ml HDPE Bottle, HNO3 to pH 2 6 months 5000 µg/l NA
Manganese, µg/l EPA 200.7 125 ml HDPE Bottle, HNO3 to pH 2 6 months 1 µg/l 1650
Mercury, µg/l EPA 200.7 125 ml HDPE Bottle, HNO3 to pH 2 6 months 0.2 µg/l 0.002
Nickel, µg/l EPA 200.8 125 ml HDPE Bottle, HNO3 to pH 2 6 months 1 µg/l 52
Potassium, mg/l EPA 200.7 125 ml HDPE Bottle, HNO3 to pH 2 6 months 5000 µg/l NA
Selenium, µg/l EPA 200.8 125 ml HDPE Bottle, HNO3 to pH 2 6 months 5 µg/l 4.6b
Silver, µg/l EPA 200.7 125 ml HDPE Bottle, HNO3 to pH 2 6 months 1 µg/l 0.08

6
Table 5. Upper Uncompahgre River Site: 2016 Water Quality Samples - Dissolved Metals Target Analyte List and Reporting Limits, (continued)
Variable, Units Method Container Type and Preservative Holding Time
Required Reporting Limits
Risk-Based Benchmarksa
(ug/L)
Sodium, mg/l EPA 200.7
125 ml HDPE Bottle, HNO3 to pH 2 6 months 5000 µg/l NA
Thallium, µg/l EPA 200.8 125 ml HDPE Bottle, HNO3 to pH 2 6 months 1 µg/l NA
Vandium, µg/l EPA 200.8 125 ml HDPE Bottle, HNO3 to pH 2 6 months 5 µg/l NA
Zinc, µg/l EPA 200.7 125 ml HDPE Bottle, HNO3 to pH 2 6 months 2 µg/l 124
Hardness, mg/l EPA 200.7 Calc. from dissolved Ca and Mg 6 months 0.2 mg/l NA

7
Table 6. Upper Uncompahgre River Site: 2016 Water Quality Samples Total Metals Target Analyte List and Reporting Limits
Variable, Units Method Container Type and Preservative Holding Time
Required Reporting Limits
Aluminum, µg/l EPA 200.7 250 ml LDPE Bottle HNO3 to pH #2 6 months 100 µg/l
Arsenic, µg/l EPA 200.8 250 ml LDPE Bottle HNO3 to pH #2 6 months 4 µg/l
Cadmium, µg/l EPA 200.8 250 ml LDPE Bottle HNO3 to pH #2 6 months 0.2 µg/l
Chromium, µg/l EPA 200.7 250 ml LDPE Bottle HNO3 to pH #2 6 months 2 µg/l
Copper, µg/l EPA 200.7 250 ml LDPE Bottle HNO3 to pH #2 6 months 10 µg/l
Colbalt EPA 200.7 250 ml LDPE Bottle HNO3 to pH #2 6 months 2 µg/l
Iron, µg/l EPA 200.7 250 ml LDPE Bottle HNO3 to pH #2 6 months 200 µg/l
Lead, µg/l EPA 200.8 250 ml LDPE Bottle HNO3 to pH #2 6 months 1 µg/l
Manganese, µg/l EPA 200.7 250 ml LDPE Bottle HNO3 to pH #2 6 months 2 µg/l
Mercury, ug/l
Nickel, µg/l EPA 200.8 250 ml LDPE Bottle HNO3 to pH #2 6 months 1 µg/l
Selenium, µg/l EPA 200.8 250 ml LDPE Bottle HNO3 to pH #2 6 months 1 µg/l
Silver, µg/l EPA 200.7 250 ml LDPE Bottle HNO3 to pH #2 6 months 0.5 µg/l
Uranium, µg/l EPA 200.8
Zinc, µg/l EPA 200.7 250 ml LDPE Bottle HNO3 to pH #2 6 months 40 µg/l
Digestion Procedure:
Total Recoverable Metals - Hotplate EPA 200.2
“Sample Preparation Procedure for Spectrochemical Determination of Total Recoverable Elements”, Methods for the Determination of Metals in Environmental
Samples, EPA/600/4-91/0100, June 1991
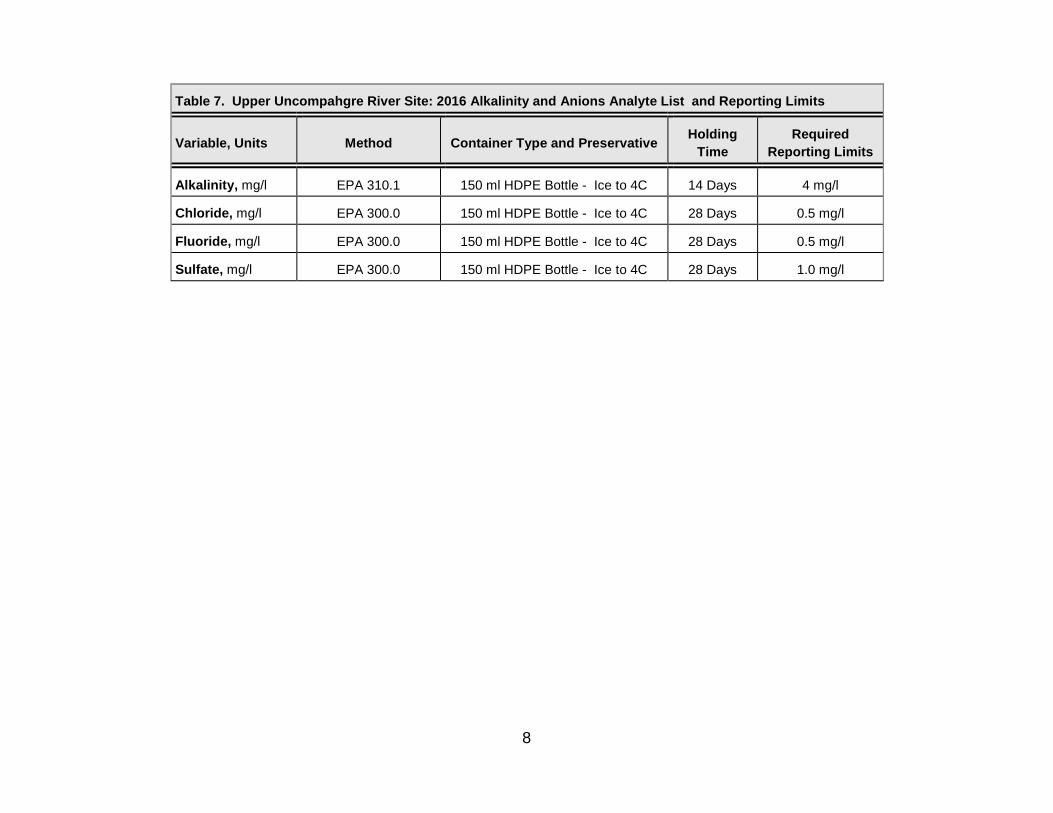
8
Table 7. Upper Uncompahgre River Site: 2016 Alkalinity and Anions Analyte List and Reporting Limits
Variable, Units Method Container Type and Preservative Holding
Time Required
Reporting Limits
Alkalinity, mg/l EPA 310.1 150 ml HDPE Bottle - Ice to 4C 14 Days 4 mg/l
Chloride, mg/l EPA 300.0 150 ml HDPE Bottle - Ice to 4C 28 Days 0.5 mg/l
Fluoride, mg/l EPA 300.0 150 ml HDPE Bottle - Ice to 4C 28 Days 0.5 mg/l
Sulfate, mg/l EPA 300.0 150 ml HDPE Bottle - Ice to 4C 28 Days 1.0 mg/l

9
Table 8: Upper Uncompahgre: 2016 SAP/QAPP - Laboratory Analytical Instrumentation and Methods QC Criteria QC Check / Symbol Explanation Run Frequency Acceptance Criteria Corrective Action
Initial Calibration Verification (ICV)
Certified standard or standard from a different lot/source than calibration standards
Beginning of run to verify calibration
90-110% recovery (%R) of “true value” Terminate analysis, restandardize
Continuing Calibration Verification (CCV)
Approximate mid-range standard made from working standards stock
Every 10 unknowns and at end of run
90-110%R “True” value Re-analyze immediately (once). Then: Restandardize and rerun all samples following last “acceptable” CCV. If recovery >110% and <120% and all associated samples (same analyte) show non-detected, no action required.
Spectral/Mass Interference Check for ICP-OE & ICP-MS (ICSA / ICSAB)
Analyze spectral interferents at high concentrations alone (ICSA) and with other target analytes (ICSAB) to evaluate the effect on analyte recovery
Once per analytical run, prior to sample analyses
ICSAB: ± 20%R ‘true value’ ICSA: ± 20%R ‘true value’ or < ±PQL whichever is greater
Evaluate the sample analyte levels. Rerun ICSA/AB or use an alternate wavelength. If interferent levels in the samples don’t approach ICSA interferent levels, no action is required. If necessary, recalculate IECs & rerun associated samples
Calibration Blanks, Initial & Continuing (ICB & CCB)
Blank with same reagents as working standards; i.e. zero point on curve
Beginning, end, and after each ICV/CCV during analytical run
≤ ±PQL Re-analyze immediately once. If still unacceptable, terminate analysis & restandardize. Rerun all samples analyzed after last “acceptable” blank. Evaluate interferent level(s) vs samples, use prof judgement for addit'l required sample reruns.
Preparation Blank (PB)
Digested or prepared blank processed identical to samples. Aliquot of clean water prepared using same reagents/volumes as unknown samples.
Once per preparation batch/per matrix, or at 5% frequency, whichever is greatest
≤ ±PQL PB > PQL: Redigest all samples >MDL and <10x PB value PB < -PQL: Re-calibrate and re-analyze all associated samples
Matrix Spike & Matrix Spike Duplicate (MS & MSD)
Unknown sample (NOT a field blank) fortified at approximately 10-100x MDL for each target analyte. High concentration samples (spike <25% sample target analyte concentration), no calculation is required
1 per 20 unknowns per matrix, whichever is greatest (One PB Spike per PB)
Spike recovered at: 80-120% (ICP& MS) - waters 65-135% (all) - solids
Compose 1 post-digest spike (PS) and retest, note in the narrative. (Analyze original sample with PS) Evaluate duplicate reproducibility. Compare results to LFB/PBS for similar trends. If no similar trends observed, assume a matrix effect. Qualify corresponding analyte data as estimated 'J' for similar matrix samples in set.

10
Table 9: Upper Uncompahgre/Lake Como: 2016 SAP/QAPP - QA/QC Calculation Algorithms
Statistical QC Parameter Evaluated Acronym Analyses Applied to Calculation Algorithm
Percent Recovery %R Spike recovery determinations %R = ((Cs - Sa) ÷ (Sa)) x 100
Percent Recovery %R ICV/CCV, ICSAB, LCS %R = (AT ÷ T) x100
Relative Percent Difference RPD Variance between duplicates RPD = ((C - CD) / ((C + CD) ÷ 2)) x 100
Percent Difference %D Serial dilution variance %D = ((C - CL) / C) x 100
Notes: C = Sample extract concentration CD = Duplicate sample concentration Cs = Sample extract, spiked concentration CL = Sample extract concentration, dilution factor corrected. Sa = Spike amount added AT = Analyzed concentration for the known standard. T = True (possibly certified) amount in standard solution
Hardness = (Ca, mg/L)*2.497 + (Mg, mg/L)*4.118

FIGURES

Area of Interest
Figure 1Upper Uncompahgre River/Lake
Como Site2016
Map Date: May 20, 2016
Data Sources: Rivers and Streams: CDOW (2004). HUC 10: Natural Resources Conservation Service (2013). Mine: DRMS (2016). Image: Microsoft Bing Hybrid (2016).
Map Projection: UTM Zone 13 N, NAD83, Meters
0 10,0005,000Feet
0 2,0001,000Meters
µ
Mine Locations"»
HUC 10 Boundary
Rivers and Streams

"»"»
"»"»
"»
$1
$1
$1
$1
$1
$1
$1PG-067/17/2014As = NDCd = 9.7Cu = 55Mn = 1700Pb = 10Zn = 1200-------------pH = 4.7Cond = 198.4Hardness = NDSulfate = NDAKB-01
7/17/2014As = NDCd = 1.9Cu = 7.6Mn = 110Pb = 0.83 JZn = 380-------------pH = 6.12Cond = 164Hardness = NDSulfate = ND
PG-017/17/2014As = NDCd = 2.7Cu = 9.4Mn = 330Pb = 1.4Zn = 400-------------pH = 7.22Cond = 198.3Hardness = 84Sulfate = 87
PG-047/17/2014As = 0.23 JCd = 10Cu = 48Mn = 1700Pb = 9.9Zn = 1200-------------pH = 4.08Cond = 221.4Hardness = 79Sulfate = 99
PG-05 7/17/2014As = 0.22 JCd = 9.4Cu = 47Mn = 1700Pb = 5.2Zn = 1000-------------pH = 4.87Cond = 236.9Hardness = 95Sulfate = 98
PG-037/17/2014As = NDCd = 3.6Cu = 9.9Mn = 470Pb = 0.76 JZn = 520-------------pH = 6.01Cond = 188Hardness = 84Sulfate = 22
Sil-017/17/2014As = NDCd = NDCu = NDMn = 11Pb = 3.5Zn = 82-------------pH = 6.22Cond = 250.4Hardness = 110Sulfate = 110
PG-059/16/2014As = 0.22 JCd = 10Cu = 58Mn = 1700Pb = 6Zn = 1100-------------pH = 4.73Cond = 254Hardness = 110Sulfate = 130
PG-049/11/2014As = 0.24 JCd = 13Cu = 52Mn = 2100Pb = 15Zn = 1600-------------pH = 4.2Cond = 257Hardness = 92Sulfate = 110
PG-069/11/2014As = 0.22 JCd = 11Cu = 49Mn = 1700Pb = 11Zn = 1400-------------pH = 4.43Cond = 225.2Hardness = 81Sulfate = 94
PG-039/11/2014As = NDCd = NDCu = NDMn = NDPb = NDZn = ND-------------pH = 6.29Cond = 199.2Hardness = NDSulfate = ND
AKB-019/11/2014As = NDCd = NDCu = NDMn = NDPb = NDZn = ND-------------pH = 5.62Cond = 182.2Hardness = NDSulfate = ND
Sil-019/11/2014As = NDCd = NDCu = NDMn = NDPb = NDZn = ND-------------pH = NDCond = NDHardness = NDSulfate = ND
PG-019/11/2014As = NDCd = NDCu = NDMn = NDPb = NDZn = ND-------------pH = 7.15Cond = 202Hardness = NDSulfate = ND
Red RogersRed Rogers Seven-ThirtySeven-Thirty
Como ConsolidatedComo Consolidated
Bonanza MineBonanza MineRollo MineRollo Mine
Headwaters Animas RiverHeadwaters Animas River
Upper Uncompahgre RiverUpper Uncompahgre River
Placer Gulch
Miners Creek
Cement
Creek
Animas R W Fk Cal Gul
Letcher Creek
Moose Creek
Brooklyn Gulch
Albany Gulch
Burrows Creek
Hendrick Gulch
Area of Interest
Figure 2Upper Uncompahgre River/Lake
ComoSurface Water Sampling Results - 2014
Map Date: May 20, 2016
Data Sources: Surface Water Sampling Locations: Colorado Division of Mine Reclamation and Safety (2014). Rivers and Streams: CDOW (2004). HUC 10: Natural Resources Conservation Service (2013). Lands: BLM (2013), USFS (2013). Mine DRMS (2016). Image: World Topo (2016).
Map Projection: UTM Zone 13 N, NAD83, Meters
0 4,0002,000Feet
0 1,000500Meters
µ
Note: All metals results are reported in ug/LSulfate and hardness are reported in mg/LSpecific Conductance is reported in uS/cm
USFS Land
BLM Land
HUC 10 Boundary
Rivers and Streams
Mine Locations"»Mill Locations¾¾!
Surface Water Sample Locations$1
Uncompagre River

Area of Interest
Figure 3Upper Uncompahgre River/Lake
Como 2016 Sampling Event
Map Date: May 20, 2016
Data Sources: Historical Sample Locations: Colorado Division of Mine Reclamation and Safety (2014). Proposed Sample Locations:DRMS (2016). Rivers and Streams: CDOW (2004). HUC 10: Natural Resources Conservation Service (2013). Lands: BLM (2013), USFS (2013). Mine DRMS (2016). Image: World Topo (2016).
Map Projection: UTM Zone 13 N, NAD83, Meters
0 4,0002,000Feet
0 1,000500Meters
µ
Proposed Surface Water Samplel Location!.
Historical Surface Water Sample Location$1
Mine Locations"»Rivers and Streams
HUC 10 Boundary
BLM Land
USFS Land
Note: All sample locations shown are Approximate – Actual locations will be determined in the field

ATTACHMENT A
UPPER UNCOMPAHGRE RIVER/LAKE COMO – 2016 QAPP/SAP
REGION 8 EPA QUALITY ASSURANCE CROSSWALK

EPA Region 8 QA Document Review Crosswalk Page 1 of 9 Upper Uncompahgre River Site Lake Como Surface Water Characterization
Update # 2 8-2012 QAPP Crosswalk
EPA REGION 8 QA DOCUMENT REVIEW CROSSWALK QAPP/FSP/SAP for: (check appropriate box)
Entity (grantee, contract, EPA AO, EPA Program, Other) Colorado Department of Reclamation, Mining and Safety
Regulatory Authority and/or Funding Mechanism
___40 CFR 31 for Grants ___48 CFR Part 46 for Contracts ___ Interagency Agreement ___ EPA Administrative Order ___ EPA Program Funding ___ EPA Program Regulation ___ EPA CIO 2105
GRANTEE CONTRACTOR EPA X Other
Document Title [Note: Title will be repeated in Header]
Upper Uncompahgre River Site Lake Como Surface Water Characterization
QAPP/FSP/SAP Preparer
U.S. Forest Service
Period of Performance (of QAPP/FSP/SAP)
July 2016 through November 2016 Date Submitted for Review
4/8/2016
EPA Project Officer EPA Project Manager
Victor Ketellapper PO Phone # PM Phone #
303/312-6578
QA Program Reviewer or Approving Official
Jean Wyatt Date of Review May 25, 2014
Documents to Review: 1. QAPP written by Grantee or EPA must also include for review:
Work Plan(WP) / Statement of Work (SOW) / Program Plan (PP) / Research Proposal (RP) 2. QAPP written by Contractor must also include for review:
a) Copy of signed QARF for Task Order b) Copy of Task Order SOW c) Made available hard or electronic copy of approved QMP d) If QMP not approved, provide Contract SOW
3. For a Field Sampling Plan (FSP) or Sampling & Analyses Plan (SAP), the Project QAPP
must also be provided. OR
The FSP or SAP must be clearly identified as a stand-alone QA document and must contain all QAPP required elements (Project Management, Data Generation/Acquisition, Assessment and Oversight, and Data Validation and Usability).
Documents Submitted for QAPP Review: 1. QA Document(s) submitted for review:
QA Document
Document Date
Document Stand-alone
Document with QAPP
QAPP Yes FSP No NA SAP Yes Yes SOP(s) Yes
2. WP/SOW/TO/PP/RP Date: NA WP/SOW/TO/RP Performance Period: NA 3. QA document consistent with the: WP/SOW/PP for grants? Yes SOW/TO for contracts? NA 4. QARF signed by R8 QAM NA
Funding Mechanism NA Amount _____________
Summary of Comments (highlight significant concerns/issues): 1. Comment #1: NOTE: No significance comments were identified since all comments on previous Amendments were incorporated. 2. Comment #2 3. The Colorado Department of Reclamation, Mining and Safetymust address the comments in the Summary of Comments, as well as those identified in the
Comment section(s) that includes a “Response (date)” and Resolved (date)”.

EPA Region 8 QA Document Review Crosswalk Page 2 of 9 Upper Uncompahgre River Site Lake Como Surface Water Characterization
Update # 2 8-2012 QAPP Crosswalk
Element
Acceptable Yes/No/NA
Page/ Section
Comments
A. Project Management A1. Title and Approval Sheet
a. Contains project title Yes i b. Date and revision number line (for when needed) Yes i
c. Indicates organization=s name Yes i
d. Date and signature line for organization=s project manager
Yes ii
e. Date and signature line for organization=s QA manager
Yes ii
f. Other date and signatures lines, as needed Yes ii A2. Table of Contents
a. Lists QA Project Plan information sections Yes iii-iv b. Document control information indicated NA NA
A3. Distribution List Includes all individuals who are to receive a copy of the QA Project Plan and identifies their organization
Yes vi
A4. Project/Task Organization a. Identifies key individuals involved in all major aspects of the project, including contractors
Yes vii
b. Discusses their responsibilities Yes vii-viii c. Project QA Manager position indicates independence from unit generating data
Yes x
d. Identifies individual responsible for maintaining the official, approved QA Project Plan
Yes X
e. Organizational chart shows lines of authority and reporting responsibilities
Yes xi
A5. Problem Definition/Background a. States decision(s) to be made, actions to be taken, or outcomes expected from the information to be obtained
Yes 1
b. Clearly explains the reason (site background or historical context) for initiating this project
Yes 1

EPA Region 8 QA Document Review Crosswalk Page 3 of 9 Upper Uncompahgre River Site Lake Como Surface Water Characterization
Update # 2 8-2012 QAPP Crosswalk
c. Identifies regulatory information, applicable criteria, action limits, etc. necessary to the project
Yes 1
A6. Project/Task Description a. Summarizes work to be performed, for example, measurements to be made, data files to be obtained, etc.,
that support the project=s goals
Yes 1-2
b. Provides work schedule indicating critical project points, e.g., start and completion dates for activities such as sampling, analysis, data or file reviews, and assessments
Yes 1-2
c. Details geographical locations to be studied, including maps where possible
Yes 1-2
d. Discusses resource and time constraints, if applicable NA NA A7. Quality Objectives and Criteria
a. Identifies - performance/measurement criteria for all information to be collected and acceptance criteria for information obtained from previous studies, - including project action limits and laboratory detection limits and - range of anticipated concentrations of each parameter of interest
Yes 5-6; Tables 2-3
b. Discusses precision Yes 8 c. Addresses bias Yes 8 d. Discusses representativeness Yes 8 e. Identifies the need for completeness Yes 8 f. Describes the need for comparability Yes 8 g. Discusses desired method sensitivity Yes 8
A8. Special Training/Certifications a. Identifies any project personnel specialized training or certifications
Yes 8-9
b. Discusses how this training will be provided Yes 8 c. Indicates personnel responsible for assuring training/certifications are satisfied
Yes 9
d. identifies where this information is documented Yes 9

EPA Region 8 QA Document Review Crosswalk Page 4 of 9 Upper Uncompahgre River Site Lake Como Surface Water Characterization
Update # 2 8-2012 QAPP Crosswalk
A9. Documentation and Records a. Identifies report format and summarizes all data report package information
Yes 9-10
b. Lists all other project documents, records, and electronic files that will be produced
Yes 9-10
c. Identifies where project information should be kept and for how long
Yes 9-10
d. Discusses back up plans for records stored electronically
Yes 9-10
e. States how individuals identified in A3 will receive the most current copy of the approved QA Project Plan, identifying the individual responsible for this
Yes 9
B. Data Generation/Acquisition B1. Sampling Process Design (Experimental Design)
a. Describes and justifies design strategy, indicating size of the area, volume, or time period to be represented by a sample
Yes 9-11
b. Details the type and total number of sample types/matrix or test runs/trials expected and needed
Yes 9-11 Table 3
c. Indicates where samples should be taken, how sites will be identified/located
Yes 9-11
d. Discusses what to do if sampling sites become inaccessible
Yes 9-11
e. Identifies project activity schedules such as each sampling event, times samples should be sent to the laboratory, etc.
Yes 9-11
f. Specifies what information is critical and what is for informational purposes only
Yes 11
g. Identifies sources of variability and how this variability should be reconciled with project information
Yes 9-11
B2. Sampling Methods a. Identifies all sampling SOPs by number, date, and regulatory citation, indicating sampling options or modifications to be taken
Yes 12
b. Indicates how each sample/matrix type should be collected
Yes 13-14

EPA Region 8 QA Document Review Crosswalk Page 5 of 9 Upper Uncompahgre River Site Lake Como Surface Water Characterization
Update # 2 8-2012 QAPP Crosswalk
c. If in situ monitoring, indicates how instruments should be deployed and operated to avoid contamination and ensure maintenance of proper data
Yes 13-14
d. If continuous monitoring, indicates averaging time and how instruments should store and maintain raw data, or data averages
NA NA
e. Indicates how samples are to be homogenized, composited, split, or filtered, if needed
Yes 13-14
f. Indicates what sample containers and sample volumes should be used
Yes 13-14 Table 4
g. Identifies whether samples should be preserved and indicates methods that should be followed
Yes 13-14 Table 4
h. Indicates whether sampling equipment and samplers should be cleaned and/or decontaminated, identifying how this should be done and by-products disposed of
Yes 11-14 Table 4
i. Identifies any equipment and support facilities needed Yes 13-14 j. Addresses actions to be taken when problems occur, identifying individual(s) responsible for corrective action and how this should be documented
Yes 12
B3. Sample Handling and Custody a. States maximum holding times allowed from sample collection to extraction and/or analysis for each sample type and, for in-situ or continuous monitoring, the maximum time before retrieval of information
Yes 14 Table 4
b. Identifies how samples or information should be physically handled, transported, and then received and held in the laboratory or office (including temperature upon receipt)
Yes 14
c. Indicates how sample or information handling and custody information should be documented, such as in field notebooks and forms, identifying individual responsible
Yes 16
d. Discusses system for identifying samples, for example, numbering system, sample tags and labels, and attaches forms to the plan
Yes 15 - 16-
e. Identifies chain-of-custody procedures and includes form to track custody
Yes 16-

EPA Region 8 QA Document Review Crosswalk Page 6 of 9 Upper Uncompahgre River Site Lake Como Surface Water Characterization
Update # 2 8-2012 QAPP Crosswalk
B4. Analytical Methods a. Identifies all analytical SOPs (field, laboratory and/or office) that should be followed by number, date, and regulatory citation, indicating options or modifications to be taken, such as sub-sampling and extraction procedures
Yes 18-19
b. Identifies equipment or instrumentation needed Yes 18-19 c. Specifies any specific method performance criteria Yes 18-19 d. Identifies procedures to follow when failures occur, identifying individual responsible for corrective action and appropriate documentation
Yes 18-19
e. Identifies sample disposal procedures Yes 18 f. Specifies laboratory turnaround times needed Yes 18 g. Provides method validation information and SOPs for nonstandard methods
NA NA
B5. Quality Control a. For each type of sampling, analysis, or measurement technique, identifies QC activities which should be used, for example, blanks, spikes, duplicates, etc., and at what frequency
Yes 19, Table 4
b. Details what should be done when control limits are exceeded, and how effectiveness of control actions will be determined and documented
Yes 19, Table 4
c. Identifies procedures and formulas for calculating applicable QC statistics, for example, for precision, bias, outliers and missing data
Yes Table 9
B6. Instrument/Equipment Testing, Inspection, and Maintenance a. Identifies field and laboratory equipment needing periodic maintenance, and the schedule for this
Yes 19-21
b. Identifies testing criteria Yes 19-21 c. Notes availability and location of spare parts Yes 20 d. Indicates procedures in place for inspecting equipment before usage
Yes 21
e. Identifies individual(s) responsible for testing, inspection and maintenance
Yes 21

EPA Region 8 QA Document Review Crosswalk Page 7 of 9 Upper Uncompahgre River Site Lake Como Surface Water Characterization
Update # 2 8-2012 QAPP Crosswalk
f. Indicates how deficiencies found should be resolved, re-inspections performed, and effectiveness of corrective action determined and documented
Yes 20-21
B7. Instrument/Equipment Calibration and Frequency a. Identifies equipment, tools, and instruments that should be calibrated and the frequency for this calibration
Yes 20-21
b. Describes how calibrations should be performed and documented, indicating test criteria and standards or certified equipment
Yes 20-21, Table 8
c. Identifies how deficiencies should be resolved and documented
Yes 20-21, Table 8
B8. Inspection/Acceptance for Supplies and Consumables a. Identifies critical supplies and consumables for field and laboratory, noting supply source, acceptance criteria, and procedures for tracking, storing and retrieving these materials
Yes 21
b. Identifies the individual(s) responsible for this Yes 21 B9. Use of Existing Data (Non-direct Measurements)
a. Identifies data sources, for example, computer databases or literature files, or models that should be accessed and used
Yes 21
b. Describes the intended use of this information and the rationale for their selection, i.e., its relevance to project
Yes 21
c. Indicates the acceptance criteria for these data sources and/or models
Yes 21
d. Identifies key resources/support facilities needed Yes 21 e. Describes how limits to validity and operating conditions should be determined, for example, internal checks of the program and Beta testing
Yes 21
B10. Data Management a. Describes data management scheme from field to final use and storage
Yes 21-23
b. Discusses standard record-keeping and tracking practices, and the document control system or cites other written documentation such as SOPs
Yes 21-23

EPA Region 8 QA Document Review Crosswalk Page 8 of 9 Upper Uncompahgre River Site Lake Como Surface Water Characterization
Update # 2 8-2012 QAPP Crosswalk
c. Identifies data handling equipment/procedures that should be used to process, compile, analyze, and transmit data reliably and accurately
Yes 21-23
d. Identifies individual(s) responsible for this Yes 21-23 e. Describes the process for data archival and retrieval Yes 21-23 f. Describes procedures to demonstrate acceptability of hardware and software configurations
Yes 21-23
g. Attaches checklists and forms that should be used NA Demonstrated via Laboratory QMP and SOPs
C. Assessment and Oversight C1. Assessments and Response Actions
a. Lists the number, frequency, and type of assessment activities that should be conducted, with the approximate dates
Yes 23
b. Identifies individual(s) responsible for conducting assessments, indicating their authority to issue stop work orders, and any other possible participants in the assessment process
Yes 23
c. Describes how and to whom assessment information should be reported
Yes 23
d. Identifies how corrective actions should be addressed and by whom, and how they should be verified and documented
Yes 23
C2. Reports to Management a. Identifies what project QA status reports are needed and how frequently
Yes 24
b. Identifies who should write these reports and who should receive this information
Yes 24
D. Data Validation and Usability D1. Data Review, Verification, and Validation
Describes criteria that should be used for accepting, rejecting, or qualifying project data
Yes 25
D2. Verification and Validation Methods a. Describes process for data verification and validation, providing SOPs and indicating what data validation software should be used, if any
Yes 25
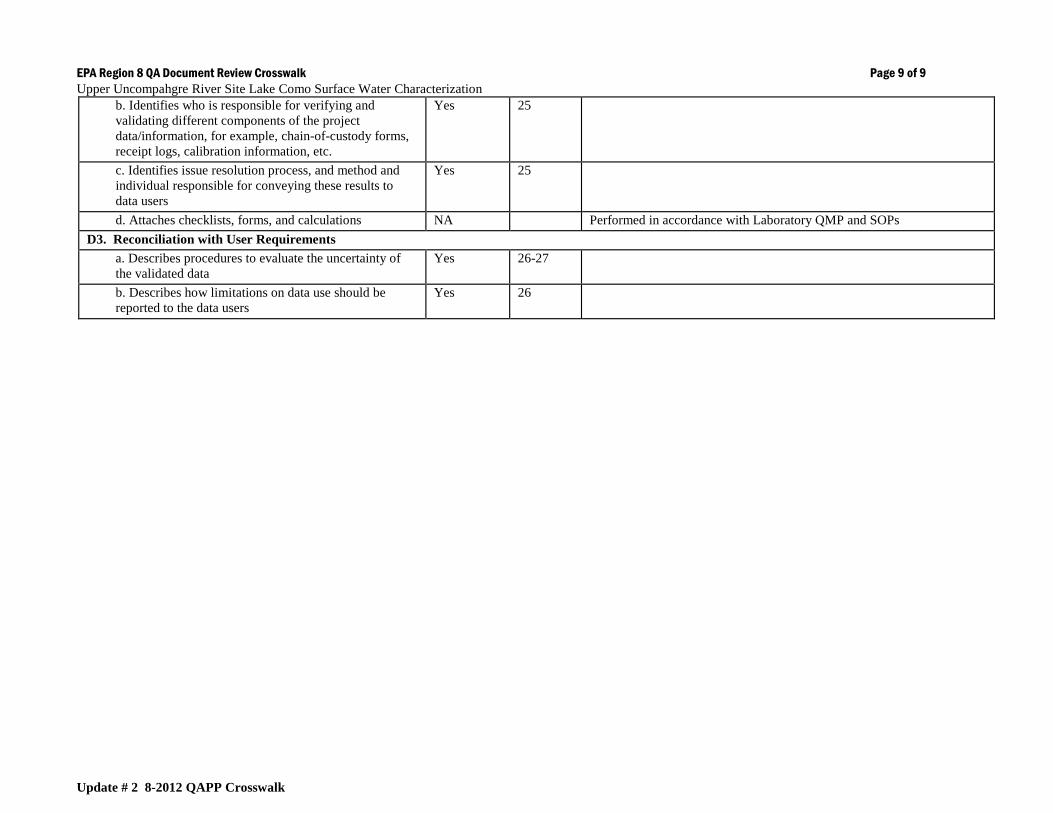
EPA Region 8 QA Document Review Crosswalk Page 9 of 9 Upper Uncompahgre River Site Lake Como Surface Water Characterization
Update # 2 8-2012 QAPP Crosswalk
b. Identifies who is responsible for verifying and validating different components of the project data/information, for example, chain-of-custody forms, receipt logs, calibration information, etc.
Yes 25
c. Identifies issue resolution process, and method and individual responsible for conveying these results to data users
Yes 25
d. Attaches checklists, forms, and calculations NA Performed in accordance with Laboratory QMP and SOPs D3. Reconciliation with User Requirements
a. Describes procedures to evaluate the uncertainty of the validated data
Yes 26-27
b. Describes how limitations on data use should be reported to the data users
Yes 26

ATTACHMENT B
UPPER UNCOMPAHGRE RIVER/LAKE COMO – 2016 QAPP/SAP
SOPS – AVAILABLE UPON REQUEST

ATTACHMENT C
UPPER UNCOMPAHGRE RIVER/LAKE COMO – 2016 QAPP/SAP
EPA ANALYTICAL REQUEST FOR LABORATORY SERVICES
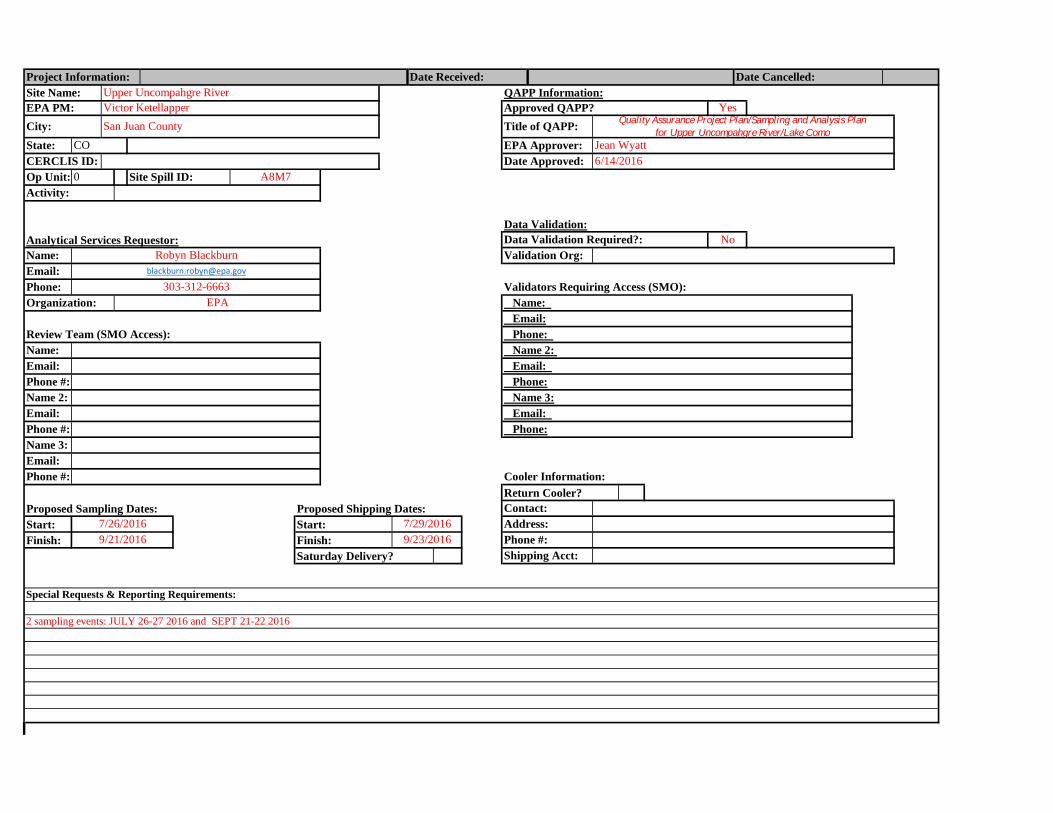
Data Validation:Analytical Services Requestor:
Return Cooler?Proposed Sampling Dates: Proposed Shipping Dates:Start: Start:Finish: Finish:
Saturday Delivery?
Project Information: Date Received: Date Cancelled:
State: CO EPA Approver: Jean Wyatt
Site Name: Upper Uncompahgre River QAPP Information:EPA PM: Victor Ketellapper Approved QAPP? YesCity: San Juan County Title of QAPP: Quality Assurance Project Plan/Sampling and Analysis Plan
for Upper Uncompahgre River/Lake Como
CERCLIS ID: Date Approved: 6/14/2016Op Unit: 0 Site Spill ID: A8M7
Organization: EPA Name:
Activity:
Data Validation Required?: NoName: Robyn Blackburn Validation Org:Email: [email protected]
Phone: 303-312-6663 Validators Requiring Access (SMO):
Email:Review Team (SMO Access): Phone: Name: Name 2: Email: Email: Phone #: Phone:
Email:
Name 2: Name 3:Email: Email: Phone #: Phone:Name 3:
Phone #: Cooler Information:
Contact:
2 sampling events: JULY 26-27 2016 and SEPT 21-22 2016
7/26/2016 7/29/2016 Address:9/21/2016 9/23/2016 Phone #:
Shipping Acct:
Special Requests & Reporting Requirements:

Site Name:# of Samples Matrix Analyses Type Inorganic Analyses Organic Conc. Level Organic Analyses Asbestos Analyses Turnaround
Time
JULY14 Water Dissolved ESAT Method 200.7*
14 Water Dissolved ESAT Method 200.8**
14 Water Total ESAT Method 200.7*
14 Water Total ESAT Method 200.8**
14 Water N/A ESAT Anions
14 Water N/A ESAT Alkalinity
14 Water N/AESAT Calculated
Hardness
14 Water Total ESAT Mercury
14 Water Dissolved*** ESAT Mercury
14 Sediment Total ESAT Metals
14 Sediment Total ESAT Anions
14 Sediment Total ESAT Mercury
SEPTEMBER
14 Water Dissolved ESAT Method 200.7*
14 Water Dissolved ESAT Method 200.8**
14 Water Total ESAT Method 200.7*
14 Water Total ESAT Method 200.8**
14 Water N/A ESAT Anions
14 Water N/A ESAT Alkalinity
14 Water N/AESAT Calculated
Hardness
14 Water Total ESAT Mercury
14 Water Dissolved*** ESAT Mercury
10 Soil N/A ESAT Metals
10 Soil N/A ESAT Sulfate
Upper Uncompahgre River/Lake Como - 2016
*ESAT Requested EPA Method 200.7 analytes: Al, Ba, Be, Ca, Co, Fe, K, Mg, Mn, Na, Sr, Zn
**ESAT Requested EPA Method 200.8 analytes: Ag, As, Cd, Cr, Cu, Mo, Ni, Pb, Sb, Se, Tl, U, V, *** Analyze for dissolved mercury only if total mercury is detected

Site Name: Site ID:
Event: GPS
stream flows (or gauge reading)
latitude, longitude
# of Samples 14 14
Event: GPS
stream flows (or gauge reading)
latitude, longitude
# of Samples 14 1214
Field Parameters
14
Field ParametersSeptember
Upper Uncompahgre A888
pH, temperature, conductivitiy, DO
July
pH, temperature, conductivitiy, DO


![Quality Assurance Project Plan - University of Kentucky54] Water Distribution System Sampling QAPP...Quality Assurance Project Plan i ... SOP- Standard Operating Procedure SPADNS-](https://static.fdocuments.in/doc/165x107/5aa03bcc7f8b9a71178dc255/pdfquality-assurance-project-plan-university-of-54-water-distribution-system.jpg)


