Sampling and Analysis Plan - deq.state.or.us Sampling and Analysis Plan . SDMP Stormwater Discharge...
154
City of Portland, Oregon Water Pollution Control Facilities (WPCF) Permit For Class V Stormwater Underground Injection Control Systems Permit Number: 102830 Sampling and Analysis Plan Stormwater Underground Injection Control System Monitoring Final February 2006 Prepared By: City of Portland, Bureau of Environmental Services
Transcript of Sampling and Analysis Plan - deq.state.or.us Sampling and Analysis Plan . SDMP Stormwater Discharge...

City of Portland, Oregon Water Pollution Control Facilities (WPCF) Permit For Class V Stormwater Underground Injection Control Systems Permit Number: 102830 Sampling and Analysis Plan Stormwater Underground Injection Control System Monitoring Final February 2006 Prepared By: City of Portland, Bureau of Environmental Services

APPROVALS
Mary Stepf/Zt/b'cra
~ /:
I. Mary Wah . anager, BES Watershed Services12 Ao.r-o~ WkAaron Wieting, BES VIC Program Water PollutLaborat ry oordinator
~, .. ~-
Date
n Control
Peter Abrams, BES VIC Program Water Pollution ControlLaboratory Coordinator
Date
anager, BES Water Pollution Control Laboratory
Date
-""-""'" .
Doug H chi on, Supervisor, BES Field Opera I ns and StormEvent Coordinator
Sampling and Analysis Plan Distribution List
Rodney Weick, D EQ WPCF permit ManagerMary Stephens, VIC Program ManagerChuck Lytle, BES Laboratory ManagerRenee Chauvin, BES Laboratory Quality Assurance CoordinatorHoward Holmes, Test America, Contract Laboratory Project ManagerDoug Hutchinson, BES Field Operations Supervisor and Storm Event CoordinatorRandy Belston, BES Sampling CoordinatorAaron Wieting, BES Monitoring CoordinatorPeter Abrams , BES Monitoring CoordinatorRod Struck, BES Hydrogeologist
Final SAP Page ii

TABLE OF CONTENTS 1 Introduction and Organization .............................................. 1-1
1.1 Introduction and Purpose ............................................................................. 1-1
1.2 SAP Organization ........................................................................................ 1-1
1.3 Relationship to Other Plans ......................................................................... 1-2
1.4 SAP Modifications....................................................................................... 1-3
2 Goals and Objectives ............................................................ 2-1
2.1 Goals ............................................................................................................ 2-1
2.2 Objectives .................................................................................................... 2-1
3 Sampling Design .................................................................... 3-1
3.1 General Considerations................................................................................ 3-1
3.2 Determination of Representative Sample Size ............................................ 3-1
3.2.1 Proportion of UICs that May Exceed Pentachlorophenol MADL........... 3-2
3.2.2 Calculation of Representative Sample Size ............................................. 3-3
3.2.3 Sample Size Results................................................................................. 3-6
3.3 Stratification................................................................................................. 3-7
3.4 Design Method for Selection of Sampling Locations.................................. 3-8
4 UIC Sample Location Selection ............................................ 4-1
4.1 General......................................................................................................... 4-1
4.2 UIC System Characteristics ......................................................................... 4-1
4.3 UIC Sample Locations - Stationary Panel ................................................... 4-2
4.4 UIC Sample Locations - Rotating Panels .................................................... 4-8
4.4.1 Panel 1 – First and Sixth Years................................................................ 4-8
4.4.2 Panels 2 through 5.................................................................................. 4-10
4.5 Pre-Sampling Investigation and Field Inspection ...................................... 4-12
4.6 Sample Location Suitability....................................................................... 4-13
4.7 Replacement Locations - Oversample Panel ............................................. 4-13
5 Storm Event Targeting .......................................................... 5-1
5.1 Sampling Considerations ............................................................................. 5-1
5.2 Storm Event Criteria .................................................................................... 5-1
5.3 Weather Forecasting .................................................................................... 5-2
Final SAP Page iii

6 Sampling Staff ....................................................................... 6-1
6.1 General......................................................................................................... 6-1
6.2 Storm Event Coordinator ............................................................................. 6-1
6.3 Sampling Teams........................................................................................... 6-1
7 Field Sampling Procedures.................................................... 7-1
7.1 Personal Safety............................................................................................. 7-1
7.2 Sample Locations......................................................................................... 7-2
7.3 Analytical Schedule ..................................................................................... 7-3
7.4 Sampling Equipment Preparation ................................................................ 7-3
7.5 Sampling Equipment Decontamination ....................................................... 7-4
7.6 Sample Container Preparation ..................................................................... 7-4
7.7 Analytical Field Meter Calibration .............................................................. 7-7
7.8 Clean Sampling Techniques ........................................................................ 7-7
7.9 Sampling Location Access Procedures........................................................ 7-8
7.10 Sample Collection and Handling ................................................................. 7-8
7.11 Field Quality Control Sample Collection .................................................... 7-9
7.12 Sample Labeling ........................................................................................ 7-10
7.13 Field Parameter Measurement ................................................................... 7-11
7.14 Sample Collection Documentation ............................................................ 7-11
7.14.1 Daily Field Reports ................................................................................ 7-11
7.14.2 Field Data Sheets ................................................................................... 7-12
7.14.3 Chain of Custody ................................................................................... 7-12
7.14.4 Photographic Documentation................................................................. 7-13
7.15 Sample Transport and Delivery to the Laboratory .................................... 7-13
7.16 Change Notification ................................................................................... 7-14
7.16.1 Field Procedures..................................................................................... 7-14
7.16.2 Sample Waivers ..................................................................................... 7-14
8 References............................................................................. 8-1
Final SAP Page iv

LIST OF TABLES Table 3.1 Sample Size Selection..................................................................................... 3-5 Table 3.2 Vehicle Trips per Day and Predominant Land Use ........................................ 3-7 Table 3.3 Panel Sampling Schedule................................................................................ 3-9 Table 3.4 Number of Sampling Locations in Each Traffic Category Per Panel........... 3-11 Table 4.1: UIC Monitoring Location Information - Stationary Panel, Year 1, Panel 6. 4-5 Table 4.2: UIC System Summary Information - Stationary Panel, Year 1, Panel 6..... 4-7 Table 4.3: UIC Monitoring Location Information - Rotating Panel, Year 1, Panel 1 .. 4-8 Table 4.4: UIC System Summary Information - Rotating Panel, Year 1, Panel 1 ....... 4-9 Table 7.1 UIC Stormwater Analytes............................................................................... 7-3 Table 7.2 Stormwater Quality Analytes – Common Pollutants Monitoring .................. 7-5 Table 7.3 Stormwater Quality Analytes – Priority Pollutant Screen .............................. 7-6 Table 7.4 Minimum QC Samples for Field Sampling .................................................... 7-9 Table 7.5 UIC Sample Point Codes – Stationary Panel (Panel 6) ................................ 7-10 Table 7.6 UIC Sample Point Codes – Rotating Panel (Panel 1).................................. 7-11
LIST OF FIGURES Figure 3.1 Sample Size vs. Margin of Error.................................................................... 3-6 Figure 4.1 Schematic of Sedimentation Manhole and UIC............................................. 4-2 Figure 4.2 UIC Locations, City of Portland ................................................................... 4-3 Figure 4.3 2005-06 UIC Monitoring Locations, Panels 1 and 6 ..................................... 4-4
APPENDICES Appendix A 2005 Pilot Study Appendix B UIC Location Maps Appendix C UIC Oversample Locations Appendix D Standard Operating Procedures for Stormwater Monitoring Appendix E Health and Safety Plan Appendix F Field Sampling Forms
Final SAP Page v

LIST OF ACRONYMS BES Bureau of Environmental Services BMP Best Management Practices CAP Corrective Action Plan CFR Code of Federal Regulations CIP Capital Improvement Projects COC Chain of Custody CPR Cardiopulmonary Resuscitation CSE Confined space entry DEQ Oregon Department of Environmental Quality DFR Daily Field Report EOP End of pipe EPA Environmental Protection Agency ERF Extended Range Forecasting Company FDS Field Data Sheet FO field operations gpm gallons per minute GRTS Generalized Random Tessellation Stratified HASP Health and Safety Plan LCL Lower confidence limit MADL Maximum Allowable Discharge Limit NCA North Creek Analytical NHEERL National Health and Environmental Effects Research Laboratory NIST National Institute of Standards and Technology O&M Operations and Maintenance OAR Oregon Administrative Rule PRG Preliminary Remediation Goal PST Pacific Standard Time QAPP Quality Assurance Project Plan QC Quality Control ROW Right of way SAP Sampling and Analysis Plan SDMP Stormwater Discharge Monitoring Plan SOP Standard Operating Procedure SWDA Safe Drinking Water Act TPD Trips per day UCL Upper confidence limit
Final SAP Page vi

LIST OF ACRONYMS (continued) UIC Underground Injection Control UICMP UIC Management Plan VOC Volatile organic compound WPCF Water Pollution Control Facility WPCL Water Pollution Control Laboratory
Final SAP Page vii

This page intentionally left blank.
Final SAP Page viii

S11 IInnttrroodduuccttiioonn aanndd OOrrggaanniizzaattiioonn
1.1 Introduction and Purpose In 1974, Congress enacted Underground Injection Control (UIC) rules under the federal Safe Drinking Water Act (SDWA). These rules are administered by the U.S. Environmental Protection Agency (EPA) under 40 CFR 144 -148. EPA delegated UIC rule primacy to the Oregon Department of Environmental Quality (DEQ) in 1984. Federal UIC rules were modified in 1999. In response to the new federal rules, delegated states were required to update their state UIC rules within 270 days. DEQ promulgated revised UIC rules (Oregon Administrative Rules (OAR) 340-044) in September 2001. OAR 340-044 includes special requirements for municipalities with more than 50 UICs. As a result of these requirements, the City of Portland (City) conducted an inventory and system assessment and determined in conjunction with DEQ that a permit would be necessary for the continued operation of a number of the City-owned UICs. A Water Pollution Control Facilities (WPCF) permit was issued to the City by DEQ in June 2005 (DEQ Permit Number 102830). For the purposes of this Sampling and Analysis Plan (SAP), all references to “WPCF” or “permit” refer to this permit.
ection
1
The WPCF permit requires the City to monitor stormwater entering City-owned or operated UICs throughout the life of the permit (10 years or permit term). This SAP was prepared to meet the stormwater monitoring conditions established in the WPCF permit. It presents the overall methodology for selecting representative sampling locations, collecting stormwater samples, and performing laboratory analyses. The SAP will be used together with the Quality Assurance Project Plan (QAPP), dated August 2006 (City of Portland, 2006a), which describes quality assurance procedures to support the technical information, guide the monitoring efforts conducted by the City and ensure that quality control and consistency are maintained. The SAP and QAPP are integrally linked and together comprise the Stormwater Discharge Monitoring Plan (SDMP) required by the WPCF permit (City of Portland, 2006b).
1.2 SAP Organization This plan covers storm event targeting, sample collection methods, analytical procedures, data analysis and reporting, and heath and safety. The SAP is organized as follows:
• Section 1 Introduction and Organization; • Section 2 Goals and Objectives; • Section 3 Sampling Design; • Section 4 UIC Sample Location Selection; • Section 5 Storm Event Targeting; • Section 6 Sampling Staff; and • Section 7 Field Sampling Procedures.
The SAP specifies procedures for sampling design (i.e., selection of UIC monitoring network) and field sampling activities to assure data collected is of known quality and can be used to demonstrate permit compliance. Each section of the SAP describes a specific aspect of the UIC system-monitoring program. The appendices provide
Final SAP Page 1-1

supporting information to the SAP including: detailed maps showing UIC sampling locations; a project health and safety plan (HASP), field sampling forms, and standard operating procedures (SOPs) for the following:
• Weather Tracking and Monitoring Preparation; • Sampling Equipment Preparation; • Sampling Equipment Decontamination; • Sample Container Preparation; • Field Meter Calibration, Measurement and Maintenance; • Clean Sampling Rules; • Sampling Location Access; • Stormwater Grab Sampling; • Field Quality Control (QC) Sample Collection; • Sample Collection Documentation; and • Sample Transport and Delivery to the Laboratory.
1.3 Relationship to Other Plans The WPCF permit requires the City to prepare numerous plans describing how the permit conditions will be implemented. In addition to the SDMP, the following plans are required:
• UIC Closure, Decommissioning, and Abandonment Plan; • Corrective Action Plan (CAP); • Groundwater Monitoring Plan (if necessary); • UIC Management Plan (UICMP);
o UICMP Registration Database (separate submittal 9/1/05); o Operations and Maintenance (O&M) Plan; o Best Management Practices (BMPs) Monitoring Program Plan; o Employee Training and Public Education Plan; and o Spill Prevention and Pollution Control Plan.
The SAP is intended to describe the City’s UIC stormwater discharge-monitoring program to primarily demonstrate permit compliance. The SAP will be updated to include City-owned or operated UICs identified during the Systemwide Assessment required by the permit (e.g., sample locations).
Monitoring data collected in accordance with the SAP may be used to identify needed corrective actions, groundwater monitoring, or UIC closure under the appropriate plans. Data collected in accordance with O&M, UIC closure, groundwater, BMP effectiveness monitoring plans, or other plans developed for the UIC program may be used to supplement the compliance monitoring data set as appropriate. All data collected under the UIC program will be used to:
• Ensure that infiltration of stormwater runoff from urban areas through City-owned UIC structures is performed in a manner that protects the beneficial use of groundwater, including use of groundwater as a drinking water resource and protects watershed health;
Final SAP Page 1-2

• Develop and implement strategies and actions that contribute to achieving watershed goals, objectives, and targets;
• Meet regulatory mandates and permit requirements for all City-owned UICs; and • The UICMP, due to DEQ on December 1, 2006, will further describe the
relationship between the various plans in the context of the City’s UIC program.
1.4 SAP Modifications Potential changes or modifications to the SAP may be identified during sampling activities or during review and evaluation of the field and/or analytical data. Potential changes or modifications will be addressed either by revising the SAP or preparing addenda to the SAP. The revised SAP or addenda would describe both the need for the changes or modifications to the SAP and QAPP, and provide a description of planned activity and how it would be implemented (e.g., sampling and analyses). Potential modifications may include, but not be limited to, the following:
• Field procedures or analytical methods; • Collection of source identification data; • Collection of groundwater data; • Collection of BMP effectiveness monitoring data; and • Sampling design.
Proposed modifications to the DEQ approved SAP will be submitted to DEQ for review and approval in accordance with the permit modification requirements (OAR 340-045-0055). In addition, the City will:
a. Submit to the DEQ for approval any modification to the DEQ-approved plan (e.g., SAP, QAPP) within 30-days of the modification;
b. Have DEQ approval before implementing a modification, unless the modification is DEQ-directed; and
c. Include a summary of any modifications in the annual monitoring report.
Modifications to plans that do not change the basic intent of the DEQ approved plans or those with low environmental and public health significance, do not require DEQ to provide public notice or an opportunity for public participation. The following types of actions/modifications are considered “minor” or “Category 1” actions under Oregon WPCF rules and will not require public notice or participation, unless determined necessary by DEQ:
• Correction of typographical errors; • Selection of Panel 2 through 5 locations; • Incorporation of new data discovered/determined by UIC investigations/inspections,
complaint responses, systemwide assessment, etc.; • Incorporation of UICs constructed after the date of the permit issuance; • Increased sampling frequency or increased analytical testing; • Schedule changes not defined by the permit;
Final SAP Page 1-3

• Changes in City data management, evaluation methods, or annual report content; • Changes in field procedures or analytical methods; • Change in contract laboratory; • Collection and evaluation of source identification or corrective action data; • Collection and evaluation of groundwater data; • Collection and evaluation of BMP effectiveness monitoring data; • Change in data evaluation and trend analyses; or • Changes in City program staff.
The following types of actions/modifications are considered “major” and might be considered “Category 2” actions and may require public notice or participation, as determined by DEQ:
• Decreased sampling frequency or decreased analytical testing; • Significant change in UIC sampling program design; or • Change in Maximum Allowable Discharge Limit (MADL) concentrations.
When SAP addenda are prepared or updates to the SAP are made, a version number will be assigned and an official copy of the new version distributed to each person on the distribution list. A copy of each document (new and/or replaced) will be archived as documentation of past procedures.
Final SAP Page 1-4

S22 GGooaallss aanndd OObbjjeeccttiivveess
2.1 Goals The primary goal of the UIC monitoring program, which is to demonstrate compliance with the WPCF permit and existing rules and regulations, is only one aspect of the overall watershed goals that have been established by the City. This section discusses the goals of the UIC monitoring program, and the role of UIC monitoring in ensuring UICs are constructed and operated in a manner that provides multiple watershed benefits and protects groundwater now and over time.
ection
2
The 2004 City of Portland Framework for Integrated Management of Watershed Health establishes four specific goals related to watershed health. Three of the four goals are supported by the existence of the UICs and their proper functioning:
• Hydrology: Move toward normative flow conditions to protect and improve watershed and stream health, channel functions, and public health and safety. UICs help mimic the natural hydraulic cycle by infiltrating stormwater from impervious areas back into the ground and providing recharge for summer base flow volumes in streams.
• Physical Habitat: Protect, enhance and restore aquatic and terrestrial habitat conditions to support key ecological functions and improved productivity, diversity, capacity and distribution of native fish and wildlife populations and biological communities. UICs help prevent damage to riparian areas caused by increased stormwater discharges during rain events.
• Water Quality: Protect and improve surface water and groundwater quality to protect public health and support native fish and wildlife populations and biological communities. MADLs for stormwater ensure that UICs are operated in a manner that is protective of groundwater quality. UICs also benefit surface water quality by treating the stormwater prior to discharge and by providing cool base flow to surface waters in the summer months.
• Biologic Communities: Protect, enhance, manage and restore native aquatic and terrestrial species and biological communities to improve and maintain biodiversity in Portland’s watersheds. UICs contribute to healthy biological communities by helping restore a more natural hydrologic cycle, providing cool base flow in the summer months, reducing damage to physical habitat created by peak stormwater flows, and controlling and treating pollutants carried in stormwater before it is discharged to the ground.
2.2 Objectives The overall objective of the monitoring approach described in this SAP is to conduct monitoring and obtain data that demonstrate compliance with the permit standards and protection of groundwater to its highest beneficial use. Additionally, the approach outlined in this SAP will provide data that informs decision making for actions implemented to improve the overall health of the watershed as described in the goals
Final SAP Page 2-1

stated in the previous section. Specifically this monitoring effort is designed to satisfy the following objectives:
1. Monitor the quality of stormwater discharged into City-owned or operated UICs and demonstrate that groundwater is protected by not exceeding MADLs established in Table 1 of the WPCF permit. • Watershed benefits resulting from the use of City-owned or operated UICs are
demonstrated while groundwater quality is protected over time. Stormwater analytical results will be evaluated relative to the MADLs to assess potential risks to groundwater and trigger response actions necessary to protect groundwater.
2. Provide a high degree of confidence that cost effective sampling design is representative of all UICs covered by the permit. • The monitoring program presented in this SAP is based on statistical methods
designed specifically to characterize large systems with a high degree of confidence that the size and nature of the sample is appropriately representative of the entire system, including UICs that may be discovered during the UIC Systemwide Assessment (submitted July 2006) and UICs located within a 500-foot setback or within a 2-year time of travel of domestic, irrigation, or public drinking water wells
3. Provide data that will be used to conduct trend analysis of the stormwater quality discharged into City-owned or operated UICs. • Stationary and rotating sampling locations will be analyzed to determine if
trends in stormwater quality can be observed over the life of the permit. The presence or absence of stormwater quality trends will yield information vital to refining strategies and management actions that improve stormwater quality and watershed health. Trend analysis will be conducted for data collected over time (e.g., from year to year of the permit). Trends will also be evaluated by stratum, and within individual UICs. Additional details are included in the project QAPP (City of Portland, 2006).
4. Identify factors that strongly influence the quality of stormwater draining to City-owned or operated UICs to assist in enhancing protection of groundwater. • The UIC sampling plan presented in this SAP is stratified to examine the
influence of traffic volume as one of the principal factors that affects stormwater quality. Field reconnaissance will be conducted at the UIC sampling locations prior to initiating compliance monitoring, and field observations will be recorded during each UIC sampling event. These efforts will assist the City in determining the factors that may influence water quality, and identifying and selecting potentially applicable response actions needed to address UICs in which one or more analytes have been detected at or near MADLs or where an unacceptable risk to groundwater has been determined. This evaluation of water quality data in conjunction with source investigations will provide information necessary to identify, prioritize and manage the array
Final SAP Page 2-2

of sources that could present a threat to groundwater quality. In addition to the analysis of trends over time, a detailed stormwater quality analysis will examine associations and relationships among stormwater quality, identified sources of pollution and the effectiveness of structural and non-structural BMPs. Additional details are included in the project QAPP (City of Portland, 2006) and the BMP Monitoring Plan (currently under development and will be included in the UICMP due to DEQ by December1, 2006).
5. Evaluate the effectiveness of actions implemented to improve stormwater quality and comply with MADL concentrations. • Monitoring will occur at UIC sample locations (stationary and rotating) prior
to and subsequent to structural or non-structural actions taken to improve stormwater quality in order to comply with MADL concentrations. Over time, the monitoring data will provide information regarding the effectiveness of BMPs and other corrective actions implemented to protect groundwater and meet MADLs. BMP information gathered as part of UIC compliance monitoring is intended to augment data that will be collected in accordance the City’s BMP Monitoring Plan. This plan is under development and will be submitted to DEQ by December 1, 2006. The BMP monitoring plan will identify systematic monitoring actions necessary to characterize the ability of various structural and non-structural BMPs to achieve MADLs.
Final SAP Page 2-3

This page intentionally left blank.
Final SAP Page 2-4

S33 SSaammpplliinngg DDeessiiggnn
3.1 General Considerations Stormwater MADLs and other limits on the waters authorized to be injected in the UICs are established in the WPCF permit to protect the beneficial use of groundwater. The permit requires the City to implement a stormwater monitoring program that characterizes stormwater entering the City’s UIC system to compare stormwater data to the MADLs, and to otherwise operate the UICs in a manner that is protective of the beneficial use of groundwater.
ection
3
There are approximately 9,000 active, City-owned and operated UICs. It is not technically practicable or financially feasible to routinely collect and analyze stormwater from each of these UICs during every storm event. Therefore, statistical methods designed specifically to address this issue were applied to select a subset of UICs for monitoring with a high degree of confidence that the subset chosen is appropriately representative of the entire system. The entire system of UICs, including those that may be discovered during the UIC Systemwide Assessment (submitted in July 2006) and UICs determined to be within a 500-foot setback1 or within a 2-year time of travel of domestic, irrigation, or public drinking water wells is the “target population” that this sampling program intends to characterize. The permit requires that this target population, be divided into two traffic volume-based sub-populations, which are believed to be associated with different stormwater qualities. The lower traffic volume category (<1,000 trips per day) is presumed to be associated with lower pollutant concentrations. The higher traffic volume category (≥ 1,000 trips per day) is presumed to be associated with higher pollutant concentrations. The set of UICs selected for monitoring is referred to as the “sample” and is a representative subset of the target population. If the selected sample is representative of the entire UIC system, then the measured characteristics of this subset of all UICs can be inferred to apply to the entire system. This section of the document describes the procedures used to identify a representative sample of UICs from the target population.
3.2 Determination of Representative Sample Size To reliably determine the size of a statistically representative sample, the total number of UICs in the target population that are likely to show analyte exceedances above allowed levels must be estimated.
Between 2003 and 2005, the City conducted two pilot studies designed to provide data on the quality of stormwater discharged to City-owned or operated UICs. The second pilot study was based on more recent versions of the Draft Permit in which sub-populations were based on traffic volume and was intended to emulate draft permit requirements. See Appendix A for more details of this second pilot study. In this pilot study, stormwater 1 The City will develop an approach for further evaluating UICs determined to be within a 500-foot
setback or within a 2-year time of travel of domestic, irrigation, or public drinking water wells. This approach will be submitted to for DEQ review and approval.
Final SAP Page 3-1

from 16 UICs was tested for all analytes identified in the permit. The concentrations of these analytes were then compared to permit MADLs. The number of MADL exceedances in the pilot study was used to estimate the number of likely MADLs exceedances in the entire UIC population. This estimated value was then used to determine the number of UICs that must be sampled annually to provide water quality data that is statistically representative of the entire UIC system. The goal of determining the appropriate sample size is to select a number of sampling locations that will limit the amount of uncertainty associated with the estimate of the number of exceedances for the entire UIC system. To quantify the amount of uncertainty associated with the estimate, a confidence interval is applied to the projected value. The amount of uncertainty reflected in this confidence interval, in addition to the initial information from the pilot study, will determine the number of UICs required to provide a sample that is representative of the entire UIC system. A confidence interval consists of two numbers, a lower confidence limit and an upper confidence limit. The width of the interval defined by the lower and upper confidence limits as applied to the projected number of UICs describes the precision of the estimate and depends on the following:
• The pilot study estimate of the number of exceedances in the entire UIC system;
• The confidence level, which is the probability of the confidence interval containing the true number of UICs in exceedance in the entire sample population described in more detail later in this section; and
• The size of the sample.
The estimated total number of MADL exceedances selected for the entire population of UICs and the selected confidence interval were used to determine the size of a representative set of UICs, as described in Section 3.2.2
3.2.1 Proportion of UICs that May Exceed Pentachlorophenol MADL The results of the pilot study (see Appendix A) were used to estimate the total number of MADL exceedances that might be expected for the entire population of UICs. This pilot study data was used to estimate the number of UICs that might exceed acceptable analyte concentrations (i.e., MADLs), based on the concentrations of one analyte, pentachlorophenol. The City assumed that pentachlorophenol is one of the primary analytes of concern because, in the pilot studies, it had the highest number of detected exceedances of the MADL. By determining the sample size, based on the primary analyte of concern, the City ensures that there will be a sufficient number of sampling locations to evaluate analytes of less concern. As a more substantial data set is developed, other analytes may emerge as key concerns, and reassessment of the sample size may be necessary. The proportion of exceedances can be estimated by dividing the number of observed exceedances in the pilot study by the total number of UICs sampled in the pilot study. The proportion of exceedances is an estimate of the percentage of UICs that may be expected to exceed MADLs for an analyte of concern if the entire population of UICs
Final SAP Page 3-2

was sampled for that analyte. The estimate of proportion of exceedances will be used to determine the total number of UICs that must be sampled to ensure the City’s UIC monitoring is representative of the water quality entering UICs throughout the City. The proportion of exceedances of the pentachlorophenol MADL was estimated at 0.081 (i.e., an estimated 8.1% of all the City-owned UICs may exceed the MADL for pentachlorophenol). By using pilot study data to estimate the proportion of exceedances, the first step in determining a representative sample size is complete. The next step is to calculate the size of the sample based on the preset values for the confidence level and width of the confidence interval.
3.2.2 Calculation of Representative Sample Size The sample size, ‘n’, for the UIC monitoring network was calculated using a method established by Agresti and Coull (1998). The sample size was selected to be representative of the entire City owned and operated UIC system, based on a specified confidence level, interval width, and the estimated proportion of UICs exceeding a selected MADL. The true proportion of UICs in exceedance is unknown and cannot be determined unless all UICs are sampled routinely (which is technically impracticable and cost-prohibitive). However, a confidence interval, calculated from sample data, contains the true unknown proportion of exceedances with a specified probability. This probability is called a confidence level. For example, a 90% confidence interval contains the true proportion of UICs in exceedance from the entire system with a 90% probability. A 90% confidence level is commonly used in environmental statistics. The width of the confidence interval embodies how precise the estimate actually is by providing upper and lower bounds. The half-width of the confidence interval is the distance between the estimated proportion of exceedances and upper and lower confidence limits. A 90% confidence level and a 12% half width are used by the EPA Environmental Monitoring and Assessment Program (http://www.epa.gov/owow/monitoring/elements/elements.html) in order to detect a 2% per year change in observed monitoring value within 10 years. BES worked with Dr. Anthony R. Olsen (EPA National Health and Environmental Effects Research Laboratory in Corvallis, Oregon) to determine an appropriate sample size. The sample size, n, was selected using a confidence interval of 90%; a pre-specified margin of error and small probability (α) of exceeding that error. The pre-specified margin of error is 12%, also referred to as “precision”, was initially recommended Dr. Olsen. The probability of exceeding the margin of error is related to the confidence level: confidence level = 100(1- α)%. This implies that α=10% if the confidence level=90%. If α=10%, this means that there is a 10% (i.e., 1 in 10) chance that the difference between the estimate of the proportion of exceedances and the true but unknown proportion of exceedances is greater than or equal to 12%. To calculate the appropriate sample size, the following equation is solved for n such that the confidence level is 90% and the half-width of the confidence interval for the estimate for the proportion of exceedances is 12 % (Agresti and Coull, 1998):
Final SAP Page 3-3

( )
nz
nnzpp
zn
zp
LCL 22/
22/
2/
22/
1
4/ˆ1ˆ2
ˆ
α
αα
α
+
+−−⎥
⎦
⎤⎢⎣
⎡+
=
( )
nz
nnzpp
zn
zp
UCL 22/
22/
2/
22/
1
4/ˆ1ˆ2
ˆ
α
αα
α
+
+−+⎥
⎦
⎤⎢⎣
⎡+
=
where: LCL is the lower confidence limit. UCL is the upper confidence limit. n is the sample size. p̂ is the observed proportion of exceedances of pentachlorophenol from the pilot
study ( = 0.081). p̂
2/αz is the z-statistic from the standard normal distribution for the 100(1-α) % confidence interval. For a 90% confidence interval, α will be set at 0.1, thus
= 1.645. 2/αz
Half-width of the confidence interval is determined by the maximum absolute difference between and the LCL or the UCL (i.e., p̂ ( )UCLpLCLp −− ˆ,ˆmax . As stated earlier, the half-width is 12%. An iterative process is used to identify the appropriate values for n (sample size):
1. First selecting a size (n) to use in the above equations (e.g., set n = 25. Also use = 0.081 and = 1.645 to calculate LCL and UCL). p̂ 2/αz
2. Then calculate the maximum half-width: ( )UCLpLCLp −− ˆ,ˆmax . If the half-width is greater than 12%, then increase n and repeat the process until a half-width of 12% is achieved.
Table 3.1 presents an evaluation of confidence intervals and margin of error, based on sample size using both a 90% and 95% confidence level.
Final SAP Page 3-4

Table 3.1 Sample Size Selection
90% Confidence Level 95% Confidence Level Sample Size CI* ME** CI ME
29 2.9, 20.4% 12.3% 2.5, 23.5% 15.4% 30 3.0, 20.1% 12.0% 2.5, 23.2% 15.1% 31 3.0, 19.9% 11.3% 2.6, 22.9% 14.8% … 35 3.2, 19.0% 10.9% 2.7, 21.8% 13.7% … 40 3.4, 18.1% 10.0% 2.9, 20.6% 12.5% 41 3.4, 18.0% 9.9% 2.9, 20.4% 12.3% 42 3.5, 17.8% 9.7% 3.0, 20.3% 12.2% 43 3.5, 17.7% 9.6% 3.0, 20.1% 12.0% 44 3.5, 17.5% 9.4% 3.0, 19.9% 11.8% 45 3.6, 17.4% 9.3% 3.1, 19.7% 11.6% 46 3.6, 17.3% 9.2% 3.1, 19.6% 11.5% 47 3.6, 17.1% 9.0% 3.1, 19.4% 11.3% 48 3.6, 17.0% 8.9% 3.2, 19.3% 11.2% 49 3.7, 16.9% 8.8% 3.2, 19.1% 11.0% 50 3.7, 16.8% 8.7% 3.2, 19.0% 10.9% Notes: * CI = Confidence Interval: lower confidence limit, upper confidence limit. Confidence
intervals are not symmetric about , because we are using more exact methods, not normal approximation methods. The greater margin of error is between and the upper confidence limit, as compared to the lower confidence limit.
p̂p̂
** ME = Margin of Error = UCL - p̂UCL = upper confidence limit p̂ = estimated percentage of exceedances = 8.1%.
Shaded cells round to 12% margin of error/“precision”. Figure 3-1 presents a graph of sample size versus the margin of error for three confidence intervals (90%, 95%, and 99%). This figure shows that as the margin of error decreases towards zero, the difference in sample size increases between the 90%, 95%, and 99% confidence intervals with only very small improvements in precision obtained. For example, in order to maintain, a margin of error of 12% for confidence interval for the population proportion of exceedances, an increase in confidence interval from 90% to 95%, would increase the sample size from about 29 to 41 samples.
Final SAP Page 3-5

Figure 3.1
3.2.3 Sample Size Results The sample size was selected using the results presented in Figure 3.1 and Table 3.1 and an evaluation of estimated annual monitoring costs. The sample size was selected by assessing the potential gain in precision (either by increasing the confidence interval and/or decreasing the precision half-width) with increased monitoring costs. The following examples show that either decreasing the half-width and/or increasing the confidence levels result in an increased annual monitoring costs above the estimated costs of the selected parameters (n = 30, 90% confidence level, 12% half width):
• 90% confidence level and a 12% half width, n = 30, upper confidence limit 20.1% exceedance (approx. 1,800 City-owned or operated UICs), selected as the basis of the sample design and for comparison of monitoring costs.
• 90% confidence and a 10.0% half width, n = 40, upper confidence limit 18.1% exceedance (approx 1,600 City-owned or operated UICs), increased annual cost $72,930.
• 90% confidence and a 5.0% half-width, n = 122, upper confidence limit 13.1% exceedance (approx 1,200 City-owned or operated UICs), increased annual cost $676,260.
Final SAP Page 3-6

• 95% confidence and a 12.0% half-width, n = 43, upper confidence limit 20.1% exceedance (approx 1,800 City-owned or operated UICs), increased annual cost $99,450.
• 95% confidence and a 10.0% half-width, n = 57, upper confidence limit 18.1% exceedance (approx 1,600 City-owned or operated UICs), increased annual cost $198,900.
• 95% confidence and a 5.0% half-width, n = 173, upper confidence limit 13.1% exceedance (approx 1,200 City-owned or operated UICs), increased annual cost $1,047,540.
Using a 90% confidence interval and 12% half width, a sample size of 30 was selected, since the limited gains in precision do not appear to be cost effective. This provides an upper confidence limit on the number of City-owned or operated UICs that exceed the pentachlorophenol MADL of 20.1% (i.e., approximately 1,670 City-owned or operated UICs may potentially exceed the MADL). This means that sampling 30 UIC locations annually will provide an estimate of the proportion of exceedances with 90% confidence and 12% confidence interval half-width and detect a 2% per year change in an observed monitoring value within 10 years. Another way to look at the selected sample size is that there is a 10% (i.e., 1 in 10) chance that the true percentage of exceedances is not within the confidence interval (3.0%, 20.1%). The proportion of exceedances was calculated for pentachlorophenol, the analyte with the most number of detected exceedances of the MADL in the pilot study. Basing the sample on the analyte of most concern in terms of MADL exceedances will help to ensure the size of the sample will be sufficient for analysis of all other analytes evaluated. As a more substantial data set is developed, other analytes may emerge as key concerns, and reassessment of the sample size may be necessary.
3.3 Stratification Once the sample size was determined, the sampling design was stratified in accordance with the two traffic volume categories identified in Table 2 of the WPCF permit and presented below in Table 3.1.
Table 3.2 Vehicle Trips per Day and Predominant Land Use
Vehicle Trips per Day (TPD) Predominant Land Use
<1,000 Residential Streets; Small Parking Lot
≥1,000 Residential Feeder Streets; Commercially Zoned Areas; Transportation Corridors; Industrial Areas
Of the active City-owned and operated UICs, approximately 57% are in the <1,000 TPD category and 43% are in the ≥1,000 TPD category. To allow enough data points in each traffic category for analysis, the sample locations will consist of 50% of UICs with <1,000 TPD and 50% with ≥1,000 TPD. Since the majority of active UICs are in the
Final SAP Page 3-7

<1,000 TPD category, which are predominantly in residential areas, the sample design is conservative as only 50% of the sample locations will be from the <1,000 TPD category. Correspondingly, the sample design will be overly representative of the UICs in the higher traffic category.
3.4 Design Method for Selection of Sampling Locations Once the size and stratification by traffic volume of the sample was determined, the sampling locations were identified. The Generalized Random Tessellation Stratified (GRTS) survey design developed by Dr. Don L. Stevens Jr. (Department of Statistics, Oregon State University) and Dr. Anthony R. Olsen (EPA National Health and Environmental Effects Research Laboratory (NHEERL)) was used to identify the 30 UIC locations that will comprise the annual sample. GRTS survey design is specifically designed to efficiently characterize a large system with many potential sampling locations, such as the City’s UIC system. It randomly selects sampling locations from a population of potential locations whose members are distributed over a large space in a manner that produces a spatially balanced sample. The GRTS method is designed for large-scale environmental sampling programs such as this WPCF permit. It allows for sampling some portions of the system more intensively than others. For example, the UICs in higher traffic category (≥ 1,000 TPD) will be over-represented in the sample as compared to their occurrence in the entire UIC system. In addition, the GRTS method can accommodate long-term monitoring programs whose objectives may or may not change over time. With a spatially balanced sample, important subpopulations may be identified throughout the course of monitoring and greater sampling efforts may be focused on these subpopulations if supported by a change in the program objectives. The GRTS method provides a statistically valid design that is representative of the City’s UIC system. Examples of some other applications of the GRTS survey design method by Dr. Olsen and the EPA NHEERL are the National Fish Tissue Contaminant Lake Survey, Clean Water Action Plan: Coastal Research and Monitoring Strategy and the Nanticoke Watershed Sampling in Maryland and Delaware.2 The goal of GRTS survey design is to generate a random selection of locations that are spatially balanced across the entire area containing all active UICs owned by the City. By assigning an “address” to each UIC, the following process takes place in order to ensure a spatially balanced random sample:
• Place random grids over the entire area of Portland containing active, City-owned UICs;
• Further partition the randomly placed grids into smaller grids, nested within the larger ones. Continue the nesting of grids until the smallest grid unit contains no more than one UIC location, thus, creating a hierarchy of grids;
• Each grid has an assigned number. Determine the “address” for each UIC with all of the assigned numbers of the nested grids containing a UIC station;
2 http://www.epa.gov/nheerl/arm/designpages/aqresmonitoring.htm
Final SAP Page 3-8

• Place the hierarchically randomized UICs on a line according to their “address;” and
• Select a systematic (evenly-spaced) sample from the UICs on the line using a random start position.
The City worked with Dr. Olsen to apply the GRTS survey design specifically to UICs owned and operated by the City. The GRTS method was used to select a sample consisting of six panels containing 15 sampling locations each and an oversample panel of 85 alternate locations. To perform long-term trend analysis and evaluate permit compliance, the sampling locations will be divided into both stationary and rotating panels. One panel is comprised of stationary (i.e., fixed) locations (Panel 6) and the other five panels will consist of the rotating locations (Panels 1 through 5). The 15 UICs in the stationary panel will be sampled during each event (i.e., five events per year) throughout the term of the permit (i.e., 10 years). The UICs in the five rotating panels will each be sampled twice each during the permit term. This will be accomplished by rotating the five panels annually between permit years 1 and 5 and again between permit years 6 and 10 ( i.e., there will be approximately 5 years between the two sampling events scheduled for each rotating panel). The WPCF permit requires analyses of Common Pollutants for all sampling events and Priority Pollutants (see Section 7.3) in years one, four, and nine from selected UICs. Table 3.2 presents the stormwater discharge-monitoring (stormwater sampling) schedule.
Table 3.3 Panel Sampling Schedule
Permit Yeara
Panels Wet Season
1 1 b, 6 b 2005 2 2, 6 2006 3 3. 6 2007 4 4 b, 6 2008 5 5, 6 2009 6 1, 6 2010 7 2, 6 2011 8 3, 6 2012 9 5b,c, 6 2013
10 4c, 6 2014 a The permit defines the wet season as October 1 through May 31. Therefore, permit year 1 is
labeled 2005 and is defined as October 1, 2005 – May 31, 2006; permit year 2 (i.e., wet season) is labeled 2006 and is defined as October 1, 2006 – May 31, 2007, etc.
b The permit requires sampling of Common Pollutants in all years and Priority Pollutants in years 1, 4, and 9.
c If sequential sampling (i.e., 1-5) were conducted after the first five years, panel 4 would be sampled twice for Priority Pollutants. In order to obtain a more robust set of data, the panel sampling sequencing was changed after year five so that Priority Pollutants are sampled at unique panels in years 1, 4, and 9.
Final SAP Page 3-9

In addition to the six panels, an oversample panel of 85 alternate locations will be compiled for Panels 2 through 5. If additional oversample locations are needed to generate replacement locations for Panels 2 through 5, the oversample panel will be regenerated on an as needed basis and would include all known UICs at the time. Locations from the oversample panel will be used to ensure an overall equal number of locations for each traffic category and will be used in case a substitution of an originally selected sampling location is required. The substitution protocol is discussed in Sections 4.5 and 4.7 of this document. New data from newly discovered or constructed UICS will be incorporated into the list of potential UIC sampling locations, as discussed in Section 4.5. Within each panel of 15 locations, there will be seven or eight sampling locations per traffic categories, as shown in Table 3.2. Although the panels will not have an equal number of locations per traffic category, the City will alternate between approximately seven and eight locations per year over the ten cycles of the permit to obtain an equal number of locations per traffic category. This will require using locations in the oversample panel. The method to ensure the specified number of locations in each category is as follows:
1. Determine the number of UICs in each traffic category in each panel as the panel is generated;
2. Replace an appropriate number of locations from the specific traffic category which exceeds the number planned for the subject panel (see Table 3.3) by selecting a replacement location from the oversample panel, following the order in which the locations appear in the oversample panel; and
3. Delete locations used or determined to be unsuitable for sampling from the list of oversample panel locations.
4. Perform a reconnaissance level verification of the estimated traffic category based on a site visit, review of PDOT traffic maps, and available aerial photographs.
5. Once a panel is selected and sampled, the panel will remain fixed unless a UIC is decommissioned or becomes unsuitable for sampling. When sampling the rotating panels a second time in years 6 through 10 of the permit, the traffic category of each UIC in the panel will be reevaluated. If the traffic category has changed since the initial sampling, the UIC will be sampled and the change will be documented in the annual Stormwater Discharge Monitoring report.
6. If significant changes are noted in traffic category during SAP implementation for a given panel, the City will attempt to maintain the overall balance between <1,000 and >1,000 TPD over the life of the permit by balancing the subsequent years panel.
Final SAP Page 3-10

Table 3.4 Number of Sampling Locations in Each Traffic Category Per Panel
Panel Number of locations in <1,000 TPD Number of locations in ≥1,000 TPD 1 a Planned 7/ Actual 9 Planned 8 / Actual 6 2 6 9 3 7 8 4 8 7 5 7 8 6 a 8 7
Total 45 45
a Year 1 (2005-2006) was planned to include 15 UICs (total of Panel 1 and 6) with <1,000 TPD and 15 UICs (total of Panel 1 and 6)with >1,000 TPD. However, during the implementation of Year 1 monitoring program, the City’s Bureau of Transportation (PDOT) initiated a new method for estimating traffic volume. This method allowed the City to more precisely estimate the traffic volume near UIC monitoring locations. The use of the new method resulted in recategorizing the traffic volume for five UIC locations: P6_2, P6_3, P6_8, P1_6, and P1_9. Each of these five locations was recategorized from >1,000 TPD to <1,000 TPD. In year 2, Panel 6 will be modified to obtain the desired traffic category split, and Panel 2 will be adjusted to obtain the 50/50 traffic category split when combined with Panel 1.
Each year, a total of 30 UICs will be monitored. After five years 75 rotating locations will be sampled once and after 10 years they will be sampled twice. A total of 90 unique locations will be monitored over the permit term (15 stationary plus 75 (5×15) rotating locations).
Final SAP Page 3-11

This page intentionally left blank.
Final SAP Page 3-12

S44 UUIICC SSaammppllee LLooccaattiioonn SSeelleeccttiioonn
4.1 General This section describes the general characteristics of City-owned UICs and describes the UIC locations selected for stormwater sampling. A total of 90 UIC locations will be monitored for permit compliance monitoring. Fifteen UIC locations (i.e., stationary panel) will be sampled every year and 75 UIC locations (i.e., rotating panels) will be sampled in two separate years during the period of the WPCF permit. Additional UIC locations will be selected each year and these will comprise the oversample panel. The oversample panel will be used to select new UIC locations for sites determined to be unsuitable for sampling (e.g., noncompliant, damaged, surcharging) or to replace UICs (in the randomly selected panels) that do not meet designated traffic category to meet the sample stratification presented in Table 3.3. The oversample panel is further discussed in Section 4.7.
ection
4
4.2 UIC System Characteristics The City Stormwater Management Manual (2004) requires a standard design (Figure 4.1) for UIC systems to facilitate maintenance and improve the quality of infiltrated stormwater. The design includes a sedimentation manhole upstream of the stormwater infiltration UIC. Sedimentation manholes are not UICs. They are solid concrete cylinders generally three to four feet in diameter and 10 feet deep used to provide pretreatment of stormwater prior to discharge to the UIC. The standard design includes a “bent elbow” drainpipe that leads from the sedimentation manhole to the infiltration sump to allow for withdrawal of water in the sedimentation manhole from below the water surface. Sedimentation manholes protect water quality by allowing sediment in the stormwater to settle before stormwater enters the UIC and by preventing oil and grease, which generally float on water, from flowing into the UIC.
The UICs are generally three feet to four feet in diameter and range in depth from a minimum of two feet up to 40 feet. Most of the newer UICs (early 1990s and later) in the City are approximately 30 feet deep. Older UICs are between 18 feet and 30 feet deep. The City became responsible for most of the older UICs as a result of annexation from Multnomah County. These Multnomah County UICs were constructed in accordance with the County’s design standards and many of these UICs did not include sedimentation manholes.
In accordance with the WPCF permit, the monitoring compliance point (and therefore, the point where monitoring is to be conducted to demonstrate compliance) is the end of pipe (EOP) discharge of stormwater into the UIC downstream of any pretreatment device (e.g., sediment manhole).
Final SAP Page 4-1

Figure 4.1 Schematic of Sedimentation Manhole and UIC
Catch basin
Sedimentation Manhole
4.3 Theregeneravolumat leas4.2 prmonit4.4). ACity, aUIC inUIC is
Final S
Grab samples arecollected at inlet to the UIC (i.e., end of pipe)
UIC
UIC Sample Locations - Stationary Panel are 15 UICs in the stationary panel (i.e., Panel 6). These locations were randomly ted using the GRTS process described in Section 3.4 and selected on traffic e (See Section 3.3 – Stratification). The selected locations will be sampled during t five qualifying storm events each year throughout the term of the permit. Figure esents a citywide overview of all UIC locations. Figure 4.3 presents UIC oring locations for Panel 6 and Panel 1 (the rotating panel is discussed in Section
ppendix B provides detailed maps showing both UIC locations by sector of the nd individual UIC locations. Table 4.1 presents location information about each Panel 6. Characteristics and maintenance information for each stationary Panel 6 provided in Table 4.2.
AP Page 4-2

Final SAP Page 4-3

Final SAP Page 4-4

Final SAP Page 4-5
Panel 6 includes seven UICs with traffic counts <1,000 trips per day and eight UICs with traffic counts >1,000 trips per day (See Table 3.3). The panel also includes the following predominant types of land uses: residential (8 UICs); commercial (2 UICs); manufacturing (3 UICs); parks and open space (1 UIC); and industrial (1 UIC). The randomized sampling approach will provide data and field information to identify those factors that may correlate with or be affecting certain pollutants. For pollutants that exceed their respective MADL, BES will further evaluate potential pollutant sources and implement response actions in accordance with the permit.
Table 4.1: UIC Monitoring Location Information - Stationary Panel, Year 1, Panel 6
Location Code Approximate Address a Estimated
TPD Predominant
Land Use DEQ UIC
No. BES UIC
No.bLatitude / Longitude
45.49676/ P6-1 3500 SE 112th Ave. 25,838 COM 6707 ADW577 -122.54801
45.57035/ P6-2 940 NE Portland Blvd. 564* SFR 2747 ADP355 -122.65526
45.55605/ P6-3 4541 NE 80th Ave. 0* SFR 3192 ADQ337 -122.58071
45.47471/ P6-4 9090 SE Claybourne St. 393 SFR 5070 ADT961 -122.56991
45.50410/ P6-5 2513 SE 153rd Ave. 36,904 MFR 6590 ADS740 -122.50598
45.56048/ P6-6 5201 N. Emerson Dr. 0 SFR 3311 ADV395 -122.69658
45.52779/ P6-7 608 NE 87th Ave. a 729 MFR 1608 ADV645 -122.57361
45.57613/ P6-8 10064 SE Woodstock
Blvd. 795* IND 5448 ADV169 -122.56014 45.49604/
P6-9 3617 SE 168th Ave. 557 SFR 6117 ADT531 -122.48968 45.55718/
P6-10 10720 NE Wygant St. 969 MFR 3581 ADQ411 -122.55228 45.55440/
P6-11 1406 NE Skidmore St. 648 SFR 3605 AAU014 -122.65157 45.50083/
P6-12 2913 SE 118th Ave. a 378 SFR 6739 ADS602 -122.54219 45.45245/
P6-13 14350 NE Knott St. 291 SFR 4296 ADW213 -122.51430 45.55559/
P6-14 4289 NE Prescott St. a 8,100 COM 3510 ADQ252 -122.61931 45.52646/
P6-15 13500 NE Glisan St. 19,380 POS 8422 ADR767 -122.52461

Final SAP Page 4-6
Table 4.1 notes: a Street address changed in BES Hansen Database since this UIC was selected for sampling (February
2006 SAP) as a Year 1 monitoring location. Addresses should not be considered precise location information and are subject to change as City staff better describe the physical UIC locations relative to nearby properties. UIC Street addresses are assigned relative to nearby properties for general locating purposes and are not specific to a given UIC. Latitude and longitude should be relied up for accurate locating of UICs and sedimentation manholes.
b BES UIC number is obtained from the BES Hansen database * TPD estimate has changed since this location was selected for Year 1 Sampling. See Section 3.1.2. TPD = trips per day MFR = manufacturing SFR = single family residential NA = information not available IND = industrial COM = commercial POS = parks & open space UIC ADR767 drains a roadway adjacent to Glendover Golf Course

Table 4.2: UIC System Summary Information - Stationary Panel, Year 1, Panel 6
Panel No.
BES UIC No.a
UIC Depth
Pretreatment System
Separation Distance b
Date of Last Maintenance
Maintenance Performed
Sediment Level (ft)c
P6-1 ADW577 18.0 Sed MHd 64 1/9/2006 Cleaned UIC & Sed MH
4
P6-2 ADP355 30.0 Sed MH 96 1/10/2002 Cleaned UIC & Sed MH
NA
P6-3 ADQ337 30.0 Sed MH 72 2/28/2005 Raise UIC/sed system to grade
(approx. 8")
NA
P6-4 ADT961 30.0 Sed MH 11 9/30/2000 Cleaned UIC & Sed MH
NA
P6-5 ADS740 30.1 Sed MH 26 8/5/2004 Cleaned UIC & Sed MH
NA
P6-6 ADV395 19.0 No Sed MH 26 1/9/2006 Cleaned UIC 6
P6-7 ADV645 21.0 No Sed MH 148 1/6/2006 3/24/2006
Cleaned UIC Cleaned UIC
6 1
P6-8 ADV169 25.0 Sed MH 7 3/24/2006 Cleaned UIC & Sed MH
7.7
P6-9 ADT531 30.0 Sed MH 26 11/24/2003 Cleaned UIC & Sed MH
NA
P6-10 ADQ411 29.0 Sed MH 47 3/29/2006 Cleaned UIC & Sed MH
2.0
P6-11 AAU014 30.0 Sed MH 160 3/7/2002 Cleaned UIC & Sed MH
NA
P6-12 ADS602 30.0 Sed MH 52.0 9/30/2000 Cleaned UIC & Sed MH
NA
P6-13 ADW213 19.6 No Sed MH 95 3/25/2000 Cleaned UIC NA
P6-14 ADQ252 26.8 Sed MH 156 3/2/2006 Cleaned UIC & Sed MH
3.5
P6-15 ADR767 28.7 Sed MH 94 3/1/2006 Cleaned UIC & Sed MH
5.5
Table 4.2 notes: a The BES UIC number is the node number and is obtained from the BES Hansen database. b The separation distance is defined as the approximate depth in feet from the bottom-most perforation
in the UIC to the approximate seasonal-high groundwater level. The bottom-most perforation is defined as the bottom of the UIC – 2 feet. Two feet were added to all separation distance calculations to account for the standard depth of the sediment trap ring on standard City UIC design. This information is reported to DEQ by the City as “Depth to groundwater” (UIC Database Report) for inclusion in DEQ’s UIC database. Information updated from Hansen on July 07, 2006.
c Sediment level represents “feet of sediment removed” as measured prior to cleaning; NA = information not available.
d Sed MH = sedimentation manhole Final SAP Page 4-7

Final SAP Page 4-8
4.4 UIC Sample Locations - Rotating Panels
4.4.1 Panel 1 – First and Sixth Years There are five rotating panels (Panels 1 through 5). These locations were selected based on traffic volume (See Section 3.3 – Stratification) and randomly generated locations using the GRTS process described in Section 3.4. UICs in Panel 1 will be sampled during at least five qualifying storm events during the first and sixth years of the permit (See Table 3-2). Figure 4.2 presents a citywide overview of the Panel 1 sampling locations. Appendix B provides detailed maps showing individual UIC locations. Table 4.3 presents location information about each UIC in Panel 1. UIC characteristics and maintenance information for each Panel 1 location is provided in Table 4.4.
Table 4.3: UIC Monitoring Location Information - Rotating Panel, Year 1, Panel 1
Estimated Location Code Approximate Address a
TPD Predominant
Land Use DEQ
UIC No. BES
UIC No.bLatitude/ Longitude
45.58146/ P1-1 6940 N. Macrum Ave. 325 SFR 2235 AAG769 -122.73663
45.57536/ P1-2 2510 N. Buffalo St. 248 SFR 2659 ADP173 -122.69332
45.55024/ P1-3 3716 NE 112th Ave. 1,187 SFR 4037 ADQ980 -122.54751
45.47135/ P1-4 7120 SE 67th Ave. 707 SFR 4997 ADT881 -122.59421
45.47259/ P1-5 7002 SE 45th Ave. 6,164 SFR 5143 ADT773 -122.61601
45.50927/ P1-6 1840 SE 164th Ave. 107* SFR 7170 ADS508 -122.49520
45.53736/ P1-7 6433 NE Tillamook St. a 1,960 POS 4564 ADR184 -122.59661
45.52152/ P1-8 20 SE 160th Ave. 578 MFR 8121 ADS110 -122.49900
45.55773/ P1-9 4740 NE 57th Ave. 385* SFR 1796 ADQ277 -122.60441
45.52248/ P1-10 10634 E Burnside St. a 9,519 MFR 8165 ADR905 -122.55327
45.51475/ P1-11 1160 SE 140th Ave. <1,000 SFR 1418 ADT118 -122.51967
45.52236/ P1-12 15839 E Burnside St. 7,704 MFR 884 ANB209 -122.50034
Table 4.3 continued on next page.

Final SAP Page 4-9
Table 4.3: UIC Monitoring Location Information - Rotating Panel, Year 1, Panel 1 Location
Code Approximate Address a Estimated Predominant Land Use
DEQ UIC No.
BES UIC No.b
Latitude/ Longitude 45.58215/
P1-13 6507 N Princeton St. a 212 SFR 2240 ADN651 -122.73519 45.55542/
P1-14 7380 NE Prescott St. 8,844 SFR 3967 ADQ898 -122.58697 45.56741/
P1-15 6125 N Mississippi Ave. a 356 SFR 1785 ADP561 -122.67594
Table 4.3 notes: a Street address changed in BES Hansen Database since this UIC was selected as a Year 1 monitoring
location. Addresses should not be considered precise location information and are subject to change as City staff better describe the physical UIC locations relative to nearby properties. UIC Street addresses are assigned relative to nearby properties for general locating purposes and are not specific to a given UIC. Latitude and longitude should be relied up for accurate locating of UICs and sedimentation manholes.
b BES UIC number is obtained from the BES Hansen database * TPD estimate has changed since this location was selected in the SAP. See Section 3.1.2.
TPD = trips per day MFR = manufacturing SFR = single family residential NA = information not available IND = industrial COM = commercial POS = parks & open space
Panel 1 includes nine UIC with traffic counts <1,000 trips per day and six UICs with traffic counts >1,000 trips per day (See Table 3.3). The panel also includes the following predominate types of land uses: residential (11 UICs); manufacturing (2 UICs); parks and open space (1 UIC); and industrial (1 UIC). The randomized sampling approach will provide data and field information to identify those factors that may correlate with or be affecting certain pollutants. For pollutants that exceed their respective MADL, BES will further evaluate potential pollutant sources and implement response actions in accordance with the permit.
Table 4.4: UIC System Summary Information - Rotating Panel, Year 1, Panel 1
Panel No. BES UIC No.a
UIC Depth
Pretreatment System
Separation Distance b
Date of Last Maintenance
Maintenance Performed
Sediment Level (ft)c
P1-1 AAG769 31.0 Sed MH d 73 3/13/2006 Cleaned UIC & Sed MH
4
P1-2 ADP173 30.0 Sed MH 82 1/27/2001 Cleaned UIC & Sed MH
NA
P1-3 ADQ980 26.0 Sed MH 93 NA NA NA
P1-4 ADT881 31.0 Sed MH 70 5/1/2001 Cleaned UIC & Sed MH
NA
Table 4.4 continued on next page.

Final SAP Page 4-10
Table 4.4: UIC System Summary Information - Rotating Panel, Year 1, Panel 1
Panel No. BES UIC No.a
UIC Depth
Pretreatment System
Separation Distance b
Date of Last Maintenance
Maintenance Performed
Sediment Level (ft)c
P1-5 ADT773 30.0 Sed MH 88 4/6/2006 Cleaned UIC & Sed MH
3.5
P1-6 ADS508 21.5 Sed MH 31 1/28/04 Cleaned UIC & Sed MH
NA
P1-7 ADR184 30.0 Sed MH 119 6/8/2005 Cleaned UIC & Sed MH
NA
P1-8 ADS110 30.0 Sed MH 54 6/14/2006 Cleaned UIC & Sed MH
NA
P1-9 ADQ277 30.5 Sed MH 128 4/7/2006 Cleaned UIC & Sed MH
NA
P1-10 ADR905 NA No Sed MH 118 3/9/2006 Cleaned UIC 0
P1-11 ADT118 30.0 Sed MH 58 12/4/2002 Cleaned UIC & Sed MH
NA
P1-12 ANB209 NA No Sed MH 64 NA NA NA
P1-13 ADN651 30.8 Sed MH 85 12/1/2000 Cleaned UIC & Sed MH
NA
P1-14 ADQ898 27.8 Sed MH 93 9/28/2001 Cleaned UIC & Sed MH
NA
P1-15 ADP561 31.0 Sed MH 102 9/16/2002 Cleaned UIC & Sed MH
NA
Table 4.4 notes: a The BES UIC number is obtained from the BES Hansen database b The separation distance is defined as the approximate depth in feet from the bottom-most perforation
in the UIC to the approximate seasonal-high groundwater level. The bottom-most perforation is defined as the bottom of the UIC – 2 feet. Two feet were added to all separation distance calculations to account for the standard depth of the sediment trap ring on standard City UIC design. This information is reported to DEQ by the City as “Depth to groundwater” (UIC Database Report) for inclusion in DEQ’s UIC database. Information updated from Hansen on July 7, 2006. Sed MH = sedimentation manhole
c Sediment level represents “feet of sediment removed” as measured prior to cleaning; NA = information not available.
d Sed MH = sedimentation manhole
4.4.2 Panels 2 through 5 UICs for Panels 2 through 5 will be initially generated following completion of the Systemwide Assessment (submitted to DEQ in July 2006), however, the final UIC sampling locations to be sampled in permit years 2 though 5 will not be finalized until the year sampling is scheduled to begin. The permit requires evaluation of sampling locations on an annual basis. The permit (Schedule C(3)(b)) requires any City-owned or operated UIC discovered, identified. or constructed after the date of the permit, be

Final SAP Page 4-11
incorporated into the list of UICs for random selection3 (i.e., incorporated into the UIC monitoring program design and sample location selection). Panels 2 through 5 will be selected from the complete list of UICs identified during the Systemwide Assessment (completed July 2006). Selecting UICs for Panels 2 through 5 from this list is considered representative of the City’s entire UIC system given that all UICs have an equal probability of being selected and that the probability of a selecting a given UIC is very low. In addition, only 20 to 30 new City-owned or operated UICs are estimated to be installed or replaced on an annual basis within Portland’s UIC system. Therefore, the probability of selecting a new UIC in Panels 3 through 5 is very low. For Panel 2, the probability of selecting a given UIC for inclusion and sampling is approximately 1 in 9,000 (0.011%). By permit year 5, when the last rotating panel is finalized, it is estimated that there may be approximately 9,090 UICs. The probability of selecting any given UIC in year 5 is approximately equivalent to Year 2 (i.e., 1 in 9,090 or 0.011%). The probability of any new UIC being selected for Panel 5 is approximately 90 in 9090 or less than 1 %. Based on the low probability of selecting a new UIC for inclusion in Panels 3 through 5, Panels 2 through 5 will be generated in 2006 following completion of the Systemwide Assessment. Panels 3 through 5 will not be regenerated unless a significant number of new UICs are identified or constructed (e.g., >500 or probability greater than 5% of a new UIC being selected for sampling in permit years 3 through 5). It is anticipated that all panels may be regenerated upon permit renewal and will include any new UICs installed since completion of the Systemwide Assessment.
BES will track the installation of new UICs and submit information to DEQ on a quarterly basis as required by the permit. The following information is provided as part of the quarterly data basis updates:
• Number of new UICs installed or identified; • Predominant land use in vicinity of new UIC; • Traffic category in vicinity of new UIC; • Locations of new UICs; • Proximity of a new UIC to drinking water wells, irrigation wells, or 2-year time of
travel. This information will be used to assess whether the characteristics of the new UICs (traffic category, land use, geographic locations) are consistent with the assumptions made regarding the City’s UIC population in the sampling design (See Section 3). If it is determined that the new UIC locations are not adequately represented, the rotating sample locations (Panels 3 through 5) may be regenerated if they have not previously been sampled (i.e., permit years 3 through 5) or additional sample locations may be added. Final sampling locations (i.e., UIC identification) for Panels 2 through 5 will be identified during the summer months prior to the monitoring season (October 1 through May 31) in which they will be sampled. Sampling locations for Panels 2 through 5 will be randomly selected following the procedures described in Section 3.0 and may be modified to meet
3 The permit requires newly identified or constructed UICs be incorporates into the list of UICs used for random selection before the first wet season after discovery or identification, unless the UIC will be decommissioned within one full Capital Improvement Project (CIP) cycle after the discovery date.

Final SAP Page 4-12
the permit traffic stratification requirements (See Table 3.3), if necessary. . UIC locations will not be duplicated between panels. Prior to finalizing UIC locations for each panel, the UIC will be investigated and field verified, as described in Section 4.5. In addition, the estimated traffic category will be visually confirmed. If the traffic category appears to be significantly different that the traffic category estimated for that location, a new location will be selected from the oversample panel. Following field verification, BES will submit to DEQ, no later than September 1 of each year, a technical memorandum describing the final selection of the panel sample locations (i.e., Rotating Panel) for the upcoming wet season and the results of the field verification. Locations in Panels 1 through 5 will be monitored during years one through five of the permit and again in years six through ten (See Table 3-2). Once panel locations are defined and sampled, the same locations will be sampled during the second sampling of the rotating panels in the sixth through tenth year of the permit. In the event one or more of the UICs used in the first five years for compliance monitoring are decommissioned or for other reasons cannot be sampled during the sixth through tenth year of the permit, a replacement location will be selected following the procedures described in Section 4.7.
4.5 Pre-Sampling Investigation and Field Inspection Prior to sampling, each identified UIC sample location will be investigated and inspected for the purpose of determining if the UIC is suitable for sampling. The pre-sampling investigation will obtain and/or confirm the following information:
• The DEQ’s UIC Identification number; • The City’s UIC identification number; • Street address or intersection location; • Latitude and longitude in decimal degrees; • The type of construction; • Estimated separation distance (i.e., the approximate depth in feet from the bottom-
most perforation in the UIC to the approximate seasonal-high groundwater level based on BES or USGS groundwater elevation maps);
• Street classification taken from Portland Department of Transportation System Plan; and
• Predominant land use in UIC drainage area. The presampling field inspection will identify and/or confirm the following to the extent practicable:
• UIC accessibility; • Potential health and safety concerns for sampling activities (e.g., traffic, UIC
location, visibility (e.g., blind corners)); • General stormwater system condition; • Maintenance (e.g., cleaning) or repair needed prior to initiating sampling; • Depth of the UIC being sampled; • The type of pretreatment BMP (if any);

Final SAP Page 4-13
• Sediment depth in sedimentation manhole or in catch basins for UICs that do not have sedimentation manholes;
• Qualitative observations of traffic types (e.g., trucks, cars) and volume; and • Potential pollutant sources (e.g., site activities, construction, unimproved street) in
the estimated UIC drainage area.
4.6 Sample Location Suitability The results of either the pre-sampling investigation or field inspection will be used to determine whether or not a UIC location is unsuitable for sampling. UICs may be determined to be unsuitable for sampling, based on one of the following factors:
• Unsafe sampling conditions; • Incorrect traffic categorization; • Location already included in the monitoring program; • Physical barrier or denied access to the location; • UIC has been decommissioned; • Maintenance or repair needed prior to initiating sampling or conditions that
prevent collection of representative samples; • UIC does not receive adequate flow during rain events; • UIC is not compliant with the permit; • UIC location could not be found or no longer exists; and/or • UIC location is not a member of the target population (i.e., UIC does not capture
drainage from rights-of-way such as drinking fountain drains, aquifer storage and recovery wells, drains receiving potable water, trenches, roof drainage, etc.).
If a UIC is deemed unsuitable for sampling, a replacement UIC will be selected, following the process described in Section 4.7. UICs determined unsuitable for sampling will be reported in the Annual Monitoring Report.
4.7 Replacement Locations - Oversample Panel In the event, any UIC in Panels 1 through 6 is determined to be unsuitable for sampling (e.g., incorrect traffic categorization, decommissioned, unsafe conditions), based on the results of the pre-sampling investigation or field inspection described in Section 4.5, a replacement UIC (i.e., location) will be selected. Replacement locations will be selected using the following process:
• Each year of the permit, a list of potential replacement locations will be randomly generated using the processes described in Section 3. As described in Section 4.4.2, the permit (Schedule C(3)(b)) requires that any City-owned or operated UIC discovered, identified, or construction after the date of the permit, be incorporated into the list of UIC sampling sites for random selection. Therefore, an oversample panel will be regenerated each year;
• If it is determined that a UIC is unsuitable for sampling, a replacement UIC will be selected from the list;

• The replacement location will be selected by choosing the first UIC on the list with the same traffic category as the UIC being replaced; and
• The replacement UIC will be investigated and field verified as described in Section 4.5 to confirm its suitability for sampling.
Additional information regarding the location, separation distance, and system maintenance will be provided in the event that a UIC is used from the replacement panel. The information provided will be consistent with the information provided in Tables 4.3 and 4.4.
For permit year one (October 1, 2005 through May 31, 2006), a list of 85 potential replacement UIC locations was generated. The initial list of oversample locations and oversample locations used in the development of Panels 1 and 6 is provided in Appendix C. During the screening and field verification of potential Panel 1 and 6 sampling locations, sixteen locations were determined to be unsuitable for sampling and these locations were replaced by selecting the first location with a similar traffic categorization identified in the oversample table. Eight locations, identified in the preliminary lists for both Panels 1 and 6, were replaced in each of these panels using the oversample list.
Final SAP Page 4-14

S55 SSttoorrmm EEvveenntt TTaarrggeettiinngg
5.1 Sampling Considerations The City will collect five stormwater samples from each designated sampling location between October 1 and May 31 of each year, as required by the WPCF permit, unless conditions are encountered that are beyond the City’s reasonable control that prevent monitoring of five storm events within a wet season or analyzing any sample or pollutant parameter. The permit (Schedule B(3)) includes a sampling waiver for conditions beyond the City’s reasonable control. These conditions include atypical climatic conditions, weather conditions that would make collection or analysis of samples unsafe or impracticable, unavoidable equipment failure, or other conditions determined by DEQ to be beyond the City’s control.
ection
5 The City will plan to sample the first predicted storm occurring each fall in order to investigate any water quality differences that may be associated with the first significant rainfall of the fall season. The remaining four events will be distributed throughout the rest of the monitoring season as storm events allow.
The City will attempt to sample all 30 selected locations during the same storm. Since storms often fall short of predicted rainfall amounts and/or duration, there is a possibility that rainfall or runoff may cease prior to the collection of all 30 samples. If all locations cannot be sampled during a targeted storm, the remaining locations will be sampled during subsequent storms meeting the criteria defined below. Consequently, for purposes of the WPCF permit, a monitoring “event” may include numerous individual storms.
5.2 Storm Event Criteria Adhering to target storm event criteria, to the extent practicable, will help ensure that stormwater runoff will be adequate for sample collection, be representative of stormwater runoff, and be consistent between sampling events. Prior to initiating a sampling event, the storm will be predicted and evaluated against the criteria listed below to assess whether the predicted storm should be targeted as a potential compliance-sampling event. Based on the City’s extensive experience with stormwater monitoring in this region, storms meeting these criteria are expected to provide the volume of runoff necessary to implement sampling. Smaller storms, or storms of shorter duration, are considered to have a low probability of producing sufficient runoff to warrant the extensive preparation and mobilization time required for this project. It is likely that a targeted and sampled storm may not meet the criteria below when the sampling event is completed, or that unpredicted events will occur that do meet the criteria. Thus, the criteria will be used as general guidance to determine when forecasted storms should be targeted for sampling during this project. Storm event criteria are as follows:
• Predicted rainfall amount of ≥ 0.2 inches per storm; • Predicted rainfall duration ≥ 6 hours; and • Antecedent dry period ≥ 6 hours (as defined by <0.1 inches of precipitation over
the previous 6 hours).
Final SAP Page 5-1

The first stormwater discharge-sampling event will be targeted to occur during the first fall storm meeting the storm monitoring criteria. Storms meeting these criteria that were either unpredicted or were predicted to have less rainfall intensity or duration are not included as potential compliance sampling events.
Hourly and daily rainfall records are available for over 20 sites on the east side of Portland. This data is maintained in BES’s HYDRA Data Report System. This data is available on the web at: http://or.water.usgs.gov/non-usgs/bes/raingage_info/clickmap.html. Storm event characteristics for the five required sampling events will be documented and summarized in the annual monitoring report. In the event one or more storm events are waived due to atypical climatic conditions, representative climatic data will be provided to document these conditions.
5.3 Weather Forecasting The Storm Event Coordinator for this project is the BES Field Operation’s (FO) supervisor or a designated alternate. The Storm Event Coordinator is responsible for tracking storm events and reviewing consultant weather forecasts to determine if a predicted storm event is likely to meet the criteria for initiating a compliance sampling event. If the weather forecast predicts that the storm criteria will be met, then the Storm Event Coordinator is responsible for mobilizing the BES Sampling Teams and ultimately making the “Go/No-Go” decision.
Extended Range Forecasting (ERF) Company, Inc., a private Portland weather forecasting service, is the City’s weather consultant. The Storm Event Coordinator receives daily weather forecasts from ERF that have a 10-day forecast including quantity of precipitation forecasts for each day. ERF is available on an as needed, on–call basis for telephone consultations regarding pending events. When a candidate storm approaches, the Storm Event Coordinator will communicate frequently with ERF to make the determination to mobilize Sampling Teams to commence sampling operations. Refer to Standard Operating Procedures (SOP) SOP D-1 for more weather tracking information.
Final SAP Page 5-2

Section
6 66 SSaammpplliinngg SSttaaffff
6.1 General Sampling Staff refers to all personnel who are involved in logistical support, sample collection, traffic control, and safety during the actual storm event being monitored. At a minimum, the Sampling staff will include:
• Storm Event Coordinator (one person, can be remote); and • Event Sampling Teams.
6.2 Storm Event Coordinator The Storm Event Coordinator is responsible for tracking weather patterns and selecting the events to be monitored. These events may occur at any time during a 24-hour day, 7 days a week. The Storm Event Coordinator will work directly with the weather forecasting service, ERF, to obtain the latest weather forecasts and updates, and make the “Go/No-Go” decision.
The Storm Event Coordinator should notify the Sampling Teams and the analytical laboratory 72-hours in advance of a potential monitoring event. During the event, the Storm Event Coordinator directs sampling activities from a base station equipped with necessary equipment to track real-time weather conditions and dependable two-way communication with ERF and event Sampling Teams (via cell phone or radio). The Storm Event Coordinator for this project will be the Field Operations’ supervisor, or a designee.
6.3 Sampling Teams Multiple teams will likely be used during a single stormwater sampling event to decrease the length of field time and the number of individual storms needed to collect samples from all 30 UIC locations. Event Sampling Teams will be composed primarily of members of the City’s FO staff and supplemented by other WPCL or BES personnel, as needed. At least one team member will be an experienced FO staff member. Sampling Teams will be primarily two person teams (required for traffic control locations). Individual samplers may be used if no traffic control is required.
Field staff is required to read, understand and follow all procedures documented in the SAP. At a minimum, field-sampling personnel will be responsible for the following:
• Inspecting field sampling equipment prior to use to ensure that it is in proper working order and calibrated;
• Ensuring that all field sampling collection forms (e.g., Chain of Custody forms, Field Data Sheets) are properly and completely filled out; and
• Ensuring that samples are collected, stored, and delivered to the laboratory in accordance with the project SAP.
Final SAP Page 6-1

They are also responsible for performing all the field-sampling activities in accordance with the procedures and standards established in the project Health and Safety Plan (HASP, see Appendix E) and the QAPP (City of Portland, 2006).
Final SAP Page 6-2

S77 FFiieelldd SSaammpplliinngg PPrroocceedduurreess Guidelines for sample collection procedures have been developed for this project to provide data of sufficient quality to demonstrate permit compliance and/or evaluate potential risks to human health and the environment associated with urban stormwater discharges. SOPs were developed for tasks that are routinely performed by BES staff. SOPs are included in Appendix D. Adherence to the procedures described in this document and the project QAPP (City of Portland, 2006) will help assure consistency between stormwater sampling events and over the duration of the permit, and prevent sample contamination due to field activities. This section focuses primarily on field sampling procedures including:
ection
7 • Personal safety; • Sample locations; • Analytical schedule; • Sampling equipment preparation; • Sampling equipment decontamination; • Sampling container preparation; • Analytical field meter calibration; • Clean sampling techniques; • Sampling station access procedures; • Sample collection and handling; • Field QC sample collection; • Sample labeling; • Field parameter measurements; • Sample collection documentation; and • Sample transport and delivery to the laboratory.
7.1 Personal Safety The approved project-specific HASP, provided in Appendix E, will be reviewed and signed by all field personnel before the sampling operations covered in this SAP begin. For this project, all sampling locations are in urban areas, typically requiring traffic control. In addition, sample collection typically requires prolonged fieldwork hours and is often performed throughout the night and on weekends. Sleep deprivation, fatigue, increased exposure to drunken drivers, etc. are all increased risk factors that are associated with this type of work. Personal safety is of primary concern while conducting all stormwater sampling related activities. Given the hazardous nature of performing this type of stormwater sampling, at least one member of each Sampling Team should have the following certifications (at a minimum, to be able to identify and avoid hazards):
• 40-hour Hazmat training and annual 8-hour refreshers; • Confined Space Entry and Work Practices certification;
Final SAP Page 7-1

• Traffic Control and Flagging certification; and • First Aid and Cardiopulmonary Resuscitation (CPR) certification.
Persons involved in sampling will be made aware of the hazards associated with the fieldwork and be given the opportunity to freely voice any concerns, if potential hazards become apparent; if personal safety is an issue, sampling will be terminated. The following list provides basic health and safety recommendations specific to this project to minimize risks to sampling personnel: • Turn on Vehicle hazard lights and overhead yellow warning lights, prior to initiating
field activities; • Do not access sampling stations until traffic control has been established, if required.
A traffic control plan will be developed by the Sampling teams for each location requiring traffic control;
• At certain times of day, or during certain traffic scenarios (e.g., rush hour, delivery zone, police activity, etc.); it may not be possible to safely access a sampling location. If a location cannot be accessed safely or if a location becomes unsafe during sampling, proceed to other locations and return to the location later during the storm or a subsequent storms;
• Remove and replace manhole covers using a manhole cover puller. Sampling Teams should always wear steel-toed boots in the field;
• Never leave an open manhole unattended; and • Avoid confined space entries (CSEs). Since only grab sampling is required for this
project, no CSE should be required. Break the manhole plane with equipment only. Sampling staff will not enter any UIC or sediment manhole unless the sampling consists of two FO staff that are properly trained and have all of the necessary CSE equipment.
7.2 Sample Locations UIC sample locations for permit years one and six, are provided in Tables 4.1 (Panel 6 - stationary panel) and Table 4.3 (Panel 1 – Rotating Panel). Figure 4.2 presents a citywide overview of the Panel 1 and 6 UIC sampling locations. Appendix B provides detailed maps showing individual UIC locations. Sample locations for Panels 2 through 5 will be defined the year they are to be sampled. Sample locations for Panels 2 through 5 will be provided to DEQ and the BES Storm Event Coordinator by September 1 of each year. In accordance with the WPCF permit, the monitoring compliance point is the end-of-pipe (EOP). For UICs with no pretreatment device and more than one discharge pipe (e.g., drainage from two catch basins), the compliance sample will be collected from the discharge pipe with the largest estimated drainage catchment in the appropriate traffic category. If more than one discharge pipe is present, the location of the pipe sampled will be documented and described in each Sampling Team’s field folders so sampling will be conducted at the same discharge pipe during each event.
Final SAP Page 7-2

7.3 Analytical Schedule Stormwater samples will be collected at 30 representative UICs during five storm events between October 1 and May 31 each year and measured for the analytes listed in Table 7.1. The permit divides these analytes into two lists: Common and Priority Pollutant Screen. Common Pollutants will be analyzed for all events. Priority Pollutants are required by the permit in years one, four, and nine. If Priority Pollutants are detected, sampling is required for five storm events.
Table 7.1 UIC Stormwater Analytes
Common Pollutants Benzene Toluene
Ethylbenzene Xylenes2
Pentachlorophenol Di(2-
ethylhexyl)phthalate1
Benzo(a)pyrene
Arsenic (Total) Cadmium (Total) Chromium (Total)
Copper (Total) Lead (Total) Zinc (Total)
Nitrate-nitrogen Priority Pollutant
Screen Antimony (Total)
Barium (Total) Beryllium (Total)
Cyanide (Total) Mercury (inorganic)
Selenium Thallium
Alachlor Atrazine
Carbofuran Carbon Tetrachloride
Chlordane Chlorobenzene
2,4-D Dalapon
o-Dichlorobenzene3
p-Dichlorobenzene4
1,3-Dichlorobenzene5
Bis(2-chloroisopropyl)ether Bis(2-chloroethyl)ether
Dinoseb Diquat
Endothall Glyphosate
Lindane Picloram
1,2,4-Trichlorobenzene
Table 7.1 notes: 1) Di(2-ethylhexyl)phthalate is also known as bis(2-ethylhexyl)phthalate or DEHP 2) Xylenes is equal to the sum of ortho, meta, and para isomers 3) o-Dichlorobenzene is also known as 1,2-dichlorobenzene 4) p-Dichlorobenzene is also known as 1,4-dichlorobenzene 5) m-dichlorobenzene is also known as 1,3-dichlorobenzene
7.4 Sampling Equipment Preparation The equipment required for collecting stormwater discharge grab samples includes:
• Stainless steel beaker (decontaminated at the WPCL laboratory); • Swing sampler with telescoping pole; • Laboratory provided sample containers; • Volatile organic compound (VOC) trip blank; • Disposable gloves (latex or nitrile and vinyl); • Cooler with blue ice; • Manhole cover puller;
Final SAP Page 7-3

• Traffic control equipment; • Analytical field meters (pH, specific conductance and temperature); • Sample collection documentation (Daily Field Reports, Field Data Sheets,
Chains-of-Custody Forms); and • Field file with location maps, location photos, and traffic control plans.
Refer to SOP D-2, provided in Appendix D, for details about sampling equipment preparation.
7.5 Sampling Equipment Decontamination Strict adherence to correct decontamination procedures is a vital link in the integrity of the sampling process and will help ensure that equipment used during the sampling process is free from pollutants that could bias analytical results.
The only equipment that will contact the sample media (stormwater) is the stainless steel beaker used to collect the grab samples. The stainless steel beakers will be decontaminated, dried, and wrapped in aluminum foil at the WPCL prior to initiating fieldwork. Each sampling team will take a sufficient number of beakers for the planned UIC sampling.
Refer to SOP D-3, provided in Appendix D, for sampling equipment decontamination procedures.
7.6 Sample Container Preparation All sample containers for this project will be provided pre-cleaned and, if required, pre-preserved from the laboratory. Tables 7.2 and 7.3 provide the required sample volumes, containers, and preservatives required for laboratory analyses, based on standard EPA-approved methodologies. In addition, if additional analyses are required (e.g., QA/QC samples) additional samples will be collected. Refer to SOP D-4, provided in Appendix D, for sampling container preparation information. Bottles will be transported in coolers with blue ice to keep chilled and to prevent breakage.
Final SAP Page 7-4

Table 7.2 Stormwater Quality Analytes – Common Pollutants Monitoring
Analyte Method a, b
Analytical
Laboratory
Minimum Sample Volume/
Bottle Preservation
Maximum Holding
Time Benzene Toluene
Ethylbenzene Xylenes
EPA 8260B WPCL 3 40-mL
Glass VOC vials
HCl to pH<2; Cool to 4° C 14 days
Pentachlorophenol EPA 515.3 NCA c 250 mL / Amber Glass
Na2SO3; Cool to 4° C 14 days
Bis(2-ethylhexyl) phthalate Benzo(a)pyrene
EPA 8270-SIM NCA 1 L / Amber Glass Cool to 4° C 7/40 days
Total Arsenic Total Cadmium Total Chromium
Total Copper Total Lead Total Zinc
EPA 200.8
WPCL
500 mL Poly
HNO3 to pH<2; Cool to 4° C
6 months
Nitrate-Nitrogen EPA 300.0 WPCL 250 mL / Poly Cool to 4° C 48 hours
Table 7.2 Notes a The permit requires that analytes detected by any of the laboratory methods used in the stormwater monitoring
program be reported. b Method preparation procedures are presented in the QAPP. c NCA = North Creek Analytical Laboratory. NCA was acquired by Test America in February 2006.
Final SAP Page 7-5

Table 7.3 Stormwater Quality Analytes – Priority Pollutant Screen
Analyte Method a, bAnalytical
Laboratory
Minimum Sample Volume/
Bottle Preservation Maximum
Holding Time
Total Antimony Total Barium
Total Beryllium Total Selenium Total Thallium
EPA 200.8 WPCL 500 mL / Poly
HNO3 to pH<2; Cool to 4° C 6 months
Total (inorganic) Mercury EPA 1631 c NCA d Obtained from total metals container
Total Cyanide SM 4500-CN-E WPCL 500 mL / Poly
NaOH to pH>12; Cool to
4° C 14 days
Alachlor Atrazine
Bis(2-chloroisopropyl) ether Bis(2-chloroethyl) ether
EPA 8270C NCA 1 L / Amber Glass Cool to 4° C 7/40 days
Carbofuran EPA 531.2 NCA 60 mL / Amber Glass
Na2SO3, KC6H7O7; Cool
to 4° C 28 days
Carbon Tetrachloride Chlorobenzene
o-Dichlorobenzene p-Dichlorobenzene
1,3-Dichlorobenzene 1,2,4-Trichlorobenzene
EPA 8260B NCA 3 40 mL
Glass VOC vials
HCl to pH<2, Cool to 4° C 14 days
Chlordane (tech) Lindane
EPA 8081 NCA 1 L / Amber Glass Cool to 4° C 7/40 days
2,4-D Dinoseb Picloram
EPA 515.3 NCA 250 mL / Amber Glass
Na2SO3; Cool to 4° C 14 days
Dalapon EPA 552.2 NCA 125 mL / Amber Glass
NH4Cl; Cool to 4° C 14 days
Diquat EPA 549.2 NCA 250 mL / Brown Poly
Na2SO3; Cool to 4° C 7 days
Table 7.3 continued on next page.
Final SAP Page 7-6

Table 7.3 Stormwater Quality Analytes – Priority Pollutant Screen
Analyte Method a, bAnalytical
Laboratory
Minimum Sample Volume/
Bottle Preservation Maximum
Holding Time
Endothall EPA 548.1 NCA 250 mL / Amber Glass
Na2SO3, Ascorbic Acid;
Cool to 4° C 7 days
Glyphosate EPA 547 NCA 250 mL / Amber Glass
Na2SO3; Cool to 4° C 14 days
Notes for Table 7.3: a The permit requires that analytes detected by any of the laboratory methods used in the stormwater
monitoring program be reported. . b Method preparation procedures are presented in the QAPP. c EPA has indicated that WPCL will soon receive approval to use EPA Method 200.8 for Total
Mercury. Once EPA approval is granted the method will be changed. d NCA = North Creek Analytical Laboratory. NCA was acquired by Test America in February 2006.
7.7 Analytical Field Meter Calibration Stormwater samples will be analyzed in the field for pH, specific conductance, and temperature using portable analytical meters. Field meters will be calibrated at the WPCL prior to initiating sampling activities. Refer to SOP D-5, provided in Appendix D, for field meter calibration procedures.
7.8 Clean Sampling Techniques Field personnel will follow clean sample collection techniques to minimize the potential for introducing contamination to stormwater discharge samples.
Care must be taken during all sampling operations to avoid contamination of the stormwater samples by human, atmospheric, or other potential sources of contamination. The Sampling Team should prevent contamination of any of the following items: stainless steel beakers, sample bottles, lids, and sample media. Whenever possible, samples should be collected upstream, and upwind of sampling personnel to minimize contamination potential. Gloves used during sampling can also be a source of contamination. Sampling Teams will use new vinyl gloves when filling containers for metals analysis and new latex or nitrile gloves when sampling for all other analytes. Refer to SOP D-6, provided in Appendix D, for clean sampling rules.
Final SAP Page 7-7

7.9 Sampling Location Access Procedures During fieldwork activities, Sampling Teams should use the following procedure to access each sampling location:
• Set up location-specific traffic control as shown in project field file; • Observe and document conditions in UIC drainage basin that may affect
stormwater discharge quality in accordance with SOP D-10 such as: o System integrity (e.g., catch basin covers in place, catch basins or inlets
operational, “gooseneck” intact and operational); o Debris (e.g., litter, plastic, leaves), sheen, etc. in catch basins, along curbs,
or in surface water sheet flow; o Traffic volume (e.g., light, medium, heavy, unusual traffic conditions),
type (e.g., passenger cars, trucks, buses); o Road conditions (e.g., unimproved streets, streets with unimproved
shoulders, new asphalt, numerous potholes); o New asphalt or sealant on roads or near by parking lots; and o Potential pollutant sources (e.g., utility poles; parked cars, sheen,
landscaping, commercial/industrial activity). • Remove manhole cover with manhole cover puller; and • Determine if flow rate at EOP is sufficient to sample (i.e., greater than 0.1 gallon
per minute (gpm)).
The flow rate will be estimated by recording the time it takes to fill a container of known volume and converting it to gallons per minute. If the flow rate is sufficient (>0.1 gpm), a grab sample will be collected. If the flow rate is insufficient, the Sampling Team will note that on sample collection documentation, close the manhole cover, and proceed to next sampling station. The field notes should indicate how the flow rate (e.g., volume of container filled) was determined and describe general flow characteristics (e.g., color, turbidity, debris, variation in flow, sheen) during sampling. Refer to SOP D-7, provided in Appendix D, for sampling station access procedures.
7.10 Sample Collection and Handling Grab samples will be collected using decontaminated stainless steel beakers connected to telescoping poles by swing samplers. To eliminate the need for field decontamination, a separate decontaminated beaker will be dedicated to each sample location. Care will be taken by the Sampling Team not to place the decontaminated beaker on the ground or to hit the side of the UIC during sampling activities.
The beaker will be positioned at the sample point to collect EOP discharge and brought to the surface grade to fill sample containers. To the extent practicable, the beaker will be filled and emptied slowly and carefully to avoid degassing the sample. Samples will be placed in precleaned bottles provided by the analytical laboratory and specified in Tables 7.2 and 7.3. Sample bottles will be filled in the following order, after donning vinyl gloves:
Final SAP Page 7-8
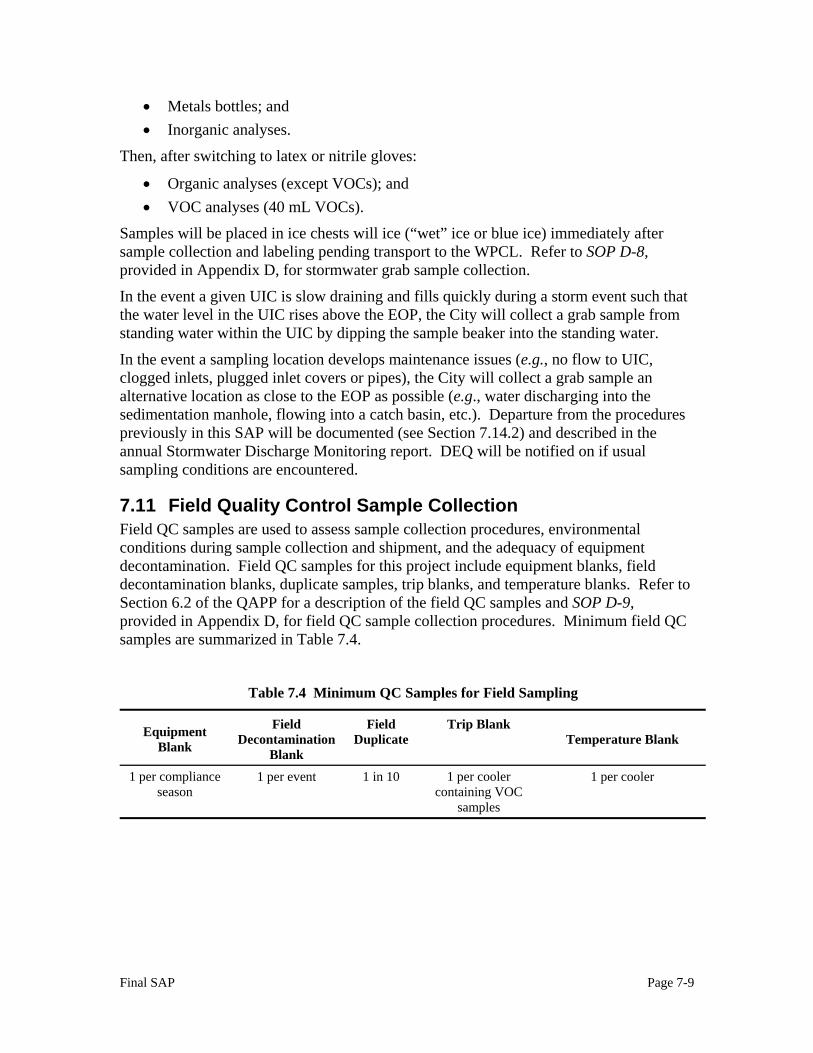
• Metals bottles; and • Inorganic analyses.
Then, after switching to latex or nitrile gloves:
• Organic analyses (except VOCs); and • VOC analyses (40 mL VOCs).
Samples will be placed in ice chests will ice (“wet” ice or blue ice) immediately after sample collection and labeling pending transport to the WPCL. Refer to SOP D-8, provided in Appendix D, for stormwater grab sample collection.
In the event a given UIC is slow draining and fills quickly during a storm event such that the water level in the UIC rises above the EOP, the City will collect a grab sample from standing water within the UIC by dipping the sample beaker into the standing water.
In the event a sampling location develops maintenance issues (e.g., no flow to UIC, clogged inlets, plugged inlet covers or pipes), the City will collect a grab sample an alternative location as close to the EOP as possible (e.g., water discharging into the sedimentation manhole, flowing into a catch basin, etc.). Departure from the procedures previously in this SAP will be documented (see Section 7.14.2) and described in the annual Stormwater Discharge Monitoring report. DEQ will be notified on if usual sampling conditions are encountered.
7.11 Field Quality Control Sample Collection Field QC samples are used to assess sample collection procedures, environmental conditions during sample collection and shipment, and the adequacy of equipment decontamination. Field QC samples for this project include equipment blanks, field decontamination blanks, duplicate samples, trip blanks, and temperature blanks. Refer to Section 6.2 of the QAPP for a description of the field QC samples and SOP D-9, provided in Appendix D, for field QC sample collection procedures. Minimum field QC samples are summarized in Table 7.4.
Table 7.4 Minimum QC Samples for Field Sampling
Equipment Blank
Field Decontamination
Blank
Field Duplicate
Trip Blank Temperature Blank
1 per compliance season
1 per event 1 in 10 1 per cooler containing VOC
samples
1 per cooler
Final SAP Page 7-9

7.12 Sample Labeling Sample labels are necessary to prevent misidentification of samples. Each sample collected will have a unique sample point code applied in the field and a unique sample identification code applied upon receipt at the WPCL. Each sample that is collected in the field will be labeled with the sample point code using indelible ink. This information will be written directly onto the sample container (polyethylene bottles) or onto permanently affixed labels (glass jars). This number is also recorded on the Chain of Custody form and the Field Data Sheet. The sample point code is assigned prior to sample collection and includes the UIC panel number followed by the sample site number in the order generated through the sampling design process, as follows:
PN_X
Where: P = panel
N = 1-6
X = 1-15
Sample Point Codes and BES UIC database identification numbers are provided in Tables 7.5 and 7.6 for year one sampling locations. Confirmed sample point codes will be provided to DEQ by September 1 for subsequent monitoring year.
Table 7.5 UIC Sample Point Codes – Stationary Panel (Panel 6)
Address Sample Point Code BES UIC No. Latitude / Longitude
3500 SE 112th Ave. P6_1 ADW577 45.49676/-122.54801 940 NE Portland Blvd P6_2 ADP355 45.57035/-122.65526
4541 NE 80th Ave P6_3 ADQ337 45.55605/-122.58071 9090 SE Claybourne St. P6_4 ADT961 45.47471/-122.56991
2513 SE 153rd Ave. P6_5 ADS740 45.50410/-122.50598 5201 N. Emerson Dr. P6_6 ADV395 45.56048/-122.69658
608 NE 87th Ave P6_7 ADV645 45.52779/-122.57361 10064 SE Woodstock Blvd. P6_8 ADV169 45.57613/-122.56014
3617 SE 168th Ave. P6_9 ADT531 45.49604/-122.48968 10720 NE Wygant St P6_10 ADQ411 45.55718/-122.55228 1406 NE Skidmore St P6_11 AAU014 45.55440/-122.65157 2913 SE 118th Ave P6_12 ADS602 45.50083/-122.54219 14350 NE Knott St. P6_13 ADW213 45.45246/ -122.51430 4289 NE Prescott St P6_14 ADQ252 45.55559/-122.61931 13500 NE Glisan St P6_15
ADR767 45.52646/-122.52461
Final SAP Page 7-10

Table 7.6 UIC Sample Point Codes – Rotating Panel (Panel 1)
Address Sample Point Code
BES UIC No. Latitude Longitude
6940 N. Macrum Ave. P1_1 AAG769 45.58146/-122.73663 2510 N. Buffalo St. P1_2 ADP173 45.57536/-122.69332 3716 NE 112th Ave. P1_3 ADQ980 45.55024/-122.54751
7120 SE 67th Ave P1_4 ADT881 45.47135/-122.59421 7002 SE 45th Ave. P1_5 ADT773 45.47259/-122.61601
1840 SE 164th Ave. P1_6 ADS508 45.50927/-122.49520 6433 NE Tillamook St P1_7 ADR184 45.53736/-122.59661
20 SE 160th Ave. P1_8 ADS110 45.52152/-122.49900 4740 NE 57th Ave. P1_9 ADQ277 45.55773/-122.60441
10634 E Burnside St P1_10 ADR905 45.52248/-122.55327 1160 SE 140th Ave P1_11 ADT118 45.51475/-122.51967
15839 E Burnside St P1_12 ANB209 45.52236/-122.50034 6507 N Princeton St P1_13 ADN651 45.58215/-122.73519 7380 NE Prescott St. P1_14 ADQ898 45.55542/-122.58697
6125 N Mississippi Ave P1_15
ADP561 45.56741/-122.67594
7.13 Field Parameter Measurement Field parameters (pH, specific conductance, and temperature) will be measured at each sample location immediately after filling the last sample container. Field measurements will be measured from collected stormwater by inserting the analytical field meter probes into stormwater collected within the stainless steel beaker. Refer to SOP D-5, provided in Appendix D, for field parameter measurement procedures.
7.14 Sample Collection Documentation Each Sample Team will complete three separate documents while performing sampling activities: Daily Field Reports; Field Data Sheets; and Chain of Custody forms. Note - Since stormwater sampling activities are correlated to rainfall data, and the City of Portland’s rain gage network provides time series data in Pacific Standard Time (PST); all times on field sampling documents will be recorded in 24-hour PST.
7.14.1 Daily Field Reports Daily Field Reports (DFRs) serve as a general log of the field activities for each Sampling Team. Each DFR has a title block area for project name, project number, date, author, and page number. Required information to be recorded on the main body of the DFRs include:
• Name of the person(s) on each Sample Team; • Location and times of each sampling site visited; and
Final SAP Page 7-11

• Summary of sampling activities and observations (list specific sample details on the Field Data Sheet).
Information recorded should be detailed enough to allow the sampling event to be reconstructed without having to rely on memory and to allow the Sampling Team for subsequent sampling events to recognize or identify any changes in the immediate proximity of the UIC that may impact the quality of stormwater quality. The Sampling Team should photodocument significant site features and/or changes.
7.14.2 Field Data Sheets A Field Data Sheet (FDS) will be completed for each sample collected. The FDS details specific observations pertaining to each sample. Required information to be recorded on the FDS includes:
• Date, arrival time, departure time, and personnel present for each sample collected;
• Sample site address and sample point code; • Weather and flow conditions at each sampling location; • Flow rate estimate at EOP; • Presence of floatable objects, oily sheens, catch basin conditions, potential
pollution sources, or other conditions that that may impact stormwater quality observed at the time of sample collection;
• UIC system integrity ((e.g., catch basin covers in place, catch basins or inlets operational, “gooseneck” intact and operational);
• General traffic conditions and type; • Sample collection point and time; • Deviations to sampling procedure; and • Collection of field QC samples.
7.14.3 Chain of Custody A Chain of Custody (COC) form is a legal document designed to track samples and persons who are responsible for them during preparation of the sample container, sample collection, sample delivery, and sample analysis. “Chain of Custody” refers to both the form and the documented account of changes in possession that occur for samples. For each sample collected, sample information must be recorded on the sampling event-specific COC form. Required information on the COC includes:
• Sampling event; • Sample date and time; • Sample matrix and type; • Name of person(s) collecting the samples; • Sample point code and sample address; • Sample identification code (discussed in Section 7.15); • Analysis requested; • Field measurement (pH, specific conductance, and temperature); and
Final SAP Page 7-12

• Printed name, signature, date, and time for each person relinquishing or receiving the samples.
To ensure that all necessary information is documented, a COC form must be completely filled out, and accompany each set of samples. COC forms will be printed on “Rite in the Rain” paper. They will be photocopied after the laboratory personnel have signed off on sample receipt so that all personnel handling the samples may maintain a copy. When transferring custody of samples, the transferee will sign and record the date and time of each transfer. Each person who takes custody will complete the appropriate portion of the COC documentation.
7.14.4 Photographic Documentation In addition to the DFR, FDS, and COC documents, the Sampling Teams will take digital photographs if unusual or noteworthy conditions are present at the sampling sites (i.e. vehicle leaking fluids into catch basin, etc.) during sample collection. Site photographs are not necessary for every site visit if reasonably normal site conditions seem to exist while the Sampling Team is on site. If digital photographs are taken, they must be documented on the FDS. Upon returning to the Laboratory, digital photographs must be downloaded, labeled, and electronically filed in accordance with the data management plan described in the QAPP.
Refer to SOP D-10, provided in Appendix D, for sampling documentation procedures. Copies of project sampling documents are provided in the Appendix F.
7.15 Sample Transport and Delivery to the Laboratory Immediately following sample collection, sample containers will be placed on ice in coolers and protected from breakage. A separate cooler will be used to transport the VOC samples and an associated trip blank. The trip blank must accompany the VOC vials from the time they leave the WPCL until the filled vials are relinquished to the WPCL.
Samples will be submitted to the WPCL by the Sampling Team under strict COC procedures. The Sample Custodian or designated alternate will assign a unique sample identification code to each sample. These codes are preprinted on gummed labels and are affixed to the sample containers and the COC form during the sample receiving and log-in process. Both samples analyzed at WPCL and any contract laboratories are labeled with these unique codes. The code consists of the initials of the BES section collecting the sample, the two digit calendar year in which the sample was collected, and the sequential sample number received by the laboratory that calendar year.
FOYYXXXX
Where: FO = field operations YY = calendar year (e.g., 05) XXXX = sequential sample number (e.g., 0648, 0649, 0650)
Each sample collected will have a unique sample point code and sample identification code. These codes will be included on the sample label and COC forms and will be used by the laboratory to identify the analytical data.
Final SAP Page 7-13

No sample shipping will be required for this project. The Sample Team will deliver samples to the WPCL within 12 hours of sampling. Some analytical tests will be performed by the City’s contract laboratory, North Creek Analytical Laboratory4 (NCA), located in Beaverton, Oregon. After log-in, sample containers destined for NCA will be stored on a designated shelf in the temperature-controlled and monitored sample receiving refrigerator. The Sample Custodian will complete a NCA COC and schedule a pick-up by NCA. Samples will be retrieved from the WPCL by the NCA courier, transported in coolers containing blue ice packs, and delivered to NCA following standard COC procedures. Refer to SOP D-11, included in Appendix D, for sample transport and delivery procedures. When sample collection occurs after normal business hours, the Sampling Team will sign and date the COC form and place the samples in the sample-receiving refrigerator. The laboratory will accept samples as soon as possible, following COC procedures.
7.16 Change Notification
7.16.1 Field Procedures All field changes to sampling procedures, including the reasons necessitating the change, will be recorded on field documentation maintained by Sampling Teams. The City will notify DEQ of significant changes to field procedures identified in this SAP within two weeks of the sampling event. In the event substantial modifications are identified for future sampling events, the City will prepare SAP addenda for approval by the BES UIC Program Manager and DEQ WPCF permit Manager.
7.16.2 Sample Waivers The WPCF permit requires that the City collect five stormwater samples from each designated sampling location between October 1 and May 31 of each year, unless conditions are encountered that are beyond the City’s reasonable control that prevent monitoring of five storm events within a wet season or analyzing any sample or pollutant parameter. The permit (Schedule B(3)) includes a sampling waiver for conditions beyond the City’s reasonable control. These conditions include atypical climatic conditions, weather conditions that would make collection or analysis of samples unsafe or impracticable, unavoidable equipment failure, or other conditions determined by DEQ to be beyond the City’s control. In the event the City identifies the need for a sampling waiver, the City will notify the DEQ WPCF permit Manager, to discuss the need for a waiver or alternative methodologies to obtain the required data. The City will request written sample waivers from DEQ if conditions exist beyond the City’s reasonable control.
4 NCA = North Creek Analytical Laboratory. NCA was acquired by Test America in February 2006.
Final SAP Page 7-14

Final SAP Page 8-1
S88 RReeffeerreenncceess
Agresti, A. and Coull. B. (1998), “Approximate is Better than ‘Exact’ for Interval Estimation of Binomial Proportion,” The American Statistician, 52, 119-125. City of Portland, 2006a. Quality Assurance Project Plan – Stormwater Underground Injection Control System Monitoring. August 2006. Final.
ection
8 City of Portland, 2006b. Stormwater Discharge Monitoring Plan. August 2006. Final. Consists of the Sampling and Analyses Plan and Quality Assurance Plan.

Final SAP Page 8-2
This page intentionally left blank.

Appendices
Final SAP

This page intentionally left blank.
Final SAP

Appendix A
2005 Pilot Study
Final SAP

This page intentionally left blank.
Final SAP

2005 Pilot Study The second pilot study was designed more in tune with current permit specifications with respect to a traffic-based stratification of vehicle trips per day (TPD). The objectives of the pilot study were to collect samples and obtain initial data using methods that could be applied to sample- size planning, identify analytes of concern, and judge the amount of field and lab crew effort would be required for stormwater sampling of UICs. Stormwater samples were collected at the inlet to 16 UICs in four different traffic volumes categorized by TPD: less than 1,000; between 1,000 and 5,000; between 5,000 and 20,000; and greater than 20,000. The sample sites were selected using the GRTS survey design software provided by Dr. Olsen to ensure that they were spatially balanced throughout the study area. There was bias introduced to the study design as higher traffic categories were more represented in pilot study than in the actual target population. The data analysis methods aimed at reducing this bias computed a weighted proportion of exceedances to estimate target population proportion. The weights were based on the estimated traffic category breakdown in the entire population. The 16 grab samples collected for this study were analyzed for the all the analytes listed in Table 1 of the WPCF permit. The analytical methods used were specifically selected to achieve reporting limits below the permit Maximum Allowable Discharge Limit (MADL) and, if possible, the EPA Region 9 Preliminary Remediation Goals (PRGs) for tap water. Consequently, many analyses were performed by drinking water methods, which generally have lower method reporting limits than their counterparts in SW846. Analytical problems encountered with a couple of these methods will preclude their use in future monitoring. A summary of the findings is included in the table below.
Hansen ID Location Vehicle Trips per Day (TPD)
ADN417 N Hudson & Courtenay 0-1,000
ADW141 3150 NE 126th Ct 0-1,000
ADU179 3320 SE 87th Ave 0-1,000
ADW528 SE 73rd & Woodward 0-1,000
ADQ977 NE 112th & Mason 1,000-5000
ADQ501 NE Alameda & 21st 1,000-5000
ADT455 4332 SE 130th Ave 1,000-5000
ADR274 NE 108th & Sacramento 1,000-5000
ADP643 N Commercial & Ainsworth 5000-20,000
Final SAP Page A-1

Hansen ID Location Vehicle Trips per Day (TPD)
ADS699 SE 148th & Taggart 5000-20,000
ADU752 SE 122nd & Long 5000-20,000
ADV849 SE Flavel & 54th 5000-20,000
ADT131 14900 SE Stark St >20,000
ADU427 11410 SE Stark St. >20,000
ADS329 SE 122nd & Sherman >20,000
ADT080 SE 122nd & Market >20,000
Number
Analyte Method
Total Analyzed
Detected Values that
Did Not Exceed
MADL*
Detected Values
that Exceeded MADL
Non-detects, where
MRL** > MADL
Total Lead EPA 200.8 16 16 0 0
Pentachlorophenol EPA 515.3 16 13 3 0
Bis(2-ethylhexyl)phthalate EPA 525.2 16 15 1 0
Benzo(a)pyrene EPA 525.2 16 14 2 0
Bis(2-chloroisopropyl) ether EPA 8270C 16 14 0 2
Bis(2-chloroethyl) ether EPA 8270C 16 10 0 6
* Also includes non-detects where MRL<MADL. ** MRL= Method Reporting Limit
Final SAP Page A-2

Appendix B
UIC Location Maps
Final SAP

This page intentionally left blank.
Final SAP

Figure B.1 2005-06 UIC Monitoring Locations, North Sub-section Map Figure B.2 2005-06 UIC Monitoring Locations, Northeast Sub-section Map Figure B.3 2005-06 UIC Monitoring Locations, Southeast Sub-section Map Figure B.4 2005-06 UIC Monitoring Locations, Panel 1 – Site 1 Figure B.5 2005-06 UIC Monitoring Locations, Panel 1 – Site 2 Figure B.6 2005-06 UIC Monitoring Locations, Panel 1 – Site 3 Figure B.7 2005-06 UIC Monitoring Locations, Panel 1 – Site 4 Figure B.8 2005-06 UIC Monitoring Locations, Panel 1 – Site 5 Figure B.9 2005-06 UIC Monitoring Locations, Panel 1 – Site 6 Figure B.10 2005-06 UIC Monitoring Locations, Panel 1 – Site 7 Figure B.11 2005-06 UIC Monitoring Locations, Panel 1 – Site 8 Figure B.12 2005-06 UIC Monitoring Locations, Panel 1 – Site 9 Figure B.13 2005-06 UIC Monitoring Locations, Panel 1 – Site 10 Figure B.14 2005-06 UIC Monitoring Locations, Panel 1 – Site 11 Figure B.15 2005-06 UIC Monitoring Locations, Panel 1 – Site 12 Figure B.16 2005-06 UIC Monitoring Locations, Panel 1 – Site 13 Figure B.17 2005-06 UIC Monitoring Locations, Panel 1 – Site 14 Figure B.18 2005-06 UIC Monitoring Locations, Panel 1 – Site 15 Figure B.19 2005-06 UIC Monitoring Locations, Panel 6 – Site 1 Figure B.20 2005-06 UIC Monitoring Locations, Panel 6 – Site 2 Figure B.21 2005-06 UIC Monitoring Locations, Panel 6 – Site 3 Figure B.22 2005-06 UIC Monitoring Locations, Panel 6 – Site 4 Figure B.23 2005-06 UIC Monitoring Locations, Panel 6 – Site 5 Figure B.24 2005-06 UIC Monitoring Locations, Panel 6 – Site 6 Figure B.25 2005-06 UIC Monitoring Locations, Panel 6 – Site 7 Figure B.26 2005-06 UIC Monitoring Locations, Panel 6 – Site 8 Figure B.27 2005-06 UIC Monitoring Locations, Panel 6 – Site 9 Figure B.28 2005-06 UIC Monitoring Locations, Panel 6 – Site 10 Figure B.29 2005-06 UIC Monitoring Locations, Panel 6 – Site 11 Figure B.30 2005-06 UIC Monitoring Locations, Panel 6 – Site 12 Figure B.31 2005-06 UIC Monitoring Locations, Panel 6 – Site 13 Figure B.32 2005-06 UIC Monitoring Locations, Panel 6 – Site 14 Figure B.33 2005-06 UIC Monitoring Locations, Panel 6 – Site 15
Final SAP Page B-1

Final SAP Page B-2

Final SAP Page B-3

Final SAP Page B-4

Final SAP Page B-5

Final SAP Page B-6

Final SAP Page B-7

Final SAP Page B-8

Final SAP Page B-9

Final SAP Page B-10

Final SAP Page B-11

Final SAP Page B-12

Final SAP Page B-13

Final SAP Page B-14

Final SAP Page B-15

Final SAP Page B-16

Final SAP Page B-17

Final SAP Page B-18

Final SAP Page B-19

Final SAP Page B-20

Final SAP Page B-21

Final SAP Page B-22

Final SAP Page B-23

Final SAP Page B-24

Final SAP Page B-25

Final SAP Page B-26

Final SAP Page B-27

Final SAP Page B-28

Final SAP Page B-29

Final SAP Page B-30

Final SAP Page B-31

Final SAP Page B-32

Final SAP Page B-33

Final SAP Page B-34

Appendix C
UIC Oversample Locations
Final SAP

This page intentionally left blank.
Final SAP

UIC Oversample Locations
Random Panel Generation – Year 1 Wet Season 2005-2006
Panel Traffic Category
Maximum Traffic Volume (Trips per
Day) NODE_ID 1 OverSamp <1,000 729 ADV645 2 OverSamp <1,000 314 ADU762 3 OverSamp >=1,000 1751 ADP355 4 OverSamp >=1,000 3349 ADR619 5 OverSamp <1,000 0 ANB092 6 OverSamp >=1,000 8381 ADQ252 7 OverSamp <1,000 443 ADQ167 8 OverSamp <1,000 302 AMR908 9 OverSamp >=1,000 18083 ADR767
10 OverSamp <1,000 648 AAU014 11 OverSamp >=1,000 1960 ADR184 12 OverSamp <1,000 707 ADT881 13 OverSamp <1,000 0 ADT118 14 OverSamp <1,000 212 ADN651 15 OverSamp <1,000 356 ADP561 16 OverSamp <1,000 969 ADQ411 17 OverSamp <1,000 378 ADS602 18 OverSamp <1,000 398 ADT830 19 OverSamp <1,000 400 ADP688 20 OverSamp >=1,000 9519 ADR905 21 OverSamp >=1,000 7704 ANB209 22 OverSamp <1,000 574 ADP155 23 OverSamp >=1,000 5234 ADQ337 24 OverSamp >=1,000 1051 ADV188 25 OverSamp >=1,000 1025 ADS508 26 OverSamp >=1,000 12715 ADN297 27 OverSamp <1,000 274 ADN400 28 OverSamp <1,000 711 ANA992 29 OverSamp >=1,000 2354 ADT394 30 OverSamp >=1,000 3887 AMP268 31 OverSamp >=1,000 12028 ADP732 32 OverSamp >=1,000 29264 ADS987 33 OverSamp >=1,000 12062 ADU330 34 OverSamp <1,000 401 ADS858 35 OverSamp <1,000 591 ADN801 36 OverSamp >=1,000 27621 ANA736 37 OverSamp >=1,000 2340 ADV577 38 OverSamp <1,000 620 ADR455 39 OverSamp >=1,000 6766 ADQ063 40 OverSamp <1,000 0 ADS546 41 OverSamp >=1,000 3536 ADT061 42 OverSamp >=1,000 9988 ADR071
Final SAP Page C-1

43 OverSamp >=1,000 21309 ADV386 44 OverSamp <1,000 455 ADT301 45 OverSamp >=1,000 9257 ADS669 46 OverSamp <1,000 497 ADQ818 47 OverSamp <1,000 491 AMY290 48 OverSamp <1,000 182 ADU166 49 OverSamp >=1,000 19601 ADR773 50 OverSamp <1,000 291 AAU136 51 OverSamp <1,000 398 ADQ852 52 OverSamp <1,000 222 ADV027 53 OverSamp >=1,000 3805 ADS322 54 OverSamp >=1,000 1571 ADP476 55 OverSamp >=1,000 12008 ADS938 56 OverSamp <1,000 658 ADU445 57 OverSamp >=1,000 16272 ADT732 58 OverSamp >=1,000 6079 ADT859 59 OverSamp <1,000 423 ADP690 60 OverSamp >=1,000 9417 ADV770 61 OverSamp >=1,000 18727 ADR400 62 OverSamp >=1,000 12081 ADR133 63 OverSamp >=1,000 2759 ADV915 64 OverSamp <1,000 210 ADU655 65 OverSamp <1,000 395 AMZ755 66 OverSamp >=1,000 1097 ADR173 67 OverSamp >=1,000 1732 AMQ079 68 OverSamp <1,000 627 ADU618 69 OverSamp >=1,000 9933 ADS428 70 OverSamp >=1,000 3585 ADN632 71 OverSamp <1,000 496 ADR526 72 OverSamp <1,000 356 AMX435 73 OverSamp >=1,000 31280 ADW667 74 OverSamp >=1,000 3655 ADP247 75 OverSamp >=1,000 1036 ADV719 76 OverSamp >=1,000 24803 ADS341 77 OverSamp >=1,000 1606 ADT455 78 OverSamp <1,000 660 ADU809 79 OverSamp <1,000 992 ADP365 80 OverSamp >=1,000 24185 ADR951 81 OverSamp <1,000 470 ADR042 82 OverSamp >=1,000 7011 AAK188 83 OverSamp <1,000 508 ADV725 84 OverSamp >=1,000 4313 ADS215 85 OverSamp <1,000 445 ADT508
Notes: Shaded cells were screened and either used to replace a location in the sample panel or rejected.
Final SAP

Appendix D
Standard Operating Procedures for Stormwater Monitoring
Final SAP

This page intentionally left blank.
Final SAP

Appendix D Table of Contents SOP D1 Weather Tracking and Monitoring Preparation D-1 SOP-D2 Sampling Equipment Preparation D-2 SOP-D3 Sampling Equipment Decontamination D-2 SOP D-4 Sample Container Preparation D-3 SOP D-5 Field Meter Calibration, Measurement and Maintenance D-3 SOP D-6 Clean Sampling Rules D-10 SOP D-7 Sampling Location Access D-11 SOP D-8 Stormwater Grab Sampling D-11 SOP D-9 Field QC Sample Collection D-12 SOP D-10 Sample Collection Documentation D-13 SOP D-11 Sample Transport and Delivery to the Laboratory D-15
Final SAP

This page intentionally left blank.
Final SAP

SOP-D1 Weather Tracking and Monitoring Preparation The Storm Event Coordinator will review the daily (Monday through Friday) weather forecast obtained from the project weather consultant, Extended Range Forecasting (ERF) Company, Inc., throughout the wet season to determine which predicted storm events might meet project targets. When a candidate storm is within 72 hours of occurring, the Storm Event Coordinator will communicate directly with ERF via telephone on an as-need basis. Stormwater sampling is performed at any time of day or night, including weekends, and fieldwork is based on the timing and duration of the targeted event. If an event being tracked has a 75% or greater probability of generating 0.2 inches of rainfall and last at least six hours following a six hour dry period, the Storm Event Coordinator may select it as a candidate storm for this project. The Storm Event Coordinator will inform the Sampling Teams and the laboratory 72 hours before the candidate storm’s predicted arrival (referred to as “Stand-By Mode”).
During “Stand-By Mode,” the Storm Event Coordinator will maintain frequent contact with ERF and if the forecast still predicts a target magnitude event at 24 hours before its arrival, the Sampling Team will be placed in an “Alert mode.” The Sampling Team should consider “Alert Mode” as meaning that sampling is imminent, and should prepare sampling equipment accordingly.
Sampling Team “ Alert Mode” activities: • Prepare sampling equipment per SOP D-2; • Decontaminate field equipment per SOP D-3; • Assemble sample containers per SOP D-4; • Identify Sampling Team members and arrange schedules for field activities;
and • Load vehicles to conduct sampling activities.
At 12 hours before a targeted storm event is scheduled to arrive, a “Go/No-Go” decision on sampling will be made by the Storm Event Coordinator based on current information from ERF:
Sampling Team “Go” • Mobilize Sampling Teams to be deployed when precipitation is imminent or
has begun. Sampling Team “No-Go”
• Unload and organize sampling equipment for next event. If “Go,” once precipitation has begun the Sampling Teams will go into “Sample Mode”
Sampling Team “Sample Mode” • Begin field sampling activities per SOPs D-5 through D-10.
SOP-D2 Sampling Equipment Preparation
Final SAP Page D-1

Each Sampling Team will use a vehicle that is pre-equipped with basic tools, cell phones and/or two-way radios, and traffic control equipment. During the “Alert Mode” of each storm, each Sampling Team shall ensure that the vehicles are stocked with the following equipment and any other equipment that may be determined to be necessary for fulfilling the sampling requirements of this plan:
• Stainless steel beakers (pre-cleaned) – a minimum of one per sample location, • Swing sampler with telescoping pole, • Sample containers, • Volatile organic compound trip blank, • Disposable gloves (latex or nitrile and vinyl), • Cooler with blue ice, • Manhole cover puller, • Traffic control equipment, • Sampling Documentation (Daily Field Report, Field Data Sheet, Chain of
Custody), • Field folder with containing SAP, HASP, station maps, location photos, and
traffic control plans, and • Digital camera.
SOP-D3 Sampling Equipment Decontamination The only equipment that will contact the sample media (stormwater) is the stainless steel beaker used to collect stormwater grab samples. Before use, each beaker will be decontaminated using the following procedure:
1: Wash with phosphate-free detergent solution; 2: Rinse with tap water; 3. Wash with 10 percent acetone solution; 4: Wash with 10 percent methanol solution; 5: Rinse with deionized water; and 6: Rinse with ultrapure deionized water.
Air dry the beakers and cover with foil for transport to the field. To eliminate field decontamination, at least one beaker per potential sampling location will be decontaminated prior to each event.
Final SAP Page D-2

SOP D-4 Sample Container Preparation
• The Sampling Team(s) should assemble pre-cleaned and, if required, pre-preserved analyte-specific sample containers provided by the WPCL and NCA at least 24 hours prior to the sampling event. Containers should be inventoried and checked against the bottle list in the field file for each sampling station.
• Empty containers may be loaded into vans in the coolers or in boxes or packaging they were received in, with the exception of VOC vials. All VOC vials per team must be stored together in a cooler adjacent along with a trip blank.
• Containers should not be pre-labeled since each Sampling Team may visit any project station during each storm. SOP D-8 discusses sample container labeling protocol.
SOP D-5 Field Meter Calibration, Measurement and Maintenance
Portable analytical field meters will be used to measure pH, specific conductance, and temperature. Measurements will be taken in the field of stormwater collected in the stainless steel beaker immediately following filling sample containers at each site. Temperature will be measured using the thermistor of the conductivity meter. A) pH Meter Calibration, Measurement and Maintenance Orion Model 230A and YSI Model 63 meters will be used for field pH measurement for this project.
1) Calibration Calibration ensures that the pH electrode is reading accurately. Calibrate the pH meter prior to each storm event with a two-buffer system. Calibration should hold for about 12 hours, after which the meter should be re-calibrated. The meter is calibrated according to the following procedure.
• Inspect the electrode bulb for any dirt or damage. Clean with deionized water if dirty and replace if damaged. Select either the pH 4 and 7 buffer pair or the pH 7 and 10 buffer pair depending on the expected pH value of the sample. The sample pH value should be in the range of the calibration buffers used. Since stormwater is slightly acidic, the pH 4 and 7 buffer pair should be used. Calibration buffers should be replaced with fresh solution before each calibration.
• Rinse the electrode thoroughly with deionized water. • Place the electrode in pH 7 buffer. The electrode must be covered with at
least ½ inch of solution. Allow time for the temperature to equilibrate,
Final SAP Page D-3

and then record the date, time and the temperature value in the Pre-Measurement section of the pH Meter Calibration Log.
• Initiate the actual calibration process by depressing the appropriate key(s). The meter should take a few moments to recognize the buffer, and then display the theoretical value of the pH 7.00 buffer at the current temperature. Enter this value in the Pre-Measurement section of the pH Meter Calibration Log. Press the appropriate key to accept this value. (If the meter does not automatically calculate the correct buffer value at the current temperature, consult the Change in Value of pH 7 Buffer with Temperature chart to determine the correct value, and enter this value manually.)
• Remove the electrode from the pH 7 buffer and rinse the electrode with deionized water. Place the electrode in the pH 4 buffer. The meter should take a few moments to recognize the buffer, and then display the theoretical value of the buffer solution at the current temperature. Enter this value in the Pre-Measurement section of the pH Meter Calibration Log. Press the appropriate key to accept this value. (If the meter does not automatically calculate the correct buffer value at the current temperature, consult the Change in Value of pH 4 with Temperature chart to determine the correct value, and enter this value manually.)
The electrode slope in percent will be displayed on the meter screen after calibration. The slope is expected to be 90-110%. If the slope is outside this range, refer to Step 5 of the Potential Problems section below. In the pH Meter Calibration Log, record the slope and any comments concerning the calibration.
2) Measurement After calibration, use the following procedure for field pH measurement of stormwater samples. Immediate field analysis of pH ensures the most accurate measurement due to the temperature dependent nature of pH. In situ measurement is preferred, but this will not be feasible for this project so measure pH of stormwater collected in the stainless steel beaker. Rinse the pH probe with deionized water and place it in the sample within the stainless steel beaker. Submerge the probe in enough sample to cover the electrode. Allow time for the temperatures of the probe and sample to equilibrate. Avoid contamination from pH electrode filling solution when measuring pH and conductivity concurrently. Use separate discrete samples to measure conductivity and pH. When the readings have stabilized, record the pH reading (to the nearest 0.1), and the date and time the sample was taken on the Chain of Custody form.
Final SAP Page D-4

3) Post-Measurement Check To determine the extent of drift experienced over the course of the sampling event, the meter is checked against the buffers upon returning from the field. If there is a dramatic temperature difference between the field and the WPCL Field Lab, delay the check in equilibrated, record the time, and measure and record the temperature value and the pH value for the two buffers. Record these items in the Post-Measurement section of until the solution in the probe has had time to equilibrate to the temperature of the Field Lab (up to one hour). Consult the pH Acceptance Range at Temperature charts to verify that the meters have checked in within the acceptance range. To meet the acceptance range, the check in values must be within 0.20 pH units of the actual pH value at that temperature. The charts display the actual pH values along with the upper and lower acceptance limits at temperature. If the check in value falls outside this range, inform the sample custodian that: the results for pH should be considered an estimate due to the post-measurement check of the field meter being outside of the acceptance range. If sufficient space exists on the Chain of Custody or Field Data Sheet, copy the above statement into the comments section, and enter “EST” alongside the pH measurements to indicate that those readings are considered estimates. 4) Maintenance Many problems associated with calibration of the pH meters and pH measurement result from poor maintenance. The pH electrode is fairly fragile and requires regular care to prevent damage. Some preventative measures include the following:
• Before calibrating each day, inspect the pH electrode for scratches, cracks, salt crystal build up, etc. and clean or replace the electrode as required.
• Also inspect the electrode and make sure that the electrolyte solution in the electrode is full. Because the electrode cannot be refilled, the electrode will need to be replaced if low on electrolyte.
• Store the electrodes in the pH electrode storage solution (200 mL of pH 7 buffer combined with 1 g of KCl). Always keep the pH bulb wet! Do not store electrode in deionized water as this may damage it. Change the electrode storage solution daily, after drift check at the end of the sampling day.
Some substances can adhere to the glass bulb of the electrode and interfere with the measurement of pH. Clean the electrode as necessary with a detergent/water solution and/or use isopropyl alcohol. The bulb can be cleaned with a cotton swab to remove buildup. Rinse with deionized water.
Final SAP Page D-5

If the pH electrode slope is not in the range of 90-110%, clean the electrode and repeat the calibration using fresh buffers. If the slope is still outside the acceptable range, replace the electrode. Before calibrating, the new electrode probe needs to soak in pH 7 buffer for at least 30 minutes to fully hydrate the sensor. Record all maintenance and replacement activities in the pH Meter Calibration Log Book. Drift in pH readings may result from exposing the pH meter and probe to extreme hot or cold. Store the pH meter in a cool, dry place. If temperatures for the day are expected to rise above 90°F, store the pH meters in a cooler with “blue” ice. Only meters with automatic temperature compensation are to be used. However, if the thermistor fails, the meter will still display a pH reading, which will not be compensated to 25°C. If the thermistor element fails, temperature will be displayed as a constant 25°C. If this is observed, replace the probe.
B) Specific Conductance Meter Calibration, Use and Maintenance Orion Model 135A and YSI Model 63 meters will be used for field conductivity and temperature measurement for this project.
1) Calibration The conductivity meter will need to be calibrated when a check of the meter determines that the meter and reference standard values differ by more than 3 micro Siemens/centimeter (µS/cm). Calibration should hold for at least a month, but the meter should be checked each time before it is used in the field and checked again after returning from the field. During both the calibration and check, it is helpful to periodically swirl the flask. Rinse the conductivity probe, the digital thermometer probe, and an Erlenmeyer flask, first with deionized water and then with the 147 µS/cm standard. Discard the standard after the rinse. Fill the rinsed flask with ~100 ml of fresh standard and submerge both the rinsed sensor and digital thermometer. Allow a couple of minutes for thermal equilibrium. Slightly agitate the sensors up and down to expel trapped air in the sensor. Record the digital thermometer and conductivity meter temperature readings (in degrees Celsius) to the nearest tenth, the value of the conductivity standard, and
Final SAP Page D-6

the conductivity meter reading to the nearest µS/cm on the appropriate columns on the Conductivity Meter Calibration and Maintenance Sheet. If the meter and reference standard values differ by more than 3 µS/cm, follow the manufacturer’s instructions for meter calibration.
During calibration, it may be necessary to refer to the Unadjusted Conductivity Values Graph in the back of the Conductivity Meter Calibration Logbook to find the unadjusted conductivity of the standard at the temperature displayed on the meter. Record the post-calibration conductivity value on the Conductivity Meter Calibration and Maintenance Sheet.
2) Measurement Specific conductance must be measured in the field in situ or as soon as possible, because the conductivity of water is temperature dependent and can change over time due to oxidation/reduction, ion exchange, etc. In situ measurement is preferred, but this is not feasible for this project. A short holding time will ensure the most accurate results. Specific conductance measurements are reported in µS/cm at 25°C.
Rinse the conductivity probe with deionized water and place it in the sample within the stainless steel beaker. Submerge the probe in enough sample to cover the electrode. Allow temperature to equilibrate. It is helpful to gently swirl the sample container to keep air from the electrodes.
Avoid contamination from pH electrode filling solution when measuring pH and specific conductance concurrently. Use separate discrete samples to measure specific conductance and pH.
When the readings have stabilized, record both the specific conductance reading to the nearest µS/cm and temperature reading (in °C) to the nearest tenth on the Chain of Custody form. Specific conductance readings are automatically temperature-compensated; manual compensation is not necessary.
3) Post-Measurement Check For quality assurance and to see when and if drift has occurred for the conductivity meters while in the field, a post measurement check will be done with each meter upon return to the WPCL. The post measurement check is the same procedure used in calibration of this instrument, except that no adjustment will be made.
Final SAP Page D-7

Rinse the conductivity probe, the digital thermometer probe, and an Erlenmeyer flask, first with deionized water and then with the 147 µS/cm standard. Discard the standard after the rinse.
Fill the rinsed flask with ~100 mL of fresh standard and submerge both the rinsed sensor and digital thermometer. Allow a couple of minutes for thermal equilibrium. Slightly agitate the sensors up and down to expel trapped air in the sensor. Record the digital thermometer and conductivity meter temperature readings (in °C) to the nearest tenth, the value of the conductivity standard, and the conductivity meter reading to the nearest µS/cm on the post measurement columns on the Conductivity Meter Calibration and Maintenance Sheet. If the drift of the meter’s measurements is more than 10% of the 147 µS/cm standard (approximately <132 µS/cm or >162 µS/cm), If the check in value falls outside this range, inform the sample custodian that: the results for conductivity should be considered an estimate due to the post-measurement check of the field meter being outside of the acceptance range. If sufficient space exists on the Chain of Custody or Field Data Sheet, copy the above statement into the comments section, and enter “EST” alongside the conductivity measurements to indicate that those readings are considered estimates. If the check in value falls outside this range, inform the sample custodian that: the results for pH should be considered an estimate due to the post-measurement check of the field meter being outside of the acceptance range. If sufficient space exists on the Chain of Custody or Field Data Sheet, copy the above statement into the comments section, and enter “EST” alongside the pH measurements to indicate that those readings are considered estimates. 4) Maintenance Clean the conductivity cell between measurements by rinsing with deionized water. Clean oil and solvent contamination from the cell with a detergent/water solution. Clean lime or hydroxide coating with a 10% acetic acid solution. When the meter does not read zero (i.e., 0.0 – 0.1 µS/cm) in air, polish the ends of the electrodes with 600-grit sandpaper, clean with a detergent/water solution and rinse thoroughly with ultra-pure grade water.
Store the conductivity sensor cell in a clean, dry location.
Protect the conductivity system from dust and excessive heat and cold.
Final SAP Page D-8

C) Digital Temperature Meter Calibration, Use and Maintenance Orion Model 135A and YSI Model 63 meters will be used for field conductivity and temperature measurement for this project. Thus, the integrated thermistor of the field conductivity meter will be used for temperature measurement for this project.
1) Calibration Since digital thermometers cannot be calibrated, a check of the field meter’s thermistor accuracy against a National Institute of Standards and Technology (NIST)-traceable thermometer determines that field meter is measuring temperature accurately. This check should be performed each time before it is used in the field and checked again after returning from the field.
Place the digital thermometer probe in the designated water bath (pre-filled glass beaker) atop the stirrer unit in the WPCL Field Lab. A NIST-traceable thermometer resides in this water bath. Turn on the stirrer unit and allow at least one minute of continuous stirring for the digital thermometer readings to stabilize. Record the digital thermometer and NIST-traceable thermometer temperature readings (in degrees Celsius) to the nearest tenth on the Conductivity Meter Calibration and Maintenance Sheet.
If the digital thermometer and NIST-traceable thermometer temperature readings differ by more than 0.5°C the digital thermometer is considered inaccurate and should be sent to manufacturer for repair.
2) Measurement Temperature must be measured in the field in situ or as soon as possible. In situ measurement is preferred, but this is not feasible for this project. A short holding time will ensure the most accurate results.
Since the same probe and meter is used for measuring temperature and conductivity, follow the measurements described for the specific Conductance Meter.
3) Post-Measurement Check For quality assurance and to see when and if drift or malfunction has occurred for the temperature sensor while in the field, a post measurement check will be done with each meter upon return to the WPCL. The post measurement check is the same procedure used for the calibration of this instrument.
Final SAP Page D-9

Record the digital thermometer and NIST-traceable thermometer temperature readings (in degrees Celsius) to the nearest tenth on the Conductivity Meter Calibration and Maintenance Sheet.
If the digital thermometer and NIST-traceable thermometer temperature readings differ by more than 0.5°C the digital thermometer is considered inaccurate. If the check in value falls outside this range, inform the sample custodian that: the results for temperature should be considered an estimate due to the post-measurement check of the field meter being outside of the acceptance range. If sufficient space exists on the Chain of Custody or Field Data Sheet, copy the above statement into the comments section, and enter “EST” alongside the temperature measurements to indicate that those readings are considered estimates.
4) Maintenance Digital thermometer are maintained and repaired by the manufacturer only.
SOP-D6 Clean Sampling Rules Sample collection personnel should adhere to the following rules while collecting stormwater samples to reduce potential contamination.
• Do not eat, drink or smoke during sample collection. • Do not park vehicles in immediate sample collection area, do not sample near a
running vehicle. • Always wear clean, disposable, powder-free latex or nitrile gloves when handling
all sampling equipment and sample bottles except for containers for metal analysis. When handling or filling containers for metals analysis, use clean, disposable, powder-free vinyl gloves. At a minimum, gloves will be changed prior to sampling at each location.
• Never touch the inside surface of a sample container or lid to be contacted by any material other than the sample water.
• Do not breathe, sneeze, or cough in the direction of an open sample container. • Never allow any object or material to fall into or contact the collected sample
water. • Avoid allowing rainwater to drip from rain gear or other surfaces into sample
bottles.
Final SAP Page D-10

SOP-D7 Sampling Location Access During sampling activities, use the following procedure to access each sampling station:
• Set up location-specific traffic control, if needed, as shown in field file; • Remove manhole cover with manhole cover puller; and • Determine if flow rate at EOP is sufficient to sample.
Flow rate is estimated by a modified bucket and stopwatch method, which entails recording the time it takes to fill a container of known volume and converting to gallons per minute. If flow rate is sufficient (typically greater than 0.1 gallon per minute), proceed with grab sample collection. If flow rate is insufficient, close manhole cover and proceed to next sampling station.
SOP-D8 Stormwater Grab Sampling Set up a two-person clean Sampling Team: one “dirty hands” to move equipment, remove manhole cover, handle telescoping pole and swing sampler, and document sampling activities; and one “clean hands” to handle sampling beaker and fill sample containers. If working on a one-person team, change to new gloves immediately prior to handling beaker and filling bottles. If working on one-person team, don several sets of gloves over one another to facilitate glove changes. The stormwater grab sampling technique is as follows:
• Using a new pair of vinyl gloves, “clean hands” removes decontaminated beaker from Ziploc bag and places in swing sampler. A Velcro strap secures beaker in sampler.
• “Dirty hands” lowers beaker on swing sampler/pole to just below the EOP inside the UIC sump. Do not touch manhole or UIC sump walls with beaker.
• Rinse beaker with stormwater by filling with stormwater discharge and emptying into UIC.
• Fill beaker again from the middle of the EOP discharge. • Slowly pour contents into the bottle for metals analyses. “Clean hands” holds and
caps bottles while “dirty hands” pours. • Fill all containers other than those for organics analysis by continually filling beakers
and bringing to the surface. “Dirty hands” continues to handle swing sampler on pole while “clean hands” handles all sampling containers.
• “Clean hands” changes to latex or nitrile gloves and fills bottles for organic analysis using the same procedure, ending with VOC vials. The VOC vials are filled until there is no headspace and a positive meniscus is visible. Secure lid on each vial and invert. If air bubbles are present, repeat process.
• Label sample containers with sample station point code and place samples in the cooler with blue ice using the following labeling convention.
Final SAP Page D-11

o Immediately following sample collection, each container will be labeled with a unique sample “ point code” (e.g., PN-X). Refer to the project CHAIN OF CUSTODY for a list of location addresses and sample point codes.
o Duplicate sample containers will be labeled. Note on the FDS which location the duplicate was collected at since the duplicate sample will be relinquished “blind” to the laboratory. On the CHAIN OF CUSTODY form the duplicate samples will be listed as “DUP” only with no reference to where they were collected.
• Fill out Daily Field Report, Field Data Sheet, and Chain of Custody form per SOP D-10.
• Close manhole cover, break down traffic control and proceed to next location.
SOP D9 Field QC Sample Collection
Field Blank Collection Field blanks are used to check the effectiveness of the decontamination procedure and, if collected in the field, to quantify contamination from atmospheric or field sampling activities. Two field blanks will be generated for this project: the equipment blank an the field decontamination blank.
The equipment blank will test the decontamination procedure used for the stainless steel beakers. It is intended to isolate contamination originating from the sampling equipment without the influence of field sampling activities. For this reason, the equipment blank is collected under controlled conditions in the laboratory. It is created prior to field sampling activities by pouring analyte-free water (“blank water”) into a cleaned stainless steel beaker used by the FO for UIC sampling then into analyte-specific containers and are processed following the same procedures as with the environmental samples. Record the time and date that the equipment blank is collected on the Chain of Custody.
The field decontamination blank will test both the decontamination procedure used for the stainless steel beakers and test for contamination introduced by atmospheric conditions or field sampling activities. For this reason, the field decontamination blank is collected in the field at an actual sampling location using the same methods and equipment as are used for stormwater sample collection (per SOP D-8) with the exception that the sampling equipment will not be lowered into a UIC but filled at street level. The field decontamination blank is created by pouring blank water into a cleaned stainless steel beaker secured in the swing sampler used by FO for UIC sampling. The beaker is then removed from the swing samples to fill analyte-specific containers. The samples are processed with the environmental samples. Record the time and date that the field decontamination blank is collected on the Chain of Custody and the sample location on the Field Data Sheet.
Final SAP Page D-12

Duplicate Sample Collection Duplicate sampling locations for quality control are to be determined by the Storm Event Coordinator prior to the event. The Storm Event Coordinator shall select duplicate sampling locations on a random basis. The same sampling procedures described in SOP D-8 should be followed for the duplicate with the duplicate sample containers filled along side the sample containers in a corresponding manner related to analysis (e.g., grab metals bottle with duplicate grab metals bottle). Primary and duplicate sampling containers should be filled in an alternating fashion until all containers are filled.
SOP-D10 Sample Collection Documentation Three separate documents will be completed by each Sampling Team per sampling event: Daily Field Report, Field Data Sheet, and Chain of Custody. These documents should be completed in the field concurrent with sampling activities. Blank copies of these forms are included in the Attachments section of this SAP. Since stormwater sampling activities are correlated to rainfall data, and the City of Portland’s rain gage network provides time series data in PST; all times on field sample documents will be recorded in 24-hour PST. Daily Field Report Daily Field Reports serve as a general log of the field activities for each Sampling Team and are used continuously during sampling activities. Each Daily Field Report has a title block area for project name, project number, date, author, and page number, which should be fully completed on each page as needed. Additional pages should be numbered sequentially per each Sampling Team. At a minimum, the following information is required on the main body of the Daily Field Reports:
• Name of the person(s) on each Sampling Team; • Location and times of each sampling event; • General weather conditions; and • Summary of sampling activities and observations (list specific sample details on
the Field Data Sheet). Field Data Sheet
A Field Data Sheet details specific observations pertaining to each sample collected. One Field Data Sheet per sample collected is required. Required information to be recorded on the Field Data Sheets include:
• Date, arrival time, depature time, and personnel present for each sample collected; • Sample site address and sample point code; • Weather and flow conditions at each sampling location; • Flow rate estimate at EOP at the start and end of sample collection;
Final SAP Page D-13

• Presence of floatable objects, oily sheens, catch basin conditions, potential pollution sources, or other conditions that that may impact stormwater quality observed at the time of sample collection;
• Sample collection point; • Start and end time of sampling; • Deviations to sampling procedure; and • Collection of Field QC samples.
Chain of Custody The Chain of Custody form tracks the sampling path from origin through laboratory analysis, and it also presents the requested analysis and any special instructions for the analytical laboratory. After containers labeled with sample point codes are placed in coolers, fill out information on the project-specific Chain of Custody form. The following information is preprinted on the Chain of Custody:
• Project Name; • Type of sample (e.g., grab); • Matrix (e.g., stormwater); and • Requested analytes.
The following information must be completed in the field after collecting each sample:
• Date and time sampling was initiated (use start time of sample collection from the Field Data Sheet);
• Initials of person(s) collecting sample; • Sample address and point code; • Field parameter measurements; • Comments or special instructions including the metals list for the duplicate
sample; and • Additional Chain of Custody issues.
Additional information regarding Chain of Custodys is provided in Section 4.3 of the QAPP.
Final SAP Page D-14

SOP-D11 Sample Transport and Delivery to the Laboratory
Sample Handling and Transport • Pack samples well in cooler to prevent breakage or leakage (samples must be
labeled prior to placing in cooler) and provide additional protection for glass sample bottles (e.g., foam or bubble wrapping).
• Ensure that each cooler with samples contains a temperature blank and that the cooler with samples for VOC analysis also contains a trip blank.
• Sample should be packed in ice or an ice substitute (e.g., blue ice) to maintain a sample temperature of 4oC during shipping. Ice (or substitute) should be placed in double wrapped watertight bags to prevent leaking during transport.
• Hand deliver samples to WPCL at the end of each storm event. Relinquishing Samples Upon arrival at the WPCL, affix sample identification stickers to each container and in the space provided on the Chain of Custody form. Each sample receives a unique and sequential sample identification code. When relinquishing samples to the WPCL sample custodian:
• Sign and date Chain of Custody; • Have sample custodian sign and date; • Relay any special instructions; • Make one copy of Chain of Custody for the sampling records and the sample
custodian retains the original Chain of Custody; and • File copy of Chain of Custody and original Field Data Reports and Field Data
Sheets in project file.
After Hours Procedures The WPCL maintains standard business hours Monday through Friday and reduced business hours on weekends. If the Sample Custodian or designated alternate is not present at the time the Sampling Team arrives at the laboratory, the Sampling Team will sign and date the Chain of Custody form and place the samples in the temperature-controlled and monitored refrigerator located in the secured, controlled-accessed, sample receiving room. The laboratory will accept samples as soon as possible.
Final SAP Page D-15

This page intentionally left blank.
Final SAP Page D-16

Appendix E
Health and Safety Plan
Final SAP

This page intentionally left blank.
Final SAP

City of Portland, Oregon Water Pollution Control Facilities (WPCF) Permit For Class V Stormwater Underground Injection Control Systems Permit Number: 102830 Health and Safety Plan Stormwater Underground Injection Control System Monitoring Final August 2006 Prepared By: City of Portland, Bureau of Environmental Services

This page intentionally left blank.

Table of Contents 1 Introduction ................................................................................. 1
1.1 Introduction............................................................................................................... 1
1.2 UIC Overview................................................................................................. 1
1.3 Location of Sites ............................................................................................. 1
1.4 Scope of Work ................................................................................................ 2
2 Key Personnel........................................................................... 3
2.2 Project Personnel ............................................................................................ 3
2.3 Health and Safety Personnel ........................................................................... 3
3 Required Health and Safety Training ....................................... 4
3.2 Required Training ........................................................................................... 4
4 Hazard Analysis ........................................................................ 6
4.2 Work Zones and Site Access .......................................................................... 6
4.3 General Safety Equipment and Communications ........................................... 6
4.4 Personal Protective Equipment ....................................................................... 6
4.5 Chemical Hazards ........................................................................................... 6
4.6 Physical Hazards............................................................................................. 7
4.7 Biological Hazards.......................................................................................... 7
4.8 Inclement Weather .......................................................................................... 8
5 Emergency Action Plan ............................................................ 9
5.2 Emergency Routes .......................................................................................... 9
5.3 Rescue and Medical Duties............................................................................. 9
5.4 Reporting Emergencies................................................................................... 9
6 UIC Stormwater Sampling Health and Safety Plan Review... 10
List of Figures Figure 1.1 City of Portland UICs with Hospital Locations
Final SAP Page iii

HASP Signature Page
This Health and Safety Plan (HASP) has been prepared to meet the requirements of: Occupational Safety and Health Administration (OSHA) standards, 29 CFR Part 1910 and 29 CFR Part 1926, including the “Hazardous Waste Operations and Emergency Response” regulation (29 CFR 1910.120 and 29 CFR 1926.65) and other regulations that are referred to or cross referenced in these standards.
Approved By:
Final SAP Page iv

11 IInnttrroodduuccttiioonn
1.1 Introduction The Underground Injection Control (UIC) program was enacted in 1974 as part of the Safe Drinking Water Act, which is administered under 40 Code of Federal Regulations part 144. The Oregon Department of Environmental Quality (DEQ) regulates this program under Oregon Administrative Rules Chapter 340, Division 144. The intent of the program is to protect groundwater aquifers from contamination. In Oregon, all groundwater aquifers are considered potential drinking water sources.
Section
1 The City of Portland (City) is classified as a large municipality with more than 50 City-owned or operated Class V UICs. Therefore, DEQ issued the City a Water Pollution Control Facilities (WPCF) Permit for Class V Stormwater UIC Systems, which is effective from June 1, 2005 through May 31, 2015. A Sampling and Analysis Plan (SAP) and Quality Assurance Project Plan (QAPP) were prepared to meet the stormwater monitoring requirements established in the WPCF permit. Those documents will guide the monitoring efforts conducted by the City to ensure that quality control and consistency are maintained. This Health and Safety Plan (HASP) has been prepared to address the hazards associated with collecting stormwater samples for this project. The HASP will be reviewed and signed by all field personnel before the sampling operations begin.
1.2 UIC Overview The City’s standard design for UIC systems includes a sedimentation manhole upstream of the stormwater infiltration UIC. The sedimentation manhole provides pretreatment of stormwater prior to discharge into the UIC. Sedimentation manholes are solid concrete cylinders generally three to four feet in diameter and 10 feet deep. The standard design includes a “bent elbow” drainpipe that leads from the sedimentation manhole to the infiltration sump to allow for withdrawal of water in the sedimentation manhole from below the water surface. This drainpipe design prevents litter, oil, and grease, which typically float on water, from flowing into the UIC. The UICs are generally three feet to four feet in diameter and range in depth from a minimum of two feet up to 40 feet. Most of the newer UICs (early 1990s and later) in the City are approximately 30 feet deep. Older UICs are between 18 feet and 30 feet deep. The City became responsible for most of the older UICs as a result of annexation from Multnomah County. These UICs were constructed in accordance with the County’s design standards and many of these UICs did not include sedimentation manholes.
1.3 Location of Sites In the City’s current assessment, there are approximately 9,000 active City-owned UICs. A subset of 90 UICs was statistically determined as representative of this population. In accordance with the WPCF permit, these sites are equally divided into areas with less than and areas with greater than 1,000 vehicle trips per day. For the monitoring design, these 90 UICs have been divided into six panels of 15 UICs each. Panels 1 through 5
Final SAP Page E-1

consist of rotating locations, while Panel 6 comprises stationary locations. The 15 UICs in the stationary panel will be sampled during each event throughout the term of the permit. The UICs in the five rotating panels will be sampled twice during the permit term. This will be accomplished by rotating the five panels annually between permit years 1 and 5 and again between permit years 6 and 10, e.g., Panel 1 will be sampled during permit years 1 and 6. Thus, during each year of the permit, 30 UICs will be sampled.
1.4 Scope of Work The City will attempt to collect five stormwater samples from each designated sampling location between October 1 and May 31 of each year, as required by the WPCF permit. Grab samples will be collected at the end of pipe (EOP) discharge point into the UICs, downstream of any pretreatment control device. If there is no pretreatment device and multiple discharge points, the sample will be collected from the EOP draining the largest catchment, as determined in the field. Samples will be collected by using decontaminated stainless steel beakers connected to telescoping poles by swing samplers. The beaker will be positioned at the sample point to collect EOP discharge and brought to the surface grade to fill sample containers. The City will plan to sample the first predicted storm event occurring each fall in order to investigate any water quality differences that may be associated with the first large rain event of the fall season. The remaining four events will be distributed throughout the rest of the monitoring season as storm events allow. To the extent practicable, the City will collect samples at all 30 locations during the same storm event. Since storm events often fall short of predicted rainfall amounts and/or duration, there is a possibility that rainfall or runoff may cease prior to the collection of all 30 samples. If all locations cannot be sampled during a targeted event, the remaining locations will be sampled during the next storm event meeting pre-specified criteria.
Final SAP Page E-2

Section
2 22 KKeeyy PPeerrssoonnnneell
2.2 Project Personnel Storm Event Coordinator Douglas Hutchinson Project Manager Michael Hauser Monitoring Team Crew Leaders To Be Determined Monitoring Team Personnel Field Operations Staff
2.3 Health and Safety Personnel
2.3.1 Storm Event Coordinator The Storm Event Coordinator is the Field Operations Section Supervisor and is responsible for the creation and implementation of this HASP. The Storm Event Coordinator must ensure that all project personnel have read and signed this HASP prior to conducting stormwater sampling. The Storm Event Coordinator is ultimately responsible for the health and safety of all project personnel.
2.3.2 Project Manager The Project Manager (PM) directs all stormwater sampling activities. The PM is responsible for disseminating sampling site locations, site specific health and safety information including traffic control, and assigning sampling locations to Monitoring Team Crew Leaders and personnel prior to stormwater sampling. The PM also acts as a liaison between the Storm Event Coordinator and Monitoring Team Crew Leaders. The PM has the authority to terminate sampling activities if site conditions become unsafe.
2.3.3 Monitoring Team Crew Leaders Monitoring Team Crew Leaders (Crew Leaders) are directly responsible for maintaining worker health and safety at sampling locations. Crew Leaders are responsible for establishing safe work zones and properly implementing traffic control measures (if applicable) for each sampling location. Crew Leaders must report any unsafe site conditions or unsafe work practices to the PM immediately. Crew Leaders have the authority to terminate sampling activities if site conditions become unsafe.
2.3.4 Monitoring Team Personnel Monitoring Team Personnel are responsible for their own health and safety during stormwater sampling activities and are obligated to follow the safety policies described in this HASP. In addition, Monitoring Team Personnel are expected to ensure the health and safety of their coworkers by doing their part working safely as a team, and to inform their coworkers of any potentially unsafe actions they observe. Monitoring Team Personnel reserve the right to refuse to conduct sampling activities if they feel site conditions are unsafe. If site conditions become unsafe, or if injuries occur, Monitoring Team Personnel must report to the Crew Leader immediately.
Final SAP Page E-3
33 RReeqquuiirreedd HHeeaalltthh aanndd SSaaffeettyy TTrraaiinniinngg
3.2 Required Training All BES employees that participate in stormwater sampling activities must be adequately trained to perform their job in a manner that ensures health and safety. Employees should be trained concerning potential hazards associated with their duties and procedures necessary to minimize risk. To accomplish training goals, BES conducts in-house training, hires consultants to conduct specialized training or seminars, and sends personnel to training programs sponsored by other organizations. Employees must carry proof of successful completion of all required training courses.
Section
3 3.2.1 First Aid/Cardio Pulmonary Resuscitation (CPR)/Automatic External
Defibrillator (AED) Training All City of Portland personnel are required to have current Red Cross First Aid and CPR/AED training. First Aid training is required to be completed once every three years, and CPR/AED training must be completed annually. All employees must present their updated, certified, Red Cross First Aid and CPR/AED cards prior to stepping on site.
3.2.2 Driver Training All BES employees that drive City vehicles are required to possess a valid state driver license and acceptable driving record. Employees are required every two years to complete a defensive driving course. “Smart Driver” is an in-house training program designed to reduce the risks of driving and promotes safe driving.
3.2.3 Traffic Control All BES Field Operations personnel are required to complete a four-hour “Work Zone Traffic Control and Flagging Program” before working in traffic. This course addresses hazards associated with working in traffic, proper traffic control signage and traffic cone placement procedures based on road types and speed limits, and proper flagging techniques.
3.2.4 Confined Space Entry (CSE) Training All BES Field Operations personnel are required to complete an in-house confined space entry training provided by the BES Risk Management Division. Although CSE will not be required for this project, employees are trained to recognize and identify confined spaces, properly complete confined space entry permits, operate confined space entry tools including tripods, fall protection, and atmosphere testing equipment. Emergency procedures including self-rescue and topside rescue are also included in this course.
3.2.5 Hazardous Waste Operations and Emergency Response Training All BES Field Operations personnel are required to complete Hazardous Waste Operations and Emergency Response (HAZWOPER) Training before working on hazardous wastes sites in accordance with Occupational Health and Safety Administration (OSHA) regulations as stated in 29 CFR 1910.120. Field Operations
Final SAP Page E-4

personnel are required to complete an initial 40-hour training course and annually complete an eight-hour refresher course.
Final SAP Page E-5

Section
4 44 HHaazzaarrdd AAnnaallyyssiiss
4.2 Work Zones and Site Access The work zone is defined by the area within the traffic cone barrier surrounding the sampling manhole. In traffic control situations, the work zone is extended to the traffic cone boundaries that extend upstream and downstream of the sampling manhole. Site access will only be granted to project personnel and no unauthorized persons will be allowed in the work zone.
4.3 General Safety Equipment and Communications First aid kits and fire extinguishers are available in the field laboratory, equipment staging area, and in each sampling vehicle. Eye wash stations and a decontamination shower are located in the field laboratory. Each sampling vehicle has a cellular phone for communications and emergencies, and each sampling crew will carry a handheld two-way radio for logistical communications with the PM that can also be used as a backup for emergency communications.
4.4 Personal Protective Equipment
4.4.1 Stormwater Sampling All site personnel will wear modified Level D personal protective equipment (PPE) while conducting sampling activities. Modified Level D PPE for this project consists of steel-toed shoes, cotton coveralls, rain gear (if applicable), latex or vinyl gloves, and Class 3 high visibility traffic vests. Modified Level D PPE, if worn properly, will reduce foot injuries, splash, skin adsorption, and traffic related risks while conducting stormwater sampling.
4.4.2 Decontamination Decontamination procedures for stormwater sampling present the greatest potential risk for chemical exposure of any project task performed by BES employees. Reagents such as nitric acid and acetone are used to decontaminate sampling equipment. These reagents present inhalation and skin adsorption risks and must be handled with extreme caution. Employees must wear coveralls, a chemical resistant apron, chemical resistant gloves, and a face shield when handling nitric acid and/or acetone. Employees must always add reagents to water when making decontamination solutions, not water to reagents, in order to reduce splashing hazards. These reagents must also be handled under the ventilated sash fume hood located in the field laboratory, or well-ventilated area to reduce inhalation hazards.
4.5 Chemical Hazards
4.5.1 Stormwater Sampling Based on previous stormwater sampling events, the analytical data indicate that overall, stormwater contamination is low and does not present significant exposures to employees
Final SAP Page E-6

above applicable permissible exposure limits (PELs). However, chemicals typically present in stormwater, albeit at low levels, include volatile organic compounds (VOCs), semi-volatile organic compounds (SVOCs), heavy metals, and pesticides. Employees must wear coveralls and latex or vinyl gloves when conducting sampling activities to reduce exposure to these chemicals. Employees must use caution when handling stormwater to reduce splashing and skin contact. If stormwater makes contact with skin, it must be washed off immediately.
4.5.2 Decontamination Reagents The greatest potential risk for chemical exposure to employees exists in the handling of decontamination reagents during the cleaning of sampling equipment. Nitric acid is a strong corrosive that will burn skin upon contact, causes eye and respiratory irritation, and pulmonary edema if swallowed. Acetone is a flammable liquid that causes skin and respiratory irritation upon exposure. Employees must wear proper PPE and work under a sash fume hood or well-ventilated area to minimize skin contact and inhalation risks while handling these chemicals. Eye wash stations and a decontamination shower are located in the field laboratory.
4.6 Physical Hazards Physical hazards associated with working in urban streets with high traffic volumes are anticipated to be the most significant hazards associated with UIC stormwater sampling. At sites where sampling locations are located in or near traffic lanes, workers will wear Class 3 high visibility traffic vests and traffic control measures including signage, flashing overhead lights, traffic cones, and flaggers (if applicable) will be utilized to reduce risks. All sampling locations associated with this project are located in manholes that should not require confined space entry since sampling will be performed with beakers attached to telescoping poles. Manhole covers will be removed however, and hazards associated with this task involve heavy lifting, crushing, tripping, and falling hazards. Manhole pulling tools must be utilized when removing and replacing manholes. Manholes should never be moved with bare hands or feet. Workers are required to wear steel-toed shoes and are to use proper lifting techniques to minimize crushing and back injury risks. Removed manhole covers should be placed out of foot traffic areas and open manholes are never to be left unattended to reduce falling hazards.
4.7 Biological Hazards Biological hazards associated with stormwater sampling are minimal, however, some hazards do exist, such as bacteria and other waterborne pathogens present in stormwater. Latex or vinyl gloves should be worn during sampling activities to minimize exposures. Other potential biological hazards include insect bites or stings, spider bites, and rodent bites. All insect, spider, or rodent bites must be reported and if medical attention is necessary, it must be provided immediately.
Final SAP Page E-7

4.8 Inclement Weather Sampling in inclement weather is anticipated for UIC stormwater sampling. Samples can only be collected during times of stormwater runoff, so rainy, windy conditions are expected. Employees should take extra precaution while sampling in inclement weather in high traffic areas as driver visibility is decreased and the road surface is slippery. The potential for slips, trips and falls is also greater in wet weather. Proper clothing, such as rain gear, should be worn in inclement weather to reduce risks of cold-related illnesses such as hypothermia.
Final SAP Page E-8

Section
5 55 EEmmeerrggeennccyy AAccttiioonn PPllaann
5.2 Emergency Routes All sampling locations lie in Northeast and Southeast Portland. A map of all sampling site locations and area hospitals is attached as Figure 1.1 of this HASP. If a medical emergency occurs, first dial 911. If emergency transport (ambulance) is not required, refer to the map and choose the nearest medical facility to the sampling location to seek treatment.
5.3 Rescue and Medical Duties If a medical emergency occurs, first dial 911. All stormwater sampling personnel are trained in First Aid and CPR, as required in section 3.1.1 of this HASP. Employees are expected, though not required, to provide immediate medical care for injuries within the scope of their training until the scene becomes unsafe, or professional medical care arrives.
5.4 Reporting Emergencies If a medical emergency occurs, first dial 911. If a non-medical incident occurs, employees are required to complete a “BES Near Hit & Non-Medical Incident Report”. If the incident requires medical attention, employees must first proceed to the emergency room, then should contact the BES Risk Management Section to complete the proper documentation.
Final SAP Page E-9

66 UUIICC SSttoorrmmwwaatteerr SSaammpplliinngg HHeeaalltthh aanndd SSaaffeettyy PPllaann RReevviieeww
I have reviewed this HASP for UIC Stormwater Sampling and understand the hazards present for this project. I agree to follow the procedures outlined in this HASP and to inform the Monitoring Team Crew Leader, Project Manager and/or the Storm Event Coordinator should any unsafe conditions be noted. I understand that failure to follow safety requirements can result in removal from this project.
Name (print) Date Signature
Section
6
Final SAP Page E-10

Figure 1.1 City of Portland UIC Monitoring Locations and Hospitals
Final SAP Page E-11

This page intentionally left blank.
Final SAP Page E-12

Appendix F
Field Sampling Forms
Site Inspection Report Field Data Sheet
Daily Field Report Chain of Custody Form
Corrective Action Report
Final SAP

This page intentionally left blank.
Final SAP

Final SAP Page F-1
CITY OF PORTLAND ENVIRONMENTAL SERVICES
Water Pollution control Laboratory 6543 N. Burlington Ave., Portland, OR 97203-5452
UIC WPCF PERMIT MON – 4010.027 SITE INSPECTION REPORT
Date: Time: Inspector:
SECTION 1 – AREA DESCRIPTION Site Address: Traffic volume:
Node number: SED MH: SUMP 1: SUMP 2:
Drainage area description:
Photos of site
Observed land use:
Traffic control requirements: Flagging Lane Closure # Staff Required: _____ Hours to Avoid: _____________
Describe:
Section 2 – Catch basin Number of catch basins: Locations:
Catch basin status: Predominant drainage:
Depth of sediment, if no sed-MH present:
Comments:
Section 3 – Sedimentation manhole 6.2.1.1.1.1 Location:
Leaking Gooseneck present, condition:
Depth to water surface: Is water level below gooseneck?
Depth to sediment surface:
Comments:
Section 4 – Sump Location in relation to Sed MH:
Inlet pipe: Flush with wall Sticking out from wall
Depth to water surface: Depth to sediment surface:
Comments:

Final SAP Page F-2
CITY OF PORTLAND ENVIRONMENTAL SERVICES
Water Pollution control Laboratory 6543 N. Burlington Ave., Portland, OR 97203-5452
UIC WPCF PERMIT MON - 4010.027 FIELD DATA SHEET
Date: Time: Event No: Sampling Team:
SECTION 1 – SITE CONDITIONS Site Address: Sample Point Code:
Observed Traffic Volume/Type:
Weather and Flow Conditions: Flow Rate Estimate (gpm):
Street Drainage Type:
� Curb and Gutter
� No Curb
� Gravel/Dirt Road
� Other: .
Catch Basin(s) Condition:
� Floatable Objects: .
� Oily Sheen/Staining
� Garbage/Debris/Organic matter
� Other: .
Sed-MH Condition:
� Floatable Objects: .
� Oily Sheen/Staining
� Garbage/Debris/Organic matter
� Other: .
Potential Sources of Pollution in Drainage Area:
� Parked vehicle(s)
� Telephone pole(s) staining? Y / N
� Garbage/Debris/Organic matter
� Staining on street
� Oily Sheen
� Pet Waste
� Industrial Activity: .
� Commercial Activity: .
� Other: .
Describe other conditions observed at the time of sample collection that may impact stormwater quality (e.g., construction activity, car repair, street maintenance, poor housekeeping): Photo(s) Taken? Y / N
Section 2 – Stormwater Sample collection Sample Location: Sample Time:
Sample Location Condition:
Sample ID: affix FO number sticker
Any deviations from sampling standard operating procedures? Y / N
Describe:
Duplicate sample collected here? Y / N Duplicate Sample ID: affix FO number sticker
Field blank collected here? Y / N Field Blank Sample ID: affix FO number sticker
Lab QC samples collected here? Y / N Lab QC Sample ID: N/A (same as Sample ID)

Final SAP Page F-3

Final SAP Page F-4
City of Portland Date:
Chain-of-Custody Page: ofBureau of Environmental Services
Collected By:
Project Name: UIC WPCF PERMIT MONFile Number: 4010.027 Matrix: STORMWTR
WPCL Sample I.D. LocationPointCode
SampleDate
SampleTime
SampleType
1 FO
2 FO
3 FO
4 FO
5 FO
6 FO
7 FO
8 FO
9 FO
10 FORelinquished By: 1. Relinquished By: 2. Relinquished By: 3. Relinquished By: 4.Signature: Time: Signature: Time: Signature: Time: Signature: Time:
Printed Name: Date: Printed Name: Date: Printed Name: Date: Printed Name: Date:
Received By: 1. Received By: 2. Received By: 3. Received By: 4.Signature: Time: Signature: Time: Signature: Time: Signature: Time:
Printed Name: Date: Printed Name: Date: Printed Name: Date: Printed Name: Date:
Organics
Pest
icide
s by
8081
Carb
amat
es by
531.2
Herb
icide
s by
515.3
Nutrients Field
Tem
pera
ture
(deg
C)
Meter
Ser
ial N
o.:
Cond
uctiv
ity (u
mhos
/cm)
Meter
Ser
ial N
o.:
pH (p
H Un
its)
Meter
Ser
ial N
o.:
Endo
thall
by 54
8.1
VOCs
by 82
60B
NCARequested Analyses
Glyp
hosa
te by
547
Dalap
on by
552.2
Diqu
at by
549.2
SVOC
s by 8
270C
PAHs
by 82
70-S
IM
Metals
Diss
olve
d Me
tals
by 20
0.8
Water Pollution Control Laboratory6543 N. Burlington Ave.Portland, Oregon 97203-4552(503) 823-5696
TSS
Tota
l Met
als by
200.8
Tota
l Cya
nide
Nitra
te-n
itrog
en
Sample Time recorded in PST
Metals list: Sb, As, Ba, Be, Cd, Cr, Cu, Pb, Hg, Se, Tl, Zn
General

Final SAP Page F-5
CAR # (assigned by QA/QC chemist)
City of Portland Water Pollution Control Laboratory
Corrective Action Report
This CAR form is to be utilized as documentation of a QA/QC non-conformance and subsequent corrective action. The CAR is initiated by the analyst and routed to the QA/QC Chemist. The CAR form should be submitted for QA approval before sample results are reported. CAR initiated by: Date: Lab area / analysis: Non-conformance: Samples affected: Corrective action: Conclusion / Comments: Comment required on sample report(s)? Yes / No Further action required? Yes / No Corrective action executed by: Completion date: Other approval: Date: QA/QC Chemist Section Verification: Date: Comment required on sample report(s)? Yes / No Further action required? Yes / No QA/QC Chemist comments:

Final SAP Page F-6
This page intentionally left blank.