Sampling and Analysis Plan and Quality Assurance Project ...
53
Sampling and Analysis Plan and Quality Assurance Project Plan Soos Creek Watershed Temperature and Dissolved Oxygen Total Maximum Daily Load Study February 2009 Alternate Formats Available 206-296-6519 TTY Relay: 711
Transcript of Sampling and Analysis Plan and Quality Assurance Project ...
Sampling and Analysis Plan and Quality Assurance Project Plan–Soos Creek
Sampling and Analysis Plan and Quality Assurance Project Plan
Soos Creek
Watershed Temperature and Dissolved Oxygen Total Maximum Daily Load Study
February 2009
Alternate Formats Available 206-296-6519 TTY Relay: 711

Sampling and Analysis Plan and Quality Assurance Project Plan–Soos Creek
Sampling and Analysis Plan and Quality Assurance Project Plan Soos Creek
Watershed Temperature and Dissolved Oxygen Total Maximum Daily Load Study Areas
February 2009
Prepared by Raymond K. Timm

Sampling and Analysis Plan and Quality Assurance Project Plan–Soos Creek
King County - ii -
2004 303(d) Listings that triggered this study:
Big Soos Creek (VY4301) – Temperature, Dissolved Oxygen, Fecal Coliform Little Soos Creek (TI91MT) – Temperature, Dissolved Oxygen, Fecal Coliform Little Soosette Creek (GS67LK, HH34YJ, RX82DV) – Dissolved Oxygen, Fecal Coliform Soosette Creek (HH34YJ) – Fecal Coliform Covington Creek (AU56VG) – Fecal Coliform Jenkins Creek (NP20EM) – Fecal Coliform Waterbody Number: WA-09-1026.
Approvals
Sinang Lee, TMDL Lead, Ecology Northwest Regional Office 1/21/2009
Dave Garland, Unit Supervisor, Ecology Northwest Regional Office 1/29/2009
Kevin Fitzpatrick, Section Manager, Ecology Northwest Regional Office 1/22/2009
Karol Erickson, Unit Supervisor, Ecology Modeling and Informational Support Unit
1/27/2009
Raymond Timm, Project Manager, King County Science Program, 1/8/2009
Curtis DeGasperi, Lead Hydrologist, King County Science Program, 4/15/2009
Katherine Bourbonais, Project Manager, King County Environmental Laboratory, 4/2/2009
Colin Elliott, Quality Assurance Officer, King County Environmental Laboratory, 4/2/2009
Sampling and Analysis Plan and Quality Assurance Project Plan–Soos Creek
King County - iii -
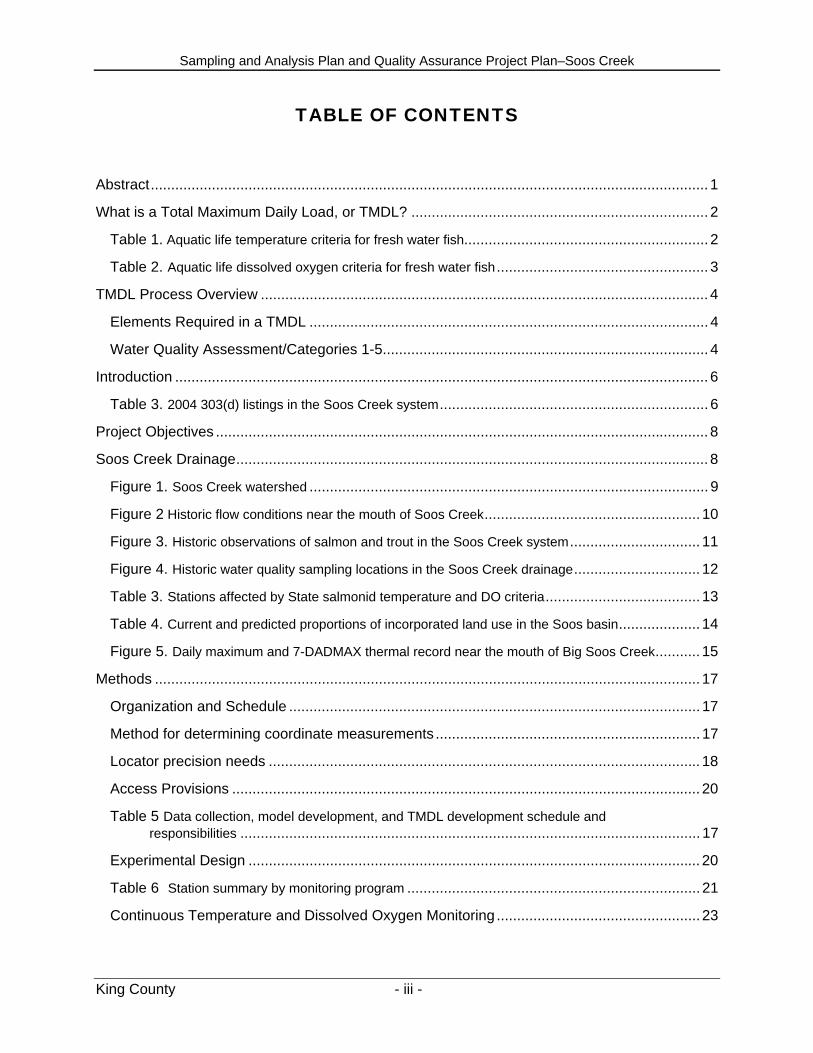
TABLE OF CONTENTS
Abstract......................................................................................................................................... 1
What is a Total Maximum Daily Load, or TMDL? ......................................................................... 2
Table 1. Aquatic life temperature criteria for fresh water fish............................................................ 2
Table 2. Aquatic life dissolved oxygen criteria for fresh water fish.................................................... 3
TMDL Process Overview .............................................................................................................. 4
Elements Required in a TMDL .................................................................................................. 4
Water Quality Assessment/Categories 1-5................................................................................ 4
Introduction ................................................................................................................................... 6
Table 3. 2004 303(d) listings in the Soos Creek system.................................................................. 6
Project Objectives ......................................................................................................................... 8
Soos Creek Drainage.................................................................................................................... 8
Figure 1. Soos Creek watershed .................................................................................................. 9
Figure 2 Historic flow conditions near the mouth of Soos Creek..................................................... 10
Figure 3. Historic observations of salmon and trout in the Soos Creek system................................ 11
Figure 4. Historic water quality sampling locations in the Soos Creek drainage............................... 12
Table 3. Stations affected by State salmonid temperature and DO criteria...................................... 13
Table 4. Current and predicted proportions of incorporated land use in the Soos basin.................... 14
Figure 5. Daily maximum and 7-DADMAX thermal record near the mouth of Big Soos Creek........... 15
Methods ...................................................................................................................................... 17
Organization and Schedule ..................................................................................................... 17
Method for determining coordinate measurements ................................................................. 17
Locator precision needs .......................................................................................................... 18
Access Provisions ................................................................................................................... 20
Table 5 Data collection, model development, and TMDL development schedule and responsibilities ................................................................................................................. 17
Experimental Design ............................................................................................................... 20
Table 6 Station summary by monitoring program ........................................................................ 21
Continuous Temperature and Dissolved Oxygen Monitoring .................................................. 23

Sampling and Analysis Plan and Quality Assurance Project Plan–Soos Creek
King County - iv -
Figure 6. Sections of Big Soos, Jenkins, and Covington creeks that are subject to supplemental spawning and incubation criteria ........................................................................................ 24
Synoptic Productivity Monitoring ............................................................................................. 25
Figure 7. Twenty four water quality grab sampling locations.................................................. 26
Synoptic Flow and Travel Time ............................................................................................... 27
Figure 8. Locations for time of travel study ................................................................................. 28
Riparian Shade Development ................................................................................................. 29
Figure 9 Monitoring locations for continuous water temperature, dissolved oxygen (DO), pH, and specific conductance ........................................................................................................ 30
Quality Control ............................................................................................................................ 31
Measurement Quality Objectives............................................................................................. 31
Field Methods and Techniques...................................................................................................32
Station Positioning Methods....................................................................................................32
Field Parameters/Methods ...................................................................................................... 32
Table 7 Field Parameters /Methods ........................................................................................... 32
Sampling Equipment, Maintenance and Calibration................................................................ 32
Sampling Equipment............................................................................................................ 32
Maintenance ........................................................................................................................ 33
Calibration............................................................................................................................ 33
Conventionals ...................................................................................................................... 33
Table 8 Conventional Parameters Sample Storage Containers and Holding Times ........................ 33
Discharge and Water Quality Monitoring................................................................................. 34
Table 9 Summary of field in-situ and laboratory quality control samples ........................................ 34
In situ Measurements .............................................................................................................. 35
Continuous Temperature and Dissolved Oxygen Monitoring .................................................. 36
Table 10 Field check quality control requirements for In-situ measurements and extended deployments .................................................................................................................... 36
Table 11 YSI field check quality control requirements............................................................ 37
Flow Measurements ................................................................................................................ 37
Water Sample Collection......................................................................................................... 37
Laboratory Measurement Procedures..................................................................................... 38
Table 12 King County Environmental Laboratory measurement procedures.......................... 39
Table 13 Laboratory quality control requirements ................................................................... 40
Sampling and Analysis Plan and Quality Assurance Project Plan–Soos Creek
King County - v -
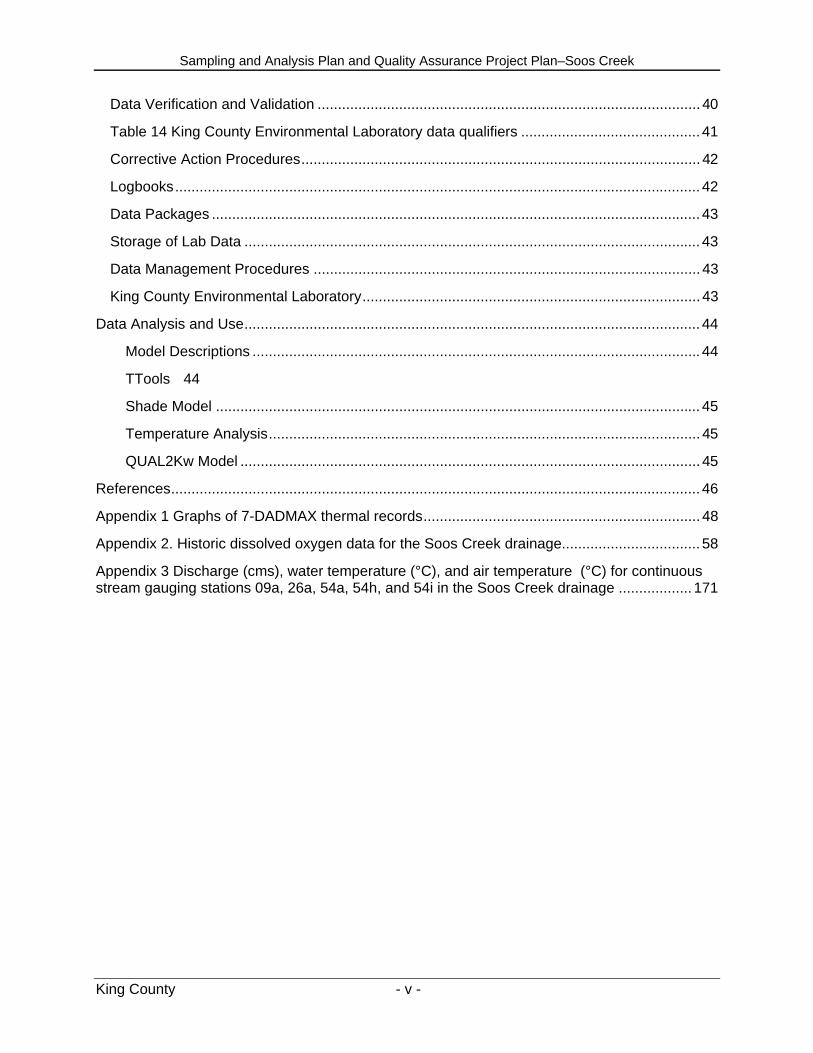
Data Verification and Validation .............................................................................................. 40
Table 14 King County Environmental Laboratory data qualifiers ............................................ 41
Corrective Action Procedures.................................................................................................. 42
Logbooks................................................................................................................................. 42
Data Packages ........................................................................................................................ 43
Storage of Lab Data ................................................................................................................ 43
Data Management Procedures ............................................................................................... 43
King County Environmental Laboratory................................................................................... 43
Data Analysis and Use................................................................................................................ 44
Model Descriptions .............................................................................................................. 44
TTools 44
Shade Model ....................................................................................................................... 45
Temperature Analysis.......................................................................................................... 45
QUAL2Kw Model ................................................................................................................. 45
References.................................................................................................................................. 46
Appendix 1 Graphs of 7-DADMAX thermal records.................................................................... 48
Appendix 2. Historic dissolved oxygen data for the Soos Creek drainage.................................. 58
Appendix 3 Discharge (cms), water temperature (°C), and air temperature (°C) for continuous stream gauging stations 09a, 26a, 54a, 54h, and 54i in the Soos Creek drainage .................. 171

Sampling and Analysis Plan and Quality Assurance Project Plan Soos Creek
King County - 1 -
ABSTRACT
Water quality monitoring by the King County Department of Natural Resources and Parks, and the Washington State Department of Ecology suggests that there are segments of the Soos Creek system that do not meet water quality standards for temperature or dissolved oxygen for varying periods during the year. The Soos Creek system is subject to two water quality criteria related to fish use of the system (i.e. salmonid spawning and incubation, and core summer rearing habitat). The segments that routinely experience excursions beyond these criteria are listed under Section 303(d) of the Clean Water Act as impaired waters. This study has field and lab components (i.e. data collection and analysis) that will be used to populate a water quality model that simulates the transport and fate of both point and non-point pollutant loadings including temperature and conventional parameters. The water quality model will be used to develop pollutant load reduction quantities needed to bring the streams into compliance with the state water quality standards. Data collection and model development represent a cooperative approach between King County and the Department of Ecology to develop Total Maximum Daily Load reduction targets for the Greater Soos Creek system.

Sampling and Analysis Plan and Quality Assurance Project Plan–Soos Creek
King County - 2 -
WHAT IS A TOTAL MAXIMUM DAILY LOAD, OR TMDL?
The federal Clean Water Act (CWA, 1972, and later modifications, 1977, 1981, 1987, 1990, and 2002) established a process to identify and clean up polluted waters. Under the Clean Water Act, every state has its own water quality standards designed to protect, restore and preserve water quality. Water quality standards consist of designated uses for protection (e.g. native biota and drinking water supply) and criteria necessary to achieve/ maintain those uses (USEPA 2002). In November 2006 the Washington State Department of Ecology (Ecology) revised the temperature and dissolved oxygen standards for specific streams depending on their use by various species and life-histories of fish (Table 1, Table 2) (Ecology 2006). These updated standards are in effect for this study.
Every two years, states are required to prepare a list of waterbodies--lakes, rivers, streams or marine waters--that do not meet water quality standards. This list of impaired waterbodies is mandated by section 303(d) of the Clean Water Act and is known as the 303(d) list. The list is developed through a process whereby the Washington State Department of Ecology (Ecology) solicits water quality data from local, state, and federal governments, tribes, industries, and citizen’s monitoring groups. These data are then compiled with other water quality data that were collected and maintained by Ecology. To ensure that the 303(d) list meets minimum standards of accuracy, all data collection and analysis methods are evaluated to be certain that candidate sites are appropriate for listing.
TABLE 1. Aquatic life temperature criteria for fresh water fish in Washington State. 7-DADMAX is the 7-day mean average daily maximum temperature. Category Highest 7-DADMAX
Char Spawning 9°C (48.2°F) Char Spawning and Rearing 12°C (53.6°F) Salmon and Trout Spawning 13°C (55.4°F) Core Summer Salmonid Habitat 16°C (60.8°F) Salmonid Spawning, Rearing, and Migration 17.5°C (63.5°F) Salmonid Rearing and Migration Only 17.5°C (63.5°F) Non-anadromous Interior Redband Trout 18°C (64.4°F) Indigenous Warm Water Species 20°C (68°F)
Sampling and Analysis Plan and Quality Assurance Project Plan–Soos Creek
King County - 3 -
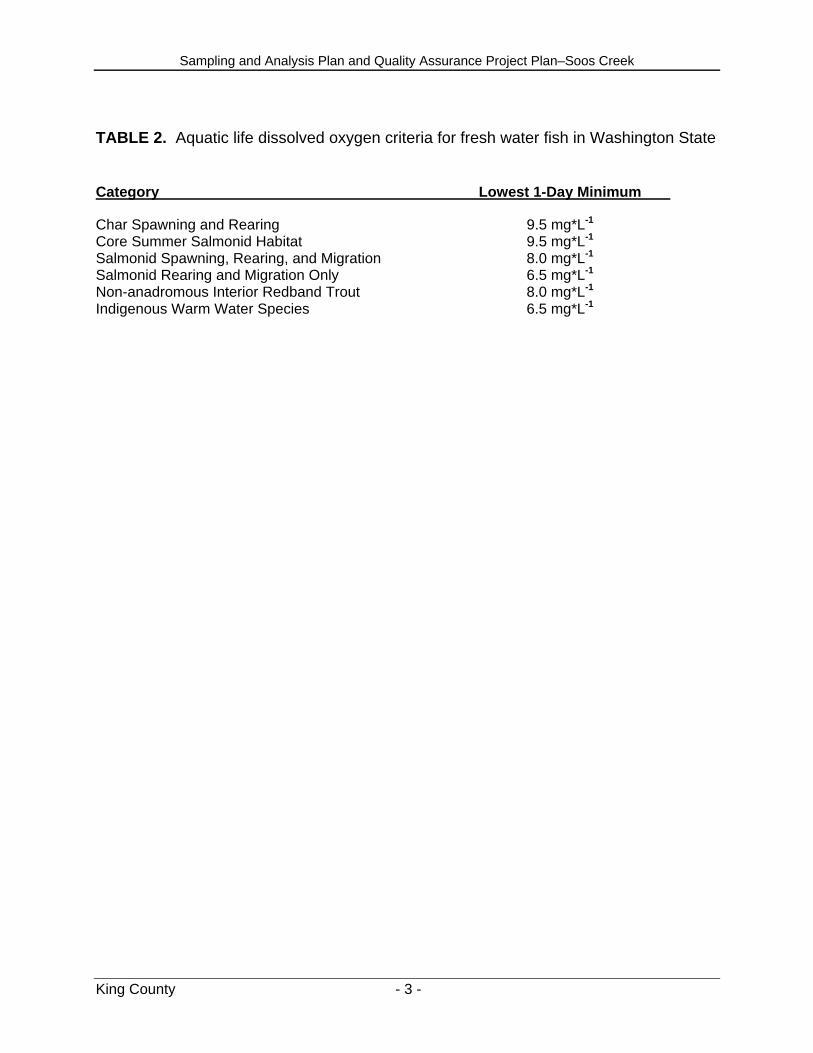
TABLE 2. Aquatic life dissolved oxygen criteria for fresh water fish in Washington State
Category Lowest 1-Day Minimum
Char Spawning and Rearing 9.5 mg*L-1
Core Summer Salmonid Habitat 9.5 mg*L-1 Salmonid Spawning, Rearing, and Migration 8.0 mg*L-1 Salmonid Rearing and Migration Only 6.5 mg*L-1 Non-anadromous Interior Redband Trout 8.0 mg*L-1 Indigenous Warm Water Species 6.5 mg*L-1
Sampling and Analysis Plan and Quality Assurance Project Plan–Soos Creek
King County - 4 -
TMDL PROCESS OVERVIEW
The Clean Water Act requires that a Total Maximum Daily Load (TMDL) be developed for each of the waterbodies on the 303(d) list. A TMDL identifies the extent to which waters are impaired by pollution. Listings lead to a in situ study that informs a cleanup strategy and monitoring plan that is developed by Ecology with local assistance (Ecology 2004).
ELEMENTS REQUIRED IN A TMDL
Identification of the pollutant loading capacity for a waterbody is an important step in developing a TMDL. The United States Environmental Protection Agency (USEPA) defines the loading capacity of an aquatic system as the amount of a pollutant that a waterbody can receive without violating water quality standards (USEPA 2001). The loading capacity provides a reference for reducing the amount of pollution in order to bring a waterbody into compliance with standards. The portion of the receiving water’s loading capacity assigned to a particular source is a load or wasteload allocation. By definition, a TMDL is the sum of the allocations, which must not exceed the loading capacity.
The goal of a TMDL is to ensure that impaired waters will be restored to the water quality standards as set forth in the CWA. Total maximum daily load studies include a quantitative assessment of water quality impairments and identify point and nonpoint sources believed to be causing the problems. The TMDL determines the amount of a given pollutant that can be discharged to a waterbody and still meet standards (the loading capacity) and allocates that load among the various sources.
If a pollutant comes from a point source such as a municipal or industrial facility’s discharge pipe, that facility’s share of the system loading capacity is called a wasteload allocation. The cumulative share of nonpoint sources such as from general urban, residential, or farm runoff, is referred to as a load allocation.
A TMDL must also consider seasonal variations and include an error term that incorporates incomplete knowledge about the causes of the water quality problem or its loading capacity. A reserve capacity for future loads from growth pressures is sometimes included as well. The sum of the wasteload and load allocations, the error, and any reserve capacity must not exceed the loading capacity (Ecology 2006).
WATER QUALITY ASSESSMENT/CATEGORIES 1-5
The 303(d) list identifies polluted waters in Washington. The Water Quality Assessment provides more detail about the condition of the State’s waters. This list categorizes waterbodies according to five criteria:
Category 1. Meets tested standards for clean water.
Category 2. Waters of concern.
Category 3. No data available.
Category 4. Polluted waters that do not require a TMDL because solutions are being implemented:

Sampling and Analysis Plan and Quality Assurance Project Plan–Soos Creek
King County - 5 -
4a. TMDL approved and is being implemented.
4b. Pollution control plan in place that should solve the problem.
4c. Impaired by a non-pollutant (e.g. low water flow, dams, culverts).
Category 5. Polluted waters that require a TMDL--or the 303(d) list.

Sampling and Analysis Plan and Quality Assurance Project Plan–Soos Creek
King County - 6 -
INTRODUCTION
Data collected by King County and others demonstrate that segments of the Soos Creek system are impaired relative to the water quality standards for temperature, dissolved oxygen, and fecal coliform bacteria (Table 3). On the basis of those data, Ecology included these segments in the 2004 303(d) list of impaired waters. Ecology and King County initiated a cooperative study to develop cleanup plans for temperature and dissolved oxygen in the greater Soos Creek system. The data collected in this effort will be used to populate a water quality model that will inform the cleanup plan and develop pollutant load reduction targets necessary to bring stream segments into compliance with the water quality standards for dissolved oxygen and temperature. This document summarizes the data collection and modeling efforts. Fecal coliform bacterial problems will be addressed in a separate study.
TABLE 3. 2004 303(d) listings in the Soos Creek system for dissolved oxygen (DO), temperature (T), and fecal coliform (FC) excursions beyond the federal Clean Water Act section 303(d) water quality standards. The table includes the name, state and county identifier, location, parameter for which the location is listed, and whether it was previously identified as out of compliance.
Waterbody Name
Listing ID
KC Station
ID
Location Information Parameter 98 List?
Big Soos Creek 15866 L320 22N 05E 03 DO Yes
Big Soos Creek 15867 M320 22N 05E 10 DO Yes
Big Soos Creek 13160 A320 21N 05E 16 FC Yes
Big Soos Creek 15870 L320 22N 05E 03 FC Yes
Big Soos Creek 15871 N320 22N 05E 23 FC Yes
Covington Creek 13162 C320 21N 05E 12 FC No
Jenkins Creek 13164 D320 22N 05E 36 FC Yes
Little Soos Creek 15858 U320 22N 05E 11 DO Yes
Little Soos Creek 13167 G320 22N 05E 26 FC Yes
Little Soos Creek 15859 U320 22N 05E 11 FC Yes
Little Soos Creek 7046 G320 22N 05E 26 T No
Little Soos Creek 15862 T320 22N 05E 24 T No
Little Soosette 15831 Y320 22N 05E 28 DO Yes

Sampling and Analysis Plan and Quality Assurance Project Plan–Soos Creek
King County - 7 -
Waterbody Name
Listing ID
KC Station
ID
Location Information Parameter 98 List?
Creek
Little Soosette Creek
15836 X320 22N 05E 33 DO Yes
Little Soosette Creek
15832 Y320 22N 05E 28 FC Yes
Little Soosette Creek
15837 X320 22N 05E 33 FC Yes
Little Soosette Creek
15849 V320 21N 05E 03 FC Yes
Soosette Creek 15840 B320 21N 05E 10 FC No
King County provides regional services throughout both incorporated and un-incorporated areas of the county. These services include land-use and natural resource management, sewage treatment, stormwater management, and water quality monitoring. The County has monitored water quality in local lakes, rivers, and streams for more than 30 years in the Ambient Streams and Rivers Routine Monitoring program.
The King County streams and rivers program monitors the larger streams in King County that could be impacted by the wastewater collection, conveyance and treatment system (those with pipe crossings and/or wastewater facilities adjacent to the streams). The primary purpose of this monitoring program is to perform regional water quality evaluation to determine whether the waters are being impacted by the county conveyance system; and whether other human activity negates the improvement in water quality realized by wastewater programs. The monitoring program also provides information as to the need for additional treatment and evaluation of the ecological health of the County’s waters (e.g., Table 3).
In addition to the streams and rivers program, the County is also engaged in hydrologic monitoring through the water and land resources division (WLRD) Watershed Support Unit Stream Monitoring Program started in 1987. The original purpose of the program was to collect rainfall and streamflow data to support hydrologic modeling in the Basin Planning Unit. The program provides hydrologic data for other units in WLRD and other Divisions within King County. The stream monitoring program operates continuous stream gauges throughout the County, with 5 in the Soos Creek system. In addition to continuous flow data, water and air temperature are often collected at the gauge sites and other water quality data may be collected as well (King County 1995).
Sampling and Analysis Plan and Quality Assurance Project Plan–Soos Creek
King County - 8 -
PROJECT OBJECTIVES
The project objectives for this TMDL study are to collect data and develop temperature and dissolved oxygen models for the Soos Creek system during summer low-flow conditions. These models will inform cleanup plans that will be developed and implemented by Ecology. In addition, these data could supplement the ambient monitoring programs conducted by King County, Cities of Kent, Auburn, Covington, Black Diamond, and others.
Specific tasks to be addressed in this study include:
• Characterize stream temperatures and processes governing the thermal regime in the Soos Creek system during critical conditions.
• Conduct supplemental critical-period surveys for physical, chemical, and biological measures relevant to dissolved oxygen levels in the system. Characterize nutrient levels in the system.
• Develop predictive temperature models of the greater Soos system under critical low-flow conditions. Apply the models to determine load allocations for effective shade and other surrogate measures to meet temperature water quality standards. Identify the areas influenced by lakes and wetlands and, if necessary, estimate the natural temperature regime.
• Develop predictive dissolved oxygen models and use the results to establish pollutant load reduction targets.
This TMDL investigation furthers the County's interests in maintaining and enhancing regional water quality. King County is cooperating with Ecology in this investigation by developing the study, performing the field investigations and laboratory analyses and calibrating the water quality model which will be used by Ecology to develop and implement a cleanup plan.
SOOS CREEK DRAINAGE
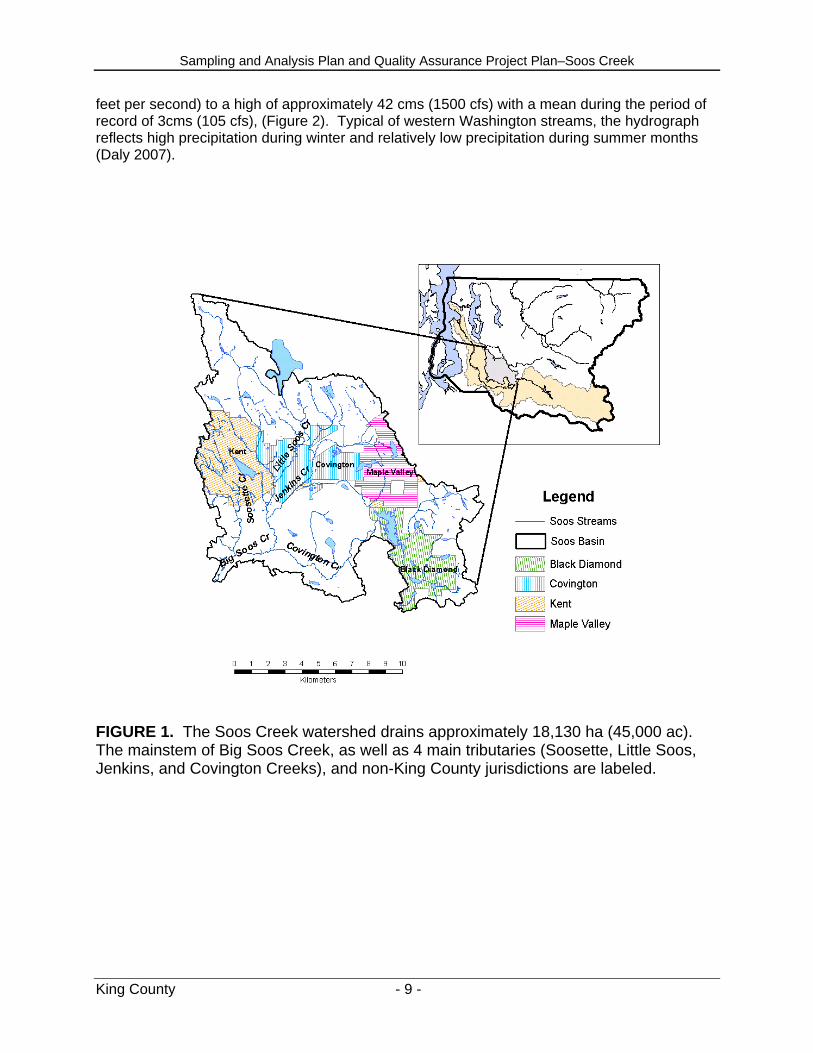
The Soos Creek system consists of mainstem Big Soos Creek and nearly 25 tributary streams. Total stream length within the drainage approaches 97 km (60 miles) draining an area of approximately 18,130 ha (45,000 ac). The system has four main tributaries; Little Soos, Soosette, Jenkins, and Covington creeks (Figure 1). All tributaries drain from flat to rolling terrain in the upper reaches of the watershed which was historically characterized by extensive wetlands and a water table that is very close to the surface. The headwaters of Big Soos Creek in the northwestern portion of the study area are approximately 137-160m (450 ft – 525 ft) elevation. In the central portion of the study area, Little Soos Creek originates at Lake Youngs, at an elevation of about 152m (500 ft), (King County 1989). Currently, portions of the upper reaches of Jenkins Creek are within the city limits of Maple Valley and others drain unincorporated King County. The headwaters of Covington Creek are in the Cities of Covington and Black Diamond and the lower reaches are within unincorporated King County. The middle reaches of Soosette and Jenkins creeks drain through the City of Kent. All major tributaries join Big Soos Creek below river kilometer 8 which ultimately drains south into the Green River through unincorporated King County. During water years 1994 – 1997, mean monthly discharges ranged from a low of approximately 0.7 cubic meters per second (cms), (24 cubic
Sampling and Analysis Plan and Quality Assurance Project Plan–Soos Creek
King County - 9 -
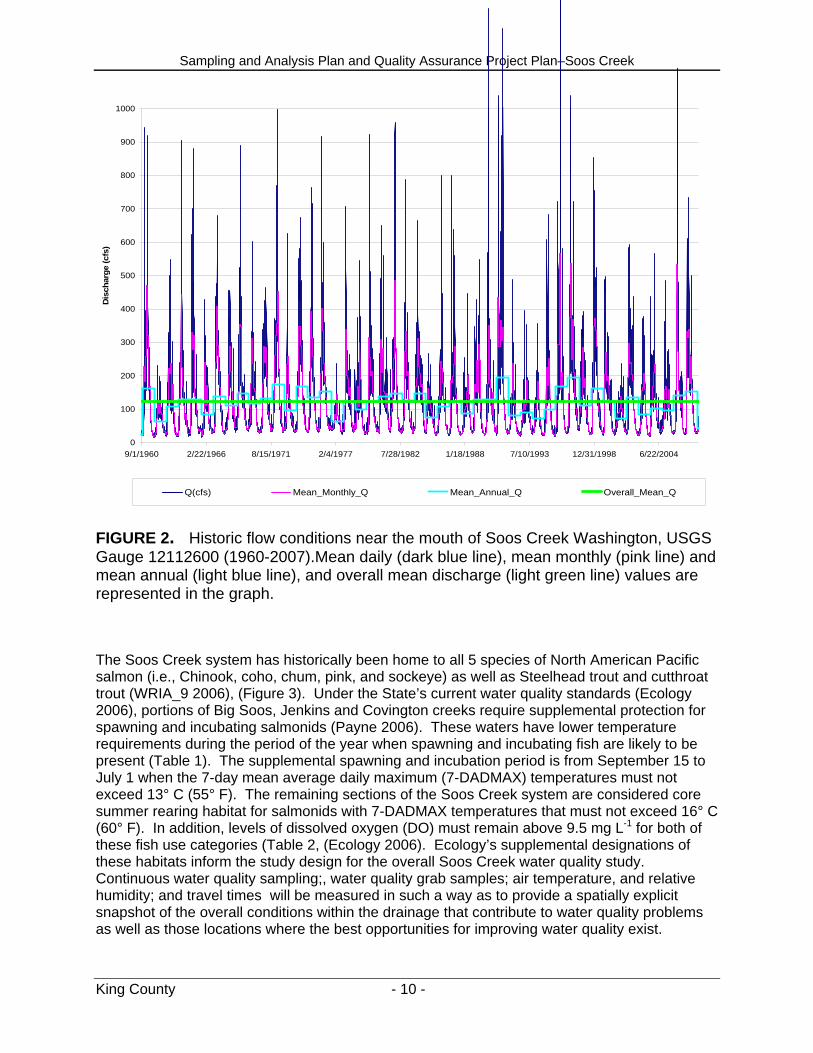
feet per second) to a high of approximately 42 cms (1500 cfs) with a mean during the period of record of 3cms (105 cfs), (Figure 2). Typical of western Washington streams, the hydrograph reflects high precipitation during winter and relatively low precipitation during summer months (Daly 2007).
FIGURE 1. The Soos Creek watershed drains approximately 18,130 ha (45,000 ac). The mainstem of Big Soos Creek, as well as 4 main tributaries (Soosette, Little Soos, Jenkins, and Covington Creeks), and non-King County jurisdictions are labeled.
Sampling and Analysis Plan and Quality Assurance Project Plan–Soos Creek
King County - 10 -
0
100
200
300
400
500
600
700
800
900
1000
9/1/1960 2/22/1966 8/15/1971 2/4/1977 7/28/1982 1/18/1988 7/10/1993 12/31/1998 6/22/2004
Dis
char
ge (c
fs)
Q(cfs) Mean_Monthly_Q Mean_Annual_Q Overall_Mean_Q
FIGURE 2. Historic flow conditions near the mouth of Soos Creek Washington, USGS Gauge 12112600 (1960-2007).Mean daily (dark blue line), mean monthly (pink line) and mean annual (light blue line), and overall mean discharge (light green line) values are represented in the graph.
The Soos Creek system has historically been home to all 5 species of North American Pacific salmon (i.e., Chinook, coho, chum, pink, and sockeye) as well as Steelhead trout and cutthroat trout (WRIA_9 2006), (Figure 3). Under the State’s current water quality standards (Ecology 2006), portions of Big Soos, Jenkins and Covington creeks require supplemental protection for spawning and incubating salmonids (Payne 2006). These waters have lower temperature requirements during the period of the year when spawning and incubating fish are likely to be present (Table 1). The supplemental spawning and incubation period is from September 15 to July 1 when the 7-day mean average daily maximum (7-DADMAX) temperatures must not exceed 13° C (55° F). The remaining sections of the Soos Creek system are considered core summer rearing habitat for salmonids with 7-DADMAX temperatures that must not exceed 16° C (60° F). In addition, levels of dissolved oxygen (DO) must remain above 9.5 mg L-1 for both of these fish use categories (Table 2, (Ecology 2006). Ecology’s supplemental designations of these habitats inform the study design for the overall Soos Creek water quality study. Continuous water quality sampling;, water quality grab samples; air temperature, and relative humidity; and travel times will be measured in such a way as to provide a spatially explicit snapshot of the overall conditions within the drainage that contribute to water quality problems as well as those locations where the best opportunities for improving water quality exist.

Sampling and Analysis Plan and Quality Assurance Project Plan–Soos Creek
King County - 11 -
FIGURE 3. Historic observations of salmon and trout in the Soos Creek system. Documented locations of Chinook, coho, chum, pink and sockeye salmon; and Steelhead and cutthroat trout are represented by colored dots. Note that some observations may be obscured by superimposed symbols.
3a

Sampling and Analysis Plan and Quality Assurance Project Plan–Soos Creek
King County - 12 -
FIGURE 4. Historic water quality sampling locations in the Soos Creek drainage. Sampling performed by King County and University of Washington
3d

Sampling and Analysis Plan and Quality Assurance Project Plan–Soos Creek
King County - 13 -
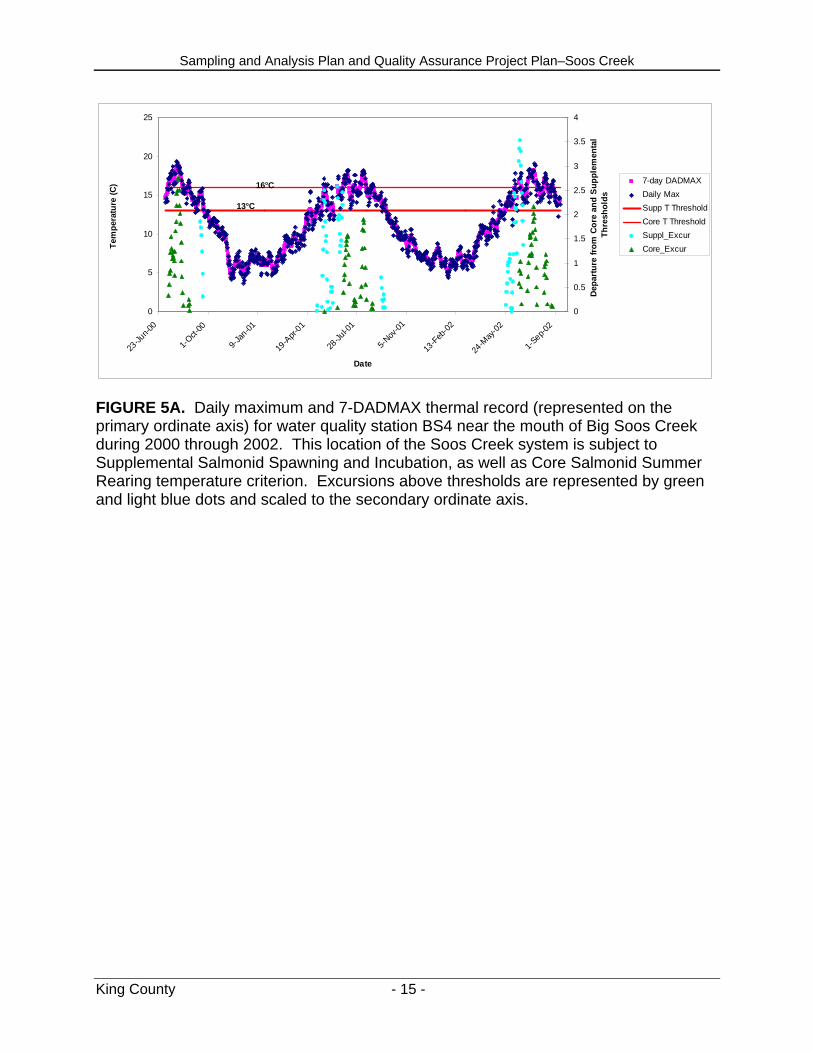
In addition to the sampling locations where temperature and dissolved oxygen excursions triggered the 303(d) listing for the Soos Creek system, there are 17 additional water quality sampling locations within the drainage that were used to inform the listings in the system (King County 1995). Daily temperature measurements were taken at these stations by the County and the University of Washington and were analyzed for the period of record at each station (Table 3). For all water quality sampling stations except JE2, there are excursions beyond the 7-DADMAX during the core rearing periods of the year. In addition, the stations within the supplemental spawning and incubation reaches of Big Soos, Covington, and Jenkins creeks, exhibit chronic excursions for both spawning and rearing criteria. For example, the thermal and dissolved oxygen record for gauging station BS4 indicates regular excursions beyond the State’s water quality criteria (Figures 5a, 5b). Thermal records from the remaining 17 monitoring locations are presented in Appendix 1
Dissolved oxygen data that were collected as part of the King County routine streams and rivers monitoring program were used in the 303(d) determination for the Soos Creek system. These data were derived from monthly grab samples from 26 sampling locations throughout the system, 17 of which triggered the 2004 listing (Table 3),(Ecology 2005). Measured DO concentrations were 0.06 – 8.8 mg/L below the State water quality standard of 9.5 mg/L for salmonid spawning, incubation and rearing. The DO record for all existing sampling locations in the Soos Creek system can be found in Appendix 2.
TABLE 3. Existing water quality sampling station locations, period of record, availability of parameters measured, and whether or not respective stations are affected by State salmonid temperature and DO criteria. Core and supplemental water quality criteria indicate that 7-DADMAX temperatures must not exceed 16 C and 13 C respectively, and DO must not go below 9.5 mgL-1 during critical periods of the year.
Station Description Agency Start Date End Date Temp Q Core Supp.
BS4 Big Soos Creek mouth
KC 7-Jul-00 12-Sep-02 Yes No Yes Yes
26a Jenkins Creek near mouth
KC 8/1/1987 N/A Yes Yes Yes Yes
JE1 Jenkins Creek mainstem
UW 7-Jul-00 26-Oct-01 Yes No Yes Yes
CO2 Covington Creek mainstem
UW 7-Jul-00 12-Sep-02 Yes No Yes Yes
09a Covington Creek (near mouth)
KC 1/1/1988 N/A Yes Yes Yes Yes
BS3 Big Soos mainstem
UW 7-Jul-00 12-Sep-02 Yes No Yes No
BS2 Big Soos mainstem (upstream)
UW 7-Jul-00 12-Sep-02 Yes No Yes No

Sampling and Analysis Plan and Quality Assurance Project Plan–Soos Creek
King County - 14 -
Station Description Agency Start Date End Date Temp Q Core Supp.
BS1.5 Big Soos mainstem (upstream)
UW 22-Mar-01
12-Sep-02 Yes No Yes No
D1 Big Soos mainstem (upstream)
UW 29-Mar-01
10-Sep-01 Yes No Yes No
LS1 Little Soos Creek (near mouth)
UW 18-Jul-00 12-Sep-02 Yes No Yes No
LS2 Little Soos Creek (upstream)
UW 3-Apr-01 12-Sep-02 Yes No Yes No
54i Little Soos Creek at SE 272nd
KC 30-Sep-95
N/A Yes Yes Yes No
JE2 Jenkins Creek mainstem (upstream)
UW 18-Jul-00 12-Sep-02 Yes No Yes No
CO1 Covington Creek mainstem (upstream)
UW 7-Jul-00 12-Sep-02 Yes No Yes No
CT1 Covington Creek tributary
UW 18-Jul-00 12-Sep-02 Yes No Yes No
54h Soosette Creek Above SR 18
KC 12/1/1993
N/A Yes Yes Yes No
ST1 Soosette Creek Below SR 18
UW 18-Jul-00 Yes No Yes No
An ancillary consideration in this study is that the King County comprehensive plan (County 2004) has anticipated that substantial portions of the Soos Creek watershed will incorporate and/or urbanize by 2025 (Table 4). Under this plan the current watershed population of approximately 112,000 people could increase. Resulting potential impacts to surface waters is reasonably expected to increase (County 2004).
TABLE 4. Current and predicted proportions of incorporated land use in the Soos basin, relative to current urban growth boundaries.
Area Current (ha) Current % Build-out (ha) Build-out %
Unincorporated 533,070 96 426,672 77
Incorporated 16,766 4 123,164 23
Sampling and Analysis Plan and Quality Assurance Project Plan–Soos Creek
King County - 15 -
0
5
10
15
20
25
23-Ju
n-00
1-Oct-
00
9-Jan
-01
19-A
pr-01
28-Ju
l-01
5-Nov
-01
13-Feb
-02
24-M
ay-02
1-Sep-0
2
Date
Tem
pera
ture
(C)
0
0.5
1
1.5
2
2.5
3
3.5
4
Dep
artu
re fr
om C
ore
and
Supp
lem
enta
l Th
resh
olds
7-day DADMAXDaily MaxSupp T ThresholdCore T ThresholdSuppl_ExcurCore_Excur
16°C
13°C
FIGURE 5A. Daily maximum and 7-DADMAX thermal record (represented on the primary ordinate axis) for water quality station BS4 near the mouth of Big Soos Creek during 2000 through 2002. This location of the Soos Creek system is subject to Supplemental Salmonid Spawning and Incubation, as well as Core Salmonid Summer Rearing temperature criterion. Excursions above thresholds are represented by green and light blue dots and scaled to the secondary ordinate axis.

Sampling and Analysis Plan and Quality Assurance Project Plan–Soos Creek
King County - 16 -
-10
-5
0
5
10
15
20
25
March
-71
Augu
st-76
Febr
uary-
82
Augu
st-87
Janu
ary-9
3
July-
98
Janu
ary-0
4
July-
09
DO
mgL̂
-1
-10
-5
0
5
10
15
20
25
DO mgL^-1ThresholdDeparture mgL^-1
FIGURE 5B. Historic dissolved oxygen levels and excursions below current State water quality standards for spawning, incubating, and rearing salmonids in the Soos Creek system. Data source is monthly grab samples from the King County routine streams and rivers monitoring program (see Table 3). Purple squares represent DO measurements from field and laboratory analyses, light blue triangles represent excursions below the threshold value in mgL-1. The threshold value is represented by the red line.
Sampling and Analysis Plan and Quality Assurance Project Plan–Soos Creek
King County - 17 -
METHODS
ORGANIZATION AND SCHEDULE
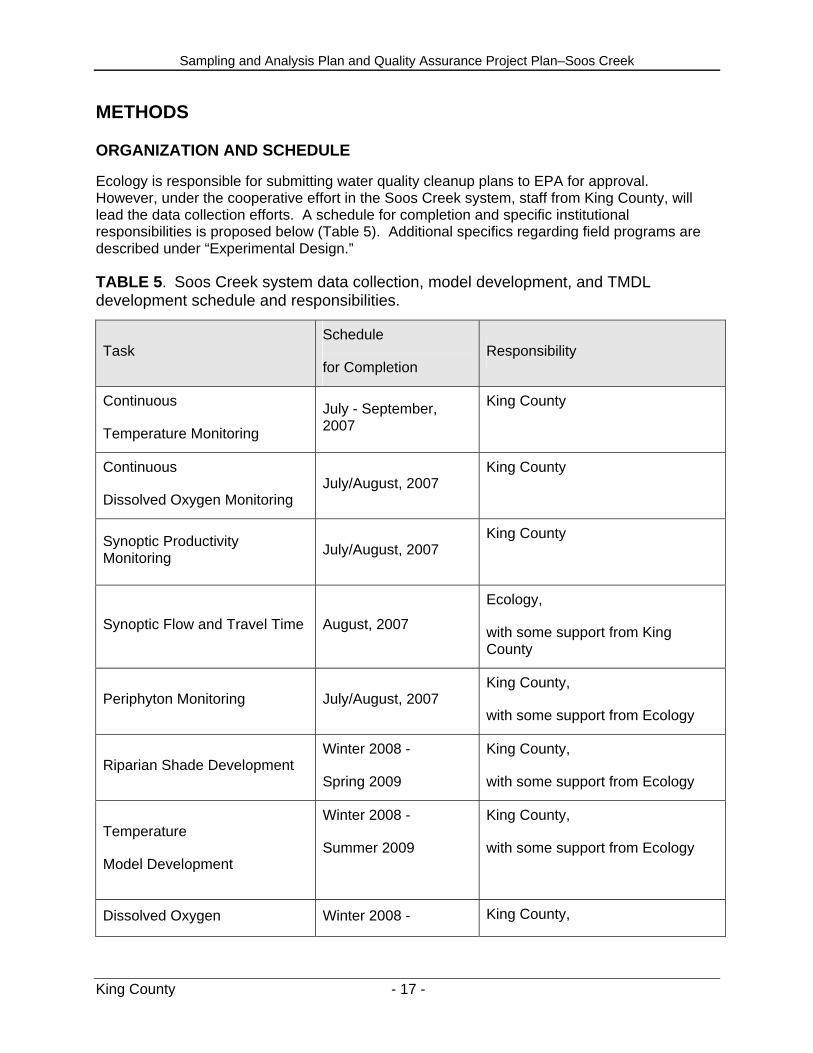
Ecology is responsible for submitting water quality cleanup plans to EPA for approval. However, under the cooperative effort in the Soos Creek system, staff from King County, will lead the data collection efforts. A schedule for completion and specific institutional responsibilities is proposed below (Table 5). Additional specifics regarding field programs are described under “Experimental Design.”
TABLE 5. Soos Creek system data collection, model development, and TMDL development schedule and responsibilities.
Task Schedule
for Completion Responsibility
Continuous
Temperature Monitoring
July - September, 2007
King County
Continuous
Dissolved Oxygen Monitoring July/August, 2007
King County
Synoptic Productivity Monitoring July/August, 2007
King County
Synoptic Flow and Travel Time August, 2007
Ecology,
with some support from King County
Periphyton Monitoring July/August, 2007 King County,
with some support from Ecology
Riparian Shade Development Winter 2008 -
Spring 2009
King County,
with some support from Ecology
Temperature
Model Development
Winter 2008 -
Summer 2009
King County,
with some support from Ecology
Dissolved Oxygen Winter 2008 - King County,
Sampling and Analysis Plan and Quality Assurance Project Plan–Soos Creek
King County - 18 -
Model Development Summer 2009 with some support from Ecology
Draft TMDL Technical Report December 2009 King County,
with some support from Ecology
Final TMDL Technical Report February 2010 Ecology
TMDL Submittal Report March 2010 Ecology
Detailed Implementation Plan March 2011 Ecology
Final EIM Data Processing March 2009 King County
METHOD FOR DETERMINING COORDINATE MEASUREMENTS
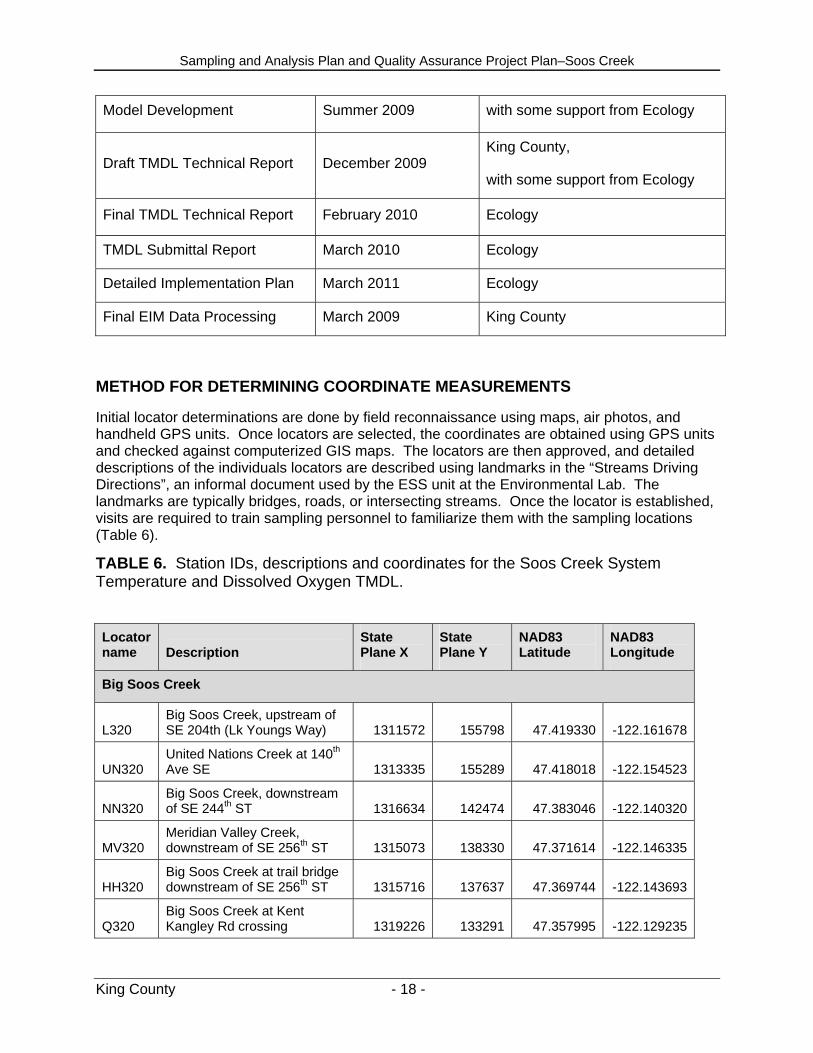
Initial locator determinations are done by field reconnaissance using maps, air photos, and handheld GPS units. Once locators are selected, the coordinates are obtained using GPS units and checked against computerized GIS maps. The locators are then approved, and detailed descriptions of the individuals locators are described using landmarks in the “Streams Driving Directions”, an informal document used by the ESS unit at the Environmental Lab. The landmarks are typically bridges, roads, or intersecting streams. Once the locator is established, visits are required to train sampling personnel to familiarize them with the sampling locations (Table 6).
TABLE 6. Station IDs, descriptions and coordinates for the Soos Creek System Temperature and Dissolved Oxygen TMDL.
Locator name Description
State Plane X
State Plane Y
NAD83 Latitude
NAD83 Longitude
Big Soos Creek
L320 Big Soos Creek, upstream of SE 204th (Lk Youngs Way) 1311572 155798 47.419330 -122.161678
UN320 United Nations Creek at 140th Ave SE 1313335 155289 47.418018 -122.154523
NN320 Big Soos Creek, downstream of SE 244th ST 1316634 142474 47.383046 -122.140320
MV320 Meridian Valley Creek, downstream of SE 256th ST 1315073 138330 47.371614 -122.146335
HH320 Big Soos Creek at trail bridge downstream of SE 256th ST 1315716 137637 47.369744 -122.143693
Q320 Big Soos Creek at Kent Kangley Rd crossing 1319226 133291 47.357995 -122.129235

Sampling and Analysis Plan and Quality Assurance Project Plan–Soos Creek
King County - 19 -
Locator name Description
State Plane X
State Plane Y
NAD83 Latitude
NAD83 Longitude
FF320
Soos Trib downstream of SE 288th ST and Kent Black Diamond RD 1317705 128132 47.343783 -122.135019
GG320
Big Soos Creek downstream of Kent Black Diamond Rd and trib. 1317645 128035 47.343514 -122.135254
AA320
Big Soos Creek, downstream of Jenkins, East of 154th Ave SE at SE 296th ST 1317684 125229 47.335825 -122.134905
A320
Big Soos Creek, at USGS gage at 13150 Auburn/Black Diamond Rd 1309971 116825 47.312427 -122.165419
Soosette Creek
ST320 Soosette Creek, upstream of SE 288th ST 1312184 128173 47.343637 -122.157287
Little Soos Creek
LY320
Little Soos Creek near Lake Youngs outlet, downstream of 164th Ave SE 1321119 148763 47.400492 -122.122645
LS320 Little Soos Creek at SE 240th ST 1324309 143829 47.387113 -122.109436
G320 Little Soos Creek downstream of Kent Kangley Rd 1320103 133268 47.357972 -122.125696
JT320 Jenkins Trib upstream of SE 248th ST 1338032 140918 47.379744 -122.053860
TT320 Little Soos (Jenkins Trib), downstream of SE 256th ST 1326766 138419 47.372395 -122.099160
Jenkins Creek
SS320 Jenkins Creek downstream of SE 256th ST 1327291 138419 47.372419 -122.097041
JK320 Jenkins Creek downstream of Kent Kangley Rd 1325834 133151 47.357913 -122.102570
D320 Jenkins Creek upstream of Kent Black Diamond RD 1319047 126900 47.340468 -122.129523
Covington Creek
Z320 Covington Creek below Lake Sawyer at 224th Ave SE 1339866 124875 47.335847 -122.045439
C320 Covington Creek at Auburn Black Diamond Rd 1327034 116444 47.312171 -122.096622
Sampling and Analysis Plan and Quality Assurance Project Plan–Soos Creek
King County - 20 -
Locator name Description
State Plane X
State Plane Y
NAD83 Latitude
NAD83 Longitude
CT320
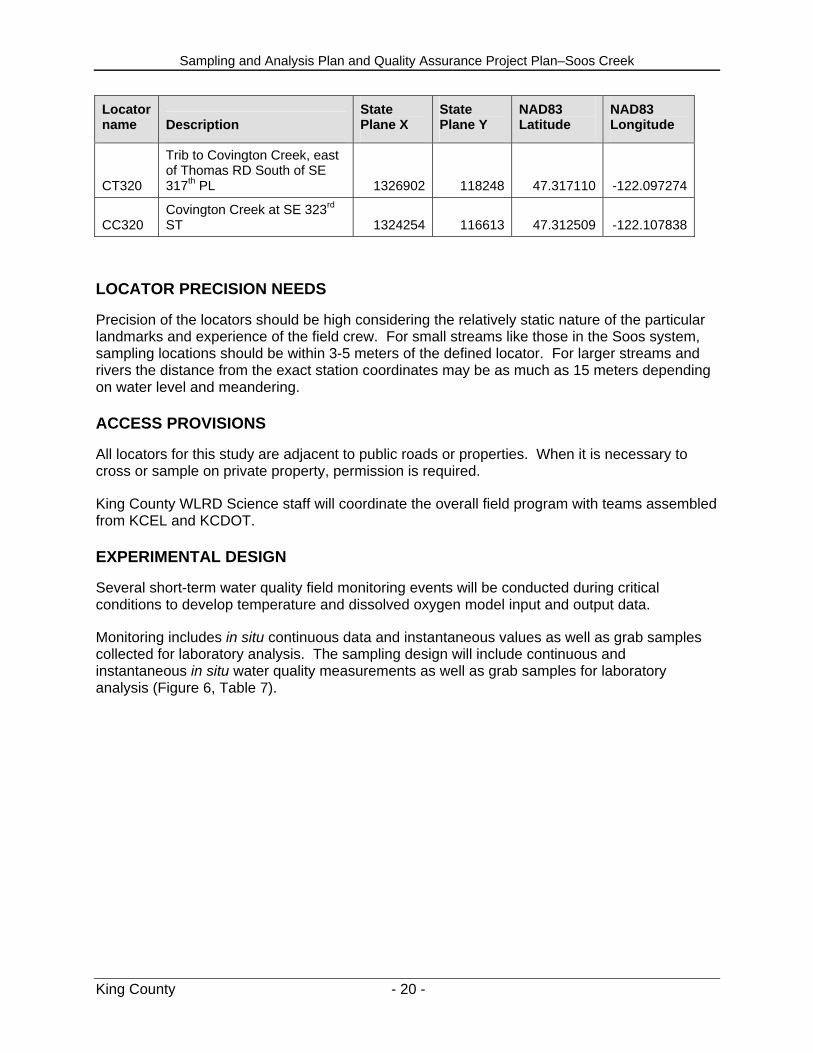
Trib to Covington Creek, east of Thomas RD South of SE 317th PL 1326902 118248 47.317110 -122.097274
CC320 Covington Creek at SE 323rd ST 1324254 116613 47.312509 -122.107838
LOCATOR PRECISION NEEDS
Precision of the locators should be high considering the relatively static nature of the particular landmarks and experience of the field crew. For small streams like those in the Soos system, sampling locations should be within 3-5 meters of the defined locator. For larger streams and rivers the distance from the exact station coordinates may be as much as 15 meters depending on water level and meandering.
ACCESS PROVISIONS
All locators for this study are adjacent to public roads or properties. When it is necessary to cross or sample on private property, permission is required.
King County WLRD Science staff will coordinate the overall field program with teams assembled from KCEL and KCDOT.
EXPERIMENTAL DESIGN
Several short-term water quality field monitoring events will be conducted during critical conditions to develop temperature and dissolved oxygen model input and output data.
Monitoring includes in situ continuous data and instantaneous values as well as grab samples collected for laboratory analysis. The sampling design will include continuous and instantaneous in situ water quality measurements as well as grab samples for laboratory analysis (Figure 6, Table 7).
Sampling and Analysis Plan and Quality Assurance Project Plan–Soos Creek
King County - 21 -
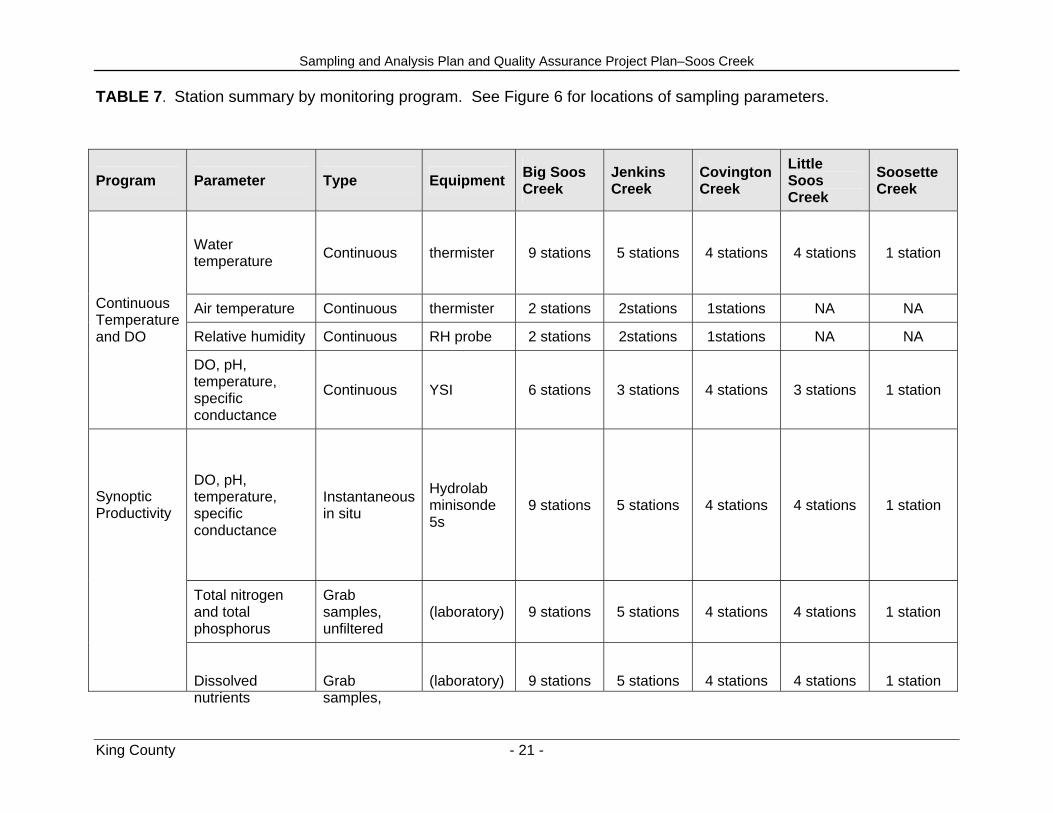
TABLE 7. Station summary by monitoring program. See Figure 6 for locations of sampling parameters.
Program Parameter Type Equipment Big Soos Creek
Jenkins Creek
Covington Creek
Little Soos Creek
Soosette Creek
Water temperature Continuous thermister 9 stations 5 stations 4 stations 4 stations 1 station
Air temperature Continuous thermister 2 stations 2stations 1stations NA NA
Relative humidity Continuous RH probe 2 stations 2stations 1stations NA NA
Continuous Temperature and DO
DO, pH, temperature, specific conductance
Continuous YSI 6 stations 3 stations 4 stations 3 stations 1 station
DO, pH, temperature, specific conductance
Instantaneous in situ
Hydrolab minisonde 5s
9 stations 5 stations 4 stations 4 stations 1 station
Total nitrogen and total phosphorus
Grab samples, unfiltered
(laboratory) 9 stations 5 stations 4 stations 4 stations 1 station
Synoptic Productivity
Dissolved nutrients
Grab samples,
(laboratory) 9 stations 5 stations 4 stations 4 stations 1 station

Sampling and Analysis Plan and Quality Assurance Project Plan–Soos Creek
King County - 22 -
Program Parameter Type Equipment Big Soos Creek
Jenkins Creek
Covington Creek
Little Soos Creek
Soosette Creek
(nitrate+nitrite, ammonia nitrogen, orthophosphorus)
filtered
Chlorophyll a Grab samples (laboratory) 9 stations 5 stations 4 stations 4 stations 1 station
TOC, DOC, alkalinity Grab samples (laboratory) 9 stations 5 stations 4 stations 4 stations 1 station
Periphyton Grab samples (see Methods) 9 stations 5 stations 4 stations 4 stations 1 station
Discharge Instantaneousin situ
Swoffer 2100 Flow meter and wading rod
9 stations 5 stations 4 stations 4 stations 1 station
Synoptic Flow and Travel Time
Tracer concentration Continuous Fluorometer
2 release stations and 3 monitoring stations
1 release station and 2 monitoring stations
1 release stations and 1 monitoring stations
1 release station and 1 monitoring stations
NA
Shade Riparian shade Instantaneous in situ
Hemiview camera 2 stations 3 stations 1 stations 2 stations 1 station

Sampling and Analysis Plan and Quality Assurance Project Plan–Soos Creek
King County - 23 -
CONTINUOUS TEMPERATURE AND DISSOLVED OXYGEN MONITORING
Continuous temperature data will be summarized by daily minimum and maximum values for model calibration and validation. Both air temperature and water temperature are necessary to model stream conditions. Because elevation differences are small within the Soos Creek system, air temperature thermistors and relative humidity probes will be deployed at a subset of five sites (Figure 7, Table 7). Water, air and RH thermistors will be deployed around July 1 and retrieved around October 1.
As with temperature, continuous dissolved oxygen data will be summarized by daily minimum and maximum values for model calibration and validation. Equipment will be deployed during July 23 through July 27. The monitoring period should occur during highest temperatures and lowest dissolved oxygen conditions as flows approach summer low-flow conditions. Equipment will record dissolved oxygen, temperature, pH, and specific conductance at 18 locations within the system (Figure 7).

Sampling and Analysis Plan and Quality Assurance Project Plan–Soos Creek
King County - 24 -
FIGURE 6. Sections of Big Soos, Jenkins, and Covington creeks that are subject to supplemental spawning and incubation criteria are represented by bold blue lines. Remaining stream reaches are considered core salmonid summer rearing habitat. Red triangles indicate locations of continuous water quality sampling for DO, temperature, pH, and specific conductance.
Sampling and Analysis Plan and Quality Assurance Project Plan–Soos Creek
King County - 25 -
SYNOPTIC PRODUCTIVITY MONITORING
River temperature and dissolved oxygen generally reach critical levels during late July or early August as stream discharges approach summer low-flow conditions. A synoptic monitoring program will be conducted over a two-day period in the Soos Creek watershed to characterize water quality parameters relevant to modeling temperature and dissolved oxygen.
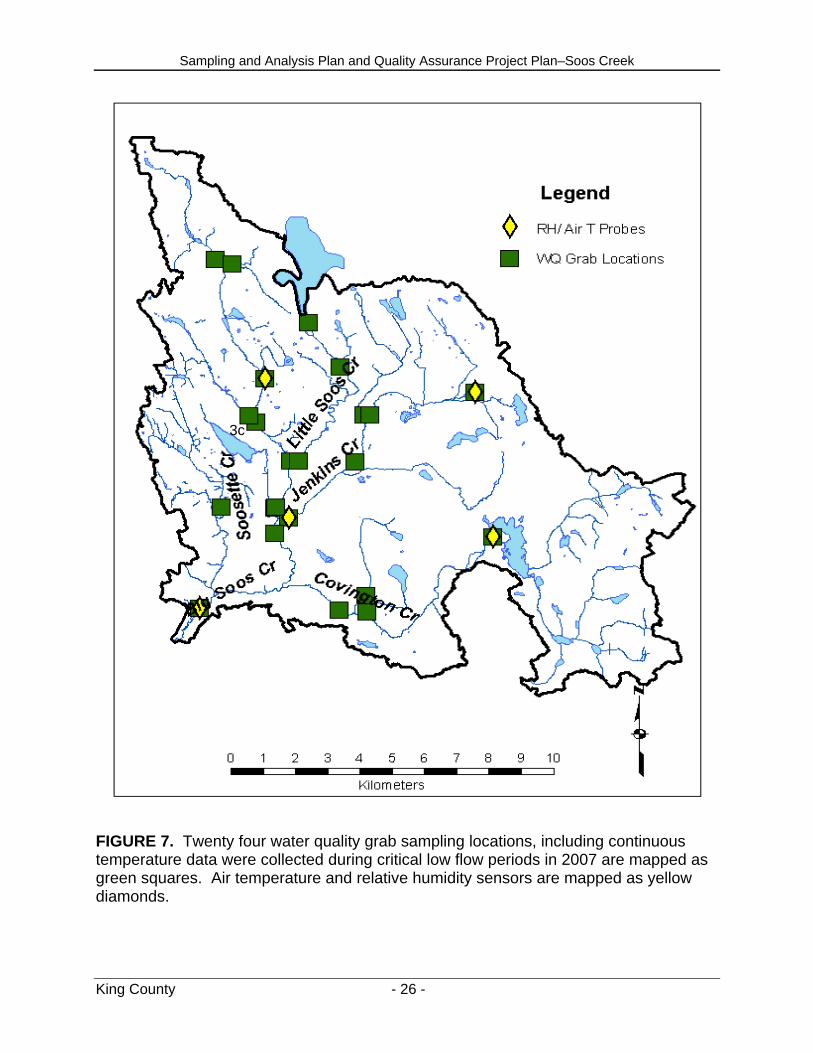
Field teams will record in situ parameters (temperature, dissolved oxygen, pH, and specific conductance) and collect representative grab samples for laboratory analysis early in the morning and late in the afternoon on two consecutive days for nutrients and productivity (Figure 7, Table 7). Timing will depend on summer 2007 hydrologic conditions and monitoring will be conducted near baseflow and will coincide with continuous monitoring field work during periods that are not influenced by storm events. Grab samples will be analyzed for total nitrogen, nitrate plus nitrite, ammonia, total phosphorus, orthophosphate, total organic carbon, dissolved organic carbon, alkalinity, and chlorophyll a and phaeophytin a. Samples will be delivered to the laboratory twice per day.
Field teams will characterize periphyton density at a subset of sites located on the main stem of Soos Creek system. Periphyton biomass will be estimated at the eighteen continuous sonde deployment sites within the Soos Creek watershed (Figure 7). Periphyton biomass samples will be collected by scraping material from a measured surface area on representative rocks. Three samples will be collected at each site. The material will then be analyzed for chlorophyll a and ash-free dry weight following (Joy 2001.).
Sampling and Analysis Plan and Quality Assurance Project Plan–Soos Creek
King County - 26 -
FIGURE 7. Twenty four water quality grab sampling locations, including continuous temperature data were collected during critical low flow periods in 2007 are mapped as green squares. Air temperature and relative humidity sensors are mapped as yellow diamonds.
3c
Sampling and Analysis Plan and Quality Assurance Project Plan–Soos Creek
King County - 27 -
SYNOPTIC FLOW AND TRAVEL TIME
The movement of water within stream systems strongly influences water quality, especially at the interface of surface and subsurface flows which influences temperature, dissolved oxygen, and nutrient concentrations (Edwards 1998). Knowledge of the fine-scale distribution of flows within a watershed enables the estimation of groundwater exchanges. In addition, travel time provides a fundamental model calibration and validation parameter and also enhances understanding of the system (Kannel 2007).
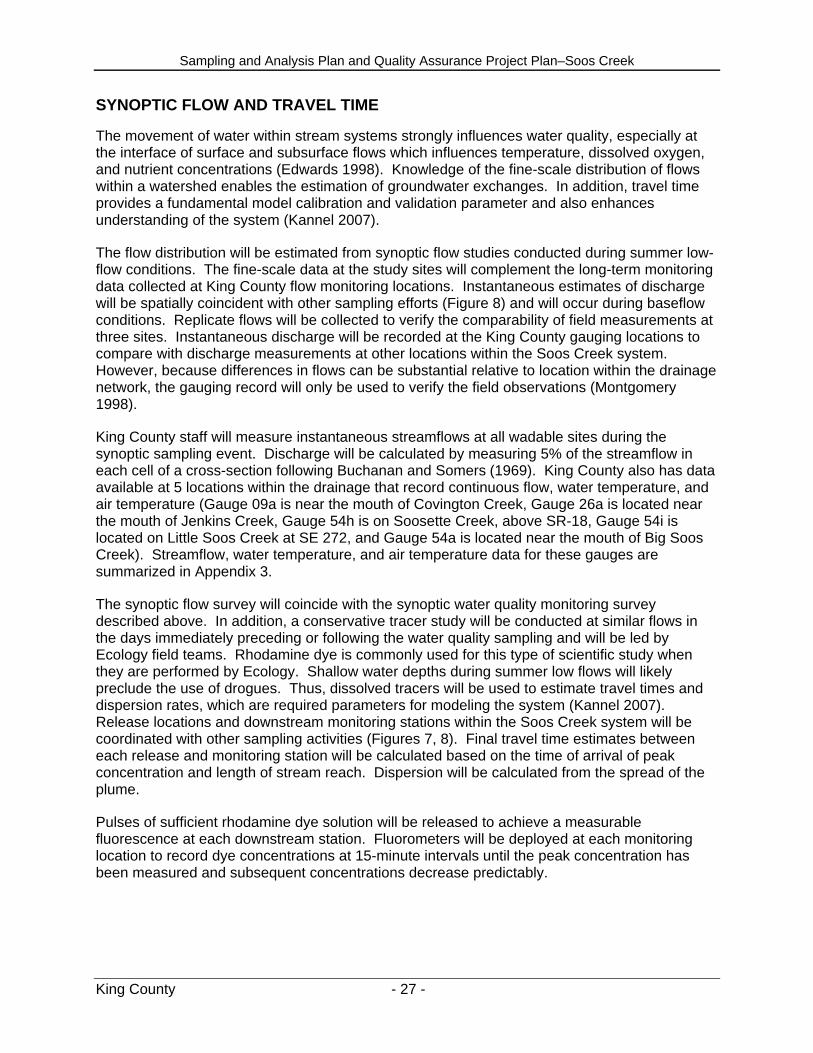
The flow distribution will be estimated from synoptic flow studies conducted during summer low-flow conditions. The fine-scale data at the study sites will complement the long-term monitoring data collected at King County flow monitoring locations. Instantaneous estimates of discharge will be spatially coincident with other sampling efforts (Figure 8) and will occur during baseflow conditions. Replicate flows will be collected to verify the comparability of field measurements at three sites. Instantaneous discharge will be recorded at the King County gauging locations to compare with discharge measurements at other locations within the Soos Creek system. However, because differences in flows can be substantial relative to location within the drainage network, the gauging record will only be used to verify the field observations (Montgomery 1998).
King County staff will measure instantaneous streamflows at all wadable sites during the synoptic sampling event. Discharge will be calculated by measuring 5% of the streamflow in each cell of a cross-section following Buchanan and Somers (1969). King County also has data available at 5 locations within the drainage that record continuous flow, water temperature, and air temperature (Gauge 09a is near the mouth of Covington Creek, Gauge 26a is located near the mouth of Jenkins Creek, Gauge 54h is on Soosette Creek, above SR-18, Gauge 54i is located on Little Soos Creek at SE 272, and Gauge 54a is located near the mouth of Big Soos Creek). Streamflow, water temperature, and air temperature data for these gauges are summarized in Appendix 3.
The synoptic flow survey will coincide with the synoptic water quality monitoring survey described above. In addition, a conservative tracer study will be conducted at similar flows in the days immediately preceding or following the water quality sampling and will be led by Ecology field teams. Rhodamine dye is commonly used for this type of scientific study when they are performed by Ecology. Shallow water depths during summer low flows will likely preclude the use of drogues. Thus, dissolved tracers will be used to estimate travel times and dispersion rates, which are required parameters for modeling the system (Kannel 2007). Release locations and downstream monitoring stations within the Soos Creek system will be coordinated with other sampling activities (Figures 7, 8). Final travel time estimates between each release and monitoring station will be calculated based on the time of arrival of peak concentration and length of stream reach. Dispersion will be calculated from the spread of the plume.
Pulses of sufficient rhodamine dye solution will be released to achieve a measurable fluorescence at each downstream station. Fluorometers will be deployed at each monitoring location to record dye concentrations at 15-minute intervals until the peak concentration has been measured and subsequent concentrations decrease predictably.
Sampling and Analysis Plan and Quality Assurance Project Plan–Soos Creek
King County - 28 -
FIGURE 8. Release (red symbols) and measurement (green symbols) locations for time of travel study. Dye will be released at upstream locations and continuous measurement of dye concentrations taken until the peak of the plume has passed the downstream locations.

Sampling and Analysis Plan and Quality Assurance Project Plan–Soos Creek
King County - 29 -
RIPARIAN SHADE DEVELOPMENT
Following DeGasperi (2005), King County will estimate riparian canopy cover using Light Detection and Ranging (LiDAR) in a simple subtractive process whereby the digital ground model (DGM) is subtracted from the digital surface model (DSM) to generate a digital height model (DHM) for the vegetation. The next step in the process requires coding the DHM so that vegetation tall enough to provide effective shade (greater than 2m in height) are included in the analyses (i.e., vegetation with heights less than 2m is coded “0”, and vegetation taller than 2m is coded “1”). Riparian vegetation characteristics will be developed from hemi-spherical photographic imagery and field observations (Figure 9).

Sampling and Analysis Plan and Quality Assurance Project Plan–Soos Creek
King County - 30 -
FIGURE 9. Monitoring locations for continuous water temperature, dissolved oxygen (DO), pH, specific conductance, (red triangles). Data labels correspond with King County laboratory information management system (LIMS) identifiers; instantaneous DO, pH, water temperature, specific conductance, nutrients, Chlorophyll a, total organic carbon (TOC), dissolved organic carbon (DOC), alkalinity, and discharge.

Sampling and Analysis Plan and Quality Assurance Project Plan–Soos Creek
King County - 31 -
QUALITY CONTROL
MEASUREMENT QUALITY OBJECTIVES
Measurement quality objectives (MQOs) refer to the performance or acceptance criteria for individual data quality indicators such as precision, bias, and lower reporting limit. MQOs provide the basis for determining the procedures that should be used for sampling and analysis.
Field studies measure parameters necessary to reliably test hypotheses within the constraints of temporal and spatial variability (Krebs 1989). Sampling, laboratory analysis, and data evaluation steps all have sources of error that should be addressed by MQOs. For example, accuracy in laboratory measurements may be more easily controlled than field sampling variability. Sampling variability can be controlled somewhat by strictly following standard procedures and collecting quality control samples, but natural spatial and temporal variability can contribute greatly to the overall variability in a parameter value. In addition, financial resources can limit the number of samples that can be taken at one site spatially or over various time intervals. Finally, laboratory and field errors are further amplified by estimate errors in loading calculations and model results.
Precision is the degree of agreement between replicate analyses of a sample under identical conditions and is a measure of the random error associated with the analysis, usually expressed as Relative Percent Difference (RPD) or Relative Standard Deviation (RSD). Accuracy is the measure of the difference between an analytical result and the true value, usually expressed as percent. The accuracy of a result is affected by both systematic errors (bias) and random errors (imprecision). Bias is the systematic or persistent distortion of a measurement process that causes errors in one direction (Zar 1999). Precision, accuracy, and bias for water quality data may be measured by one or more of the following quality control procedures: method blanks, matrix spikes, certified reference materials, replicates, positive controls, and negative controls.
Representativeness expresses the degree to which sample data accurately and precisely represent a characteristic of a population, parameter variations at the sampling point, or an environmental condition. Samples for analysis will be collected from stations with pre-selected coordinates to represent specific site locations. Sample collection procedures are assigned to minimize variations, potential contamination, and other types of degradation in the chemical and physical composition of the water. Following standard field protocols ensures that samples are representative. Laboratory representativeness is achieved by proper preservation and storage of samples along with appropriate sub-sampling and preparation for analysis.
Completeness is defined as the total number of samples analyzed for which acceptable analytical data are generated, compared to the total number of samples collected. Sampling at stations with known position coordinates in favorable conditions and at the appropriate time points, along with adherence to standardized sampling and testing protocols, will aid in providing a complete data set for this project. The goal for completeness is 100%.
Comparability is a qualitative parameter expressing the confidence with which one data set can be compared to another. This goal is achieved through using standardized techniques to collect and analyze representative samples, along with standardized data validation and reporting procedures.

Sampling and Analysis Plan and Quality Assurance Project Plan–Soos Creek
King County - 32 -
FIELD METHODS AND TECHNIQUES
STATION POSITIONING METHODS A precise method of station positioning is important for studies in which sampling stations are revisited multiple times. This TMDL will assess spatial characteristics in water quality throughout the study area for the week of July 23- July 27, 2007. Sampling will occur at bridge structures, culverts or public access points. Most stream sampling locators are described with street addresses, nearby structures and coordinates. The intent of the descriptive information is to get field personnel to the intended location on the stream reach. They often must wade into the stream to sample an area that is moving and representative of the stream at this point in the reach. Detailed driving directions, which include sampling instructions and very specific sampling locations, allow field personnel to accurately find and properly sample the correct station for each event.
FIELD PARAMETERS/METHODS
TABLE 7 Field Parameters /Methods Parameter Name Method
Sample Temperature, Field YSI 6600 and Hobo Tidbit, Hydrolab MS5
Dissolved Oxygen, Field YSI 6600, Hydrolab MS5
Specific conductance, Field YSI 6600, Hydrolab MS5
pH, Field YSI 6600, Hydrolab MS5
Time, Field (entered as part of collection date in local time)
YSI 6600, Hydrolab MS5
Discharge Rate of Stream Swoffer/Staff
Relative Humidity Relative Humidity probes
SAMPLING EQUIPMENT, MAINTENANCE AND CALIBRATION
Sampling Equipment
• Set of sample bottles
• Fieldsheets with a clipboard and waterproof pens
• Swoffer flow meter and form
• Pocket rod for stream gauge
• Richards sampler

Sampling and Analysis Plan and Quality Assurance Project Plan–Soos Creek
King County - 33 -
• Sample bucket w/ line
• YSI 6600 or 6920 with calibrated sonde and datalogger
• Ice chest w/ ice and barrier
• Field clothes and safety gear
• Gate keys (if applicable)
Maintenance
Richards bottles require monitoring of monofilament, rubber springs and stoppers for damage and are to be replaced when necessary. The triggering mechanism requires adjustment of springs and allen screws. YSI probes require daily calibration and periodic DO probe membrane replacement. YSI probes must be kept in a high humidity environment during storage and transport.
Calibration
The YSI sondes require daily calibration before each use following the methods outlined in “YSI Multiprobe Operation” SOP #02-01-005-002. Swoffer flow meters are checked for calibration but are not recalibrated on a daily basis. See “Sampling Methods for Stream and River Sampling” SOP #02-02-004-001. Thermistors require a pre- and post-deployment calibration check. Other field equipment does not require calibration.
Conventionals
Conventional parameters measured during this study include ammonia nitrogen, nitrate/nitrite nitrogen, ortho-phosphate, total phosphorous, total nitrogen, alkalinity, chlorophyll a, pheophytin a, total organic carbon and dissolved organic carbon. Field data include pH, specific conductance, dissolved oxygen, temperature, relative humidity, flow, periphyton biomass and riparian shade. All samples are kept in a cooler at 4°C (± 2°C). See Table 8 for container and additional preservation requirements.
TABLE 8 Conventional Parameters Sample Storage Containers and Holding Times
Analyte Container Holding Times
Ammonia Nitrogen 250 mL HDPE CWM 1 day (1,2,3)
Nitrate/Nitrite Nitrogen
250 mL HDPE CWM 1 day (1,2,3)
Ortho Phosphate 250 mL HDPE CWM 1 day (1,3)
Total Nitrogen 250 mL HDPE CWM 2 days (4)
Total Phosphorus 250 mL HDPE CWM 2 days (4)
Alkalinity 500 mL HDPE CWM 14 days
Sampling and Analysis Plan and Quality Assurance Project Plan–Soos Creek
King County - 34 -
Chlorophyll a 1 L HDPE, AWM 1 day (5)
Pheophytin a 1 L HDPE, AWM 1 day (5)
Total Organic Carbon
2 - 40 mL Amber Glass VOA
1 day (7)
Dissolved Organic Carbon
125 mL Amber HDPE CNM
1 day (1,7)
Collect one of each bottle type except collect two amber VOA bottles for TOC.
(1) Must be filtered through a 0.45 micron filter ASAP or within 1 day of collection. (2) Filtered samples may be preserved with sulfuric acid to a pH < 2. Maximum holding time for
preserved samples is 28 days. Samples must be analyzed or preserved within 2 days of collection.
(3) Filtered samples may be preserved by freezing at –20° C. Maximum holding time for frozen samples is 14 days.
(4) Digestate has a 28-day holding time. (5) Following filtration, the filters may be stored in acetone in the freezer for up to 28 days. (6) 1 day from the end of composite period for composite samples and 2 days for grab samples. (7) Samples are preserved with 0.1 mL of phosphoric acid within 1 day of collection to extend holding
time to 28 days.
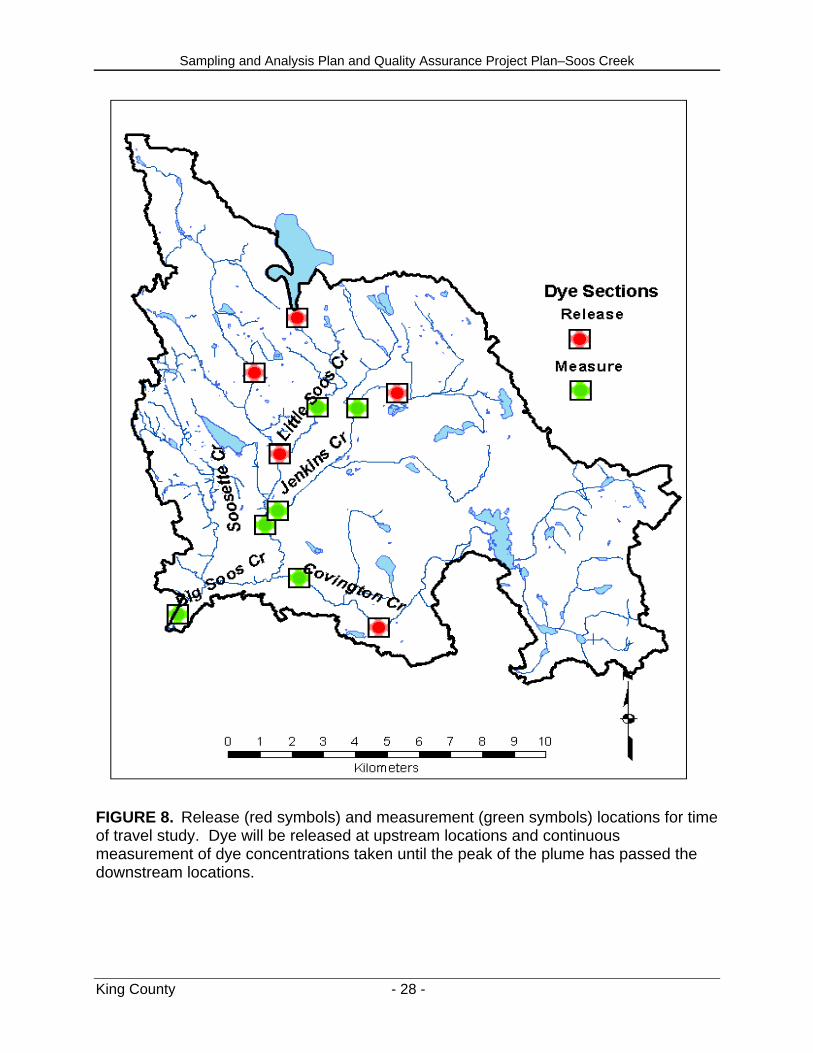
DISCHARGE AND WATER QUALITY MONITORING
Field procedures will follow standard operating procedures (King County Environmental Lab, 2002a, 2002b, 2004, 2005a-f). Replicate samples provide estimates of total variation for field samples and laboratory analysis and thereby facilitating an estimate of total precision. Collectively, these measures represent the King County environmental quality control efforts (Table 9)
TABLE 9. Summary of field in-situ and laboratory quality control samples.
Analysis Field Replicates
Lab Check Standard or Lab Control Sample
Lab Method Blank
Lab Duplicate
Matrix Spikes
Field Measurements
Velocity/Discharge 1/day N/A N/A N/A N/A
Temperature 1/10 N/A N/A N/A N/A
Dissolved Oxygen 1/10 N/A N/A N/A N/A
Specific Conductance 1/10 1/run N/A N/A N/A
pH 1/10 1/10 N/A N/A N/A
Laboratory Analyses

Sampling and Analysis Plan and Quality Assurance Project Plan–Soos Creek
King County - 35 -
Analysis Field Replicates
Lab Check Standard or Lab Control Sample
Lab Method Blank
Lab Duplicate
Matrix Spikes
Chlorophyll a 1/10 samples 1/day 1/20
samples 1/20 samples N/A
Pheophytin a 1/10 samples N/A 1/20
samples 1/20 samples N/A
Total Organic Carbon 1/10 samples 1/20 samples 1/20
samples 1/20 samples
1/20 samples
Dissolved Organic Carbon
1/10 samples 1/20 samples 1/20
samples 1/20 samples
1/20 samples
Alkalinity 1/10 samples 1/20 samples N/A 1/20
samples N/A
Total Nitrogen 1/10 samples 1/20 samples 1/20
samples 1/20 samples
1/20 samples
Ammonia Nitrogen 1/10 samples 1/20 samples 1/20
samples 1/20 samples
1/20 samples
Nitrate plus Nitrite Nitrogen
1/10 samples 1/20 samples 1/20
samples 1/20 samples
1/20 samples
Orthophosphate 1/10 samples 1/20 samples 1/20
samples 1/20 samples
1/20 samples
Total Phosphorus 1/10 samples 1/20 samples 1/20
samples 1/20 samples
1/20 samples
IN SITU MEASUREMENTS
Field sheets are printed on Rite in the Rain® paper. Each station has a set of field observation parameters that must be documented during sampling. Field observations should be recorded at the time of observation. A field measurement replicate is defined as a separate in situ measurement made following all procedures typically done between individual measurements. For replicate measurements the probe typically would be removed from the waterbody and then returned to the same depth and position used in the original measurement (County 2006).
Upon returning to the lab, a post-run analysis of dissolved oxygen, specific conductance, and pH should be completed and documented in the Quality Control (QC) notebook. These QC sheets are to document QC samples, including initial calibration, field replicate readings, check standards, and post-run calibration checks. Analysts include the calibration and analysis dates, standard lot numbers and concentrations, instrument readings, recovery calculations, and initials. All maintenance and instrument work should be noted in the instrument logbooks where each entry is dated and signed. If QC results are found to be outside of control limits, results may be qualified according to standards documented in the King County Environmental Laboratory’s (KCEL) Quality Assurance Manual (County 2006).

Sampling and Analysis Plan and Quality Assurance Project Plan–Soos Creek
King County - 36 -
CONTINUOUS TEMPERATURE AND DISSOLVED OXYGEN MONITORING
Temperature loggers, also known as thermistors, will be pre- and post-calibrated by KCEL following Ecology protocols to document instrument bias and performance at representative temperatures (Ward 2001). A National Institute of Standards and Technology (NIST) certified reference thermometer will be used for the calibration. At the completion of monitoring, instrument bias based on the pre- and post-calibration results will be noted for each thermistor if the bias is greater than ±0.2°C. Variation for field sampling of instream temperatures will be addressed with a field check of the data loggers with a hand-held alcohol thermometer at all sites upon deployment, download events, and at thermistor removals at the end of the study period. Field sampling and measurements will follow standard Ecology quality control protocols.
Extended deployment YSI measurements will be performed consistently with the protocols defined in KCEL Standard Operating Procedures (SOP) #02-01-008-001 YSI Multiprobe Operation. Following calibration, each YSI sonde will be taken into the field and deployed at selected locations for five days. Sondes will be secured by steel cable, locked to a permanent structure, and placed in the thalweg at each site. The sondes will record temperature, dissolved oxygen, specific conductance, and pH readings at 15 minute intervals throughout deployment. After the deployment period, the sondes will be returned to the lab for a post deployment end check (Table 10) and data upload (County 2002a).
Field replicates for an extended deployment YSI measurement consist of placing a second sonde in the water for the duration of the monitoring period and comparing the output following the deployment period. Acceptance limits for sonde parameters have been defined (King County 2002a), and summarized below (Table 11).
YSI QC sheets are intended for documentation of YSI QC samples. This includes initial calibration, continuing calibration verification replicates, duplicates, and post-run calibration check. The analyst will include the calibration and analysis date; standard lot numbers and concentrations; and instrument readings, recovery calculations, and initials.
All maintenance and instrument work should be noted in the YSI logbooks. Each entry is to be dated and signed.
TABLE 10. Hydrolab field check quality control requirements for In-situ measurements and extended deployments and YSI field check quality control requirements for extended deployments.
Hydrolab MS5 YSI 6600 and 6920 sondes
Parameter
Calibration Drift End
Check Acceptance
Limits
Field Measurement
Replicate Acceptance
Limits
Field Calibration
Check Standards
Post-Deployment Calibration
Check Acceptance
Limits
Field Replicate
Acceptance Limits
Dissolved Oxygen ± 4 % RPD </= 20% N/A ±10 % RPD </=
20%

Sampling and Analysis Plan and Quality Assurance Project Plan–Soos Creek
King County - 37 -
Temperature N/A ± 0.3 C N/A N/A +/- 0.3 C
Specific conductance ± 10 % RPD </= 10% ± 10 % ± 10 % RPD </=
10%
pH ± 0.2 pH units ± 0.2 pH units ± 0.2 pH
units ± 0.3 pH units +/- 0.2 pH units
TABLE 11. YSI field check quality control requirements.
YSI
Parameter Post-Deployment Calibration Check Acceptance Limits
Dissolved Oxygen ±10 %
Temperature Not applicable
Specific conductance ± 10 %
pH ± 0.3 pH units
FLOW MEASUREMENTS
Water depth and velocity will be recorded at cross sections proximal to sampling locations and in conjunction with the travel time study using wading rods and velocity meters calibrated to manufacturer’s recommendations. All flow measurements will follow Buchanan and Somers (1969) and standard King County Environmental Laboratory’s SOP (County 2002b). Streamflow measurements will be conducted at each sampling location three times during the study in order to capture a range of flow conditions as the system approaches steady, low-flow conditions. In addition, discharge measurements will be taken during thermistor deployment during early July and again when the thermistors are retrieved near the end of September. Field teams will use consistent techniques described at a pre-sampling meeting to minimize variability among teams.
WATER SAMPLE COLLECTION
Samples are collected by one of three methods. Grab sampling by hand-dipping sample bottles; using a bucket with a bottom drain; or, a Richards bottle sampler. Grab sampling requires the least prep time and implement cleaning and is therefore the preferred sampling method. Both the bucket and Richards bottle methods require considerable cleaning with a brush and reverse osmosis of the sample water at the lab, followed by thoroughly rinsing three times with ambient stream water. Samples will be collected from the thalweg, within free-flowing stream sections, and away from channel boundaries. Where access is from a bridge,
Sampling and Analysis Plan and Quality Assurance Project Plan–Soos Creek
King County - 38 -
the sample will be collected from the upstream side. These procedures are described in King County Environmental Laboratory’s SOP # 02-02-13-001 (County 2005b).
LABORATORY MEASUREMENT PROCEDURES
All water samples will be analyzed by the King County Environmental Laboratory using Standard Operating Procedures (Table 12). The method detection limit (MDL) is defined as that concentration at which an analyte can be detected reliably. The reporting detection limit (RDL) is defined as that concentration at which an analyte can be quantified reliably. Dissolved nutrient samples will be filtered within 24 hours of collection using 0.45-micron filters. Syringes will be triple rinsed prior to filtering. The first 10 to 20 mL of sample extracted through a pre-cleaned filter will be discarded. Each sample run should include at least one field replicate for each parameter to be analyzed in the laboratory. At a minimum, 10% of the samples will be field replicates. Field replicates are collected using the same methodology as the original samples or as close temporally to the original sample as possible. The field replicate is not distinguishable from the original sample except by sample number and collection time.
Samples will be delivered to the analytical laboratory twice daily. All samples are to be placed in a cooler with ice and a plastic barrier. This will keep the samples at or near 4°C until they arrive at the lab. This also minimizes the number of people handling samples and protects sample quality and security.
At the analytical laboratory, the sample manager should oversee:
• Receipt of samples. • Maintenance of sample management records. • Maintenance of sample tracking logs. • Distribution of samples for laboratory analyses. • Supervision of labeling and log keeping.

Sampling and Analysis Plan and Quality Assurance Project Plan–Soos Creek
King County - 39 -
TABLE 12. King County Environmental Laboratory measurement procedures. Units are mg/L for all but alkalinity (mg-CaCO3/L) and chlorophyll a (ug/L).
Analyte KCEL SOP
Analytical Method MDL RDL Sample
Containers Hold Time
Field Preservation Method
Total Nitrogen
03-03-013-002
SM4500-N-C 0.05 0.1
125 mL HDPE CWM
2 days Cool to 4°C
Nitrate+Nitrite Nitrogen
03-03-013-002
SM4500-NO3-F 0.02 0.04
125 mL HDPE CWM
2 days Filter and cool to 4°C
Ammonia-Nitrogen
03-03-012-003
SM4500-NH3-G 0.01 0.02
125 mL HDPE CWM
2 days Filter and cool to 4°C
Total Phosphorus
03-03-013-002
SM4500-P-B,F MOD
0.005 0.01 125 mL HDPE CWM
2 days Cool to 4°C
Orthophosphorus
03-03-013-002
SM4500-P-F 0.002 0.005
125 mL HDPE CWM
2 days Filter and cool to 4°C
Total Organic Carbon
03-04-001-004
SM5310-B 0.5 1.0 40 mL amber glass VOA
2 days Cool to 4°C
Dissolved Organic Carbon
03-04-001-004
SM5310-B 0.5 1.0
125 mL amber HDPE CNM
2 days Filter and cool to 4°C
Alkalinity
03-03-001-003
SM2320-B (4C) 0.2 10
500 mL HDPE CWM
14 days Cool to 4°C
Chlorophyll a
03-02-002S-003
EPA 446.0/SM 10200 H
0.15 0.3 1 L HDPE AWM
1 day Cool to 4°C
Pheophytin a
03-02-002S-004
EPA 446.0 1 2 1L HDPE
AWM 1 day Cool to 4°C
Sampling and Analysis Plan and Quality Assurance Project Plan–Soos Creek
King County - 40 -
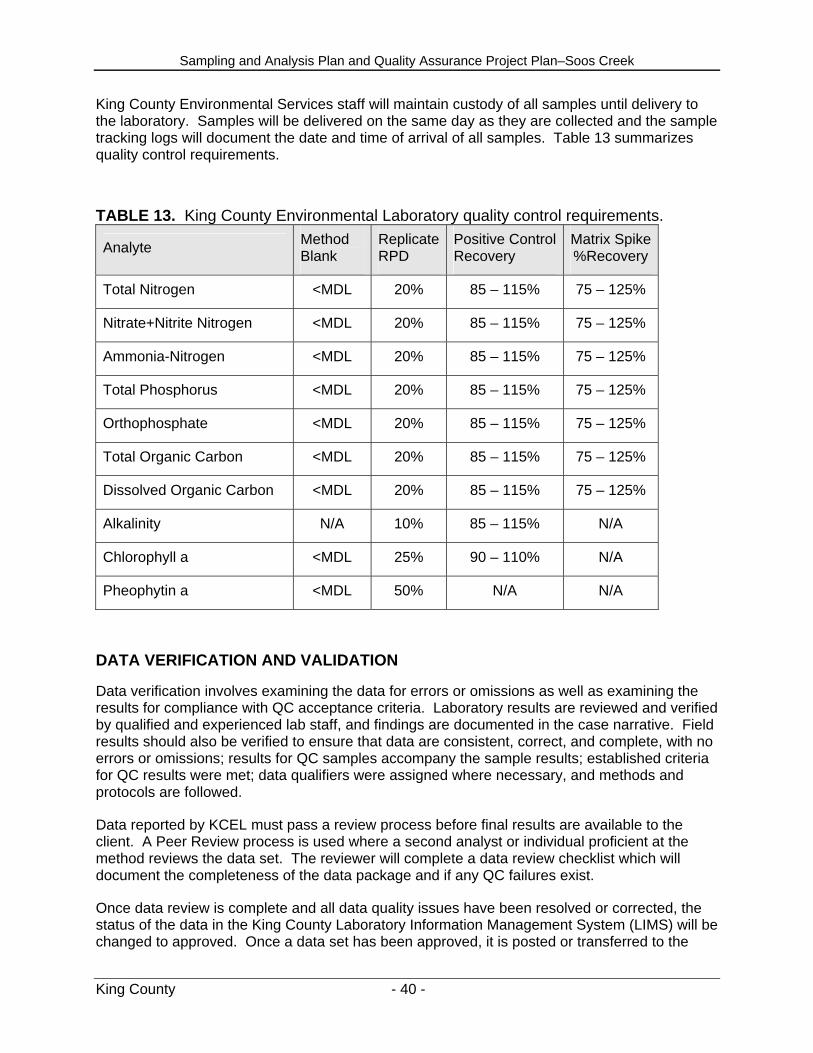
King County Environmental Services staff will maintain custody of all samples until delivery to the laboratory. Samples will be delivered on the same day as they are collected and the sample tracking logs will document the date and time of arrival of all samples. Table 13 summarizes quality control requirements.
TABLE 13. King County Environmental Laboratory quality control requirements.
Analyte Method Blank
Replicate RPD
Positive Control Recovery
Matrix Spike %Recovery
Total Nitrogen <MDL 20% 85 – 115% 75 – 125%
Nitrate+Nitrite Nitrogen <MDL 20% 85 – 115% 75 – 125%
Ammonia-Nitrogen <MDL 20% 85 – 115% 75 – 125%
Total Phosphorus <MDL 20% 85 – 115% 75 – 125%
Orthophosphate <MDL 20% 85 – 115% 75 – 125%
Total Organic Carbon <MDL 20% 85 – 115% 75 – 125%
Dissolved Organic Carbon <MDL 20% 85 – 115% 75 – 125%
Alkalinity N/A 10% 85 – 115% N/A
Chlorophyll a <MDL 25% 90 – 110% N/A
Pheophytin a <MDL 50% N/A N/A
DATA VERIFICATION AND VALIDATION
Data verification involves examining the data for errors or omissions as well as examining the results for compliance with QC acceptance criteria. Laboratory results are reviewed and verified by qualified and experienced lab staff, and findings are documented in the case narrative. Field results should also be verified to ensure that data are consistent, correct, and complete, with no errors or omissions; results for QC samples accompany the sample results; established criteria for QC results were met; data qualifiers were assigned where necessary, and methods and protocols are followed.
Data reported by KCEL must pass a review process before final results are available to the client. A Peer Review process is used where a second analyst or individual proficient at the method reviews the data set. The reviewer will complete a data review checklist which will document the completeness of the data package and if any QC failures exist.
Once data review is complete and all data quality issues have been resolved or corrected, the status of the data in the King County Laboratory Information Management System (LIMS) will be changed to approved. Once a data set has been approved, it is posted or transferred to the

Sampling and Analysis Plan and Quality Assurance Project Plan–Soos Creek
King County - 41 -
portion of the LIMS database known as the Environmental Data System (EDS) where all historical LIMS data are maintained. Signatures or initials of the lab lead and reviewer(s) indicate formal approval of hardcopy data or reports (non-LIMS), typically on the review checklist. A copy of this approved checklist should be stored with the final hardcopy data package. Table 14 presents laboratory data qualifiers. When data are entered into Ecology’s EIM system, the standard EIM qualifiers, which differ from those used by KCEL, will be used.
For field data entered into LIMS, a copy of the LIMS data review report, workgroup report, QC report, field sheet, and Hydrolab calibration form are reviewed by a second individual familiar with the procedure before the data is approved in LIMS. For the YSI data that are collected during the extended deployments and not entered into LIMS, a second individual familiar with the procedure will review the dataset and verify the completeness of the data, identify any anomalies and ensure QC specifications have been met. Any questionable data will be flagged and the project manager notified. A peer-reviewed spreadsheet containing the data files, a copy of the YSI QC sheet and any field notes will be presented electronically to the project manager.
TABLE 14. King County Environmental Laboratory data qualifiers. Qualifier Description
General
H
Indicates that a sample handling criterion was not met in some manner prior to analysis. The sample may have been compromised during the sampling procedure or may not comply with holding times, storage conditions, or preservation requirements. The qualifier will be applied to applicable analyses for a sample.
R
Indicates that the data are judged unusable by the data reviewer. The qualifier is applied based on the professional judgment of the data reviewer rather than any specific set of QC parameters and is applied when the reviewer feels that the data may not or will not provide any useful information to the data user. This qualifier may or may not be analyte-specific.
<MDL
Applied when a target analyte is not detected or detected at a concentration less than the associated method detection limit (MDL). MDL is defined as the lowest concentration at which an analyte can be detected. The MDL is the lowest concentration at which a sample result will be reported.
<RDL
Applied when a target analyte is detected at a concentration greater than or equal to the associated MDL but less than the associated reporting detection limit (RDL). RDL is defined as the lowest concentration at which an analyte can reliably be quantified. The RDL represents the minimum concentration at which method performance becomes quantitative and is not subject to the degree of variation observed at concentrations between the MDL and RDL.
RDL Applied when a target analyte is detected at a concentration that, in the raw data is equal to the RDL.
TA Applied to a sample result when additional narrative information is available in the text field. The additional information may help to qualify the sample result but is not

Sampling and Analysis Plan and Quality Assurance Project Plan–Soos Creek
King County - 42 -
necessarily covered by any of the standard qualifiers.
Chemistry
B
Applied to a sample result when an analyte was detected at a concentration greater than the MDL in the associated batch method blank. The qualifier is applied in Organics analyses when the sample analyte concentration is less than five times the blank concentration and is applied in Conventionals and Metals analysis when the sample concentration is less than ten times the blank concentration. The qualifier indicates that the analyte concentration in the sample may include laboratory contamination.
This is an analyte-specific qualifier.
>MR
Applied when a target analyte concentration exceeds the instrument or method capacity to measure accurately. The qualifier is primarily in the organics section. It is applied when the detected analyte concentration exceeds the upper instrument calibration limit and further dilution is not feasible. The reported value is an estimated analyte concentration.
CORRECTIVE ACTION PROCEDURES
Individual SOPs describe specific corrective actions for each analytical procedure and QC measure. If QC samples exceed their control limits, the analysis is repeated, if possible, or documented and affected samples qualified. If samples are lost or compromised, the project manager must determine whether to re-sample or to disregard the station for the specific parameter or event.
King County Environmental Laboratory documentation and record keeping will follow standard protocols, as described in the King County QA Manual (County 2006). Within the analytical laboratory, each section and analytical procedure has its own documentation protocol. The minimum documentation required in the lab includes an instrument logbook, analysis log, calibration and analysis documentation, and hardcopy sheets.
For all analytical results generated by lab activities, sufficient hardcopy data must be stored such that a reviewer could verify that the requirements of the reference method and SOP were met. The format of stored data may include logbook entries, field notes, benchsheets, and printouts of instrument or data files. Storage of only the electronic version of these documents is not sufficient to meet current data storage requirements. Subcontracted tests are to be documented in a similar manner.
LOGBOOKS
Hand written information used as supporting documentation, which is not stored directly with the analysis results, such as standards preparation records and equipment calibration checks, must be maintained in logbooks. All logbooks should be paginated. Logbooks prepared from instrument printout or other loose pages should be permanently bound prior to storage. Logbook entries should be made using indelible black ink (no pencils) and dated and initialed. Logbooks and individual logbook entries must be uniquely identified if they are to be referenced
Sampling and Analysis Plan and Quality Assurance Project Plan–Soos Creek
King County - 43 -
in other documents. All deletions and corrections must be a single line cross-out, accompanied with the date and initials of the person making the correction.
DATA PACKAGES
For each run or analysis sequence, a data package will be produced which will include all appropriate raw data for standards, samples and QC analyses. Data packages must include the inclusive dates and times of the analyses and the identity of the analyst(s). If corrective actions were taken or a compromised sample was analyzed, the data package will contain a copy of the Corrective Action Form and/or a Compromised Sample Form (or their equivalent). Specific requirements for the contents of data packages are described in each method SOP. The analyst(s) who generated the data is responsible for compiling the data package and transferring it to the data reviewer. Prior to data review, the data packages are organized according to method SOPs. Data packages may reference other data sets or documents rather than requiring each data package to contain copies of all necessary information. All deletions and corrections to handwritten or printed documentation must be a single line cross-out, accompanied with the date and initials of the person making the correction.
STORAGE OF LAB DATA
Procedures for the storage and disposal of hardcopy lab data are summarized in King County Environmental Laboratory’s SOP #11-01-005-000 (Records Storage) which is based on King County and Washington State governmental records storage requirements. It is the policy of the lab to store all data packages, supporting documentation, and project records for a minimum of ten years, based on the date of sample collection or field data measurement. The subcontract lab is responsible for its own records’ storage which should be at least ten years.
In the laboratory information management system (LIMS), the final sample and QC data are maintained indefinitely in the EDS database, which is backed up daily. Additional LIMS information specific to sample management is maintained a minimum of one-year past the date the final results were posted. Other types of electronic data, such as instrument files, may be stored but no lab-wide policy is currently available.
DATA MANAGEMENT PROCEDURES
Two phases of data management will occur. KCEL follows standard data management protocols and will submit the data to Ecology. Ecology will complete data management as described below.
KING COUNTY ENVIRONMENTAL LABORATORY
Once raw data have been generated by an analytical procedure or from field measurements, the data must be transformed into a format appropriate for analysis. For chemistry parameters, numerical results are entered into LIMS where additional calculations may take place such as conversion of instrumental concentrations to final sample results.
The format used to load data to LIMS and types of calculations done after loading is specified in each method SOP. The adjustment of the number of significant digits and addition of selected data qualifiers is also accomplished by LIMS. For in-lab data loaded to LIMS, automatic calculation of QC results and comparison to acceptance limits is performed by LIMS. However, data for subcontracted samples for chemistry parameters are also entered into the LIMS

Sampling and Analysis Plan and Quality Assurance Project Plan–Soos Creek
King County - 44 -
database. QC results for subcontracted analyses are not entered into LIMS and any data flags must be manually entered.
Data will not be distributed outside each lab unit or to clients until it has met the full definition of final data. Final Data is defined as approved data posted to the historical database (EDS) or is otherwise in its final reportable and stored format (if not a LIMS parameter). This implies the data has been appropriately peer reviewed, properly qualified and is in its final format in terms of units and significant figures. Not only is final data assured of a higher level of quality through peer reviewing and qualification, but it will also match any future reports since it has come from the final storage location. The standard method for clients to access final data is either through direct electronic access to LIMS (EDS database) or through hard-copy reports and/or electronic files provided by the Lab Project Manager (LPM) or their equivalent. Direct client access to the EDS database is controlled by access privileges provided by the Information Systems and Data Analysis unit for individual clients. Data reporting via hardcopy through LPMs must follow the guidelines in King County Environmental Laboratory’s SOP #11-03-001-001 (Project Report Review Guidelines) before being delivered to the client. Electronic files delivered to clients must also follow King County Environmental Laboratory’s SOP #08-01-001-000 (Guidelines for Delivering Electronic Lab Data to Customers).
Field measurement data will be entered into a field book by King County with waterproof paper in the field and then entered into spreadsheets as soon as practical after returning from the field. This database will be used for preliminary analysis and to create a table to upload data into EIM.
Sample result data received from KCEL will be exported prior to entry into EIM and added to a cumulative spreadsheet for laboratory results. This spreadsheet will be used to informally review and analyze data during the course of the project. All data will be uploaded to EIM by the EIM data engineer once it has been reviewed for quality assurance and finalized. All spreadsheet files, paper field notes, and GIS products created as part of the data analysis and model building will be kept with the project data files.
DATA ANALYSIS AND USE
Model Descriptions
Several models will be used to evaluate the loading capacity and to determine the wasteload and load allocations necessary to meet the water quality standards (Ecology 2003a and 2003b). Data collection, compilation, and assessment are based on the data requirements of the models used in this study, which are described below.
TTools
TTools is a GIS extension developed by the Oregon Department of Environmental Quality (Oregon Department of Environmental Quality 2001) to develop spatially explicit data from polygon coverages and grids. The tool develops vegetation and topography perpendicular to the stream channel and samples longitudinal stream channel characteristics, such as the near-stream disturbance zone and elevation.

Sampling and Analysis Plan and Quality Assurance Project Plan–Soos Creek
King County - 45 -
Shade Model
Shade.xls was adapted from a program that was originally developed by the Oregon Department of Environmental Quality (ODEQ) as part of the HeatSource model (Boyd 2003). Shade.xls calculates shade using one of two optional methods:
• ODEQ's original method from the HeatSource model version 7.
• Chen’s method based on the Fortran program HSPF SHADE (Chen, 1996).
The method uses a slightly different approach to modeling the attenuation of solar radiation through the canopy (Chen et al., 1998a and 1998b).
All data will be assembled from field surveys.
Temperature Analysis
Data collected during this TMDL effort will allow the development of a temperature simulation model that is both spatially continuous and which spans full-day lengths (quasi-dynamic, steady-state diel simulations). The GIS and modeling analyses will be conducted using three software tools:
• • Oregon Department of Environmental Quality’s TTools extension for ArcView (ODEQ, 2001) will be used to sample and process GIS data for input to the Shade and QUAL2Kw models.
• • Ecology’s Shade model (Ecology, 2003a) will be used to estimate effective shade along Soos Creek system, Cottage Lake Creek, and Soos Creek system Creek. Effective shade will be calculated at 100-m (330 ft) intervals along the streams and then averaged over 500-m (1600 ft) intervals for input to the QUAL2Kw model.
QUAL2Kw Model
The QUAL2Kw model (Chapra, 2001; Ecology, 2003b) will be used to calculate the components of the heat budget and simulate water temperatures. QUAL2Kw simulates diurnal variations in stream temperature for a steady flow condition. QUAL2Kw will be applied by assuming that flow remains constant for a given condition such as a seven-day or one-day period, but key variables are allowed to vary with time over the course of a day. For temperature simulation, the solar radiation, air temperature, relative humidity, headwater temperature, and tributary water temperatures are specified or simulated as diurnally varying functions. QUAL2Kw uses the kinetic formulations for the components of the surface water heat budget described in (Chapra 2003). Diurnally varying water temperatures at 500-m (1,640 ft) intervals along the streams in the basin will be simulated using a finite difference numerical method. The water temperature model will be calibrated to instream data along the creeks. Groundwater contributions will be quantified from the synoptic flow study in consultation with previous hydrologic flow modeling conducted by King County using HSPF.
All input data for the Shade and QUAL2Kw models will be geographically referenced, allowing spatial and/or continuous inputs to apply to certain zones or specific river segments.

Sampling and Analysis Plan and Quality Assurance Project Plan–Soos Creek
King County - 46 -
REFERENCES
Boyd, M., and Kasper, B. 2003. Analytical methods for dynamic open channel heat and mass transfer: Methodology for heat source model Version 7.0. Pages 204 in P. Oregon Department of Environmental Quality, OR., editor.
Chapra, S. C., and G. J. Pelletier. 2003. QUAL2K: A Modeling Framework for Simulating River and Stream Water Quality (Beta Version): Documentation and User's Manual. Civil and Environmental Engineering Department, Tufts University.
County, K. 1989. Soos Creek Basin Plan and Draft Environmental Impact Statement. Pages 272 in. King County Surface Water Management Division, Seattle, WA.
County, K. 1995. Hydrologic Monitoring Report. Natural Resources and Parks, Water and Land Resources Division.
County, K. 2002a. Standard Operating Procedure for Unattended YSI Multiprobe Operation. K. C. E. Laboratory, editor. King County.
County, K. 2002b. Standard Operating Procedures for Sampling Methods for Stream and River Water. K. C. E. Lab, editor. King County.
County, K. 2004. King County Comprehensive Plan update with 2006 ammendments.
County, K. 2005b. Standard Operating Procedures for Clean Sampling for Trace Metals, Trace Organics, Microbiology and Conventional Chemistry Parameters Using Surface Grabs. K. C. E. Laboratory, editor. King County.
County, K. 2006. King County Envirionmental Laboratory, Quality Assurance Manual. K. C. E. Laboratory, editor. King County.
Daly, C. 2007. Parameter-elevation Regressions on Independent Slopes Model (PRISM).
Ecology, W. S. D. o. 2004. Water Quality Program Guidance: Implementing Washington State Temperature Standards through TMDLs and NPDES Permits. Pages 14 in W. S. D. o. Ecology, editor.
Ecology, W. S. D. o. 2005. Washington State's Water Quality Assessment [303(d) & 305(b) Report] Final 2004 Submittal. Washington State Department of Ecology, Olympia, Washington.
Ecology, W. S. D. o. 2006. WATER QUALITY STANDARDS FOR SURFACE
WATERS OF THE STATE OF WASHINGTON. Chapter 173-201A WAC.
Edwards, R. T. 1998. The Hyporheic Zone. Pages 399-429 in R. J. N. a. R. E. Bilby, editor. River Ecology and Management: Lessons from the Pacific Coastal Ecoregion. Springer, New York.
Joy, J. 2001. Quality Assurance Project Plan: Stillaguamish River Basin and Port Susan Total Maximum Daily Load Evaluation Update. W. S. D. o. Ecology, editor.

Sampling and Analysis Plan and Quality Assurance Project Plan–Soos Creek
King County - 47 -
Kannel, P. R. L., S. Lee, Y. S. Kanel, S. R. Pelletier, G. J. Kim, Hyungsoo. 2007. Application of automated QUAL2Kw for water quality modeling and management in the Bagmati River, Nepal. Ecological Modelling 202(3-4):503.
Krebs, C. J. 1989. Ecological Methodology. Harper and Row, New York.
Montgomery, D. R., and J.M. Buffington. 1998. Channel Processes, Classification, and Response. Pages 13-42 in a. R. E. B. R. J. Naiman, editor. River Ecology and Management: Lessons from the Pacific Coastal Ecoregion. Springer, New York.
Oregon Department of Environmental Quality, P., OR. 2001. Ttools 3.0 User Manual. P. Oregon Department of Environmental Quality, OR., editor.
Payne, S. 2006. Waters Requiring Supplemental
Spawning and Incubation Protection For
Salmonid Species. W. S. D. o. Ecology, editor. Water Quality Program.
USEPA. 2001. Guidance for Water Quality-Based Decisions: The TMDL Process. U.S. Environmental Protection Agency.
USEPA. 2002. Clean Water Act. 33 U.S.C 1251 et seq.
Ward, W., B. Hopkins, D. Hallock, C. Wiseman, R. Plotnikoff, and W. Ehinger. 2001. Stream Sampling Protocols for the Environmental Monitoring and Trends Section. W. S. D. o. Ecology, editor.
WRIA_9. 2006. Fish Distribution Maps and Data
Green/Duwamish and Central Puget Sound Watershed
Water Resource Inventory Area (WRIA) 9. King County, Seattle, WA.
Zar, J. H. 1999. Biostastical Analysis, 4th edition. Prentice-Hall, Upper Saddle River, New Jersey.