Samantha Kleinberg, Assistant Professor of Computer Science, Stevens Institute of Technology at...
25
Causal Inference and Explanation to Improve Human Health Samantha Kleinberg Stevens Institute of Technology
-
Upload
mlconf -
Category
Technology
-
view
515 -
download
1
Transcript of Samantha Kleinberg, Assistant Professor of Computer Science, Stevens Institute of Technology at...

Causal Inference and Explanation to Improve Human Health
Samantha Kleinberg Stevens Institute of Technology

Can we learn..
risk factors for heart failure
causes of secondary brain injury
what leads to an individual’s hypoglycemic episodes
from observing people?

Why worry about causality?
• Robust predictions
• Coherent explanations
• Actionable information

Why observational data?
• Experiments often infeasible, unethical, or too expensive
• Routinely collected in many situations • Electronic health records in hospitals • ICU data streams • Body-worn sensors and mobile devices

This talk
• We can make some progress in getting causes from medical data
• But should worry about missing data and nonstationarity
• Explanation can be automated (sometimes)

Logic-based causal inference
• Complex, temporal relationships
• Assess average difference cause makes to probability of effect
Kleinberg, S. (2012) Causality, Probability, and Time. Cambridge University Press.Kleinberg, S. (2015) Why: A Guide to Finding and Using Causes. O’Reilly Media

• Main idea: looking for better explanations for the effect
• Inferring timing
• Instead of accepting/rejecting hypotheses, refine them from data using greedy search
• Can start by testing relationships between all variables and CHF in 1-2 weeks, and ultimately infer "high AST leads to CHF in 4-10 days”

Application: understanding stroke recovery
Massive amounts of data collected in ICU (>100,000 measurements per person)
How do patients change over time?

NICU dataset• 98 patients with subarachnoid hemorrhage
• Monitoring included • Depth and surface EEG • Microdialysis • Physiologic measurements
(no data on procedures)

Lots of data, but lots of missing data
• Device malfunctions
• Device connected to perform a procedure
• Different monitors started at different times
• Different recording frequencies
TW% BrT CI CO2EX CPP CVP ELWI GEDI GLU GLU2panel HR ICP0296 0.56001433 0.55845172 0.45439822 0.77027571 0.89076666 0.80927443 0.47893916 0.47893916 0.07274971 0.07943021 0.98646971 0.92582606962168 0.69029286 0.71585128 0.67012404 0.80326783 0.91217418 0.84294797 0.56494303 0.56494303 0.13405794 0.03836355 0.98382787 0.94543471
56.0014325 55.845172 45.4398223 77.0275708 89.0766656 80.9274429 47.893916 47.893916 7.27497093 7.94302149 98.6469713 92.582606269.0292858 71.5851282 67.0124038 80.3267833 91.2174176 84.294797 56.4943028 56.4943028 13.4057939 3.83635458 98.3827871 94.5434715
0D
20D
40D
60D
80D
100D
TW%D
BrTD CID
CO2EXD
CPPD
CVPD
ELWID
GEDID
GLUD
GLU2panelD
HRD
ICPD
LACD
LGRD
LPRD
MAP
DMVD
PEEPD
PGRD
PYRD
PbtO2D RRD
SPO2%
DSV
VDSvO2D
TMPD
rCBFD
%"data"recorded
"per"
varia
ble"
0296hrsD
962168hrsD
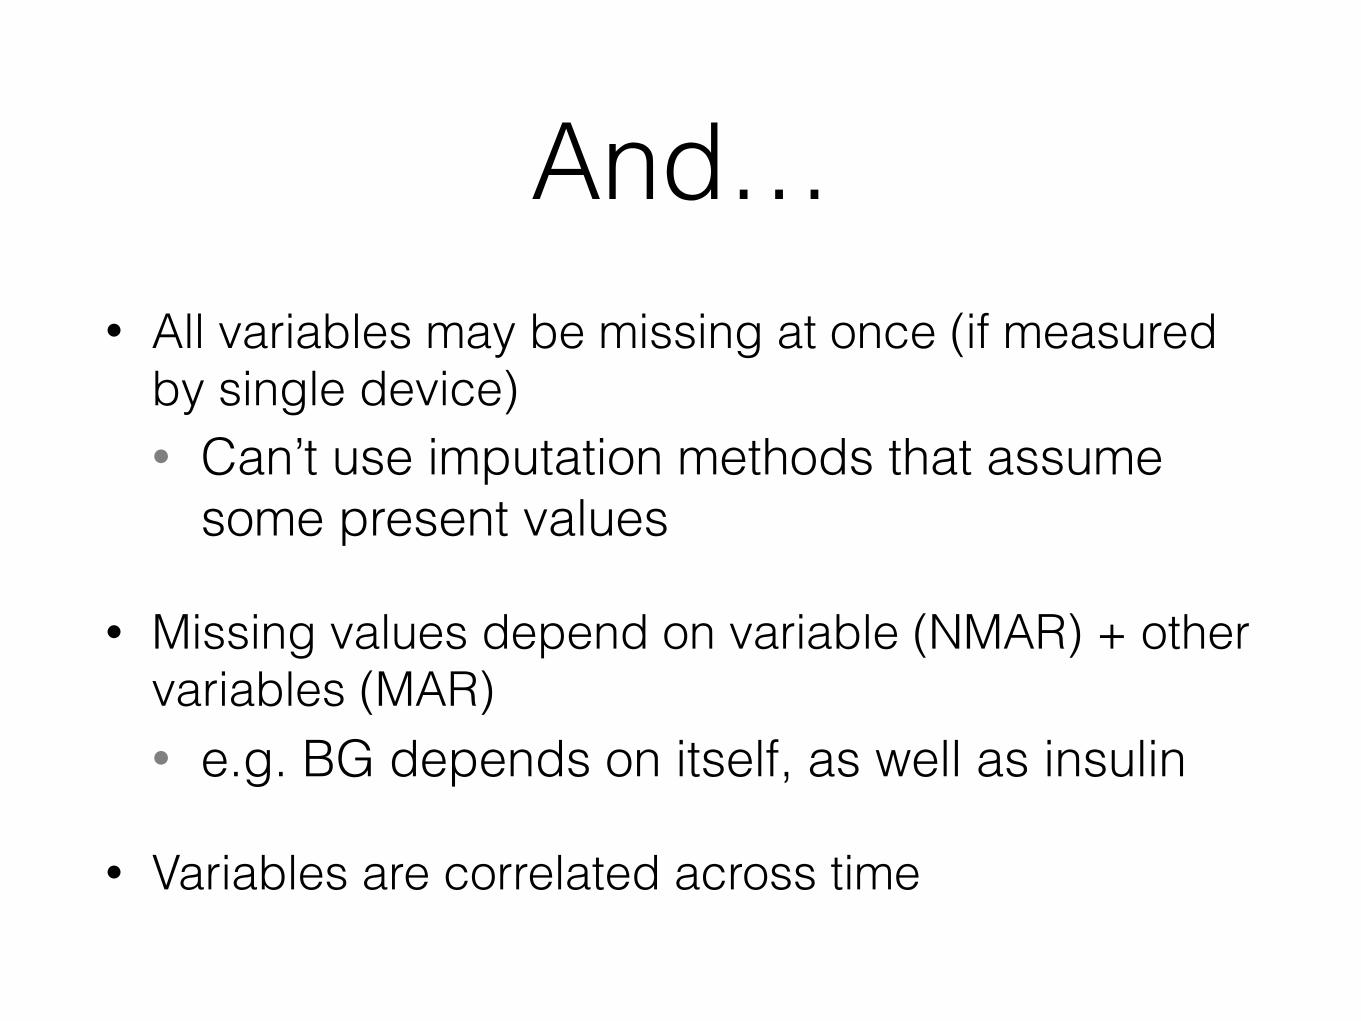
And…• All variables may be missing at once (if measured
by single device) • Can’t use imputation methods that assume
some present values
• Missing values depend on variable (NMAR) + other variables (MAR) • e.g. BG depends on itself, as well as insulin
• Variables are correlated across time
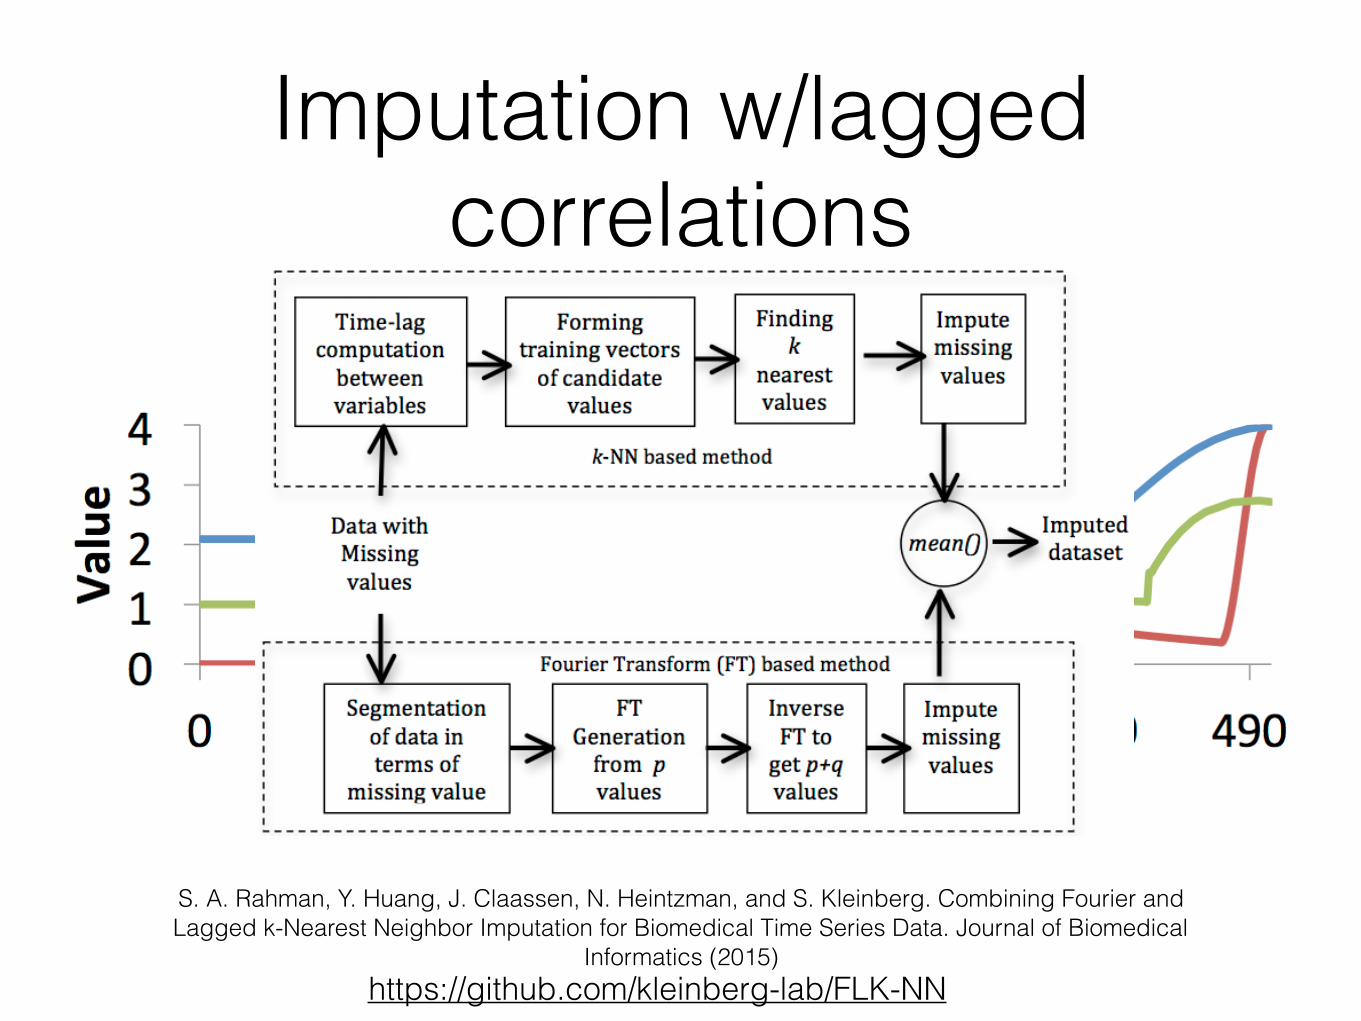
Imputation w/lagged correlations
S. A. Rahman, Y. Huang, J. Claassen, N. Heintzman, and S. Kleinberg. Combining Fourier and Lagged k-Nearest Neighbor Imputation for Biomedical Time Series Data. Journal of Biomedical
Informatics (2015)https://github.com/kleinberg-lab/FLK-NN
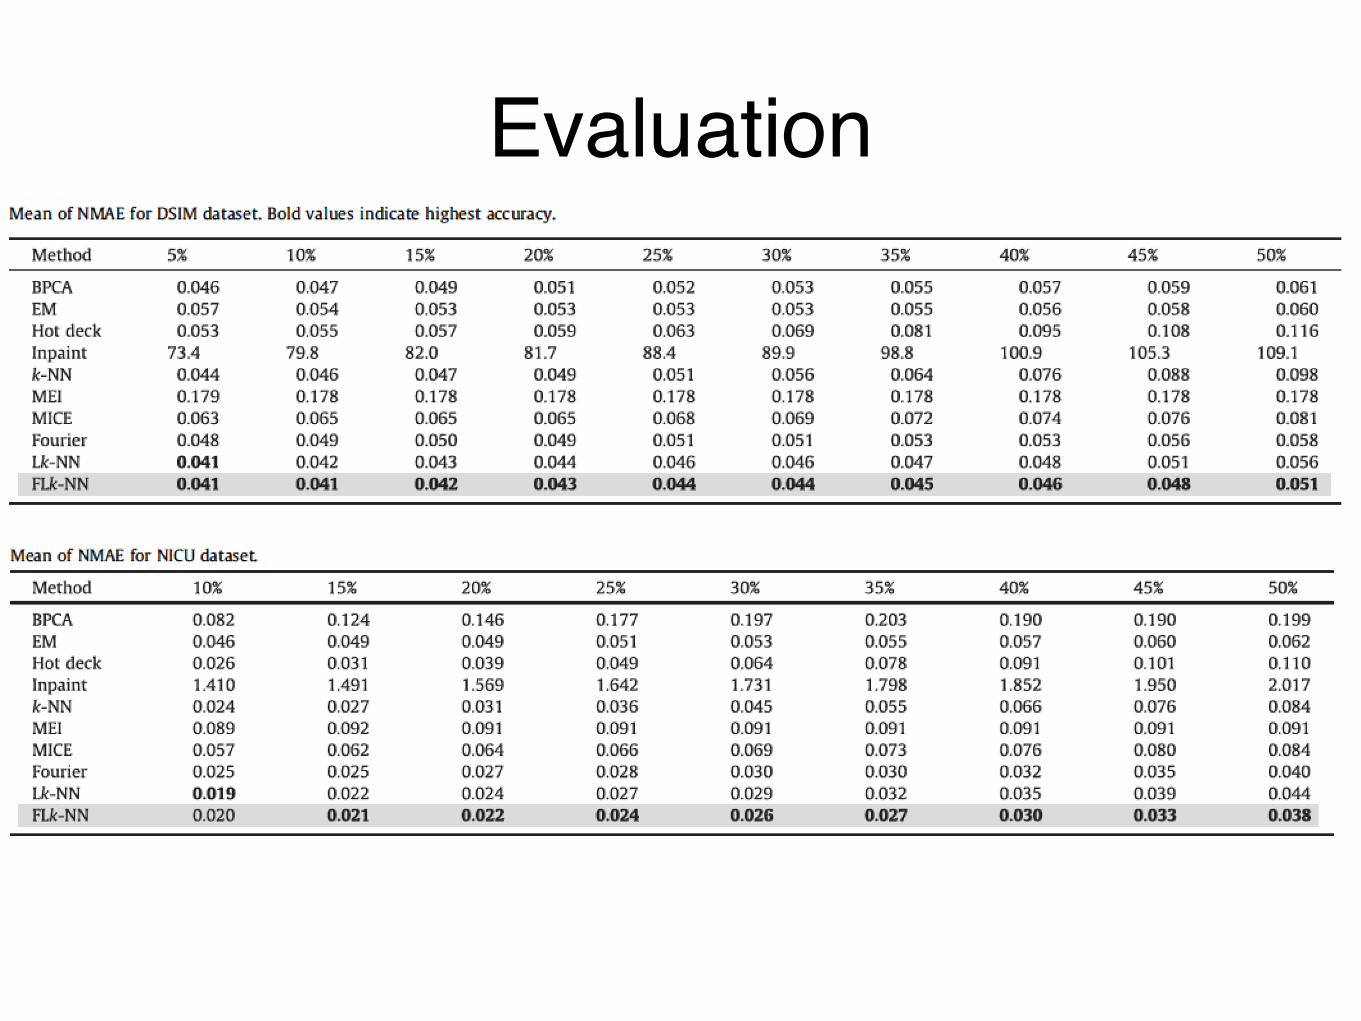
Evaluation

Regulation changes over time
0-96hrs
96-168 hrs
Claassen J, Rahman SA, Huang Y, Frey H, Schmidt M, Albers D, Falo CM, Park S, Agarwal S, Connolly ES, Kleinberg S (2015) Causal structure of brain physiology after brain injury. PLoS ONE.

Explanation
• Why is an individual’s brain swelling at a particular time?
• What caused a specific stock market crash?
• Who is at fault for a car accident?

• Inference finds type-level relationships
• Explanation tells us why specific events happened
heart failure
uncontrolled diabetes
thyroid disfunction
heart failure
uncontrolled diabetes
thyroid disfunction

• Goals for explanation
• Find causes of specific events automatically (no human in the loop)
• Find causes of when, whether and how events occur
• Approach: simulation to answer counterfactual queries
C. Merck and S. Kleinberg. Causal explanation under indeterminism: A sampling approach. AAAI, 2016.https://github.com/kleinberg-lab/stoch_cf

Counterfactual vs. Actual Distributions
• P(•|¬A) is the counterfactual distribution of A
• P(•|A) is the actual distribution of A

Three Types of Explanation
B because of A iff P (B|A) >> P (B|¬A)
B hastened by A iff E[tB |A] << E[tB |¬A]
B intensified by A iffE[mB |A] >> E[mB |¬A]
B despite A iff P (B|A) << P (B|¬A)
B delayed by A iffE[tB |A] >> E[tB |¬A]
B attenuated by A iffE[mB |A] << E[mB |¬A]
tB = time of B occurring
mB = intensity (manner) of B occurring
probability:
timing:
intensity:

Causal Chain with Billiard Balls

Hastening
• 6->8, then 8->P
• but 7->8 is a more reliable backup
• probability raising finds “8->P despite 6->8”
• but by analyzing timing we find “6->8 hastened 8->P”

Diabetes Simulation• Run or Lunch alone would not
have caused Hypoglycemia (see counterfactual dists)
• Yet together they explain the Hypoglycemia(see actual distribution)
• We see beyond the most recent event (Lunch)
• We can measure quantitative strength of effect in mg/dL: E[ glu | R] - E[ glu | ¬R]

Looking forward: personalized and pervasive sensing
• Can we develop a fitbit for nutrition?
• Find effect of food on glucose, causes of overeating

Key open problems
• Data with uncertain timings
• Finding the “right” variables
• Explanation beyond models

Thanks!
Teams @CUMC, Stevens
NSF, NIH, JSMF
And my group is hiring!