Salt Creek Elementary School
12
2015-16 School Accountability Report Card for Salt Creek Elementary School Page 1 of 12 Salt Creek Elementary School 1055 Hunte Pkwy • Chula Vista, CA 91914 • (619) 397-5494 • Grades K-6 Mrs. Lalaine Perez, Principal / Mr. Robert Cochran, Associate Principal, Principal [email protected] 2015-16 School Accountability Report Card Published During the 2016-17 School Year Chula Vista Elementary School District 84 East J Street Chula Vista, CA 91910-6100 (619) 425-9600 www.cvesd.org District Governing Board Leslie Bunker Armando Farias Laurie Humphrey Eduardo Reyes, Ed.D. Francisco Tamayo District Administration Francisco Escobedo, Ed.D. Superintendent Jeffrey Thiel Assistant Superintendent, Human Resources Services and Support Oscar Esquivel Assistant Superintendent, Business Services and Support Matthew Tessier Assistant Superintendent, Innovation and Instruction Services and Support ---- ---- School Description Mission: • Our mission at Salt Creek is to create confident college and career ready leaders who apply learned skills to real-life situations. They are innovative and critical thinkers, effective communicators, and collaborative learners. Students are self-evaluators who have the skills to adapt to the diverse world around them. They are respectful and responsible citizens in the community. Academic Focus: • School wide teachers implement the concept of LIGHT: Language & Literacy, Interpersonal Intelligence, Growth Mindset/Goal Setting, Higher Order Thinking, and Technology. Professional development for teachers and instructional activities support the five key concepts in LIGHT. In addition, all teachers utilize the Pearson Learning Teams model to target common student needs by grade level. Programs: • Salt Creek has a strong Spanish/English Dual Language Immersion Program in K-6th grade. About 30% of our students participate in this very successful program. We have 15 Dual Immersion classrooms, and staff meet as an entire team at least three times per year to evaluate program quality and effectiveness for the purpose of ongoing improvement and consistency. We also have a robust GATE program, which offers differentiation as well as enrichment opportunities during the school day and after school, including Technology Club, Salt Creek Garden and Monarch Butterfly Program, Entrepreneur Academy, and more. VAPA is also a regular part of our instructional program, with all students K-6 receiving instruction in Music, Art, Drama, Dance and Physical Education.
Transcript of Salt Creek Elementary School

2015-16 School Accountability Report Card for Salt Creek Elementary School Page 1 of 12
Salt Creek Elementary School
1055 Hunte Pkwy • Chula Vista, CA 91914 • (619) 397-5494 • Grades K-6 Mrs. Lalaine Perez, Principal / Mr. Robert Cochran, Associate Principal, Principal
2015-16 School Accountability Report Card
Published During the 2016-17 School Year
Chula Vista Elementary School District
84 East J Street Chula Vista, CA 91910-6100
(619) 425-9600 www.cvesd.org
District Governing Board
Leslie Bunker
Armando Farias
Laurie Humphrey
Eduardo Reyes, Ed.D.
Francisco Tamayo
District Administration
Francisco Escobedo, Ed.D. Superintendent
Jeffrey Thiel Assistant Superintendent, Human Resources Services and Support
Oscar Esquivel Assistant Superintendent, Business
Services and Support
Matthew Tessier Assistant Superintendent, Innovation and Instruction Services and Support
---- ----
School Description Mission: • Our mission at Salt Creek is to create confident college and career ready leaders who apply
learned skills to real-life situations. They are innovative and critical thinkers, effective communicators, and collaborative learners.
Students are self-evaluators who have the skills to adapt to the diverse world around them. They are respectful and responsible citizens in the community. Academic Focus: • School wide teachers implement the concept of LIGHT: Language & Literacy, Interpersonal
Intelligence, Growth Mindset/Goal Setting, Higher Order Thinking, and Technology. Professional development for teachers and instructional activities support the five key concepts in LIGHT. In addition, all teachers utilize the Pearson Learning Teams model to target common student needs by grade level.
Programs: • Salt Creek has a strong Spanish/English Dual Language Immersion Program in K-6th grade.
About 30% of our students participate in this very successful program. We have 15 Dual Immersion classrooms, and staff meet as an entire team at least three times per year to evaluate program quality and effectiveness for the purpose of ongoing improvement and consistency. We also have a robust GATE program, which offers differentiation as well as enrichment opportunities during the school day and after school, including Technology Club, Salt Creek Garden and Monarch Butterfly Program, Entrepreneur Academy, and more. VAPA is also a regular part of our instructional program, with all students K-6 receiving instruction in Music, Art, Drama, Dance and Physical Education.

2015-16 School Accountability Report Card for Salt Creek Elementary School Page 2 of 12
About the SARC By February 1 of each year, every school in California is required by state law to publish a School Accountability Report Card (SARC). The SARC contains information about the condition and performance of each California public school. Under the Local Control Funding Formula (LCFF) all local educational agencies (LEAs) are required to prepare a Local Control and Accountability Plan (LCAP), which describes how they intend to meet annual school-specific goals for all pupils, with specific activities to address state and local priorities. Additionally, data reported in an LCAP is to be consistent with data reported in the SARC. • For more information about SARC requirements, see the California
Department of Education (CDE) SARC Web page at http://www.cde.ca.gov/ta/ac/sa/.
• For more information about the LCFF or LCAP, see the CDE LCFF Web page at http://www.cde.ca.gov/fg/aa/lc/.
• For additional information about the school, parents/guardians and community members should contact the school principal or the district office.
2015-16 Student Enrollment by Grade Level
Grade Level Number of Students
Kindergarten 128
Grade 1 130
Grade 2 129
Grade 3 140
Grade 4 159
Grade 5 164
Grade 6 145
Total Enrollment 995
2015-16 Student Enrollment by Group
Group Percent of Total Enrollment
Black or African American 3.9
American Indian or Alaska Native 0.3
Asian 5.3
Filipino 14
Hispanic or Latino 49.4
Native Hawaiian or Pacific Islander 0.1
White 20.9
Two or More Races 5.4
Socioeconomically Disadvantaged 14
English Learners 28.4
Students with Disabilities 5
Foster Youth 0
A. Conditions of Learning State Priority: Basic The SARC provides the following information relevant to the Basic State Priority (Priority 1): • Degree to which teachers are appropriately assigned and fully
credentialed in the subject area and for the pupils they are teaching; • Pupils have access to standards-aligned instructional materials; and • School facilities are maintained in good repair.
Teacher Credentials
Salt Creek Elementary School 14-15 15-16 16-17
With Full Credential 40 40 39
Without Full Credential 0 0
Teaching Outside Subject Area of Competence 0 0 NA
Chula Vista Elementary School District 14-15 15-16 16-17
With Full Credential ♦ ♦ 1268
Without Full Credential ♦ ♦ 16
Teaching Outside Subject Area of Competence ♦ ♦ NA
Teacher Misassignments and Vacant Teacher Positions at this School
Salt Creek Elementary School 14-15 15-16 16-17
Teachers of English Learners 0 0
Total Teacher Misassignments 0 0
Vacant Teacher Positions 0 0
* “Misassignments” refers to the number of positions filled by teachers who lack legal authorization to teach that grade level, subject area, student group, etc. Total Teacher Misassignments includes the number of Misassignments of Teachers of English Learners.
Core Academic Classes Taught by Highly Qualified Teachers
2015-16 Percent of Classes In Core Academic Subjects Core Academic Classes Taught by Highly Qualified Teachers
Location of Classes Taught by Highly
Qualified Teachers Not Taught by Highly
Qualified Teachers
This School 97.5 2.5
Districtwide
All Schools 96.4 3.6
High-Poverty Schools 95.0 5.0
Low-Poverty Schools 98.4 1.6
* High-poverty schools are defined as those schools with student eligibility of approximately 40 percent or more in the free and reduced price meals program. Low-poverty schools are those with student eligibility of approximately 39 percent or less in the free and reduced price meals program.

2015-16 School Accountability Report Card for Salt Creek Elementary School Page 3 of 12
Quality, Currency, Availability of Textbooks and Instructional Materials (School Year 2016-17) The Chula Vista Elementary School District follows the State’s curriculum cycle to adopt updated, high quality textbooks and related materials. The evaluation and adoption of textbooks and instructional materials is based on recommendations by committees of our District’s school staffs and community members. Students are provided with an adequate supply of Board-approved textbooks for all subject areas. The reading/language arts and mathematics curricula are aligned with California Common Core Standards.. All of our students have access to textbooks and supportive instructional materials in all core subjects, which are in good condition. Core materials are available in both English and Spanish. An inventory of books is warehoused centrally for growth needs at the schools. The District’s vision is to prepare students to succeed in the 21st Century and is committed to providing students with 21st century tools, and the necessary infrastructure to support said tools. The District also invested in software applications to assist with formative and summative assessments, literacy skills, mathematics and language acquisition. In addition, teachers are integrating technology tools to facilitate day to day tasks such as attendance, report cards and electronic communication.
Textbooks and Instructional Materials
Year and month in which data were collected: November 2016
Core Curriculum Area Textbooks and Instructional Materials/Year of Adoption
Reading/Language Arts Houghton Mifflin Reading K-6 and Houghton Mifflin Lectura K-6 Spanish. Adopted in 2002-03.
The textbooks listed are from most recent adoption: Yes
Percent of students lacking their own assigned textbook: 0%
Mathematics Houghton Mifflin Go Math K-6, English and Spanish. Adopted in 2015-2016.
The textbooks listed are from most recent adoption: Yes
Percent of students lacking their own assigned textbook: 0%
Science Houghton-Mifflin Science series for Kindergarten to Sixth Grade English and Spanish. Adopted Spring 2008.
The textbooks listed are from most recent adoption: Yes
Percent of students lacking their own assigned textbook: 0%
History-Social Science Harcourt Social Studies Kindergarten – Sixth grade (English & Spanish). Adopted Spring 2007.
The textbooks listed are from most recent adoption: Yes
Percent of students lacking their own assigned textbook: 0%
School Facility Conditions and Planned Improvements (Most Recent Year) The District maintains a planned program, which ensures routine maintenance functions are performed on a scheduled basis. Salt Creek Elementary’s custodial staff performs basic cleaning operations daily.
School Facility Good Repair Status (Most Recent Year) Year and month in which data were collected: 12/12/2015
System Inspected Repair Status Repair Needed and
Action Taken or Planned Good Fair Poor
Systems: Gas Leaks, Mechanical/HVAC, Sewer
X
Interior: Interior Surfaces
X CR 301: (4) stained ceiling tile (7) Light out CR 501: (4) stained ceiling tile CR 702: (4) Dirty registers (9) Loose drinking fountain Kitchen storage: (4) Hole in ceiling needs cover Multipurpose: (4) Cracks in drywall above doors to kitchen

2015-16 School Accountability Report Card for Salt Creek Elementary School Page 4 of 12
School Facility Good Repair Status (Most Recent Year) Year and month in which data were collected: 12/12/2015
System Inspected Repair Status Repair Needed and
Action Taken or Planned Good Fair Poor
Cleanliness: Overall Cleanliness, Pest/ Vermin Infestation
X
Electrical: Electrical
X 300 girls RR: (7) Light out (8) Loose toilet seat CR 301: (4) stained ceiling tile (7) Light out CR 703: Library: (7) Light out
Restrooms/Fountains: Restrooms, Sinks/ Fountains
X 300 girls RR: (7) Light out (8) Loose toilet seat CR 606: (9) fountain sticks on CR 701: (9) Loose drinking fountain CR 702: (4) Dirty registers (9) Loose drinking fountain Library boys RR: (8) Loose toilet seats
Safety: Fire Safety, Hazardous Materials
X CR 401: (11) household disinfectant CR 605: (10) Plug in air freshener CR704:
Structural: Structural Damage, Roofs
X
External: Playground/School Grounds, Windows/ Doors/Gates/Fences
X Playground: (14) Need wood chips
Overall Rating Exemplary Good Fair Poor
---------- X
2015-16 School Accountability Report Card for Salt Creek Elementary School Page 5 of 12
B. Pupil Outcomes
State Priority: Pupil Achievement The SARC provides the following information relevant to the State priority: Pupil Achievement (Priority 4): • Statewide assessments (i.e., California Assessment of Student
Performance and Progress [CAASPP] System, which includes the Smarter Balanced Summative Assessments for students in the general education population and the California Alternate Assessments [CAAs] for English language arts/literacy [ELA] and mathematics given in grades three through eight and grade eleven. The CAAs have replaced the California Alternate Performance Assessment [CAPA] for ELA and mathematics, which were eliminated in 2015. Only eligible students may participate in the administration of the CAAs. CAA items are aligned with alternate achievement standards, which are linked with the Common Core State Standards [CCSS] for students with significant cognitive disabilities); and
• The percentage of students who have successfully completed
courses that satisfy the requirements for entrance to the University of California and the California State University, or career technical education sequences or programs of study
2015-16 CAASPP Results for All Students
Subject
Percent of Students Meeting or Exceeding the State Standards (grades 3-8 and 11)
School District State
14-15 15-16 14-15 15-16 14-15 15-16
ELA 65 79 55 62 44 48
Math 59 66 43 48 34 36
* Percentages are not calculated when the number of students tested is ten or less, either because the number of students in this category is too small for statistical accuracy or to protect student privacy.
CAASPP Results for All Students - Three-Year Comparison
Subject
Percent of Students Scoring at Proficient or Advanced (meeting or exceeding the state standards)
School District State
13-14 14-15 15-16 13-14 14-15 15-16 13-14 14-15 15-16
Science 93 88 89 71 67 62 60 56 54
* Science test results include California Standards Tests (CSTs), California Modified Assessment (CMA), and California Alternate Performance Assessment (CAPA) in grades five, eight, and ten. Scores are not shown when the number of students tested is ten or less, either because the number of students in this category is too small for statistical accuracy or to protect student privacy.
Grade Level
2015-16 Percent of Students Meeting Fitness Standards
4 of 6 5 of 6 6 of 6
---5--- 19.2 31.4 45.5
* Percentages are not calculated when the number of students tested is ten or less, either because the number of students in this category is too small for statistical accuracy or to protect student privacy.
2015-16 CAASPP Results by Student Group
Science (grades 5, 8, and 10)
Group Number of Students Percent of Students
Enrolled with Valid Scores w/ Valid Scores Proficient or Advanced
All Students 165 159 96.4 88.7
Male 88 84 95.5 89.3
Female 77 75 97.4 88.0
Filipino 19 19 100.0 100.0
Hispanic or Latino 80 78 97.5 84.6
White 37 36 97.3 97.2
Two or More Races 12 12 100.0 83.3
Socioeconomically Disadvantaged 26 25 96.2 60.0
English Learners 26 23 88.5 69.6
* Science test results include CSTs, CMA, and CAPA in grades five, eight, and ten. The “Proficient or Advanced” is calculated by taking the total number of students who scored at Proficient or Advanced on the science assessment divided by the total number of students with valid scores. Scores are not shown when the number of students tested is ten or less, either because the number of students in this category is too small for statistical accuracy or to protect student privacy.

2015-16 School Accountability Report Card for Salt Creek Elementary School Page 6 of 12
School Year 2015-16 CAASPP Assessment Results - English Language Arts (ELA) Disaggregated by Student Groups, Grades Three through Eight and Eleven
Student Group Grade
Number of Students Percent of Students
Enrolled Tested Tested Standard Met or
Exceeded
All Students 3 138 136 98.5 81.6
4 158 151 95.6 72.8
5 164 154 93.9 80.5
6 147 140 95.2 82.9
Male 3 71 70 98.6 80.0
4 78 77 98.7 64.9
5 87 82 94.3 79.3
6 71 69 97.2 78.3
Female 3 67 66 98.5 83.3
4 80 74 92.5 81.1
5 77 72 93.5 81.9
6 76 71 93.4 87.3
Black or African American 3 -- -- -- --
4 -- -- -- --
5 -- -- -- --
6 -- -- -- --
American Indian or Alaska Native 3 -- -- -- --
Asian 3 -- -- -- --
4 13 12 92.3 91.7
5 -- -- -- --
6 -- -- -- --
Filipino 3 25 25 100.0 84.0
4 17 17 100.0 70.6
5 19 19 100.0 89.5
6 28 28 100.0 89.3
Hispanic or Latino 3 66 65 98.5 73.8
4 82 77 93.9 67.5
5 79 74 93.7 74.3
6 78 74 94.9 79.7
Native Hawaiian or Pacific Islander 4 -- -- -- --
White 3 32 31 96.9 93.5
4 31 31 100.0 80.7
5 37 35 94.6 88.6
6 23 21 91.3 95.2

2015-16 School Accountability Report Card for Salt Creek Elementary School Page 7 of 12
School Year 2015-16 CAASPP Assessment Results - English Language Arts (ELA) Disaggregated by Student Groups, Grades Three through Eight and Eleven
Student Group Grade
Number of Students Percent of Students
Enrolled Tested Tested Standard Met or
Exceeded
Two or More Races 3 -- -- -- --
4 -- -- -- --
5 12 12 100.0 91.7
6 -- -- -- --
Socioeconomically Disadvantaged 3 22 21 95.5 66.7
4 21 20 95.2 45.0
5 25 23 92.0 60.9
6 23 23 100.0 69.6
English Learners 3 36 35 97.2 62.9
4 28 24 85.7 41.7
5 26 23 88.5 52.2
6 13 10 76.9 40.0
Students with Disabilities 3 -- -- -- --
4 12 11 91.7 18.2
5 -- -- -- --
6 -- -- -- --
Foster Youth 3 -- -- -- --
4 -- -- -- --
5 -- -- -- --
6 -- -- -- --
ELA test results include the Smarter Balanced Summative Assessment and the CAA. The “Percent Met or Exceeded” is calculated by taking the total number of students who met or exceeded the standard on the Smarter Balanced Summative Assessment plus the total number of students who met the standard on the CAAs divided by the total number of students who participated in both assessments. Double dashes (--) appear in the table when the number of students is ten or less, either because the number of students in this category is too small for statistical accuracy or to protect student privacy. The number of students tested includes all students who participated in the test whether they received a score or not; however, the number of students tested is not the number that was used to calculate the achievement level percentages. The achievement level percentages are calculated using only students who received scores.
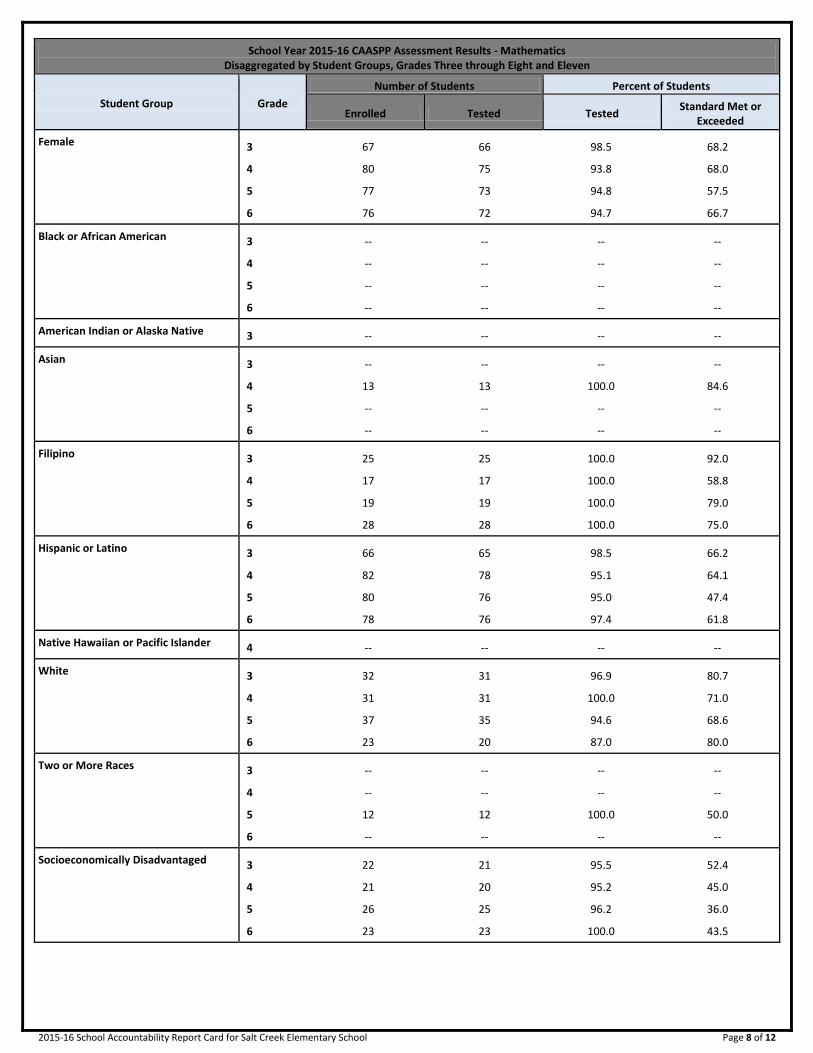
School Year 2015-16 CAASPP Assessment Results - Mathematics Disaggregated by Student Groups, Grades Three through Eight and Eleven
Student Group Grade
Number of Students Percent of Students
Enrolled Tested Tested Standard Met or
Exceeded
All Students 3 138 136 98.5 75.7
4 158 153 96.8 64.0
5 165 156 94.5 57.0
6 147 141 95.9 67.4
Male 3 71 70 98.6 82.9
4 78 78 100.0 60.3
5 88 83 94.3 56.6
6 71 69 97.2 68.1
2015-16 School Accountability Report Card for Salt Creek Elementary School Page 8 of 12
School Year 2015-16 CAASPP Assessment Results - Mathematics Disaggregated by Student Groups, Grades Three through Eight and Eleven
Student Group Grade
Number of Students Percent of Students
Enrolled Tested Tested Standard Met or
Exceeded
Female 3 67 66 98.5 68.2
4 80 75 93.8 68.0
5 77 73 94.8 57.5
6 76 72 94.7 66.7
Black or African American 3 -- -- -- --
4 -- -- -- --
5 -- -- -- --
6 -- -- -- --
American Indian or Alaska Native 3 -- -- -- --
Asian 3 -- -- -- --
4 13 13 100.0 84.6
5 -- -- -- --
6 -- -- -- --
Filipino 3 25 25 100.0 92.0
4 17 17 100.0 58.8
5 19 19 100.0 79.0
6 28 28 100.0 75.0
Hispanic or Latino 3 66 65 98.5 66.2
4 82 78 95.1 64.1
5 80 76 95.0 47.4
6 78 76 97.4 61.8
Native Hawaiian or Pacific Islander 4 -- -- -- --
White 3 32 31 96.9 80.7
4 31 31 100.0 71.0
5 37 35 94.6 68.6
6 23 20 87.0 80.0
Two or More Races 3 -- -- -- --
4 -- -- -- --
5 12 12 100.0 50.0
6 -- -- -- --
Socioeconomically Disadvantaged 3 22 21 95.5 52.4
4 21 20 95.2 45.0
5 26 25 96.2 36.0
6 23 23 100.0 43.5

2015-16 School Accountability Report Card for Salt Creek Elementary School Page 9 of 12
School Year 2015-16 CAASPP Assessment Results - Mathematics Disaggregated by Student Groups, Grades Three through Eight and Eleven
Student Group Grade
Number of Students Percent of Students
Enrolled Tested Tested Standard Met or
Exceeded
English Learners 3 36 35 97.2 37.1
4 28 26 92.9 42.3
5 26 23 88.5 17.4
6 13 12 92.3 8.3
Students with Disabilities 3 -- -- -- --
4 12 11 91.7 18.2
5 -- -- -- --
6 -- -- -- --
Foster Youth 3 -- -- -- --
4 -- -- -- --
5 -- -- -- --
6 -- -- -- --
Mathematics test results include the Smarter Balanced Summative Assessment and the CAA. The “Percent Met or Exceeded” is calculated by taking the total number of students who met or exceeded the standard on the Smarter Balanced Summative Assessment plus the total number of students who met the standard on the CAAs divided by the total number of students who participated in both assessments. Double dashes (--) appear in the table when the number of students is ten or less, either because the number of students in this category is too small for statistical accuracy or to protect student privacy. The number of students tested includes all students who participated in the test whether they received a score or not; however, the number of students tested is not the number that was used to calculate the achievement level percentages. The achievement level percentages are calculated using only students who received scores.
C. Engagement
State Priority: Parental Involvement The SARC provides the following information relevant to the Parental Involvement State Priority (Priority 3): • Efforts the school district makes to seek parent input in making decisions for the school district and each schoolsite. Opportunities for Parental Involvement (School Year 2016-17) Contact Lalaine Perez, Principal, or Robert Cochran, Associate Principal, at (619) 397-5494 to become involved. Research shows a high correlation between parent involvement and effective schools. We encourage parents to become actively involved in our school. We have regular Coffee Chats to keep parents informed about school programs, policies, curriculum, instruction, assessment and activities. We provide parents with ways in which they can become partners with us in the education of their children. Additionally, we have a very active Parent Teacher Group, GATE Parent Committee, and English Learner Advisory Committee, Safety Committee, and School Site Council.
State Priority: School Climate The SARC provides the following information relevant to the School Climate State Priority (Priority 6): • Pupil suspension rates; • Pupil expulsion rates; and • Other local measures on the sense of safety. School Safety Plan Required drills are conducted regularly, which include monthly fire drills, quarterly earthquake drills, two lockdown drills, two shelter in place drills, and one annual bus evacuation drill. All visitors check in the office using the RAPTOR system and wear a visitor's pass while on site. Parent volunteers direct morning traffic to allow for safe drop-off. Safety Patrol assist with safe pedestrian crossing before and after school. All classrooms are equipped with an emergency bag and a Safety Clip Board with instructions for all emergency procedures. A Safety Committee that includes staff, parents, and our School Resource Officer provides feedback and input to SSC regarding the School Safety Plan. The Comprehensive School Safety Plan was approved by SSC on September 7, 2016.
2016-17 School Accountability Report Card for Salt Creek Elementary School Page 10 of 12
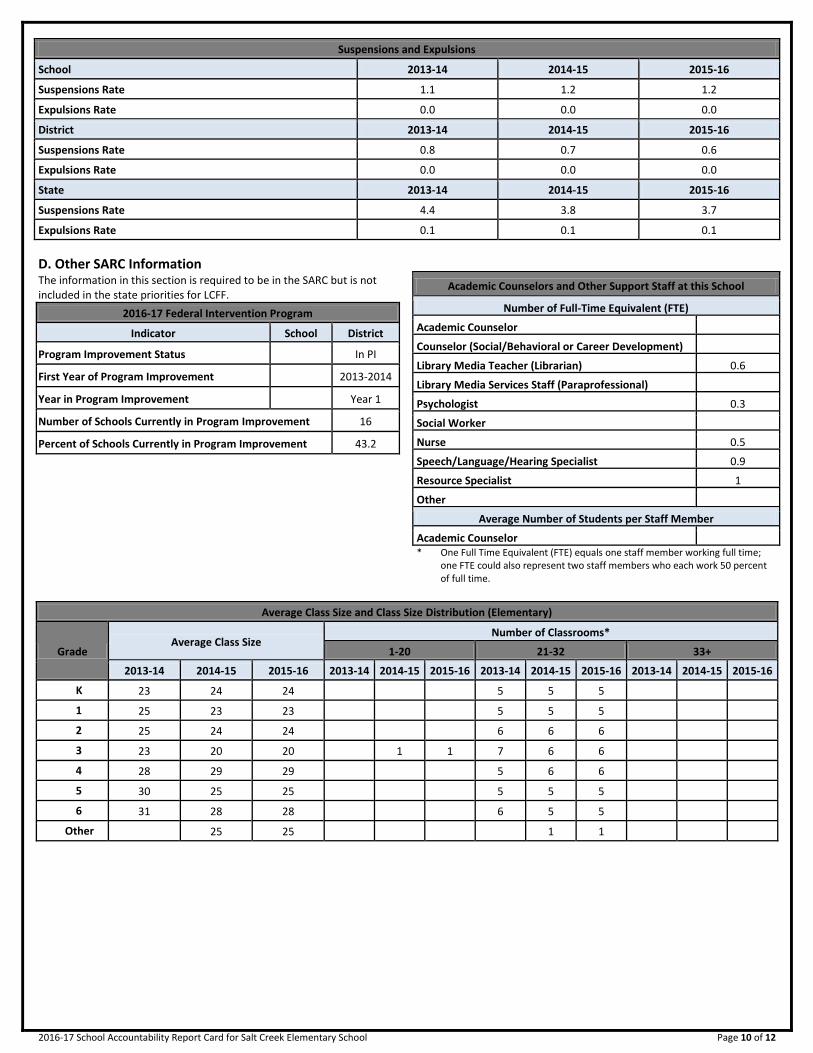
Suspensions and Expulsions
School 2013-14 2014-15 2015-16
Suspensions Rate 1.1 1.2 1.2
Expulsions Rate 0.0 0.0 0.0
District 2013-14 2014-15 2015-16
Suspensions Rate 0.8 0.7 0.6
Expulsions Rate 0.0 0.0 0.0
State 2013-14 2014-15 2015-16
Suspensions Rate 4.4 3.8 3.7
Expulsions Rate 0.1 0.1 0.1
D. Other SARC Information
The information in this section is required to be in the SARC but is not included in the state priorities for LCFF.
2016-17 Federal Intervention Program
Indicator School District
Program Improvement Status In PI
First Year of Program Improvement 2013-2014
Year in Program Improvement Year 1
Number of Schools Currently in Program Improvement 16
Percent of Schools Currently in Program Improvement 43.2
Academic Counselors and Other Support Staff at this School
Number of Full-Time Equivalent (FTE)
Academic Counselor-------
Counselor (Social/Behavioral or Career Development)
Library Media Teacher (Librarian) 0.6
Library Media Services Staff (Paraprofessional)
Psychologist------- 0.3
Social Worker-------
Nurse------- 0.5
Speech/Language/Hearing Specialist 0.9
Resource Specialist------- 1
Other-------
Average Number of Students per Staff Member
Academic Counselor------- * One Full Time Equivalent (FTE) equals one staff member working full time;
one FTE could also represent two staff members who each work 50 percent of full time.
Average Class Size and Class Size Distribution (Elementary)
Grade Average Class Size
Number of Classrooms*
1-20 21-32 33+
2013-14 2014-15 2015-16 2013-14 2014-15 2015-16 2013-14 2014-15 2015-16 2013-14 2014-15 2015-16
K
23 24 24 5 5 5
1
25 23 23 5 5 5
2
25 24 24 6 6 6
3
23 20 20 1 1 7 6 6
4
28 29 29 5 6 6
5
30 25 25 5 5 5
6
31 28 28 6 5 5
Other
25 25 1 1

2016-17 School Accountability Report Card for Salt Creek Elementary School Page 11 of 12
Professional Development provided for Teachers Each year, targeted professional improvement activities are provided for teachers, instructional aides, and other employees. Activities reflect the school's goals and objectives and are part of our School Single Site Plan. Staff development topics for the past three years included: LANGUAGE AND LITERACY:
• GLAD: Three modules of GLAD provided by Gloria Velarde and Lorena Beyfuss to support teachers in implementation of pictorial input charts, explicit vocabulary, metacognition, and use of sentence frames and chants to support English Learners, Spanish Learners, and ALL learners.
• Vocabulary's CODE: Staff development on meaningful vocabulary instruction using the strategy of Vocabulary's CODE from the book, "The Core Six: Essential Strategies for Academic Achievement in the Common Core" was provided to all staff to increase academic language for all students, particularly English Learners.
• Designated ELD: ILT provided Designated ELD training using resources from the District ILT Academy presentation by Nancy Rojas (Department of Language Acquisition), site created ELD video lessons, the Language and Literacy Toolkit from the Stanislaus School District, and the CA ELD Standards.
MATH:
• To continue to support conceptual math, District Math Resource Teacher Denise Finney has provided professional development in Number Talks and Math Writing. Content provided to teachers also support Language and Literacy in the area of mathematics. In addition, all teachers K-6 received training on our new math adoption, Houghton-Mifflin's Go Math. Professional development included training on these of the online resources.
• Site Resource Teacher will provide training in the Standards of Mathematical Practices using resources from District Math Resource Teacher Finney as follow up work with our COMPASS cohort.
Achieve 3000:
• All 2nd-6th grade teachers received training in Achieve 3000, a web-based reading comprehension program that focuses on nonfiction text and activities that support increasing Lexile to meet College and Career Readiness. Support is also given to sites throughout the year to ensure successful implementation.
Classroom Management/Behavior:
• Larry Alvarado has provided at least two staff trainings on "Classroom Management" and "How to Handle the ADHD Student in the Classroom" to provide tools for teachers on establishing a positive classroom climate for learning.
Visible Learning:
• Administration has facilitated professional learning using the book, "Visible Learning for Literacy" by Doug Fisher and Nancy Frey, which incorporates the research of John Hattie on practices and influences that make the biggest impact on student achievement.
FY 2014-15 Teacher and Administrative Salaries
Category District Amount
State Average for Districts In Same
Category
Beginning Teacher Salary $46,210 $44,573
Mid-Range Teacher Salary $69,717 $72,868
Highest Teacher Salary $92,864 $92,972
Average Principal Salary (ES) $122,938 $116,229
Average Principal Salary (MS) $119,596
Average Principal Salary (HS) $121,883
Superintendent Salary $252,443 $201,784
Percent of District Budget
Teacher Salaries 39% 39%
Administrative Salaries 5% 5% * For detailed information on salaries, see the CDE Certificated Salaries &
Benefits webpage at www.cde.ca.gov/ds/fd/cs/.
FY 2014-15 Expenditures Per Pupil and School Site Teacher Salaries
Level Expenditures Per Pupil Average
Teacher Salary Total Restricted Unrestricted
School Site-------
8,290.51 1,993.32 6,297.19 71,218
District-------
♦ ♦ 6,990.07 $71,827
State------- ♦ ♦ $5,677 $75,137
Percent Difference: School Site/District -9.9 -0.8
Percent Difference: School Site/ State 10.9 -5.2
* Cells with ♦ do not require data.

2016-17 School Accountability Report Card for Salt Creek Elementary School Page 12 of 12
Types of Services Funded
Students' academic and social/emotional needs are met through a variety of programs that are supported by site and categorical funds. KIDCO meets the needs of students who are having difficulty adjusting due to transition to a new school, changes in family structure, or military transfer. Our District Social Worker also provides services students once a week. English Learners at CELDT 1 and 2 are invited to an additional learning opportunity Monday-Thursday at our Imagine Learning English Morning Program in the computer lab. GATE students are also invited to our after school Monarch Butterfly Program, Technology club, Entrepreneur Academy, and Career Academy. To meet academic needs, Extended Day after school tutoring is offered in math and reading for 3rd-6th grade, and JumpStart reading intervention is offered for K-2nd grade.
DataQuest DataQuest is an online data tool located on the CDE DataQuest Web page at http://dq.cde.ca.gov/dataquest/ that contains additional information about this school and comparisons of the school to the district and the county. Specifically, DataQuest is a dynamic system that provides reports for accountability (e.g., test data, enrollment, high school graduates, dropouts, course enrollments, staffing, and data regarding English learners).
Internet Access Internet access is available at public libraries and other locations that are publicly accessible (e.g., the California State Library). Access to the Internet at libraries and public locations is generally provided on a first-come, first-served basis. Other use restrictions may include the hours of operation, the length of time that a workstation may be used (depending on availability), the types of software programs available on a workstation, and the ability to print documents.