SALINITY INDUCED CHANGES IN THE LEAF ANATOMY OF …...Journal of Coastal Development ISSN :...
18
Journal of Coastal Development ISSN : 1410-5217 Volume 14, Number 3 : June : 191-201 Accredited : 83/Dikti/Kep/2009 191 SALINITY INDUCED CHANGES IN THE LEAF ANATOMY OF THE MANGROVE Avicennia marina ALONG THE ANTHROPOGENICALLY STRESSED TROPICAL CREEK M.U.Borkar 1 , Athalye R.P. 1 and Quadros Goldin 2 1 B.N.Bandodkar College of Science, Chendani Koliwada, Thane (West) 400 601. 2 WWF-India, Maharashtra State Office, 204 National Insurance Building, D.N. Road, Fort. Mumbai 400 001, India ABSTRACT The mangrove Avicennia marina is a dominant mangrove along the anthropogenically stressed tropical Thane creek, west coast of India. Leaf anatomy of the mangrove along the Thane creek, was assessed in relation to stationwise and seasonwise variations in salinity. It was noticed that under the conditions of higher salinity, Avicennia marina showed increased thickness of hypodermal water storage tissue in the leaf (for conservation of water) and produced taller salt extruding glands at the lower epidermis to eliminate more salt; whereas, the thickness of the photosynthetic mesophyllic tissue significantly reduced. At lower salinity or with reduction in salinity in monsoon, contrary to above occurred. These changes probably explain the stunted growth of Avicennia marina in high salinity environment and its vigorous growth at lower salinity. Key Words: Avicennia marina ; salinity ; water storage tissue ; stunted growth ; thane creek Corresponding : email: [email protected] / [email protected] / [email protected] INTRODUCTION Mangroves are salt tolerant angiosperm plants, which are commonly present along the banks of coastal water bodies such as estuaries and creeks. Arroyo (1977) defined mangroves as ―A small group of true mangrove plants and associated species belonging to systematically unrelated families, possessing similar physiological characteristics and structural adaptations with common preference to the intertidal habitat.‖ The special adaptation of these plants is that they are tolerant to fluctuating water salinity. The prop roots and the stilt roots form a firm anchorage in the sinking substratum, also trap the fine suspended particles in water leading to accumulation of sediment and formation of the mudflats. The mudflats enhance the settlement and growth of different mangrove species and their associate plants there by developing mangrove forest or ―mangrove ecosystem‖. The mangrove forests grow by taking nutrients from the tidal waters and in turn provide natural food to the mangrove dwelling fauna (Odum et al., 1982). The forest detritus, comprising of fallen leaves and branches from the mangroves, provides nutrients to the coastal environment and support immense variety of sea life in intricate food webs, associated directly through detritus, and indirectly through the planktonic and epiphytic algal food chain. The organic detritus, according to Darnell (1967), is ―All types of biogenic materials in various stages of microbial decomposition which represent potential energy sources for consumer species.‖ Simenstad (1983) expanded this definition to include ‗any free particles of organic matter, which no longer produce carbon through photosynthesis.‘ In this, he included all the biogenic particles of both plant and animal origin; as well as free formed (through chemical or geological processes) particles including associated, adsorbed, or dissolved substances and residing microbes. According to Jiunn (1995), the mangrove mudflats receive nutrients not only from the mangroves but also from other sources such as terrestrial run off and Original Paper
Transcript of SALINITY INDUCED CHANGES IN THE LEAF ANATOMY OF …...Journal of Coastal Development ISSN :...
Journal of Coastal Development ISSN : 1410-5217 Volume 14, Number 3 : June : 191-201 Accredited : 83/Dikti/Kep/2009
191
SALINITY INDUCED CHANGES IN THE LEAF ANATOMY OF THE MANGROVE Avicennia marina ALONG THE
ANTHROPOGENICALLY STRESSED TROPICAL CREEK
M.U.Borkar
1, Athalye R.P.
1 and Quadros Goldin
2
1B.N.Bandodkar College of Science, Chendani Koliwada, Thane (West) 400 601.
2 WWF-India, Maharashtra State Office, 204 National Insurance Building, D.N. Road, Fort.
Mumbai 400 001, India
ABSTRACT
The mangrove Avicennia marina is a dominant mangrove along the anthropogenically stressed tropical
Thane creek, west coast of India. Leaf anatomy of the mangrove along the Thane creek, was assessed in
relation to stationwise and seasonwise variations in salinity. It was noticed that under the conditions of
higher salinity, Avicennia marina showed increased thickness of hypodermal water storage tissue in the leaf
(for conservation of water) and produced taller salt extruding glands at the lower epidermis to eliminate
more salt; whereas, the thickness of the photosynthetic mesophyllic tissue significantly reduced. At lower
salinity or with reduction in salinity in monsoon, contrary to above occurred. These changes probably
explain the stunted growth of Avicennia marina in high salinity environment and its vigorous growth at lower
salinity.
Key Words: Avicennia marina ; salinity ; water storage tissue ; stunted growth ; thane creek
Corresponding : email: [email protected] / [email protected] / [email protected]
INTRODUCTION
Mangroves are salt tolerant angiosperm plants,
which are commonly present along the banks of
coastal water bodies such as estuaries and
creeks. Arroyo (1977) defined mangroves as ―A
small group of true mangrove plants and
associated species belonging to systematically
unrelated families, possessing similar
physiological characteristics and structural
adaptations with common preference to the
intertidal habitat.‖ The special adaptation of
these plants is that they are tolerant to
fluctuating water salinity. The prop roots and
the stilt roots form a firm anchorage in the
sinking substratum, also trap the fine suspended
particles in water leading to accumulation of
sediment and formation of the mudflats. The
mudflats enhance the settlement and growth of
different mangrove species and their associate
plants there by developing mangrove forest or
―mangrove ecosystem‖.
The mangrove forests grow by taking
nutrients from the tidal waters and in turn
provide natural food to the mangrove dwelling
fauna (Odum et al., 1982). The forest detritus,
comprising of fallen leaves and branches from
the mangroves, provides nutrients to the coastal
environment and support immense variety of
sea life in intricate food webs, associated
directly through detritus, and indirectly through
the planktonic and epiphytic algal food chain.
The organic detritus, according to Darnell
(1967), is ―All types of biogenic materials in
various stages of microbial decomposition
which represent potential energy sources for
consumer species.‖ Simenstad (1983) expanded
this definition to include ‗any free particles of
organic matter, which no longer produce carbon
through photosynthesis.‘ In this, he included all
the biogenic particles of both plant and animal
origin; as well as free formed (through chemical
or geological processes) particles including
associated, adsorbed, or dissolved substances
and residing microbes. According to Jiunn
(1995), the mangrove mudflats receive nutrients
not only from the mangroves but also from
other sources such as terrestrial run off and
Original Paper
Journal of Coastal Development ISSN : 1410-5217 Volume 14, Number 3 : June : 191-201 Accredited : 83/Dikti/Kep/2009
192
estuary outflow, depending upon the
geomorphology of the basin and tidal
amplitude. The mangrove ecosystems serve as
sinks for macro and micronutrients and also the
heavy metals and other toxicants, whenever
there is pollution. The nutrient rich mangrove
ecosystems support a complex community
assemblage in their vicinity, and also export
organic and inorganic nutrients to the open seas
through tidal cycles and enrich them to increase
their productivity.
The mangroves have adapted
themselves best in the shallow sea coast,
sheltered estuaries and deltaic zones of the
tropics and subtropics with characteristic
environmental conditions viz. temperature
ranges between 20o C to 30
o C, moderate to high
monsoon precipitation i.e. 1000 – 3000 mm/
annum, high humidity but with coastal aridity.
On the sea-land interface in global mangrove
systems, there are gradual, slow or quickly
changing ecological or geomorphological
conditions to which mangroves have to adapt.
The human thrust or pressure, other biotic
factors and interactions also cause changes in
mangrove ecosystems. Due to this the
mangroves are now very dynamic but have
become fragile through out the globe.
The salinity tolerant plants in mangrove
ecosystem are commonly known as halophytes.
They are adapted to survive in a range of saline
environments. In any environment the
halophytes require water for growth and
development. To obtain sufficient water,
osmotic adjustments have to be made. For this
the halophytes take up ions to increase the
osmotic level in their tissues, which permits
moisture to move from soil into the tissues. On
the other hand excess salt ions can produce
toxic effects on plant cells. To counter these
potential toxic effects of high concentration of
ions different mechanisms are used by the
halophytes such as exclusion of salts by the
roots, dilution of ions through succulence,
synthesizing organic osmotic compounds that
can reduce the need for salt ions, and
distribution of excess salt ions into tissues,
organs, or the vacuoles of the cells. The
halophytes need to obtain sufficient ions to
maintain growth while avoiding water deficit or
an excess of ions. In a world where most of the
water is saline halophytic plant are examples of
effective adaptations to increased salinity (Rao
and Tan, 1984). These adaptations have
provided study subjects to many researchers.
The mangrove Avicennia marina is the
dominant mangrove species along the Thane
creek that occurs through out the length of the
creek. The mangrove Avicennia marina has salt
storing glands, salt extruding glands, water
storage tissue, ability to synthesize and store
tannin etc. The changes in the leaf anatomy of
the mangrove along the anthropogenically
stressed Thane creek (Quadros et al., 2004 &
2009) west coast of India, were assessed in
relation to stationwise and seasonwise
variations in salinity. Being the dominant
species it was studied to assess salinity induced
changes on the leaf anatomy.
MATERIALS AND METHODS
Sample Collection
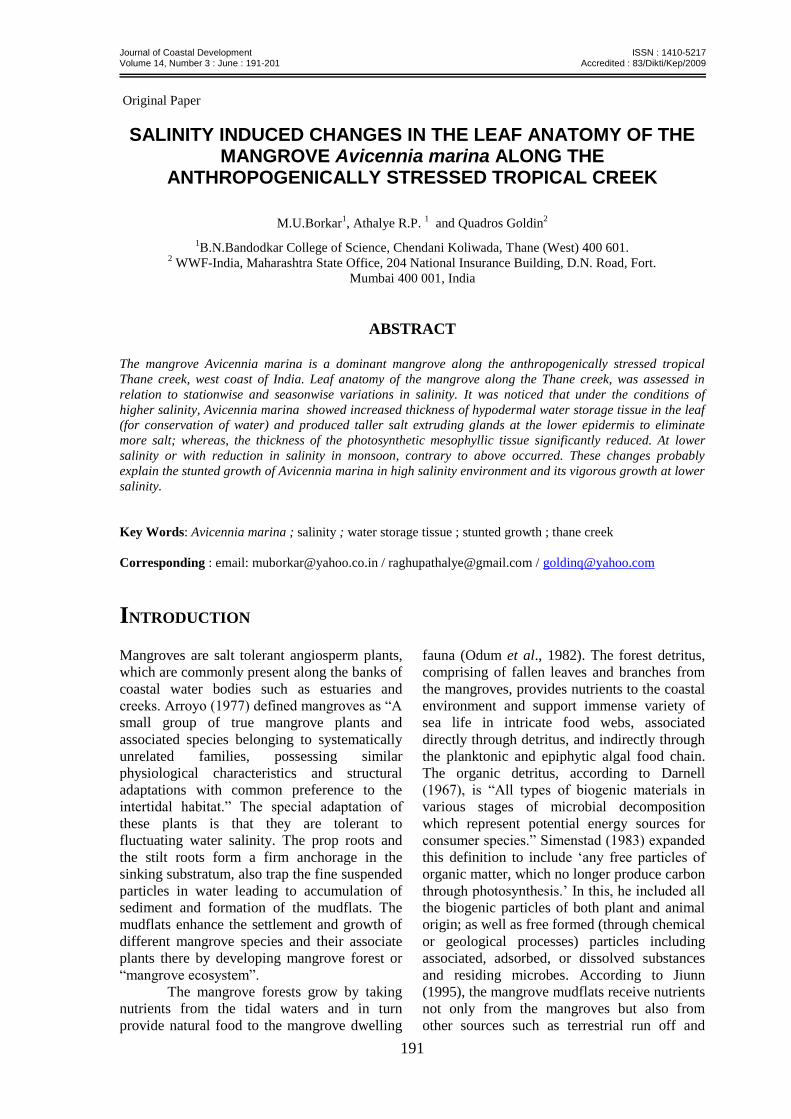
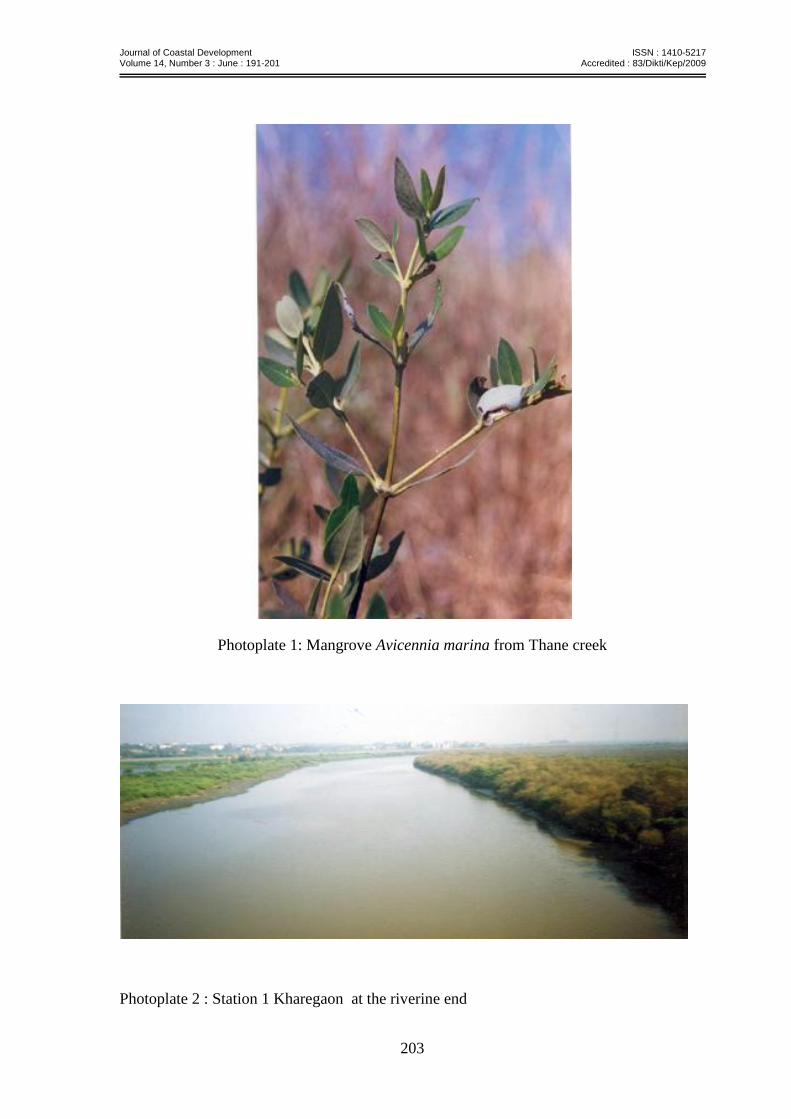
Samples of leaves of Avicennia marina (Fig. 1)
were collected seasonally for four seasons viz.
monsoon or rainy season (June to September),
early post monsoon or the recovery period,
when the salinity in the creek which is lowered
in monsoon, recovers (October - November),
late post monsoon or winter season (December
to February) and premonsoon or summer
(March to May).
Two stations were selected along the 26
km stretch of the Thane creek. According to
Miller and Ambrose (2000), species are rarely
dispersed uniformly in nature; hence the
ecological field studies should be designed
accordingly.
Of the two stations selected, one was on
the riverine end of the creek; the other station
was at the seaward end of the creek. Thus the
stations represent low and high salinity regions
of the creek respectively. The profile of the
sampling stations is as follows:
Journal of Coastal Development ISSN : 1410-5217 Volume 14, Number 3 : June : 191-201 Accredited : 83/Dikti/Kep/2009
193
Fig.1. Mangrove Avicennia marina from Thane creek
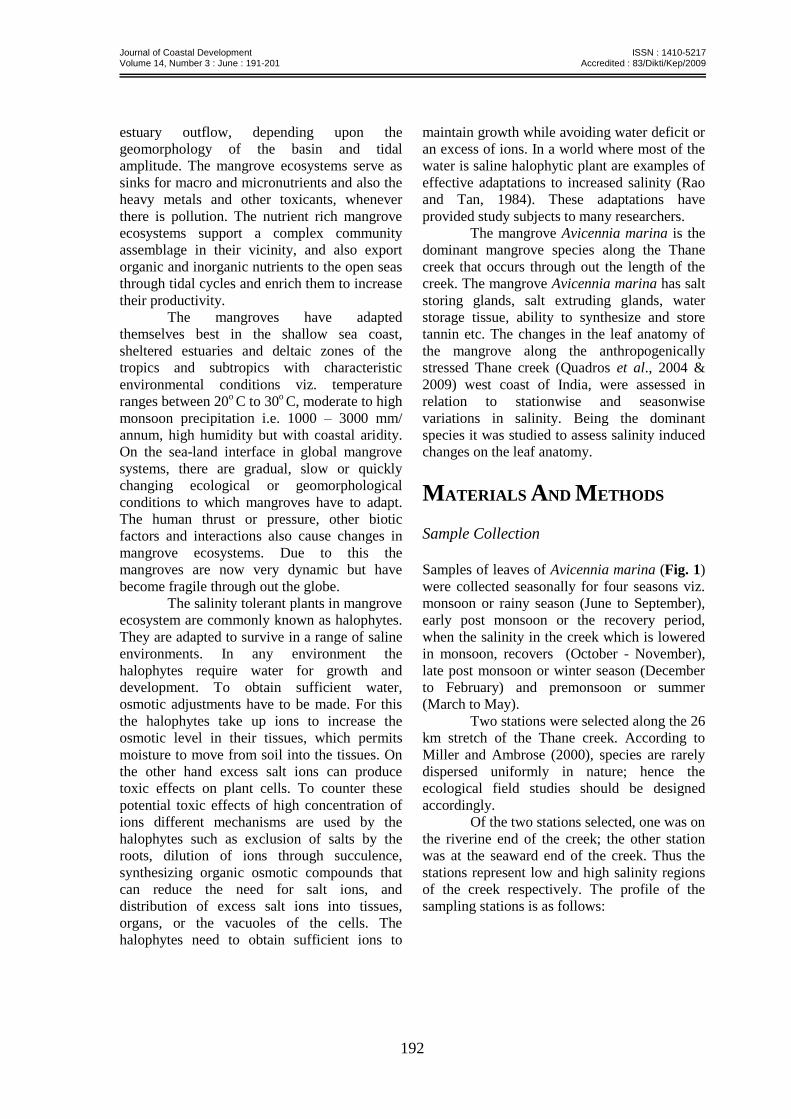
Station 1 – (Near Kharegaon village)
This station is on the east bank of the Thane
creek situated about 1.5 km downstream from
the place where the creek meets the Ulhas river
estuary by a narrow connection (Fig.2). It has
relatively more influence of fresh water. At this
station the mudflats were about 15 meters wide
from the midstream, black in colour, soft and
sinking type. The total width of the creek
during the peak high tide was barely 100
meters, and the water depth about 3 meters.
This station faced a large amount of
anthropogenic pressure in terms of human
activity, and the sewage and solid waste
disposal.
Fig. 2. Station 1 Kharegaon at the riverine end
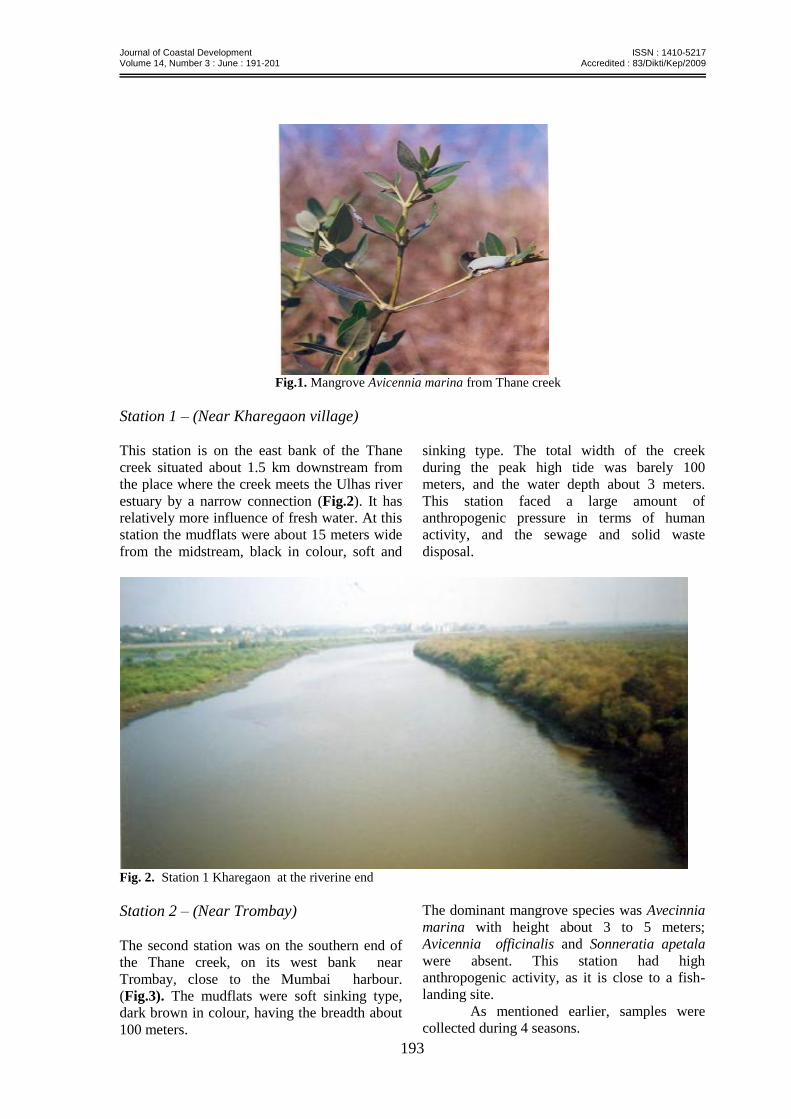
Station 2 – (Near Trombay) The second station was on the southern end of
the Thane creek, on its west bank near
Trombay, close to the Mumbai harbour.
(Fig.3). The mudflats were soft sinking type,
dark brown in colour, having the breadth about
100 meters.
The dominant mangrove species was Avecinnia
marina with height about 3 to 5 meters;
Avicennia officinalis and Sonneratia apetala
were absent. This station had high
anthropogenic activity, as it is close to a fish-
landing site.
As mentioned earlier, samples were
collected during 4 seasons.
Journal of Coastal Development ISSN : 1410-5217 Volume 14, Number 3 : June : 191-201 Accredited : 83/Dikti/Kep/2009
194
Fig. 3 Station2 Trombay at the seaward end
In every season at least 3 samples were
taken at intervals and average value was
considered to represent the season
This aspect was taken for study because a close
scrutiny of literature revealed lack of
information about the changes in the anatomical
structures corresponding with the changes in
the salinity. The present study was focused
mainly on Avicennia marina Photoplate 1:
including two varieties Avicennia marina var.
marina and Avicennia marina var. acutissima
because they occurred at different salinity
environments along the creek. Avicennia
officinalis occurred mainly at the riverine side.
Salinity measurement
The salinity estimations were done by
Argentometric titrations (APHA, 1981).
Along with the leaves water sample was also
collected from these two stations to study the
difference in salinity. Station 1 (one at the
riverine end with low average salinity and
station 2 at the seaward end with high average
salinity. Samples were collected during
different seasons viz. monsoon or rainy season
(June to September), early post monsoon or the
recovery period, when the salinity in the creek
which is lowered in monsoon, recovers
(October - November), late post monsoon or
winter season (December to February) and
premonsoon or summer (March to May).
(Table 1).
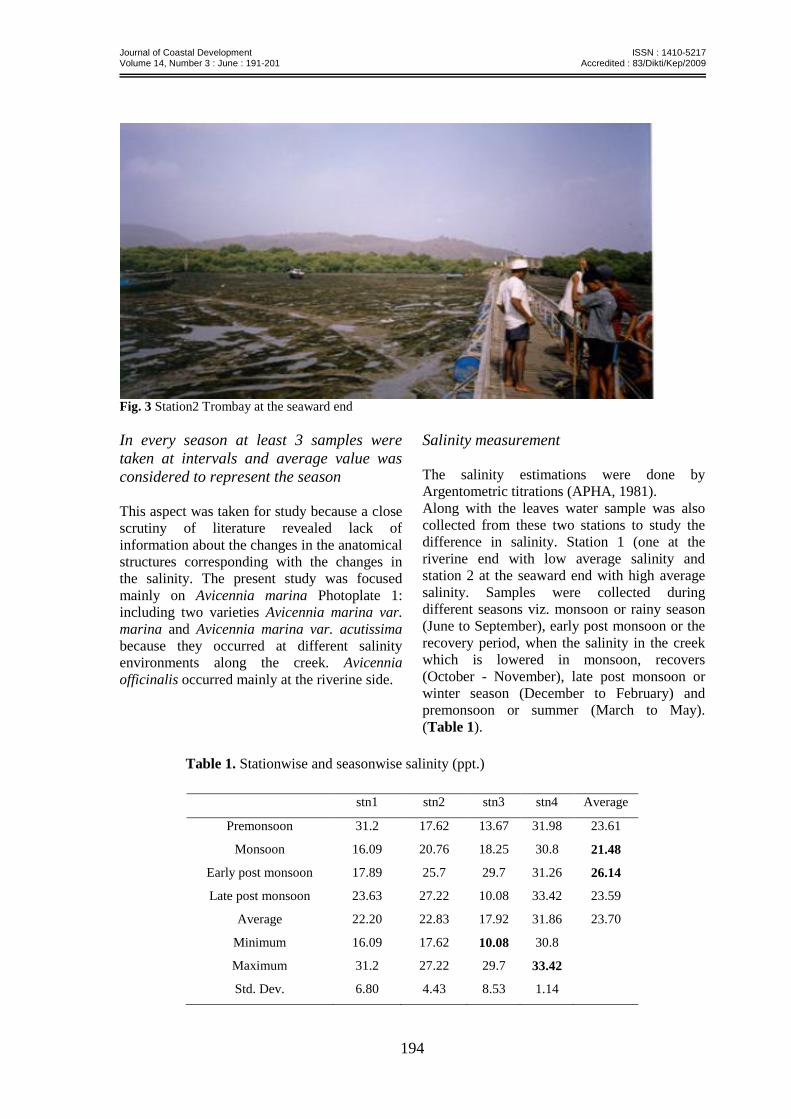
Table 1. Stationwise and seasonwise salinity (ppt.)
stn1 stn2 stn3 stn4 Average
Premonsoon 31.2 17.62 13.67 31.98 23.61
Monsoon 16.09 20.76 18.25 30.8 21.48
Early post monsoon 17.89 25.7 29.7 31.26 26.14
Late post monsoon 23.63 27.22 10.08 33.42 23.59
Average 22.20 22.83 17.92 31.86 23.70
Minimum 16.09 17.62 10.08 30.8
Maximum 31.2 27.22 29.7 33.42
Std. Dev. 6.80 4.43 8.53 1.14
Journal of Coastal Development ISSN : 1410-5217 Volume 14, Number 3 : June : 191-201 Accredited : 83/Dikti/Kep/2009
195
Anatomy Analysis
Leaves, twigs and the roots of Avicennia
marina were collected in every season namely
premonsoon, monsoon, early postmonsoon, late
postmonsoon and from the stations at the
riverine and the seaward end.
The anatomical peculiarities were
studied in suitably stained transverse sections,
using compound microscope. Suitable
transverse sections were taken, stained with
safranin and prepared for microscopic studies.
The tissue organization was studied to detect
the anatomical variations (if any) with season
and station.
Data Analysis
Microphotographs of the sections were taken.
Measurements of the tissue parts were taken
with the help of occulometer and stage
micrometer. Z test was applied to analyse the
significance of difference in the mean values.
The significance of the difference in the
average values was assessed using statistical Z
Test of significance.
RESULTS AND DISCUSSION
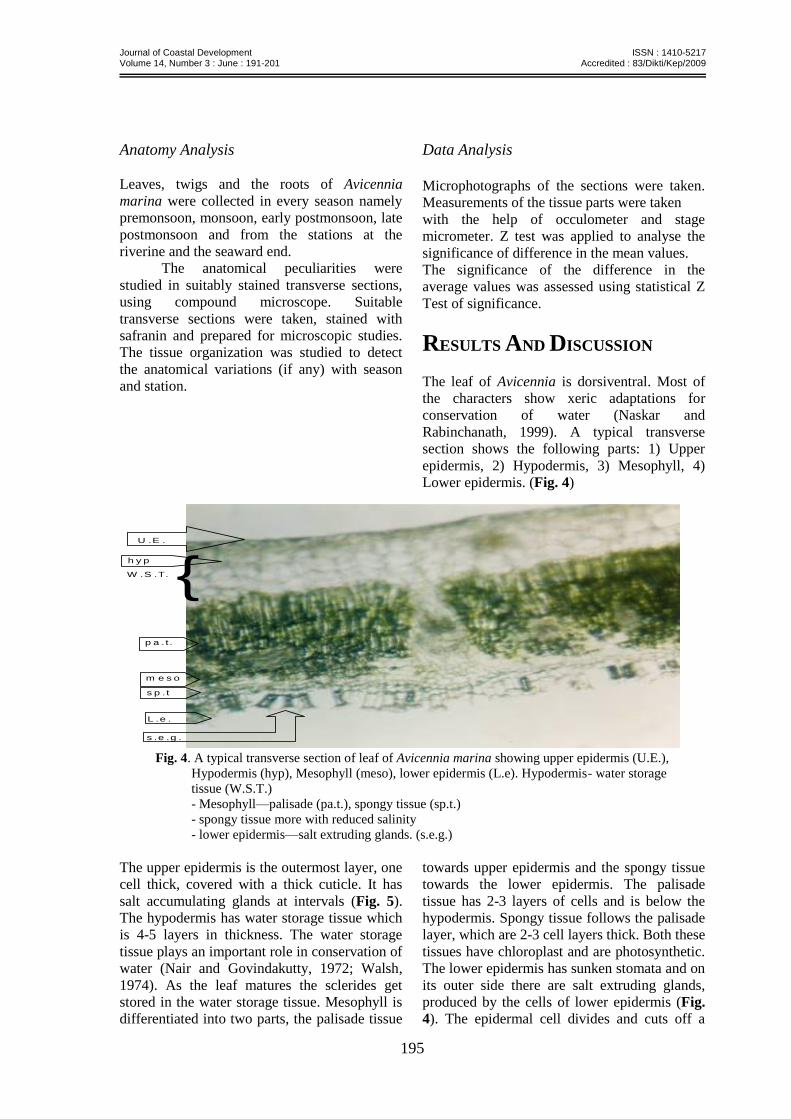
The leaf of Avicennia is dorsiventral. Most of
the characters show xeric adaptations for
conservation of water (Naskar and
Rabinchanath, 1999). A typical transverse
section shows the following parts: 1) Upper
epidermis, 2) Hypodermis, 3) Mesophyll, 4)
Lower epidermis. (Fig. 4)
U .E .
{W .S .T.
h y p
m e s o
L .e .
s .e .g .
s p . t
p a . t .
Fig. 4. A typical transverse section of leaf of Avicennia marina showing upper epidermis (U.E.),
Hypodermis (hyp), Mesophyll (meso), lower epidermis (L.e). Hypodermis- water storage
tissue (W.S.T.)
- Mesophyll—palisade (pa.t.), spongy tissue (sp.t.)
- spongy tissue more with reduced salinity
- lower epidermis—salt extruding glands. (s.e.g.)
The upper epidermis is the outermost layer, one
cell thick, covered with a thick cuticle. It has
salt accumulating glands at intervals (Fig. 5).
The hypodermis has water storage tissue which
is 4-5 layers in thickness. The water storage
tissue plays an important role in conservation of
water (Nair and Govindakutty, 1972; Walsh,
1974). As the leaf matures the sclerides get
stored in the water storage tissue. Mesophyll is
differentiated into two parts, the palisade tissue
towards upper epidermis and the spongy tissue
towards the lower epidermis. The palisade
tissue has 2-3 layers of cells and is below the
hypodermis. Spongy tissue follows the palisade
layer, which are 2-3 cell layers thick. Both these
tissues have chloroplast and are photosynthetic.
The lower epidermis has sunken stomata and on
its outer side there are salt extruding glands,
produced by the cells of lower epidermis (Fig.
4). The epidermal cell divides and cuts off a

Journal of Coastal Development ISSN : 1410-5217 Volume 14, Number 3 : June : 191-201 Accredited : 83/Dikti/Kep/2009
196
basal cell on the outer side, which then forms
the salt extruding gland. This gland is
multicellular, it accumulates and extrudes the
salt (mainly NaCl) to outside. All these leaf
anatomical characteristics showed significant
changes according to stationwise and
seasonwise variations in salinity.
Fig. 5. Upper epidermis covered with a thick cuticle. It has salt accumulating gland at intervals.
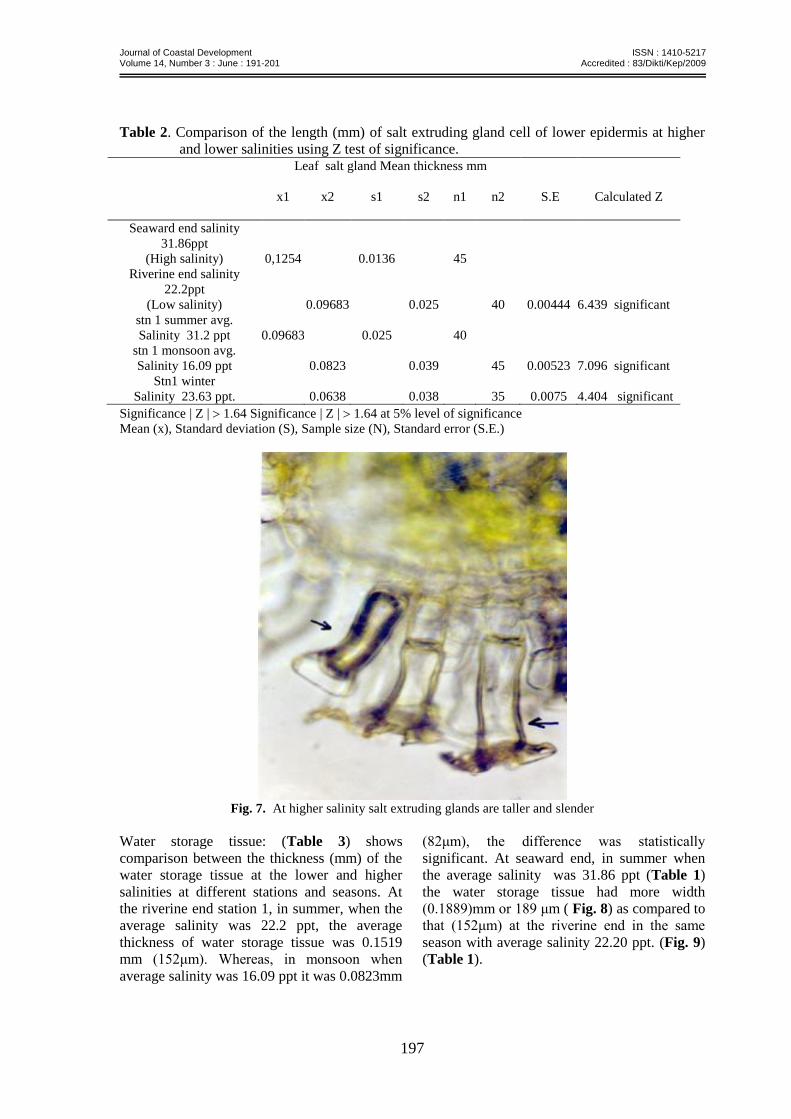
Salt extruding glands of lower epidermis: It was
observed that the length of the salt glands
varied according to the salinity of the
environment. At lower salinity the gland cells
were shorter (Fig. 6) in height where as at the
higher salinity the gland cells were taller. (Fig.
7).In summer season at the riverine end the
average height of the salt gland cell was
0.096mm(96μm), which at the seaward end
with relatively high average salinity was 0.125
mm (125μm), the difference being statistically
significant (Table 2). The change in the tallness
of the salt gland cell was also noticed with the
season. In the monsoon season there was
significant drop in salinity. During this period
the salt gland cells were shorter in height as
compared to summer season. The gland cell
average height in summer (salinity 22.2 ppt;
(Table 1) at riverine end station was 0.096mm
(96μm) which changed to 0.082mm (82 μm) in
monsoon (salinity 16.09 ppt). The above
differences were statistically significant when Z
test was applied.
Fig. 6. At lower salinity salt extruding glands are shorter and broader.
Journal of Coastal Development ISSN : 1410-5217 Volume 14, Number 3 : June : 191-201 Accredited : 83/Dikti/Kep/2009
197
Table 2. Comparison of the length (mm) of salt extruding gland cell of lower epidermis at higher
and lower salinities using Z test of significance. Leaf salt gland Mean thickness mm
x1 x2 s1 s2 n1 n2 S.E Calculated Z
Seaward end salinity
31.86ppt
(High salinity) 0,1254 0.0136 45
Riverine end salinity
22.2ppt
(Low salinity) 0.09683 0.025 40 0.00444 6.439 significant
stn 1 summer avg.
Salinity 31.2 ppt 0.09683 0.025 40
stn 1 monsoon avg.
Salinity 16.09 ppt 0.0823 0.039 45 0.00523 7.096 significant
Stn1 winter
Salinity 23.63 ppt. 0.0638 0.038 35 0.0075 4.404 significant
Significance | Z | 1.64 Significance | Z | 1.64 at 5% level of significance
Mean (x), Standard deviation (S), Sample size (N), Standard error (S.E.)
Fig. 7. At higher salinity salt extruding glands are taller and slender
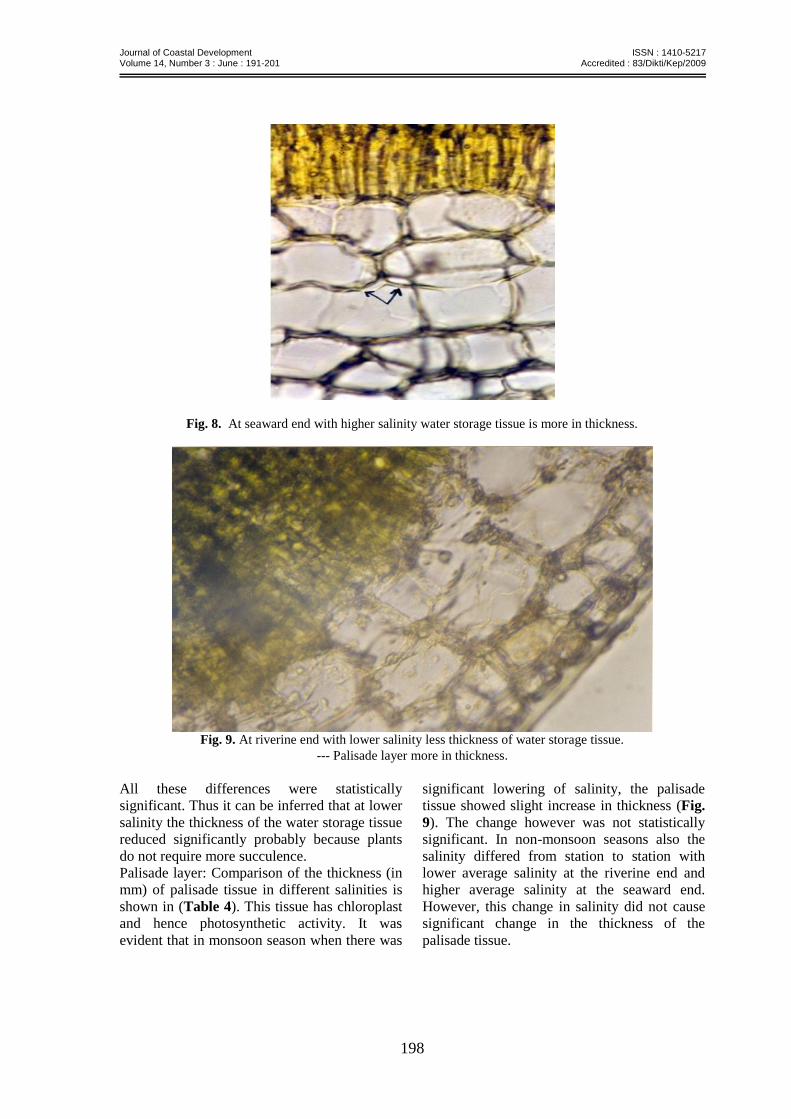
Water storage tissue: (Table 3) shows
comparison between the thickness (mm) of the
water storage tissue at the lower and higher
salinities at different stations and seasons. At
the riverine end station 1, in summer, when the
average salinity was 22.2 ppt, the average
thickness of water storage tissue was 0.1519
mm (152μm). Whereas, in monsoon when
average salinity was 16.09 ppt it was 0.0823mm
(82μm), the difference was statistically
significant. At seaward end, in summer when
the average salinity was 31.86 ppt (Table 1)
the water storage tissue had more width
(0.1889)mm or 189 μm ( Fig. 8) as compared to
that (152μm) at the riverine end in the same
season with average salinity 22.20 ppt. (Fig. 9)
(Table 1).
Journal of Coastal Development ISSN : 1410-5217 Volume 14, Number 3 : June : 191-201 Accredited : 83/Dikti/Kep/2009
198
Fig. 8. At seaward end with higher salinity water storage tissue is more in thickness.
Fig. 9. At riverine end with lower salinity less thickness of water storage tissue.
--- Palisade layer more in thickness.
All these differences were statistically
significant. Thus it can be inferred that at lower
salinity the thickness of the water storage tissue
reduced significantly probably because plants
do not require more succulence.
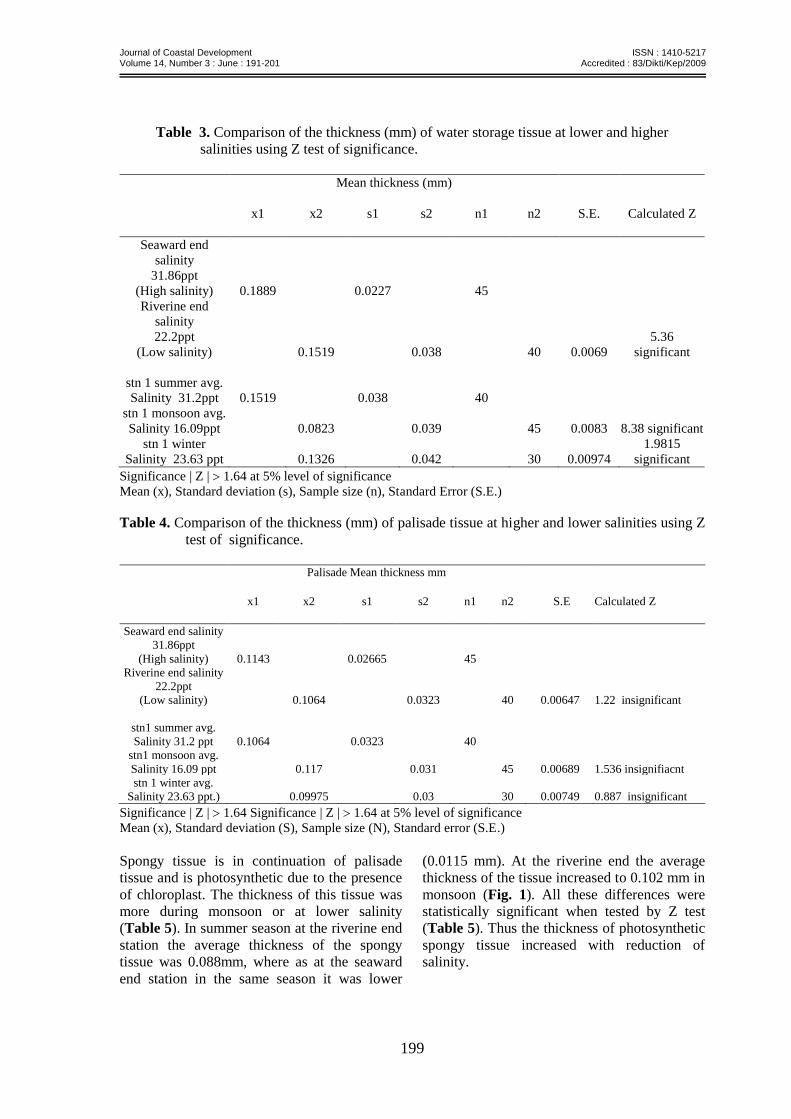
Palisade layer: Comparison of the thickness (in
mm) of palisade tissue in different salinities is
shown in (Table 4). This tissue has chloroplast
and hence photosynthetic activity. It was
evident that in monsoon season when there was
significant lowering of salinity, the palisade
tissue showed slight increase in thickness (Fig.
9). The change however was not statistically
significant. In non-monsoon seasons also the
salinity differed from station to station with
lower average salinity at the riverine end and
higher average salinity at the seaward end.
However, this change in salinity did not cause
significant change in the thickness of the
palisade tissue.
Journal of Coastal Development ISSN : 1410-5217 Volume 14, Number 3 : June : 191-201 Accredited : 83/Dikti/Kep/2009
199
Table 3. Comparison of the thickness (mm) of water storage tissue at lower and higher
salinities using Z test of significance.
Mean thickness (mm)
x1 x2 s1 s2 n1 n2 S.E. Calculated Z
Seaward end
salinity
31.86ppt
(High salinity) 0.1889 0.0227 45
Riverine end
salinity
22.2ppt
(Low salinity) 0.1519 0.038 40 0.0069
5.36
significant
stn 1 summer avg.
Salinity 31.2ppt 0.1519 0.038 40
stn 1 monsoon avg.
Salinity 16.09ppt 0.0823 0.039 45 0.0083 8.38 significant
stn 1 winter
Salinity 23.63 ppt 0.1326 0.042 30 0.00974
1.9815
significant
Significance | Z | 1.64 at 5% level of significance
Mean (x), Standard deviation (s), Sample size (n), Standard Error (S.E.)
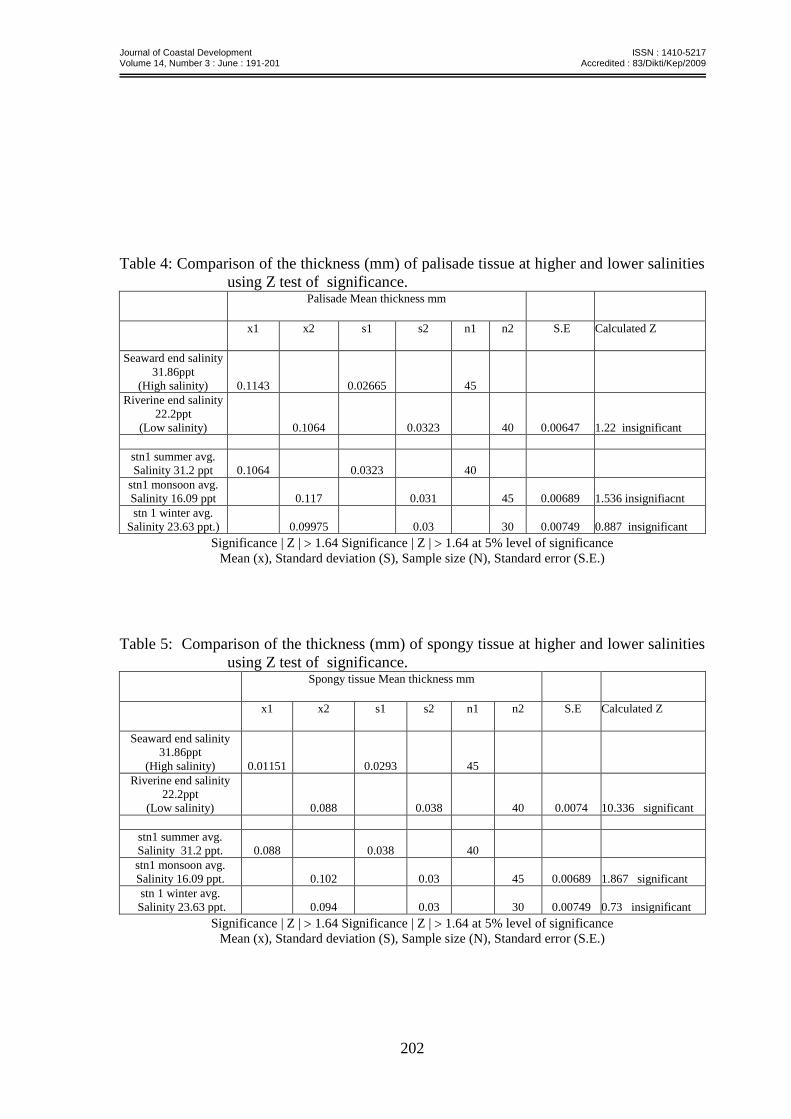
Table 4. Comparison of the thickness (mm) of palisade tissue at higher and lower salinities using Z
test of significance.
Palisade Mean thickness mm
x1 x2 s1 s2 n1 n2 S.E Calculated Z
Seaward end salinity
31.86ppt
(High salinity) 0.1143 0.02665 45
Riverine end salinity
22.2ppt
(Low salinity) 0.1064 0.0323 40 0.00647 1.22 insignificant
stn1 summer avg.
Salinity 31.2 ppt 0.1064 0.0323 40
stn1 monsoon avg.
Salinity 16.09 ppt 0.117 0.031 45 0.00689 1.536 insignifiacnt
stn 1 winter avg.
Salinity 23.63 ppt.) 0.09975 0.03 30 0.00749 0.887 insignificant
Significance | Z | 1.64 Significance | Z | 1.64 at 5% level of significance
Mean (x), Standard deviation (S), Sample size (N), Standard error (S.E.)
Spongy tissue is in continuation of palisade
tissue and is photosynthetic due to the presence
of chloroplast. The thickness of this tissue was
more during monsoon or at lower salinity
(Table 5). In summer season at the riverine end
station the average thickness of the spongy
tissue was 0.088mm, where as at the seaward
end station in the same season it was lower
(0.0115 mm). At the riverine end the average
thickness of the tissue increased to 0.102 mm in
monsoon (Fig. 1). All these differences were
statistically significant when tested by Z test
(Table 5). Thus the thickness of photosynthetic
spongy tissue increased with reduction of
salinity.
Journal of Coastal Development ISSN : 1410-5217 Volume 14, Number 3 : June : 191-201 Accredited : 83/Dikti/Kep/2009
200
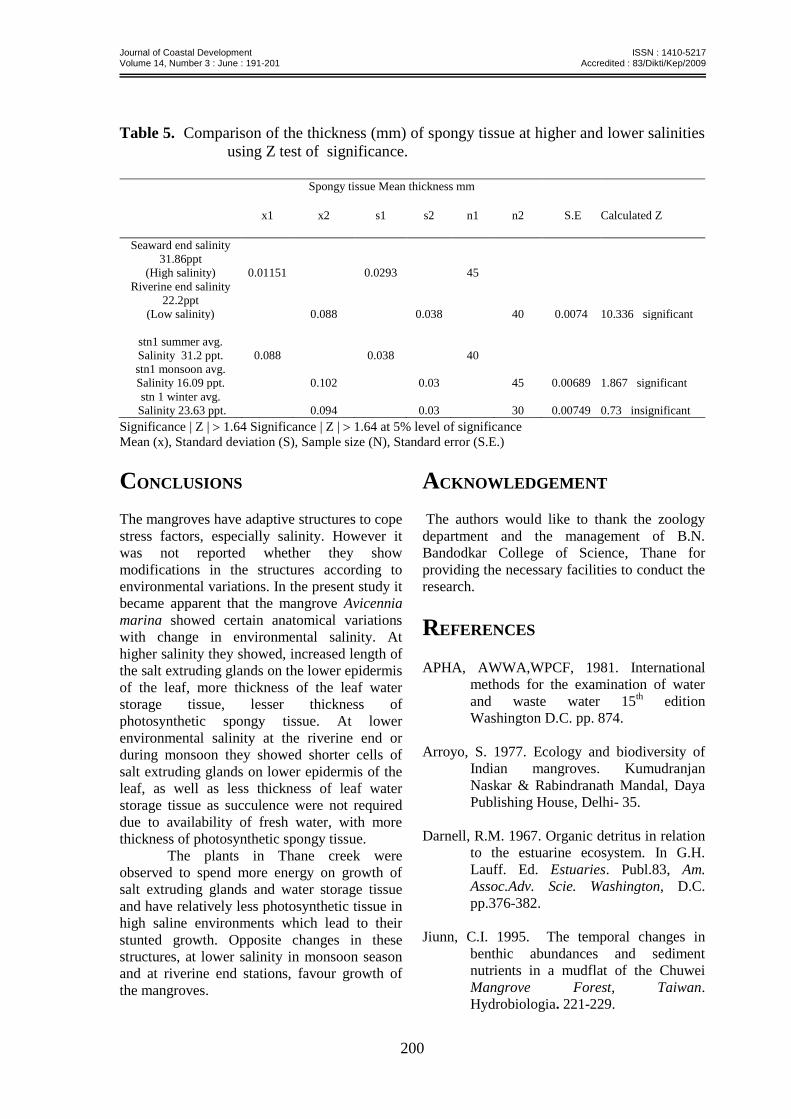
Table 5. Comparison of the thickness (mm) of spongy tissue at higher and lower salinities
using Z test of significance.
Spongy tissue Mean thickness mm
x1 x2 s1 s2 n1 n2 S.E Calculated Z
Seaward end salinity
31.86ppt
(High salinity) 0.01151 0.0293 45
Riverine end salinity
22.2ppt
(Low salinity) 0.088 0.038 40 0.0074 10.336 significant
stn1 summer avg.
Salinity 31.2 ppt. 0.088 0.038 40
stn1 monsoon avg.
Salinity 16.09 ppt. 0.102 0.03 45 0.00689 1.867 significant
stn 1 winter avg.
Salinity 23.63 ppt. 0.094 0.03 30 0.00749 0.73 insignificant
Significance | Z | 1.64 Significance | Z | 1.64 at 5% level of significance
Mean (x), Standard deviation (S), Sample size (N), Standard error (S.E.)
CONCLUSIONS
The mangroves have adaptive structures to cope
stress factors, especially salinity. However it
was not reported whether they show
modifications in the structures according to
environmental variations. In the present study it
became apparent that the mangrove Avicennia
marina showed certain anatomical variations
with change in environmental salinity. At
higher salinity they showed, increased length of
the salt extruding glands on the lower epidermis
of the leaf, more thickness of the leaf water
storage tissue, lesser thickness of
photosynthetic spongy tissue. At lower
environmental salinity at the riverine end or
during monsoon they showed shorter cells of
salt extruding glands on lower epidermis of the
leaf, as well as less thickness of leaf water
storage tissue as succulence were not required
due to availability of fresh water, with more
thickness of photosynthetic spongy tissue.
The plants in Thane creek were
observed to spend more energy on growth of
salt extruding glands and water storage tissue
and have relatively less photosynthetic tissue in
high saline environments which lead to their
stunted growth. Opposite changes in these
structures, at lower salinity in monsoon season
and at riverine end stations, favour growth of
the mangroves.
ACKNOWLEDGEMENT
The authors would like to thank the zoology
department and the management of B.N.
Bandodkar College of Science, Thane for
providing the necessary facilities to conduct the
research.
REFERENCES
APHA, AWWA,WPCF, 1981. International
methods for the examination of water
and waste water 15th edition
Washington D.C. pp. 874.
Arroyo, S. 1977. Ecology and biodiversity of
Indian mangroves. Kumudranjan
Naskar & Rabindranath Mandal, Daya
Publishing House, Delhi- 35.
Darnell, R.M. 1967. Organic detritus in relation
to the estuarine ecosystem. In G.H.
Lauff. Ed. Estuaries. Publ.83, Am.
Assoc.Adv. Scie. Washington, D.C.
pp.376-382.
Jiunn, C.I. 1995. The temporal changes in
benthic abundances and sediment
nutrients in a mudflat of the Chuwei
Mangrove Forest, Taiwan.
Hydrobiologia. 221-229.
Journal of Coastal Development ISSN : 1410-5217 Volume 14, Number 3 : June : 191-201 Accredited : 83/Dikti/Kep/2009
201
Miller, A.W. and R.F. Ambrose. 2000.
Sampling patchy distributions:
comparisons of sampling designs in
rocky intertidal habitats. Marine
Ecology Progress Series 196: 1 – 14.
Nair, N. B. and A.G. Govindakutty. 1972. Proc.
Indian National Sci. Acad. 38 pp. 251-
258.
Naskar, K.M. and Rabindranath. 1999.
Ecology and biodiversity of Indian
mangroves. Kumudranjan Naskar &
Rabindranath Mandal, Daya Publishing
House, Delhi- 35. Pp. 51-74.
Odum,W.E., L.C., McIvor, T.J. Smith. 1982.
The ecology of mangrove of South
Florida: A community profile. Pub.
U.S. Dept of Interior Fish and Wild
Life Service.
Quadros Goldin, V. Mishra, U. Mangal, R.P.
Borkar. 2004. Athalye. Impact of
Construction and Reclamation activities
on the water quality of the Thane
Creek, Central-West Coast of India. J.
Coast. Dev. 7(2): 71 – 78.
Quadros, G., S. Sukumaran, R.P. Athalye.
2009. Impact of changing ecology on
intertidal polychaetes in an
anthropogenically stressed tropical
creek, India. Aquatic. Ecol. 43: 997 –
985.
Rao, A.N. and H. Tan. 1984. Leaf structure and
its ecological significance in certain
mangrove plants. Proc. As. Symp.
Mang. Env. - Res. & Manag. 183-194.
Simenstad. 1983. The ecology of estuarine
channels of the Pacific North West
Coast : a community profile. U.S. Fish
Wildlife, Sev. FWS / OBS- 83/05. 181
pp.
Walsh, G.E. 1974. Ecology of Halophytwes.
(Reimold. R. and Queen, U.S. (Eds)
Academic Press.
Journal of Coastal Development ISSN : 1410-5217 Volume 14, Number 3 : June : 191-201 Accredited : 83/Dikti/Kep/2009
202
Table 4: Comparison of the thickness (mm) of palisade tissue at higher and lower salinities
using Z test of significance. Palisade Mean thickness mm
x1 x2 s1 s2 n1 n2 S.E Calculated Z
Seaward end salinity
31.86ppt
(High salinity) 0.1143 0.02665 45
Riverine end salinity
22.2ppt
(Low salinity) 0.1064 0.0323 40 0.00647 1.22 insignificant
stn1 summer avg.
Salinity 31.2 ppt 0.1064 0.0323 40
stn1 monsoon avg.
Salinity 16.09 ppt 0.117 0.031 45 0.00689 1.536 insignifiacnt
stn 1 winter avg.
Salinity 23.63 ppt.) 0.09975 0.03 30 0.00749 0.887 insignificant
Significance | Z | 1.64 Significance | Z | 1.64 at 5% level of significance
Mean (x), Standard deviation (S), Sample size (N), Standard error (S.E.)
Table 5: Comparison of the thickness (mm) of spongy tissue at higher and lower salinities
using Z test of significance. Spongy tissue Mean thickness mm
x1 x2 s1 s2 n1 n2 S.E Calculated Z
Seaward end salinity
31.86ppt
(High salinity) 0.01151 0.0293 45
Riverine end salinity
22.2ppt
(Low salinity) 0.088 0.038 40 0.0074 10.336 significant
stn1 summer avg.
Salinity 31.2 ppt. 0.088 0.038 40
stn1 monsoon avg.
Salinity 16.09 ppt. 0.102 0.03 45 0.00689 1.867 significant
stn 1 winter avg.
Salinity 23.63 ppt. 0.094 0.03 30 0.00749 0.73 insignificant
Significance | Z | 1.64 Significance | Z | 1.64 at 5% level of significance
Mean (x), Standard deviation (S), Sample size (N), Standard error (S.E.)
Journal of Coastal Development ISSN : 1410-5217 Volume 14, Number 3 : June : 191-201 Accredited : 83/Dikti/Kep/2009
203
Photoplate 1: Mangrove Avicennia marina from Thane creek
Photoplate 2 : Station 1 Kharegaon at the riverine end
Journal of Coastal Development ISSN : 1410-5217 Volume 14, Number 3 : June : 191-201 Accredited : 83/Dikti/Kep/2009
204
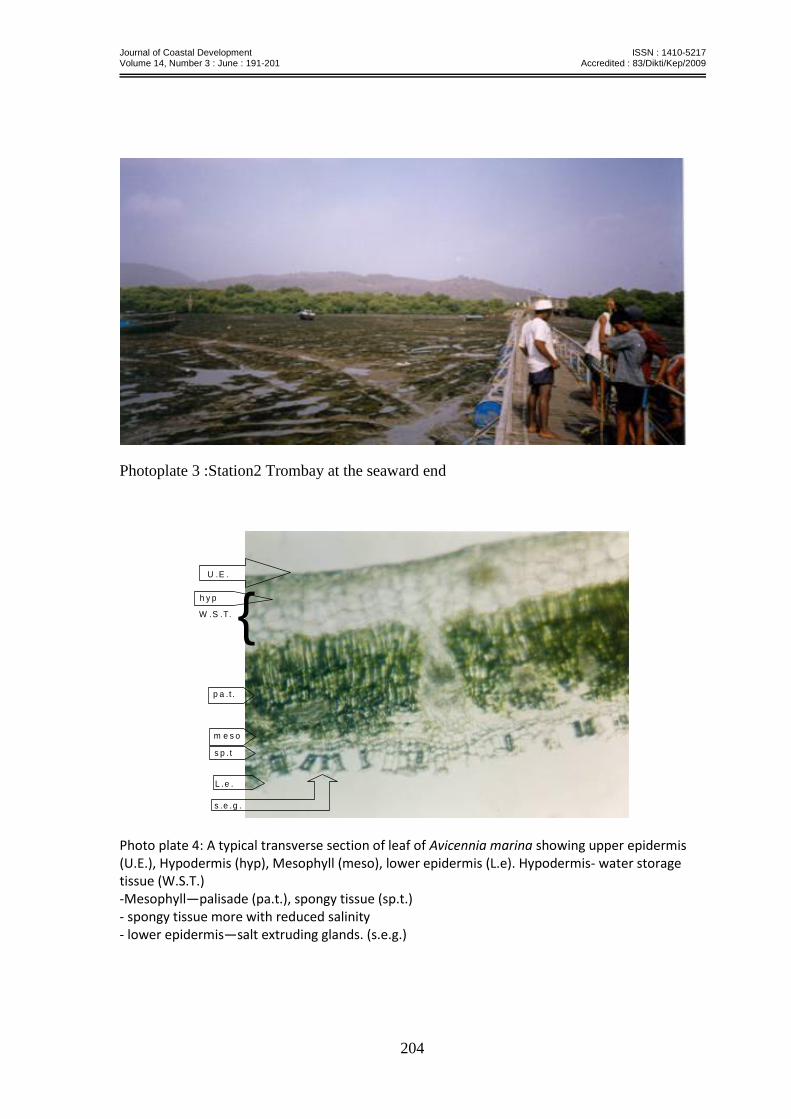
Photoplate 3 :Station2 Trombay at the seaward end
U .E .
{W .S .T.
h y p
m e s o
L .e .
s .e .g .
s p . t
p a . t .
Photo plate 4: A typical transverse section of leaf of Avicennia marina showing upper epidermis (U.E.), Hypodermis (hyp), Mesophyll (meso), lower epidermis (L.e). Hypodermis- water storage tissue (W.S.T.) -Mesophyll—palisade (pa.t.), spongy tissue (sp.t.) - spongy tissue more with reduced salinity - lower epidermis—salt extruding glands. (s.e.g.)
Journal of Coastal Development ISSN : 1410-5217 Volume 14, Number 3 : June : 191-201 Accredited : 83/Dikti/Kep/2009
205
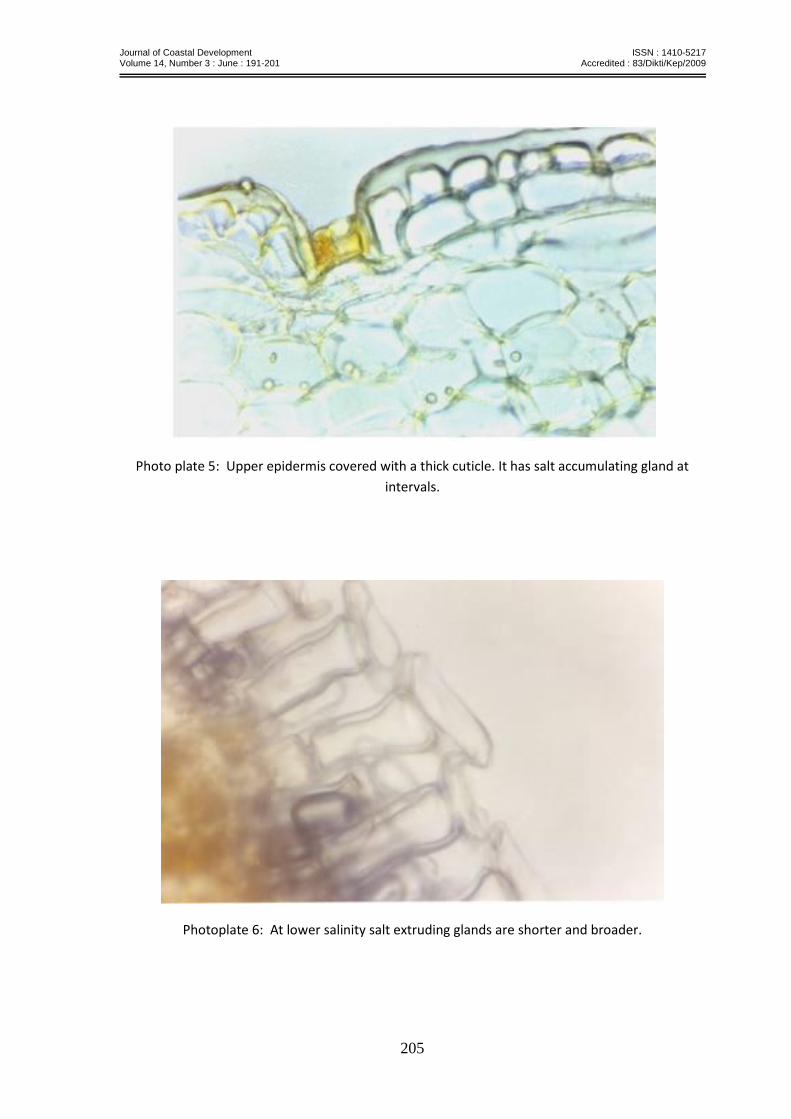
Photo plate 5: Upper epidermis covered with a thick cuticle. It has salt accumulating gland at
intervals.
Photoplate 6: At lower salinity salt extruding glands are shorter and broader.
Journal of Coastal Development ISSN : 1410-5217 Volume 14, Number 3 : June : 191-201 Accredited : 83/Dikti/Kep/2009
206
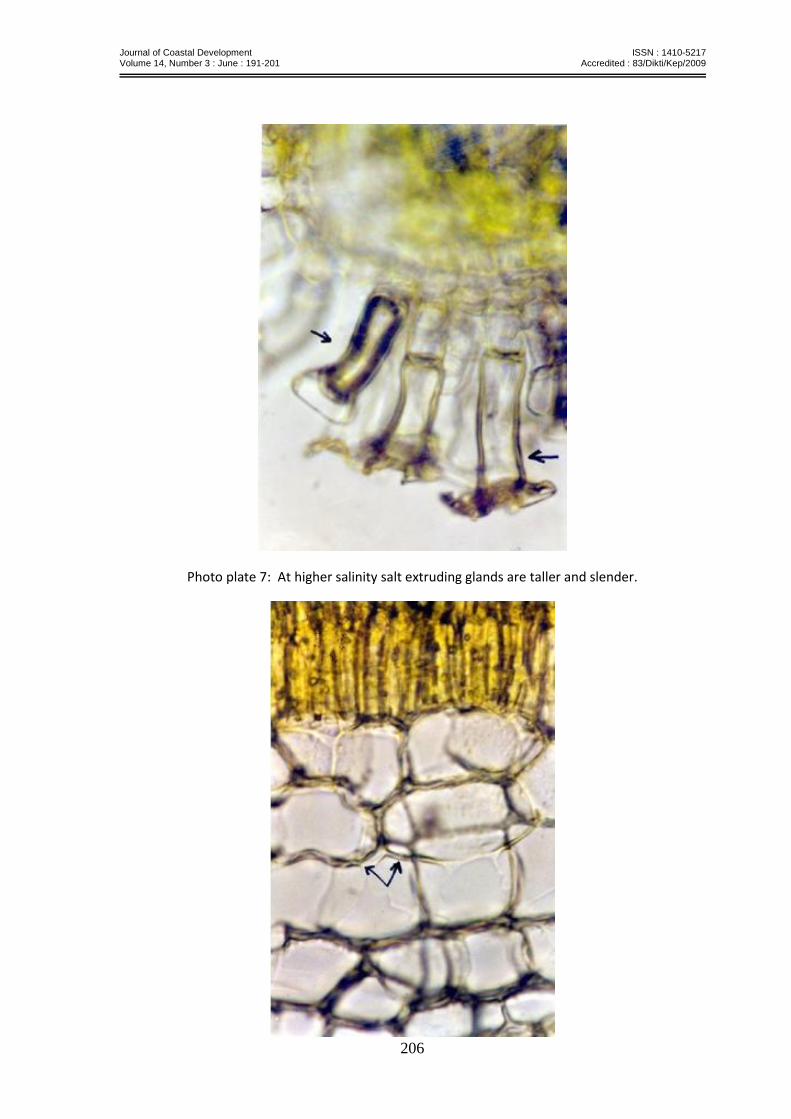
Photo plate 7: At higher salinity salt extruding glands are taller and slender.
Journal of Coastal Development ISSN : 1410-5217 Volume 14, Number 3 : June : 191-201 Accredited : 83/Dikti/Kep/2009
207
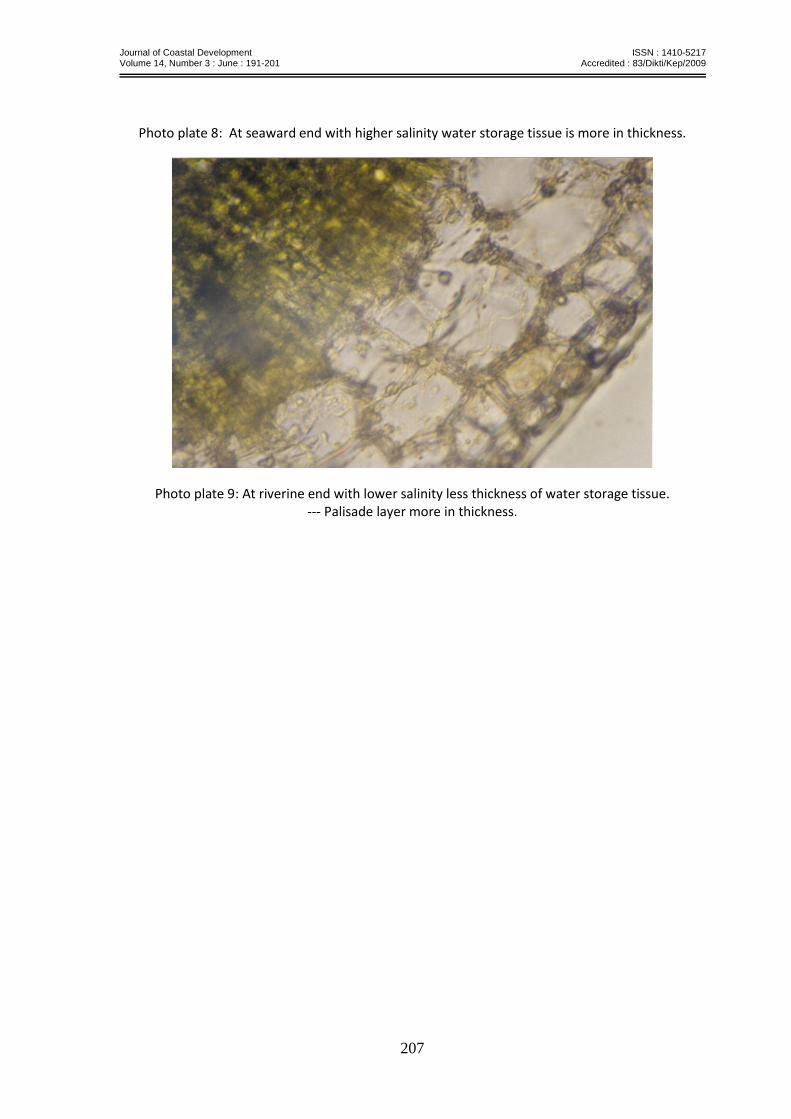
Photo plate 8: At seaward end with higher salinity water storage tissue is more in thickness.
Photo plate 9: At riverine end with lower salinity less thickness of water storage tissue. --- Palisade layer more in thickness.
Journal of Coastal Development ISSN : 1410-5217 Volume 14, Number 3 : June : 191-201 Accredited : 83/Dikti/Kep/2009
208
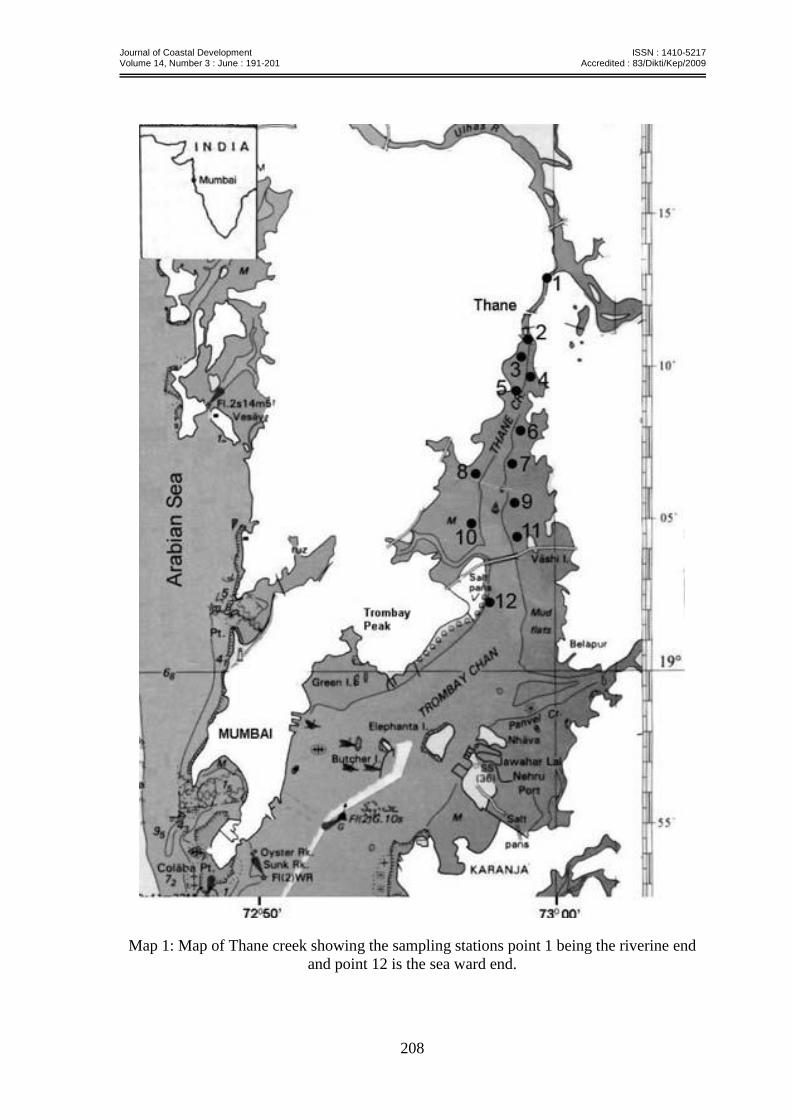
Map 1: Map of Thane creek showing the sampling stations point 1 being the riverine end
and point 12 is the sea ward end.