Salem Partners Aerospace & Defense · growth in global defense budgets. In Q4, defense stocks...
14
Dear Friends, Happy (belated) New Year! We hope everyone had a fantastic holiday with friends and family. To us, the sense of relaxation has quickly become a fading memory as 2016 is off to a very busy start with multiple clients looking for liquidity events and more than a few prospects considering jumping into the market. Our practice set new records last year for both deal volume and value, as we successfully represented five A&D businesses in liquidity events; the first few pages of the review provide detail on a few of our most recent closes. Each of these opportunities served as part of our continuing (with no end in sight) education into the ever-evolving A&D supply-chain and the resultant M&A activity. Our clients encompassed a range of sub-verticals that included a world-class tube & duct manufacturer as well as another transaction in the now familiar world of metal processing. While we were (and are) privileged to represent a number of high-quality companies, an important underpinning of our success has been the continued strength of the broader M&A market as well as steady growth in both the commercial and defense sub-sectors. Our outlook for 2016 is generally positive. We see no near-term negative catalyst or trend that points to a more challenging M&A environment in 2016. That said, the fact that equity market returns for commercial aerospace-focused names were negative in 2016 is a disconcerting data point at this stage of the now 7-year old bull market. At Salem, we need to look no further than the struggling oil & gas industry and the corresponding dramatic decline in M&A valuations to remind ourselves to capitalize on this current, supportive environment. We look forward to 2016 and wish everyone good luck in the new year. We always welcome your thoughts or questions, and would be happy to reach out to discuss these topics or any others that may interest you. Sincerely, Trevor Bohn Ryan Murphy Managing Director Vice President Year-End Review 2015 Introduction Salem Partners – Aerospace & Defense Year-End Review
Transcript of Salem Partners Aerospace & Defense · growth in global defense budgets. In Q4, defense stocks...
Dear Friends,
Happy (belated) New Year!
We hope everyone had a fantastic holiday with friends and family. To us, the sense of
relaxation has quickly become a fading memory as 2016 is off to a very busy start with
multiple clients looking for liquidity events and more than a few prospects considering
jumping into the market.
Our practice set new records last year for both deal volume and value, as we successfully
represented five A&D businesses in liquidity events; the first few pages of the review provide
detail on a few of our most recent closes. Each of these opportunities served as part of our
continuing (with no end in sight) education into the ever-evolving A&D supply-chain and
the resultant M&A activity. Our clients encompassed a range of sub-verticals that included a
world-class tube & duct manufacturer as well as another transaction in the now familiar
world of metal processing.
While we were (and are) privileged to represent a number of high-quality companies, an
important underpinning of our success has been the continued strength of the broader M&A
market as well as steady growth in both the commercial and defense sub-sectors. Our
outlook for 2016 is generally positive. We see no near-term negative catalyst or trend that
points to a more challenging M&A environment in 2016. That said, the fact that equity
market returns for commercial aerospace-focused names were negative in 2016 is a
disconcerting data point at this stage of the now 7-year old bull market. At Salem, we need to
look no further than the struggling oil & gas industry and the corresponding dramatic
decline in M&A valuations to remind ourselves to capitalize on this current, supportive
environment. We look forward to 2016 and wish everyone good luck in the new year.
We always welcome your thoughts or questions, and would be happy to reach out to discuss
these topics or any others that may interest you.
Sincerely,
Trevor Bohn Ryan Murphy
Managing Director Vice President
Year-End Review 2015Introduction
Salem Partners – Aerospace & DefenseYear-End Review

Deal Highlights
Select Salem Partners Aerospace & Defense Transactions in Q4 2015
Vertically integrated
mechanical
assemblies and
energetics
manufacturer
partners with local
private equity group
Southern California-
based metal
finishing services
provider partners
with family office to
pursue growth
opportunities
Private equity-
backed
aerostructures
platform
strategically divests
certain assets and
recapitalizes with
private equity
partner
HIGHLIGHTS
Capco Recapitalized by Capco Growth Partners LLC
Based in Grand Junction, Colorado, Capco is an industry-leading
designer, developer, and manufacturer of highly-engineered
mechanical assemblies and energetic devices. Capco serves as a
prime contractor for key procurement offices from each of the
U.S. Department of Defense’s service branches, while also
serving a commercial customer base of aerospace & defense
OEMs and Tier I suppliers. The recapitalization of Capco by
Capco Growth Partners will allow the company to pursue the
broad scope of addressable opportunities enabled by the Capco’s
unique combination of engineering and manufacturing capability
and expertise, while continuing to deliver superior quality and a
unique value proposition to its customers.
All Metals Recapitalized by Watson Family Investments
Based in Stanton, California, All Metals Processing provides
high-quality metal finishing services to a diverse customer base
of commercial and defense aerospace manufacturers. All Metals
provides a unique combination of metal processing services
including plating, anodizing, and coatings, as well as
complementary services including non-destructive testing and
inspection. The combination of All Metals and Watson Family
Investments will allow AMP to continue to provide industry-
leading quality and rapid turn times to its customers while
growing to meet strong demand from both the commercial and
defense aerospace end markets.
PCA Aerospace Partial Divestiture and Recapitalization
Southern California-based PCA Aerospace is a diversified
aerostructures manufacturing platform with unique capabilities
in the machining and forming of large, complex components
and subassemblies for a variety of commercial and military
applications. Private equity backer Vintage Fund Management
strategically divested certain non-core assets of the platform and
recapitalized the business to provide greater operating efficiency
with the flexibility to pursue multiple attractive growth
opportunities.

Deal Spotlight
Select Salem Partners Advises Steico Industries Inc. in Sale to Senior plc
Senior acquires
premium aerospace
tubing & ducting
asset Steico
Industries
HIGHLIGHTS
Oceanside, CA-based Steico Industries was acquired by UK-
based Senior plc in December for $90 million. The acquisition of
Steico will add meaningful scale and capability to Senior’s
established presence in the tube and duct space, and solidifies
Senior’s position as the premier provider of aerospace tube and
duct components and assemblies for both commercial and
defense platforms.
Salem Partners acted as the exclusive investment banking advisor
to Steico Industries Inc. in its sale to Senior plc.
Gulfstream V
F-35
Sample Customers
Historical Stock Performance
Boeing 777
HA-420
Boeing 737
AW-139
Owner-managed business with 208 employees
State-of-the-art 112,000 sq. ft. vertically
integrated manufacturing facility
LTM Revenue £854.90
LTM EBITDA £123.80
Market Cap £963.40
EBITDA Multiple 9.0x
Commercial Aircraft
37%
Defense Aerospace
31%Business Jet
22%
Commercial Rotorcraft
5%
Other5%
Senior plc is a publicly-traded UK-
based manufacturer of highly-
engineered components and systems
for the aerospace and defense markets
2015e Revenue $37.7mm
2015e EBITDA $7.5mm
Implied EV $90mm
EV/EBITDA 12.0x
£1
£2
£3
Sample Platforms
Market Snapshot
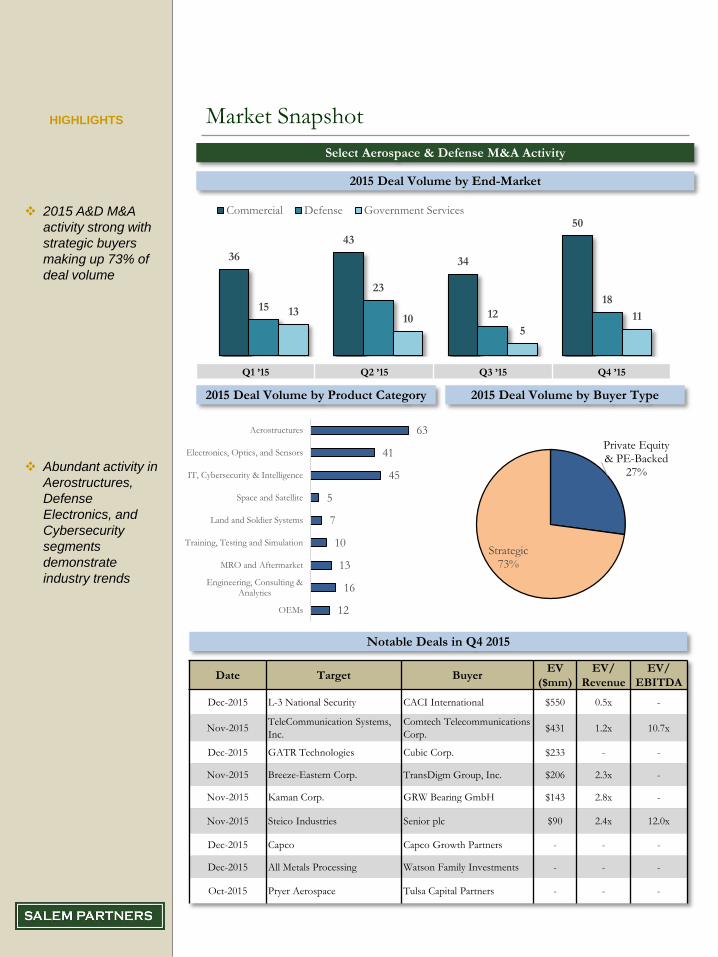
Select Aerospace & Defense M&A Activity
2015 Deal Volume by End-Market
Q1 ’15 Q2 ’15 Q3 ’15 Q4 ’15
2015 A&D M&A
activity strong with
strategic buyers
making up 73% of
deal volume
Abundant activity in
Aerostructures,
Defense
Electronics, and
Cybersecurity
segments
demonstrate
industry trends
HIGHLIGHTS
Notable Deals in Q4 2015
2015 Deal Volume by Product Category 2015 Deal Volume by Buyer Type
Date Target BuyerEV
($mm)
EV/
Revenue
EV/
EBITDA
Dec-2015 L-3 National Security CACI International $550 0.5x -
Nov-2015TeleCommunication Systems,
Inc.
Comtech Telecommunications
Corp.$431 1.2x 10.7x
Dec-2015 GATR Technologies Cubic Corp. $233 - -
Nov-2015 Breeze-Eastern Corp. TransDigm Group, Inc. $206 2.3x -
Nov-2015 Kaman Corp. GRW Bearing GmbH $143 2.8x -
Nov-2015 Steico Industries Senior plc $90 2.4x 12.0x
Dec-2015 Capco Capco Growth Partners - - -
Dec-2015 All Metals Processing Watson Family Investments - - -
Oct-2015 Pryer Aerospace Tulsa Capital Partners - - -
36
43
34
50
15
23
12
1813
105
11
Commercial Defense Government Services
63
41
45
5
7
10
13
16
12
Aerostructures
Electronics, Optics, and Sensors
IT, Cybersecurity & Intelligence
Space and Satellite
Land and Soldier Systems
Training, Testing and Simulation
MRO and Aftermarket
Engineering, Consulting &Analytics
OEMs
Private Equity & PE-Backed
27%
Strategic73%
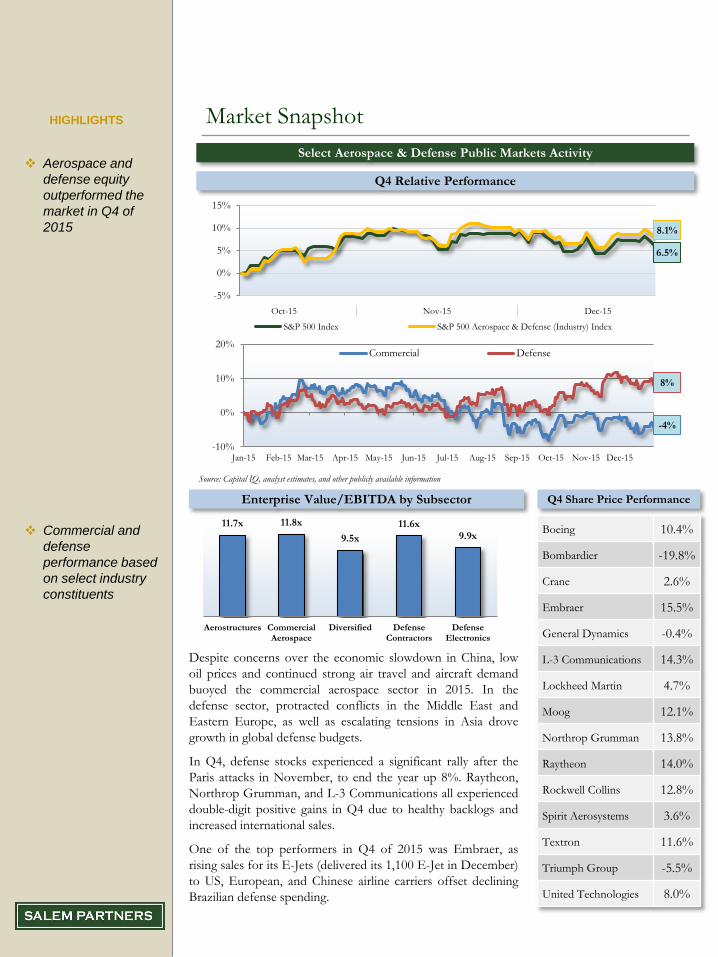
Market Snapshot
Select Aerospace & Defense Public Markets Activity
Source: Capital IQ, analyst estimates, and other publicly available information
Enterprise Value/EBITDA by Subsector Q4 Share Price Performance
Boeing 10.4%
Bombardier -19.8%
Crane 2.6%
Embraer 15.5%
General Dynamics -0.4%
L-3 Communications 14.3%
Lockheed Martin 4.7%
Moog 12.1%
Northrop Grumman 13.8%
Raytheon 14.0%
Rockwell Collins 12.8%
Spirit Aerosystems 3.6%
Textron 11.6%
Triumph Group -5.5%
United Technologies 8.0%
Oct-15 Nov-15 Dec-15
Aerospace and
defense equity
outperformed the
market in Q4 of
2015
Commercial and
defense
performance based
on select industry
constituents
HIGHLIGHTS
Despite concerns over the economic slowdown in China, low
oil prices and continued strong air travel and aircraft demand
buoyed the commercial aerospace sector in 2015. In the
defense sector, protracted conflicts in the Middle East and
Eastern Europe, as well as escalating tensions in Asia drove
growth in global defense budgets.
In Q4, defense stocks experienced a significant rally after the
Paris attacks in November, to end the year up 8%. Raytheon,
Northrop Grumman, and L-3 Communications all experienced
double-digit positive gains in Q4 due to healthy backlogs and
increased international sales.
One of the top performers in Q4 of 2015 was Embraer, as
rising sales for its E-Jets (delivered its 1,100 E-Jet in December)
to US, European, and Chinese airline carriers offset declining
Brazilian defense spending.
1 2
11.7x 11.8x
9.5x
11.6x9.9x
Aerostructures CommercialAerospace
Diversified DefenseContractors
DefenseElectronics
-5%
0%
5%
10%
15%
S&P 500 Index S&P 500 Aerospace & Defense (Industry) Index
8.1%
6.5%
-10%
0%
10%
20%
Jan-15 Feb-15 Mar-15 Apr-15 May-15 Jun-15 Jul-15 Aug-15 Sep-15 Oct-15 Nov-15 Dec-15
Commercial Defense
8%
-4%
Q4 Relative Performance

US Army, Navy, & Airforce
43%
International19%
Civil U.S. Government &
Commercial19%
Other19%
Selected A&D M&A
Buyer Target
Harris Corporation Merges with Exelis
Transaction Overview
Harris acquired Exelis for $4.75 billion to create a top-10 defense supplier. This deal is another
example of consolidation among mid-tier companies in the defense industry after the merger of
Orbital and ATK in 2014.
Deal Rationale
The two companies offer highly complementary products; Harris specializes in communication
equipment including military radios and air traffic control equipment while Exelis’ expertise lies in
surveillance through electronic, sensor, and GPS systems.
In addition to filling capability offerings on both ends of the table, this acquisition will give the
combined entity the scale to more aggressively compete for major defense programs. Exelis will help
bolster Harris’ standing as an IT integrator able to provide end-to-end IT and C4ISR solutions to its
customers, particularly in the federal government, where Exelis has significant experience and
exposure.
Transaction Value $4.75 Billion
Revenue Multiple 1.5x
EBITDA Multiple 9.3x
Revenue $3.25 billion
EBITDA $510 million
Headquarters McLean, VA
Employees 10,000
On February 6,
2015, Harris
Corporation entered
into a definitive
agreement to
acquire Exelis in a
deal valued at $4.75
billion
C4ISR Electronics &
Systems
Information
and Technical
Services
33%67%
Electronic
Warfare Systems
Radar and
Reconnaissance
Systems
Night Vision
Systems
Advanced
Information
Solutions
Civil and
Aerospace Systems
Command,
Control, and
Comm. Systems
Communication
Solutions
Electronic Attack
and Release
Systems
GPS Systems
Exelis Overview
Deals Terms 2014 Revenue by Customer
Products Customers
HIGHLIGHTS

Buyer Target
Lockheed Martin Acquires Sikorsky Aircraft from United Technologies
Lockheed Martin acquired Sikorsky Aircraft Corporation for $9.0 billion from United
Technologies. The deal will enable Lockheed Martin to expand its platform offerings by adding
a helicopter unit in-house to complement their existing fixed-wing platforms.
Deal Rationale
The rationale behind UTC’s divesture of Sikorsky stems from the company’s strategic shift towards
commercial-oriented system providers with higher growth prospects. Sikorsky was unique among
UTC’s other business units as it is a platform provider that requires significantly more R&D investment
compared to UTC’s other units, which are system providers.
Lockheed gains a military technology leader with significant upside to which it could add value through
its expertise in platform integration and government military procurement. In addition to an estimated
$150 million in annual revenue synergies, Sikorsky will enable Lockheed to reduce its exposure to the
F-35 program, which currently makes up about 20% of revenue.
On July 20, 2015,
Lockheed Martin
entered into a
definitive agreement
to acquire Sikorsky
Aircraft, one of the
world’s largest
helicopter
companies, in a
deal valued at for
$9.0 billion
UH-60 CH-53
S-92 SH-3 (S-61)
S-76 S-97
US Government
52%
International48%
Transaction Overview
Sikorsky Aircraft Overview
Deals Terms 2014 Revenue International vs. US
Transaction Value $9.0 Billion
Revenue Multiple 1.2x
EBITDA Multiple 13.0x
Revenue $7.45 billion
EBITDA $692 million
Headquarters Stratford, CT
Employees 18,000
Sample Platforms Customers
HIGHLIGHTS Selected A&D M&A

General Industrial & Other
13%
Power Generation
17%
Aerospace70%
Buyer Target
Lockheed Martin Acquires Sikorsky Aircraft from United Technologies
Berkshire Hathaway acquired Precision Castparts for $37.2 billion in what was Warren Buffet’s
biggest deal ever. Precision Castparts has played a central role in A&D M&A over the last few
years.
Deal Rationale
While this was the biggest deal Berkshire has ever executed at what Warren Buffet called, “a very high
multiple,” Buffet bought the company at a 20% discount of its stock price at the start of 2015. PCC
stock price had been suppressed in 2015 due to the decline in energy prices that has affected its oil and
gas business. However, the company’s power generation business only makes up 17% of its total
revenue while its lucrative aerospace business, which makes up about 70% of revenue is expected to
experience significant growth in the next few years with the ramp up of production for the 737 MAX
and A320neo. Buffet was certainly persuaded by PCC’s significant competitive advantage in the
aerospace industry and strong leadership team headed by Mark Donegan, who has been serving as
CEO since 2002, and has built the Company into the A&D juggernaut it is today.
On August 10,
2015, Berkshire
Hathaway entered
into a definitive
agreement to
acquire Precision
Castparts in a deal
valued at $37.2
billion, the largest
deal in the A&D
history
Investment
Cast
Products
Forged
Products
Airframe
Products
43% 32%25%
Structural
Castings
Airfoil
Castings
IGT
Castings
Forged
Components
Hi-Performance
Alloys
Titanium Alloys
Fasteners
Fastener
Systems
Aerostructures
Transaction Overview
Precision Castparts Overview
Deals Terms 2014 Revenue by Industry
Transaction Value $37.2 Billion
Revenue Multiple 3.7x
EBITDA Multiple 13.9x
Revenue $10.0 billion
EBITDA $2,676 million
Target Headquarters Portland, OR
Employees 31,100
Products Customers
HIGHLIGHTS Selected A&D M&A
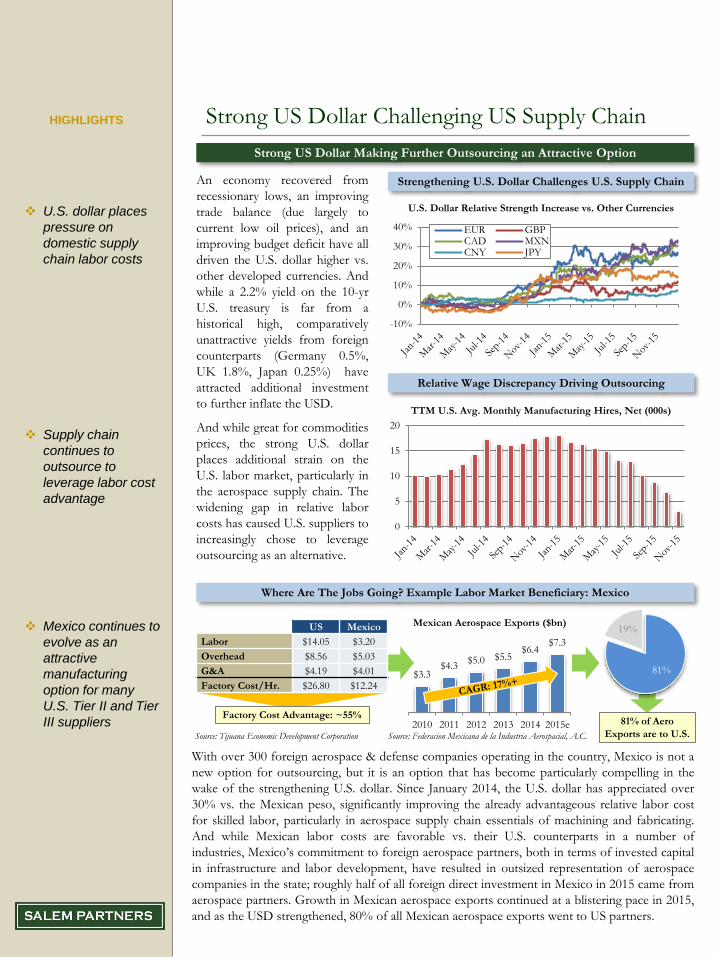
Strong US Dollar Challenging US Supply Chain
Strong US Dollar Making Further Outsourcing an Attractive Option
Strengthening U.S. Dollar Challenges U.S. Supply Chain
U.S. dollar places
pressure on
domestic supply
chain labor costs
Supply chain
continues to
outsource to
leverage labor cost
advantage
Mexico continues to
evolve as an
attractive
manufacturing
option for many
U.S. Tier II and Tier
III suppliers
HIGHLIGHTS
With over 300 foreign aerospace & defense companies operating in the country, Mexico is not a
new option for outsourcing, but it is an option that has become particularly compelling in the
wake of the strengthening U.S. dollar. Since January 2014, the U.S. dollar has appreciated over
30% vs. the Mexican peso, significantly improving the already advantageous relative labor cost
for skilled labor, particularly in aerospace supply chain essentials of machining and fabricating.
And while Mexican labor costs are favorable vs. their U.S. counterparts in a number of
industries, Mexico’s commitment to foreign aerospace partners, both in terms of invested capital
in infrastructure and labor development, have resulted in outsized representation of aerospace
companies in the state; roughly half of all foreign direct investment in Mexico in 2015 came from
aerospace partners. Growth in Mexican aerospace exports continued at a blistering pace in 2015,
and as the USD strengthened, 80% of all Mexican aerospace exports went to US partners.
An economy recovered from
recessionary lows, an improving
trade balance (due largely to
current low oil prices), and an
improving budget deficit have all
driven the U.S. dollar higher vs.
other developed currencies. And
while a 2.2% yield on the 10-yr
U.S. treasury is far from a
historical high, comparatively
unattractive yields from foreign
counterparts (Germany 0.5%,
UK 1.8%, Japan 0.25%) have
attracted additional investment
to further inflate the USD.
And while great for commodities
prices, the strong U.S. dollar
places additional strain on the
U.S. labor market, particularly in
the aerospace supply chain. The
widening gap in relative labor
costs has caused U.S. suppliers to
increasingly chose to leverage
outsourcing as an alternative.
-10%
0%
10%
20%
30%
40% EUR GBPCAD MXNCNY JPY
Relative Wage Discrepancy Driving Outsourcing
U.S. Dollar Relative Strength Increase vs. Other Currencies
TTM U.S. Avg. Monthly Manufacturing Hires, Net (000s)
0
5
10
15
20
Where Are The Jobs Going? Example Labor Market Beneficiary: Mexico
US Mexico
Labor $14.05 $3.20
Overhead $8.56 $5.03
G&A $4.19 $4.01
Factory Cost/Hr. $26.80 $12.24
Factory Cost Advantage: ~55%
$3.3$4.3
$5.0 $5.5$6.4
$7.3
2010 2011 2012 2013 2014 2015e
Mexican Aerospace Exports ($bn)
81%
19%
81% of Aero
Exports are to U.S.Source: Tijuana Economic Development Corporation Source: Federacion Mexicana de la Industria Aerospacial, A.C.

Boeing Outlook
Boeing’s 737 Facing Emerging Markets Pressure and Competition
Boeing 737 Historical Orders vs. Deliveries 2015 marks the first
year since 2009 that
Boeing has
received fewer
orders than
deliveries for the
B737
A320neo now holds
60% of the market
share for next-
generation single-
aisle aircraft
China unveils B737
and A320
competitor
HIGHLIGHTS
Boeing vs. Airbus Single-Aisle Market Share
China finally unveiled its first locally manufactured jet-liner, the C919, in November 2015.
Intended to compete with Airbus’ A320 and Boeing’s 737, COMAC, the state-backed maker of
the C919, expects to deliver the first aircraft in 2018.
A320neo60%
B737MAX40%
0
500
1000
1500
2000 2001 2002 2003 2004 2005 2006 2007 2008 2009 2010 2011 2012 2013 2014 2015
Orders Deliveries
Boeing has long held an advantage in the single-aisle jet market in terms of the number of
single-aisle jets in service. However, Airbus has been steadily chipping away at that advantage
and could soon overtake Boeing as the predominant next-generation single-aisle aircraft
manufacturer. Since it began taking orders in 2010, Airbus has garnered 60% of the orders for
next-generation single-aisle jets, receiving 4,295 firm orders for the A320neo while Boeing has
only received 2,869 for the 737MAX.
Increased Competition from China
B737MAX vs. A320neo Market
share (Cumulative Net Orders
Since Introduction)
Boeing vs. Airbus Single-Aisle Aircraft in Service
In 2015, the market dynamics that contributed to the ballooning of Boeing’s B737 order book
over the last few years might soon be changing. Boeing’s supremacy in single-aisle aircraft is
threatened by the slowing Chinese economy, rising interest rates, and increased competition
from other aircraft manufacturers.
C919 unveiling in Shanghai
Designed by ex-Boeing and Airbus engineers, the C919 is
poised to break the single-aisle aircraft duopoly, but it will
take several years before it can establish the operational
track record and scale to compete with Boeing and Airbus.
Boeing has already announced plans to open a 737
assembly facility in China in order to increase its presence
in China and maintain a leadership position in a market
where 1/3 of all B737 are delivered.
87% 85% 83% 80% 78% 77% 75% 72% 70% 67% 65% 64% 62% 61% 60% 59% 58% 57%
13% 15% 17% 20% 22% 23% 25% 28% 30% 33% 35% 36% 38% 39% 40% 41% 42% 43%
0%
20%
40%
60%
80%
100%
1998
1999
2000
2001
2002
2003
2004
2005
2006
2007
2008
2009
2010
2011
2012
2013
2014
2015
Boeing Airbus Source: AirbusSource: Ascend/WSJ
Source: Boeing
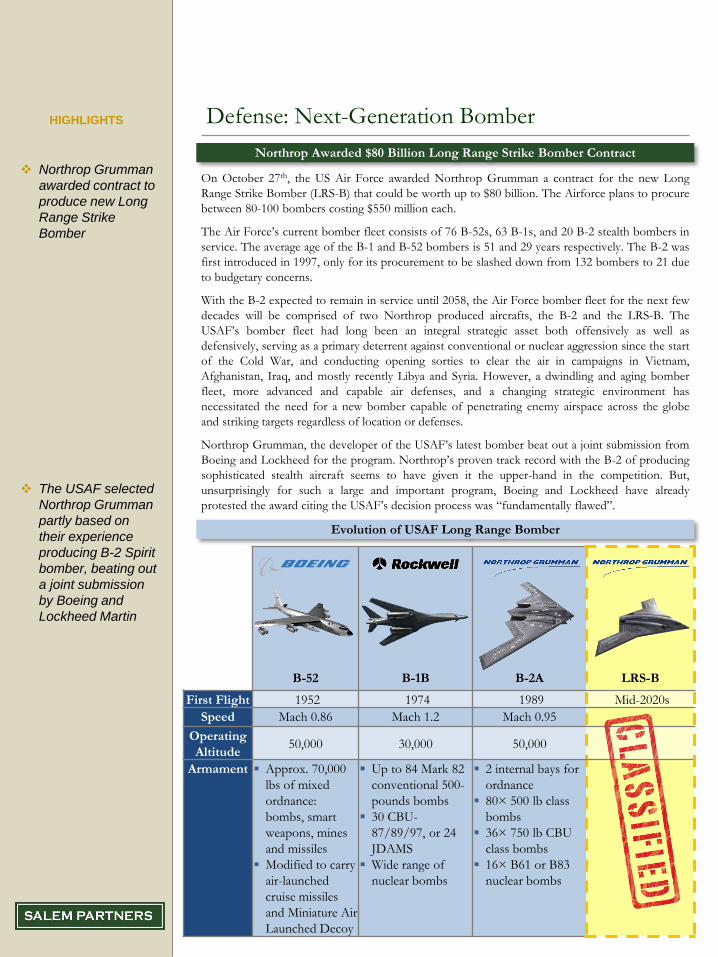
Northrop Grumman
awarded contract to
produce new Long
Range Strike
Bomber
The USAF selected
Northrop Grumman
partly based on
their experience
producing B-2 Spirit
bomber, beating out
a joint submission
by Boeing and
Lockheed Martin
HIGHLIGHTS Defense: Next-Generation Bomber
Northrop Awarded $80 Billion Long Range Strike Bomber Contract
On October 27th, the US Air Force awarded Northrop Grumman a contract for the new Long
Range Strike Bomber (LRS-B) that could be worth up to $80 billion. The Airforce plans to procure
between 80-100 bombers costing $550 million each.
The Air Force’s current bomber fleet consists of 76 B-52s, 63 B-1s, and 20 B-2 stealth bombers in
service. The average age of the B-1 and B-52 bombers is 51 and 29 years respectively. The B-2 was
first introduced in 1997, only for its procurement to be slashed down from 132 bombers to 21 due
to budgetary concerns.
With the B-2 expected to remain in service until 2058, the Air Force bomber fleet for the next few
decades will be comprised of two Northrop produced aircrafts, the B-2 and the LRS-B. The
USAF’s bomber fleet had long been an integral strategic asset both offensively as well as
defensively, serving as a primary deterrent against conventional or nuclear aggression since the start
of the Cold War, and conducting opening sorties to clear the air in campaigns in Vietnam,
Afghanistan, Iraq, and mostly recently Libya and Syria. However, a dwindling and aging bomber
fleet, more advanced and capable air defenses, and a changing strategic environment has
necessitated the need for a new bomber capable of penetrating enemy airspace across the globe
and striking targets regardless of location or defenses.
Northrop Grumman, the developer of the USAF’s latest bomber beat out a joint submission from
Boeing and Lockheed for the program. Northrop’s proven track record with the B-2 of producing
sophisticated stealth aircraft seems to have given it the upper-hand in the competition. But,
unsurprisingly for such a large and important program, Boeing and Lockheed have already
protested the award citing the USAF’s decision process was “fundamentally flawed”.
B-52 B-1B B-2A LRS-B
First Flight 1952 1974 1989 Mid-2020s
Speed Mach 0.86 Mach 1.2 Mach 0.95
Operating
Altitude50,000 30,000 50,000
Armament Approx. 70,000
lbs of mixed
ordnance:
bombs, smart
weapons, mines
and missiles
Modified to carry
air-launched
cruise missiles
and Miniature Air
Launched Decoy
Up to 84 Mark 82
conventional 500-
pounds bombs
30 CBU-
87/89/97, or 24
JDAMS
Wide range of
nuclear bombs
2 internal bays for
ordnance
80× 500 lb class
bombs
36× 750 lb CBU
class bombs
16× B61 or B83
nuclear bombs
Evolution of USAF Long Range Bomber

The Defense
Security
Cooperation
Agency has
processed a record
$46.6 billion foreign
military sales in FY
2015
Conflicts in Eastern
Europe, the Middle
East, and the
Pacific drive the
need for US allied
countries to
replenish their
arsenal and
upgrade their
ground, naval, and
aerial armaments
HIGHLIGHTS Defense: Foreign Military Sales Review
Escalating Global Tensions in Europe, Middle East, and South China Asia Drive FMS
Country Amount(a) Primary Contractors Type
Saudi Arabia
$17.2
billion
The recent heightened tensions in the Middle East as a result of ISIS seizing further territory in
Iraq and the protracted Syrian civil war have signaled the need for rearmament for US-allied
countries in the region. Saudi Arabia, Iraq, UAE, and Turkey have bolstered their aerial, ground,
and C4ISR military capabilities in order to defend their territory as well as support the coalition
effort to thwart ISIS. Additionally, China’s recent territorial claims in the South China Sea have
prompted countries in the region to acquire weaponry from US military contractors. Japan,
South Korea, and Taiwan have all made significant purchases in 2015.
Japan
$7.6
billion
Iraq
$5.3
billion
UAE
$4.2
billion
UK
$3.1
billion
Taiwan
$1.8
billion
Korea
$1.4
billion
a) Foreign Military Sales calculated from October 2014 to December 2015
Helicopter Radar
System
Missile &
Guns
Guided
Missile
Surface-to-
AirSubmarine
Bomb Naval
Vessel
Cargo
Aircraft
Tank Light
Armored
Vehicle
Drone
Source: Defense Security Cooperation Agency

Public Market A&D Valuations
Select Company Trading Levels as of December 31, 2015
Market data as of December 31th, 2015; financial data per most recent filing available as of December 31th, 2015
$US in mm; conversion rate, if applicable, based on historical exchange rate as of most recent filing date
Source: Capital IQ, analyst estimates, and other publicly available information
CompanyMarket
Cap.
Enterprise
ValueRevenue EBITDA
EV/
Revenue
EV/
EBITDA
Debt/
EBITDA
B/E Aerospace Inc. $4,429 $6,297 $2,708 $514 2.33x 12.3x 4.7x
BAE Systems plc $23,323 $26,147 $25,647 $2,493 1.02x 10.5x 2.0x
Boeing Co. $96,873 $96,116 $97,009 $9,914 0.99x 9.7x 1.0x
Bombardier Inc. $2,178 $8,523 $19,115 $858 0.45x 9.9x 7.3x
CAE Inc. $2,979 $3,695 $1,765 $342 2.09x 10.8x 3.0x
Chemring Group plc $540 $759 $547 $54 1.39x 14.0x 2.5x
Cobham plc $4,729 $6,554 $3,249 $556 2.02x 11.8x 4.3x
Dassault Systemes SA $20,297 $18,982 $3,031 $803 6.26x 23.7x 0.6x
Embraer SA $5,613 $7,033 $4,423 $443 1.59x 15.9x 4.4x
Esterline Technologies Corp. $2,398 $3,099 $1,936 $280 1.60x 11.1x 3.2x
Finmeccanica SpA $8,097 $14,704 $16,807 $1,781 0.87x 8.3x 4.2x
General Dynamics Corp. $43,423 $43,464 $32,022 $4,660 1.36x 9.3x 0.9x
GKN plc $7,795 $8,858 $11,060 $1,319 0.80x 6.7x 1.1x
Hexcel Corp. $4,389 $4,942 $1,868 $398 2.65x 12.4x 1.1x
Honeywell International Inc. $79,821 $80,463 $38,865 $7,222 2.07x 11.1x 1.3x
ITT Corporation $3,251 $2,750 $2,479 $405 1.11x 6.8x 0.0x
L-3 Communications Holdings Inc. $9,368 $13,069 $11,531 $1,216 1.13x 10.7x 2.9x
Lockheed Martin Corporation $66,729 $71,841 $45,745 $5,948 1.57x 12.1x 1.0x
Meggitt PLC $4,283 $5,333 $2,561 $562 2.08x 9.5x 1.9x
MTU Aero Engines AG $5,002 $5,944 $4,865 $584 1.22x 10.2x 1.9x
Northrop Grumman Corporation $34,436 $39,671 $23,940 $3,618 1.66x 11.0x 1.6x
Orbital ATK $5,256 $6,739 $3,981 $562 1.69x 12.0x 3.9x
Raytheon Co. $37,496 $40,313 $23,062 $3,290 1.75x 12.3x 1.5x
Rheinmetall AG $2,823 $3,499 $5,641 $442 0.62x 7.9x 3.0x
Rockwell Collins Inc. $12,120 $14,001 $5,244 $1,198 2.67x 11.7x 1.8x
Rolls Royce Holdings plc $15,591 $16,677 $21,791 $2,647 0.77x 6.3x 1.3x
SAAB AB $3,270 $3,587 $2,925 $179 1.23x 20.0x 1.3x
Safran SA $28,657 $30,835 $18,691 $3,454 1.65x 8.9x 1.7x
Smiths Group plc $5,474 $6,694 $4,531 $774 1.48x 8.6x 2.7x
Spirit AeroSystems Holdings, Inc. $6,828 $6,926 $6,609 $1,033 1.05x 6.7x 1.2x
Textron Inc. $11,497 $14,772 $13,511 $1,581 1.09x 9.3x 2.6x
Thales SA $15,628 $15,285 $15,177 $1,553 1.01x 9.8x 1.2x
TransDigm Group Incorporated $12,265 $20,053 $2,707 $1,204 7.41x 16.7x 7.1x
Triumph Group, Inc. $1,960 $3,525 $3,912 $351 0.90x 10.0x 3.5x
Ultra Electronics Holdings plc $2,039 $2,260 $1,108 $183 2.04x 12.4x 1.5x
United Technologies Corp. $85,216 $104,064 $63,978 $11,574 1.63x 9.0x 1.7x
Zodiac Aerospace $6,597 $7,973 $5,524 $440 1.44x 18.1x 3.6x
Average 1.75x 11.3x 2.4x
Median 1.48x 10.7x 1.9x
This presentation has been prepared by Salem Partners LLC (“Salem Partners”) for the exclusive use of the party to whom Salem Partners delivers this presentation
(together with its subsidiaries and affiliates, the “Recipient”) using publicly available information. Salem Partners has not independently verified the information
contained herein, nor does Salem make any representation or warranty, either express or implied, as to the accuracy, completeness or reliability of the information
contained in this presentation, or any other information (whether communicated in written or oral form) transmitted to or made available to the Recipient. Any
estimates or projections as to events that may occur in the future (including projections of revenue, expense, net income and stock performance) are based on
publicly available information as of the date of this presentation. There is no guarantee that any of these estimates or projections will be achieved. Actual results will
vary from the projections and such variations may be material. Nothing contained herein is, or shall be relied upon as, a promise or representation as to the past or
future. Salem Partners expressly disclaims any and all liability relating to or resulting from the use of this presentation.
This presentation has been prepared solely for informational purposes and is not to be construed as a solicitation or an offer to buy or sell any securities or related
financial instruments. The Recipient should not construe the contents of this presentation as legal, tax, accounting or investment advice or a recommendation. The
Recipient is urged to consult its own counsel, tax and financial advisors as to legal and related matters concerning any information described herein. This
presentation does not purport to be all-inclusive or to contain all of the information that the Recipient may require. No investment, divestment or other financial
decisions or actions should be based solely on the information in this presentation. The Recipient should not rely on any information contained herein.
This presentation has been prepared on a confidential basis solely for the use and benefit of the Recipient. The Recipient agrees that the information contained
herein and in all related and ancillary documents is not to be used for any other purpose, that such information is of a confidential nature and that Recipient will
treat it in a confidential manner. Distribution of this presentation to any person other than the Recipient and those persons retained to advise the Recipient who
agree to maintain the confidentiality of this material and be bound by the limitations outlined herein, is unauthorized without the prior consent of Salem Partners.
This material must not be copied, reproduced, distributed or passed to others at any time without the prior written consent of Salem Partners.
Trevor Bohn
Managing Director
(310) 806 – 4218
Ryan Murphy
Vice President
(310) 806 – 4209
Aaron Peltz
Associate
(310) 806 – 4211
11111 Santa Monica Blvd., Suite 2250
Los Angeles, CA 90025
www.salempartners.com
P: (310) 806-4200
F: (310) 806-4201
• M&A Advisory
• Strategic Advisory
• Capital Raising
• Valuation Opinions
• Fairness Opinions
• Consulting
• Expert Testimony
• Litigation Support


![Ike]t - Defense Technical Information Center ROROS (C0etHee1Ofl t f*~vAo afode it naeO*W m Idenh" . by jock number) Air Force Budgets-Air Force Planning. Department of Defense Military](https://static.fdocuments.in/doc/165x107/5b08cff97f8b9a5f6d8d042f/iket-defense-technical-information-roros-c0ethee1ofl-t-fvao-afode-it-naeow.jpg)