SAIPEM: Board announces 2014 preliminary consolidated results
21
SAIPEM: Board announces 2014 preliminary consolidated results San Donato Milanese, February 16, 2015 - Today, the Board of Directors of Saipem S.p.A. reviewed the Saipem Group preliminary consolidated results as at December 31, 2014 (not yet submitted to the Company Statutory Auditors and Independent Auditors), which have been prepared in compliance with the International Financial Reporting Standards (EU approved IFRS). Full Year 2014: • Revenues: €12,873 million, driven by strong contribution from E&C Offshore • Adjusted EBIT 1 : back to profit at €465 million, including a €130 million write off of pending revenues 2 • EBIT: €55 million, impacted by non-cash item of € 410 million in Q4 following impairment test • Adjusted net profit: €180 million • Net profit: -€230 million • Investments: €694 million (€902 million in 2013) • Net debt reduction for the first time since 2011 to €4,424 million (€4,760 million at December 31, 2013), thanks to improvement in working capital and resolution of some pending revenue negotiations • Excellent order intake with new contracts worth €17,971 million (€10,062 million in 2013), in line with strict commercial discipline • Strong backlog of €22,147 million (€17,065 million at December 31, 2013) Q4 2014: • Revenues: €3,398 million • Adjusted EBIT: €22 million • EBIT: -€388 million; • Adjusted net profit: -€32 million • Net profit: -€442 million • New contracts: €2,983 million 1 Adjusted EBIT and Net Profit do not include non-cash net capital invested reduction of €410 million, taken following assessment of useful life and the devaluation of some cash-generating units in light of the deterioration of the oil price scenario. 2 Pending revenues: claims and change orders under negotiation. page 1 of 21
-
Upload
nguyencong -
Category
Documents
-
view
217 -
download
1
Transcript of SAIPEM: Board announces 2014 preliminary consolidated results

SAIPEM: Board announces 2014 preliminary consolidated results San Donato Milanese, February 16, 2015 - Today, the Board of Directors of Saipem S.p.A. reviewed the Saipem Group preliminary consolidated results as at December 31, 2014 (not yet submitted to the Company Statutory Auditors and Independent Auditors), which have been prepared in compliance with the International Financial Reporting Standards (EU approved IFRS). Full Year 2014: • Revenues: €12,873 million, driven by strong contribution from E&C Offshore • Adjusted EBIT1: back to profit at €465 million, including a €130 million write off of
pending revenues2 • EBIT: €55 million, impacted by non-cash item of € 410 million in Q4 following impairment
test • Adjusted net profit: €180 million • Net profit: -€230 million • Investments: €694 million (€902 million in 2013) • Net debt reduction for the first time since 2011 to €4,424 million (€4,760 million at
December 31, 2013), thanks to improvement in working capital and resolution of some pending revenue negotiations
• Excellent order intake with new contracts worth €17,971 million (€10,062 million in 2013), in line with strict commercial discipline
• Strong backlog of €22,147 million (€17,065 million at December 31, 2013) Q4 2014: • Revenues: €3,398 million • Adjusted EBIT: €22 million • EBIT: -€388 million; • Adjusted net profit: -€32 million • Net profit: -€442 million • New contracts: €2,983 million
1 Adjusted EBIT and Net Profit do not include non-cash net capital invested reduction of €410 million, taken following assessment of useful life and the devaluation of some cash-generating units in light of the deterioration of the oil price scenario. 2 Pending revenues: claims and change orders under negotiation.
page 1 of 21

Guidance 2015: • Revenues: between €12 and €13 billion • EBIT: between €500 and €700 million • Net profit: between €200 and €300 million • Investments: approximately ~€650 million • Net debt: <€4 billion3 Umberto Vergine, Saipem CEO commented: “In 2014 we progressed well in delivering the recovery of Saipem’s business and achieved a number of our goals for this year of transition. The business returned to profitability, we delivered a reduction in net debt for the first time in three years and had a year of excellent order intake. Clearly, Saipem is not immune to the oil price drop which occurred in Q4 and to the deterioration of our industry scenario. This led to an impairment on some assets with an impact on our reported results. The business will continue to face industry headwinds as we move through 2015. The tough market environment may affect the timing of resolution of ongoing negotiations on legacy contracts, the scope of existing projects and the timing of future contract awards. Saipem’s strong and diverse backlog has improved our resilience and we still see significant new opportunities to pursue in line with our commercial strategy. Given this backdrop, we believe 2015 will be another challenging year, but we are confident Saipem is well positioned to continue on its path of recovery”.
3 Excluding potential impact of US dollar fluctuation.
page 2 of 21

Financial highlights (million euro)
Q4 2013
Q3 2014
Q4 2014
Q4 2014 vs
Q4 2013 (%)
2013 2014
2014 vs
2013 (%)
3,153 3,509 3,398 7.8 Revenues 11,841 12,873 8.7
349 337 220 (37.0) EBITDA 867 1,212 39.8
171 150 (388) ns Operating profit 157 55 (65.0)
171 150 22 (87.1) Adjusted operating profit 157 465 ns
70 76 (442) ns Net profit (159) (230) 44.7
70 76 (32) ns Adjusted net profit (159) 180 ns
248 263 166 (33.1) Cash flow (Net profit + Depreciation and amortization) 551 927 68.2
222 146 219 (1.4) Investments 902 694 (23.1)
1,998 1,856 2,983 49.3 New contracts 10,062 17,971 78.6
Revenues and associated profit levels, particularly in the Engineering and Construction sector, and, to a lesser extent, in the Drilling sector, are not consistent over time, as they are influenced not only by market performance but also by climatic conditions and individual project schedules. Consequently, the results from any one particular fiscal period can vary significantly, thereby precluding a direct comparison with the same period in other fiscal years or extrapolation of figures from a single quarter to the entire year. Given the uncertain outlook for 2015 determined by the current oil price scenario, the Board of Directors will propose at the Annual Shareholders’ Meeting, due to be convened on April 30, 2015, to maintain the current dividend policy, thereby foregoing the distribution of a dividend for the year 2014. Current market impact The current market scenario has significantly deteriorated as a result of the recent oil price collapse and the slump in investments by oil companies. This has resulted in a general drop in oil service companies’ market capitalisation. Given this context, Saipem carried out an evalution of the assets on its balance sheet and recorded effects amounting to €540 million. These account entirely for the difference between Saipem’s results and the 2014 guidance provided by management in previous announcements. These effects are: - a reduction of net capital invested of €410 million relative to 1 asset and 3 cash-generating units to re-align their value to the expectation of useful life or future margins . This test involved 21 cash-generating units and took into consideration the impairment indicators of all offshore and onshore (both E&C and drilling) vessels. The reduction in capital employed which followed the impairment test affected the Offshore Business Unit (-€250 million) and the Offshore Engineering & Construction Business Unit (-€160 million). Goodwill was not affected; - a reduced estimate of pending revenues to reflect increased rigidity from some clients in the current market environment and ongoing negotiations which, in some cases, are not progressing as anticipated. Consequently, €130 million of pending revenues were written-down from Onshore Engineering & Construction contracts.
page 3 of 21

Capital expenditure in 2014 amounted to €694 million (€902 million in 2013) and included: - €260 million in the Offshore Engineering & Construction sector, relating mainly to the ongoing
development of the new fabrication yard in Brazil and the maintenance and upgrading of the existing asset base;
- €55 million in the Onshore Engineering & Construction sector relating to the purchase of equipment and the maintenance of existing assets;
- €180 million in the Offshore Drilling sector, mainly relating to class reinstatement works for the jack-up Perro Negro 7 and the semi-submersible rig Scarabeo 7, in addition to the maintenance and upgrading of the existing asset base;
- €199 million in the Onshore Drilling sector relating to 2 new rigs in Saudi Arabia, the upgrading of rigs due to operate in Saudi Arabia and South America, and maintenance of the existing asset base.
Net financial debt at December 31, 2014 amounted to €4,424 million, a reduction of €336 million compared to December 31, 2013. This is the first reduction in net debt over the past three years. Operational cash flow generated during the year more than offset investments. Working capital improved in the fourth quarter, mainly due to the positive conclusion of some negotiations with clients and credit recovery. With regards to accounts receivables, while Venezuela remains a critical area some progress was made in the first weeks of 2015. New contracts and backlog During Q4 2014, Saipem was awarded contracts amounting to €2,983 million (€1,998 million in Q4 2013). Backlog at December 31, 2014 stood at €22,147 million (€11,161 million in the Offshore Engineering & Construction sector, €6,703 million in the Onshore Engineering & Construction sector, and €4,283 million in the Drilling sectors), of which €9,035 million is due to be executed in 2015. Backlog includes the South Stream contract, currently suspended at least until 19 February 2015 as recently indicated by the client. In the first weeks of 2015, Saipem was awarded a new Engineering & Construction contract for the Kashagan field project, located in the Kazakh waters of the Caspian Sea, valued at approximately $1.8 billion. The North Caspian Operating Company (NCOC) has awarded Saipem a contract for the construction of two 95 kilometre pipelines, which will connect D island in the Caspian Sea to the Karabatan onshore plant in Kazakhstan. The scope of work includes the engineering, the welding materials, the conversion and the preparation of vessels, the dredging, the installation, the burial and the pre-commissioning of the two pipelines. The construction will be completed by end of 2016.
page 4 of 21

Operational update 2014 was a year of transition for Saipem during which management focused on the execution of legacy contracts and on rebuilding the profitability of the business by improving performance and acquiring new contracts in line with a strict commercial strategy. These goals have been achieved in a deteriorating market environment, which impacted oil companies’ investment plans from the second half of the year. This has also resulted in the increased rigidity of client attitudes towards negotiations. Saipem has returned to profitability delivering an adjusted EBIT of €465 million compared to a loss of €884 million in 2013. Progress was made in de-risking legacy contracts with pending revenues amounting to €1.1 billion at the end of 2014. The reduction of pending revenues achieved during Q4 has been driven partially by the positive outcome of certain negotiations with clients (amounting to about €200 million) while the increased rigidity of client attitudes resulted in a write-off of €130 million of pending revenues in the E&C onshore business. E&C offshore EBIT contribution was €435 million showing a significant improvement from €91 million last year. E&C onshore is still reporting negative EBIT of €411 million, following the impact of a €130 million write off of pending revenues and further deterioration of some legacy contracts in Q4. This was mainly due to unexpected extra costs incurred during the final commissioning and testing phases of some projects, and to the poor performance of one sub-contractor. This issue has now been resolved. Additionally, the limited contribution from new projects in their initial phase was unable to offset structural costs. Drilling EBIT contribution was positive at €441 million, a slight decrease compared to 2013, despite the deterioration of the oil price environment in the second half of the year. Management outlook for 2015 Given the current oil price scenario, 2015 will carry a number of uncertainties. While Saipem is continuing to progress in its business recovery, the timing may be longer than expected. The sharp slowdown in investments announced by oil companies is likely to have an impact on negotiations of new contract acquisitions, both in terms of timing and daily rates, and may affect the attitude of Saipem’s clients towards negotiating operational and commercial issues related to
4 Data were restated following the coming into force of new accounting principles IFRS 10 and IFRS 11.
page 5 of 21

ongoing projects. In particular, in 2015 Saipem will still have to execute €1.8 billion of legacy contracts. Looking at the uncertainties for 2015, a significant part of Saipem’s revenues and margins will depend on the outcome of the South Stream project, currently under suspension. However, the solid and diversified backlog acquired during 2014, further strengthened by the recent acquisition of the Kashagan contract, makes Saipem more resilient to the current environment. In 2015 Saipem is also targeting some important new business opportunities that fit our technical capabilities while maintaining strict commercial discipline. The above factors and uncertainties are reflected in the range estimates of the 2015 guidance. For 2015, Saipem expects revenues of between €12 and €13 billion. This range mainly reflects the uncertainties connected to the South Stream contract while we wait for clear indications from the client on the future of the project. EBIT is expected to be in a range between €500 and €700 million and Net income is expected between €200 and €300 million. Capex is expected at around €650 million, slightly below previous long term guidance adopting measures to improve efficiency and contribute to net debt reduction. Finally, Saipem targets net debt below €4 billion, excluding the impact of currency fluctuations.
page 6 of 21

*** This press release should be read jointly with the condensed interim consolidated financial statements at June 30, 2014 and the statutory and consolidated financial statements at December 31, 2013 of Saipem S.p.A., which are already available on the Company’s website (www.saipem.com) under the section “Investor Relations – Financial Statements.” *** Saipem’s Chief Financial Officer and Compliance Officer, Mr Alberto Chiarini, in his capacity as manager responsible for the preparation of the Company’s financial reports, certifies, pursuant to art. 154-bis paragraph 2 of Legislative Decree no. 58/1998, that accounting data corresponds to the Company’s documents and accounting books and entries. By their nature, “forward-looking statements” are subject to risk and uncertainty since they are dependent upon circumstances which should or are considered likely to occur in the future and are outside of the Company’s control. These include, but are not limited to: monetary exchange and interest rate fluctuations, commodity price volatility, credit and liquidity risks, HSE risks, the levels of capital expenditure in the oil and gas industry and other sectors, political instability in areas where the Group operates, actions by competitors, success of commercial transactions, risks associated with the execution of projects (including ongoing investment projects), in addition to changes in stakeholders’ expectations and other changes affecting business conditions. Actual results could therefore differ materially from the forward-looking statements. The Financial Reports contain in-depth analyses of some of the aforementioned risks. Forward-looking statements are to be considered in the context of the date of their release.
page 7 of 21

Conference call and webcast A conference call and webcast will be hosted by CEO Umberto Vergine today at 5.30pm CET (4.30pm GMT, 11.30pm EST, 8.30am PST). It can be followed on Saipem’s website www.saipem.com by clicking on the webcast banner on the home page, or through the following URL: http://edge.media-server.com/m/p/ordrpa2a. During the conference call and webcast, a presentation shall be given, which will be available for download from the webcast window and from the ‘Investor Relations / Presentations’ section on the www.saipem.com website, around 15 minutes before the scheduled start time. This presentation will be also available for download from the authorised storage mechanism 1Info (www.1info.it) and Borsa Italiana S.p.A (www.borsaitaliana.it). Saipem operates in the Engineering & Construction and Drilling businesses, with a strong bias towards oil & gas-related activities in remote areas and deep-waters. Saipem is a leader in the provision of engineering, procurement, project management and construction services with distinctive capabilities in the design and execution of large-scale offshore and onshore projects, and technological competences such as gas monetization and heavy oil exploitation. Website: www.saipem.com Switchboard: +39-025201 Shareholder Information Saipem S.p.A., Via Martiri di Cefalonia, 67 - 20097 San Donato Milanese (MI), Italy Institutional relations and communication: Tel.: +39-02520.34088 E-mail: [email protected] Relations with institutional investors and financial analysts: Tel.: +39-02520.34653 Fax: +39-02520.54295 E-mail: [email protected] Media relations: iCorporate Tel.: +39 02 4678752 Cell.: +39 366 9134595 E-mail: [email protected] RLM Finsbury Tel.:+44 (0)20 7251 3801 [email protected]
page 8 of 21

Analysis by business sector: adjusted data are commented below Engineering & Construction: Offshore
(million euro)
Q4 2013
Q3 2014
Q4 2014
Q4 2014 vs
Q4 2013 (%)
2013 2014
2014 vs
2013 (%)
1,366 2,022 1,996 46.1 Revenues 5,146 7,202 40.0
(1,193) (1,834) (1,779) 49.1 Expenses (4,772) (6,470) 35.6
(73) (75) (235) ns Depreciation and amortization (283) (457) 61.5
100 113 (18) ns Operating profit 91 275 ns
– – 160 ns Assets devaluation – 160 ns
100 113 142 42.0 Adjusted operating profit 91 435 ns
12.7 9.3 10.9 EBITDA adjusted % 7.3 10.2 7.3 5.6 7.1 EBIT adjusted % 1.8 6.0
855 1,056 749 New contracts 5,581 10,043
The backlog at December 31, 2014 stood at €11,161 million, of which €5,255 million is due to be executed in 2015. Revenues for 2014 amounted to €7,202 million, representing a 40% increase compared to 2013,
mainly due to greater levels of activity in Central and South America and in West Africa.
Adjusted operating profit for 2014 amounted to €435 million, equal to 6% of revenues, compared to €91 million in 2013. The EBITDA margin stood at 10.2% compared to the 7.3% margin recorded in 2013.
Operating profit for 2014 amounted to €275 million, on account of the devaluation of assets
which amounted to €160 million. Pursuant to accounting standards IFRS 10 and 11, the deconsolidation of joint ventures at
December 31, 2014, has a negative impact of €225 million on revenues and a negative impact of €16 million on operating profit, deriving mainly from operations in Angola (negative impact of €110 million on revenues and a positive impact of €16 million on operating profit in 2013).
page 9 of 21
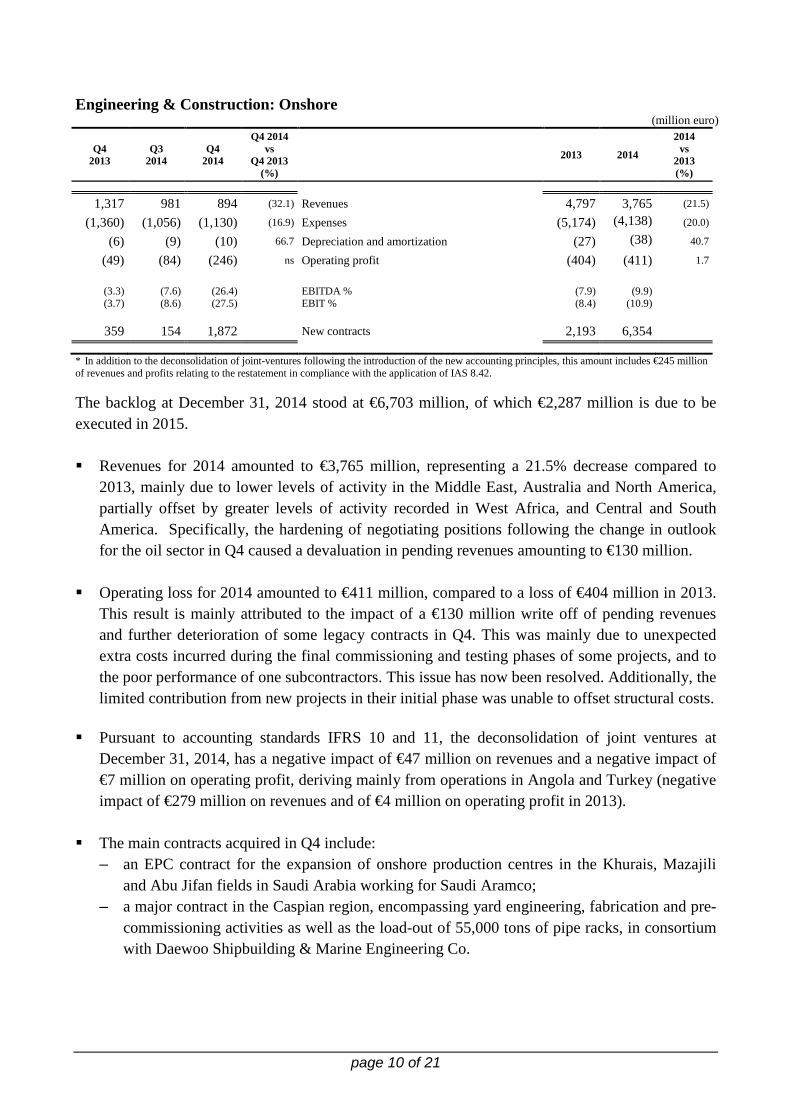
Engineering & Construction: Onshore
(million euro)
Q4 2013
Q3 2014
Q4 2014
Q4 2014 vs
Q4 2013 (%)
2013 2014
2014 vs
2013 (%)
1,317 981 894 (32.1) Revenues 4,797 3,765 (21.5)
(1,360) (1,056) (1,130) (16.9) Expenses (5,174) (4,138) (20.0)
(6) (9) (10) 66.7 Depreciation and amortization (27) (38) 40.7
(49) (84) (246) ns Operating profit (404) (411) 1.7
(3.3) (7.6) (26.4) EBITDA % (7.9) (9.9) (3.7) (8.6) (27.5) EBIT % (8.4) (10.9)
359 154 1,872 New contracts 2,193 6,354
* In addition to the deconsolidation of joint-ventures following the introduction of the new accounting principles, this amount includes €245 million of revenues and profits relating to the restatement in compliance with the application of IAS 8.42.
The backlog at December 31, 2014 stood at €6,703 million, of which €2,287 million is due to be executed in 2015. Revenues for 2014 amounted to €3,765 million, representing a 21.5% decrease compared to
2013, mainly due to lower levels of activity in the Middle East, Australia and North America, partially offset by greater levels of activity recorded in West Africa, and Central and South America. Specifically, the hardening of negotiating positions following the change in outlook for the oil sector in Q4 caused a devaluation in pending revenues amounting to €130 million.
Operating loss for 2014 amounted to €411 million, compared to a loss of €404 million in 2013. This result is mainly attributed to the impact of a €130 million write off of pending revenues and further deterioration of some legacy contracts in Q4. This was mainly due to unexpected extra costs incurred during the final commissioning and testing phases of some projects, and to the poor performance of one subcontractors. This issue has now been resolved. Additionally, the limited contribution from new projects in their initial phase was unable to offset structural costs.
Pursuant to accounting standards IFRS 10 and 11, the deconsolidation of joint ventures at
December 31, 2014, has a negative impact of €47 million on revenues and a negative impact of €7 million on operating profit, deriving mainly from operations in Angola and Turkey (negative impact of €279 million on revenues and of €4 million on operating profit in 2013).
The main contracts acquired in Q4 include:
– an EPC contract for the expansion of onshore production centres in the Khurais, Mazajili and Abu Jifan fields in Saudi Arabia working for Saudi Aramco;
– a major contract in the Caspian region, encompassing yard engineering, fabrication and pre-commissioning activities as well as the load-out of 55,000 tons of pipe racks, in consortium with Daewoo Shipbuilding & Marine Engineering Co.
page 10 of 21

Drilling: Offshore (million euro)
Q4 2013
Q3 2014
Q4 2014
Q4 2014 vs
Q4 2013 (%)
2013 2014
2014 vs
2013 (%)
285 322 314 10.2 Revenues 1,177 1,192 1.3
(126) (160) (142) 12.7 Expenses (539) (580) 7.6
(64) (66) (323) ns Depreciation and amortization (259) (512) 97.7
95 96 (151) ns Operating profit 379 100 ns
– – 250 ns Assets devaluation – 250 ns
95 96 99 4.2 Adjusted operating profit 379 350 (7.7)
55.8 50.3 54.8 EBITDA adjusted % 54.2 51.3 33.3 29.8 31.5 EBIT adjusted % 32.2 29.4
381 402 178 New contracts 1,401 722
The backlog at December 31, 2014 stood at €2,920 million, of which €941 million is due to be executed in 2015. Revenues for 2014 amounted to €1,192 million, representing a 1.3% increase compared to
2013, mainly attributable to the increased operations of the semi-submersible rigs Scarabeo 5 and Scarabeo 6, which had been undergoing upgrading works in 2013. This partially offset reduced operations of the semi-submersible rig Scarabeo 7, which underwent upgrading works for approximately 6 months in 2014.
Adjusted operating profit for 2014 amounted to €350 million compared to €379 million in 2013, with the margin on revenues decreasing from 32.2% to 29.4%. The EBITDA margin stood at 51.3%, an almost 3% decrease on the 54.2% achieved in 2013, due to reduced operations by the semi-submersible rig Scarabeo 7.
Operating profit for 2014 amounted to € 100 million, as it was affected by the devaluation of
assets amounting to €250 million.
The main contract acquired in Q4 was the lease of the jack-up Perro Negro 7 for Saudi Aramco.
page 11 of 21

Vessel utilisation in 2014 and the impact of programmed maintenance for 2015 are as
follows:
Year 2014 Year 2015 Vessel Under contract Idle Idle (days) (days) Semi-submersible rig Scarabeo 3 364 1 (b) 168 (a+c) Semi-submersible rig Scarabeo 4 365 – 123 (a) Semi-submersible rig Scarabeo 5 342 23 (b) – Semi-submersible rig Scarabeo 6 362 3 (b) 47 (a) Semi-submersible rig Scarabeo 7 182 183 (a) – Semi-submersible rig Scarabeo 8 359 6 (b) 20 (a) Semi-submersible rig Scarabeo 9 341 24 (a+b) – Drillship Saipem 10000 365 – 122 (a) Drillship Saipem 12000 363 2 (b) 92 (a) Jack-up Perro Negro 2 359 6 (b) 75 (a) Jack-up Perro Negro 3 365 – – Jack-up Perro Negro 4 365 – 30 (a) Jack-up Perro Negro 5 365 – 122 (a) Jack-up Perro Negro 7 298 67 (a+b) – Jack-up Perro Negro 8 325 40 (a) 181 (a) Tender Assisted Drilling Barge 362 3 (b) 20 (a) Ocean Spur 360 5 (b) –
(a) = the vessel underwent/shall undergo class reinstatement works and/or preparation works for a new contract. (b) = the vessel underwent maintenance works to address technical problems. (c) = the vessel was not under contract.
page 12 of 21

Drilling: Onshore (million euro)
Q4 2013
Q3 2014
Q4 2014
Q4 2014 vs
Q4 2013 (%)
2013 2014
2014 vs
2013 (%)
185 184 194 4.9 Revenues 721 714 (1.0)
(125) (122) (127) 1.6 Expenses (489) (473) (3.3)
(35) (37) (40) 14.3 Depreciation and amortization (141) (150) 6.4
25 25 27 8.0 Operating profit 91 91 –
32.4 33.7 34.5 EBITDA % 32.2 33.8 13.5 13.6 13.9 EBIT % 12.6 12.7
403 244 184 New contracts 887 852
The backlog at December 31, 2014 stood at €1,363 million (including the effects of the cancellation of a contract for Shell in Ukraine, which amounted to €16 million), of which €552 million is due to be executed in 2015. Revenues for 2014 amounted to €714 million, in line with the revenues achieved in 2013; lower
levels of activity in South America and Algeria were largely offset by increased levels of activity in Saudi Arabia.
Operating profit for 2014 amounted to €91 million, in line with that of 2013, with margin on revenues largely unchanged. The EBITDA margin stood at 33.8%, compared to 32.2% in 2013, thanks to an improvement in operational efficiency.
Pursuant to accounting standards IFRS 10 and 11, the deconsolidation of joint ventures at December 31, 2014, has a negative impact of €19 million on revenues and a negative impact of €1 million on operating profit, deriving mainly from operations in Kazakhstan (negative impact of €26 million on revenues and of €2 million on operating profit in 2013).
The main contracts acquired in the fourth quarter of 2014 include: – for various clients, new contracts for the lease of 9 rigs in the Middle East and in Latin
America, whose duration ranges from three months to three years.
Average utilization of assets in 2014 stood at 96.5% (95.9% in 2013). At December 31, 2014, the Company owned 98 rigs (in addition to 2 rigs under construction) located as follows: 28 in Venezuela, 25 in Saudi Arabia, 19 in Peru, 7 in Colombia, 4 in Kazakhstan, 4 in Bolivia, 3 in Ecuador, 2 in Italy, 1 in Chile, 1 in Congo, 1 in Mauritania, 1 in Tunisia, 1 in Turkmenistan and 1 in Ukraine. Additionally, 5 third-party rigs were deployed in Peru, 1 third-party rig in Congo and 1 in Chile.
page 13 of 21
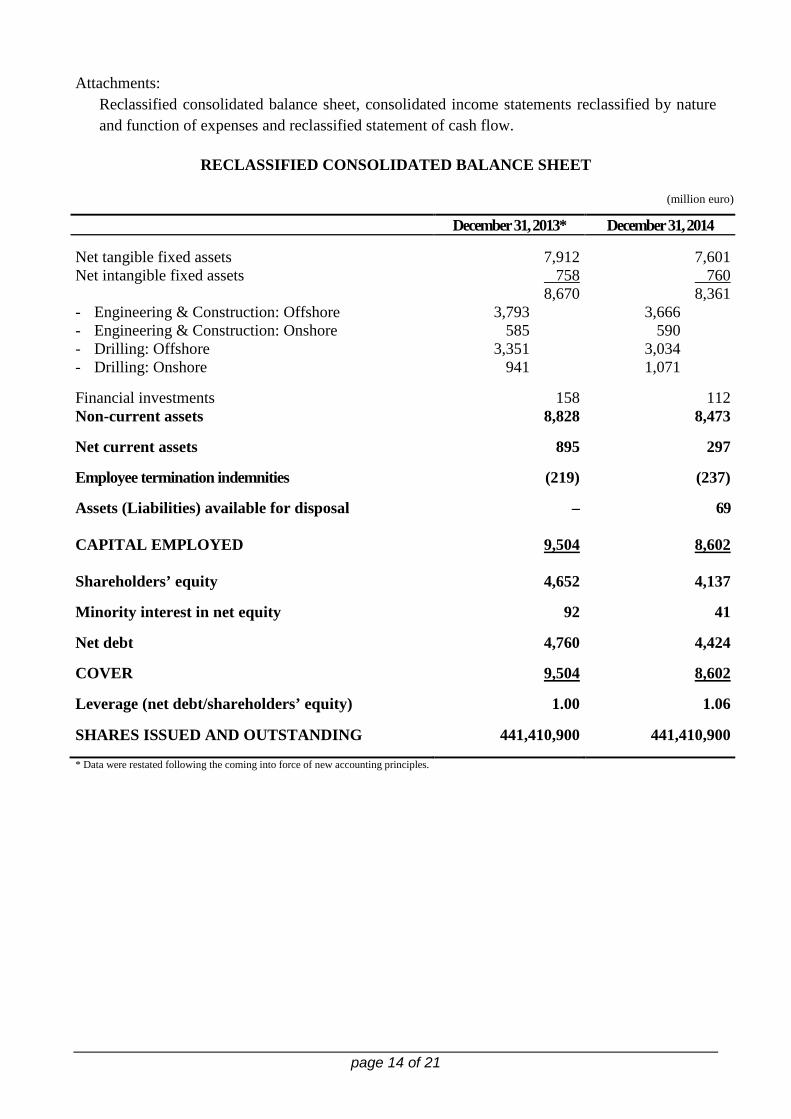
Attachments: Reclassified consolidated balance sheet, consolidated income statements reclassified by nature and function of expenses and reclassified statement of cash flow.
RECLASSIFIED CONSOLIDATED BALANCE SHEET
(million euro)
December 31, 2013* December 31, 2014 Net tangible fixed assets 7,912 7,601 Net intangible fixed assets 758 760 8,670 8,361 - Engineering & Construction: Offshore 3,793 3,666 - Engineering & Construction: Onshore 585 590 - Drilling: Offshore 3,351 3,034 - Drilling: Onshore 941 1,071 Financial investments 158 112 Non-current assets 8,828 8,473 Net current assets 895 297 Employee termination indemnities (219) (237) Assets (Liabilities) available for disposal – 69
CAPITAL EMPLOYED 9,504 8,602 Shareholders’ equity 4,652 4,137 Minority interest in net equity 92 41 Net debt 4,760 4,424 COVER 9,504 8,602 Leverage (net debt/shareholders’ equity) 1.00 1.06 SHARES ISSUED AND OUTSTANDING 441,410,900 441,410,900 * Data were restated following the coming into force of new accounting principles.
page 14 of 21

CONSOLIDATED INCOME STATEMENT RECLASSIFIED BY
NATURE OF EXPENSES
(million euro)
Q4 2013
Q3 2014
Q4 2014
Year
2013 2014
3,153 3,509 3,398 Operating revenues 11,841 12,873
3 3 2 Other revenues and income 7 9
(2,209) (2,580) (2,564) Purchases, services and other costs (8,711) (9,262)
(598) (595) (616) Payroll and related costs (2,270) (2,408)
349 337 220 GROSS OPERATING RESULT 867 1,212
(178) (187) (608) Amortization, depreciation and write-downs (710) (1,157)
171 150 (388) OPERATING RESULT 157 55
(44) (52) (37) Financial expenses (189) (199)
(9) 13 (6) Income from investments 2 24
118 111 (431) INCOME BEFORE INCOME TAXES (30) (120)
(41) (35) (19) Income taxes (106) (118)
77 76 (450) INCOME BEFORE MINORITY INTEREST (136) (238)
(7) – 8 Minority interest (23) 8
70 76 (442) NET RESULT (159) (230)
248 263 166 CASH FLOW (Net result + Depreciation and amortization) 551 927
page 15 of 21

CONSOLIDATED INCOME STATEMENT
RECLASSIFIED BY FUNCTION OF EXPENSES
(million euro)
Q4 2013
Q3 2014
Q4 2014
Year
2013 2014
3,153 3,509 3,398 Operating revenues 11,841 12,873
(2,855) (3,227) (3,664) Production costs (11,169) (12,326)
(38) (32) (23) Idle costs (162) (116)
(37) (35) (38) Selling expenses (142) (143)
(4) (3) (3) Research and development costs (14) (11)
(1) (7) (6) Other operating income (expenses), net (14) (21)
218 205 (336) CONTRIBUTION FROM OPERATIONS 340 256
(47) (55) (52) General and administrative expenses (183) (201)
171 150 (388) OPERATING PROFIT 157 55
(44) (52) (37) Financial expenses (189) (199)
(9) 13 (6) Income from investments 2 24
118 111 (431) INCOME BEFORE INCOME TAXES (30) (120)
(41) (35) (19) Income taxes (106) (118)
77 76 (450) INCOME BEFORE MINORITY INTEREST (136) (238)
(7) – 8 Minority interest (23) 8
70 76 (442) NET PROFIT (159) (230)
248 263 166 CASH FLOW (Net Profit + Depreciation and amortization) 551 927
page 16 of 21

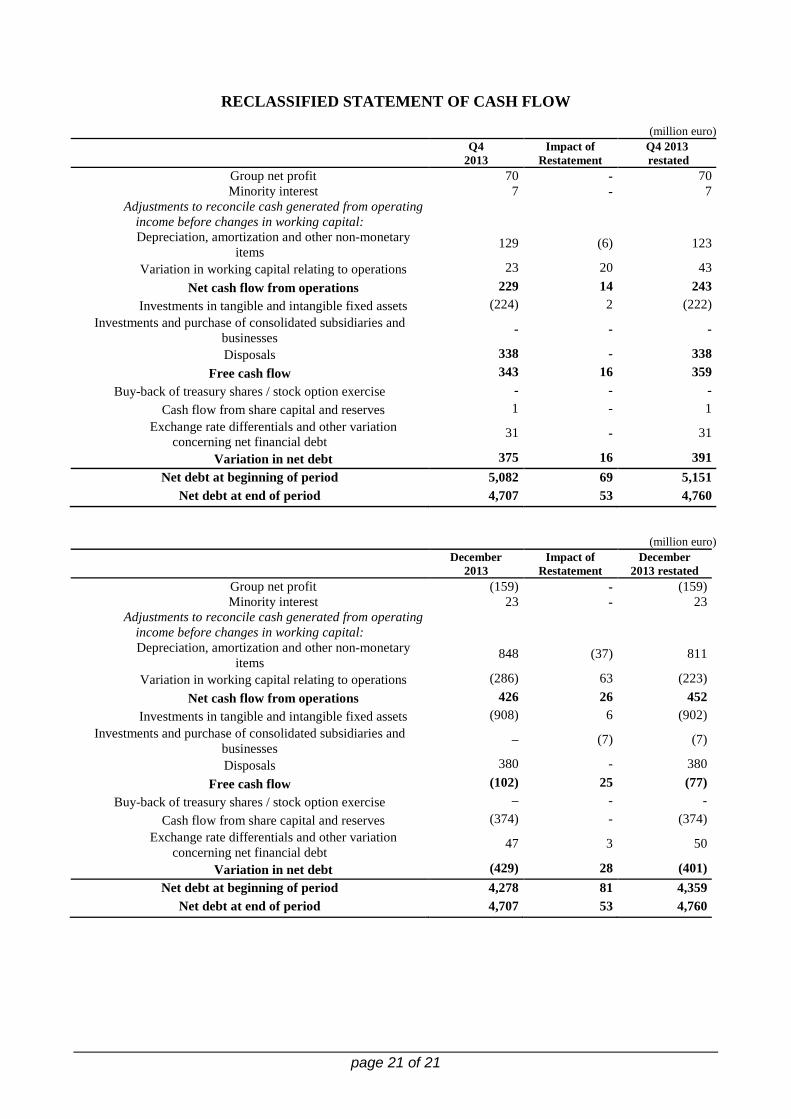
RECLASSIFIED STATEMENT OF CASH FLOW
(million euro)
Q4 2013
Q3 2014
Q4 2014
Year
2013 2014
70 76 (442) Net profit (159) (230)
7 – (8) Minority interest 23 (8)
Adjustments to reconcile cash generated from operating income before changes in working capital:
123 188 632 Depreciation, amortization and other non-monetary items
811 1,141
43 (80) 782 Variation in working capital relating to operations (223) 295
243 184 964 Net cash flow from operations 452 1,198
(222) (146) (219) Investments in tangible and intangible fixed assets (902) (694)
– (2) (5) Investments and purchase of consolidated subsidiaries and businesses
(7) (9)
338 1 7 Disposals 380 15
359 37 747 Free cash flow (77) 510
– – – Buy back of treasury shares/Exercise of stock options – –
1 – (1) Cash flow from share capital and reserves (374) (45)
31 (63) (40) Effect of exchange rate differences on net debt and other changes
50 (129)
391 (26) 706 Change in net debt (401) 336
5,151 5,104 5,130 Net debt at beginning of period 4,359 4,760
4,760 5,130 4,424 Net debt at end of period 4,760 4,424
page 17 of 21

Effects of the application of IFRS 11: Financial Statements The following tables illustrate the effects of restatements on the Balance Sheet at December 31, 2013 and the Income statement of the Fourth Quarter and the year 2013, following the implementation of the new IFRS 10 and IFRS 11 accounting standards.
RECLASSIFIED CONSOLIDATED BALANCE SHEET
(million euro)
December 31, 2013
Impact of restatement
December 31, 2013 restated
Net tangible fixed assets 7,972 (60) 7,912 Net intangible fixed assets 758 – 758 Financial investments 126 32 158 Non-current assets 8,856 (28) 8,828 Net current assets 828 67 895 Employee termination indemnities (233) 14 (219) CAPITAL EMPLOYED 9,451 53 9,504 Shareholders’ equity 4,652 – 4,652 Minority interest in net equity 92 – 92 Net debt 4,707 53 4,760 COVER 9,451 53 9,504 Leverage (net debt/shareholders’ equity) 0.99 1.00 SHARES ISSUED AND OUTSTANDING 441,410,900 441,410,900
page 18 of 21
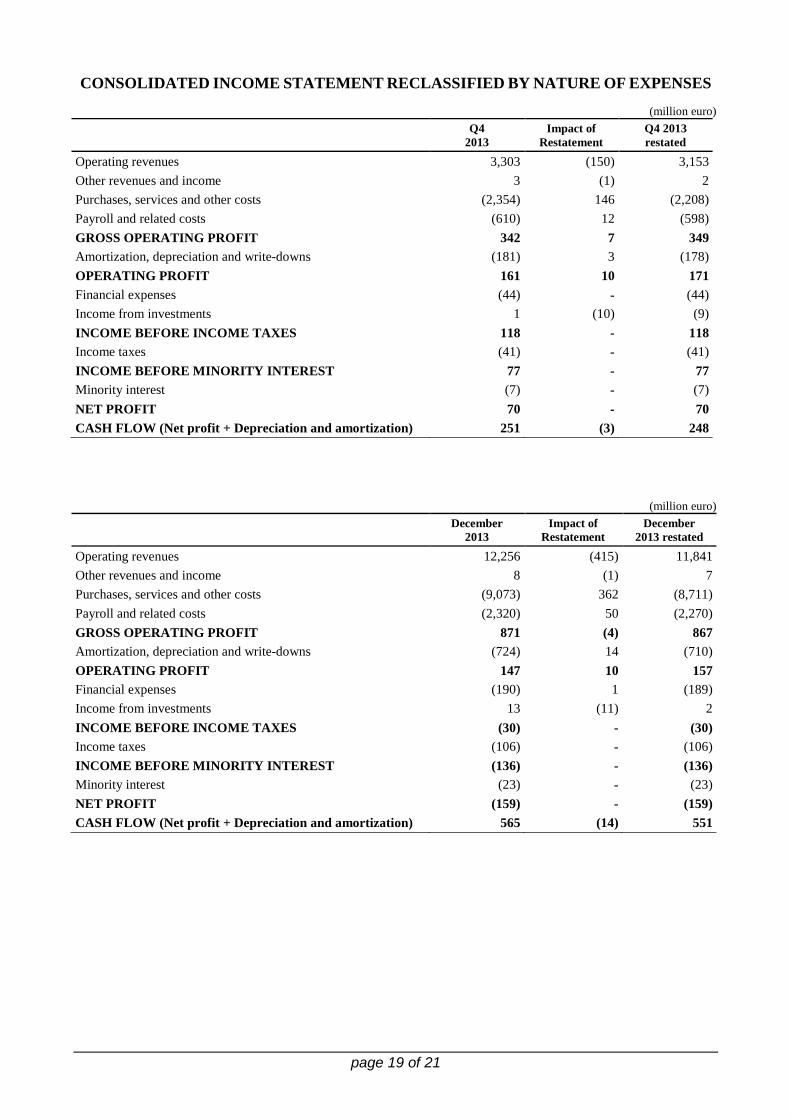
CONSOLIDATED INCOME STATEMENT RECLASSIFIED BY NATURE OF EXPENSES
(million euro)
Q4 2013
Impact of Restatement
Q4 2013 restated
Operating revenues 3,303 (150) 3,153 Other revenues and income 3 (1) 2 Purchases, services and other costs (2,354) 146 (2,208) Payroll and related costs (610) 12 (598) GROSS OPERATING PROFIT 342 7 349 Amortization, depreciation and write-downs (181) 3 (178) OPERATING PROFIT 161 10 171 Financial expenses (44) - (44) Income from investments 1 (10) (9) INCOME BEFORE INCOME TAXES 118 - 118 Income taxes (41) - (41) INCOME BEFORE MINORITY INTEREST 77 - 77 Minority interest (7) - (7) NET PROFIT 70 - 70 CASH FLOW (Net profit + Depreciation and amortization) 251 (3) 248
(million euro)
December 2013
Impact of Restatement
December 2013 restated
Operating revenues 12,256 (415) 11,841 Other revenues and income 8 (1) 7 Purchases, services and other costs (9,073) 362 (8,711) Payroll and related costs (2,320) 50 (2,270) GROSS OPERATING PROFIT 871 (4) 867 Amortization, depreciation and write-downs (724) 14 (710) OPERATING PROFIT 147 10 157 Financial expenses (190) 1 (189) Income from investments 13 (11) 2 INCOME BEFORE INCOME TAXES (30) - (30) Income taxes (106) - (106) INCOME BEFORE MINORITY INTEREST (136) - (136) Minority interest (23) - (23) NET PROFIT (159) - (159) CASH FLOW (Net profit + Depreciation and amortization) 565 (14) 551
page 19 of 21

CONSOLIDATED INCOME STATEMENT RECLASSIFIED
BY FUNCTION OF EXPENSES
(million euro)
Q4 2013
Impact of Restatement
Q4 2013 restated
Operating revenues 3,303 (150) 3,153 Production costs (3,008) 153 (2,855) Idle costs (39) 1 (38) Selling expenses (39) 2 (37) Research and development costs (4) - (4) Other operating income (expenses), net (3) 2 (1) CONTRIBUTION FROM OPERATIONS 210 8 218 General and administrative expenses (49) 2 (47) OPERATING PROFIT 161 10 171 Financial expenses (44) - (44) Income from investments 1 (10) (9) INCOME BEFORE INCOME TAXES 118 - 118 Income taxes (41) - (41) INCOME BEFORE MINORITY INTEREST 77 - 77 Minority interest (7) - (7) NET PROFIT 70 - 70 CASH FLOW (Net Profit + Depreciation and amortization) 251 (3) 248
(million euro)
December 2013
Impact of Restatement
December 2013 restated
Operating revenues 12,256 (415) 11,841 Production costs (11,584) 415 (11,169) Idle costs (163) 1 (162) Selling expenses (145) 3 (142) Research and development costs (14) - (14) Other operating income (expenses), net (15) 1 (14) CONTRIBUTION FROM OPERATIONS 335 5 340 General and administrative expenses (188) 5 (183) OPERATING PROFIT 147 10 157 Financial expenses (190) 1 (189) Income from investments 13 (11) 2 INCOME BEFORE INCOME TAXES (30) - (30) Income taxes (106) - (106) INCOME BEFORE MINORITY INTEREST (136) - (136) Minority interest (23) - (23) NET PROFIT (159) - (159) CASH FLOW (Net Profit + Depreciation and amortization) 565 (14) 551
page 20 of 21
RECLASSIFIED STATEMENT OF CASH FLOW
(million euro)
Q4 2013
Impact of Restatement
Q4 2013 restated
Group net profit 70 - 70 Minority interest 7 - 7
Adjustments to reconcile cash generated from operating income before changes in working capital:
Depreciation, amortization and other non-monetary items
129 (6) 123
Variation in working capital relating to operations 23 20 43 Net cash flow from operations 229 14 243
Investments in tangible and intangible fixed assets (224) 2 (222) Investments and purchase of consolidated subsidiaries and
businesses - - -
Disposals 338 - 338 Free cash flow 343 16 359
Buy-back of treasury shares / stock option exercise - - - Cash flow from share capital and reserves 1 - 1
Exchange rate differentials and other variation concerning net financial debt
31 - 31
Variation in net debt 375 16 391 Net debt at beginning of period 5,082 69 5,151
Net debt at end of period 4,707 53 4,760
(million euro)
December 2013
Impact of Restatement
December 2013 restated
Group net profit (159) - (159) Minority interest 23 - 23
Adjustments to reconcile cash generated from operating income before changes in working capital:
Depreciation, amortization and other non-monetary items
848 (37) 811
Variation in working capital relating to operations (286) 63 (223) Net cash flow from operations 426 26 452
Investments in tangible and intangible fixed assets (908) 6 (902) Investments and purchase of consolidated subsidiaries and
businesses – (7) (7)
Disposals 380 - 380 Free cash flow (102) 25 (77)
Buy-back of treasury shares / stock option exercise – - - Cash flow from share capital and reserves (374) - (374)
Exchange rate differentials and other variation concerning net financial debt
47 3 50
Variation in net debt (429) 28 (401) Net debt at beginning of period 4,278 81 4,359
Net debt at end of period 4,707 53 4,760
page 21 of 21