Safety Evaluation of the Plunge Pool and the Downstream River of
112
Safety Evaluation of the Plunge Pool and the Downstream River of the Baihetan Hydropower Station Using Model Experiments Henrik Pettersson Johan Pettersson Division of Applied Thermodynamics and Fluid Mechanics Master Thesis Department of Management and Engineering LIU-IEI-TEK-A--11/01067—SE
Transcript of Safety Evaluation of the Plunge Pool and the Downstream River of

Safety Evaluation of the Plunge Pool and the
Downstream River of the Baihetan Hydropower
Station Using Model Experiments
Henrik Pettersson
Johan Pettersson
Division of Applied Thermodynamics and Fluid Mechanics
Master Thesis
Department of Management and Engineering
LIU-IEI-TEK-A--11/01067—SE

ii
Abstract As a part of the hydropower expansion in China, the Baihetan Hydropower Station is now being
constructed in the southern parts of the country. This hydropower station will, when completed,
become the third largest in the world in terms of installed power output.
The construction of a hydropower plant of the Baihetans Hydropower Station’s size is not without
problems and high standards of safety are essential as large land areas upstream and downstream of
the dam are affected. One of the risks is that the flow of water through the dam can cause scour and
erosion downstream of the dam which threatens the stability of both the dam and the riverbed. To
evaluate this risk, studies of a model in the scale of 1:100 have been performed at the Department
of Hydraulic Engineering at Tsinghua University in Beijing, China.
This thesis evaluates whether the discharge through the dam causes a hydrodynamic pressure above
the allowed limit in the plunge pool below the dam and which measures that can be made to reduce
this pressure. Flow velocity measurements were conducted, both in the plunge pool and along the
downstream riverbed, to further evaluate the risk of erosion.
The experiments show that the use of nappe splitters in two of the surface spillways will reduce the
hydrodynamic pressure in the plunge pool to well below the acceptable limit of 15 m H2O. However,
the flow velocity downstream of the plunge pool is too large and protection measures are
recommended to avoid riverbed erosion.
The results obtained indicate that a shortening of the plunge pool is possible which would lead to a
reduced construction cost. However, further studies would be necessary to determine if this
increases the risk of erosion in the downstream river.

iii
Sammanfattning Som en följd av Kinas vattenkraftsexpansion konstrueras just nu Baihetan vattenkraftverk i södra
Kina som, när det är färdigställt, kommer att bli världens tredje största vattenkraftverk sett till
installerad effekt.
Att konstruera ett vattenkraftverk av Baihetans storlek är dock inte problemfritt och det ställs höga
krav på säkerheten då stora landytor både nedströms och uppströms av dammen påverkas. En av de
faror som existerar är att vattenflödet genom dammen kan orsaka erosion nedströms, vilket kan
leda till att dammens samt flodfårans stabilitet äventyras. För att undersöka risken för erosion
nedströms om Baihetan dammen har försök utförts på en modell i skala 1:100 på institutionen för
vattenhydraulik vid Tsinghua universitet i Beijing, Kina.
Det här examensarbetet avhandlar huruvida flödet genom dammen orsakar ett för högt tryck i
nedslagsbassängen nedanför och vad man kan göra för att minska detta tryck. För att ytterligare
försäkra sig om att erosion inte sker i nedslagsbassängen och i flodfåran har hastighetsmätningar av
flödet utförts.
Experimenten visar att nyttjande av flödessplittrare i två av yt-utskoven medför att det dynamiska
trycket i nedslagsbassängen ligger långt under den tillåtna gränsen på 15 m H2O. Däremot är
flödeshastigheten nedströms om nedslagsbassängen för hög och skyddsåtgärder är
rekommenderade för att undvika erosion längs flodfåran.
Resultaten som erhållits indikerar att en nedkortning av nedslagsbassängen är möjlig vilket skulle
innebära en minskad konstruktionskostnad. Det krävs dock ytterligare studier för att bestämma
huruvida detta skulle påverka erosionsrisken i flodfåran nedströms.

iv
Acknowledgements The project in this Master thesis has been carried out at the Department of Hydraulic Engineering at
Tsinghua University in Beijing, China, from March to May 2010.
This project is funded by Elforsk AB within the frame of dam safety, where Mr. Cristian Andersson
and Mrs. Sara Sandberg are program directors. Some of the travel expenses have been covered by
Linköping University.
We owe our thanks to Dr. James Yang from KTH/Vattenfall R&D for making the trip possible and for necessary arrangements. We are very grateful to Professor Chunbo Jiang at the Department of Hydraulic Engineering at
Tsinghua University. Professor Jiang has provided valuable help and feedback during the process of
writing this Master thesis and we would not have been able to complete this project without him.
Many thanks to Ph.D. student Di Zhang for providing both everyday help with the project and
answers to all our questions. His help has been very valuable throughout our time in China. We
would also like to thank the other students at our office at the Department of Hydraulic Engineering
for being very friendly and helpful to us.
We would like to thank our supervisor, Ph.D. Johan Renner, at Linköping University for valuable
input and opinions regarding this Master thesis.
Thanks to our examiner, Professor Matts Karlsson, for the approval of performing this Master thesis
and for allowing us to be the first students from Linköping University to carry out a Master thesis at
Tsinghua University.
We would also like to thank our fellow students, Markus Bäck and Daniel Kolm, for agreeing to take
part as our objectors for this Master thesis and their valuable opinions during the writing process.
Many people have been involved in the process of this Master thesis and we are very grateful for all
their help and support.
Beijing, May 2011
Henrik Pettersson
Johan Pettersson

v
Table of contents 1 Introduction .................................................................................................................................... 1
1.1 Background ............................................................................................................................. 1
1.2 Purpose ................................................................................................................................... 1
1.3 Delimitations ........................................................................................................................... 2
1.4 Method of approach ............................................................................................................... 2
2 Project description .......................................................................................................................... 3
2.1 Dam engineering ..................................................................................................................... 3
2.1.1 History of dam engineering............................................................................................. 3
2.1.2 Types of dams ................................................................................................................. 3
2.2 Environmental and socio-economic consequences of mega dams ........................................ 4
2.3 The Chinese energy situation .................................................................................................. 5
2.4 Hydropower in China .............................................................................................................. 5
2.4.1 The Jinsha River project .................................................................................................. 6
2.4.2 Baihetan Hydropower Station ........................................................................................ 6
3 Theoretical frame of reference ....................................................................................................... 7
3.1 Spillways .................................................................................................................................. 7
3.1.1 Estimation and selection of design flood ........................................................................ 7
3.1.2 Characteristic water level at the Baihetan dam .............................................................. 9
3.1.3 Spillway types used at the Baihetan dam ....................................................................... 9
3.1.4 Spillway design at the Baihetan dam ............................................................................ 10
3.2 Energy dissipation ................................................................................................................. 14
3.2.1 Hydraulic jump stilling basins ........................................................................................ 14
3.2.2 Flip bucket or ski-jump energy dissipation ................................................................... 16
3.2.3 Mid-air energy dissipation ............................................................................................ 16
3.2.4 Plunge pool ................................................................................................................... 16
3.2.5 Energy dissipation at the Baihetan dam ....................................................................... 18
3.3 Scour and protection measures ............................................................................................ 19
3.3.1 Erosion .......................................................................................................................... 20
3.3.2 Scour downstream of dams .......................................................................................... 21
3.3.3 Scour protection at the Baihetan dam .......................................................................... 24
3.4 Hydraulic modelling .............................................................................................................. 24
3.4.1 Scale theory ................................................................................................................... 25
3.4.2 Scale effects .................................................................................................................. 25
3.4.3 Scale effects at the Baihetan dam ................................................................................ 27
3.5 Physical theory ...................................................................................................................... 30
3.5.1 Equations and units ....................................................................................................... 30
3.5.2 Pressure calculations on the Baihetan plunge pool floor ............................................. 31

vi
4 Experiments .................................................................................................................................. 34
4.1 Reference system .................................................................................................................. 34
4.2 Pressure experiments ........................................................................................................... 35
4.2.1 Hydrodynamic pressure measurements ....................................................................... 37
4.2.2 Depth of water cushion................................................................................................. 38
4.2.3 Reading of the piezometric tubes ................................................................................. 38
4.3 Flow velocity experiments .................................................................................................... 39
4.3.1 Velocity meter ............................................................................................................... 39
4.3.2 Plunge pool measurements .......................................................................................... 40
4.3.3 Measurements downstream of the second dam .......................................................... 40
4.3.4 Recording of flow velocity data .................................................................................... 41
5 Pressure experiments ................................................................................................................... 42
5.1 Results of the pressure experiments .................................................................................... 42
5.1.1 Experiment 1 – Plunge pool .......................................................................................... 42
5.1.2 Experiment 1 – Second dam ......................................................................................... 43
5.1.3 Experiment 2 – Plunge pool .......................................................................................... 44
5.1.4 Experiment 2 – Second dam ......................................................................................... 45
5.1.5 Experiment 3 – Plunge pool .......................................................................................... 45
5.1.6 Experiment 3 – Second dam ......................................................................................... 46
5.2 Pressure distribution ............................................................................................................. 47
5.2.1 Twin peaks .................................................................................................................... 47
5.2.2 Close to dam impinge ................................................................................................... 48
5.2.3 No water cushion penetration ...................................................................................... 49
5.3 Analysis of the pressure experiments ................................................................................... 50
5.3.1 Experiment 1 – Plunge pool .......................................................................................... 50
5.3.2 Experiment 1 – Second dam ......................................................................................... 51
5.3.3 Experiment 1 – Pressure distribution ........................................................................... 51
5.3.4 Experiment 2 – Plunge pool .......................................................................................... 51
5.3.5 Experiment 2 – Second dam ......................................................................................... 52
5.3.6 Experiment 2 – Pressure distribution ........................................................................... 52
5.3.7 Experiment 3 – Plunge pool .......................................................................................... 53
5.3.8 Experiment 3 – Second dam ......................................................................................... 53
5.3.9 Experiment 3 – Pressure distribution ........................................................................... 53
5.4 Preferable nappe splitter setup ............................................................................................ 53
6 Flow velocity experiments ............................................................................................................ 54
6.1 Results of the flow velocity experiments .............................................................................. 54
6.1.1 Velocity decline along the plunge pool centre line ....................................................... 54
6.1.2 Maximum velocity in the plunge pool .......................................................................... 55

vii
6.1.3 Flow velocity upstream of the second dam .................................................................. 55
6.1.4 Flow velocity over the second dam .............................................................................. 56
6.1.5 Flow velocity downstream of the second dam ............................................................. 57
6.2 Analysis of the flow velocity experiments ............................................................................ 58
6.2.1 Velocity decay along the plunge pool centre line ......................................................... 58
6.2.2 Maximum velocity in the plunge pool .......................................................................... 58
6.2.3 Flow velocity upstream of the second dam .................................................................. 58
6.2.4 Flow velocity over the second dam .............................................................................. 58
6.2.5 Flow velocity downstream of the second dam ............................................................. 58
7 Discussion ...................................................................................................................................... 59
7.1 Pressure results ..................................................................................................................... 59
7.2 Flow velocity results .............................................................................................................. 59
7.3 Sources of error .................................................................................................................... 60
8 Conclusion ..................................................................................................................................... 61
References ............................................................................................................................................ 62
Published sources ............................................................................................................................. 62
Internet sources ................................................................................................................................ 64
Appendix A .......................................................................................................................................... - 1 -
Appendix B .......................................................................................................................................... - 5 -
Appendix C ........................................................................................................................................ - 20 -
Appendix D ........................................................................................................................................ - 35 -

viii
Table of figures Figure 2.1 Different types of dams (Hutchinson Encyclopaedia talktalk.co.uk © RM, 2011. All Rights
Reserved. Helicon Publishing is a division of RM)................................................................................... 4
Figure 3.1 Different crest profiles for surface spillways (Khatsuria, 2004) ............................................. 9
Figure 3.2 Spillways in the model of the Baihetan dam, seen from downstream ................................ 11
Figure 3.3 Outlay of the surface spillways at the Baihetan dam, seen from above ............................. 11
Figure 3.4 Angle definitions of spillways ............................................................................................... 12
Figure 3.5 The design of surface spillways 3, 2 and 1 ........................................................................... 13
Figure 3.6 Outlay of the deep orifices at the Baihetan dam, seen from above .................................... 13
Figure 3.7 Definition sketch of the five phases of energy dissipation (Novak et al., 2001).................. 14
Figure 3.8 Hydraulic jump within a stilling basin (Chadwick et al., 2004) ............................................ 15
Figure 3.9 Plunge pool created by a second dam (Puertas & Dolz, 2005) ............................................ 16
Figure 3.10 Flow regions in a plunge pool hit by vertical jets (Xu et al., 2002) .................................... 17
Figure 3.11 Hydraulic jump within the plunge pool (Puertas & Dolz, 2005) ........................................ 17
Figure 3.12 Schematic picture of flow velocities in a river bend (Roca et al., 2009) ............................ 20
Figure 3.13 Scour protection by the use of a concrete apron (Khatsuria, 2004).................................. 23
Figure 3.14 Flow velocity distribution: a) Frictionless flow b) Real flow (Featherstone & Nalluri, 1995)
.............................................................................................................................................................. 31
Figure 3.15 Schematic figure of the Baihetan plunge pool ................................................................... 32
Figure 3.16 Schematic figure of the left bottom side of Baihetan plunge pool.................................... 32
Figure 3.17 Scenario 1: Smooth overflow over the second dam .......................................................... 33
Figure 3.18 Scenario 2: Distinct fall of water over the second dam ..................................................... 33
Figure 4.1 Reference system used in the Baihetan plunge pool .......................................................... 34
Figure 4.2 Different nappe splitter setup in surface spillways during experiment 1-3 ........................ 35
Figure 4.3 Left: Piezometric tube-setup below the plunge pool, Right: Piezometric tubes on a gridded
board ..................................................................................................................................................... 37
Figure 4.4 Arrangement of piezometric tubes in the Baihetan plunge pool ........................................ 38
Figure 4.5 Grid made in AutoCAD ......................................................................................................... 39
Figure 4.6 The electromagnetic current velocity sensor used in the experiments .............................. 40
Figure 4.7 Location of flow velocity measurement points downstream of the second dam ............... 41
Figure 4.8 The X- and Y-vectors and their resultant XY ........................................................................ 41
Figure 5.1 Pressure distribution of the Twin peak category (check condition, experiment 1) ............ 47
Figure 5.2 Pressure distribution of the Close to dam impinge category (Surface condition, experiment
3) ........................................................................................................................................................... 48
Figure 5.3 Pressure distribution of the No water cushion penetration category (Energy dissipation
condition, experiment 1) ...................................................................................................................... 49
Figure 6.1 Velocity decline along plunge pool centre line (Y-direction) ............................................... 54
Figure 6.2 Flow velocity at Y=220 m (XY-direction) .............................................................................. 55
Figure 6.3 Flow velocity at Y=380 m (Y-direction) ................................................................................ 56
Figure 6.4 Flow velocity profile for the Check, Design and Normal condition measured from the
surface ................................................................................................................................................... 57

ix
Table of tables Table 2.1 Exploitable hydropower resources of the Jinsha River system (Yang & Yao, 2002) ............... 6
Table 3.1 Reservoir water levels of the Baihetan dam ........................................................................... 9
Table 3.2 Discharge from surface spillways and deep orifices ............................................................. 10
Table 3.3 Angle definitions of surface spillways ................................................................................... 12
Table 3.4 Angle definitions of deep orifices.......................................................................................... 14
Table 3.5 Classifications of hydraulic jumps (Khatsuria, 2004) ............................................................. 15
Table 3.6 Scale relationship with Froude number similarity (Novak et al., 2001) ................................ 25
Table 3.7 Hydraulic radius and inlet dimensions of surface spillways and deep orifices ..................... 27
Table 3.8 Reynolds number at the inlet of the surface spillways ......................................................... 28
Table 3.9 Reynolds number at the inlet of the deep orifices ............................................................... 28
Table 3.10 Hydraulic radius over the second dam during the check, design, energy dissipation and
normal condition ................................................................................................................................... 29
Table 3.11 Reynolds number over the second dam during the check, design, energy dissipation and
normal condition ................................................................................................................................... 29
Table 3.12 Physical units used .............................................................................................................. 30
Table 4.1 Water level and orifice setup during different conditions .................................................... 35
Table 4.2 Conditions for experiment 2 and 3 ....................................................................................... 36
Table 5.1 Maximum pressure in the plunge pool (experiment 1) ........................................................ 42
Table 5.2 Maximum pressure on the second dam (experiment 1)....................................................... 43
Table 5.3 Difference in tailwater level between experiment 1 and experiment 2 & 3 ........................ 44
Table 5.4 Maximum pressure in the plunge pool (experiment 2) ........................................................ 44
Table 5.5 Maximum pressure on the second dam (experiment 2)....................................................... 45
Table 5.6 Maximum pressure in the plunge pool (experiment 3) ........................................................ 45
Table 5.7 Maximum pressure on the second dam (experiment 3)....................................................... 46
Table 6.1 Average flow velocity profile over the second dam .............................................................. 56
Table 6.2 Flow velocity along the left river bank .................................................................................. 57
Table 6.3 Flow velocity along the right river bank ................................................................................ 57

1
1 Introduction In this chapter, the background and purpose of the thesis are presented. It is followed by a review of
the delimitations and the method of approach used.
1.1 Background China is the world’s most populous country and alongside its fast growing economy the standard of
living has increased. This has caused a rapid increase in China’s demand for energy, which has
doubled during the last decade.
To lessen China’s dependency upon fossil fuel and still satisfy the country’s high demand for energy,
new hydro power plants are being planned and built. Because of that, the Jinsha river system in the
south of China is experiencing a huge development of hydropower expansion. Only in its lower
reaches four new hydro power plants are either planned or under construction and two of those
plants are soon to be opened.
The Baihetan Hydropower Station, which is in the planning stage, will when opened be the third
largest in the world in terms of power output.
Safety is a very important factor when building a hydro power plant which has such a big impact on
the environment as the Baihetan Hydropower Station. This thesis will investigate the water flow
through the Baihetan dam and its impact on the environment downstream.
It is the free falling jets from the dam’s outlets that may cause scour and erosion in the plunge pool
below the dam as well as in the riverbed far downstream of the Baihetan dam. There is also a risk
that cavitation damage occurs in the plunge pool due to the high velocity of the free falling jets
when they crash into the plunge pool.
In order to investigate the risk of scour and erosion, a model of the Baihetan dam has been built at
the Department of Hydraulic Engineering at Tsinghua University. The flow properties and the impact
made by the water downstream of the dam can be measured and evaluated in this model and to
give a good estimation of what to expect in reality.
1.2 Purpose The purpose of this thesis is to investigate whether or not the discharge of water through the
Baihetan dam into the plunge pool below during different dam outlet configurations poses a threat
to the stability of the dam itself and the environment downstream of it.
The aim is to choose the dam outlet configuration which eliminates the risk of scour and erosion and
therefore does not endanger the dam structure or its surroundings.
Three different dam outlet configurations will be investigated and the configuration which minimizes
the risk of scour and erosion will be chosen.
In order to decide whether or not safety measures need to be undertaken in the downstream river
the risk of river bank erosion will be investigated during the most favourable dam outlet
configuration.

2
1.3 Delimitations When studying the model of the Baihetan dam, the behaviour of certain phenomena cannot be
established. The part of the model that represents the plunge pool is made out of plexiglass, whilst it
would be made out of concrete in the reality. The model of the Baihetan dam can therefore not
describe the scour and uplift processes that might take place in the real plunge pool.
In the model, the part that represents the river downstream of the plunge pool is made out of solid
concrete. It can therefore not represent the erosion process caused by the moving water that would
occur in a real river with a non-solid riverbed.
During the pressure experiments, the average pressure is measured. It should be noted that the
maximum average pressure described in this thesis is not the maximum instant pressure. The
pressure value measured is therefore, at best, equal to but generally lower than the maximum
instant pressure. However, the regulations considering maximum allowed pressure from water
impact is set relative to the average pressure which is investigated in this thesis.
It is the East China Investigation and Design Institute (ECIDI) that are responsible for the construction
of the real dam, henceforth denominated the prototype. The ECIDI have several ongoing
experiments on different models of the Baihetan dam at different locations in China and they decide
during which conditions different outlet configurations should be tested at Tsinghua University.
There are structures in the downstream part of the model that represents the outlet of tunnels
which is present in the prototype. These tunnels are used to increase the discharge capacity for the
dam during certain conditions but are not in use in the model. This means that the model’s
downstream flow will not be accurate during these flow conditions.
1.4 Method of approach To establish whether the discharge of water at the Baihetan dam poses a threat to the dam’s
stability and the downstream environment, several experiments have been conducted. These
experiments were carried out on a hydraulic model in the Department of Hydraulic Engineering at
Tsinghua University.
The model consists of the structure of the Baihetan dam, one kilometre of the upstream reservoir, a
plunge pool below the dam and two kilometres of the Jinsha River downstream of the dam. All parts
of the model are in the scale of 1:100.
During three experiments, the pressure on the plunge pool bottom caused by the free falling jets
from the dam outlets crashing into the plunge pool was measured in the model. The difference
between the experiments was different setups of nappe splitters in the dam outlets.
The experimental results were transformed into the pressure value that would occur on the
prototype plunge pool bottom with the help of scale relationships. Velocity measurements of the
flow in the plunge pool and in the river downstream were also conducted. These values were then
transformed according to the same scale relationships.
To establish whether the pressure and velocity values measured in the model can be considered
acceptable a thorough literature study was conducted. This theoretical frame of reference has been
used to analyse and discuss the results obtained.

3
2 Project description This chapter consists of a general review of dam engineering and its situation and applications in
China. It is followed by a description of the Jinsha River project and specifically, the Baihetan
Hydropower Station.
2.1 Dam engineering The main purpose of a dam is to impound and store water in a safe manner. The reason for
impounding water can diverse from irrigation, water supply and hydroelectric power generation to
river regulation and flood control (Novak et al., 2001).
Despite the fact that 20 % of the worlds produced electricity derives from hydropower it is not the
most common sector of application regarding dams, in fact only a mere 16 % of the dams in the
world are generating electric power. Instead the most dams (37 %) are used for irrigation
possibilities. (Naturskyddsföreningen, 2010)
2.1.1 History of dam engineering
Among civil engineering activities, construction of dams is one of the oldest and most fundamental.
The earliest known dam construction, the Jawa Dam in Jordan, dates back to 3,000 BC (Helms, 1977)
and in Egypt dams for flood control were built as early as 2,800 BC (Bazza, 2007).
Power from water has been used to grind flour, saw wood et cetera for thousands of years but in the
mid-1700s the book Architecture Hydraulique, written by the French engineer Bernard Forest de
Bélidor, was the starting point of the development of the modern hydropower turbine. About 150
years later the streets in the American cities Grand Rapids and Niagara Falls were lit up by lights
powered by electricity derived from hydropower stations. (U.S. Department of Energy, 2008)
2.1.2 Types of dams
Dams are of numerous types but based on the principal construction material used, they can be
separated into two main categories; embankment dams and concrete dams. (Novak et al.,2001)
2.1.2.1 Embankment dams
The construction material used in embankment dams is mainly earthfill and/or rockfill. Due to the
use of similar, low angle slopes at both the upstream and the downstream side an embankment dam
has a relatively high volume compared to its height. Embankment dams (figure 2.1.1) usually consist
of an impervious core surrounded by supporting shoulders consisting of relatively pervious materials
which main purpose is entirely structural. (Novak et al., 2001)
2.1.2.2 Concrete dams
Characteristics of concrete dams are that the slopes on both sides are dissimilar, often very steep
downstream and almost vertical upstream. Novak et al. (2001) divides concrete dams into three
different sub-categories:
Gravity dams. A gravity dam is a dam with a triangular gravity profile which is essential
because the dam is entirely dependent upon its own mass for stability (figure 2.1.2).
Arch dams. The concept of an arch dam is to transmit most of the water load to the
abutments or valley sides by using an arch form. An arch dam is more efficient than
gravity or buttress dams in terms of volume of concrete required (figure 2.1.3).

4
Buttress dams. A buttress dam consists of a continuous upstream face supported by
downstream buttresses. It may be considered as a lightened version of the gravity dam
for conceptual purposes (figure 2.1.4).
Figure 2.1 Different types of dams (Hutchinson Encyclopaedia talktalk.co.uk © RM, 2011. All Rights Reserved. Helicon Publishing is a division of RM)
2.2 Environmental and socio-economic consequences of mega dams Buildning a large scale dam, a so called mega dam, bring about numerous benefits. In these times
with large focus on global warming, one of the benefits that stand out is that the process of
generating hydropower is completely carbon dioxide-free. This means that once the dam is
constructed hydropower is considered clean. (Bionomicfuel.com, 2010)
Another benefit from building a mega dam is that once the dam is constructed the hydropower plant
produces electricity at a constant rate and since dams are built to last a very long time it will
continue to do so for numerous years. By closing the sluice gates, one can store great amounts of
water in the reservoir and use it for electricity production later on. (Bionomicfuel.com, 2010)
Even though the construction of a mega dam brings great benefits one cannot overlook the
disadvantages. Maybe the most noticeable one is the relocation of the, often thousands of, people
that live in the planned area of the reservoir. In China 12.2 million people have been relocated
because of the construction of large dams. (Devencenzi & Pinderhughes, 2003)
The new houses that are built for the relocated people are often built by far lower standards than
the houses they used to live in before the construction took place. Another disadvantage the
relocated people face is far poorer agriculture conditions. Dams are often planned in fertile valleys

5
with good agriculture conditions but in the new lands the area that is best suitable for agriculture is
already occupied. (Naturskyddsföreningen, 2009)
People that live downstream of the dam are also affected (poorer cattle breeding and fishing
conditions, less access to groundwater) but the constructors rarely consider them as victims which
mean that they do not get any compensation at all (Naturskyddsföreningen, 2009).
Another major disadvantage of mega dams is that an increasing amount of diseases are connected
to the construction and running of the dam. During the construction phase the temporary
construction workers might bring new diseases that are unfamiliar to the local population. Therefore
they often lack the necessary immune defence which leads to immense spreading of the disease.
(Naturskyddsföreningen, 2009)
When the dam is constructed the huge amounts of static water attracts a lot of insects and parasites
which help spread diseases to the surrounding people (Devencenzi & Pinderhughes, 2003).
2.3 The Chinese energy situation The fact that China is the world’s most populous country with a population of over 1.3 billion people
combined with the fast growing Chinese economy has increased the demand of energy (BBC News,
2010). According to the annual outlook by the International Energy Agency (World Energy Outlook
2010 Executive Summary, 2010) the Chinese energy demand has doubled over the last decade
(China surpassed the U.S. as the world’s largest energy consumer during 2009). The agency predicts
that the demand will rise furthermore and 2035 it will account for 22 percent of the world’s total
energy demand, compared to 17 percent today.
Today China is the world’s largest consumer of coal (Nationmaster.com, 2011) and in an attempt to
make the country less dependent on fossil based fuels the government passed a new Renewable
Energy Law in 2006 (China Environmental Law, 2008).
The law states that in 2020, 15 percent of the produced energy is to come from renewable energy
resources and to meet these standards the Chinese government has decided to increase the
hydropower capacity from today’s 200 GW to 430 GW until 2020 (Global Times, 2011).
2.4 Hydropower in China To date, an estimate of 45,000 large dams (> 15 metres of height) have been built in the world and
almost half of them (22,000-24,000) are located in China. This can be put into comparison to the
second most dammed country in the world, the U.S., which holds around 5,500 dams. (Schwartz,
2005)
To help meet the future demands of an increased hydropower capacity the abundant resources in
Southwest China will be exploited during the next three decades. The government plans to turn this
area (including the upper stretch of the Yangtze River known as the Jinsha River and its two
tributaries, the Dadu and Yalong Rivers) into the country’s largest energy base, which will send
power from the energy rich but economically poor western China, to economically developed
eastern areas. (Yang & Yao, 2002)

6
2.4.1 The Jinsha River project
The Chinese government has launched a hydropower project in the three rivers that, when finished,
will produce five times as much hydroelectricity than the world’s largest dam, the Three Gorges Dam
(Chinese Government, 2006).
One phase of this huge project takes part in the lower reaches of the Jinsha River in the southern
parts of China. In this section, four new hydropower plants (Wudongde, Baihetan, Xiluodu and
Xiangjiaba) will be constructed. The Xiluodu and Xiangjiaba stations which are soon to be opened will
install a total capacity of 18.6 GW. The Wudongde station adds a capacity of around 7.4 GW.
(International Rivers, 2009)
2.4.2 Baihetan Hydropower Station
The material in this section is based on numbers and statistics provided by Professor Chunbo Jiang of
the Department of Hydraulic Engineering at Tsinghua University, Beijing.
The Baihetan Hydropower Station is located in the Jinsha River in the reach between Panzhihua and
Yibin. The left bank of the dam is located in the Sichuan Province and the right bank in the Yunnan
Province. The power station site is 260 km away from Kunming, 400 km from Chongqing, Chengdu
and Guiyang, and 1,850 km from Shanghai.
Even though the main purpose of the power station is to generate electric power it will also, among
other things, help preventing floods, hold back sand and improve the shipping conditions
downstream. Like other dams built in alpine gorges the characteristics of the Baihetan dam can be
summarized as large water head, narrow river valley and tremendous flood discharge.
The Baihetan Hydropower Station is planned to be completed 2020 and will have an installed
capacity of 14 GW, which makes it the third largest hydroelectric power plant in the world. It is only
outnumbered by the Three Gorges Dam, also located in China, and the Itaipu Dam located on the
border of Brazil and Paraguay (About.com, 2011). The power station will have an average annual
output of over 60 TWh and the reservoir will have a capacity of 20.6 km3, which is about half the
capacity of the reservoir at the Three Gorges Dam (The Encyclopedia of Earth, 2010).
As mentioned earlier the three other dams in the Jinsha Project installs a capacity of 26 GW in total.
Along with the Baihetan Hydropower Station, the four stations will make up a generating capacity of
40 GW, which is equal to more than three quarters of the total installable capacity of the lower
Jinsha River (table 2.1).
River name River length
[km]
Total fall [m] Installable
capacity [GW]
Annual energy
[TWh]
Jinsha main stream 3,481 5,142 59 323
Lower Jinsha 1,326 1,680 50 275
Yalong main stream 1,571 3,870 22 136
Dadu main stream 1,062 4,177 20 109
Table 2.1 Exploitable hydropower resources of the Jinsha River system (Yang & Yao, 2002)
The Baihetan dam will have an arch length of 704 m and it will rise 289 m above the plunge pool,
making it the world’s tallest concrete dam (World Interesting Facts, 2010).
7
3 Theoretical frame of reference
In this chapter the background theory relevant for the thesis is presented. The first part consists of
the theory behind the design of spillways and the different types of spillways used at the Baihetan
dam. Thereafter follows a part which focuses on different energy dissipation measures and how the
energy is dissipated in the Baihetan dam. It is succeeded by a part which read up on the theory
behind scour and how that problem is taken care of at the Baihetan Dam. Thereafter, the theory of
hydraulic modelling is explained and finally the physical theory of pressure calculations and open
channel flow is clarified.
3.1 Spillways A spillway is designed to prevent overtopping of a dam at a place that is not designed for
overtopping and is described as the safety valve of a dam reservoir system. The main function of a
spillway is to transport surplus water from the reservoir into the downstream river but there are
seven functions that can be assigned to spillways (Khatsuria, 2004):
1. Maintaining normal river water functions
2. Discharging water for utilization
3. Maintaining initial water level in the flood-control operation
4. Controlling floods
5. Controlling additional floods
6. Releasing surplus water
7. Lowering water levels
The spillway design has to provide a safe and adequate spillway structure for the lowest possible
cost but the first step is to determine the size of the spillways to suit the anticipated requirements of
the site. It is the overtopping of dams that causes more than a third of all dam failures. (Khatsuria,
2004)
Dam outlets generally have a bottom outlet apart from a spillway. Its function is to dispose of
sediment in the reservoir. The main factors governing the choice of spillway, apart from economics,
are the reliability and accuracy of flood prediction, the duration and amount of spillage, seismicity of
project site, topography, geology and the dam type. (Novak et al., 2001)
3.1.1 Estimation and selection of design flood
Even though some of the overtopping failures can be derived from equipment malfunctions or
operational errors, the principal cause is insufficient spillway capacity. Since a dam failure in many
cases will have catastrophic consequences, no extensive level of failure can be tolerated. At these
dam sites protection should be provided up to the maximum flood levels. (Khatsuria, 2004)
At a dam site where the consequences of dam failure would be less severe and hence the probability
of minor failure acceptable, the expense for protecting of the dam can be reduced. (Khatsuria, 2004)
The design floods are normally divided into two different water levels: Check water level and Design
water level (Khatsuria, 2004).

8
3.1.1.1 Check water level
The water level where the crest structure, waterway and energy dissipator is on the verge of
collapse, but still exhibits a marginally safe performance is called the Check Water Level. The flood at
this level is often equal to the Probable Maximum Flood (PMF). The PMF is the flood that can be
expected from the most extreme possible hydrological and meteorological conditions for a given
region. A Probable Maximum Perception (PMP) is calculated for all drainage basins. The PMP has the
potential to produce a critical flood at the dam location and the value of the PMP is selected by
examining large, historic storms. (Khatsuria, 2004)
The frequency of the PMP is suggested to be equivalent to a return period of 10,000 years (Hydraulic
Engineering: Requirements for reservoirs, 1997) and by taking storms, snowmelt, and base flow into
consideration the PMP-value can be transformed into a PMF-value (Hydrology Handbook, 1996).
3.1.1.2 Design water level
The design water level is the water level where the flood, under normal conditions, can be
discharged with a safety margin provided by the free board. The design water level is usually
computed by using a percentage of the PMF but it can also be a flood with a given probability of
exceeding the water level e.g. 1:100, 1:1000 etc. (Khatsuria, 2004)
3.1.1.3 Flood frequency analysis
Instead of using rainfall data to estimate the spillway design flood, flood data can be used. A way to
do this is by analysing the flood data from the past 20 to 60 years. Khatsuria (2004) states that the
data (annual floods in the area) can be used, provided that it satisfies two given conditions:
The data is homogenous, e.g. the records have not been affected by dams, diversions,
urbanization etc.
The characteristics of the data is time independent
3.1.1.4 Chinese design flood standards and regulations
Chinese dams are classified into five different groups (A, B, C, D, E) depending on; reservoir capacity,
irrigated area, installed power output and what kind of development that is to be protected from
floods. The dams are then designed to fulfil two different conditions (Khatsuria, 2004):
Normal operating condition (Design water level)
Extra ordinary condition (Check water level)
If a dam failure would be so severe that it could endanger a lot of property or even people’s lives,
the Check Water Level should be chosen according to a PMF. Less important structures can be,
based on the structure, designed for floods with a return period of 300 to 10,000-year floods
(embankment dams) or 200 to 5,000-year floods (concrete dams). (Khatsuria, 2004)

9
3.1.2 Characteristic water level at the Baihetan dam
The dam, the water inlet of the power station and the constructions for flood discharge are designed
by the standards of a flood with a return period of 1,000 years and checked by the standards of a
10,000-year flood. The elevation of the dam crest is 844 metres above sea level (henceforth
abbreviated masl) and the reservoir water levels are listed in table 3.1.
Characteristic water level Reservoir water level [masl]
Check water level 842
Design water level 838
Normal water level 835 Table 3.1 Reservoir water levels of the Baihetan dam
1
3.1.3 Spillway types used at the Baihetan dam
There are a number of different spillway categories but according to Khatsuria (2004), the use of free
jet spillways is best suitable for an arch dam where the water leaves the dam from a crested sill at
the top and/or an outlet in the middle part of the structure. At the Baihetan Dam there are both a
set of free jet spillways (from this point on referred to as the surface spillways) and a set of middle
outlets (from this point on called deep orifices).
3.1.3.1 Surface spillways
Coleman, Wei & Lindell (1999) summarizes the function of a surface spillway as a spillway that
provides for a flow over an arch dam where the water jet free falls before hitting the water surface
beneath.
When using surface spillways the choice of crest profile at the top of the arch dam is important. This
is because the available width at the top of the dam rarely is sufficient to base an overflow profile.
Generally three types of profiles are used (Khatsuria, 2004):
Profiles that, for all types of discharges, direct the overflow jet to fall on the concrete apron
beneath (figure 3.1.1)
Profiles that use nappe splitters to spread the jets over larger areas. (figure 3.1.2)
Profiles with ski jump buckets that deflect the jet further away downstream. (figure 3.1.3)
Figure 3.1 Different crest profiles for surface spillways (Khatsuria, 2004)
1 Due to classification issues, the data has been adjusted according to the wishes of the ECIDI.

10
Nappe splitters
One way to reduce the forces on the concrete apron beneath as well as the erosion downstream is
to aerate and spread the jet over a larger area. One way to do this is by using nappe splitters. Nappe
splitters are small blocks that are placed close to the lip of the spillway. A correct nappe splitter
arrangement can make sure that the water jets split and force two different jets to collide in mid-air,
break up and fall down as disseminated spray. (Khatsuria, 2004)
Ski jump buckets
When the erosion of the plunging jet and spray is tolerated the use of a ski jump bucket is a common
way to make the water jet hit the riverbed at a safe distance from the main dam. The jet’s leaving
velocity, the angle of the bucket lip and the difference in altitude between the bucket lip and the
downstream water surface are all factors that affect the horizontal throw distance. (Wei & Lindell,
1999)
Khatsuria (2004) also defines the objective of a ski jump bucket as to force the water jet to impinge
at such a distance that the scour caused by the jet does not endanger the dam.
3.1.3.2 Deep orifices
The objective of deep orifices (also called bottom outlets) is, similar to that of the ski jump bucket, to
force the jets to impinge at a safe distance from the dam and therefore making sure that the
possible scour hole does not cause problems for the stability of the dam. They are also used to
control the disposal of sediment in the reservoir. The discharge, the operating head and the desired
conditions downstream provides the number, size and elevation of the deep orifices. Multiple
outlets of smaller capacity are more frequently used than a single large sized one. (Khatsuria, 2004)
3.1.4 Spillway design at the Baihetan dam
Due to classification the data in this section have been altered at the request of the ECIDI.
The flow through the Baihetan dam has been divided into 13 jets, six from the surface spillways and
seven from the deep orifices. The discharge from the orifices depends on the water level according
to table 3.2.
Characteristic water level
Discharge, surface spillways [m3s-1]
Discharge, deep orifices [m3s-1]
Total discharge [m3s-1]
Check water level 17,994 12,108 30,102
Design water level 12,545 11,833 24,378
Normal water level 9,446 11,657 21,103 Table 3.2 Discharge from surface spillways and deep orifices
The spillways in the model of the Baihetan dam can be seen in figure 3.2 below. There are six surface
spillways numbered 1 to 6 with surface spillway number 1 to the right in figure 3.2. The deep orifices
are numbered 1 to 7 with deep orifice number 1 below surface spillway 1 (figure 3.2).

11
Figure 3.2 Spillways in the model of the Baihetan dam, seen from downstream
3.1.4.1 Surface spillways
The Baihetan Hydropower Station has six surface spillways in total (figure 3.3), each with an inlet
dimension of 15 x 14 m. They are placed along an elliptical line with a separation of 12.1 m which
means that the total width of the surface spillway system is 150 m. The centreline of the spillway
inlets is elevated 820 masl (254 metres above the concrete bed below).
Figure 3.3 Outlay of the surface spillways at the Baihetan dam, seen from above
Surface spillways
Deep orifices

12
All of the surface spillways have the form of a reversed funnel but the design differs amongst them
according to table 3.3. To disperse the flow nappe splitters can be placed in spillway 1 (one on the
right-hand side facing downstream) and in spillways 3 and 4 (one on each side of the spillway), a
more thorough presentation of the nappe splitter setup can be found in section 4.1.2. Concerning
the angles, all expansion angles are relative a vertical plane whilst all other angles are relative a
horizontal plane (figure 3.4).
Spillway # Expansion angle
Slope angle Ski jump angle Nappe splitter angle
1 7° 16° - 21°
2 7° 31° 6° -
3 5° 36° - 21°
4 5° 36° - 21°
5 7° 31° 6° -
6 7° 16° - -
Table 3.3 Angle definitions of surface spillways
Figure 3.4 Angle definitions of spillways
The design of the spillways is presented in figure 3.5:
Surface spillway 1 has a slope angle of 16° but without a nappe splitter (figure 3.5.1)
Surface spillway 2 has a slope angle of 31 ° and a ski jump angle of 6° (figure 3.5.2)
Surface spillway 3 is equipped with nappe splitters with an angle of 21°. The slope angle is
36° (figure 3.5.3)

13
Figure 3.5 The design of surface spillways 3, 2 and 1
3.1.4.2 Deep Orifices
The deep orifices have a somewhat different layout than that of the surface spillways. In total, there
are seven deep orifices (figure 3.6) placed just below the spaces between the surface spillways
forming a zigzag pattern between the outlets.
The outlets of the orifices are all at the same height, 734 masl (168 metres above the concrete bed
below) and the principle layout is very similar. The inlet area is 5.8 m wide and 15 m high (except for
orifice # 4 which has a height of 15 m), after that the area shrinks slightly and in the middle part all
orifices are of the same size (5.8 x 11 m). Thereafter the layout changes again and at the outlet the
area is 6.5 x 7 m, this goes for all orifices.
Figure 3.6 Outlay of the deep orifices at the Baihetan dam, seen from above
1 2 3

14
As showed in table 3.4, some orifices are deflected more towards the centre line of the dam. The
orifices are for the most part horizontal but at the tongue the water jets are either angled down
towards the water bed or upwards by the help of a ski jump bucket.
Orifice # Deflection angle Slope angle Ski jump angle
1 - 6° -
2 3° - 4°
3 4° - 13°
4 - - 26°
5 4° - 13°
6 3° - 4°
7 - 6° - Table 3.4 Angle definitions of deep orifices
3.2 Energy dissipation Dissipation of kinetic energy in the water flow at the base of a spillway is essential to restore the
flow into the downstream river to an almost pre dam condition in as short distance as possible. This
procedure is necessary to protect the riverbed and banks from erosion and to prevent the dam and
adjoining structures such as powerhouse and canal from being undermined (Khatsuria, 2004). See
figure 3.7 for a definition sketch of energy dissipation from a dam outlet.
Figure 3.7 Definition sketch of the five phases of energy dissipation (Novak et al., 2001)
3.2.1 Hydraulic jump stilling basins
The most effective way of dissipating energy in a flow is by the use of a hydraulic jump and the most
common type of energy dissipator is through a hydraulic jump into a stilling basin (Nalluri &
Featherstone, 2001). A hydraulic jump is what occurs when a supercritical flow has its velocity
abruptly reduced to a subcritical flow which results in an increase of water depth after the jump. A
hydraulic jump stilling basin which is properly designed can dissipate 60 – 70 percent of the energy
in the basin itself. (Khatsuria, 2004)

15
To classify different open channel-flows the Froude number2 (Fr) is used. The Froude number is a
dimensionless number which describes the ratio of inertial to gravity forces. Different classifications
regarding the Froude number are described below (French, 1986):
If Fr>1, the inertial forces are dominant and the flow is in a supercritical state
If Fr<1, the gravitational forces are dominant and the flow is in a subcritical state
If Fr=1, the inertial and gravitational forces are in equilibrium and the flow is in a critical
state
When water is flowing in a critical state (Fr=1) the depth and the velocity of that flow is denoted
critical too. The flow for which the depth is less than the critical depth and the velocity greater than
the critical velocity is termed a supercritical flow. A flow for which the depth is greater than the
critical depth and the velocity less than the critical velocity is called a subcritical flow. (Roberson et
al., 1998)
A flow transition from a supercritical flow to a subcritical flow can occur very abruptly through a
hydraulic jump and is always accompanied by significant turbulence and energy dissipation (French,
1986).
Hydraulic jumps can be classified according to the pre-jump Froude number. For a Froude number
up to about 1.7, called an undular jump, a slight ruffle on the water surface can be seen. (Khatsuria,
2004) The classification for higher Froude number can be seen in table 3.5.
Jump type Pre-jump Froude number Energy loss
Pre-jump 1.7 - 2.5 Low
Transition jump 2.5 - 4.5 25 – 50 %
Steady jump 4.5 – 9 50 – 70 %
Effective but rough jump >9 >70 %
Table 3.5 Classifications of hydraulic jumps (Khatsuria, 2004)
3.2.1.1 Stilling basin
A stilling basin (figure 3.8) consists of a short, level apron at the bottom of the spillway and is
constructed of concrete to resist scour. At the inlet, an integrally cast row of chute blocks is placed,
which breaks the flow into a series of jets. Alternate jets are being lifted from the floor as they pass
over the tops of the blocks. The outlet consists of an integral sill which provides the resistance
required to reduce energy and control the location of the hydraulic jump, which must take place
within the basin. (Chadwick et al., 2004)
Figure 3.8 Hydraulic jump within a stilling basin (Chadwick et al., 2004)
2
√ ; U= characteristic flow velocity, g = gravitational acceleration, L = characteristic length

16
3.2.2 Flip bucket or ski-jump energy dissipation
Because of problems associated with turbulence, such as intermittent cavitation, vibration, uplift
and hydrodynamic loading, hydraulic jump stilling basins are not recommended for heads exceeding
100 metres (Khatsuria, 2004).
Flip bucket or ski-jump energy dissipation are often used at high overflow dams where spray from
the jet can be tolerated and erosion by the plunging jet can be controlled (Wei & Lindell, 1999). The
flip bucket and ski-jump are not considered energy dissipators in real sense. The high energy jet is
deflected from the dam into the air and made to strike the riverbed downstream of the dam
(Khatsuria, 2004).
3.2.3 Mid-air energy dissipation
Spillways may be arranged in pairs and as a very effective way of energy dissipation before riverbed
impact; the free jets can be angled towards each other for the water to collide mid-air (Chadwick et
al., 2004).
Novak et al. (2001) states that a jet falling from a spillway, solid or dispersed, does not lose much
energy from air resistance. They also claim that if the jets instead are made to collide in mid-air the
energy loss is substantially enhanced.
When accomplishing jet collisions by jets issuing from different levels of a dam, the lower level jets
have to surpass the higher level jets. There are two disadvantages with this arrangement. Firstly, the
furthest reaching jet has to come from the lower outlet, which results in an excessive plunge pool
length. Secondly, a large part of the plunge pool does not
contribute to the energy dissipation since the stretch
between the dam and point of impingement becomes
long. A shorter plunge pool will lower the investment cost
of a project. (Gao, 1999)
3.2.4 Plunge pool
To avoid erosion in the form of direct action of the vertical
jets on the riverbed, it is common practice to construct an
auxiliary structure, a second dam, which creates a plunge
pool (figure 3.9). It is the plunge pool that absorbs most of
the energy in the water jets so that when the water flows
over the second dam and reaches the riverbed, it has lost
most of its scouring ability. (Puertas & Dolz, 2005)
3.2.4.1 Energy dissipation in plunge pools
Xu et al. (2002) concludes that the energy dissipation of the jet crashing in the plunge pool is the
process of energy transferring and exchanging.
First, the jet impinging into the plunge pool loses energy when the time-averaged energy of the jet is
turned into turbulent energy. Secondly, energy is dissipated as heat energy due to fluid viscosity
before the water flows out of the plunge pool. (Xu et al., 2002)
Figure 3.9 Plunge pool created by a second dam (Puertas & Dolz, 2005)

17
It is in the region around the jet axis that the main energy transition occurs. It is also where the
dissipation rate of turbulent energy is the highest. As a consequence, only a little water mass in the
plunge pool takes part in energy dissipation. That is one of the reasons why energy dissipation gets
more difficult the more concentrated the jets are. (Xu et al., 2002)
It is at the water surface that the maximum values of turbulent energy and dissipation rate happens.
This implies that it is the shear of water flow that is the main dissipation mode in the plunge pool,
when the water depth is enough. However, the smaller the water depth, the less shear dissipation of
energy takes place. (Xu et al., 2002)
With this knowledge, the plunge pool can be divided into three energy dissipation regions, as seen in
figure 3.10. A large amount of energy is dissipated in the shear region, where the jet hits the plunge
pool. Secondly, energy is dissipated by impact on the pool floor.Before the water leaves the plunge
pool, energy is dissipated by turbulent mixing in the mixing region. (Xu et al., 2002)
Figure 3.10 Flow regions in a plunge pool hit by vertical jets (Xu et al., 2002)
3.2.4.2 Design of plunge pools
When designing a plunge pool that will be hit by vertical jets there are no set standards. The
behaviour of the jet in the air, in the mass of water and pressures and forces on the plunge pool
floor has to be taken into account. (Khatsuria, 2004)
Xu et al. (2002) also states that the pressure on the plunge pool floor is the most important
parameter when designing plunge pools. Not only the maximum pressure should be restricted, but
also the gradient of the pressure distribution on the pool floor. A large pressure gradient means that
the shear energy dissipation is not enough and that the impact kinetic energy is too concentrated.
The limitation of the maximum kinetic pressure and the
difference between the minimum and the maximum value is
set to 15 metres H2O. Khatsuria (2004) states that Japan has a
maximum kinetic pressure limit of 30 metres H2O but that a
limit of 15 metres H2O is Chinese practice.
If the water cushion in the plunge pool is not deep enough to
absorb the nappe and the energy in the nappe is great enough
to expel the cushion, a hydraulic jump is formed within the
plunge pool (figure 3.11). Little energy is then lost before the
water jet impact on the plunge pool floor with the result of
higher dynamic pressure on the plunge pool floor. (Puertas &
Dolz, 2005)
Figure 3.11 Hydraulic jump within the plunge pool (Puertas & Dolz, 2005)

18
Dynamic uplift can happen on the concrete slab that makes the floor of a plunge pool. It is caused by
fluctuating pressure beneath the slabs, through cracks or unsealed joints. This is most likely to
happen in the impact region, which is subject to intense pressure fluctuations. Maximum uplift is
caused when the instantaneous maximum pressure occurs on the downward side of the slab and
minimum pressure on the upward side. (Khatsuria, 2004)
The forces on the downward surface of the concrete slab are very complicated. Because of this, the
maximum kinetic pressure and maximum pressure difference needs to be determined empirically.
(Xu et al., 2002)
In order to decrease the depth of the pool, the water flow from the dam should be divided into
multiple jets. These jets should also be dispersed enough before entering the plunge pool. However,
the influence of aeration of the jets on the pressure of the plunge pool floor is small. By optimizing
the distance between the jets, a dynamic water cushion can be formed by the upstream jet under
the downstream jet. This may decrease the impact force on the plunge pool floor. (Xu et al., 2002)
Gao (1999) states that the method to increase the energy dissipation ratio and to reduce the impact
on the plunge pool floor is to increase the area of the shear region by dividing the flow into
dispersed jets and to increase the water depth in the plunge pool.
Since the water body between the dam and the jet entry location is very stable and contribute little
to the energy dissipation, this stretch of water should not be too long so the plunge pool length can
be decreased (Xu et al., 2002). Khatsuria (2004) states that a plunge pool should include a length
where the effect of the impinging jets are nullified or greatly reduced. This length is approximately
one third of the water cushion depth downstream of the jet striking point.
To determine the width of the plunge pool a study of a hydraulic model is required. It may be as
wide as the dam spillways but is often governed by the space available at the base of the dam. The
orientation of the water jets may be adjusted as well. (Khatsuria, 2004)
The conclusions which Xu et al. (2002) draw to optimize a plunge pool are:
1. Expand the range of the shear dissipation region by, e.g., dispersing the jets.
2. Reduce the impact intensity in the impact dissipation region by, e.g., forming dynamic water
cushion.
3. Make use of the water body in the mixing dissipation region as much as possible.
3.2.5 Energy dissipation at the Baihetan dam
The characteristics of hydropower stations built in the regions of alpine gorges, such as the Baihetan
dam, are; high water head, large flow and narrow valley. The flood discharge per river-bed width in
these regions range from several times up to some dozen times higher than similar projects in other
countries. (Lian et al., 2009)
Several measures have been taken by the ECIDI to maximize the energy dissipation of the flow from
when it leaves the spillways of the dam to when it leaves the plunge pool and enters the riverbed.
This is made in order to minimize the scouring capacity the flow might have on the downstream
riverbed and to restore the characteristics of the flow to that of before the construction of the
Baihetan dam.

19
A second dam is used to create a plunge pool below the dam, on which the jets from the dam
outlets impinge. This creates a water cushion of predictable depth which prevents scouring in the
plunge pool and enhances energy dissipation.
The water flow through the dam has been divided into 13 jets. The reasons are:
Enlarging the area of which the water flow hits the surface of the plunge pool and by that
increasing the size of the shear region
Enable the jets to hit each other mid-air and therefore creating mid-air energy dissipation
All spillways are angled towards the centre of the plunge pool where the water is the deepest so
that the impact region happens as deep as possible (figure 3.3 and figure 3.6). The different slope
angles (figure 3.4) of the surface spillways have the function of spreading the shear region in the
downstream direction and to contain the impinge point in the deep part of the plunge pool, along its
centre line.
The surface spillways are all expanding according to their expansion angle (figure 3.4) in order to
spread the jet. This makes the jet less concentrated which further increases the shear region and it
enhances the mid-air energy dissipation by making larger parts of the jets collide.
The deep orifices 2 to 6 are all equipped with a ski jump bucket at the outlet which deflects these
jets further downstream than the jets from the surface spillways. Deep orifice 4 has the biggest ski
jump with the ski jumps in 3 & 5 and 4 & 6 progressively smaller. There are three reasons for this:
Making sure that the impinge points of the jets from the deep orifices happen further
downstream than that of the more energy concentrated jets from the surface spillways,
hence enlarging the shear region
Spreading the impinge point of the jets from the deep orifices and therefore enlarging the
shear region
Making sure that mid-air energy dissipation happens by having the jets from the surface
spillway crash into the jets from the deep orifices
By using nappe splitters in some spillways, some parts of a jet will be deflected further downstream
than others parts of the same jet. This increases the shear region and enhances the mid-air energy
dissipation by spreading of the jet.
3.3 Scour and protection measures Hydraulic structures disturb the flow in a channel by constricting the channel and therefore increase
the flow velocity of the water. The flow velocity decelerates during the energy dissipation process
which generates a higher degree of turbulence and therefore a higher scouring capacity. Scouring is
a localised erosion process and bed protection is often constructed in order to decrease the
maximum scour hole and to shift the scour holes that possesses a threat towards the hydraulic
structure. (Hoffmans & Verheij, 1997)

20
3.3.1 Erosion
The forces acting on particles on a riverbed perimeter is gravity, the cohesion force between
particles and the force caused by the flow of water past the particles. Erosion will happen when the
flow generated force acting on a particle is large enough to cause particle movement. Movement of
a particle on a level riverbed will only be caused by water flowing past it. However, a particle resting
on a sloping side of a channel is subject to two forces; the flow generated force, as in the case of the
particle on the level riverbed, and a gravitational force component. The gravitation force tends to
make the particle slide or roll down the slope. It is the magnitude of the resultant of these two
forces that decide whether or not particle movement happen on a sloping part of the riverbed.
(French, 1986)
By definition, the force acting on the particles composing the perimeter of a channel is called the
tractive force. This tractive force is not the force exerted on a single particle, but instead the force
exerted over a certain area of the river perimeter. The tractive force is most often not uniformly
distributed over the channel perimeter. (French, 1986)
3.3.1.1 Erosion in river bends
Outer bends in river bends are particularly vulnerable to erosion and scour due to bend effects. The
bend effect is caused by the interaction by the downstream flow velocity, u, the cross stream flow,
(v, w), and the river bed topography (figure 3.12). Cross stream flow can be divided into two parts
(Roca et al., 2009):
Mainly circulatory motion caused by the
interaction between the centrifugal force
in the outer side of the river bend and
inward pressure gradient induced by the
transversal tilting of the water surface in
the inner side of the river bend
Transversal motion which seem to happen
in shallower parts of the river bend where
important variations in local topography
happens
The downstream velocity is redistributed by the cross stream flow and is increased in the outer parts
and decreased in the inner parts of a river bend. This causes an increased erosion capacity on the
outer bank. Moreover, the cross stream flow transports sediment from the outer to the inner part
of the river bend with significantly increased depth near the outer bank. This process may endanger
the stability of the outer bank. (Roca et al., 2009)
3.3.1.2 Cavitation
When the pressure in a flow, , drops to the pressure of a saturated vapour, , cavitation occurs. It
may be caused by separation of flow, usually of high velocity, along a fixed boundary or of large
pressure fluctuations in highly turbulent flows with low mean pressure. (Novak et al., 2010)
Figure 3.12 Schematic picture of flow velocities in a river bend (Roca et al., 2009)

21
During cavitation, cavities, or bubbles, are being formed in the flow which are filled with saturated
vapour and gases excluded from the fluid because of the severe pressure drop. When these bubbles
are carried downstream and reach a region with a much higher pressure they implode
suddenly. The implosion is accompanied by a violent impact with high pressure of water filling the
imploded cavitation bubble. Cavitation produces instability in the flow with noise, possible vibrations
of structures and most importantly, damage and pitting of surfaces as a result. (Novak et al., 2010)
The peak pressure during the collapse of a cavitation bubble may rise as high as
( times the atmospheric pressure). Such an event only last for a few milliseconds, but can be
repeated in rapid succession. Cavitation’s potential for causing damage to concrete or metal surfaces
is therefore considerable and is known to have caused major damage in large hydroelectric schemes.
(Chadwick & Morfett, 1986) The effect of cavitation has to be taken into account when constructing
a hydraulic structure and prevented whenever possible (Novak et al., 2001).
It is the velocity of the flow, , and the pressure, , that affects the onset of cavitation. Together
with the density, , a variation of the Euler number can be written, called the cavitation number, .
(Novak et al., 2001)
Cavitation occurs when the cavitation number fall below a critical value, . A value of is
sometimes considered when evaluating the critical velocity on “smooth” concrete surfaces. Great
care should be taken when flow velocities approach , even if the surface is “smooth” and
well-constructed as cavitation problems may occur. (Novak et al., 2001)
The presence of dissolved gases or small solid particles in a flow may cause cavitation at higher
pressures than the saturated vapour pressure. It is therefore inadvisable to operate at absolute
pressure heads lower than 3 m in hydraulics structures. (Chadwick & Morfett, 1986)
Although the mean pressure in a flow may be well above the saturated vapour pressure, fluctuating
instantaneous pressure in a turbulent flow can fall below the limit and cause cavitation. This makes
it necessary to analyse the turbulent pressure fluctuations e.g. under the hydraulic jump in a stilling
basin. In order to do that, model or prototype measurements are necessary. Otherwise, the design
of a hydraulic structure has to follow well established principles. (Novak et al., 2001)
3.3.2 Scour downstream of dams
Scour downstream of dams may cause serious damage to the structure and is one of the main
concerns in hydraulic engineering. Hence, accurate prediction of time evolution and ultimate scour is
needed (Bollaert & Schleiss, 2003). Since the phenomenon of scouring is extremely complex almost
all predictions and existing formulae are based on experimental and empirical work (Borghei &
Daemi, 2001).
3.3.2.1 Scour from free falling jets
Even though trajectory buckets are normally used in sites where the river bed consists of sound rock,
scour downstream of these spillways will still occur. Therefore, to guarantee the safety of the
structure, the effect from the scour must be taken into consideration. (Khatsuria, 2004)

22
The process of rock scouring from free falling jets can be divided into six different phases; impact of
aerated jet, shear-layer diffusion in plunge pool, dynamic pressure at the interface between the
water and the rock, hydraulic fracturing of the rock, dynamic uplift of the rock blocks, and finally the
disintegration and transport of them. (Bollaert & Schleiss, 2003)
To estimate potential scour different methods can be used but the most common method is the use
of a hydraulic model. However, it is nearly impossible to fully simulate the process above in a
hydraulic model and therefore the model often consists of a downstream bed with fractioned
material which only makes it possible to simulate a part of the last phase (the transport of the rock
block from the scour hole). This usage of a fully erodible bed to estimate scour results in what is
called the ultimate or maximum scour. (Khatsuria, 2004)
Despite the fact that usage of already fractioned material to simulate scour may lead to an
underestimation of the total scour depth and/or an overestimation of the extension of the scour
hole the results obtained, in terms of ultimate scour, are reasonable. (Bollaert & Schleiss, 2003)
Since the application of empirical formulae is easy and straight forward the use of such formulae is a
very common tool when designing hydraulic structures. By using some general mathematical
techniques (e.g. dimension analysis) model and prototype results can be related to the main
parameters of the formulae. (Bollaert & Schleiss, 2003)
However, the accuracy of different formulae differs substantially, depending on whether a model or
a prototype is used as input. Bollaert and Schleiss (2003) claims that this shows that, besides the
difficulty to simulate true geomechanic aspects in a laboratory, substantial scale effects may affect
the empirical formulae.
In an idealized situation the scour is expected to be confined to the area where the jets hit the river
bed, but prototype experience from a number of projects has showed that there is a possibility for
the scour to work its way back upstream towards the toe of the dam and consequently endangering
the stability of the whole structure. (Khatsuria, 2004)
Jansen (1988) also states that back-flow currents and eddies from the impact area can produce
damaging scour at hydraulic structures. However, these back-flow currents and eddies can be
reduced to an acceptable level with the help of a plunge pool that provides adequate energy
dissipation (Jansen, 1988).
Furthermore Khatsuria (2004) states that small amounts of entrained air can increase the minimum
velocity for which the jets initiate motion of the material in the river bed, hence reducing the scour
depth. Also, since scour progresses very rapidly, time can be ignored as a parameter.
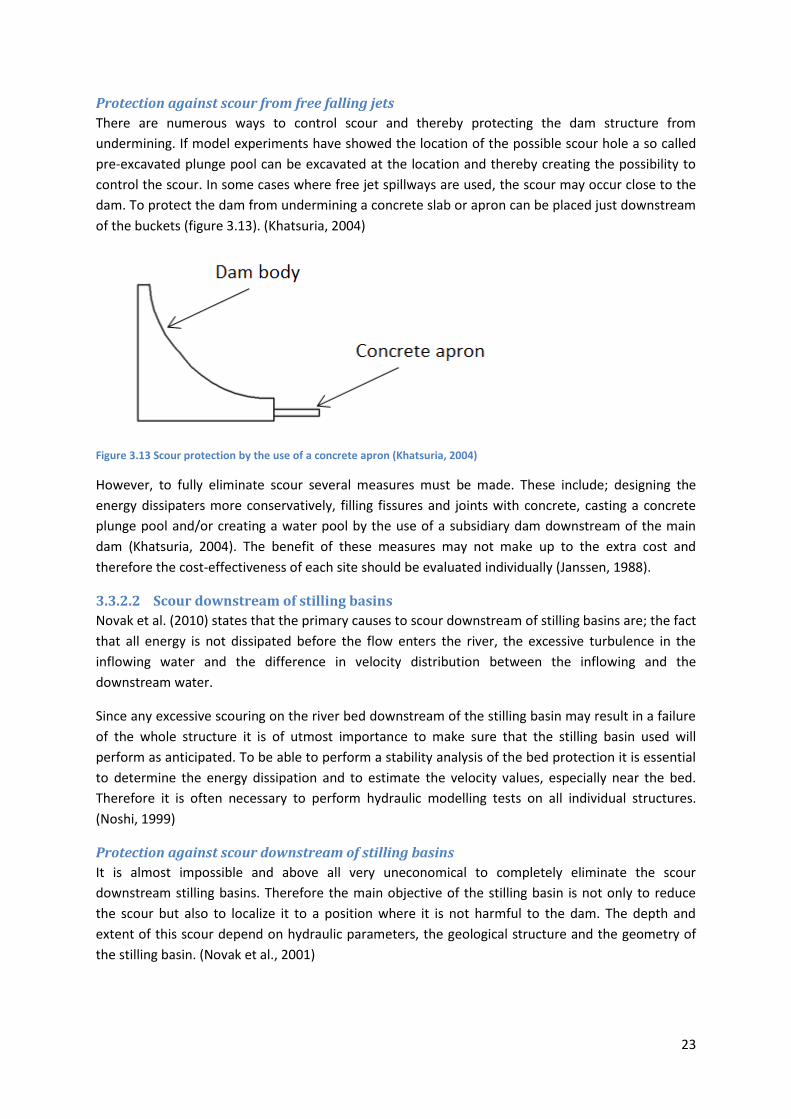
23
Protection against scour from free falling jets
There are numerous ways to control scour and thereby protecting the dam structure from
undermining. If model experiments have showed the location of the possible scour hole a so called
pre-excavated plunge pool can be excavated at the location and thereby creating the possibility to
control the scour. In some cases where free jet spillways are used, the scour may occur close to the
dam. To protect the dam from undermining a concrete slab or apron can be placed just downstream
of the buckets (figure 3.13). (Khatsuria, 2004)
Figure 3.13 Scour protection by the use of a concrete apron (Khatsuria, 2004)
However, to fully eliminate scour several measures must be made. These include; designing the
energy dissipaters more conservatively, filling fissures and joints with concrete, casting a concrete
plunge pool and/or creating a water pool by the use of a subsidiary dam downstream of the main
dam (Khatsuria, 2004). The benefit of these measures may not make up to the extra cost and
therefore the cost-effectiveness of each site should be evaluated individually (Janssen, 1988).
3.3.2.2 Scour downstream of stilling basins
Novak et al. (2010) states that the primary causes to scour downstream of stilling basins are; the fact
that all energy is not dissipated before the flow enters the river, the excessive turbulence in the
inflowing water and the difference in velocity distribution between the inflowing and the
downstream water.
Since any excessive scouring on the river bed downstream of the stilling basin may result in a failure
of the whole structure it is of utmost importance to make sure that the stilling basin used will
perform as anticipated. To be able to perform a stability analysis of the bed protection it is essential
to determine the energy dissipation and to estimate the velocity values, especially near the bed.
Therefore it is often necessary to perform hydraulic modelling tests on all individual structures.
(Noshi, 1999)
Protection against scour downstream of stilling basins
It is almost impossible and above all very uneconomical to completely eliminate the scour
downstream stilling basins. Therefore the main objective of the stilling basin is not only to reduce
the scour but also to localize it to a position where it is not harmful to the dam. The depth and
extent of this scour depend on hydraulic parameters, the geological structure and the geometry of
the stilling basin. (Novak et al., 2001)

24
3.3.3 Scour protection at the Baihetan dam
The ECIDI have made several scour protection measures at the Baihetan dam. To resist the scour at
the toe of the dam which, if left uncontrolled, could endanger the stability of the whole structure a
pre-excavated 410 m long3 concrete plunge pool will be constructed.
At the end of the plunge pool a second dam will be constructed. This dam will create an artificial
water pool which will lead to a decreased hydrodynamic pressure at the interface between the
water and the concrete, hence decreasing the scour.
By the use of hydraulic modeling experiments, the optimal design of the energy dissipaters can be
found. An optimal use of the energy dissipaters will minimize the hydrodynamic pressure on the
concrete slab and hence reducing the scour. All in all, the ECIDI argues that a combination of these
measures will fully eliminate the scour at the toe of the dam.
To control the scour and erosion potential in the river downstream of the second dam velocity
measurements are made both in the plunge pool and in the river. These velocity measurements also
tell if cavitation is likely to happen in the prototype which may damage the concrete slab (section
3.3.1.2). According to the ECIDI, a flow velocity of 7.5 ms-1 downstream of the second dam is
acceptable but local maxima of up to 10 ms-1 can be tolerable.
3.4 Hydraulic modelling Experiments have been used as a way to solve hydraulic problems for a long time, but it was not
until the second half of the 19th century that the idea of using scale models evolved and gradually
became the basis of solving hydraulic problems. The development of mathematical techniques and
computing ability since about 1960 have led to a change in, but not necessarily diminished the use of
hydraulic modelling when solving these problems. The reason to why hydraulic modelling has not
become obsolete lies in the continuous development of hydraulic structures including increased size
and new complex geometry that defies mathematical solutions. (Novak et al., 2001)
Model studies always precede the construction of a significant hydraulic structure and studies of a
river and dam model are conducted for any one or more of the following purposes (Houghtalen et
al., 2010):
Determine the discharge coefficient of a large measurement structure, i.e. an overflow
spillway or a weir
Develop an effective energy dissipation method at the outlet of a hydraulic structure
Reduce energy loss at an intake structure or transition section
Develop an efficient, economic spillway
Investigate the pattern a flood wave travels through a river channel
Establish the effects of artificial structures such as bends, levees, dikes, jetties and training
walls have on the sedimentation movements in the channel reaches as well as the impact on
the upstream and downstream reaches of the channel
3 This value has been adjusted due to classification issues

25
A scale model in hydraulic engineering simulates the direct physical phenomena usually in the same
medium as in the prototype. The model operates according to certain scaling laws, which are
conditions that must be fulfilled to achieve the desired similarity between prototype and model. It is
the scale factor that describes the ratio between a variable in the model and the corresponding
variable in the prototype. (Novak et al., 2001)
3.4.1 Scale theory
To decide the relationship between the model and prototype variables, the type of flow must be
decided and a dimensionless group is then used. Examples of widely used dimensionless groups are
(Douglas et al., 2005):
Reynolds number, ratio of inertia and viscous forces
Froude number, ratio of inertia and gravitational forces
Mach number, ratio of fluid velocity to the local sonic velocity
In the case of free surface flow, which is investigated in this thesis, the gravitational effects governs
the flow and to achieve dynamic similarity the Froude number has to remain constant (Douglas et
al., 2005). The relation between the prototype, p, and model, m, using the scale factor λ can be seen
in table 3.6:
Physical unit Relation Unit
Length [m]
Volume [m3]
Time [s]
Velocity [ms-1]
Pressure λ [Nm-2]
Discharge λ [m3s-1]
Force λ [N]
Reynolds number λ [-] Table 3.6 Scale relationship with Froude number similarity (Novak et al., 2001)
3.4.2 Scale effects
When choosing a suitable scale for a model, problems occur. A model with reasonable depth might
result in a model too large to be practical but by choosing a model size depending on the restrictions
of area and cost might result in channel depths that are too small. With channel depths too shallow,
two problems arise (Douglas et al., 2005):
Accuracy in level and level change measurements is impossible to achieve
Surface roughness of the channel bed would be impractically small and the flow might
become laminar instead of turbulent as normally found in practice
To solve this, a distorted scale with a vertical scale of 1:100 and larger and a horizontal scale
between 1:200 and 1:500 is used. (Douglas et al., 2005)

26
The flow at hydraulic structures is usually three dimensional. Hence, the vertical accelerations
cannot be neglected. Distortion of the velocity distribution is therefore not acceptable and
undistorted models are the norm. (Novak et al., 2010)
Even a geometrically similar model almost inevitably has some sort of scale distortion and/or some
scale effects on the flow. As an example, in a model of a spillway with a jet, the jet will get less air
entrainment than the prototype and therefore less air resistance which will result in a longer
distance from the spillway to the impact on the river bed downstream. In the prototype, the scour
will take place closer to the dam and have other effects than in the model. The modeller has to be
aware of these effects and then decide whether the model result enhances or reduces the safety of
the prototype structure. (Novak et al., 2001)
It is also possible, due to scale effects that a very “smooth” model spillway is too rough for a correct
representation of friction losses in the flow when passing the spillway. This may result in lower
spillway outlet velocities of the jet in the model than it would be in the prototype. However, since
the spillway length of a ski jump bucket is small, the friction losses can be neglected. (Novak et al.,
2010)
Novak et al. (2001) states that the main scale effects are model roughness and model approach
conditions associated with turbulent boundary layer development, cavitation and surface tension
effects and associated aeration and vortex-formation problems. Not all of these scale effects can be
overcome, but with a high enough Reynolds number some of them can at least be minimized (Novak
et al., 2001).
Models generally have a Reynolds number large enough to be operating out of dependence of this
number. If the model is too small, and Froude number equivalence is set up, the Reynolds number
will be small enough to produce viscous effects not representative of the prototype. (Douglas et al.,
2005) Novak et al. (2010) states that a minimal Reynolds number of 105 is required in the model
spillway to eliminate or at least minimize scale effects regarding energy dissipation. These scale
effects will include degree of turbulence and effect of aeration and friction.
In open channel flow, the Reynolds number in the model should be above 103.5-104.5 to avoid scale
effects (Novak et al., 2001). The model should also have a water depth exceeding 0.03 m to avoid
surface tension effects (Novak et al., 2010).
Cavitation can sometimes not occur in a model when it would in prototype. This is due to the
ambient atmospheric pressure that has not been reduced to the model scale. Pressure
measurements can however indicate if this is likely to happen in a prototype. As an example, if a
negative pressure value is measured in a model, which when scaled up to a prototype value is less
than or equal to a pressure of 0 m H2O, one can be sure that cavitation would occur. The reason for
this is that cavitation will take place in reality when (section 3.3.1.2), and m H2O for
normal water temperatures. Another way to investigate the behaviour of cavitation in a model is to
place it in a cavitation tunnel where the ambient pressure can be controlled and reduced. (Novak et
al., 2001)

27
3.4.3 Scale effects at the Baihetan dam
Since the model of the Beihetan dam at Tsinghua University has the scale of 1:100, λ will be equal to
100 (table 3.6).
The assumptions made at the Department of Hydraulic Engineering at Tsinghua University are:
The roughness of the plexiglas in the model will represent the roughness of the concrete in
the prototype due to scaling
Air entrainment effects is neglected
Friction effects are neglected
These assumptions can be made when the Reynolds number in the model is higher than the
recommended value of 105 (section 3.4.2). To show that these assumptions are justified, the model’s
Reynolds number will be calculated at three places; at the inlet of the surface spillways, at the inlet
of the deep orifices and over the second dam.
The data in the calculations below have been adjusted according to the wishes of the ECIDI due to
classification issues. However, the results in this section can still be used since it does not differ
much from results obtained when using the real data.
The Reynolds number is expressed as (Appelqvist & Loyd, 1979):
[1]
is the kinematic viscosity ( m2s-1 for water at room temperature), is the characteristic
velocity, often taken as the average flow velocity and is the characteristic length. In an open
channel, the characteristic length is equal to the hydraulic radius , which is the ratio of the flow
area to the wetted perimeter. For a rectangular channel with flow depth and width , the
hydraulic radius will be (French, 1986):
[2]
In a flow through a rectangular duct with width and height , where there is no water surface, the
characteristic length is also equal to the hydraulic radius, which in this case is the following
(Featherstone & Nalluri, 1995):
[3]
The inlet dimensions, area and hydraulic radius for the surface spillways and deep orifices can be
seen in table 3.7:
Outlet Height [m] Width [m] Area (A=hw) [m2] Rduct [m]
Surface spillway 14.0 15.0 210.0 14.5
Deep orifice 15.0 5.8 87.0 8.4
Table 3.7 Hydraulic radius and inlet dimensions of surface spillways and deep orifices
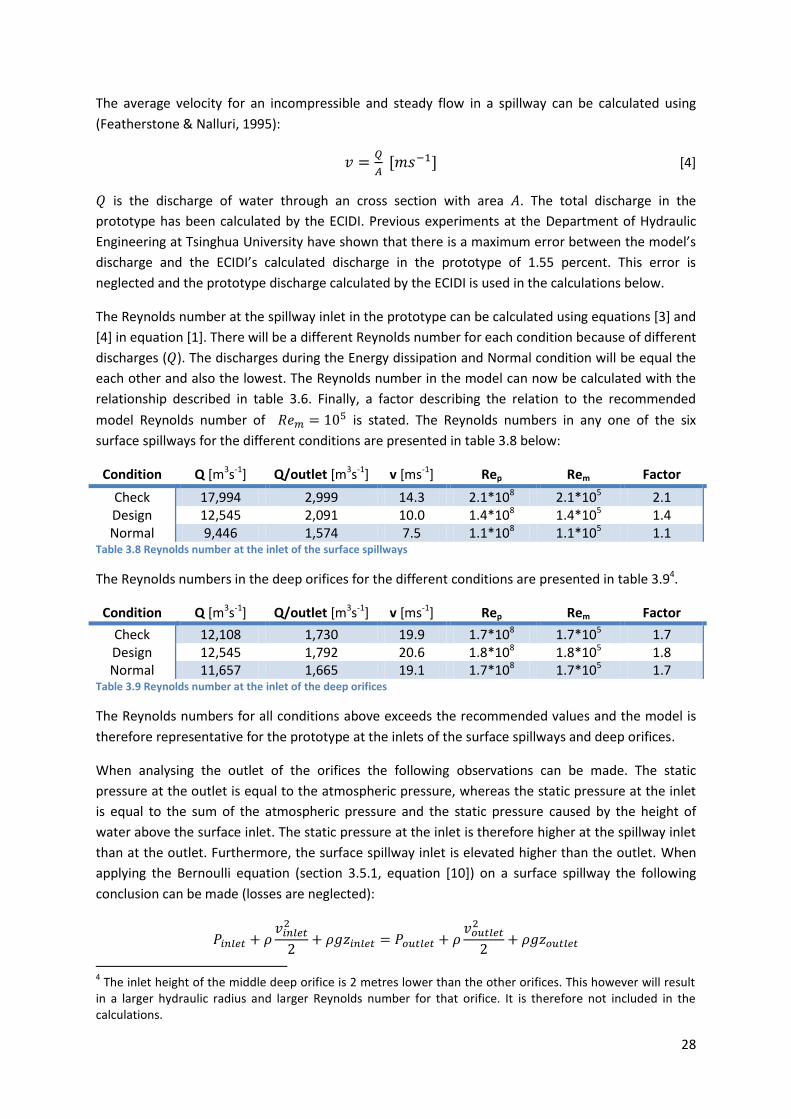
28
The average velocity for an incompressible and steady flow in a spillway can be calculated using
(Featherstone & Nalluri, 1995):
[4]
is the discharge of water through an cross section with area . The total discharge in the
prototype has been calculated by the ECIDI. Previous experiments at the Department of Hydraulic
Engineering at Tsinghua University have shown that there is a maximum error between the model’s
discharge and the ECIDI’s calculated discharge in the prototype of 1.55 percent. This error is
neglected and the prototype discharge calculated by the ECIDI is used in the calculations below.
The Reynolds number at the spillway inlet in the prototype can be calculated using equations [3] and
[4] in equation [1]. There will be a different Reynolds number for each condition because of different
discharges ( ). The discharges during the Energy dissipation and Normal condition will be equal the
each other and also the lowest. The Reynolds number in the model can now be calculated with the
relationship described in table 3.6. Finally, a factor describing the relation to the recommended
model Reynolds number of is stated. The Reynolds numbers in any one of the six
surface spillways for the different conditions are presented in table 3.8 below:
Condition Q [m3s-1] Q/outlet [m3s-1] v [ms-1] Rep Rem Factor
Check 17,994 2,999 14.3 2.1*108 2.1*105 2.1 Design 12,545 2,091 10.0 1.4*108 1.4*105 1.4 Normal 9,446 1,574 7.5 1.1*108 1.1*105 1.1
Table 3.8 Reynolds number at the inlet of the surface spillways
The Reynolds numbers in the deep orifices for the different conditions are presented in table 3.94.
Condition Q [m3s-1] Q/outlet [m3s-1] v [ms-1] Rep Rem Factor
Check 12,108 1,730 19.9 1.7*108 1.7*105 1.7 Design 12,545 1,792 20.6 1.8*108 1.8*105 1.8 Normal 11,657 1,665 19.1 1.7*108 1.7*105 1.7
Table 3.9 Reynolds number at the inlet of the deep orifices
The Reynolds numbers for all conditions above exceeds the recommended values and the model is
therefore representative for the prototype at the inlets of the surface spillways and deep orifices.
When analysing the outlet of the orifices the following observations can be made. The static
pressure at the outlet is equal to the atmospheric pressure, whereas the static pressure at the inlet
is equal to the sum of the atmospheric pressure and the static pressure caused by the height of
water above the surface inlet. The static pressure at the inlet is therefore higher at the spillway inlet
than at the outlet. Furthermore, the surface spillway inlet is elevated higher than the outlet. When
applying the Bernoulli equation (section 3.5.1, equation [10]) on a surface spillway the following
conclusion can be made (losses are neglected):
4 The inlet height of the middle deep orifice is 2 metres lower than the other orifices. This however will result
in a larger hydraulic radius and larger Reynolds number for that orifice. It is therefore not included in the calculations.

29
The velocity is greater at the surface spillway outlet than at the inlet, resulting in an even greater
Reynolds number and therefore less influence of scale effects.
When calculating the Reynolds number at the second dam, only the conditions where there is a
smooth overflow over the second dam will be considered (section 3.5.2). When there is a distinct fall
of water over the second dam the flow is assumed to be more turbulent and will therefore have a
higher Reynolds number.
The flow over the second dam is an open channel flow and assumed to be in a rectangular channel.
When calculating the water depth ( ) over the second dam, the difference between the tailwater
level5 and the height of the second dam will be used. The tailwater level will vary depending on the
discharge and the height of the second dam is 612 masl. The hydraulic radius for the different
discharge conditions can be seen in table 3.10 by using equation [2] where the width of the second
dam ( ) is 159 m.
Condition Tailwater level [m] Water depth [m] Area [m2] Hydraulic radius [m]
Check 637 25 3,975 19.0 Design 633 21 3,339 16.6
Energy diss.6 630 18 2,862 14.8 Normal 625 13 2,067 11.2
Table 3.10 Hydraulic radius over the second dam during the check, design, energy dissipation and normal condition
The Reynolds number can now be calculated using equation [4] in equation [1] and is presented in
table 3.11 below. Since it is an open channel flow, the factor is relative a minimum Reynolds number
of 104.5 (section 3.4.2).
Condition Q [m3s-1] v [ms-1] Rep Rem Factor
Check 30,102 7.6 1.44*108 1.44*105 4.6 Design 24,378 7.3 1.21*108 1.21*105 3.8
Energy diss. 21,103 7.4 1.09*108 1.09*105 3.4 Normal 21,103 10.2 1.14*108 1.14*105 3.6
Table 3.11 Reynolds number over the second dam during the check, design, energy dissipation and normal condition
The result from table 3.11 show that the model’s Reynolds number is well above the minimum
required Reynolds number and that the water depth (y) in the model is above the required 0.03 m to
avoid surface tension effects. This part of the model is therefore also representative for the
prototype.
After investigating these three critical points, the whole model is assumed to be representative of
the prototype and the results obtained from experiments conducted in the model are considered
valid.
5 The water level far downstream of the second dam
6 See section 4.2

30
3.5 Physical theory In this section, the physical theory that is necessary to evaluate the experiment results will be
presented. The basic formulas and how they are used in practise at the Department of Hydraulic
Engineering at Tsinghua University will be explained.
3.5.1 Equations and units
Physical unit Description Unit
X,Y,Z External forces in x, y and z direction N
u,v,w Fluid velocity in x, y and z direction ms-1
Density kgm--3
Dynamic viscosity Nsm-2
Shear stress Nm-2
g Gravitational acceleration ms-2
P Pressure Nm-2
z Elevation above a datum line m
V,v Velocity ms-1
Table 3.12 Physical units used
Navier-Stokes equations describe how a small element moves in a fluid. They derive from Newton’s
law of motion, (Appelqvist & Loyd, 1979):
(
)
[5]
(
)
[6]
(
)
[7]
Equation [5], [6], and [7] apply for incompressible Newtonian fluids, which mean that they obey the
linear relationship
(Featherstone & Nalluri, 1995).
Chanson (2004) describes the steps that lead to the Bernoulli equation. With the assumption of a
steady, frictionless and incompressible flow, the Navier-Stokes equation along a streamline
becomes:
[8]
Where is the velocity along a streamline and is the direction along it. A streamline is an imaginary
line in a fluid that is everywhere a tangent to the velocity vector. Eq. [8] can be expressed as
(Chanson, 2004):
(
) [9]

31
This equation integrated along a streamline becomes the Bernoulli equation (Chanson, 2004):
[10]
Featherstone and Nalluri (1995) apply the Bernoulli equation on a real incompressible flow,
accounting for friction losses and velocity distribution within the flow. The extended Bernoulli
equation along a streamline becomes:
[11]
is the kinetic energy correction factor. It is used because the velocity in a real flow (figure 3.14 b)
differs from the mean velocity used in a frictionless flow (figure 3.14 a). The factor , also known as
the Coriolis coefficient is expressed as
(
) and usually lies between 1.03 and 1.3 for
turbulent flows. A is the cross sectional area through which the flow pass. (Featherstone & Nalluri,
1995)
Figure 3.14 Flow velocity distribution: a) Frictionless flow b) Real flow (Featherstone & Nalluri, 1995)
Eq. [11] can be expressed in metres when divided by , which is the so called hydraulic head:
[12]
The term
represents the work done by pushing a body of fluid by fluid pressure and is called
pressure head. The term
is the kinetic energy of the fluid and is the potential energy. These
terms are called kinetic and potential head respectively. (Featherstone & Nalluri, 1995)
3.5.2 Pressure calculations on the Baihetan plunge pool floor
The following assumptions are made at the Department of Hydraulic Engineering at Tsinghua
University for the pressure measurements at the bottom of the plunge pool of the Baihetan dam.
The pressure head at a point at the bottom of the plunge pool is:
[13]

32
The first part of Eq. [13],
is assumed to be constant at all points. Where decreases,
will
increase by the same amount and the sum of the two terms can be seen as the depth of the water,
and is called water cushion (figure 3.15).
Figure 3.15 Schematic figure of the Baihetan plunge pool
To measure the total pressure head, , piezometric tubes were attached to the bottom of the
plunge pool (section 4.2.1). Both and
are known, so the shock pressure,
can be calculated
using:
(
) [14]
This pressure is caused by the jets crashing in the plunge pool from the dam. The fluid velocity at the
inlet of the piezometric tube is in fact really complex and move in different directions at different
velocities. The velocity in the expression for the kinetic head, , is the average velocity at the
measuring point perpendicular to the surface (figure 3.16).
Figure 3.16 Schematic figure of the left bottom side of Baihetan plunge pool

33
The total value of can be acquired from a reading on the piezometric tubes. The value of
in
the plunge pool differs according to the experiment condition and is directly dependant of the water
level. There are two different scenarios:
1.
is equal to the tailwater depth when there is a smooth overflow from the second dam
into the river (figure 3.17). The tailwater depth is measured 13.2 metres downstream of the
dam which corresponds to 1,320 metres at the actual dam site.
2. When the tailwater depth is lower than the height of the second dam, measured from the
riverbed bottom, there is a distinct fall of water over the second dam (figure 3.18). In this
scenario,
is equal to the water depth in the plunge pool, measured 3.7 m from the
dam. This value corresponds to a length of 370 metres in reality.
It is the magnitude of the discharge that influence whether scenario 1 or scenario 2 above is used.
When all spillways in the dam are open and there is a large discharge (see table 4.1) scenario 1 is
used. That is because the run-off in the downstream river is not great enough to make the tailwater
level much lower than the plunge pool water level (figure 3.17). The tailwater level is somewhat
lower than the plunge pool water level. However, this will result in a safety margin of the
experiment since the water cushion used in the calculations is actually smaller than the real water
cushion. Furthermore, waves that form in the plunge pool due to the jets will subside before they
reach the point, 1,320 m from the dam, where the tailwater level is measured, and will therefore not
affect the result.
Figure 3.17 Scenario 1: Smooth overflow over the second dam
When the discharge from the dam is lower than the run-off capacity in the downstream river the
tailwater level declines. But the water level in the plunge pool will be above the tailwater level
because of the water flow being constricted over the second dam (figure 3.18).
Figure 3.18 Scenario 2: Distinct fall of water over the second dam

34
4 Experiments This chapter explains the method used when conducting the pressure and flow velocity experiments
relevant to this thesis. The reference system will be presented, followed by the pressure experiments
setup and finally the setup of the flow velocity experiments. The data in this chapter regarding the
dam has been altered due to classification issues of the ECIDI.
4.1 Reference system During both the pressure and flow velocity experiments the same reference system, based on a
three dimensional left-handed coordinate system with a horizontal X-Y plane and a vertical X-Z plane
(figure 4.1), was used. In this reference system the X-axis shows the perpendicular distance from the
plunge pool centre line, positive direction to the left when facing downstream. The Y-axis gives the
distance along the centre line from the dam body and the Z-axis shows the vertical distance from its
zero point at the plunge pool floor.
When referring to elevation above sea level one should keep in mind that the plunge pool (and
hence the zero point of the Z-axis) is elevated 566 masl.
Also notable is that the plunge pool profile is not symmetrical. The left side when facing downstream
has a much gentler slope than the right side, as seen in figure 4.1.
Figure 4.1 Reference system used in the Baihetan plunge pool

35
4.2 Pressure experiments The pressure measurement experiments were conducted in order to investigate how the discharge
from the dam affects the pressure on the plunge pool floor. To further investigate how to minimize
the pressure on the plunge pool floor alterations on the model’s spillways were made. In three
different experiments nappe splitters (figure 3.5.3) were inserted in some of the surface spillways to
deflect parts of the jet.
The three experiments were carried out with different nappe splitter setups as seen in figure 4.2.
The first experiment had one nappe splitter in surface spillway 1 and two nappe splitters in surface
spillways 3 and 4 (figure 4.2.1). With this setup, ten conditions according to table 4.1 were
investigated. These conditions have been calculated by the ECIDI and represent the river’s real water
level when the Baihetan dam is in operation. The ECIDI also designed the nappe splitter setups used
at the different experiments. Experiment 2 was conducted using two nappe splitters in the surface
spillways 3 and 4 (figure 4.2.2) whilst in experiment 3 all nappe splitters were removed (figure 4.2.3).
Figure 4.2 Different nappe splitter setup in surface spillways during experiment 1-3
Condition Reservoir water level [masl]
Tailwater level [masl]
Outlets open Discharge surface spillway [m3s-1]
Discharge deep orifices [m3s-1]
Check 842 642 6 surface+7 deep 17,994 12,108
Design 838 638 6 surface+7 deep 12,545 11,833
Energy diss. 835 635 6 surface+7 deep 9,446 11,657
Normal 835 629 6 surface+7 deep 9,446 11,657
Deep - 620 7 deep 0 11,657
Surface - 618 6 surface 9,446 0
1+6 - 609 2 surface (1+6) 3,149 0
2+5 - 609 2 surface (2+5) 3,149 0
3+4 - 609 2 surface (3+4) 3,149 0
1+3+5 - 612 3 surface (1+3+5) 4,723 0 Table 4.1 Water level and orifice setup during different conditions

36
Experiment 2 and 3 were conducted with a lower tailwater depth according to table 4.2. The new
values of the tailwater level were given by ECIDI when new calculations showed that the
downstream water level would be lower than expected.
Condition Reservoir water level [masl]
Tailwater level [masl]
Outlets open Discharge surface spillway [m3s-1]
Discharge deep orifices [m3s-1]
Check 842 637 6 surface+7 deep 17,994 12,108
Design 838 633 6 surface+7 deep 12,545 11,833
Energy diss. 835 630 6 surface+7 deep 9,446 11,657
Normal 835 625 6 surface+7 deep 9,446 11,657
Deep - 614 7 deep 0 11,657
Surface - 611 6 surface 9,446 0
1+6 - 602 2 surface (1+6) 3,149 0
2+5 - 602 2 surface (2+5) 3,149 0
3+4 - 602 2 surface (3+4) 3,149 0
1+3+5 - 602 3 surface (1+3+5) 4,723 0 Table 4.2 Conditions for experiment 2 and 3
The ten different conditions in table 4.1 and table 4.2 are:
Check, Design and Normal condition as described in section 3.1.2 with all dam outlets open
Energy dissipation condition, which is the Normal condition but with a larger tailwater
depth which causes a larger water cushion in the plunge pool. The reason for the larger
tailwater depth is explained in section 4.3.3.
Deep condition in which the surface spillways are closed but all seven deep orifices are open
(figure 3.2)
Surface condition in which the deep orifices are closed but all six surface spillways are open
(figure 3.2)
1+6 condition in which only the surface spillways 1 & 6 are open (figure 3.3)
2+5 condition in which only the surface spillways 2 & 5 are open (figure 3.3)
3+4 condition in which only the surface spillways 3 & 4 are open (figure 3.3)
1+3+5 condition in which only the surface spillways 1, 3 & 5 are open (figure 3.3)
These ten conditions have been decided by the ECIDI and are investigated since they represent
typical conditions that will occur in the prototype when it has been built. Pictures of the model
during the different conditions are presented in Appendix A.
Two pumps were used to transport the water to the upstream reservoir and by changing their
effective output the reservoir water level could be adjusted to the desired condition. A measuring
device was attached to the reservoir bank so that the water level could be determined. To obtain the
desired tailwater level that occurs in the real river at different water flows, a control dam far
downstream was used. The opening of the control dam was adjusted to increase or decrease the
flow through it and hence regulating the tailwater level so it matched a marking on the model’s bank
which indicates the water level.

37
4.2.1 Hydrodynamic pressure measurements
To measure the hydrodynamic pressure on the plunge pool floor caused by the water crashing in the
plunge pool from the dam, piezometric tubes were used. These tubes were attached to the bottom
of the plunge pool (figure 4.3 Left). The other ends of the tubes were attached vertically to a gridded
board so the water level in the tubes could be read (figure 4.3 Right).
Figure 4.3 Left: Piezometric tube-setup below the plunge pool, Right: Piezometric tubes on a gridded board
The location of the measuring points on the plunge pool floor of the model can be seen in figure 4.4.
The first measuring points were located 100 centimetres downstream of the dam and from that
point on up to 200 centimetres there were 11 measuring points every 10 centimetres. There is one
measuring point along the plunge pool centre line and five measuring points placed on each side of
it.
The reason for the high concentration of measuring points is because it is within this region the jets
impinge with the plunge pool and therefore where the pressure will peak.
At 210 centimetres downstream of the dam up to 350 centimetres there are only five measuring
points at each 10 centimetres interval. There are also additional measuring points upstream,
downstream and on the second dam with the last measuring point 430 centimetres downstream of
the dam. The denotation of a specific measuring point’s position is (X, Y).

38
Figure 4.4 Arrangement of piezometric tubes in the Baihetan plunge pool
4.2.2 Depth of water cushion
As previously stated the elevation of the plunge pools lowest point (PPLP) is 566 masl. This point is
used to calculate the depth of the water cushion since it is the total depth of the water that is
relevant when using piezometric tubes. The elevation of the second dam is 612 masl. If the tailwater
depth is greater than the elevation of the second dam (a smooth overflow, see figure 3.17) the
water cushion is calculated by using:
If the tailwater depth is lower than 612 masl and there is not a smooth overflow from the second
dam into the river, the water depth at the position (0,370), which is measured physically, is used
(figure 3.18).
4.2.3 Reading of the piezometric tubes
At each condition seen in table 4.1, photos of the gridded boards were taken to determine the water
level in the piezometric tubes. Six arbitrary photos of the tubes leading to the peak region were
chosen, but for the other measuring points only three photos were used. These photos were loaded
into the computer program AutoCAD, and with the help of a grid the water levels could be
determined (figure 4.5). The water level in all the piezometric tubes was recorded from each photo
and the average water level for each piezometric tube was then calculated by using Microsoft Excel.

39
Figure 4.5 Grid made in AutoCAD
4.3 Flow velocity experiments To evaluate the risk of cavitation in the plunge pool and erosion in the downstream riverbed, flow
velocity measurements were conducted. The flow velocity measurements were conducted using the
nappe splitter setup shown the most favourable from the pressure experiments (section 5.4).
The discharge of the Surface, Deep, 1+6, 2+5, 3+4 and 1+3+5 conditions is really low compared to
the discharge in the conditions where all surface spillways and deep orifices are open (table 4.1),
hence the flow velocity in the plunge pool will be severely lower. Furthermore, the water cushion in
condition Energy dissipation is much larger compared to that of the Normal condition. This means
that the flow velocity at the bottom of the plunge pool will be significantly lower in the first-named
condition. Therefore flow velocity measurements were only carried out during the Check, Design
and Normal conditions.
4.3.1 Velocity meter
The water flow velocity was measured using an electromagnetic current velocity meter (figure 4.6).
By attracting ions from the water the velocity meter creates a potential between its electrodes and
by measuring the voltage of this potential the velocity of the water, which according to Faraday’s
law is proportional to the voltage, can be determined. (Omega Engineering Technical Reference,
2011)
A digital output transmitted from the sensor is then transferred to a PC and by the help of the
computer program WinLabEM the results can be recorded instantaneously. The system has the
possibility to connect up to four different sensors at the same time but in the experiments
performed in this thesis only one single sensor was used (figure 4.6).

40
Figure 4.6 The electromagnetic current velocity sensor used in the experiments
4.3.2 Plunge pool measurements
Since the flow velocities in the plunge pool are really complex with fluctuating velocities in varying
directions, only the velocity along the plunge pools centre line was measured. The velocity was
measured 2 centimetres above the plunge pool bottom, downstream of where the jets impinge with
the plunge pool surface. That is because it is the velocity along the plunge pool bottom which
indicates whether scour is likely to take place in the plunge pool.
The flow velocity was measured along the centreline every 20 centimetres from the position (0, 200)
to position (0,380). At position (0, 400), which is just above the second dam, the flow velocity was
measured at different depths to get an estimation of the flow velocity distribution (figure 3.14 b))
during the different conditions. The velocity profile over the second dam can indicate if the outflow
from the plunge pool varies over time and whether or not a hydraulic jump (section 3.2.1) is likely to
happen downstream of the second dam.
4.3.3 Measurements downstream of the second dam
In order to investigate the potential erosion along the riverbed flow velocity measurements were
also conducted downstream of the second dam. These measurements were not made along the
centreline but instead close to the riverbed on both the right hand-side and the left hand-side of the
river. The velocity was measured every two metres from the second dam to a point 1,200 cm away
from the dam itself. This means that there were measurement points in the mode at Y=600 cm,
Y=800 cm, Y=1,000 cm and Y=1,200 cm (figure 4.7).
The pier like structures, three on each side, that can be seen at 800 cm ≤ Y ≤ 1,000 cm in figure 4.7 is
a simulation of tunnel outlets that gives the Baihetan dam extra discharge capacity from the water
reservoir to the downstream river without going through the dam. The tunnels are used to increase
discharge during the Check, Design and Energy Dissipation conditions. This is the reason to the
Energy Dissipation condition’s higher tailwater level compared to the Normal condition. There is no
discharge through the tunnels in the model but the structures will affect the flow downstream of the
second dam by their geometry.

41
Figure 4.7 Location of flow velocity measurement points downstream of the second dam
4.3.4 Recording of flow velocity data
The electromagnetic current velocity meter recorded 20 flow velocity values each second in the X-
and Y-direction. These values were, with the help of WinLabEM, transferred to an MS Excel file.
Besides recording the flow velocity values of the X- and Y-directions WinLabEM also calculated the
resultant of the two vectors, XY (figure 4.8). The average velocity for each second was calculated and
then presented in a diagram for each measuring point. Since the flow velocity in the plunge pool is
larger than the downstream flow velocity and fluctuates greatly, 20 seconds was chosen as the
sampling time. The flow velocity downstream of the second dam is smaller and does not fluctuate as
much as the plunge pool flow velocity and a sampling time of 10 seconds was therefore chosen.
Figure 4.8 The X- and Y-vectors and their resultant XY

42
5 Pressure experiments In this chapter the results from the pressure experiments are presented and analysed in order
evaluate the impact on the plunge pool floor and to decide which nappe splitter setup that is the
most favourable.
5.1 Results of the pressure experiments The results of the pressure measurements in the plunge pool and on the second dam for the
different conditions are presented below. The pressure on the second dam is only measured along
the centre line. There is a shaded region in the tables that present where the maximum shock
pressure take place in the plunge pool. This region shows the conditions in which the tailwater level
is used to calculate the water cushion depth. For the other conditions, the water depth at position
(0, 370) is used.
The measured pressure is presented in metres H2O. The reader should therefore keep in mind that a
head of 1 metre H2O corresponds to a pressure of roughly 9.8 kNm-2. All values are presented as
prototype values and scaled up using the scale relationships described in table 3.6.
The values presented below are the peak pressure values for the different conditions. All values
from the different experiments are presented in Appendix B.
5.1.1 Experiment 1 – Plunge pool
The nappe splitter setup shown in figure figure 4.2.1 was used in Experiment 1.
Condition X [m] Y [m] Total head [m H2O]
Water cushion [m H2O]
Shock pressure [m H2O]
Check 50 180 80.67 76.47 4.20
Design -30 190 73.73 72.33 1.40
Normal -30 190 64.47 63.47 1.00
Energy diss. -20 360 68.10 68.78 -0.68
Surface -10 130 58.07 51.52 6.55
Deep 40 260 54.30 54.00 0.30
1+6 50 120 62.60 51.00 11.60
2+5 0 360 51.50 51.00 0.50
3+4 40 360 51.37 51.00 0.37 1+3+5 50 130 64.60 52.00 12.60
Table 5.1 Maximum pressure in the plunge pool (experiment 1)

43
Table 5.1 present where the maximum pressure occurs in the plunge pool during the different
conditions. The following observations can be made:
During the Check, Design and Normal conditions, the maximum pressure occurs 180-190 m
from the dam
During condition Surface, 1+6 and 1+3+5 the maximum pressure occurs closer to the dam at
120-130 m, compared to the first four conditions
The Surface condition’s shock pressure value is more than six times greater than that of the
Normal condition
Maximum pressure occurs very far downstream of the dam for the other conditions
Condition 1+6 and 1+3+5 exerts the maximum shock pressure on the plunge pool at the
edge of the measurement area (X=50 m)
The shock pressure is negative for the Energy dissipation condition
5.1.2 Experiment 1 – Second dam
Table 5.2 presents the maximum pressure at the second dam.
Condition Y [m] Total head [m H2O]
Water cushion [m H2O]
Shock pressure [m H2O]
Check 420 77.67 76.47 1.20
Design 400 73.77 72.33 1.44
Normal 410 65.83 63.47 2.36
Energy diss. 420 71.13 68.74 2.39
Surface 380 56.50 51.52 4.98
Deep 380 55.30 54.00 1.30 1+6 380 51.33 51.00 0.33
2+5 380 51.50 51.00 0.50
3+4 380 51.40 51.00 0.40
1+3+5 380 52.23 52.00 0.23
Table 5.2 Maximum pressure on the second dam (experiment 1)
For the Check, Design, Normal and Energy dissipation conditions the maximum pressure
happens after the second dam
The highest pressure occurs at the Surface condition
For all the conditions using the water cushion depth at position (0, 370) the maximum
pressure occurs at the upstream side of the second dam
All the last four conditions have a low shock pressure compared to the other conditions

44
5.1.3 Experiment 2 – Plunge pool
Experiment 2 used the nappe splitter setup in figure figure 4.2.2. The difference in tailwater depth
for the ten conditions compared to experiment 1 is presented in table 5.3.
Condition Tailwater level experiment 1 [masl]
Tailwater level experiment 2 & 3 [masl]
Difference [m]
Check 642 637 5
Design 638 633 5
Normal 629 624 5
Energy diss. 635 630 5
Surface 618 611 7
Deep 620 614 6
1+6, 2+5, 3+4 609 602 7
1+3+5 612 602 10
Table 5.3 Difference in tailwater level between experiment 1 and experiment 2 & 3
Table 5.4 presents the maximum pressure in the plunge pool in experiment 2:
Condition X [m] Y [m] Total head [m H2O]
Water cushion [m H2O]
Shock pressure [m H2O]
Check 40 180 83.18 71.41 11.77
Design 40 180 76.70 67.45 9.25
Normal 50 180 64.83 58.51 6.32
Energy diss. 50 180 70.12 63.82 6.30
Surface -10 130 60.40 57.30 3.10
Deep 0 360 53.40 48.16 5.24
1+6 40 120 57.63 51.00 6.63
2+5 0 360 51.53 51.00 0.53
3+4 40 360 51.50 51.00 0.50 1+3+5 30 130 56.20 52.00 4.20
Table 5.4 Maximum pressure in the plunge pool (experiment 2)
The noteworthy differences when comparing table 5.4 and table 5.1:
The Check condition exerts the highest maximum shock pressure and it takes place closer to
the centre line compared to the same condition in experiment 1
The maximum shock pressure is higher and takes place closer to the dam for the Design,
Normal and Energy dissipation condition compared to experiment 1
The water cushion for condition Surface is deeper than in experiment 1, but is not measured
compared to the tailwater depth
The maximum shock pressure of the 1+6 and 1+3+5 condition has decreased severely
compared to experiment 1
The Check and Design condition exerts their maximum shock pressure close to the edge of
the measurement area at X=40 m

45
5.1.4 Experiment 2 – Second dam
The results in table 5.5 are somewhat different than those in table 5.2:
Condition Y [m] Total head [m H2O]
Water cushion [m H2O]
Shock pressure [m H2O]
Check 390 73.80 71.41 2.39
Design 380 69.97 67.45 2.52
Normal 370 62.73 58.51 4.22
Energy diss. 380 66.00 63.82 2.18
Surface 380 57.67 57.30 0.37
Deep 370 53.67 48.16 5.51
1+6 380 51.43 51.00 0.43
2+5 370 51.53 51.00 0.53
3+4 390 51.58 51.00 0.58
1+3+5 380 52.77 52.00 0.77
Table 5.5 Maximum pressure on the second dam (experiment 2)
All maximum pressure values occur at the upstream side of the second dam
The maximum shock pressure for condition Surface has decreased substantially compared to
experiment 1
The maximum shock pressure for condition Deep has increased in experiment 2
The shock pressure for the last four conditions have increased compared to experiment 1
but remain low compared to the other conditions
5.1.5 Experiment 3 – Plunge pool
This experiment was conducted without nappe splitters as seen in figure 4.2.3. The maximum
pressure in the plunge pool can be seen in table 5.6.
Condition X [m] Y [m] Total head [m H2O]
Water cushion [m H2O]
Shock pressure [m H2O]
Check 50 170 93.13 71.41 21.72
Design 50 170 81.27 67.45 13.82
Normal 40 180 72.53 58.51 14.02
Energy diss. 40 180 73.03 63.82 9.21
Surface 40 110 64.10 57.30 6.80
Deep 0 360 53.40 48.16 5.24
1+6 40 120 57.63 51.00 6.63
2+5 0 360 51.53 51.00 0.53
3+4 -20 120 56.70 51.00 5.70
1+3+5 40 110 69.50 52.00 17.50
Table 5.6 Maximum pressure in the plunge pool (experiment 3)

46
The results in table 5.6 differ from the previous experiments in the following ways:
All shock pressure values are higher compared to experiment 2 except for those conditions
where surface spillway 3 and 4 are closed
The shock pressure of condition Check and 1+3+5 exceed the allowed maximum shock
pressure of 15 m H2O.
The maximum shock value for condition 1+3+5 takes place very close to the dam
The Check and Design conditions exerts their maximum shock pressure at the edge of the
measurement area (X=50 m)
When compared to experiment 2, the Surface and 1+3+5 condition has a higher shock
pressure value and it is located closer to the edge of the measurement area
5.1.6 Experiment 3 – Second dam
The results in table 5.7 show these characteristics:
Condition Y [m] Total head [m H2O]
Water cushion [m H2O]
Shock pressure [m H2O]
Check 370 75.93 71.41 4.52
Design 390 71.27 67.45 3.82
Normal 390 63.13 58.51 4.62
Energy diss. 380 66.00 63.82 2.18
Surface 370 57.57 57.30 0.27
Deep 370 53.67 48.16 5.51
1+6 380 51.43 51.00 0.43
2+5 370 51.53 51.00 0.53
3+4 390 51.47 51.00 0.47
1+3+5 380 52.97 52.00 0.97
Table 5.7 Maximum pressure on the second dam (experiment 3)
Except for condition Deep the maximum shock pressure is the highest for the conditions
when all spillways and orifices are open
All maximum shock pressure values occur on the upstream side of the dam
The Check and Design condition exerts higher shock pressure compared to experiment 2

47
5.2 Pressure distribution Observation shows that the pressure distribution for these experiments can be divided into three
different categories; Twin peaks, Close to dam impinge and No water cushion penetration.
5.2.1 Twin peaks
This category has two distinct peak pressure regions at either side of the plunge pool centre line at
roughly the same distance downstream of the dam. The pressure upstream and downstream of
these peak regions is low with a noticeable rise in pressure towards the upstream side of the second
dam (figure 5.1). Some conditions have the peak pressure at the edge of the measurement area
(X=50 m), hence contain the possibility of a higher pressure outside this area.
All Check, Design and Normal conditions for the three experiments is subject to the twin peak
category. The Energy dissipation condition shows these characteristics in experiment 2 and 3 only.
These are presented in Appendix C.
Figure 5.1 Pressure distribution of the Twin peak category (check condition, experiment 1)

48
5.2.2 Close to dam impinge
The characteristics of this type of pressure distribution consist of a peak pressure region close to the
dam with the highest values along the edges of the plunge pool. The pressure distribution in the rest
of the plunge pool is fairly even with no large fluctuations (figure 5.2).
Condition Surface, 1+6 and 1+3+5 can all be assigned to this category for all three experiments.
During experiment 3, condition 3+4 also shows these characteristics. This category also has some
peak pressure values at the edge of the measurement area, therefore containing the possibility of a
peak pressure value outside of the measurement area. These cases are presented in Appendix C.
Figure 5.2 Pressure distribution of the Close to dam impinge category (Surface condition, experiment 3)

49
5.2.3 No water cushion penetration
The water cushion in this category is too deep for the jets to penetrate. The peak pressure values
occur instead at the upstream side of the second dam where the water flow is being deflected
(figure 5.3).
The conditions assigned to this category are; Deep and 2+5 conditions for all three experiments. The
Energy dissipation condition in experiment 1 and the 3+4 condition in experiment 1 and 2 also
exhibit the characteristics for this category. All of these cases can be seen in Appendix C.
Figure 5.3 Pressure distribution of the No water cushion penetration category (Energy dissipation condition, experiment 1)

50
5.3 Analysis of the pressure experiments The analysis of the three pressure measurement experiments is divided into three different
categories; the maximum shock pressure in the plunge pool, the maximum shock pressure at the
second dam and the pressure distribution in the plunge pool.
5.3.1 Experiment 1 – Plunge pool
Experiment 1 was conducted with nappe splitters in surface spillways 1, 3 and 4 (figure 4.2.1). The
nappe splitters disperse the jets and deflect them further downstream into the plunge pool.
The maximum shock pressure occurs closer to the dam when the deep orifices are closed. This is
because the jets from the surface spillways impinge on the plunge pool surface without colliding
with and being carried away further downstream by the long reaching jets from the deep orifices.
Even though the discharge during the Normal condition is more than twice as large than during the
Surface condition, the maximum shock pressure values are more than six times greater during the
latter condition. This has several explanations:
The jets from the surface spillways are more concentrated since they are not being
dispersed by the lower jets, which decrease the shear region and lower the energy
dissipation there
There is no mid-air energy dissipation
The depth of the water cushion is almost 12 metres smaller than during the normal
condition which lessens its energy absorption ability
Because of the plunge pool geometry (figure 4.1), the left side is shallower than the right side
causing the jet from surface spillway 1 to have a greater impact on the plunge pool floor pressure
than the jet from surface spillway 6. The nappe splitter in surface spillway 1 deflects the jet further
towards the left side of the plunge pool. Because of this a larger part of the jet hits the shallow
region making the contribution of this jet to the maximum shock pressure value even larger.
The maximum shock pressure values of experiment 1 occurs during condition 1+6 and 1+3+5 and
they all happen at X=50 m. The reason lies in the nappe splitter in surface spillway 1 as described
above, the relatively small water cushion and no mid-air energy dissipation.
The Energy dissipation condition exhibits a negative shock pressure, which is not possible since it has
to be greater or equal to zero. The negative shock pressure is because of the surface profile of the
water. If the maximum shock pressure value takes place where the jets impinge with the plunge pool
the tailwater depth can be used to calculate the water cushion. But during the Energy dissipation
condition, the maximum shock pressure occurs downstream of the impinging point at Y=360 m. At
this point, the water depth is greater than the tailwater depth because of waves forming, which
causes a higher static pressure, hence the negative shock pressure.
All plunge pool floor pressure results which exhibit a maximum shock pressure value downstream of
the impinge point and where the tailwater depth is used to calculate the water cushion depth are
therefore irrelevant. This will not affect the result since the maximum shock pressure will occur
below the impinge point.

51
5.3.2 Experiment 1 – Second dam
The reason mentioned above also explains why the maximum shock pressure during some cases
occur downstream of the second dam. The water level at the points where the maximum pressure
for the Check, Design, Normal and Energy dissipation occur is higher than the tailwater level and the
peak pressure therefore occurs on the upstream side of second dam in reality.
Even though this method of calculating the depth of the water cushion may include an error, it will
also produce a safety margin since the real shock pressure will always be lower than the
experimental value because of a higher local static pressure caused by waves being formed.
For the conditions where the water cushion depth are measured relative to the water depth at
position (0, 370) a more accurate result of the shock pressure on the second dam will be acquired.
The pressure on the downstream side of the second dam will be smaller because of a smaller water
depth on this side.
5.3.3 Experiment 1 – Pressure distribution
The Check, Design and Normal condition all belong to the Twin peaks category. However, the Design
and Normal condition has their maximum pressure occurring on the right side of the plunge pool
(X=-30 m). Because of the geometry of the plunge pool and the nappe splitter in surface spillway 1,
the peak pressure is likely to take place on the left side of the plunge pool but outside of the
measuring area. Because of this it is impossible to determine the real peak pressure values and
therefore the results are not satisfactory.
The peak pressure values for condition Check, 1+6 and 1+3+5 all happen at X=50 m with the
possibility of a peak value actually occurring outside of the measuring area. This is especially risky
since the peak pressure values of 1+6 and 1+3+5 lies close to the maximum allowed peak pressure of
15 m H2O.
The water cushion in the Energy dissipation condition is too thick for the jets to penetrate despite
that all spillways are open. This condition has therefore the characteristics of No water cushion
penetration.
5.3.4 Experiment 2 – Plunge pool
Nappe splitters were used in surface spillway 3 and 4 as seen in figure 4.2.2. The tailwater level in
this experiment has been lowered compared to experiment 1, according to table 5.3.
The maximum pressure for the Check, Design, Normal and Energy dissipation conditions has
increased compared to experiment 1 because of a smaller depth of the water cushion, which is a
consequence of the lower tailwater depth.
Since the nappe splitter in surface spillway 1 is removed, the jet will not be deflected outwards and
will therefore crash into the plunge pool closer to the centre line. As a result, the maximum pressure
values are located at X=40 m, X=40 m and X=30 m for the Check, 1+6 and 1+3+5 condition
respectively.
This is the reason for the lower maximum shock pressure values for condition 1+6 and 1+3+5. The jet
from surface spillway 1 hits the plunge pool at a location where the water is deeper.

52
The peak pressure value during the Design and Normal condition occurs closer the dam compared to
experiment 1. This is due to the fact that the jet from surface spillway 1 is less dispersed since there
is no nappe splitter in its spillway. Therefore the jets from the deep orifices will not be able to
deflect this jet as far downstream in this experiment. The fact that the removal of the nappe splitter
in surface spillway 1 does not change the Y-location of the maximum pressure for the Surface, 1+6
and 1+3+5 conditions further shows the lower jets influence on the impinge point.
However, the Y-location of the maximum pressure value for the Check condition does not change
between experiment 1 and 2. This is a consequence of the much larger discharge from the surface
spillways during this condition (table 4.2) which results in more powerful jets from the surface
spillway and hence a lesser impact from the deep jets on the trajectory.
The lowering of the tailwater level in experiment 2 brings about a change in the surface profile of
condition Surface. The water level in the plunge pool will increase compared to experiment 1, which
will increase the water cushion depth and decrease the maximum shock pressure.
5.3.5 Experiment 2 – Second dam
The fact that all maximum pressure values occur at the upstream side of the second dam, which is
reasonable because this is where the deflection of the water flow happens, shows that the water
cushion depth is better estimated in this experiment. This may be due to the lower tailwater level in
this experiment that may prevent or lessen the forming of waves that happened in experiment 1.
The maximum shock pressure for condition Surface has decreased substantially because of an
increased water cushion depth that absorbs more energy before it hits the second dam. The same
reasoning but opposite holds for condition Deep where a smaller water cushion leads to an increase
of the maximum shock pressure.
5.3.6 Experiment 2 – Pressure distribution
The maximum shock pressure happens at X=40 m for the Check and 1+6 conditions and at X=30 m
for the 1+3+5 condition, this shows that there is no higher shock pressure value outside of the
measurement area. The highest shock pressure value happens during the Check condition, which is
the worst possible flood condition. The fact that this shock pressure is well below 15 m H2O and
definitely inside of the measurement area makes the result satisfactory.
The peak pressure value has been relocated to the left side (X=50 m) of the plunge pool for the
Normal condition compared to X=-30 m in experiment 1. This further strengthens the argument that
the peak pressure value was outside of the measurement area in experiment 1 and that it has
moved closer to the centre line with the removal of the nappe splitter in surface spillway 1.
Both maximum pressure values for the Normal and Energy dissipation condition lies at X=50 m and
therefore contains the possibility of a higher maximum shock pressure outside of the measurement
area. However, the values are much lower than the maximum shock pressure for the check
condition and well below the limit of 15 m H2O. The values are therefore not considered to be able
to exceed the maximum allowed shock pressure since they have to almost triple in order to do so.

53
The characteristics of the pressure distribution for the Energy dissipation condition have changed
from No water cushion penetration in experiment 1 to Twin peaks in this experiment. This is because
of the reduced water cushion depth with less energy dissipation as a consequence and the jets are
therefore able to penetrate the water cushion and exert a larger pressure on the plunge pool floor.
5.3.7 Experiment 3 – Plunge pool
Experiment 3 was conducted with no nappe splitters (figure 4.2.3).
With the nappe splitters in surface spillway 3 and 4 removed, the maximum shock pressure increases
compared to experiment 2 during all conditions in which surface spillway 3 and 4 are in use. This is
because the jets from these spillways are more concentrated, causing less mid-air energy dissipation
and a smaller shear region in the plunge pool. The effect of not dispersing the jet from surface
spillway 3 and 4 causes the maximum shock pressure in the Check and 1+3+5 condition to exceed
the maximum allowed shock pressure of 15 m H2O.
Because of the removal of the nappe splitters in surface spillway 3 and 4 the jets emerging from
these spillways will not be deflected as far downstream into the plunge pool as in the previous
experiments. This causes the maximum shock pressure to take place closer to the dam in the 3+4
and 1+3+5 conditions than in experiment 2.
5.3.8 Experiment 3 – Second dam
The maximum shock pressure values for the Check, Design and Normal conditions have increased
compared to experiment 2. This is because of no nappe splitter in surface spillway 3 and 4. This
further indicates that the energy dissipation in the plunge pool is insufficient in this experiment.
5.3.9 Experiment 3 – Pressure distribution
The removal of the nappe splitters in surface spillway 3 and 4 increases the overall shock pressure in
the plunge pool at the impinge point. However, the increase of the shock pressure on the left side of
the plunge pool (X>0 m) is greater than that on the right side (X<0 m). This effect is clearly noticeable
in the Surface condition in which the maximum shock pressure position has changed to X=40 m in
this experiment compared to X=-10 m in experiment 2. The reason lies in the plunge pool profile
which is shallower on the X>0 m side of the centre line.
With the maximum shock pressure values occurring at X=50 m for the Check and Design condition,
this experiment contain the possibility of even higher shock pressure values outside of the
measurement area. The maximum shock pressure could therefore be higher than the allowed 15 m
H2O for the Design condition as well as for the Check and 1+3+5 condition. This makes the result in
this experiment not satisfactory.
As a consequence of the now more concentrated jets from surface spillway 3 and 4 the
characteristics of condition 3+4 changes from No water cushion penetration in experiment 2, to
Close to dam impinge in this experiment.
5.4 Preferable nappe splitter setup The experiments conducted on the three different nappe splitter setups show that the setup used in
experiment 2 (figure 4.2.2) is the most favourable and is the setup that is investigated further in the
flow velocity experiments (chapter 6).

54
6 Flow velocity experiments In this chapter the results of the flow velocity experiments are presented and analysed. The
experiments were performed using the nappe splitter setup that was shown most favourable during
the pressure measurements.
6.1 Results of the flow velocity experiments The flow velocities measured in the plunge pool, above the second dam and downstream of the
second dam with the nappe splitter setup seen in figure 4.2.2) are presented below. The values
measured were transformed to prototype values according to table 3.6.
6.1.1 Velocity decline along the plunge pool centre line
Figure 6.1 below demonstrates the flow velocity decay that takes place in the plunge pool. Each
value is the average flow velocity during the 20 second sampling time in the Y-direction (figure 4.1).
The flow velocity is measured from just downstream of where the jets impinge with the plunge pool
to upstream of where the structure of the second dam begins. The flow velocities measured at
Y≥340 m fluctuates in both negative and positive Y-direction and are therefore not representative
for the velocity decay and not included in figure 6.1 below.
Figure 6.1 Velocity decline along plunge pool centre line (Y-direction)
Figure 6.1 shows that the maximum flow velocity occurs closest to the jet impinge point at Y=220 m
and gradually decays further downstream.
0
5
10
15
20
25
220 240 260 280 300 320
Ve
loci
ty [
ms-1
]
Y [m]
Check
Design
Normal

55
6.1.2 Maximum velocity in the plunge pool
Figure 6.2 below presents the average flow velocity each second during 20 seconds in the XY-
direction (figure 4.8) at Y=220 m. The flow direction varies during the sampling time, but it is the
magnitude of the flow velocity that is the important factor and decides whether scour occurs.
The flow velocity at 240 m ≤ Y ≤ 320 m has the same characteristics as the flow at Y=220 m but they
are not as large (figure 6.1) and are therefore presented in Appendix D.
Figure 6.2 Flow velocity at Y=220 m (XY-direction)
Noteworthy observations from figure 6.2:
The maximum flow velocity happens during the Check condition and is just below 30 ms-1
The flow velocity for all three conditions does not fluctuate much
The flow velocity for the Check condition is generally larger than during the Design
condition which is larger than for the Normal condition, all according to their flow
discharges
The maximum flow velocity has the potential to cause scour since it is close to 35 ms-1
6.1.3 Flow velocity upstream of the second dam
To show how the direction of the flow fluctuates over time, figure 6.3 below presents the flow
velocity at Y=380 m in the Y-direction. The flow velocity for Y=340 m and Y=360 m has similar
characteristics and are presented in Appendix D.
0
5
10
15
20
25
30
35
0 5 10 15 20
Ve
loci
ty [
ms-1
]
Time [s]
Check
Design
Normal

56
Figure 6.3 Flow velocity at Y=380 m (Y-direction)
The flow velocity fluctuates in the positive and negative Y-direction (downstream and
upstream direction) except during the Normal condition which only has a flow velocity in the
negative Y-direction
The flow velocity is well below 35 ms-1 and has no potential to cause scour
6.1.4 Flow velocity over the second dam
To get a flow profile over the second dam, the flow velocity in the Y-direction was measured. The
flow velocity was measured at six different depths (D) measured from the water’s surface to get an
estimation of the flow profile. Table 6.1 below presents the average flow velocity during 20 seconds
in the Y-direction over the second dam. Figure 6.4 shows the velocity profile over the second dam,
with the water surface being positioned at zero for the vertical axis.
Y=400 [m] Check [ms-1] Design [ms-1] Normal [ms-1]
D=5 m 18.4 13.7 10.0 D=10 m 14.6 8.1 7.7 D=15 m 10.9 4.5 5.2 D=20 m 4.7 4.0 - D=25 m 3.9 3.6 - D=30 m 2.1 - -
Table 6.1 Average flow velocity profile over the second dam
Noteworthy observations from table 6.1 and figure 6.4:
The average flow profile is similar to that of figure 3.14 b) for all conditions with a lower flow
velocity closer to the bottom
The reason for the lower amount of data during the Normal and Design conditions
compared to the Check condition is that the water depth is smaller during these conditions
-3,5
-3
-2,5
-2
-1,5
-1
-0,5
0
0,5
1
1,5
0 5 10 15 20
Ve
loci
ty [
ms-1
]
Time [s]
Check
Design
Normal

57
Figure 6.4 Flow velocity profile for the Check, Design and Normal condition measured from the surface
6.1.5 Flow velocity downstream of the second dam
Table 6.2 and table 6.3 below presents the average flow velocity in the XY-direction during ten
seconds downstream of the second dam. The flow velocity is measured at each side of the
downstream riverbank.
Y-Left Check [ms-1] Design [ms-1] Normal [ms-1]
600 [m] 11.5 11.1 10.4 800 [m] 7.1 8.7 6.9
1,000 [m] 7.1 8.4 10.2 1,200 [m] 8.2 7.1 8.6
Table 6.2 Flow velocity along the left river bank
Some observations made of the flow velocity at the left bank (table 6.2):
The flow velocity is the highest at Y=600 m for all conditions
There is a risk of erosion at Y=600 m during all conditions and Y=1,000 m during the Normal
condition since the flow velocity exceeds 10 ms-1
Y-Right Check [ms-1] Design [ms-1] Normal [ms-1]
600 [m] 6.8 7.8 8.6 800 [m] 7.4 9.4 6.6
1,000 [m] 7.3 7.7 8.5 1,200 [m] 9.4 5.2 8.9
Table 6.3 Flow velocity along the right river bank
Observations made of the flow velocity at the right bank (table 6.3):
All flow velocities are lower at Y=600 m at the right river bank than at the left
No flow velocity exceeds the maximum allowed of 10 ms-1
0
5
10
15
20
25
30
35
0 5 10 15 20
Dis
tan
ce f
rom
su
rfac
e [
m]
Velocity [ms-1]
Check
Design
Normal

58
6.2 Analysis of the flow velocity experiments The analysis of the flow velocity experiments is divided into five different categories; The velocity
decay along the plunge pool centre line, the maximum velocity in the plunge pool and the flow
velocity upstream, over and downstream of the second dam. The risk for scour in the plunge pool
and on the riverbed is also discussed.
6.2.1 Velocity decay along the plunge pool centre line
The velocity in the plunge pool fluctuates greatly and moves in different directions at all times.
However, figure 6.1 shows that the average flow velocity in the Y-direction decreases with an
increasing Y. This is a reasonable result since friction and energy losses in the flow will decrease the
flow velocity along the plunge pool floor.
6.2.2 Maximum velocity in the plunge pool
The maximum flow velocity at Y=220 m almost reaches 30 ms-1 during the Check condition which is
close to the flow velocity at which cavitation might occur (~35 ms-1). However, due to the water
cushion depth in the plunge pool (>50 metres during all conditions, table 5.4), there is no risk for a
big pressure drop in the flow and therefore not a risk for cavitation. Flow separation cannot happen
in the plunge pool because of its shape, which is another reason to why cavitation is not likely to
occur. The flow velocity straight below of the jet impinge point (Y≈180 m) is most likely larger than at
Y=220 m, but the above mentioned reasons are enough to disregard the risk of cavitation at this
position as well.
6.2.3 Flow velocity upstream of the second dam
Great fluctuation of the flow velocity takes place at 340 m ≤ Y ≤ 380 m with velocities in both
positive and negative Y-direction. This is an indication of vortices forming and detaching on the
upward slope of the second dam. There is no risk of scour in this area as the flow velocities are too
small.
6.2.4 Flow velocity over the second dam
The flow velocity over the second dam during the three conditions show the characteristics of a
standard flow profile with the flow velocity being the largest during the Check condition and the
smallest during the Normal condition, all according to their respective discharges.
6.2.5 Flow velocity downstream of the second dam
The flow downstream of the second dam is heavily influenced by the riverbed topography (figure
4.7). Furthermore, the structures that simulate the tunnel outlets affect the local flow velocity by
their geometry which explains the random flow velocities at 800 m ≤ Y ≤ 1,000 m.
In the prototype there will be a discharge through these tunnels during the Check and Design
conditions. However, the model does not have the possibility to simulate this discharge. This means
that the flow velocity results measured downstream of the tunnels are not accurate. How the flow
through these tunnels affect the downstream flow is out of the scope of this thesis, however, its
potential impact is not considered important.
Since the flow velocity exceeds 10 ms-1 at Y=600 m on the left river bank for all conditions, it is
recommended that protection measures of the riverbed are executed.

59
7 Discussion In this chapter, the pressure and flow velocity results obtained from the experiments conducted will
be discussed. Different sources of errors that may have influenced the results will also be declared.
7.1 Pressure results The results acquired from experiment 1-3 show that experiment 2 has the most favourable nappe
splitter setup regarding the shock pressure on the plunge pool floor. The shock pressure is well
below the limit of 15 m H2O at all measuring points. There is however a possibility for a maximum
shock pressure value outside of the measurement area during two conditions. The maximum shock
pressure acquired during these two conditions is well below 15 m H2O and therefore not considered
likely to exceed this limit outside of the measurement area. One reason is that the maximum shock
pressure value during the Normal and Energy dissipation conditions has to almost triple in order to
exceed the allowed shock pressure limit. Another reason is that the gradient of the shock pressure
peak region tend to be smooth and not change abruptly, which it has to do in these two cases in
order to reach 15 m H2O.
With the nappe splitter setup used in experiment 2 the shear region will be large enough to dissipate
the energy in the jets and to keep the maximum shock pressure below the limit of 15 m H2O.
Experiment 1 exhibit values that is below the maximum allowed shock pressure value. However,
since the tailwater level is five metres too large and some conditions still shows shock pressure
values close to the maximum limit, the nappe splitter setup used is considered unfavourable. There
is also the fact that several maximum shock pressure values will occur outside of the measurement
area despite that the water cushion is too large which further strengthens the argument that this
nappe splitter setup is unfavourable.
The maximum allowed shock pressure is exceeded by far in experiment 3 during two different
conditions which make the nappe splitter setup used inapplicable considering the safety of the dam.
The shear region is too small and the mid-air energy dissipation is not sufficient when the nappe
splitter setup in experiments 1 and 3 is used. This is what causes the shock pressure on the plunge
pool floor to exceed the maximum allowed pressure.
Since the shock pressure values at all measuring points are well below the limit and that the shock
pressure over the second dam is low, the plunge pool length can be shortened when the nappe
splitter setup in experiment 2 is used. This can result in a lowered investment cost since a shorter
plunge pool does not need as much material to be excavated. However, this will affect the mixing
region upstream of the second dam and therefore further experiments are required as the pressure
distribution and the flow velocity in the plunge pool might be affected.
7.2 Flow velocity results The flow velocity in the plunge pool and downstream of the second dam is highly complex with a
fluctuating, unsteady and non-uniform flow. It is therefore very difficult to measure and analyse the
flow velocity characteristics at the Baihetan dam. However, the flow velocity experiments conducted
is considered to be adequate when evaluating the risk of scour in the plunge pool and in the river
downstream of the second dam.

60
The results acquired from the flow velocity experiments show that there is no risk of scour in the
plunge pool but care should be taken just downstream of the second dam as the flow velocity there
exceeds the maximum allowed flow velocity. The construction of a concrete lining on the
downstream river bank and/or a decrease of the angle of the river bed slope are two recommended
measures that might be undertaken to reduce the risk of riverbed erosion due to high flow velocity.
Similar to the pressure measurement results, the flow velocity results in the plunge pool indicates
that the plunge pool can be shortened to decrease the construction costs of the Baihetan dam.
However, this might increase the flow velocity downstream of the second dam even more because
of a shortened mixing region which therefore loses some of its energy dissipation capacity. Hence,
the erosion protection measures might have to be extended further downstream.
7.3 Sources of error When measuring the average pressure on the plunge pool floor with the method described in this
thesis, some errors occur. The average pressure fluctuates which is clearly noticeable when
observing the piezometric tubes containing the water from the plunge pool in which the water level
varies greatly. As mentioned in section 4.2.3, six photos were taken of the tubes that lead to the
peak pressure region and three photos of the tubes that lead to the other measuring points. This
method is not fully accurate and includes a source of error. However, this error is neglected and this
method is expected to give a good estimation of the pressure on the plunge pool floor.
To decide the water level in the piezometric tubes, a grid was drawn in AutoCAD as described in
section 4.2.3. This grid includes an error since it is hard to get it completely accurate depending on
different angles of the board for different photos. Some values were sometimes impossible to
decide because of blurred photos and bad lighting conditions.
The tailwater level is regulated by adjusting the opening of the control dam until the water level
reaches the desired marking on the model’s bank (section 4.2). It is hard to get an exact match
between the tailwater surface and the marking because of waves and fluctuations of the
downstream water’s surface. This will cause a small error when calculating the shock pressure for
the conditions where the tailwater depth is used.
The scale effects described in section 3.4.2 are not considered to have a large impact on the results
in this thesis and they are therefore neglected.
As mentioned in section 3.4.2, the water jets in a model will get less air entrainment than the
corresponding water jets in the prototype, and therefore get less air resistance. The peak pressure in
the prototype may therefore occur closer to the dam than what the results in this thesis claim.
However, since all the results in experiment 2 is satisfactory and below the restricting values, this is
not considered a problem.
The downstream flow velocities include a large margin of error since the topographic differences in
the riverbank will have a great impact on the local flow velocity. The overall tendency of these
results should therefore be considered and not the local variations. There is no flow through the
tunnels in the model which will give an error when measuring the downstream flow velocity.
However, this error is not considered to have a large impact and is therefore neglected.
61
8 Conclusion The results obtained in this thesis show that the nappe splitter setup used during experiment 2 is the
most favourable. This setup has two nappe splitters each in surface spillways 3 and 4. The discharge
from the Baihetan dam poses no threat to the stability of the dam itself during this setup. However,
the flow velocity downstream of the second dam has the potential to cause erosion and further
studies regarding protection measures are therefore recommended.
There is a possibility that the length of the plunge pool can be shortened which would lessen the
construction cost of the Baihetan Hydropower Station. However, this would demand further studies
which might increase the investment cost and planning time of the project. The authors recommend
that the East China Investigation and Design Institute consider further investigation regarding this
matter.

62
References
Published sources American Society of Civil Engineers (1996) Hydrology Handbook. Second ed.
Appelqvist, Bo & Loyd, Dan (1979) Grundläggande Teknisk Strömningslära. LiTH-IKP-R1227. Second
ed.
Bazza, Mohammed (2007) Overview of the history of water resources and irrigation management in
the near east region. Water Science & Technology: Water Supply Vol 7 No 1 201–209. Accessed
110204. DOI:10.2166/ws.2007.023
Bollaert, Erik & Schleiss, Anton (2003) Scour of rock due to the impact of plunging high velocity jets
Part 1: A state-of-the-art review. Journal of Hydraulic Engineering. Vol. 00, No. 0. 1-14. Accessed
110406. DOI: 10.1080/00221686.2007.9521823
Borghie, S.M & Daemi A.R (2001) Effect of guide wall diversion on local scour downstream of a sluice
gate.30th IAHR Congress, Beijing, China, 2001. Accessed 110406.
Chadwick, Andrew, Morfett, John & Borthwick, Martin (1986) Hydraulics in Civil and Environmental
Engineering. Spon Press.
Chadwick, Andrew, Morfett, John & Borthwick, Martin (2004) Hydraulics in Civil and Environmental
Engineering. Spon Press. Fourth ed.
Chanson, Hubert (2004) The Hydraulics of Open Channel Flow: An Introduction. Elsevier Butterworth-
Heinemann. Second ed.
Coleman, H. Wayne, C. Y. Wei & James E. Lindell (1999) Hydraulic Design of Spillways. Hydraulic
Design Handbook 17.1-17.54. McGraw-Hill Book Company.
Douglas, John F., Gasiorek, Janusz M., Swaffield, John A. & Jack, Lynne B. (2005) Fluid Mechanics.
Pearson. Fifth ed
Featherstone, R. E. & Nalluri C. (1995) Civil Engineering Hydraulics. Blackwell Sciences. Third ed
Featherstone, R. E. & Nalluri C. (2001) Civil Engineering Hydraulics. Blackwell Sciences. Fourth ed
French, Richard H. (1986) Open-Channel Hydraulics. McGraw-Hill Book Company.
Gao, Jizhang (1999). High efficiency of energy dissipation by double layers of jets and supershort
plunge pool. 28th IAHR Congress, Graz, Austria, 1999. Accessed 110308.
Helms, S.W. (1977) Jawa Excavations 1975. Third Preliminary Report. Levant 9 21-35.
Hoffmans, G. J. C. M. & Verheij H.J. (1997) Scour manual. A.A Balkema
Houghtalen, Robert J., Hwang, Ned H. C. & Osman Akan, A. (2010) Fundamentals of Hydraulic
Engineering Systems. Pearson. Fourth ed.

63
Jansen, R.B (1988) Advanced Dam Engineering for Design, Construction and Rehabilitation. Kluwer
Academic Publishers.
Khatsuria, R. M. (2004) Hydraulics of Spillways and Energy Dissipators. Marcel Dekker.
Lian, Jijian, Liu, Xizhu & Ma, Bin (2009) Safety evaluation and the static-dynamic coupling analysis of
counter-arched slab in plunge pool. Accessed 110307. DOI: 10.1007/s11431-008-0311-6
Noshi, Hani M. (1999) Energy dissipation near the bed downstream end-sill. 28th IAHR Congress,
Graz, Austria, 1999. Accessed 110307.
Novak, P., Guinot, V., Jeffrey, A. & Reeve, D. E. (2010) Hydraulic Modelling – an Introduction. Spon
Press.
Novak, P., Moffat, A. I. B., Nalluri, C. & Narayanan, R. (2001) Hydraulic Structures. Spon Press. Third
ed.
Puertas J. & J. Dolz (2005) Plunge Pool Pressures Due to a Falling Rectangular Jet. Journal of
Hydraulic Engineering. Vol. 131, No. 5. 404-407. Accessed 110317. DOI: 10.1061/(ASCE)0733-
9429(2005)131:5(404)
Roberson, John A., Cassidy John J. & Chaudhry M. Hanif (1998) Hydraulic Engineering. Hamilton
Printing. Second ed.
Roca M., Blanckeart K. & Martín-Vide J. P. (2009). Reduction of Bend Scour by an Outer Bank Footing:
Flow Field and Turbulence. Journal of Hydraulic Engineering. Vol. 135, No. 5. 361-368. Accessed
110406. DOI: 10.1061/(ASCE)HY.1943-7900.0000028
Schwartz, Maurice L. (2005) Encyclopedia of coastal science. Encyclopedia of Earth Sciences Series.
U.S. Army Corps of Engineers (1997) Hydraulic Engineering Requirements for Reservoirs. Department
of the Army.
Wei C. Y. & James E. Lindell (1999) Hydraulic Design of Stilling Basins and Energy Dissipators.
Hydraulic Design Handbook 18.1-18.55. McGraw-Hill Book Company.
Xu, Weilin. , Liao, Huasheng , Yang, Yongquan. & Wu, Chigong (2002). Turbulent flow and energy
dissipation in plunge pool of high arch dam. Journal of Hydraulic Research. Vol. 40 No. 4 471-476.
Accessed 110307. DOI: 10.1080/00221680209499889
Yang, Haitao & Yao, Guocan (2002) Hydropower Development in Southwestern China. IEEE Power
Engineering Review. Vol 22 No.3 16-18. Accessed 110210. DOI: 10.1109/MPER.2002.989196

64
Internet sources About.com construction. World Greatest Power Generating Systems. [www]
http://construction.about.com/od/Benchmark-Projects/ig/World-Greatest-Power-Generator-
Systems/ (2011-03-14)
BBC News. China country profile. [www]
http://news.bbc.co.uk/2/hi/africa/country_profiles/1287798.stm (2011-02-03)
Biofuels.com. Pros and Cons of Hydropower - Updated Article With New Information. [www]
http://www.bionomicfuel.com/pros-and-cons-of-hydropower/ (2011-02-10)
China Environmental Law. China’s Renewable Energy Law. *www+
http://www.chinaenvironmentallaw.com/2008/03/27/china%E2%80%99s-renewable-energy-law/
(2011-02-08)
Chinese Government. China to build more hydropower plants on Yangtze River. [www]
http://english.gov.cn/2006-06/12/content_307866.htm (2011-02-09)
Devencenzi, Tony & Pinderhughes, Raquel R., Urban Studies Program, San Fransisco State University.
The Environmental and Social Impacts of Large Scale Dams. [www]
http://www.bss.sfsu.edu/raquelrp/projects/Mega%20Dams.ppt (2011-02-14)
Global Architects Guide. Baihetan Dam Multimedia Information. [www]
http://www.globalarchitectsguide.com/library/Baihetan-Dam.php (2011-02-09)
Global Times. China ready for flood of hydropower. [www]
http://business.globaltimes.cn/industries/2011-01/609534.html (2011-02-08)
Hutchinson Encyclopaedia talktalk.co.uk, Dam. [www]
http://www.talktalk.co.uk/reference/encyclopaedia/hutchinson/m0005614.html (2011-04-07)
International Energy Agency. World Energy Outlook Executive Summary 2010. [www]
http://www.worldenergyoutlook.org/docs/weo2010/WEO2010_es_english.pdf (2011-04-05)
International Rivers. Jinsha River Dams. [www] http://www.internationalrivers.org/china/jinsha-
river/jinsha-river-dams (2011-02-09)
Nationmaster.com. Coal consumption (most recent) by country. [www]
http://www.nationmaster.com/graph/ene_coa_con-energy-coal-consumption (2011-02-04)
Naturskyddsföreningen. Sociala och ekonomiska konsekvenser av dammbyggen. [www]
http://www.naturskyddsforeningen.se/natur-och-miljo/klimat/energi/vattenkraft/vanliga-
fragor/sociala-konsekvenser/ (2011-02-11)
Naturskyddsföreningen. Vattenkraft - Vanliga frågor. [www]
http://www.naturskyddsforeningen.se/natur-och-miljo/klimat/energi/vattenkraft/vanliga-fragor/
(2011-02-08)
Omega Engineering Technical Reference. Introduction to Magnetic Flow Meters. [www]
http://www.omega.com/prodinfo/magmeter.html (2011-05-11)

65
The Enyclopedia of Earth. Three Gorges Dam, China. [www]
http://www.eoearth.org/article/Three_Gorges_Dam,_China (2011-04-19)
U.S. Department of Energy. History of Hydropower. [www]
http://www1.eere.energy.gov/windandhydro/hydro_history.html (2011-02-03)
World Interesting Facts. Top 5 Highest Dams in the World. [www]
http://www.worldinterestingfacts.com/infrastructure/top-5-highest-dams-in-the-world.html (2011-
03-14)

- 1 -
Appendix A
Figure A.1 Discharge profile during the Check, Design, Normal and Energy dissipation conditions
Figure A.2 Discharge profile during the Surface condition

- 2 -
Figure A.3 Discharge profile during the Deep condition
Figure A.4 Discharge profile during the 1+6 condition

- 3 -
Figure A.5 Discharge profile during the 2+5 condition
Figure A.6 Discharge profile during the 3+4 condition

- 4 -
Figure A.7 Discharge profile during the 1+3+5 condition

- 5 -
Appendix B
Pressure results from experiment 1
Y [m] X[m] Mean pressure [m H2O]
Check Design Normal Energy Surface Deep 1+6 2+5 3+4 1+3+5
100 -50.0 67.00 63.33 57.07 61.23 52.63 49.20 50.47 50.50 50.37 51.10
100 -40.0 66.97 63.20 57.03 61.23 52.93 49.30 50.80 50.57 50.37 51.10
100 -30.0 66.83 63.33 57.20 60.93 52.93 49.47 50.83 50.60 50.20 50.93
100 -20.0 67.30 62.97 57.00 60.53 52.90 49.37 50.80 50.73 50.03 50.87
100 -10.0 67.60 63.43 57.07 60.83 53.00 49.20 50.67 50.47 50.33 50.87
100 0 68.17 63.33 57.13 61.17 53.00 49.33 50.50 50.53 50.07 50.73
100 10.0 68.6 63.33 57.24 61.07 53.20 49.00 50.00 50.50 50.30 50.87
100 20.0 68.93 64.30 57.53 61.13 53.37 49.40 50.10 50.50 50.13 50.90
100 30.0 69.10 64.37 57.43 61.37 52.93 49.37 49.73 50.40 50.23 50.33
100 40.0 69.27 65.17 57.93 61.70 52.13 49.53 49.07 50.40 50.23 49.80
100 50.0 69.17 64.83 57.93 61.87 51.33 49.30 49.00 50.30 50.20 49.50
110 -50.0 68.03 64.53 57.70 61.33 52.33 49.27 50.60 50.57 50.50 51.10
110 -40.0 67.70 63.87 57.40 61.17 52.60 49.17 50.53 50.53 50.33 51.07
110 -30.0 67.63 63.53 57.30 61.17 52.83 49.30 50.63 50.47 50.23 51.00
110 -20.0 68.30 63.67 57.20 61.03 52.70 49.30 50.50 50.50 50.07 50.97
110 -10.0 68.60 63.47 57.27 60.90 52.90 49.30 50.70 50.50 50.00 50.77
110 0 68.90 64.20 57.30 60.87 53.03 49.33 50.37 50.47 50.00 50.77
110 10.0 69.13 63.73 57.10 61.13 52.67 49.00 49.60 50.33 50.00 50.67
110 20.0 69.6 64.23 57.33 61.20 52.27 49.20 49.63 50.42 50.12 50.00
110 30.0 69.93 64.93 57.87 61.47 51.67 49.37 49.67 50.53 50.33 50.07
110 40.0 69.9 64.67 57.95 61.53 51.27 48.60 49.27 50.27 50.00 50.13
110 50.0 69.80 65.40 58.00 61.80 52.00 49.10 49.47 50.40 50.17 48.77
120 -50.0 69.20 64.60 57.73 61.53 52.87 49.17 50.60 50.57 50.47 51.03
120 -40.0 69.00 64.53 57.67 61.47 53.10 49.20 50.13 50.37 50.40 50.77
120 -30.0 69.00 64.17 57.27 61.30 53.17 49.13 50.13 50.40 50.33 50.77
120 -20.0 69.53 64.53 57.20 61.17 53.10 49.10 50.00 50.53 50.37 50.97
120 -10.0 69.50 64.73 57.50 60.97 53.43 49.13 50.27 50.50 49.87 50.77
120 0 69.80 64.90 57.30 61.00 53.47 49.27 49.87 50.47 49.80 50.80
120 10.0 69.9 64.95 57.45 61.07 52.67 49.30 49.47 50.47 50.10 50.00
120 20.0 70.20 65.03 57.70 61.67 51.87 49.37 49.10 50.47 50.20 50.23
120 30.0 70.17 65.47 58.07 61.57 52.80 49.27 49.03 50.43 50.23 49.53
120 40.0 70.47 65.67 57.87 61.77 54.37 49.40 50.13 50.53 50.10 52.13
120 50.0 70.13 65.80 58.03 61.53 63.83 49.37 62.60 50.37 50.23 60.93
130 -50.0 69.23 64.20 57.83 61.50 52.73 48.67 50.33 50.00 49.90 50.43
130 -40.0 69.13 63.93 57.33 61.23 53.33 48.57 54.17 49.83 49.87 50.40
130 -30.0 69.33 64.00 57.07 60.93 52.90 48.50 50.87 49.73 49.93 50.33
130 -20.0 69.73 63.87 57.33 60.97 54.17 48.20 51.00 49.73 49.97 50.17
130 -10.0 70.00 64.13 57.10 60.97 57.27 48.27 53.97 49.70 50.00 50.27
130 0 70.00 64.40 57.13 60.97 52.53 48.73 49.07 49.70 49.77 50.37

- 6 -
130 10.0 70.53 64.73 57.50 61.37 52.97 48.47 50.00 50.14 50.27 50.63
130 20.0 70.60 65.02 57.80 60.97 52.47 48.52 49.56 50.14 50.17 49.47
130 30.0 70.77 65.30 58.10 61.63 52.07 48.63 48.87 50.13 50.00 49.47
130 40.0 70.20 65.70 58.23 61.50 53.73 48.50 50.03 50.07 49.67 51.53
130 50.0 70.13 66.00 58.40 61.87 59.63 48.67 57.53 50.06 49.47 64.60
140 -50.0 70.20 64.70 58.20 61.53 53.67 48.57 50.23 49.63 49.83 50.07
140 -40.0 70.07 64.40 57.80 61.20 53.60 48.60 49.40 49.85 49.93 50.20
140 -30.0 70.17 64.23 57.27 60.97 52.53 48.37 50.13 49.83 49.97 50.27
140 -20.0 70.43 65.00 57.20 60.80 53.37 48.73 50.02 49.70 50.00 50.33
140 -10.0 70.93 64.83 57.40 60.87 54.73 47.70 49.87 49.67 50.17 50.17
140 0 71.00 65.13 57.70 61.33 52.63 48.60 48.23 49.80 50.00 50.40
140 10.0 71.10 65.40 57.83 61.47 53.50 48.13 50.80 49.90 50.30 50.23
140 20.0 71.27 65.63 58.13 61.63 52.00 48.37 48.13 49.93 50.17 48.70
140 30.0 71.07 65.93 58.20 61.83 52.30 48.47 48.53 49.97 50.10 49.53
140 40.0 71.33 66.40 58.63 62.00 52.67 48.53 48.67 50.20 50.00 49.73
140 50.0 71.13 66.27 58.53 61.97 51.80 48.50 48.33 49.90 49.57 48.70
150 -50.0 71.00 65.00 58.43 61.40 54.77 48.70 50.57 50.00 50.00 50.37
150 -40.0 70.30 64.73 57.73 61.10 54.50 48.57 49.63 49.70 49.87 49.90
150 -30.0 70.80 64.47 57.07 60.87 53.80 48.33 48.00 49.70 50.00 50.43
150 -20.0 71.37 65.13 57.00 61.33 52.33 48.20 48.13 49.73 50.23 50.23
150 -10.0 71.43 65.70 57.57 61.47 52.13 47.90 47.60 49.70 50.13 50.37
150 0 71.50 65.83 58.07 61.57 52.33 48.00 48.03 49.93 50.33 50.40
150 10.0 71.40 66.17 58.50 62.30 52.87 48.10 49.73 49.93 50.33 50.33
150 20.0 71.30 66.17 58.50 61.93 52.30 48.27 47.73 50.13 50.10 48.57
150 30.0 71.57 66.40 58.70 62.27 51.57 48.47 47.93 49.93 50.13 48.97
150 40.0 72.47 66.57 58.97 62.07 54.23 48.43 48.43 50.43 49.90 49.27
150 50.0 72.27 66.70 58.87 62.17 50.40 48.50 48.63 50.30 49.93 47.87
160 -50.0 70.80 64.80 57.77 61.90 53.73 49.13 50.40 50.20 50.10 50.97
160 -40.0 70.00 64.03 56.83 61.17 54.03 48.93 50.20 50.13 49.97 50.83
160 -30.0 70.53 64.13 57.13 60.67 54.03 48.77 50.07 50.00 49.93 50.73
160 -20.0 70.60 64.67 58.07 60.93 53.23 48.83 49.47 50.17 50.00 50.83
160 -10.0 71.33 65.53 58.60 61.53 52.50 49.00 48.73 49.83 50.00 50.67
160 0 72.00 66.40 58.80 61.67 52.00 49.03 49.47 49.90 49.87 50.97
160 10.0 71.87 66.87 58.77 62.03 51.93 49.23 49.27 50.33 49.80 50.87
160 20.0 71.60 66.97 58.97 62.30 47.53 49.17 47.93 50.13 49.83 50.63
160 30.0 71.33 67.00 58.53 62.30 49.70 49.17 47.20 49.93 49.87 48.73
160 40.0 71.10 66.93 58.33 62.17 50.47 49.10 47.57 49.23 49.73 49.13
160 50.0 72.23 66.83 60.93 62.37 49.70 49.10 48.47 49.10 49.93 49.60
170 -50.0 70.47 64.27 57.13 61.93 53.63 48.77 50.30 50.13 49.97 51.00
170 -40.0 70.67 64.30 56.80 61.10 53.80 48.70 50.30 50.00 49.90 51.07
170 -30.0 74.90 67.20 58.30 61.10 53.90 48.67 50.37 50.00 49.97 51.27
170 -20.0 74.00 65.50 58.87 61.03 53.93 48.70 49.87 50.27 50.03 51.23
170 -10.0 71.67 66.23 58.73 61.50 53.57 48.83 50.27 50.13 50.07 51.03
170 0 71.63 66.73 58.80 61.73 52.80 49.03 50.40 50.30 50.03 51.27
170 10.0 71.73 67.13 59.10 62.20 52.47 49.13 50.10 50.33 49.97 51.03
170 20.0 71.03 67.13 59.63 62.53 51.53 49.13 49.37 50.57 49.93 50.77

- 7 -
170 30.0 71.40 67.00 58.93 62.50 49.60 49.27 48.53 50.17 49.97 49.43
170 40.0 72.47 67.87 60.33 62.30 49.73 49.27 48.00 49.77 49.97 49.37
170 50.0 76.27 71.57 63.77 64.97 52.27 49.13 48.30 49.83 50.10 49.63
180 -50.0 70.00 64.13 56.80 61.57 53.83 48.57 50.33 50.20 49.90 51.03
180 -40.0 71.10 65.80 58.60 61.40 54.07 48.70 50.37 50.13 49.93 51.27
180 -30.0 75.80 72.73 62.40 61.57 53.97 48.63 50.33 50.50 49.97 51.37
180 -20.0 76.43 69.80 59.57 61.27 54.33 48.53 50.07 50.47 50.17 51.40
180 -10.0 72.10 66.27 59.53 61.10 54.33 48.53 49.47 50.43 50.10 51.37
180 0 72.17 67.07 59.47 61.07 54.00 48.77 50.63 50.23 50.10 51.43
180 10.0 71.90 67.73 59.63 61.70 53.93 48.80 50.90 50.37 50.03 51.23
180 20.0 72.07 67.53 59.13 62.37 53.50 49.07 50.33 50.43 50.03 51.47
180 30.0 73.23 67.67 59.33 62.63 51.80 49.07 50.23 50.30 50.00 51.13
180 40.0 78.17 69.90 59.00 63.13 52.23 49.07 50.27 50.10 50.00 50.17
180 50.0 80.67 72.13 60.20 62.60 53.13 48.73 49.60 49.80 50.00 49.90
190 -50.0 70.37 64.60 57.30 61.97 54.13 48.17 50.47 50.33 49.93 51.30
190 -40.0 71.07 66.40 59.63 62.37 54.17 48.67 50.37 50.50 49.97 51.47
190 -30.0 73.83 73.73 64.47 63.13 54.17 48.23 50.30 50.47 50.17 51.47
190 -20.0 74.87 71.87 60.23 62.27 54.37 48.20 49.97 50.73 50.30 51.47
190 -10.0 72.43 67.07 58.40 61.53 54.43 48.27 48.93 50.20 50.13 51.53
190 0 72.70 67.27 59.80 61.33 54.03 48.20 50.17 50.70 50.13 51.53
190 10.0 71.83 68.10 59.40 61.50 53.70 48.07 50.27 50.37 50.03 51.67
190 20.0 72.20 68.00 59.93 63.37 54.40 48.83 50.80 50.63 50.10 51.33
190 30.0 73.30 68.13 59.73 63.33 54.23 48.90 50.60 50.23 50.20 51.30
190 40.0 76.23 69.83 59.33 63.53 53.60 49.00 50.13 50.13 50.20 50.77
190 50.0 75.03 70.07 60.30 63.80 53.47 48.87 50.33 50.07 50.27 50.80
200 -50.0 71.87 66.93 58.70 63.33 54.17 48.13 50.67 50.57 50.03 51.63
200 -40.0 71.30 67.80 59.67 64.43 53.97 47.80 50.33 50.53 50.07 51.70
200 -30.0 72.03 71.00 61.60 65.30 54.37 47.60 50.53 50.60 50.37 51.60
200 -20.0 72.80 69.40 59.77 64.50 54.60 47.57 50.57 50.83 50.57 51.63
200 -10.0 72.40 67.50 58.20 64.50 54.10 47.33 49.93 50.80 50.40 51.60
200 0 72.33 67.73 59.40 64.00 54.20 47.63 50.17 50.93 50.43 51.70
200 10.0 71.53 68.87 59.50 63.40 53.83 48.47 50.17 50.83 50.40 51.80
200 20.0 71.57 68.40 60.27 63.07 54.00 48.77 50.40 50.83 50.40 51.63
200 30.0 73.07 68.57 60.27 63.43 54.03 48.77 50.67 50.67 50.23 51.40
200 40.0 74.13 69.07 59.87 64.33 53.60 48.57 50.67 50.63 50.27 51.30
200 50.0 73.00 68.53 59.67 64.77 52.80 48.77 50.53 50.70 50.27 51.27
210 -40.0 72.50 67.63 60.47 64.80 54.37 48.93 50.70 50.97 50.47 51.57
210 -20.0 71.93 67.50 60.23 64.80 54.60 48.70 50.80 50.90 50.53 51.67
210 0.0 72.10 68.70 60.80 64.80 54.27 48.80 51.00 51.07 50.77 51.83
210 20.0 71.13 67.63 60.60 64.80 53.83 48.83 50.70 51.03 50.50 51.67
210 40.0 71.60 68.37 59.93 64.80 53.93 48.93 50.77 50.93 50.37 51.57
220 -40.0 74.77 67.67 59.93 65.00 55.13 47.03 51.10 50.90 50.47 51.93
220 -20.0 72.63 66.40 58.80 64.27 55.23 47.17 50.97 51.03 50.63 51.57
220 0.0 72.60 68.30 60.40 65.00 54.20 48.50 51.17 51.03 50.90 51.67
220 20.0 72.30 68.67 60.57 64.73 54.57 48.03 51.33 51.03 50.80 51.67

- 8 -
280 -40.0 76.00 71.33 63.53 65.07 55.43 52.37 50.87 51.03 50.90 51.70
280 -20.0 75.97 71.00 63.33 65.17 55.60 52.20 50.97 51.03 50.83 51.60
280 0.0 75.67 70.97 62.93 65.03 55.63 51.73 51.10 51.03 50.77 51.60
280 20.0 75.63 71.07 62.63 64.63 55.43 51.23 50.93 50.87 50.50 51.50
280 40.0 75.50 70.87 62.23 64.50 55.30 51.27 50.97 50.97 50.60 51.67
290 -40.0 76.27 71.13 63.37 65.17 55.53 52.57 50.97 51.03 50.90 51.73
290 -20.0 76.10 71.00 63.00 64.67 55.53 52.20 50.93 51.10 50.70 51.60
290 0.0 75.23 71.07 62.90 64.97 55.73 51.57 51.13 51.13 50.87 51.63
290 20.0 75.50 71.13 62.73 64.73 55.47 51.13 51.00 51.03 50.60 51.50
290 40.0 75.67 71.30 62.67 64.63 55.57 51.33 50.97 50.97 50.43 51.60
300 -40.0 76.57 71.20 63.33 65.13 55.57 52.60 50.93 51.10 50.77 51.60
300 -20.0 76.27 71.00 62.93 65.23 55.50 52.30 50.97 51.10 50.63 51.63
300 0.0 75.23 71.03 62.80 64.73 55.50 51.60 51.00 51.00 50.47 51.47
300 20.0 75.13 71.23 62.67 64.93 55.77 51.67 50.97 51.17 50.60 51.63
300 40.0 75.97 71.17 62.63 64.80 55.57 51.50 50.93 51.03 50.60 51.53
310 -40.0 76.80 71.10 63.27 65.47 55.45 52.55 50.80 50.85 50.60 51.73
310 -20.0 76.37 70.93 63.00 65.40 55.35 52.50 50.85 50.80 50.55 51.73
310 0.0 75.23 70.97 62.90 64.90 55.40 51.65 50.75 50.70 50.50 51.60
310 20.0 76.17 71.03 62.73 65.17 55.50 51.25 50.85 50.75 50.45 51.67
310 40.0 76.47 71.13 62.73 65.00 55.50 51.20 50.85 50.80 50.65 51.63
220 40.0 72.57 68.13 60.30 63.80 53.67 48.07 51.20 51.07 50.63 51.80
230 -40.0 73.20 67.90 62.50 65.67 54.87 48.77 50.87 50.17 50.40 51.57
230 -20.0 73.07 67.87 61.20 65.10 54.93 47.97 50.73 50.73 50.57 51.47
230 0.0 72.17 69.83 61.33 64.50 54.80 47.83 50.93 50.83 50.60 51.37
230 20.0 70.73 68.73 61.63 64.67 54.10 49.67 51.00 50.87 50.67 51.63
230 40.0 72.00 68.37 61.00 64.50 54.93 50.00 51.00 50.83 50.53 51.53
240 -40.0 74.63 68.70 64.17 66.07 55.13 49.43 50.93 50.77 50.57 51.60
240 -20.0 74.70 69.57 62.67 65.73 55.00 49.80 50.87 50.87 50.83 51.60
240 0.0 73.43 69.73 62.00 64.67 55.23 48.83 50.97 50.97 50.63 51.40
240 20.0 72.20 70.10 62.40 64.47 55.23 50.13 50.93 50.80 50.40 51.47
240 40.0 73.27 69.27 61.97 64.43 55.33 50.47 51.00 50.87 50.63 51.50
250 -40.0 75.63 70.03 63.80 65.97 55.00 49.33 50.83 50.83 50.90 51.63
250 -20.0 75.23 70.17 63.40 65.77 55.13 51.30 50.80 50.93 50.83 51.50
250 0.0 74.80 70.33 62.67 64.53 55.37 50.20 50.93 50.77 50.77 51.43
250 20.0 73.33 70.77 62.10 64.43 55.53 50.70 51.07 50.93 50.50 51.53
250 40.0 74.17 70.80 62.33 64.23 55.40 50.83 51.00 50.87 50.57 51.50
260 -40.0 75.97 70.50 63.90 65.67 55.07 50.77 50.77 50.77 50.87 51.77
260 -20.0 75.17 70.50 63.83 65.33 55.20 52.13 50.73 50.87 50.63 51.47
260 0.0 75.53 70.83 62.73 64.70 55.40 51.33 51.00 50.90 50.60 51.50
260 20.0 75.03 71.03 62.40 64.53 55.50 51.00 51.07 50.97 50.67 51.70
260 40.0 74.00 71.70 62.30 64.30 55.30 54.30 50.97 50.73 50.47 51.60
270 -40.0 75.87 70.97 63.87 65.10 55.20 52.03 50.80 50.83 50.73 51.67
270 -20.0 75.83 70.87 63.50 65.20 55.33 52.50 50.80 51.00 50.77 51.50
270 0.0 75.80 70.87 62.83 64.83 55.50 51.67 50.97 50.97 50.63 51.50
270 20.0 75.60 71.13 62.57 64.60 55.37 51.17 50.97 50.90 50.53 51.63
270 40.0 74.87 71.27 62.30 64.50 55.23 51.03 51.00 50.97 50.57 51.63

- 9 -
320 -40.0 76.73 71.23 63.03 65.77 55.40 52.60 50.85 50.75 50.45 51.67
320 -20.0 76.40 71.13 63.07 65.73 55.35 52.65 50.85 50.75 50.45 51.73
320 0.0 75.93 71.07 63.00 65.30 55.45 51.90 50.85 50.80 50.50 51.73
320 20.0 76.43 70.93 62.77 65.80 55.65 51.45 50.85 50.80 50.45 51.73
320 40.0 77.03 71.13 62.87 65.30 55.40 51.30 50.80 50.75 50.40 51.67
330 -40.0 76.67 71.47 63.17 66.03 55.55 52.80 50.85 50.90 50.55 51.70
330 -20.0 76.27 71.20 62.83 66.00 55.40 53.00 50.80 50.80 50.45 51.63
330 0.0 76.40 71.13 63.17 65.93 55.55 52.25 50.80 50.85 50.55 51.67
330 20.0 76.73 70.97 63.03 65.67 55.55 51.75 50.75 50.75 50.50 51.60
330 40.0 77.03 71.07 63.00 65.57 55.30 51.65 50.85 50.80 50.50 51.63
340 -40.0 76.53 71.50 63.30 66.23 55.65 52.85 50.85 50.85 50.45 51.53
340 -20.0 76.47 71.37 63.60 66.27 55.40 53.35 50.90 50.90 50.65 51.63
340 0.0 76.53 71.30 63.23 65.73 55.55 52.75 50.85 50.80 50.45 51.40
340 20.0 76.67 71.13 63.07 65.90 55.45 52.05 50.80 50.75 50.55 51.57
340 40.0 77.00 71.27 63.30 66.13 55.45 52.15 50.85 50.85 50.55 51.43
350 -40.0 76.50 71.87 64.20 67.40 56.03 53.50 51.30 51.50 51.33 52.07
350 -20.0 76.77 71.83 64.17 67.53 55.73 53.63 51.10 51.40 51.10 52.00
350 0.0 76.97 71.87 64.07 67.30 55.97 53.87 51.07 51.37 51.07 52.00
350 20.0 76.20 71.73 63.73 67.23 56.20 53.57 51.20 51.50 51.20 51.83
350 40.0 76.00 71.67 63.77 67.30 56.13 53.17 51.00 51.40 51.10 51.67
360 -40.0 76.80 72.20 64.37 67.67 56.07 53.77 50.93 51.43 51.07 52.13
360 -20.0 77.00 72.17 64.67 68.10 56.03 54.20 51.33 51.43 51.20 52.20
360 0.0 77.20 72.07 64.57 68.00 56.17 54.27 51.30 51.50 51.30 52.10
360 20.0 76.50 72.03 64.03 67.53 56.20 54.17 51.23 51.47 51.37 51.93
360 40.0 76.00 72.00 64.13 67.40 56.03 53.70 51.23 51.50 51.37 51.93
400 -40.0 77.27 73.27 65.83 68.90 52.97 55.87 49.57 50.07 49.63 50.40
400 -20.0 77.33 73.23 65.77 68.83 53.10 55.73 49.60 49.83 49.73 50.27
400 0.0 77.20 73.67 65.73 68.87 52.63 55.53 49.70 49.63 49.63 50.30
400 20.0 76.93 73.77 65.77 69.40 52.70 55.50 49.77 49.97 49.73 50.37
400 40.0 77.13 73.70 65.43 69.03 52.77 55.33 49.60 49.97 49.73 50.33
370 0 77.43 72.30 64.83 67.90 56.30 54.20 51.00 51.47 51.10 52.17
380 0 77.53 72.33 64.80 67.73 56.50 53.93 51.33 51.50 51.40 52.23
390 0 77.57 72.67 64.90 67.87 56.33 54.67 51.20 51.47 51.37 52.23
410 0 77.57 73.57 65.83 68.97 52.37 55.77 43.80 44.07 43.67 45.20
420 0 77.67 73.70 65.83 69.23 52.37 55.83 44.00 44.40 43.77 45.43
430 0 77.67 73.60 65.77 69.17 52.23 55.77 44.13 44.50 44.03 45.87

- 10 -
Pressure results from experiment 2
Y [m] X[m] Mean pressure [m H2O]
Check Design Normal Energy Surface Deep 1+6 2+5 3+4 1+3+5
100 -50.0 61.80 59.40 51.67 56.53 52.67 47.10 50.25 50.90 50.47 50.93
100 -40.0 61.77 59.10 51.60 56.30 52.80 47.07 50.50 50.97 50.60 51.03
100 -30.0 62.10 58.80 52.00 55.90 53.03 47.20 50.45 50.77 50.33 51.00
100 -20.0 62.20 59.07 51.93 55.93 53.07 47.20 50.40 50.67 50.23 50.97
100 -10.0 62.73 59.50 52.00 55.70 53.20 47.60 50.30 50.47 50.27 50.27
100 0.0 62.50 60.00 51.97 56.43 53.33 47.23 50.30 50.53 50.17 50.80
100 10.0 63.80 58.23 54.60 57.77 53.33 47.43 50.30 50.57 50.30 50.93
100 20.0 63.93 60.07 53.00 56.83 53.40 47.30 50.03 50.57 50.13 51.00
100 30.0 64.07 60.23 53.30 57.70 53.30 47.30 49.15 50.50 50.10 50.60
100 40.0 64.13 61.23 53.80 57.77 53.10 47.30 49.83 50.53 50.13 50.90
100 50.0 63.97 61.40 53.77 57.97 52.90 47.23 50.05 50.57 49.87 50.60
110 -50.0 62.23 60.20 52.13 57.07 52.63 46.93 50.38 50.73 50.53 50.90
110 -40.0 62.10 59.50 51.83 56.67 52.67 46.63 50.05 50.83 50.53 50.87
110 -30.0 62.10 59.50 52.00 56.57 52.70 46.83 50.20 50.70 50.43 50.93
110 -20.0 62.67 59.60 51.93 56.43 53.13 47.13 50.28 50.57 50.20 50.93
110 -10.0 63.40 59.33 52.60 56.83 53.30 47.20 50.28 50.53 50.20 50.90
110 0.0 63.73 59.33 52.63 57.93 53.07 47.20 50.20 50.50 49.93 50.90
110 10.0 64.17 59.85 53.03 57.53 53.17 47.87 50.00 50.37 50.03 50.00
110 20.0 63.27 60.38 53.25 57.52 53.20 47.60 49.50 50.55 50.12 50.80
110 30.0 64.80 60.67 53.50 57.50 53.27 47.20 48.30 50.73 50.17 50.87
110 40.0 64.80 59.77 53.73 58.27 52.90 47.27 49.40 50.50 50.03 51.00
110 50.0 64.60 61.80 53.93 57.97 52.27 47.17 48.48 50.63 49.93 49.57
120 -50.0 63.63 60.43 52.73 57.43 52.90 46.93 50.35 50.57 50.40 50.97
120 -40.0 62.80 60.00 52.23 56.90 52.50 46.57 49.60 50.60 50.27 50.93
120 -30.0 62.93 59.90 52.17 56.80 52.80 46.77 49.28 50.67 50.27 50.93
120 -20.0 63.57 60.27 52.73 56.83 53.00 47.03 49.50 50.80 50.20 51.00
120 -10.0 64.00 59.60 52.90 56.87 53.10 47.07 49.28 50.47 50.03 50.90
120 0.0 64.40 60.13 52.80 56.80 53.10 47.03 49.18 50.43 49.73 50.90
120 10.0 65.00 60.40 53.15 57.07 52.93 47.03 49.09 50.48 50.08 50.12
120 20.0 65.23 60.73 53.43 57.37 52.73 47.03 49.00 50.53 50.20 50.27
120 30.0 65.30 61.73 53.83 57.93 53.07 47.07 54.50 50.57 50.63 51.70
120 40.0 65.37 61.40 54.10 58.00 54.97 47.10 57.63 50.53 50.30 53.55
120 50.0 65.23 62.10 54.17 57.93 54.60 47.13 55.55 50.47 49.47 52.20
130 -50.0 64.60 60.47 53.83 57.23 52.24 46.67 50.03 49.87 50.03 50.64
130 -40.0 64.40 60.07 53.70 56.83 53.80 46.67 51.53 49.97 49.90 50.58
130 -30.0 64.13 60.03 53.47 57.50 53.14 46.77 51.60 49.90 50.03 50.54
130 -20.0 64.80 60.00 53.47 56.53 54.02 46.87 51.27 50.00 50.07 50.50
130 -10.0 65.07 60.30 53.40 56.63 60.40 46.73 53.23 50.00 50.00 50.48
130 0.0 65.10 60.50 53.50 58.10 52.68 46.77 48.67 49.80 49.70 50.36
130 10.0 65.67 60.77 53.50 57.23 53.70 46.93 49.80 50.10 49.93 49.12
130 20.0 65.63 61.13 53.62 57.90 55.80 47.02 49.45 50.13 50.13 51.00
130 30.0 66.03 61.50 53.87 57.77 57.92 47.07 48.77 50.17 50.30 56.20
130 40.0 65.60 61.73 53.87 57.90 56.22 47.03 49.40 50.10 49.63 52.98
130 50.0 65.53 61.80 53.63 58.03 54.00 47.10 49.90 50.17 49.27 51.30
140 -50.0 65.50 60.97 54.00 57.63 52.34 46.57 50.13 49.57 49.83 50.52

- 11 -
140 -40.0 64.80 60.57 54.10 57.23 52.26 46.80 49.67 49.80 49.83 50.66
140 -30.0 64.83 60.30 53.90 56.93 52.30 46.73 50.67 49.80 49.97 50.56
140 -20.0 65.30 60.73 53.73 57.47 53.64 46.80 50.27 49.80 50.00 50.48
140 -10.0 65.77 60.70 53.77 57.13 56.42 46.80 49.47 49.97 50.07 50.38
140 0.0 66.13 61.30 53.93 57.87 53.06 46.80 47.87 49.90 50.00 49.96
140 10.0 66.07 61.10 53.87 57.67 53.90 46.83 50.10 50.00 50.10 49.20
140 20.0 66.40 61.37 53.93 57.77 52.66 46.93 47.33 50.10 50.23 49.14
140 30.0 66.60 62.00 54.57 58.13 54.00 47.03 47.33 50.03 50.23 49.94
140 40.0 67.63 62.50 55.00 58.47 52.84 47.17 46.83 50.27 50.10 48.52
140 50.0 66.33 62.77 54.30 58.30 52.36 47.10 47.13 50.20 49.57 48.12
150 -50.0 66.27 61.63 54.83 58.37 53.34 46.80 50.37 50.30 50.03 50.84
150 -40.0 64.33 61.10 54.10 57.57 52.42 46.80 50.03 49.83 49.83 50.76
150 -30.0 64.53 60.73 54.13 57.43 51.26 46.60 48.87 49.90 50.03 50.90
150 -20.0 65.57 61.37 54.07 57.53 50.94 46.70 48.17 49.90 50.27 50.94
150 -10.0 66.27 61.20 54.23 57.57 51.10 46.70 47.63 50.03 50.20 50.82
150 0.0 66.73 61.47 54.30 57.93 50.76 46.87 47.63 50.20 50.27 50.16
150 10.0 66.63 61.97 54.23 58.17 51.98 46.63 49.23 50.27 50.20 49.24
150 20.0 66.43 61.93 54.10 58.17 51.22 46.97 47.67 49.90 50.23 49.02
150 30.0 67.13 62.60 54.67 58.60 51.38 47.17 47.57 50.57 50.40 49.21
150 40.0 69.47 63.13 55.07 58.87 51.48 47.30 47.07 49.77 50.20 48.68
150 50.0 67.40 63.23 54.57 58.53 51.76 47.20 48.23 50.20 50.03 49.66
160 -50.0 66.28 62.12 54.03 57.60 53.67 46.70 50.37 50.33 49.93 50.30
160 -40.0 65.12 61.32 53.63 56.94 53.47 46.67 50.47 50.27 49.90 50.53
160 -30.0 66.42 60.98 52.97 57.56 52.40 46.63 49.90 50.27 49.97 50.67
160 -20.0 67.06 61.68 53.20 58.70 51.00 46.67 48.83 49.77 50.03 50.80
160 -10.0 66.70 62.26 54.27 58.60 50.43 46.67 48.27 49.87 50.10 51.20
160 0.0 67.10 62.72 54.27 58.24 49.83 46.77 48.10 50.30 50.13 50.57
160 10.0 66.42 62.62 53.87 58.54 50.33 46.87 49.37 49.83 50.20 49.33
160 20.0 66.28 62.56 53.97 58.68 49.93 47.07 49.17 50.07 50.10 48.93
160 30.0 67.20 63.02 54.70 58.96 50.00 47.23 48.73 49.60 50.10 49.20
160 40.0 68.68 62.78 54.97 58.72 50.53 47.27 49.63 49.20 50.03 49.10
160 50.0 68.34 63.12 55.37 58.54 51.53 47.30 50.03 49.73 49.97 48.27
170 -50.0 65.88 61.84 53.97 57.24 51.53 46.70 50.47 50.47 50.07 51.40
170 -40.0 65.32 60.86 53.23 56.50 53.80 46.73 50.67 50.47 50.00 51.23
170 -30.0 69.84 63.42 54.20 57.98 53.43 46.73 50.40 50.53 50.00 51.20
170 -20.0 72.86 64.82 54.63 58.52 53.63 46.70 49.90 50.67 50.10 51.23
170 -10.0 67.44 62.54 54.57 58.42 52.57 46.63 50.03 50.73 50.13 51.37
170 0.0 68.22 63.18 54.47 58.78 51.37 46.70 50.07 50.37 50.27 51.50
170 10.0 66.74 63.04 54.03 58.66 50.83 46.80 50.70 50.43 50.20 51.07
170 20.0 66.84 62.56 54.00 58.84 51.00 46.93 50.80 50.73 50.13 49.40
170 30.0 68.70 63.06 54.53 58.58 51.07 47.23 49.97 50.37 50.10 49.20
170 40.0 77.74 68.26 58.87 60.08 51.03 47.27 50.17 50.17 50.17 49.13
170 50.0 75.38 66.28 59.63 65.30 51.33 47.23 50.07 50.20 50.07 49.17
180 -50.0 66.10 61.86 55.30 56.90 52.73 46.83 50.63 50.67 50.20 51.63
180 -40.0 65.12 60.96 55.00 58.16 54.13 47.13 50.67 50.67 50.13 51.80
180 -30.0 69.68 64.76 57.63 60.72 53.87 46.80 50.57 50.67 50.07 51.70
180 -20.0 72.28 69.82 56.30 59.30 53.93 46.70 50.40 50.87 50.10 51.57
180 -10.0 68.70 63.48 54.43 58.78 53.87 46.63 50.00 50.83 50.13 51.33
180 0.0 69.62 63.34 54.97 59.00 53.47 46.70 50.20 50.97 50.33 51.33

- 12 -
180 10.0 67.30 63.42 54.53 58.78 52.93 46.90 51.23 50.90 50.37 51.37
180 20.0 67.38 62.72 53.40 58.44 52.63 46.83 51.20 50.93 50.30 50.87
180 30.0 72.64 65.66 54.27 58.94 53.13 47.17 49.90 51.00 50.30 50.20
180 40.0 83.18 76.70 61.27 63.82 52.57 47.27 50.20 50.77 50.30 50.13
180 50.0 77.72 70.48 64.83 70.12 52.53 47.17 50.30 50.20 50.33 49.87
190 -50.0 67.04 62.68 55.00 57.66 53.43 47.10 50.73 50.87 50.17 51.83
190 -40.0 65.38 61.62 55.37 60.28 54.40 47.07 50.60 50.83 50.13 51.90
190 -30.0 67.86 64.44 59.53 62.56 54.43 46.73 50.40 50.83 50.17 51.60
190 -20.0 68.92 66.48 57.53 59.74 54.20 46.33 50.37 50.87 50.23 51.83
190 -10.0 68.54 63.94 54.87 59.00 53.93 46.63 50.17 51.00 50.30 51.77
190 0.0 69.36 64.02 55.57 59.32 54.17 46.40 49.77 51.00 50.53 51.77
190 10.0 67.18 63.54 54.50 58.42 53.60 46.07 50.53 51.10 50.47 51.43
190 20.0 68.82 63.24 53.40 58.20 54.60 46.43 50.10 51.13 50.53 51.53
190 30.0 72.44 65.78 53.83 58.44 54.30 46.70 50.10 51.03 50.60 51.30
190 40.0 75.28 68.82 57.60 61.62 53.47 46.70 50.33 50.57 50.60 50.97
190 50.0 73.06 66.96 58.63 65.06 53.80 47.00 50.43 50.80 50.67 51.75
200 -50.0 67.56 63.92 55.10 58.36 53.70 46.80 50.97 51.03 50.23 51.30
200 -40.0 66.72 63.08 54.43 59.84 54.53 46.77 50.53 50.97 50.23 51.35
200 -30.0 66.86 63.56 58.00 60.96 54.63 46.33 50.30 50.97 50.33 50.95
200 -20.0 67.38 64.04 57.00 59.92 54.47 46.40 50.57 51.00 50.50 51.00
200 -10.0 68.04 63.48 53.47 59.58 54.50 46.20 49.97 51.03 50.63 51.30
200 0.0 68.10 64.46 56.40 58.76 54.87 44.77 49.60 50.93 50.73 51.50
200 10.0 67.02 63.82 55.20 58.96 54.70 45.30 49.50 51.30 50.80 51.47
200 20.0 68.54 63.38 54.43 58.26 54.60 45.97 50.10 51.30 50.73 51.27
200 30.0 69.64 64.11 54.67 58.36 54.07 46.00 50.50 51.10 50.77 51.77
200 40.0 70.12 64.22 55.40 60.04 52.77 46.00 50.73 50.70 50.77 51.87
200 50.0 69.18 64.94 55.80 61.12 53.90 46.03 50.30 51.23 50.83 51.87
210 -40.0 67.70 64.66 56.53 60.28 53.10 45.93 50.73 51.13 50.57 52.03
210 -20.0 66.86 64.14 56.30 60.44 54.97 46.13 50.70 51.07 50.90 51.90
210 0.0 66.66 64.24 57.27 60.60 55.17 46.75 49.67 51.23 50.97 51.90
210 20.0 66.76 63.38 55.20 58.76 55.00 45.90 50.20 51.27 50.87 51.77
210 40.0 67.58 63.56 55.27 59.44 54.40 46.20 50.63 50.87 50.87 51.90
220 -40.0 68.60 68.10 57.53 61.00 54.57 45.30 50.68 51.20 50.63 52.03
220 -20.0 65.93 64.63 57.00 61.30 54.57 45.40 50.73 51.10 50.63 51.70
220 0.0 67.70 65.40 58.07 61.47 54.73 46.90 50.63 51.10 50.57 51.77
220 20.0 64.47 63.13 55.97 58.85 54.40 47.43 50.63 51.20 50.53 51.83
220 40.0 66.00 63.70 55.73 59.17 54.53 47.00 50.85 51.03 50.63 51.73
230 -40.0 68.97 66.83 60.07 62.50 54.37 45.00 50.87 50.87 50.36 51.80
230 -20.0 66.87 63.30 58.70 62.37 54.50 44.90 50.83 50.77 50.80 51.53
230 0.0 66.20 63.47 57.60 61.83 53.97 46.77 50.50 50.83 50.57 51.63
230 20.0 66.17 62.60 55.60 59.95 54.30 48.50 50.63 50.90 50.60 51.77
230 40.0 67.20 66.70 56.00 62.40 54.80 47.23 50.57 50.87 50.60 51.77
240 -40.0 70.53 67.97 59.63 63.03 54.53 44.10 50.77 50.97 50.63 51.83
240 -20.0 67.73 65.13 59.87 62.47 54.57 47.30 50.90 50.83 50.83 51.60
240 0.0 66.93 64.37 58.70 62.60 54.70 47.20 50.90 50.80 50.67 51.73
240 20.0 66.97 63.70 56.77 61.67 54.70 48.80 50.90 50.90 50.53 51.80

- 13 -
280 -40.0 70.80 69.73 60.50 64.03 54.67 51.73 50.90 51.03 50.90 51.97
280 -20.0 68.83 69.07 60.20 63.67 54.87 51.30 50.70 50.97 50.90 51.90
280 0.0 71.97 71.00 59.93 64.20 55.03 50.47 51.17 50.97 50.87 51.97
280 20.0 70.40 68.77 60.23 64.00 55.17 49.80 50.77 50.87 50.73 51.90
280 40.0 67.80 69.57 60.30 63.83 55.10 49.77 50.93 50.87 50.80 51.97
290 -40.0 70.43 70.07 60.87 64.07 54.77 51.10 50.97 51.03 50.87 51.93
290 -20.0 71.60 69.80 60.70 64.13 54.83 50.77 50.63 50.93 50.80 51.90
290 0.0 68.13 70.43 60.73 63.90 55.20 50.33 51.07 51.03 50.83 52.07
290 20.0 68.90 69.73 60.43 63.40 55.23 50.20 50.93 50.97 50.80 52.00
290 40.0 70.70 69.73 60.57 63.90 55.17 50.03 50.83 50.93 50.77 51.90
300 -40.0 71.07 70.40 60.70 64.10 54.83 50.63 50.63 51.00 50.80 51.87
300 -20.0 71.17 70.30 60.77 64.07 54.93 50.40 50.90 50.97 50.73 51.87
300 0.0 71.37 69.03 60.47 63.80 54.97 50.13 50.73 50.20 50.67 51.57
300 20.0 68.57 70.23 60.63 63.70 54.03 49.83 50.70 51.00 50.73 52.07
300 40.0 71.30 70.00 60.63 64.20 53.87 49.67 50.60 50.93 50.73 51.97
310 -40.0 71.60 70.50 60.90 64.07 54.87 50.57 50.50 51.00 50.87 51.90
310 -20.0 71.40 70.37 60.60 64.07 55.10 50.47 50.57 50.97 50.77 51.97
310 0.0 71.47 69.57 60.67 63.93 55.07 50.23 50.67 50.90 50.77 51.90
310 20.0 70.60 70.73 60.77 63.93 55.37 49.77 50.67 50.97 50.73 52.07
310 40.0 72.07 70.30 60.90 64.33 55.33 49.80 50.63 50.97 50.80 52.00
320 -40.0 72.33 70.63 60.77 64.10 55.03 50.47 50.60 50.87 50.73 51.93
320 -20.0 71.83 70.47 60.77 64.10 55.23 50.57 50.40 50.93 50.70 51.87
320 0.0 71.53 68.97 60.67 64.13 55.10 50.43 50.60 50.83 50.73 51.83
320 20.0 71.17 70.67 60.87 64.27 55.30 50.00 51.03 50.97 50.70 52.00
320 40.0 72.53 70.33 61.03 64.30 55.40 50.00 50.93 50.93 50.73 52.03
330 -40.0 72.70 70.70 60.73 64.20 55.33 50.73 51.03 51.00 50.83 52.03
330 -20.0 72.43 70.03 60.33 64.07 55.20 50.87 50.97 50.93 50.70 52.00
330 0.0 72.50 70.30 60.57 64.33 55.10 50.70 51.03 50.97 50.67 51.93
330 20.0 72.37 70.53 60.57 64.13 55.03 50.10 51.00 50.93 50.67 51.97
330 40.0 72.67 70.30 60.70 64.33 55.47 50.03 50.93 50.93 50.70 52.03
340 -40.0 72.67 70.70 59.80 64.30 55.50 50.87 50.97 50.97 50.80 51.97
340 -20.0 72.70 70.17 60.80 64.23 55.33 51.27 50.97 51.03 50.80 52.07
240 40.0 68.80 66.63 57.57 63.10 55.13 48.13 50.80 50.97 50.67 51.90
250 -40.0 71.43 69.40 59.57 63.57 54.57 46.33 50.90 51.07 50.63 51.83
250 -20.0 66.63 67.67 58.77 63.07 54.63 47.97 50.93 50.87 50.80 51.70
250 0.0 65.37 66.63 58.97 62.77 54.93 48.50 50.90 50.70 50.37 51.73
250 20.0 69.47 65.90 58.73 63.93 55.03 49.80 50.90 50.97 50.57 51.87
250 40.0 70.83 68.10 58.57 63.10 55.10 48.77 50.83 50.90 50.60 51.87
260 -40.0 71.60 69.87 59.90 63.87 54.70 49.83 50.83 51.00 50.77 51.93
260 -20.0 71.07 69.50 59.73 63.60 54.77 50.40 50.73 50.83 50.83 51.77
260 0.0 71.17 67.87 60.10 63.17 55.00 49.57 50.93 50.87 50.77 51.83
260 20.0 70.90 67.17 60.33 64.13 55.07 50.07 51.03 51.03 50.83 51.90
260 40.0 71.23 68.40 59.87 63.27 55.10 49.57 50.87 50.87 50.60 51.93
270 -40.0 71.40 69.70 60.30 63.83 54.70 51.20 50.90 50.93 50.83 51.93
270 -20.0 72.10 69.80 59.73 63.87 54.73 51.13 50.87 50.93 50.90 51.77
270 0.0 71.97 70.00 60.20 63.70 54.97 50.20 51.00 50.93 50.83 51.90
270 20.0 71.33 68.27 59.97 64.13 55.00 49.87 51.07 51.00 50.83 51.90
270 40.0 71.30 69.03 60.27 63.43 55.10 49.83 50.90 50.93 50.83 51.97

- 14 -
340 0.0 72.23 69.93 58.80 64.18 55.30 51.30 50.83 50.93 50.70 51.23
340 20.0 72.73 70.73 61.00 64.17 54.97 50.43 50.97 50.97 50.73 51.93
340 40.0 72.80 70.57 60.77 64.40 55.23 50.50 50.97 50.70 50.50 52.20
350 -40.0 73.07 68.93 61.73 64.93 56.00 52.13 51.33 51.47 51.37 52.70
350 -20.0 72.70 68.90 61.87 65.03 56.10 52.40 51.33 51.50 51.20 52.63
350 0.0 73.10 69.13 62.00 64.93 55.73 52.73 51.27 51.50 51.23 52.57
350 20.0 73.33 69.37 61.83 64.33 55.90 52.03 51.40 51.50 51.33 52.57
350 40.0 73.20 69.00 61.80 64.70 56.13 51.87 51.33 51.43 51.40 52.77
360 -40.0 73.07 69.20 62.13 65.07 56.30 52.60 51.43 51.53 51.47 52.77
360 -20.0 73.03 69.23 62.10 65.23 56.17 53.27 51.37 51.50 51.30 52.67
360 0.0 73.33 69.53 62.40 65.23 56.27 53.40 51.37 51.53 51.33 52.33
360 20.0 73.43 69.60 62.30 64.83 56.10 52.73 51.43 51.53 51.43 52.57
360 40.0 73.10 68.93 62.30 63.07 55.97 52.63 51.40 51.47 51.50 52.77
400 -40.0 73.20 68.83 60.87 64.73 52.83 52.77 49.90 50.20 50.03 50.73
400 -20.0 73.33 68.90 60.53 64.57 53.13 52.43 50.00 50.27 50.03 50.93
400 0.0 73.43 68.90 60.80 64.97 52.10 52.63 46.97 50.17 50.07 50.67
400 20.0 73.57 68.50 60.77 65.23 52.70 52.03 48.50 47.83 47.87 50.73
400 40.0 73.20 68.43 59.77 64.30 51.93 52.43 50.00 50.00 50.17 50.70
370 0 73.60 69.80 62.73 65.77 56.43 53.67 51.27 51.53 51.27 52.53
380 0 73.70 69.97 62.27 66.00 57.67 53.37 51.43 51.70 51.37 52.77
390 0 73.80 69.50 62.57 65.17 56.40 53.27 51.43 51.70 51.57 52.77
410 0 73.43 69.03 61.23 65.07 49.97 51.20 38.87 39.03 39.00 42.00
420 0 73.43 69.00 60.57 64.97 50.20 51.20 38.93 39.10 39.23 42.17
430 0 73.33 68.97 60.87 63.23 50.10 51.13 39.00 39.07 39.33 42.47

- 15 -
Pressure results from experiment 3
Y [m] X[m] Mean pressure [m H2O]
Check Design Normal Energy Surface Deep 1+6 2+5 3+4 1+3+5
100 -50.0 65.10 63.37 54.27 57.67 52.17 47.10 50.2
5
50.90 50.27 51.30
100 -40.0 64.90 63.20 53.57 57.67 52.13 47.07 50.5
0
50.97 50.37 51.80
100 -30.0 61.23 62.67 53.43 56.80 51.73 47.20 50.4
5
50.77 49.83 51.80
100 -20.0 64.70 62.50 52.80 56.57 52.13 47.20 50.4
0
50.67 49.63 51.60
100 -10.0 65.00 62.60 53.00 56.67 53.70 47.60 50.3
0
50.47 47.83 48.20
100 0.0 65.37 62.80 53.17 56.77 53.60 47.23 50.3
0
50.53 48.87 49.27
100 10.0 63.00 62.87 55.53 56.03 56.10 47.43 50.3
0
50.57 48.70 49.57
100 20.0 65.80 63.80 54.17 57.30 53.07 47.30 50.0
3
50.57 49.10 51.30
100 30.0 66.10 63.77 55.17 57.70 52.10 47.30 49.1
5
50.50 48.73 51.00
100 40.0 66.57 64.57 54.80 58.17 52.47 47.30 49.8
3
50.53 49.10 49.80
100 50.0 66.40 64.60 54.97 58.47 51.67 47.23 50.0
5
50.57 50.23 49.67
110 -50.0 65.57 63.97 54.37 57.80 52.53 46.93 50.3
8
50.73 50.60 51.23
110 -40.0 65.27 63.67 54.47 57.57 51.70 46.63 50.0
5
50.83 50.33 51.20
110 -30.0 65.13 63.23 53.87 57.37 52.37 46.83 50.2
0
50.70 53.03 51.20
110 -20.0 65.13 62.37 53.53 57.03 56.13 47.13 50.2
8
50.57 54.70 51.13
110 -10.0 63.20 62.73 55.80 56.30 53.70 47.20 50.2
8
50.53 53.03 50.50
110 0.0 64.33 62.97 55.70 56.97 54.00 47.20 50.2
0
50.50 55.03 50.17
110 10.0 65.08 63.41 55.41 57.12 55.67 47.87 50.0
0
50.37 52.70 53.40
110 20.0 65.82 63.86 55.12 57.46 55.54 47.60 49.5
0
50.55 54.08 56.76
110 30.0 66.57 64.30 54.83 57.97 55.40 47.20 48.3
0
50.73 55.47 60.13
110 40.0 61.77 64.20 56.37 57.63 64.10 47.27 49.4
0
50.50 55.37 69.50
110 50.0 66.97 64.87 55.03 58.50 52.40 47.17 48.4
8
50.63 49.90 51.47
120 -50.0 65.87 64.30 54.77 58.23 52.37 46.93 50.3
5
50.57 50.43 51.03
120 -40.0 65.57 64.03 54.43 57.70 52.27 46.57 49.6
0
50.60 50.33 50.70
120 -30.0 65.13 63.83 54.20 57.63 54.50 46.77 49.2
8
50.67 49.00 50.60
120 -20.0 65.77 63.90 54.13 57.80 61.27 47.03 49.5
0
50.80 56.70 50.83
120 -10.0 65.67 63.60 54.87 57.30 54.30 47.07 49.2
8
50.47 54.47 49.83
120 0.0 66.20 63.97 54.07 57.40 54.43 47.03 49.1
8
50.43 52.83 50.30
120 10.0 66.50 64.08 54.54 57.62 55.16 47.03 49.0
9
50.48 52.22 52.32
120 20.0 66.83 64.20 55.00 57.83 54.90 47.03 49.0
0
50.53 51.60 54.33
120 30.0 67.67 64.57 54.90 58.20 56.70 47.07 54.5
0
50.57 54.40 57.13
120 40.0 67.30 64.93 55.13 58.37 56.30 47.10 57.6
3
50.53 51.27 55.20
120 50.0 67.30 65.10 55.17 58.73 56.67 47.13 55.5
5
50.47 49.73 54.57
130 -50.0 66.50 64.17 55.07 57.77 52.67 46.67 50.0
3
49.87 50.17 50.70
130 -40.0 66.10 63.90 54.97 57.50 53.87 46.67 51.5
3
49.97 49.60 50.67
130 -30.0 65.83 63.70 55.23 57.63 52.27 46.77 51.6
0
49.90 47.30 50.53
130 -20.0 66.27 63.70 54.80 57.60 52.93 46.87 51.2
7
50.00 48.77 50.50
130 -10.0 66.73 63.70 54.80 57.57 53.03 46.73 53.2
3
50.00 49.23 49.47
130 0.0 66.00 63.63 55.57 57.47 53.30 46.77 48.6
7
49.80 48.17 49.27
130 10.0 67.33 64.03 54.77 57.80 52.53 46.93 49.8
0
50.10 47.87 50.07
130 20.0 68.00 64.60 54.80 58.00 52.50 47.02 49.4
5
50.13 47.60 42.67
130 30.0 68.13 64.70 54.83 58.17 52.47 47.07 48.7
7
50.17 47.43 50.53
130 40.0 68.23 64.93 54.80 58.33 51.27 47.03 49.4
0
50.10 47.23 50.60
130 50.0 68.17 65.03 54.67 58.53 51.53 47.10 49.9
0
50.17 49.77 50.80
140 -50.0 66.33 64.33 55.17 57.27 53.83 46.57 50.1
3
49.57 50.07 50.43

- 16 -
140 -40.0 65.70 64.23 55.03 57.77 51.93 46.80 49.6
7
49.80 50.07 50.37
140 -30.0 65.80 64.03 54.93 57.73 51.80 46.73 50.6
7
49.80 47.13 50.63
140 -20.0 66.20 64.00 54.80 57.93 50.70 46.80 50.2
7
49.80 47.23 50.37
140 -10.0 66.90 64.00 54.90 57.90 51.30 46.80 49.4
7
49.97 47.50 50.33
140 0.0 67.20 64.30 54.80 57.97 51.43 46.80 47.8
7
49.90 47.20 49.33
140 10.0 67.60 64.33 54.77 58.03 51.57 46.83 50.1
0
50.00 47.47 49.23
140 20.0 67.77 64.73 54.77 58.17 50.67 46.93 47.3
3
50.10 47.07 48.27
140 30.0 67.90 65.10 54.70 58.63 50.70 47.03 47.3
3
50.03 47.07 48.17
140 40.0 68.20 65.53 55.00 59.03 51.27 47.17 46.8
3
50.27 47.23 48.83
140 50.0 67.93 65.43 54.97 59.07 51.43 47.10 47.1
3
50.20 50.00 49.33
150 -50.0 65.60 64.63 55.27 58.00 54.53 46.80 50.3
7
50.30 50.20 50.97
150 -40.0 63.87 64.03 54.90 57.87 53.23 46.80 50.0
3
49.83 50.10 50.70
150 -30.0 63.87 64.20 54.80 57.80 51.67 46.60 48.8
7
49.90 49.37 50.90
150 -20.0 64.77 64.40 54.97 58.30 50.80 46.70 48.1
7
49.90 47.13 50.90
150 -10.0 66.53 64.50 54.87 58.10 51.13 46.70 47.6
3
50.03 47.20 50.90
150 0.0 66.67 64.53 54.77 58.27 51.27 46.87 47.6
3
50.20 47.57 50.07
150 10.0 66.40 64.60 54.53 58.33 51.73 46.63 49.2
3
50.27 48.13 49.37
150 20.0 66.23 64.87 54.00 58.43 50.80 46.97 47.6
7
49.90 47.90 48.20
150 30.0 65.67 64.70 54.00 58.67 51.37 47.17 47.5
7
50.57 47.87 48.47
150 40.0 65.17 65.10 53.60 58.60 51.87 47.30 47.0
7
49.77 49.57 49.83
150 50.0 65.50 65.17 53.37 58.90 52.20 47.20 48.2
3
50.20 49.93 51.00
160 -50.0 64.83 63.93 57.13 58.33 54.60 46.70 50.3
7
50.33 49.90 50.67
160 -40.0 64.00 63.57 56.87 58.00 54.60 46.67 50.4
7
50.27 50.17 50.77
160 -30.0 63.23 64.50 56.53 57.80 54.50 46.63 49.9
0
50.27 50.20 50.53
160 -20.0 64.20 65.10 57.00 58.33 54.07 46.67 48.8
3
49.77 49.93 50.40
160 -10.0 66.20 66.00 57.20 58.90 53.93 46.67 48.2
7
49.87 48.10 50.73
160 0.0 66.23 64.97 57.07 58.30 53.50 46.77 48.1
0
50.30 47.83 50.23
160 10.0 66.70 64.43 56.80 58.00 53.70 46.87 49.3
7
49.83 48.63 49.40
160 20.0 67.37 64.00 56.70 57.60 53.17 47.07 49.1
7
50.07 49.27 49.27
160 30.0 68.73 64.20 56.83 57.73 52.80 47.23 48.7
3
49.60 49.80 49.90
160 40.0 73.63 66.23 58.53 59.47 52.73 47.27 49.6
3
49.20 50.10 50.67
160 50.0 76.77 69.37 58.83 59.90 53.77 47.30 50.0
3
49.73 50.07 51.13
170 -50.0 65.07 63.73 57.37 58.67 54.27 46.70 50.4
7
50.47 49.87 51.03
170 -40.0 70.53 67.30 59.77 60.50 54.40 46.73 50.6
7
50.47 49.97 50.97
170 -30.0 74.03 64.97 59.43 58.77 54.47 46.73 50.4
0
50.53 50.23 50.73
170 -20.0 69.60 65.37 57.13 58.50 54.77 46.70 49.9
0
50.67 50.30 50.40
170 -10.0 68.57 65.50 57.80 59.13 54.67 46.63 50.0
3
50.73 49.87 50.50
170 0.0 69.77 65.33 57.77 58.87 54.67 46.70 50.0
7
50.37 49.30 50.40
170 10.0 70.67 64.97 57.33 58.60 54.63 46.80 50.7
0
50.43 49.87 50.83
170 20.0 71.63 65.03 57.57 58.70 54.07 46.93 50.8
0
50.73 50.10 51.33
170 30.0 75.77 67.30 60.10 61.17 53.63 47.23 49.9
7
50.37 50.23 51.07
170 40.0 90.77 76.03 70.77 72.20 53.67 47.27 50.1
7
50.17 53.63 51.03
170 50.0 93.13 81.27 71.43 71.43 54.23 47.23 50.0
7
50.20 49.97 51.07
180 -50.0 65.50 66.97 57.47 58.20 54.30 46.83 50.6
3
50.67 49.80 51.07
180 -40.0 72.23 72.50 63.53 64.93 54.57 47.13 50.6
7
50.67 49.87 51.03
180 -30.0 81.97 70.47 66.73 64.93 54.67 46.80 50.5
7
50.67 50.07 50.40
180 -20.0 77.57 67.07 58.03 59.27 54.80 46.70 50.4
0
50.87 50.20 49.57
180 -10.0 73.07 67.67 58.67 60.57 54.50 46.63 50.0
0
50.83 50.00 49.57
180 0.0 74.10 66.77 58.83 60.17 54.53 46.70 50.2
0
50.97 50.43 50.47

- 17 -
180 10.0 74.63 65.60 57.97 58.47 54.70 46.90 51.2
3
50.90 50.93 51.93
180 20.0 74.63 68.10 58.63 59.60 54.00 46.83 51.2
0
50.93 50.57 51.83
180 30.0 79.33 71.63 66.67 64.60 54.03 47.17 49.9
0
51.00 50.30 51.27
180 40.0 86.43 79.43 72.53 73.03 54.47 47.27 50.2
0
50.77 50.27 51.53
180 50.0 85.13 76.07 68.00 67.83 54.53 47.17 50.3
0
50.20 49.93 51.40
190 -50.0 65.10 63.97 57.93 58.97 54.47 47.10 50.7
3
50.87 49.97 51.47
190 -40.0 69.87 69.17 59.27 61.20 54.67 47.07 50.6
0
50.83 49.97 51.60
190 -30.0 77.23 70.07 63.03 63.57 54.57 46.73 50.4
0
50.83 49.97 50.63
190 -20.0 77.10 67.13 59.03 60.40 54.60 46.33 50.3
7
50.87 50.10 49.03
190 -10.0 73.53 68.13 58.40 60.47 54.40 46.63 50.1
7
51.00 50.13 49.30
190 0.0 73.53 67.27 58.20 59.17 54.27 46.40 49.7
7
51.00 49.87 50.93
190 10.0 71.97 68.40 56.97 57.80 53.93 46.07 50.5
3
51.10 50.47 51.60
190 20.0 72.63 68.17 58.33 59.00 53.40 46.43 50.1
0
51.13 50.57 51.63
190 30.0 73.73 71.13 61.63 60.90 53.40 46.70 50.1
0
51.03 50.20 51.63
190 40.0 73.73 70.60 62.40 61.40 54.40 46.70 50.3
3
50.57 50.30 51.53
190 50.0 72.33 67.43 58.67 58.67 54.53 47.00 50.4
3
50.80 50.23 51.40
200 -50.0 64.87 64.13 59.63 60.37 54.83 46.80 50.9
7
51.03 50.10 51.67
200 -40.0 66.40 64.67 57.77 57.07 54.60 46.77 50.5
3
50.97 49.90 51.80
200 -30.0 69.50 65.67 57.93 59.40 54.77 46.33 50.3
0
50.97 50.10 51.47
200 -20.0 70.50 67.17 59.17 58.83 54.70 46.40 50.5
7
51.00 50.10 50.93
200 -10.0 69.33 67.80 58.37 59.23 54.23 46.20 49.9
7
51.03 49.30 51.17
200 0.0 68.63 67.97 57.10 58.53 54.43 44.77 49.6
0
50.93 49.23 51.47
200 10.0 67.43 67.97 55.27 57.77 54.07 45.30 49.50 51.30 50.07 51.10
200 20.0 68.17 66.13 56.53 56.77 53.90 45.97 50.10 51.30 50.37 51.57
200 30.0 69.90 67.40 57.13 57.53 53.47 46.00 50.50 51.10 50.37 51.80
200 40.0 69.73 65.60 57.03 57.83 54.50 46.00 50.73 50.70 50.50 51.77
200 50.0 67.03 64.33 56.87 57.47 54.63 46.03 50.30 51.23 50.33 51.60
210 -40.0 66.73 64.57 57.83 58.40 54.90 45.93 50.73 51.13 50.23 52.20
210 -20.0 66.57 63.27 55.83 57.30 55.07 46.13 50.70 51.07 50.10 52.00
210 0.0 65.00 63.53 56.60 57.03 55.00 46.75 49.67 51.23 49.07 51.73
210 20.0 64.50 62.60 55.37 56.23 54.47 45.90 50.20 51.27 50.37 51.93
210 40.0 65.47 63.97 56.10 57.00 54.90 46.20 50.63 50.87 50.67 51.80
220 -40.0 64.40 65.87 58.83 61.37 54.87 45.30 50.68 51.20 50.37 52.23
220 -20.0 60.20 62.53 54.37 58.07 53.30 45.40 50.73 51.10 50.30 51.97
220 0.0 60.17 64.10 54.77 57.97 55.03 46.90 50.63 51.10 50.03 51.40
220 20.0 59.10 63.57 53.60 56.93 54.63 47.43 50.63 51.20 50.50 51.47
220 40.0 63.87 64.27 56.83 56.60 55.13 47.00 50.85 51.03 50.47 51.93
230 -40.0 63.53 66.83 59.43 62.17 54.87 45.00 50.87 50.87 50.53 51.83
230 -20.0 63.93 63.30 55.27 58.50 54.87 44.90 50.83 50.77 50.50 52.00
230 0.0 64.00 63.47 54.84 57.43 55.13 46.77 50.50 50.83 50.70 51.87
230 20.0 62.00 62.60 53.73 56.77 55.03 48.50 50.63 50.90 50.73 52.07
230 40.0 63.97 66.70 58.83 61.00 55.23 47.23 50.57 50.87 50.93 51.87
240 -40.0 67.63 67.97 60.60 62.80 54.90 44.10 50.77 50.97 50.73 52.03
240 -20.0 64.33 65.13 57.80 61.00 55.00 47.30 50.90 50.83 50.77 52.03
240 0.0 64.07 64.37 56.37 59.47 55.07 47.20 50.90 50.80 50.87 52.03
240 20.0 62.70 63.70 55.53 58.23 55.00 48.80 50.90 50.90 50.73 52.10

- 18 -
280 -40.0 71.77 69.73 60.70 64.13 54.67 51.73 50.90 51.03 51.00 52.30
280 -20.0 72.00 69.07 60.53 63.33 55.00 51.30 50.70 50.97 50.90 52.33
280 0.0 72.23 71.00 61.47 64.03 55.37 50.47 51.17 50.97 51.03 52.37
280 20.0 71.37 68.77 58.63 62.90 55.00 49.80 50.77 50.87 50.93 52.33
280 40.0 72.13 69.57 59.70 63.87 54.97 49.77 50.93 50.87 50.90 52.27
290 -40.0 71.87 70.07 60.97 64.27 54.93 51.10 50.97 51.03 51.03 52.33
290 -20.0 72.77 69.80 60.03 63.07 55.10 50.77 50.63 50.93 50.87 52.20
290 0.0 74.00 70.43 60.10 63.10 55.50 50.33 51.07 51.03 50.77 52.43
290 20.0 72.30 69.73 59.00 63.70 55.13 50.20 50.93 50.97 51.03 52.47
290 40.0 72.43 69.73 59.80 64.07 55.07 50.03 50.83 50.93 50.80 52.33
300 -40.0 72.57 70.40 61.03 64.63 55.03 50.63 50.63 51.00 50.97 52.27
300 -20.0 72.33 70.30 59.47 64.40 55.10 50.40 50.90 50.97 50.83 52.27
300 0.0 73.87 69.03 59.50 62.70 55.13 50.13 50.73 50.20 50.47 51.67
300 20.0 72.37 70.23 58.97 64.43 55.37 49.83 50.70 51.00 51.03 52.47
300 40.0 72.33 70.00 60.47 64.23 55.17 49.67 50.60 50.93 50.83 52.30
310 -40.0 72.63 70.50 61.10 65.03 55.23 50.57 50.50 51.00 50.97 52.27
310 -20.0 71.57 70.37 60.17 64.70 55.23 50.47 50.57 50.97 50.90 52.30
310 0.0 73.47 69.57 59.80 64.30 55.27 50.23 50.67 50.90 50.83 52.37
310 20.0 72.10 70.73 59.43 65.00 55.40 49.77 50.67 50.97 50.97 52.47
310 40.0 72.37 70.30 60.53 64.60 55.30 49.80 50.63 50.97 50.97 52.43
320 -40.0 72.80 70.63 60.90 65.13 55.40 50.47 50.60 50.87 50.90 52.27
320 -20.0 69.93 70.47 60.20 64.80 55.27 50.57 50.40 50.93 50.83 52.27
320 0.0 72.67 68.97 60.40 62.93 55.40 50.43 50.60 50.83 50.70 52.33
320 20.0 71.27 70.67 59.63 63.27 55.53 50.00 51.03 50.97 50.90 52.33
320 40.0 72.03 70.33 60.90 63.47 55.40 50.00 50.93 50.93 50.87 52.27
330 -40.0 72.70 70.70 61.30 64.93 55.57 50.73 51.03 51.00 50.97 52.30
330 -20.0 71.13 70.03 60.57 64.17 55.33 50.87 50.97 50.93 50.90 52.27
330 0.0 70.57 70.30 60.87 63.13 55.37 50.70 51.03 50.97 50.87 52.40
330 20.0 70.20 70.53 60.53 63.67 55.67 50.10 51.00 50.93 50.83 52.33
330 40.0 71.60 70.30 61.50 64.37 55.57 50.03 50.93 50.93 50.83 52.30
240 40.0 66.53 66.63 59.43 62.30 55.10 48.13 50.80 50.97 50.97 52.03
250 -40.0 70.10 69.40 60.87 63.20 54.93 46.33 50.90 51.07 50.67 52.17
250 -20.0 65.60 67.67 59.67 63.27 54.87 47.97 50.93 50.87 50.83 52.07
250 0.0 65.30 66.63 58.53 62.17 55.00 48.50 50.90 50.70 50.90 52.00
250 20.0 64.27 65.90 58.33 61.20 55.07 49.80 50.90 50.97 50.83 52.23
250 40.0 69.67 68.10 59.50 62.73 54.97 48.77 50.83 50.90 50.83 52.03
260 -40.0 71.73 69.87 61.13 64.13 54.93 49.83 50.83 51.00 50.70 52.20
260 -20.0 67.70 69.50 61.00 63.13 54.70 50.40 50.73 50.83 50.83 52.03
260 0.0 66.27 67.87 60.63 63.73 54.93 49.57 50.93 50.87 50.93 52.07
260 20.0 66.57 67.17 59.33 62.47 55.10 50.07 51.03 51.03 51.00 52.33
260 40.0 71.00 68.40 60.33 62.87 54.93 49.57 50.87 50.87 50.80 52.20
270 -40.0 72.40 69.70 60.87 63.83 54.87 51.20 50.90 50.93 50.80 52.27
270 -20.0 70.87 69.80 61.20 64.17 54.77 51.13 50.87 50.93 50.90 52.10
270 0.0 69.00 70.00 61.73 64.57 55.00 50.20 51.00 50.93 50.90 52.20
270 20.0 69.73 68.27 58.77 63.20 55.10 49.87 51.07 51.00 50.93 52.37
270 40.0 71.87 69.03 60.07 63.43 55.03 49.83 50.90 50.93 50.97 52.23

- 19 -
340 -40.0 72.40 70.70 61.60 65.03 55.57 50.87 50.97 50.97 50.97 52.27
340 -20.0 71.40 70.17 61.30 64.07 55.47 51.27 50.97 51.03 51.00 52.30
340 0.0 71.63 69.93 60.80 64.07 55.60 51.30 50.83 50.93 50.77 51.97
340 20.0 70.97 70.73 61.20 64.37 55.70 50.43 50.97 50.97 50.83 52.30
340 40.0 71.70 70.57 61.67 64.87 55.73 50.50 50.97 50.70 50.87 52.30
350 -40.0 74.03 71.67 62.87 65.70 55.87 52.13 51.33 51.47 51.50 52.83
350 -20.0 73.67 70.53 62.40 65.13 55.60 52.40 51.33 51.50 51.37 52.83
350 0.0 72.60 70.43 62.43 64.87 55.70 52.73 51.27 51.50 51.30 52.87
350 20.0 72.50 70.83 61.97 65.83 55.97 52.03 51.40 51.50 51.37 52.93
350 40.0 73.10 71.03 63.20 65.57 55.83 51.87 51.33 51.43 51.20 52.90
360 -40.0 73.60 71.63 63.20 66.00 55.87 52.60 51.43 51.53 51.47 52.90
360 -20.0 73.57 71.13 62.67 65.60 55.73 53.27 51.37 51.50 51.50 52.83
360 0.0 73.03 70.23 62.80 65.43 55.87 53.40 51.37 51.53 51.40 52.90
360 20.0 72.30 70.57 62.80 66.13 56.20 52.73 51.43 51.53 51.40 52.97
360 40.0 73.20 71.00 63.07 65.57 56.00 52.63 51.40 51.47 51.30 52.90
400 -40.0 72.97 71.03 60.57 63.93 52.17 52.77 49.90 50.20 49.97 50.93
400 -20.0 72.43 71.07 60.50 64.70 52.20 52.43 50.00 50.27 49.80 50.93
400 0.0 72.80 71.07 60.23 64.63 53.07 52.63 46.97 50.17 50.03 50.93
400 20.0 73.30 71.00 60.13 64.53 51.37 52.03 48.50 47.83 50.00 50.60
400 40.0 73.07 70.70 60.00 64.27 51.43 52.43 50.00 50.00 50.00 50.67
370 0.0 75.93 70.60 63.00 65.87 57.57 53.67 51.27 51.53 51.23 52.87
380 0.0 75.40 70.95 63.10 66.00 56.23 53.37 51.43 51.70 51.43 52.97
390 0.0 75.33 71.27 63.13 66.00 56.07 53.27 51.43 51.70 51.47 52.93
410 0.0 73.33 71.10 60.73 64.97 50.07 51.20 38.87 39.03 39.97 42.13
420 0.0 73.60 71.20 60.77 65.00 50.10 51.20 38.93 39.10 40.07 41.90
430 0.0 73.50 71.17 60.80 64.83 50.03 51.13 39.00 39.07 40.17 42.03

- 20 -
Appendix C
Experiment 1
Figure B.1 The pressure distribution of the Check condition in experiment 1 (Twin peaks category)
Figure B.2 The pressure distribution of the Design condition in experiment 1 (Twin peaks category)

- 21 -
Figure B.3 The pressure distribution of the Normal condition in experiment 1 (Twin peaks category)
Figure B. 4 The pressure distribution of the Energy dissipation condition in experiment 1 (no water cushion penetration)

- 22 -
Figure B.5 The pressure distribution of the Surface condition in experiment 1 (Close to dam impinge category)
Figure B.6 The pressure distribution of the Deep condition in experiment 1 (No water cushion penetration category)

- 23 -
Figure B.7 The pressure distribution of the 1+6 condition in experiment 1 (Close to dam impinge category)
Figure B.8 The pressure distribution of the 2+5 condition in experiment 1 (No water cushion penetration category)

- 24 -
Figure B.9 The pressure distribution of the 1+6 condition in experiment 1 (No water cushion penetration category)
Figure B. 10 The pressure distribution of the 1+3+5 condition in experiment 1 (Close to dam impinge category)

- 25 -
Experiment 2
Figure B.11 The pressure distribution of the Check condition in experiment 2 (Twin peaks category)
Figure B.12 The pressure distribution of the Design condition in experiment 2 (Twin peaks category)

- 26 -
Figure B.13 The pressure distribution of the Normal condition in experiment 2 (Twin peaks category)
Figure B. 14 The pressure distribution of the Energy dissipation condition in experiment 2 (Twin peaks category)

- 27 -
Figure B.15 The pressure distribution of the Surface condition in experiment 2 (Close to dam impinge category)
Figure B.16 The pressure distribution of the Deep condition in experiment 2 (No water cushion penetration category)
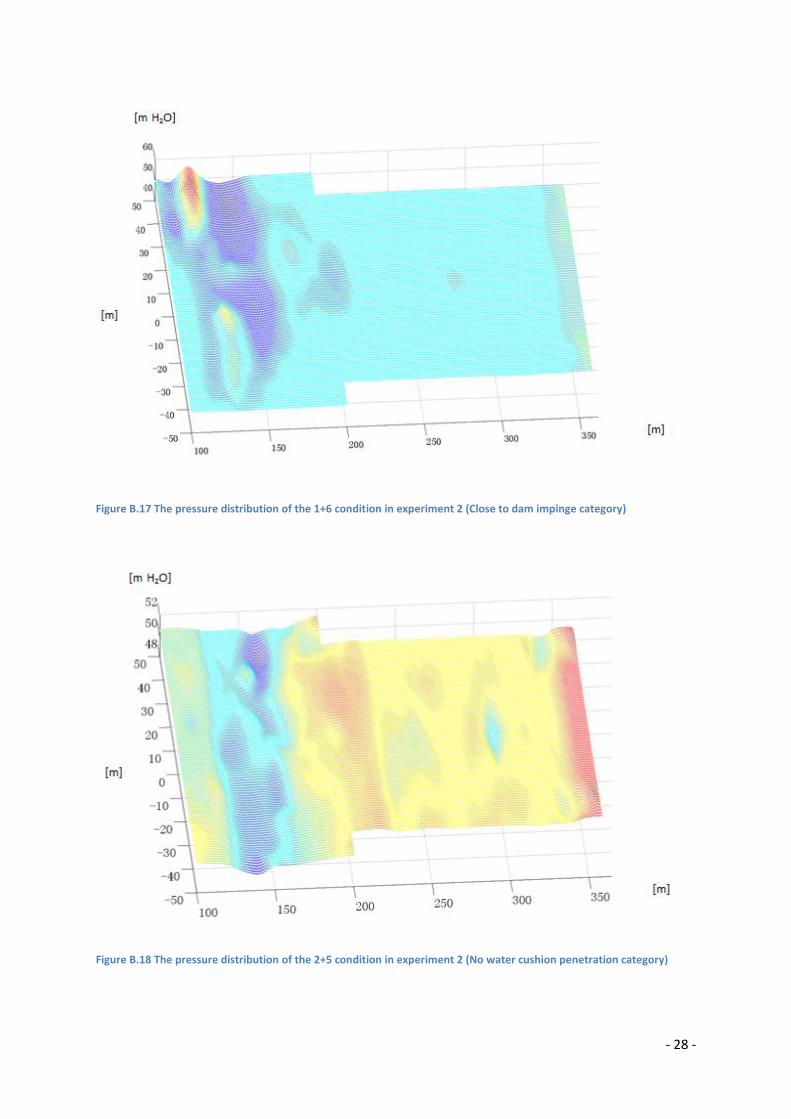
- 28 -
Figure B.17 The pressure distribution of the 1+6 condition in experiment 2 (Close to dam impinge category)
Figure B.18 The pressure distribution of the 2+5 condition in experiment 2 (No water cushion penetration category)

- 29 -
Figure B.19 The pressure distribution of the 3+4 condition in experiment 2 (No water cushion penetration category)
Figure B. 20 The pressure distribution of the 1+3+5 condition in experiment 2 (Close to dam impinge category)

- 30 -
Experiment 3
Figure B. 21 The pressure distribution of the Check condition in experiment 3 (Twin peaks category)
Figure B. 22 The pressure distribution of the Design condition in experiment 3 (Twin peaks category)

- 31 -
Figure B.23 The pressure distribution of the Normal condition in experiment 3 (Twin peaks category)
Figure B. 24 The pressure distribution of the Energy dissipation condition in experiment 3 (Twin peaks category)

- 32 -
Figure B.25 The pressure distribution of the Surface condition in experiment 3 (Close to dam impinge category)
Figure B.26 The pressure distribution of the Deep condition in experiment 3 (No water cushion penetration category)

- 33 -
Figure B.27 The pressure distribution of the 1+6 condition in experiment 3 (Close to dam impinge category)
Figure B. 28 The pressure distribution of the 2+5 condition in experiment 3 (No water cushion penetration category)

- 34 -
Figure B.29 The pressure distribution of the 3+4 condition in experiment 3 (Close to dam impinge category)
Figure B.30 The pressure distribution of the 1+3+5 condition in experiment 3 (Close to dam impinge category)

- 35 -
Appendix D
Flow velocity in the plunge pool (240 m ≤ Y ≤ 320 m)
The flow velocities in the XY-direction (section) is presented below.
Figure D.1 Flow velocity in the XY-direction at Y=240 m
Figure D.2 Flow velocity in the XY-direction at Y=260 m
0
5
10
15
20
25
30
0 5 10 15 20
Ve
loci
ty [
ms-1
]
Time [s]
Check
Design
Normal
0
5
10
15
20
25
0 5 10 15 20
Ve
loci
ty [
ms-1
]
Time [s]
Check
Design
Normal
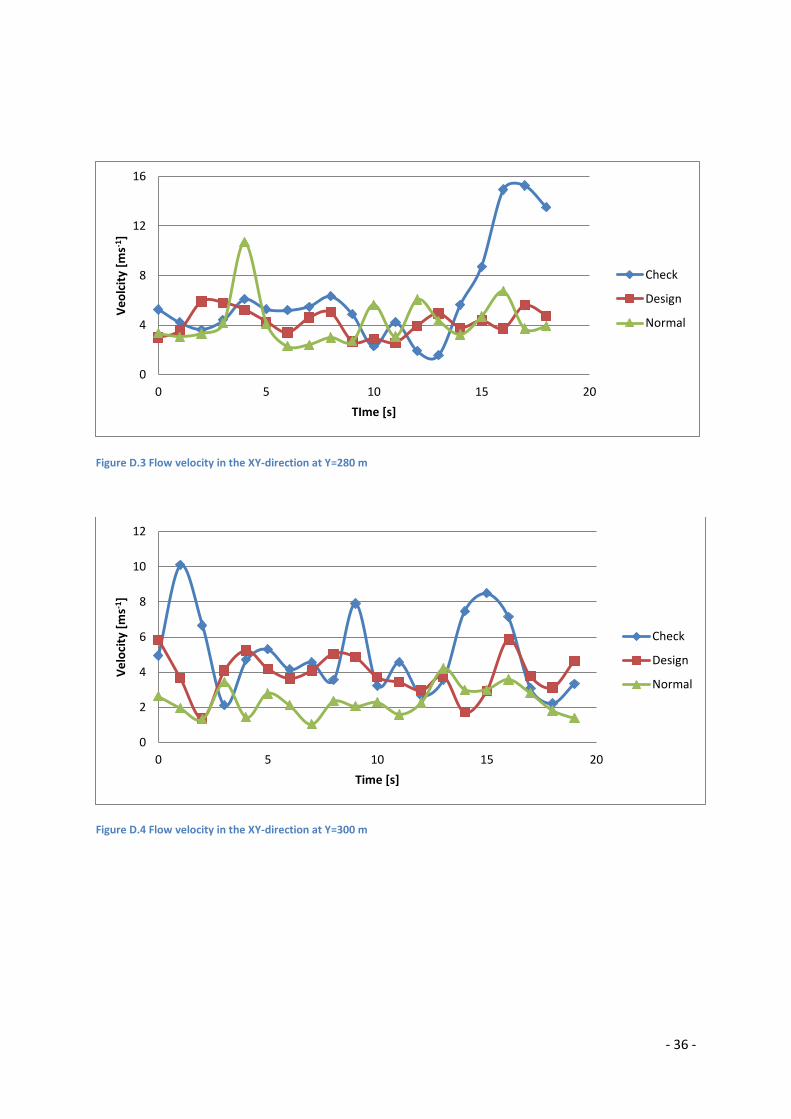
- 36 -
Figure D.3 Flow velocity in the XY-direction at Y=280 m
Figure D.4 Flow velocity in the XY-direction at Y=300 m
0
4
8
12
16
0 5 10 15 20
Ve
olc
ity
[ms-1
]
TIme [s]
Check
Design
Normal
0
2
4
6
8
10
12
0 5 10 15 20
Ve
loci
ty [
ms-1
]
Time [s]
Check
Design
Normal

- 37 -
Figure D.5 Flow velocity in the XY-direction at Y=320 m
Flow velocity upstream of the second dam (Y=340 m and Y=360 m)
The flow velocities just upstream of the second dam in the Y-direction are presented below.
Figure D.6 Flow velocity in the Y-direction at Y=340 m
0
1
2
3
4
5
6
7
0 5 10 15 20
Ve
loci
ty [
ms-1
]
Time [s]
Check
Design
Normal
-5
-4
-3
-2
-1
0
1
2
0 5 10 15 20 25
Ve
loci
ty [
ms-1
]
Time [s]
Check Y
Design Y
Normal Y

- 38 -
Figure D.7 Flow velocity in the Y-direction at Y=360 m
-4
-3
-2
-1
0
1
0 5 10 15 20
Ve
loci
ty [
ms-1
]
Time [s]
Check Y
Design Y
Normal Y