SAFETY AND TRANSPORT SAFETY
27
SAFETY AND TRANSPORT SAFETY Simulation of rubber materials for seals in use in nuclear power plants Johan Sandström RISE Report 2019:19
Transcript of SAFETY AND TRANSPORT SAFETY

SAFETY AND TRANSPORT SAFETY
Simulation of rubber materials for seals in use in nuclear power plants
Johan Sandström
RISE Report 2019:19

© RISE Research Institutes of Sweden
Simulation of rubber materials for seals in use in nuclear power plants
Johan Sandström

1
© RISE Research Institutes of Sweden
Abstract Simulation of rubber materials for seals in use in nuclear
power plants
Finite element (FE) simulations of how rubber materials for seals behave over time is
performed. The application is seals for nuclear power plants where seals are exposed to
elevated levels of ionizing radiation and temperature.
A major challenge for the simulations is to find an appropriate material model for the
rubber materials and how to calibrate it to experiments. Here is a material model
proposed that can include effects like creep, permanent set, and temperature
dependence. Calibration of material models for relaxation tests on EPDM rubber is
performed and presented with good results. Simulations of leak and tightness of seals
are evaluated and some initial observations on the effects temperature and ageing on the
tightness are made.
Key words: Seals, Calibration, Hyper-elasticity, Visco-elasticity, Rubber, Nuclear
Power
RISE Research Institutes of Sweden AB
RISE Report 2019:19
ISBN: 978-91-88907-45-5
Göteborg 2019

2
© RISE Research Institutes of Sweden
Content Abstract ....................................................................................................... 1
Content ...................................................................................................... 2
1 Introduction......................................................................................... 3
Outline ............................................................................................................... 3
2 Material modelling ............................................................................... 4
Elasticity ............................................................................................................ 4
Creep ...................................................................................................................5
Plasticity ............................................................................................................. 6
Temperature effects ........................................................................................... 6
3 Calibration to relaxation tests .............................................................. 7
Test data ............................................................................................................. 8
Simulation .......................................................................................................... 9
Results ............................................................................................................... 11
Temperature effects .......................................................................................... 13
4 Compressive set and validation ........................................................... 15
Test data ............................................................................................................ 16
Simulation ......................................................................................................... 17
5 Leak and tightness .............................................................................. 19
6 Conclusions and discussion ................................................................ 21
7 Acknowledgements ............................................................................ 23
8 References ......................................................................................... 24
3
© RISE Research Institutes of Sweden
1 Introduction This report is about simulation of seals in nuclear power plants. It is a continuation of
the report [1] that is part of the COMRADE project [2]. The purpose of the project, which
this work is part of, is to evaluate how materials for seals degrade in a nuclear power-
plant environment and how to measure this degradation. The permanent set test is a
common way to evaluate the state of seals in nuclear applications. It is the expectation
that the findings and results of this report can be of aid to nuclear power plant
maintenance to understand the behaviour of the seals and develop new methods for the
analysis of seals.
The particular aim of this report is the development of simulation methods that can be
used to evaluate test methods of aged seals e.g. compression set and how they perform
in service i.e. provide leak tightness. The developed methods should both be models that
are of direct use and lay a basis for more advanced development on both numerical
simulations techniques and materials modelling. Further information on the project and
testing is available in [3].
Seals are typically made of a rubber material e.g. EPDM and have, for instance, the form
of O-rings. An issue with rubber materials is their creep behaviour i.e. they deform over
time at constant load and can also retain a permanent deformation – permanent set. This
can reduce the sealing function since the compressive force on the seal decreases which
can cause penetration of the pressurized fluid to be contained by the seal. A further
complication in nuclear power applications is elevated temperatures and ionizing
radiation levels which can accelerate or initiate degradation like creep in polymers such
as rubbers.
The simulation is performed with finite element (FE) modelling. The advantage of FE
modelling is that complex geometry and material behaviour can be handled. In this case
the complicated behaviour of the rubber becomes the major difficulty to address here.
Outline In this report, some parts of [1] are here re-given while in other parts, a reference to [1]
is made. The continuation from report [1] is use of better relaxation tests for material
model calibration and also incorporating temperature effects. The calibrated material
model is then used to simulate compression set tests which are a standardized test to
evaluate seal materials in this application. Results from performed compressions set
testing are compared to the simulated results. This comparison can be seen as a
validation of the calibrated material model. Finally, the capability of simulation of leak
tightness is tested and evaluated.
4
© RISE Research Institutes of Sweden
2 Material modelling Rubber is a material that compared to most other engineering materials can undergo
extreme deformation and after loading (nearly) go back to the undeformed shape. This
property makes rubber suitable for seals when assembled in pipe joints. This is because
the rubber material is heavily deformed compared to the surrounding materials e.g. steel,
which causes it to maintain the sealing pressure all times at. This type of extreme
deformation is modelled with hyper-elasticity material models which is a generalization
of linear elasticity (Hooke’s law) that is only valid for small strains. Rubber also exhibits
other behaviours like creep and permanent set. For further reading refer to e.g. [4].
Elasticity The constitutive theory of hyper-elasticity is based on an energy density potential from
which the relation between strain and stress is derived. The use of an energy potential
leads to that the deformation is reversible causing the material to go back to the original
shape (a property of elasticity). Many choices of energy potentials exist that can be used
to model rubber, e.g. Neo-Hookean, Mooney-Rivlin, Arruda-Boyce, Ogden, and Yeoh.
An O-ring in a normal application is subjected to compressive strain of moderate
magnitude (stretch 0.5 or engineering strain -50 %). In such conditions where the strains
are compressive together with moderate shear strains, the Neo-Hookean type material is
fully adequate [5], [6] and is here chosen for the elastic part of the material modelling.
The more advanced hyper-elastic models are more suitable and needed for cases with
large tensile strains where the polymer molecular-chains get heavily stretched.
The Neo-Hookean energy potential is the most simple and is
𝜙 = 𝐶10(𝐽−2 3⁄ 𝐼1 − 3) +1
𝐷1
(𝐽 − 1)2 (1)
where 𝐼1 = 𝜆12 + 𝜆2
2 + 𝜆32 is the first invariant, 𝐽 = 𝜆1𝜆2𝜆3 is the volume ratio and 𝜆𝑖 are
principal stretches. It can be regarded as an extension of the linear elastic material model
(Hooke’s generalized law) and is valid for large strains. Like the linear elastic model, it
has only two material parameters: 𝐶10 and 𝐷1that govern elasticity similarly as Young’s
modulus 𝐸 and the bulk modulus respectively in linear elasticity. In linear elasticity one
often defines the behaviour with the parameter Poisson’s ratio 𝜈 which relates to the
compressibility. In the small strain limit, hyper-elastic material models approach the
linear elastic behaviour where expressions for 𝐸 and 𝜈 can be formed. For the Neo-
Hookean model the relations are
𝐶10 =𝐸
4(1 + 𝜈)
(2)
𝐷1 =6(1 − 2𝜈)
𝐸 (3)

5
© RISE Research Institutes of Sweden
Creep The creep and permanent set behaviours of the rubber are combined with hyper-
elasticity in a rheological model. The modelling here is composed of parallel chains with
an elastic component and a viscous component apart from one chain which instead have
a plasticity component to include permanent set. The rheological network is portrayed
in Figure 1 and is in the numerical FE-implementation generalized to 3 dimensions. All
elasticity (springs in Figure 1) are modelled with the same hyper-elastic model while each
chain (dash-pots) has different viscous behaviours. Furthermore, the stress in each chain
is scaled with an individual factor 𝑆𝑖 (index 𝑖 representing chain number starting from
zero for the elastic(plastic)-part) so they add with different amounts to the total response.
The sum of all 𝑆𝑖 adds up to 1.
Figure 1 Rheological network with multiple chains where the springs model hyper-elasticity, dash-pots model viscoelasticity and one slider models plasticity.
The viscoelastic behaviour gives effects like creep and relaxation. The dash-pots in Figure
1 represent viscoelastic behaviour given by a creep law – a differential equation
governing the creep rate 𝜖�̇�𝑟 of the form
𝜖�̇�𝑟 =𝑑𝜖𝑐𝑟
𝑑𝑡= 𝑓(𝜎, 𝜖, 𝑡; 𝑷) (4)
where 𝜎 is stress, 𝜖 is strain, 𝑡 is time and 𝑷 are material parameters. Various creep laws
exist that can be used in the rheological network. Mixing of different creep laws in one
rheological network is possible. Two examples of creep laws that are tried here are given
below.
One is of strain hardening type and is used in a similar application [6] and given by
𝜖�̇�𝑟 = (𝐴𝜎𝑒𝑛[(𝑚 + 1)𝜖𝑐𝑟]𝑚)
1𝑚+1 (5)
where 𝐴, 𝑛, 𝑚 are material parameters and 𝜎𝑒 is the von Mises effective stress.

6
© RISE Research Institutes of Sweden
Another creep law developed specifically for hysteresis in rubbers is the Bergstrom-
Boyce model [7] which is given by
𝜖�̇�𝑟 = 𝐴(𝜆𝑐𝑟 − 1 + 𝐻)𝐶𝜎𝑒𝑚 (6)
where 𝐴, 𝐶, 𝑚 are material parameters and 𝜆𝑐𝑟 is a stretch measure. 𝐻 is a constant to
regularize the creep strain rate near the undeformed state, the value 𝐻 = 0.01 is used
here. The parameter 𝐶 is restricted to the interval -1 to 0 while typically it has the value
𝐶 = −1 for common rubbers. The parameter 𝑚 is generally greater than 1.
Plasticity The plasticity that gives the permanent set behaviour is included with the slider as
depicted in Figure 1. Various models exist for plasticity. Either is a regular method for
plasticity modelling with a von Mises yield surface and linear isotropic hardening, or
more advanced plasticity models, used.
Temperature effects Temperature dependence can also be included for the creep behaviour by applying
Arrhenius shift factors to the creep rate. Each chain can have an individual temperature
dependence. The temperature (𝑇) dependent 𝜖�̇�𝑟,𝑇 is thus implemented so that the
reference creep rate 𝜖�̇�𝑟 is multiplied by a temperature dependent factor 𝑎(𝑇) , i.e.
𝜖�̇�𝑟,𝑇 = 𝑎(𝑇)𝜖�̇�𝑟 (7)
Arrhenius equation can be written in various but equivalent ways. Here it is written in
the form
𝑎(𝑇) = exp (−𝐸0
𝑅(
1
𝑇 − 𝑇𝑧−
1
𝑇0 − 𝑇𝑧)) (8)
where 𝐸0 is the activation energy, 𝑅 is the universal gas constant, 𝑇𝑧 is the absolute zero
in the temperature scale being used and 𝑇0 is the reference temperature at which 𝜖�̇�𝑟 is
given for. This formulation of Arrhenius equation is convenient because it is easy
implemented for a case when the creep rate is defined at 𝑇0 and is known at another
temperature.

7
© RISE Research Institutes of Sweden
3 Calibration to relaxation tests The material-model calibration is performed for a relaxation test. A relaxation test is
performed by constant compression of a specimen while the force required to hold
compression is monitored.
In such a test the stress and strain in the material cannot be calculated directly due to
non-uniform deformation. Instead, and as previously discussed, the specimen is
modelled with a FE model that handles the complicated deformation. The resulting
quantities, total compressive displacement and compressive force are then available
from the FE calculation and can then be compared to the experiments. The FE software
package Abaqus/Standard version 2018 [8] is used for simulations.
The specific behaviour of material models is determined by the parameters in the model.
In an engineering application, the parameters are calibrated to the materials in use. The
process of calibration takes place by adjusting the parameters, so the response of the
model matches a test with a material sample. When the material model is complex,
advanced methods for fitting the parameters to test data are usually needed. The method
for this fitting is referred to as an optimization and is typically conducted so an error
measure between test data and predicted values from simulation is minimized.
An introduction of the optimization methodology is given in [1]. The optimization
method that is used here is the quasi-Newton method with the Hessian approximated
with the BFGS method and gradient approximated with finite differences. The software
Dakota [9] is here used to perform the optimization. Dakota is a free open source
software that includes all the methods described here and is developed by National
Technology and Engineering Solutions of Sandia.
8
© RISE Research Institutes of Sweden
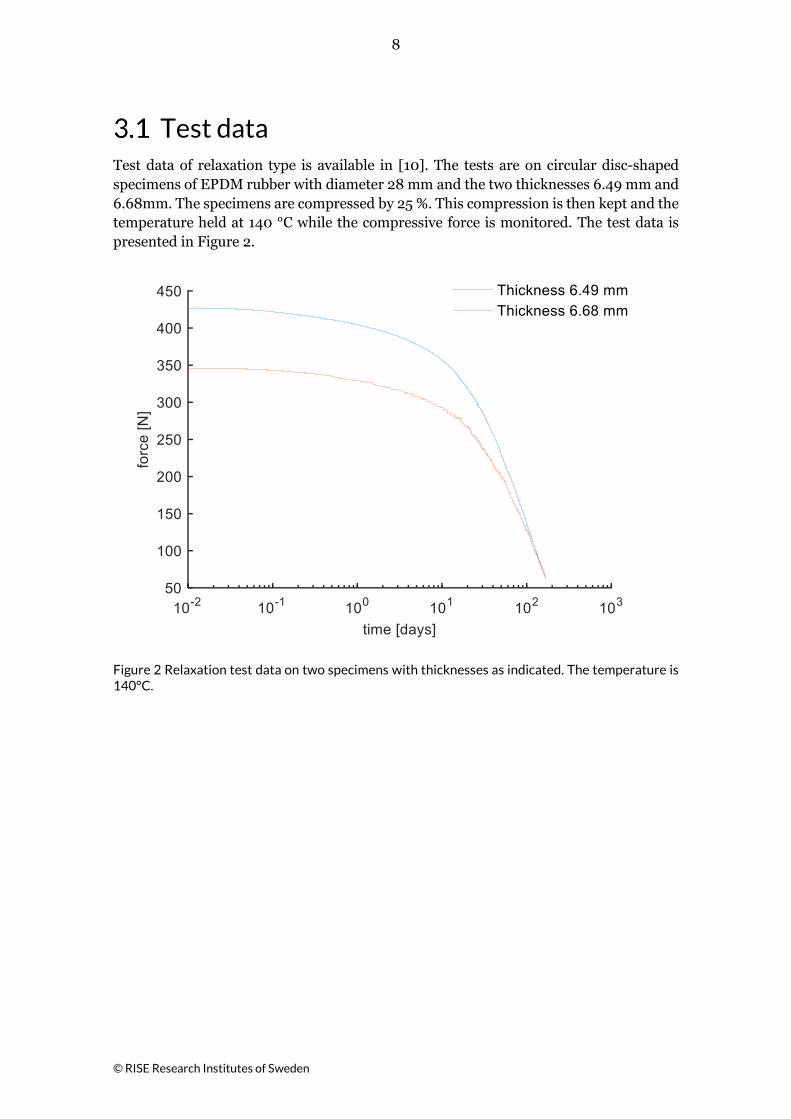
Test data Test data of relaxation type is available in [10]. The tests are on circular disc-shaped
specimens of EPDM rubber with diameter 28 mm and the two thicknesses 6.49 mm and
6.68mm. The specimens are compressed by 25 %. This compression is then kept and the
temperature held at 140 °C while the compressive force is monitored. The test data is
presented in Figure 2.
Figure 2 Relaxation test data on two specimens with thicknesses as indicated. The temperature is 140°C.

9
© RISE Research Institutes of Sweden
Simulation The simulation of relaxation is performed by modelling a rubber body that is compressed
between rigid planes. Since the specimens are circular, a 2D axi-symmetric geometry can
be used. Symmetry is also used in the vertical z-direction in the middle of body. Hence
only a 2D simulation of a quarter of the body cross section is explicitly modelled. The
geometry is depicted in Figure 3.
Figure 3 Geometry in the model. Dashed lines represent the boundaries of the part that are not used in the model due to symmetry. Symmetry lines and axes are represented by dash-dot lines.
The solving is performed with implicit quasi-static time integration, i.e. no inertia forces
are taken into account. The elements used are linear 2D axi-symmetric elements with a
hybrid formulation (Abaqus designation “CAX4RH”). Since rubber is nearly
incompressible, the hybrid formulation is needed since it treats the pressure in the
element as a separate degree of freedom. Without it, the pressure is un-determinate for
fully incompressible materials or causing numerical difficulties for nearly incompressible
materials. In Figure 4 is the FE mesh and rigid plane depicted. The mesh in the right-
hand side is deliberately made unstructured in a specific way that makes the shape of the
elements to get better quality when the rubber deforms heavily.
Figure 4 FE mesh and rigid plane (upper line).

10
© RISE Research Institutes of Sweden
The horizontal symmetry is achieved by setting the vertical displacements to zero along
the horizontal symmetry line. The axi-symmetry is achieved by using axi-symmetric
elements. The rigid plane is constrained in all degrees of freedom including rotational.
The rigid plane interacts with the body through contact using 0.5 as coefficient of
maximum friction.
The loading takes place by forcing the rigid plane down towards the horizontal symmetry
line. To model the relaxation loading, the plane is in a first step moved half (to account
for vertical symmetry) the distance of the total compression. Then in a second step the
displacement of the rigid plane is fixed while the reaction force is monitored as resulting
force to be compared to relaxation tests. In Figure 5 are FE simulation results given
before and after relaxation starts, using the material parameters from calibration in the
results section 3.3.
Figure 5 FE simulation results before relaxation (upper) and at end of relaxation simulation (lower). The color contour is minimum (compressive) principal strain and the arrows are the reaction force in Newtons.

11
© RISE Research Institutes of Sweden
Results Different material models have been investigated for calibration to relaxation testing as
described previously. In the preceding work in project, as described in [1], the strain
hardening creep model (equation (5)) was used to model the relaxation. Here, instead
the Bergstrom-Boyce creep model (equation (6)) is used. This model has been found to
be advantageous due to better convergence in the nonlinear solving of the FE problem.
The strain hardening creep model have difficulties to solve the very long relaxation times
of more than 10 million seconds. This manifests in small time steps that makes the
simulation too long to complete. The Bergstrom-Boyce creep model did not suffer from
this in any significant way.
The elastic parts in the rheological network have the same hyper-elastic model. Since the
Neo Hookean model is used, only two parameters are needed for the elastic part. In [6]
where similar simulations and calibrations were performed for EPDM rubber, Neo-
Hookean parameters corresponding to Poisson’s ratio 0.48 for the small-strains linear-
elastic limit were found to be suitable. Therefore, the elastic parameters are also here
chosen to similarly match Poisson’s ratio 0.48. Then the elastic parameters also need to
be adjusted to match the stiffness seen in the test. This can be performed simply by
manually adjusting one of the material constants in the Neo-Hookean model and
calculating the other keeping Poisson’s ratio fixed at 0.48 using equations (2) and (3) so
the simulated response matches the initial measurements using the first evaluation point
as described later. The resulting parameters are 𝐶10 = 1.0389 MPa and 𝐷1 =
0.039024 MPa-1 which correspond to Young’ modulus 6.15 MPa in the small strain linear
elastic limit.

12
© RISE Research Institutes of Sweden
The calibration for the creep model is performed as described here for the tests in Figure
2 and one viscous component in the rheological model (Figure 1). The resulting
comparison between tests and simulation with the calibrated model is presented in
Figure 6 and resulting FE-results are given in Figure 5. The difference between simulated
values for different thicknesses is indistinguishable. Consequently, only one simulated
curve is used. This is due to that the compression is relative (25 %) to the thickness.
Figure 6 Relaxation forces from the tests (solid lines) and the simulation (dashed line) with the material model and calibrated material parameters. The circles are evaluation points from the testing data and the x-markers are evaluation points from the simulations.
The resulting calibrated parameters are given in Table 1. It is noted that the parameter 𝑆
is 1.0 implicating that the rheological mode becomes a simple one-chain model without
any pure elastic part. The optimization procedure has been conducted with the constraint
𝑚 ≥ 1. Here it is noted that the optimization gives the smallest allowed value. Values
lower than 𝑚 = 1 are not typical [7] and the effect of this have not been further explored
here.
Table 1 Calibrated parameters for the material model.
Parameter Calibrated value
A [MPa-ms-1] 1.0233·10-9
𝐶 -1.0
𝑚 1.0
𝑆1 1.0

13
© RISE Research Institutes of Sweden
Inclusion of a plasticity part in the material model has not been successfully performed
here. This is in large part probably due to that for a single relaxation test it is difficult to
distinguish between the effects of elasticity, plasticity and creep. The consequence will
be difficulty to perform the optimization due to an ill-posed mathematical problem.
Temperature effects Relaxation tests from the project are available in [10]. These are conducted for the
temperatures 90 °C, 120 °C and 140 °C and given in Figure 7. It is noted that the data for
90 °C is deviating from what is expected since it does not start at the same force value.
The cause of this is not known, consequently the 90 °C data is not used here.
Figure 7 Relaxation for different temperatures.
If the amount of relaxation is taken as the decreasing change in force, it is seen that the
90 °C test have little relaxation while the 120 °C test relaxes about half the amount of the
140 °C test. To better quantify and illustrate this, the measure relative relaxation is
defined here and calculated as follows.
1. Each relaxation test is normalized to its initial (and maximum) force
2. The normalized 90 °C data and 120 °C data are each subtracted from the normalized 140 °C data. The resulting quantity is then the here defined relative relaxation (to the 140 °C test)
This relative relaxation is presented in Figure 8.

14
© RISE Research Institutes of Sweden
Figure 8 Relative relaxation compared to the 140 °C test.
It is possible to make a calibration of the thermo-effects modelling with the optimization
methods used previously. To simplify the work another, much simpler, procedure is
instead attempted. It is realized that since the 120 °C test relaxes about half as much as
the 140 °C test (except in the beginning) the creep rate is about a factor of 0.5 between
the 120 °C and 140 °C temperatures. Accordingly, it can further be realized, for the
temperature dependent factor defined by equation (8), that 𝑎(120) = 0.5 when 𝑇0 =
140 °C. The activation energy 𝐸0 in Arrhenius equation (8) can then be solved for since 𝑅
and 𝑇𝑧 are known constants in equation (8). The resulting activation energy then
becomes 𝐸0 = 46805 J/mol.
This will be further used for analysing the compression set testing in the next section.
15
© RISE Research Institutes of Sweden
4 Compressive set and validation The compressive set test measures the permanent deformation of a rubber seal and is
described in the standard ISO 815 [11]. It is conducted by compression of the seal for a
certain ageing time. The compression is then released and the height of the seal is
measured. The permanent set is then defined as
ℎ0 − ℎ1
ℎ0 − ℎ𝑠100% (9)
with
ℎ0 – original height of the seal
ℎ𝑠 – height of the seal during the compression
ℎ1 – height of the seal after the release
The test rig used here also has a cylindrical outer wall that acts as a confinement on the
outer perimeter of O-ring.
The compression set data will here be used for validation of the simulation model. This
means that the model calibrated from the relaxation test is used to simulate the
compression set test as a validation. If the simulation results matches the validation test,
the model is said to be validated.

16
© RISE Research Institutes of Sweden
Test data Test data is available for compression test for various ageing times and temperatures in
[10]. The O-rings have the following dimensions 6.99 mm in cord diameter and 43.65
mm in ring diameter. The ageing times are 60, 88, 140 and 180 days. The temperatures
are 90, 120 and 140 °C. The measurement results are given in Figure 9.
Figure 9 Compression set test results.

17
© RISE Research Institutes of Sweden
Simulation Simulation of compressive set testing can be performed according to the same principle
as for relaxation by adding an un-loading step after the relaxation step. In addition to the
horizontal rigid plane is also a vertical and fixed rigid surface placed at outer perimeter
of the undeformed O-ring to represent the cylindrical wall. In the un-loading step, the
horizontal rigid plane is released so the contact is lost and the seal can expand. The seal
will then over time further expand though creep and the difference between the partially
expanded deformation and original shape is used to calculate the compressive set with
equation (9). The time after release when the compressive set is determined from the
simulation can either be a predetermined time corresponding to a test or sufficiently long
to correspond to a permanent set.
In Figure 10 are results presented for the temperature 140 °C and ageing time 60 days.
It is seen how the strain after the release decreases so only the residual strains remains
and that a permanent deformation has occurred.
To see and account for the possibility of reversed creep after the release, a creep stage of
1000 seconds is added after the release. The relative difference in strain between
immediately after the release and an additional 1000 second is less than 10-5. It can
therefore be concluded that no gradual recovering towards the original shape after
unloading occurs on the time scales that the permanent set test is ended and measured.
This is expected since when considering the relaxation rate in Figure 2 it is seen that
substantial relaxation does not occurs until after several days.
Figure 10 FE simulation results at end of ageing for 60 days in compression, immediately before release of compression (upper) and 1000 seconds after the release (lower). The color contour is minimum principal (compressive) strain. Temperature is 140 °C. The lines are rigid bodies representing the permanent set fixture.
18
© RISE Research Institutes of Sweden
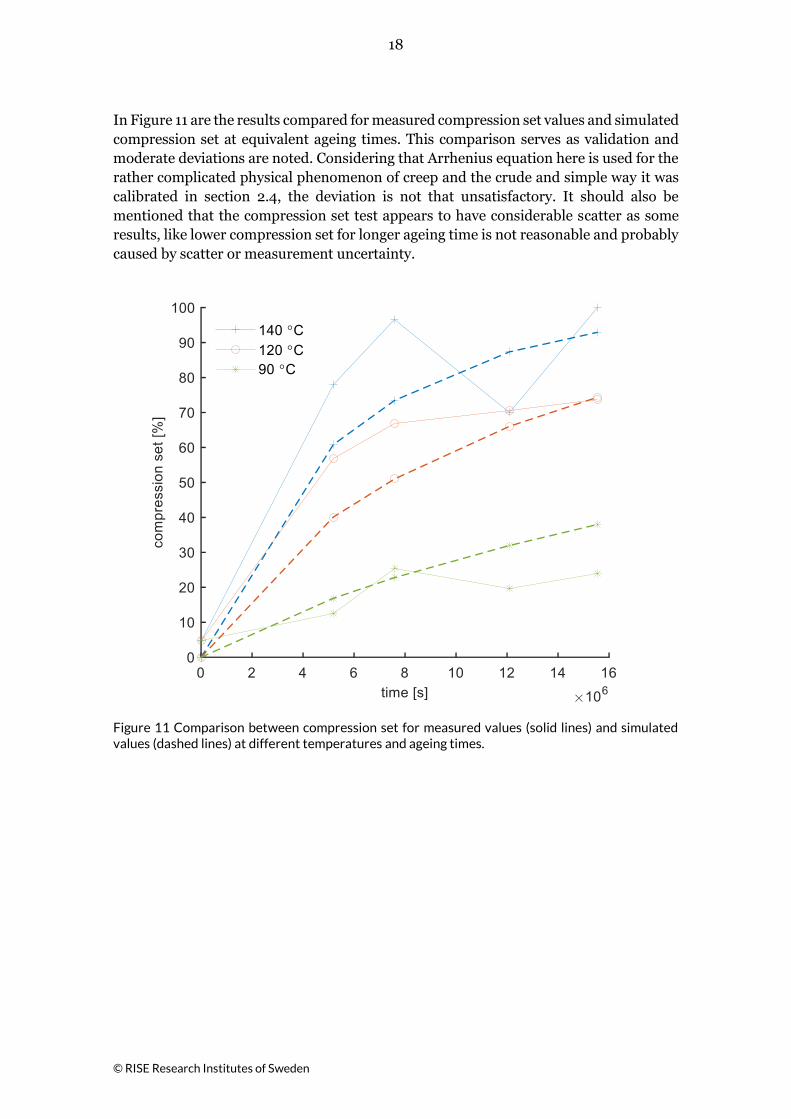
In Figure 11 are the results compared for measured compression set values and simulated
compression set at equivalent ageing times. This comparison serves as validation and
moderate deviations are noted. Considering that Arrhenius equation here is used for the
rather complicated physical phenomenon of creep and the crude and simple way it was
calibrated in section 2.4, the deviation is not that unsatisfactory. It should also be
mentioned that the compression set test appears to have considerable scatter as some
results, like lower compression set for longer ageing time is not reasonable and probably
caused by scatter or measurement uncertainty.
Figure 11 Comparison between compression set for measured values (solid lines) and simulated values (dashed lines) at different temperatures and ageing times.

19
© RISE Research Institutes of Sweden
5 Leak and tightness Leaking and tightness of a compressed seal containing a pressurized fluid can be
simulated with FE modelling. This was performed in [6] for polyethylene flange joints.
The modelling of an O-ring is setup with contacts similarly to what is described for the
relaxation simulation. In addition, a feature called pressure penetration is added [8].
This pressure penetration functionality works by adding the fluid pressure to the surface
of the seals that is exposed to the fluid but not to the surfaces that are in contact with the
surrounding solid (e.g. the pipe flanges of the joint). If the pressure is high enough, the
contacting surfaces can separate. Then the pressure penetration functionality adds the
fluid pressure to surfaces that lost contact. This can then if circumstances are correct
further separate the contacting surfaces until the pressure penetrates all way the between
the contacting surfaces which is to be interpreted as leak in the simulation.
The pressure penetration functionality is here tried and implemented for seals that are
considered in this project. The simulation is setup in the same way as compression set is
implemented in section 4.2 with the addition of the pressure penetration functionality.
The seals that are modelled have the following dimensions, 3.53 mm in cord diameter
and 29.7 mm in ring diameter. The material is modelled with the same model as
calibrated in section 3. The seals are simulated with following steps
1. Compression to reduce the O-ring thickness by 20 %
2. Ageing for 1 million seconds (11.6 days)
3. Increase of inner pressure from 0 to 200 bar in a short duration of time with no creeping active
Ageing is performed for the three temperatures 90 °C, 120 °C and 140 °C.
When the simulation is performed, the contacting surfaces become partially separated
as the pressure is increased. At a certain pressure, convergence problems (difficulties to
find numerical solutions in simulation) occur that force the simulation to be terminated.
This is not the preferred outcome of the simulation. Instead it would have been desired
that the contacting surfaces further separated to form a complete leak or that the
simulation completed to the full pressure (200 bar) without leaking or convergence
problem. Whether the convergence problems occur just prior to a rapid event such as a
sudden complete full penetration and leakage or is due to other instabilities (mechanical
or numerical) is not known at this stage. To be able use pressure penetration simulations
to predict leakage, more work is required to develop the method and its implementation
so credible results can be acquired.

20
© RISE Research Institutes of Sweden
In Figure 12 are two results presented for the temperature 90 °C, one at the end of the
ageing time 1 million seconds (before pressurization) and one for the point just before
the termination of simulation due to the convergence problems. It is noticed the
compressive strains are high near the part of the seal where the pressure is penetrating
the contact. The pressure at which the simulation terminates due to convergence
problems depends on the ageing temperature. The pressure at which this occurs is given
in Table 2. It is noticed that higher temperatures result in lower pressures at which the
simulation terminates. It can be suspected that the convergence problem is related to the
point in time where leakage is imminent so in some respect this is an indication of the
effect of temperature on leakage although no certain or quantitative conclusions can be
drawn.
Figure 12 FE simulation results for the temperature 90 °C at end of the ageing time 1 million seconds and before pressurization (upper). Results just before the termination of simulation due to the convergence problems (lower).
Table 2 Fluid pressure when the leak simulation terminates at various temperatures.
Temperature [°C] Pressure [bar]
90 96
120 83
140 59

21
© RISE Research Institutes of Sweden
6 Conclusions and discussion It is shown how the relaxation tests can be used together with simulations to calibrate
rubber material behaviour in seal applications. The visco-elastic (creep) behaviour is the
most important in this respect. The creep model that was shown to be most suitable is
the Bergstrom-Boyce model. When compared to the strain-hardening model from the
previous report, the Bergstrom-Boyce model has better efficiency and more stability
which allows for larger time increments in the simulations. The material model can also
include a plasticity part in the rheological network. Since only one type of relaxation test
is used there is not enough data to distinguish the plasticity from the creep and elasticity
leading to that plasticity is not included in the model. A possible way to include and
calibrate a plasticity part could be to also use the compression set test data. Here it is
chosen not to use the compression set in this way. Instead this data is used in a validation
process. A validation process here means that the calibration is done without the
validation data. The validation data is instead used to test if the calibrated model can
match results from the different validation test. The result is thus a more credible
material model.
The effect of temperature is included with calibration of relaxation tests at different
temperatures. It would have been possible to also perform a thorough calibration to this
data. The resources in this project do not allow this. Instead, a simple observation is
made on how much relaxation roughly occurs. With this observation the activation
energy in Arrhenius equation can be determined. This modelling of the temperature
effect is also validated with the compression test data. In the validation, the match
between the test and simulated results is reasonably good when considering the rather
crude and simple way the temperature effects calibration is performed. Furthermore, the
Arrhenius equation is derived for one well defined chemical reaction while creep in
rubbers is a complex process. Considering also this, the thermo-effects modelling seems
good. This successful use of the Arrhenius equation for more complex effects is an
experience that is often seen in various applications. Although not attempted here, it
could also be possible to use the Arrhenius equation for ionizing radiation together with
temperature.
The material models are used in a leak and tightness simulation attempt. This work is
not fully completed. Although such simulations were successfully used in work such as
[6], it does not work to full extent here. Numerical difficulties occur that prevent the
simulations to be used to simulate leakage with confidence. From the leak and tightness
simulations performed here it is shown that the increased creep for higher ageing
temperatures seems to have a detrimental effect on the tightness, although one cannot
assure or quantify the effect.

22
© RISE Research Institutes of Sweden
Further work that can improve and build on the findings in this report is:
• More detailed calibration and modelling of temperature and ionizing radiation effects
• Use of O-rings also in the calibration stage instead of flat specimens. This would be better as the deformed state then better matches the reality. Currently, the used coefficient of maximum friction has some uncertainty. The effect of this would have less impact for O-rings specimens compared to flat specimens.
• Use of more chains in the rheological network to get better accuracy in the calibrations
Another possibility could also be to use radically more advanced material modelling in
the FE-simulation framework when such modelling becomes available. An example is to
use molecular dynamics as a creep law. Such work is also part of the COMRADE project.
This would allow to explicitly include e.g. temperature, radiation and other chemical
degradation effects.

23
© RISE Research Institutes of Sweden
7 Acknowledgements This work is part of the COMRADE project in SAFIR2018 research programme. The
Finnish State Nuclear Waste Management Fund (VYR) and Swedish Radiation Safety
Authority are acknowledged for funding this work.

24
© RISE Research Institutes of Sweden
8 References
1. Sandström, Johan. Simulation and calibration of rubber materials for seals. Borås : RISE,
2018. 6P01138-01A.
2. Sipilä, Konsta, o.a. Condition Monitoring, Thermal and Radiation Degradation of Polymers
Inside NPP Con-tainments. Stockholm : Energiforsk, 2016.
3. Granlund, Marcus och Jansson, Anna. WP1 COMRADE - Development of condition
monitoring methods for polymeric components including low dose rate radiation exposure.
Borås : SP Technical Research Institute of Sweden, 2017. 6P01138 REV 1.
4. Austrell, Per-Erik. MODELING OF ELASTICITY AND DAMPING FOR FILLED ELASTOMERS.
Division of Structural Mechanics. Lund : Lund University, 1997. Report TVSM-1009.
5. Freakley, P. K. och Payne, A.R. Theory and Practice of Engineering with Rubber. London :
Applied Science Publishers, 1978. 9780853347729.
6. Sällström, Jan Henrik, Sandström, Johan och Sällberg, Sven-Erik. Täthet hos flänsförband
mellan stora polyetenrör och ventiler – experimentell och numerisk studie. Bromma : Svenskt
Vatten Utveckling, 2016. Rapportnr: 2016-17 .
7. Bergström, J.S. och Boyce, M.C. Constitutive modeling of the large strain time-dependent
behavior of elastomers. 5, 1998, Journal of the Mechanics and Physics of Solids, Vol. 46, ss.
931-954.
8. Dassault Systèmes. Abaqus 2018 Documentation. 2018. Version 2018.
9. Adams, B.M, o.a. Dakota, A Multilevel Parallel Object-Oriented Framework for Design
Optimization, Parameter Estimation, Uncertainty Quantification, and Sensitivity Analysis:
Version 6.0 User’s Manual. California : University of California, 2017. SAND2014-4633.
10. Jansson, Anna och Bondesson, Anna. COMRADE Condition Monitoring, Thermal and
Radiation Degradation of Polymers inside NPP Containments - Final report. Borås : RISE, 2019.
11. Rubber, vulcanized or thermoplastic - Determination of compression set - Part 1: At
ambient or elevated temperatures. : ISO, 2016. ISO 815-1:2016.

© RISE Research Institutes of Sweden
Through our international collaboration programmes with academia, industry, and the public
sector, we ensure the competitiveness of the Swedish business community on an international
level and contribute to a sustainable society. Our 2,200 employees support and promote all
manner of innovative processes, and our roughly 100 testbeds and demonstration facilities are
instrumental in developing the future-proofing of products, technologies, and services. RISE
Research Institutes of Sweden is fully owned by the Swedish state.
I internationell samverkan med akademi, näringsliv och offentlig sektor bidrar vi till ett
konkurrenskraftigt näringsliv och ett hållbart samhälle. RISE 2 200 medarbetare driver och stöder
alla typer av innovationsprocesser. Vi erbjuder ett 100-tal test- och demonstrationsmiljöer för
framtidssäkra produkter, tekniker och tjänster. RISE Research Institutes of Sweden ägs av
svenska staten.
RISE Research Institutes of Sweden AB
Box 24036, SE-400 22 GÖTEBORG, Sweden
Telephone: +46 10 516 50 00
E-mail: [email protected], Internet: www.ri.se
Safety
RISE Report 2019:19
ISBN: 978-91-88907-45-5