Transport Safety performance - European Transport Safety Council
32
TRANSPORT SAFETY PERFORMANCE IN THE EU A STATISTICAL OVERVIEW 2003 European Transport Safety Council Rue du Cornet 34 B – 1040 Brussels Tel: 0032 2 230 4106 Fax: 0032 2 230 4215 email: [email protected]
Transcript of Transport Safety performance - European Transport Safety Council
TRANSPORT SAFETY PERFORMANCE IN THE EU A STATISTICAL OVERVIEW
2003
European Transport Safety CouncilRue du Cornet 34B – 1040 Brussels
Tel: 0032 2 230 4106Fax: 0032 2 230 4215email: [email protected]

© 2003 European Transport Safety CouncilExtracts from this publication may be reproduced with the permission of ETSC
ISBN: 90-76024-154
2
Acknowledgements
ETSC gratefully acknowledges the contributions of the Chairman and members ofETSC’s Transport Accident Statistics Working Party to this review:
Working Party Members
Mr. Matthijs KOORNSTRA (Chairman)Dr. Jeremy BROUGHTON Mr. Jean-Pierre CAUZARDMr. Robert ESBERGER Prof. Andrew EVANSMr. Cees GLANSDORP Mr. Lasse HANTULADipl. Ing. Werner KÖPPEL Mr. Michel PIERSMr. Frank TAYLOR Mr. Ward VANLAAR
ETSC Working Party Secretary: Mr. Antonio Avenoso
ETSC is grateful for the financial support provided by Directorate of Energy andTransport of the European Commission. ETSC also acknowledges the contributiontowards the printing and dissemination costs of this review provided by BombardierTransportation, BP, CEA, KeyMed, Railway Safety, Railtrack Group plc, Scania, andShell International. The contents of this review are the sole responsibility of ETSC anddo not necessarily reflect the view of sponsors nor organisations to which research staffparticipating in the Working Party belong.
The European Transport Safety Council
The European Transport Safety Council (ETSC) is an international non-governmentalorganisation which was formed in 1993 in response to the persistent and unacceptablyhigh European road casualty toll and public concern about individual transporttragedies. Cutting across national and sectoral interests, ETSC provides an impartialsource of advice on transport safety matters to the European Commission, theEuropean Parliament and, where appropriate, to national governments andorganisations concerned with safety throughout Europe.
The Council brings together experts of international reputation on its Working Parties,and representatives of a wide range of national and international organisations withtransport safety interests and Parliamentarians of all parties on its Main Council toexchange experience and knowledge and to identify and promote research-basedcontributions to transport safety.
Board of Directors: Main Council Chairmen:Professor Herman De Croo (Chairman) Mr. Dieter Koch MEPProfessor Manfred Bandmann Mr. Mark Watts MEPProfessor G. Murray MackayProfessor Kåre Rumar Executive Director:Mr. Pieter van Vollenhoven Dr. Jörg Beckmann
3

4
CONTENTS
EXECUTIVE SUMMARY 7
1 INTRODUCTION 11
2. SUMMARY OF PASSENGER TRANSPORT RISKS AND THEIR COMPARISONS 12
2.1 EU risks across the modes 12
2.2 Risks within the road mode 12
2.3 Risks in road transport 13
2.4 Road travel and health risks 13
2.5 Road travel and activity risks 13
3 FATALITY RISK IN ROAD TRANSPORT 14
3.1 Road fatality distribution and comparisons of road fatality risks 14
3.2 Past and future road safety development in the EU 15
3.3 Past and future road safety in the ten EU accession countries 17
3.4 The safety of motorised two-wheelers in the EU 20
4 PAST AND FUTURE RAILWAY SAFETY IN THE EU 22
5 AIR PASSENGER SAFETY WITHIN THE EU 24
6 PASSENGER RISK BY SEA TRANSPORT IN EU WATERS 27
7 RECOMMENDATIONS 29
REFERENCES 31
5

6
EXECUTIVE SUMMARY
Transport crashes in the EU killed about 39,200 EU citizens in 2001, cause over 3.3million casualties and presently cost over 180 billion Euros, around twice the total EUbudget for all activity.
Nowadays road crashes in the EU lead to 97% of all transport deaths and to more than93% of all transport crash costs and are the leading cause of death and hospitaladmission for citizens under 50 years. Road crashes cost more than congestion andpollution, or cancer and heart disease.
Comparisons across the modesRisk comparisons for the EU show that the fatality risk for motorised two-wheelers is thehighest of all modes, being on average 20 times higher than for car occupants. Alsocycling and walking have on average a 7 to 9 times higher fatality risk per distancetravelled than car travel. Road traffic collectively has the highest fatality risk perpassenger kilometre of all passenger transport modes.
Rail and air travel are the safest modes per distance travelled, followed by bus. Thepassengers of trains, bus/coach and planes within the EU have the lowest fatality riskper passenger kilometre. For the average passenger trip in the EU, bus travel has a 10times lower fatality risk than car travel and air travel within the EU has for the averageflight distance about the same fatality risk per passenger kilometre as train travel andboth are half as risky as travel by coach. The risks associated with ferry travel fluctuate,but the expected fatality risk is 4 to 8 times that of train travel.
Fatality risk in road transport: the current EU countriesFrance, Germany, Italy, and Spain account for 68 per cent of the total of 38,935 roadfatalities in the EU in 2001. France and the UK have about the same number ofinhabitants, but France has about twice the number of fatalities as the UK as its risk istwice as high.
The southern EU countries, France, and Belgium have fatality risks above the averagefor the EU, and risks in the other EU countries are below-average. A five times higherdeath rate per motor vehicle kilometre is nowadays present in the worst than the bestperforming Member States (in 1997 this ratio was 7).
The fatality risk order of EU countries in 2000/2001 changed with respect to 1997, dueto noticeable differences between the rates at which national risks have fallen. The sixcountries with lowest fatality risks have had numerical targets for casualty or fatalityreduction in the past decade or decades.
The fatality rate in the EU has decreased almost constantly in an exponential way, byan average annual reduction of 5.3%. Combined with extrapolated traffic growth it leadsto a predicted 27,000 fatalities in 2010 within the present countries of the EU. The EUtarget of reducing fatalities by 50% between 2000 and 2010 (i.e. to 20,000 fatalities in2010) will only be achieved if the EU takes additional actions that reduce the risk morerapidly than in the past.
Fatality risk in road transport: the ten accession countriesMotor vehicle kilometre data are not available for the accession countries. In order tocompare their fatality risks with those of the present EU countries, it is assumed that onaverage each vehicle drives 10 thousand kilometres per year, which seemsapproximately correct overall. With this assumption, the average fatality risk of the 10
7
accession countries is about 3 times higher than the EU average, slightly higher thanGreece (worst performing EU country) and 5 times higher than the UK (best performingEU country).
The multiplication of extrapolated trends for fatality rate and vehicle growth predicts atotal of 8,625 fatalities in 2010 in the 10 accession countries, where in 2001 about11,000 road traffic deaths (within 30 days after the crash) are reported.
The safety of motorised two-wheelers in the EUUsers of motorised two-wheelers have the highest fatality risk of all road user groups.Moped and mofa fatalities are predominantly in the southern EU countries. This is alsotrue for motorcycle and scooter fatalities, but also Germany and the UK have relativelymany motorcycle and scooter fatalities.
Railway passenger safety in the EUThe fatality risk per billion train passenger kilometre fell from 1970 to 2000 by anaverage of 5.5% per year. The mean annual number of train passenger fatalities in theEU decreased from about 400 in the early 1970s to around 100 in 1999 and 2000. Therail passenger kilometre in the 15 EU-nations increased from about 200 billion in 1970to about 300 billion in 2000. The expected fatality risk per billion train passengerkilometre is about 0.35 for 2001/2002 within the EU.
Passenger safety in civil aviation within the EUAir transport fatality statistics refer mainly to scheduled flights, because air travelfatalities on unscheduled flights are only partially reported by international air transportorganisations. A similar practice exists for private plane fatalities – they are neitherregistered worldwide nor for the EU. Due to large annual variations of air passengerdeaths in scheduled flights and the absence of reliable data on unscheduled flightswithin the EU, the most probable passenger risks in civil aviation within the EU isobtained from the average of (1) the world-wide risk statistics with corrections for theshare, duration or distance and occupancy of flights within the EU and (2) the actualobserved risks for scheduled flights within the EU, both adjusted for the estimatedadditional share of unscheduled flights with estimated risks from their partially availabledata. The passenger fatality risk in civil aviation within the EU is estimated to be about0.035 per 100 million passenger kilometre, but 16 per 100 million passenger travelhours. Air and train travel within the EU have now on average the same risk perdistance. However, planes have much higher risks during the take-off, climb, descent,approach and landing manoeuvres than when cruising. Therefore, air travel trips havethe higher risks per distance the shorter the air travel trips are, whereby trips below 600kilometres ground distance are safer by (high speed) train than by plane. Due toregional differences in the safety procedures and ground communications aroundairports, the risks of air travel differ markedly according to region of departure and ofdestination, and less by the home country of the flight operator. The main airport regionswithin the EU belong to the safest in the world.
Passenger risk by sea transport in EU watersCasualty risks per ship type and size are given in the ETSC Report of 1999 on“Exposure data for travel risk assessment”. This Report shows that tankers and shipsof more than 6 million kg cargo capacity have a casualty risk per million nautical milesthat is more than twice as high as for all vessels (about 2.8 compared with about 1.35),while casualty risk for ferries and roll-on/roll-off container ships is almost half of the riskfor all vessels.
8
There were no ferry passenger fatalities in EU waters after the ESTONIA disaster in1994. The risk levels identified in the ETSC Report of 1999 can now be updated for thelonger period 1984-2001 and are thus less dominated by the exceptional number offatalities in 1994. The updated fatality risks of ferry passengers that are comparable withother transport modes risks become:
fatalities/100 million passenger hours 8.0fatalities/100 million passenger kilometres 0.25
Recommendations1. Road safety needs more priority in the transport policies of EU Member States
and the EU, because 97% of all transport fatalities in the EU are caused by roadtransport. Road transport accounts for 88% of all passenger transport in the EU,but accounts for over 100-times more deaths than all other modes together.
2. It is recommended that national and EU health policies recognise the relativelyhigh mortality and injury incidence rates for road traffic.
3. The EU target of 50% road traffic fatality reduction between 2000 and 2010 toabout 20,000 fatalities in 2010 will not be achieved unless the EU takes additionalactions that reduce the fatality risk more rapidly than in the past. Therefore, it isrecommended that further actions within the competence of the EU itself (mainlyvehicle safety regulations) are taken and that a EU road safety subsidy fund iscreated for financial incentives that support and trigger national road safetyactions and measures with a proven effectiveness.
4. Priority setting for transport safety must recognise the very high fatality risk ofmotorised two-wheelers (15 times the average road risk per kilometre travelled).
5. It is recommended that the safety of pedestrians and cyclists be improved,because their fatality risks per kilometre are 7 to 9 times higher than for car travel.
6. Passenger transport policies of the EU and its countries should promote the useof (high speed) trains in long distance trips, because the fatality risk of air travelfor ground distances of less than 600 kilometres is higher than for trains.
7. Intermodal passenger transport policies have to recognise that large differences existbetween the risks of travel modes. The safety of walking and cycling needs also tobe improved in order to optimise the safety of public transport, due to the high risk ofthe necessary walking and/or cycling in the ‘before and after’ phases of these trips.
8. Initiatives to improve the recording of road travel volumes and fatalities are beingundertaken by the EU, but progress is lacking for rail travel in the EU, travel onEU waters and inland waterways of the EU, and air travel by unscheduled flightsand private planes within the EU. Moreover, serious injury risks for different travelmodes are hard to assess because the necessary incident and exposure data aredefined differently and not consistently gathered. It is recommended that researchand development as well as reporting harmonisation on these matters be initiatedby the EU.
Similar recommendations (except the third) were formulated in 1999 in the ETSCReport on “Exposure data for travel risk assessment”, but it is disappointing that theyhave had so little effect. In view of the EU road traffic fatality reduction target that hasbeen set and the urgency of taking action to achieve the target, the recommendationsneed to be implemented soon.
9

10
1 INTRODUCTION
Transport crashes in the EU killed about 39,200 EU citizens in 2001, cause over 3.3million casualties and presently cost over 180 billion Euros (estimate taken from ETSC(1997) and corrected for inflation and improved safety), around twice the total EUbudget for all activity.
Road crashes in the EU each year lead to 97% of all transport deaths and to more than93% of all transport crash costs and are the leading cause of death and hospitaladmission for citizens under 50 years. Road crashes cost more than congestion,pollution, cancer and heart disease and result in a five times higher death rate in theworst than the best performing Member States.
As part of the current programme of activity which receives matched funding from theEuropean Commission, the European Transport Safety Council has brought togetherindependent experts from across the EU to update the analyses of the risk of death ontravel modes within the EU that were presented in the1999 ETSC Report on “Exposuredata for travel risk assessment”.
This Report discusses the risk trends up to 2000/2001 or 2001/2002 and considers whatthey mean for EU citizens and policy makers.
Section 2 looks at passenger transport risks in the EU and updates the figures of road,rail, air and ferry passenger risks within the EU for 2000/2001 or 2001/2002. Riskcomparisons of intermodal trips and comparisons between the risks of transport andother activities are also summarised 1.
Section 3 analyses fatality risks in road transport. This section includes predictions ofroad traffic fatalities in the EU and its ten accession countries for 2010 and an analysisof the number of deaths among users of motorised two-wheelers in the EU countries.The feasibility of achieving the EU target of 50% road fatality reduction in 2010 isassessed.
Section 4 considers railway safety in the EU. Passenger safety in air transport within theEU is covered in Section 5 whereas Section 6 deals with passenger risk by seatransport in EU waters.
Finally, recommendations are made for appropriate national and EU actions in the shortto medium term.
1. Risk comparisons of intermodal trips and comparisons between the risks of transport and otheractivities (for work types and at home) as well as comparisons between the health risks of transportand diseases are extensively discussed in the ETSC Report “Exposure data for travel riskassessment” (1999).
11
2. SUMMARY OF PASSENGER TRANSPORT RISKS ANDTHEIR COMPARISONS
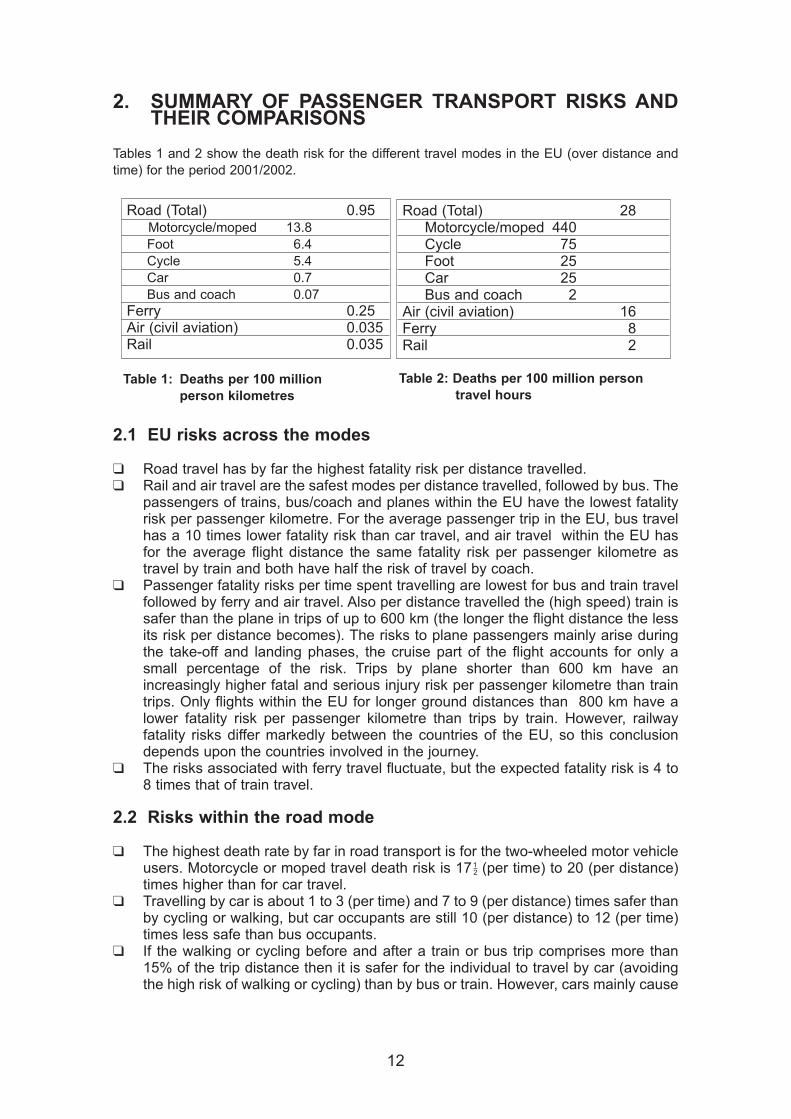
Tables 1 and 2 show the death risk for the different travel modes in the EU (over distance andtime) for the period 2001/2002.
2.1 EU risks across the modes
❑ Road travel has by far the highest fatality risk per distance travelled.❑ Rail and air travel are the safest modes per distance travelled, followed by bus. The
passengers of trains, bus/coach and planes within the EU have the lowest fatalityrisk per passenger kilometre. For the average passenger trip in the EU, bus travelhas a 10 times lower fatality risk than car travel, and air travel within the EU hasfor the average flight distance the same fatality risk per passenger kilometre astravel by train and both have half the risk of travel by coach.
❑ Passenger fatality risks per time spent travelling are lowest for bus and train travelfollowed by ferry and air travel. Also per distance travelled the (high speed) train issafer than the plane in trips of up to 600 km (the longer the flight distance the lessits risk per distance becomes). The risks to plane passengers mainly arise duringthe take-off and landing phases, the cruise part of the flight accounts for only asmall percentage of the risk. Trips by plane shorter than 600 km have anincreasingly higher fatal and serious injury risk per passenger kilometre than traintrips. Only flights within the EU for longer ground distances than 800 km have alower fatality risk per passenger kilometre than trips by train. However, railwayfatality risks differ markedly between the countries of the EU, so this conclusiondepends upon the countries involved in the journey.
❑ The risks associated with ferry travel fluctuate, but the expected fatality risk is 4 to8 times that of train travel.
2.2 Risks within the road mode
❑ The highest death rate by far in road transport is for the two-wheeled motor vehicleusers. Motorcycle or moped travel death risk is 171
2 (per time) to 20 (per distance)times higher than for car travel.
❑ Travelling by car is about 1 to 3 (per time) and 7 to 9 (per distance) times safer thanby cycling or walking, but car occupants are still 10 (per distance) to 12 (per time)times less safe than bus occupants.
❑ If the walking or cycling before and after a train or bus trip comprises more than15% of the trip distance then it is safer for the individual to travel by car (avoidingthe high risk of walking or cycling) than by bus or train. However, cars mainly cause
Table 2: Deaths per 100 million persontravel hours
Table 1: Deaths per 100 millionperson kilometres
Road (Total) 28Motorcycle/moped 440Cycle 75Foot 25Car 25Bus and coach 2
Air (civil aviation) 16Ferry 8Rail 2
Road (Total) 0.95Motorcycle/moped 13.8Foot 6.4Cycle 5.4Car 0.7Bus and coach 0.07
Ferry 0.25Air (civil aviation) 0.035Rail 0.035
12
the road traffic death of other car occupants, motorised two-wheelers, cyclists andpedestrians. Therefore, trips by public transport and before and after walking orcycling are collectively safer than car trips.
2.3 Risks in road transport
❑ Road accidents caused 38,935 deaths (within 30 days after the crash) in 2001,comprising almost 97% of all transport deaths in the EU.
❑ The road passenger transport death rate per million inhabitants is about 100 timeshigher than for all other passenger transport modes together, because road travelhas a much higher fatality risk and about 88 per cent of all passenger travel in theEU is by road.
❑ Road accidents lead to more than 93% of all passenger transport accident costseach year and are higher than the congestion costs or the costs of environmentalpollution, as estimated by the European Commission.
2.4 Road travel and health risks
❑ Involvement in road accidents is one of the three leading causes of death andhospital admission for EU inhabitants (together with cancer and coronary heartdiseases), and it is the leading cause of death for EU citizens under 50 years old.
❑ Road accidents cause a larger loss of expected life years than any kind of diseasein the EU, due to the low mean age (about 32) of road accident victims.
2.5 Road travel and activity risks
❑ The fatality risk per hour spent in road travel is
• 40 times higher than for work,
• 12 times higher than at home.
❑ The fatality risk of the safest road travel modes –bus or coach – is more than twicehigher than that at work.
13
3 FATALITY RISK IN ROAD TRANSPORT
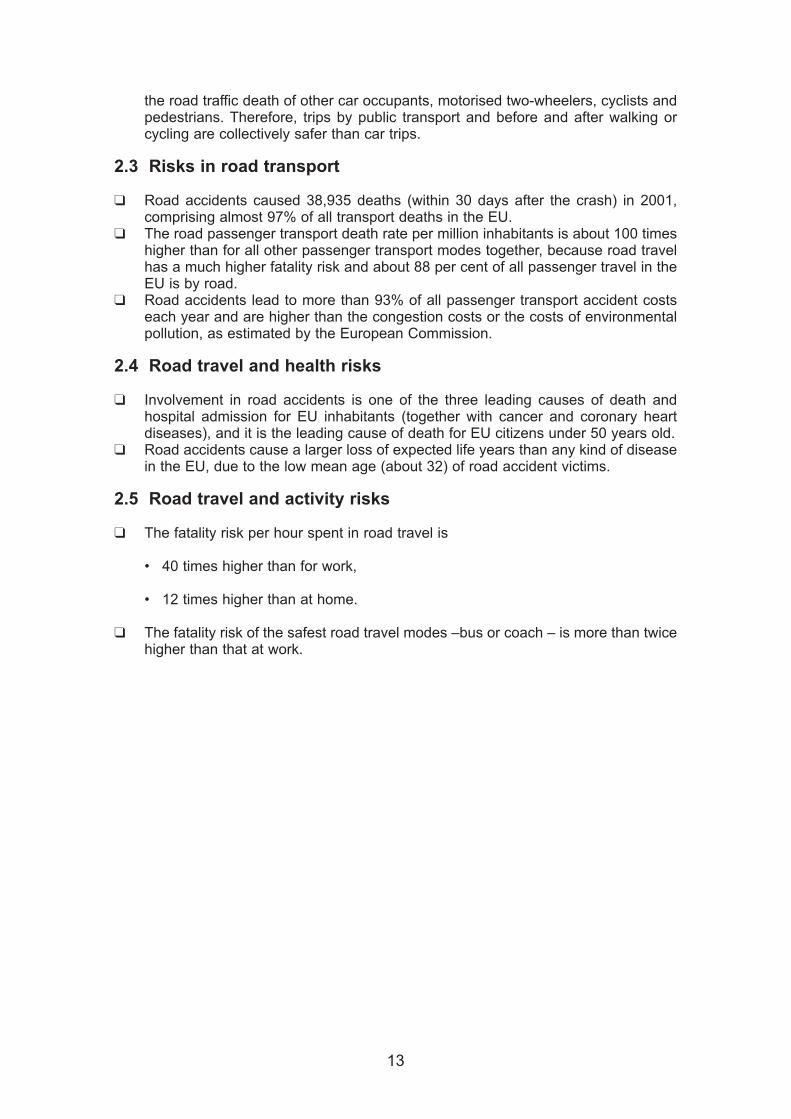
3.1 Road fatality distribution and comparisons of road fatality risks
Fig. 1 Road fatality distribution in the EU
❑ France, Germany, Italy, and Spain account for 68 per cent of the total of 38,935road fatalities in the EU in 2001.
❑ France and the UK have about the same number of inhabitants, but France hasabout twice the number of fatalities as the UK as its risk is twice as high.
❑ The southern EU countries, France and Belgium have fatality risks above theaverage for the EU, and risks in the other EU countries are below average.
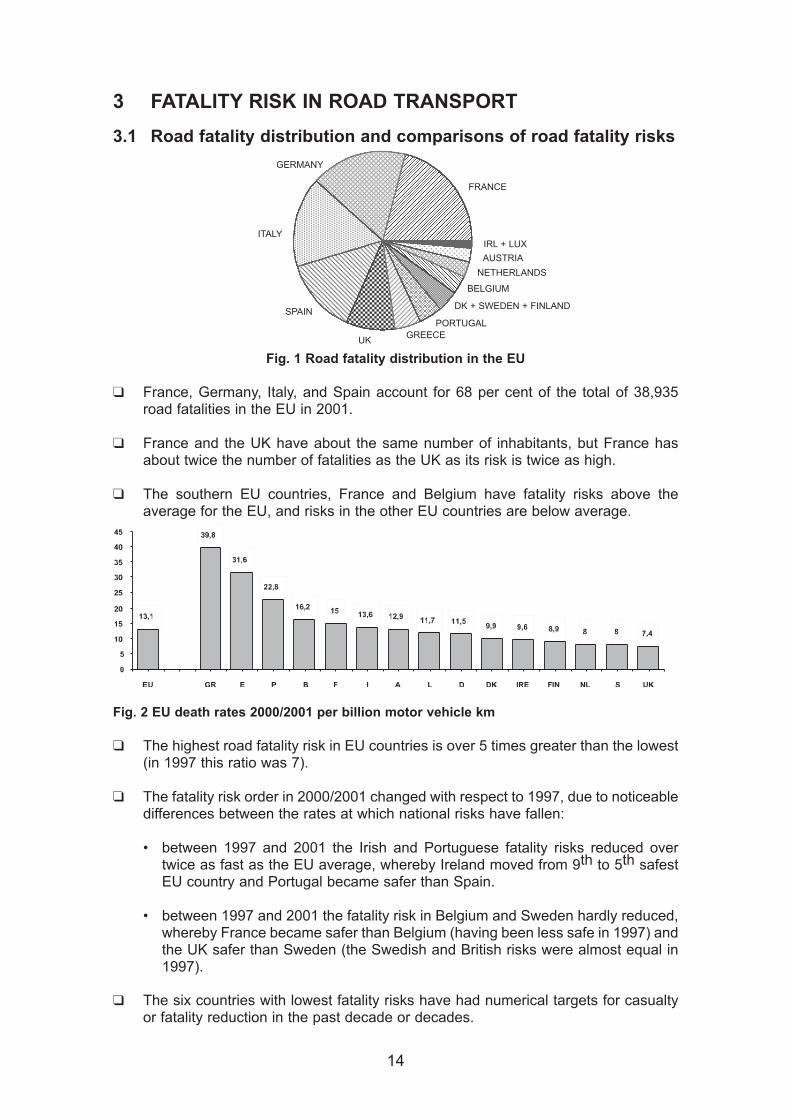
Fig. 2 EU death rates 2000/2001 per billion motor vehicle km
❑ The highest road fatality risk in EU countries is over 5 times greater than the lowest(in 1997 this ratio was 7).
❑ The fatality risk order in 2000/2001 changed with respect to 1997, due to noticeabledifferences between the rates at which national risks have fallen:
• between 1997 and 2001 the Irish and Portuguese fatality risks reduced overtwice as fast as the EU average, whereby Ireland moved from 9th to 5th safestEU country and Portugal became safer than Spain.
• between 1997 and 2001 the fatality risk in Belgium and Sweden hardly reduced,whereby France became safer than Belgium (having been less safe in 1997) andthe UK safer than Sweden (the Swedish and British risks were almost equal in1997).
❑ The six countries with lowest fatality risks have had numerical targets for casualtyor fatality reduction in the past decade or decades.
FRANCE
IRL + LUX
AUSTRIA
NETHERLANDS
BELGIUM
DK + SWEDEN + FINLAND
PORTUGALGREECE
UK
SPAIN
ITALY
GERMANY
14
3.2 Past and future road safety development in the EU
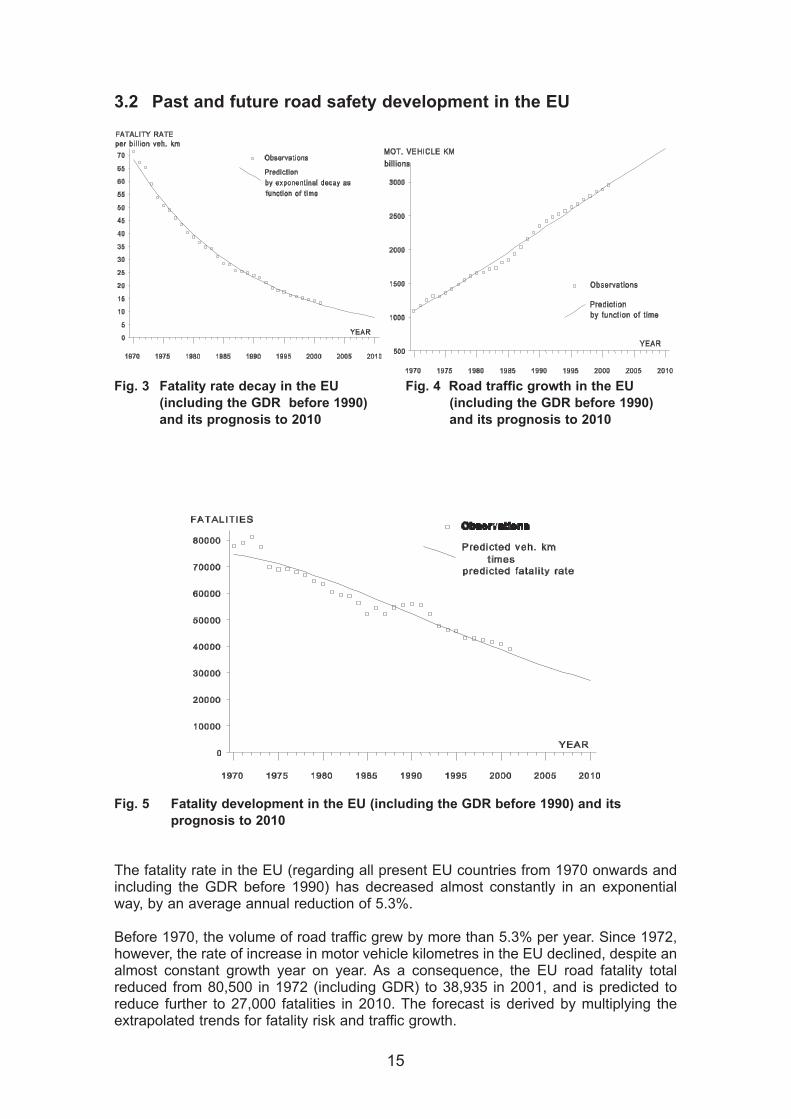
Fig. 3 Fatality rate decay in the EU Fig. 4 Road traffic growth in the EU(including the GDR before 1990) (including the GDR before 1990) and its prognosis to 2010 and its prognosis to 2010
Fig. 5 Fatality development in the EU (including the GDR before 1990) and itsprognosis to 2010
The fatality rate in the EU (regarding all present EU countries from 1970 onwards andincluding the GDR before 1990) has decreased almost constantly in an exponentialway, by an average annual reduction of 5.3%.
Before 1970, the volume of road traffic grew by more than 5.3% per year. Since 1972,however, the rate of increase in motor vehicle kilometres in the EU declined, despite analmost constant growth year on year. As a consequence, the EU road fatality totalreduced from 80,500 in 1972 (including GDR) to 38,935 in 2001, and is predicted toreduce further to 27,000 fatalities in 2010. The forecast is derived by multiplying theextrapolated trends for fatality risk and traffic growth.
15
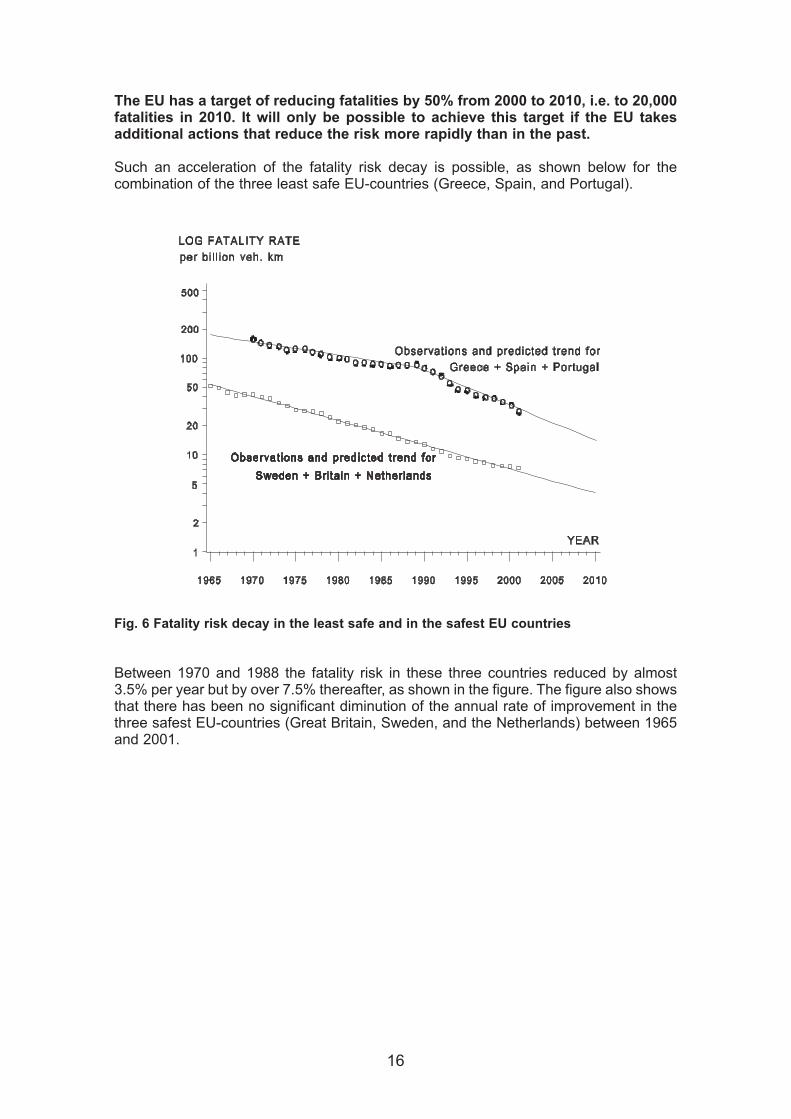
The EU has a target of reducing fatalities by 50% from 2000 to 2010, i.e. to 20,000fatalities in 2010. It will only be possible to achieve this target if the EU takesadditional actions that reduce the risk more rapidly than in the past.
Such an acceleration of the fatality risk decay is possible, as shown below for thecombination of the three least safe EU-countries (Greece, Spain, and Portugal).
Fig. 6 Fatality risk decay in the least safe and in the safest EU countries
Between 1970 and 1988 the fatality risk in these three countries reduced by almost3.5% per year but by over 7.5% thereafter, as shown in the figure. The figure also showsthat there has been no significant diminution of the annual rate of improvement in thethree safest EU-countries (Great Britain, Sweden, and the Netherlands) between 1965and 2001.
16
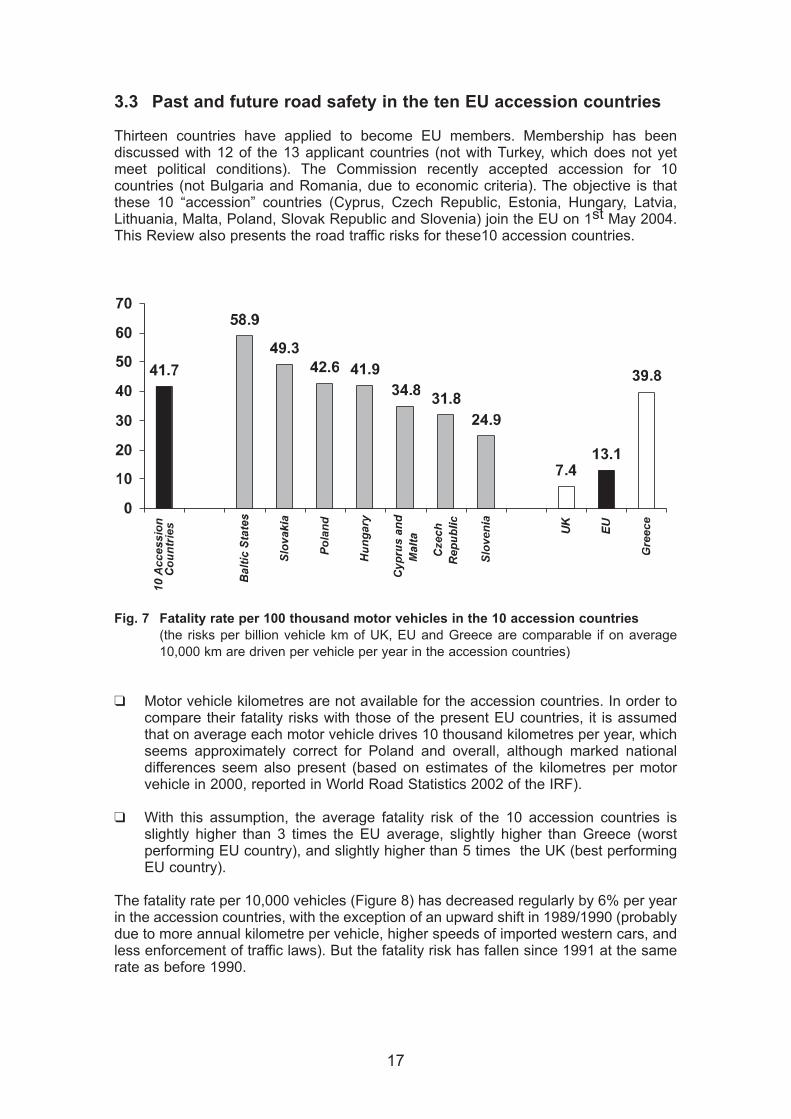
3.3 Past and future road safety in the ten EU accession countries
Thirteen countries have applied to become EU members. Membership has beendiscussed with 12 of the 13 applicant countries (not with Turkey, which does not yetmeet political conditions). The Commission recently accepted accession for 10countries (not Bulgaria and Romania, due to economic criteria). The objective is thatthese 10 “accession” countries (Cyprus, Czech Republic, Estonia, Hungary, Latvia,Lithuania, Malta, Poland, Slovak Republic and Slovenia) join the EU on 1st May 2004.This Review also presents the road traffic risks for these10 accession countries.
Fig. 7 Fatality rate per 100 thousand motor vehicles in the 10 accession countries (the risks per billion vehicle km of UK, EU and Greece are comparable if on average10,000 km are driven per vehicle per year in the accession countries)
❑ Motor vehicle kilometres are not available for the accession countries. In order tocompare their fatality risks with those of the present EU countries, it is assumedthat on average each motor vehicle drives 10 thousand kilometres per year, whichseems approximately correct for Poland and overall, although marked nationaldifferences seem also present (based on estimates of the kilometres per motorvehicle in 2000, reported in World Road Statistics 2002 of the IRF).
❑ With this assumption, the average fatality risk of the 10 accession countries isslightly higher than 3 times the EU average, slightly higher than Greece (worstperforming EU country), and slightly higher than 5 times the UK (best performingEU country).
The fatality rate per 10,000 vehicles (Figure 8) has decreased regularly by 6% per yearin the accession countries, with the exception of an upward shift in 1989/1990 (probablydue to more annual kilometre per vehicle, higher speeds of imported western cars, andless enforcement of traffic laws). But the fatality risk has fallen since 1991 at the samerate as before 1990.
17
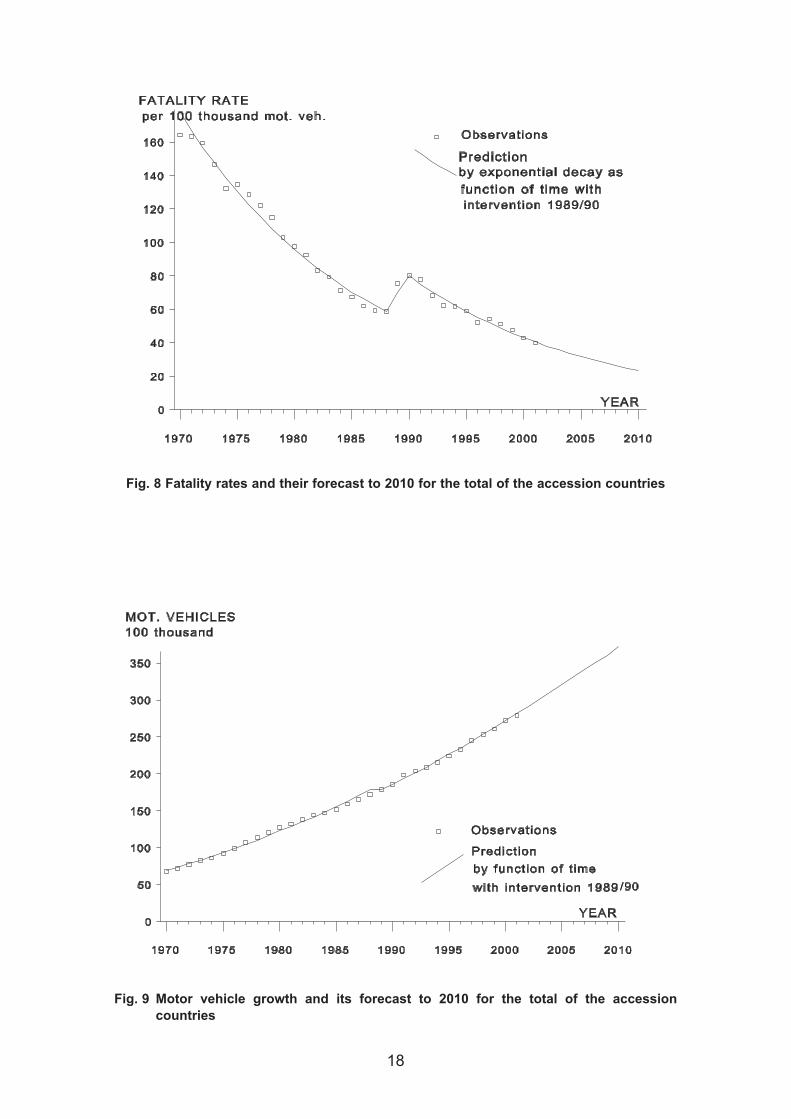
Fig. 8 Fatality rates and their forecast to 2010 for the total of the accession countries
Fig. 9 Motor vehicle growth and its forecast to 2010 for the total of the accessioncountries
18
Traffic growth in the accession countries after 1970 followed the same pattern as in theEU nations before 1972. Traffic growth in the accession countries is still in the first partof the S-shaped growth curve, as shown by figure 9 (the shift in 1989/1990 is notsignificant).
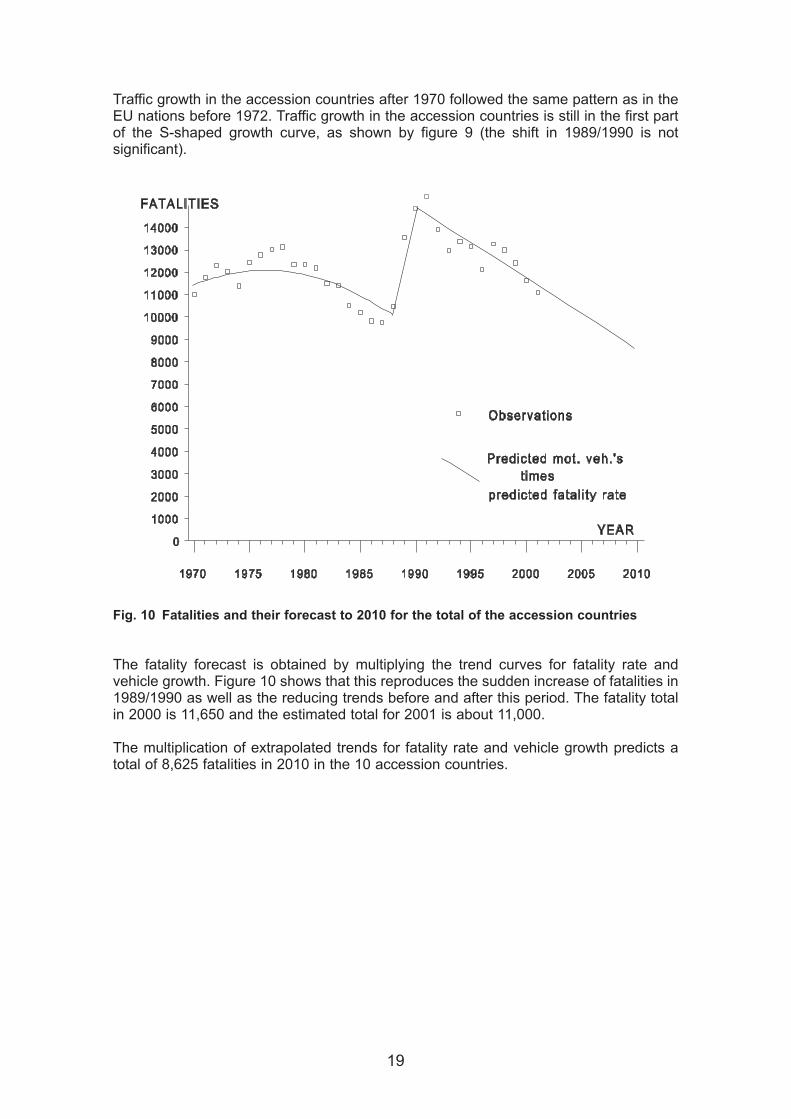
Fig. 10 Fatalities and their forecast to 2010 for the total of the accession countries
The fatality forecast is obtained by multiplying the trend curves for fatality rate andvehicle growth. Figure 10 shows that this reproduces the sudden increase of fatalities in1989/1990 as well as the reducing trends before and after this period. The fatality totalin 2000 is 11,650 and the estimated total for 2001 is about 11,000.
The multiplication of extrapolated trends for fatality rate and vehicle growth predicts atotal of 8,625 fatalities in 2010 in the 10 accession countries.
19
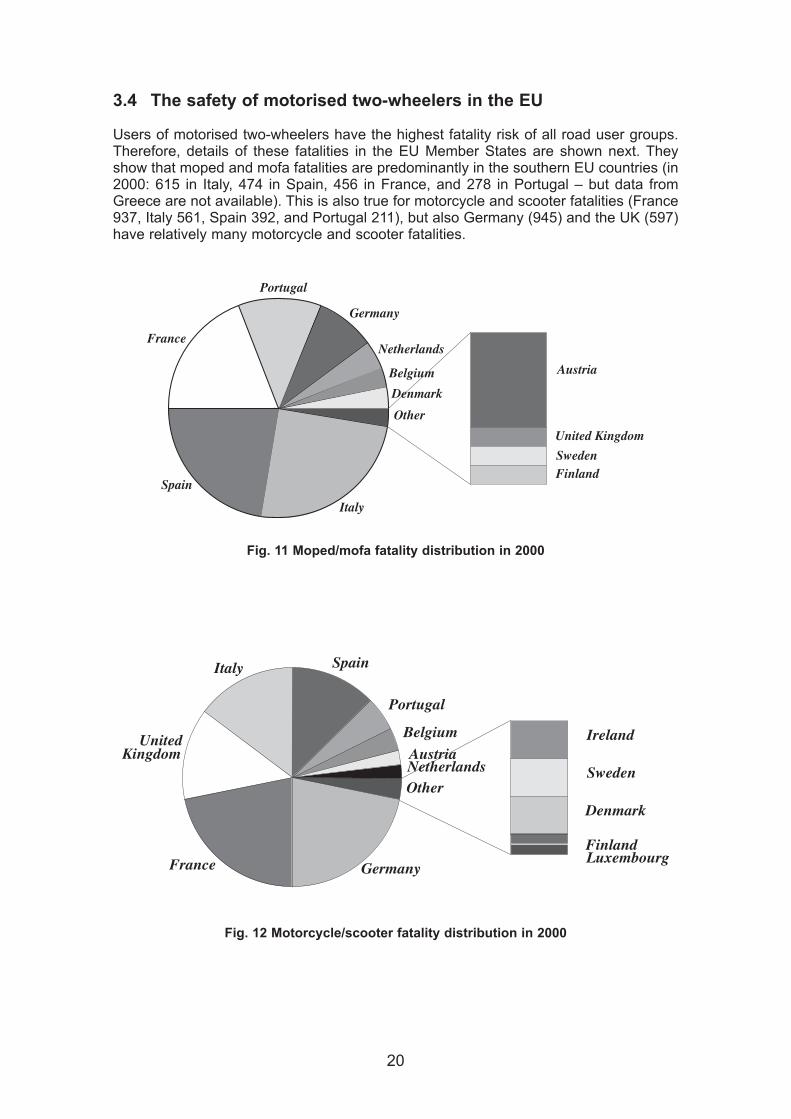
3.4 The safety of motorised two-wheelers in the EU
Users of motorised two-wheelers have the highest fatality risk of all road user groups.Therefore, details of these fatalities in the EU Member States are shown next. Theyshow that moped and mofa fatalities are predominantly in the southern EU countries (in2000: 615 in Italy, 474 in Spain, 456 in France, and 278 in Portugal – but data fromGreece are not available). This is also true for motorcycle and scooter fatalities (France937, Italy 561, Spain 392, and Portugal 211), but also Germany (945) and the UK (597)have relatively many motorcycle and scooter fatalities.
Fig. 11 Moped/mofa fatality distribution in 2000
Fig. 12 Motorcycle/scooter fatality distribution in 2000
GermanyFrance
United Kingdom
Italy Spain
Portugal
Belgium
AustriaNetherlands
Ireland
Sweden
Denmark
FinlandLuxembourg
Other
Italy
Spain
France
Portugal
Germany
Netherlands
Belgium
Denmark
Austria
United Kingdom
SwedenFinland
Other
20
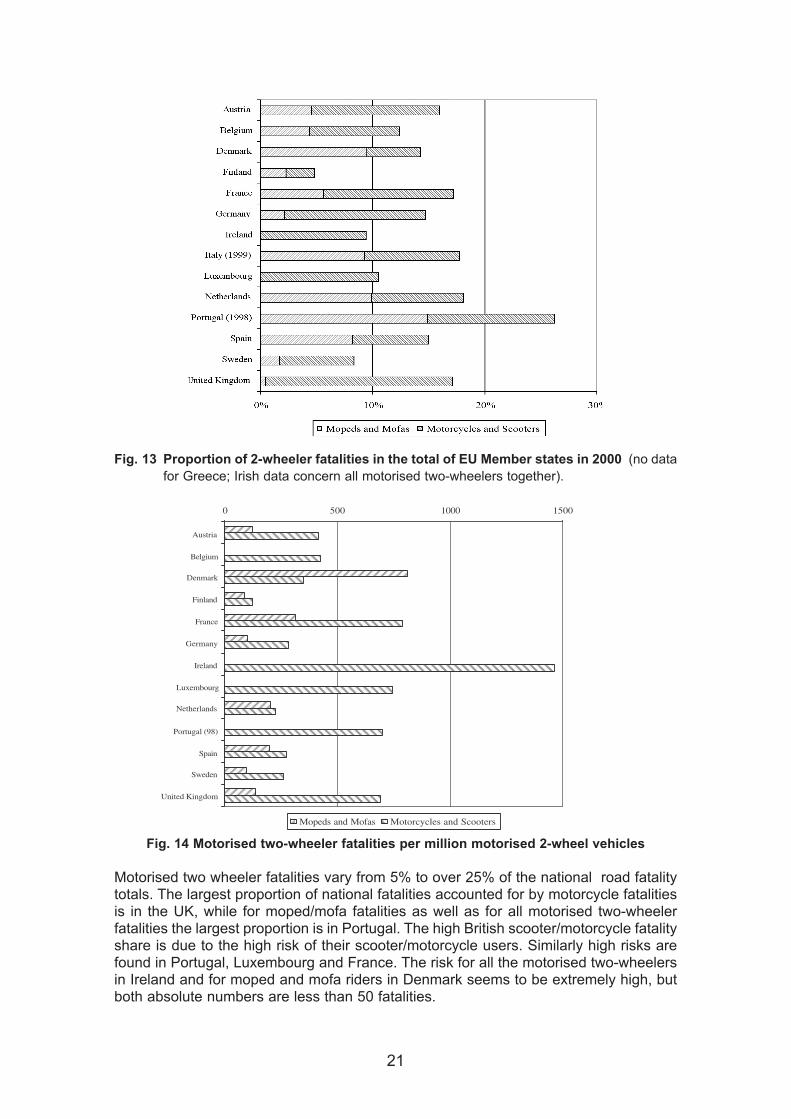
Fig. 13 Proportion of 2-wheeler fatalities in the total of EU Member states in 2000 (no datafor Greece; Irish data concern all motorised two-wheelers together).
Fig. 14 Motorised two-wheeler fatalities per million motorised 2-wheel vehicles
Motorised two wheeler fatalities vary from 5% to over 25% of the national road fatalitytotals. The largest proportion of national fatalities accounted for by motorcycle fatalitiesis in the UK, while for moped/mofa fatalities as well as for all motorised two-wheelerfatalities the largest proportion is in Portugal. The high British scooter/motorcycle fatalityshare is due to the high risk of their scooter/motorcycle users. Similarly high risks arefound in Portugal, Luxembourg and France. The risk for all the motorised two-wheelersin Ireland and for moped and mofa riders in Denmark seems to be extremely high, butboth absolute numbers are less than 50 fatalities.
0 500 1000 1500
Austria
Belgium
Denmark
Finland
France
Germany
Ireland
Luxembourg
Netherlands
Portugal (98)
Spain
Sweden
United Kingdom
Mopeds and Mofas Motorcycles and Scooters
21
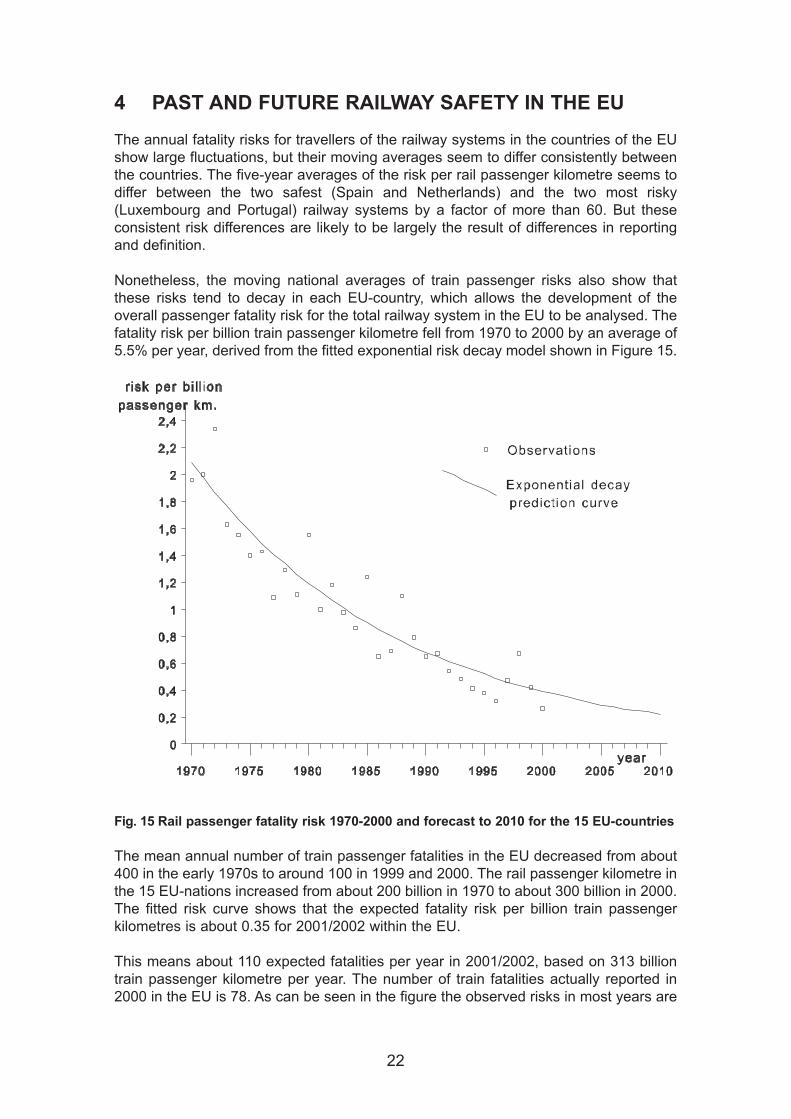
4 PAST AND FUTURE RAILWAY SAFETY IN THE EU
The annual fatality risks for travellers of the railway systems in the countries of the EUshow large fluctuations, but their moving averages seem to differ consistently betweenthe countries. The five-year averages of the risk per rail passenger kilometre seems todiffer between the two safest (Spain and Netherlands) and the two most risky(Luxembourg and Portugal) railway systems by a factor of more than 60. But theseconsistent risk differences are likely to be largely the result of differences in reportingand definition.
Nonetheless, the moving national averages of train passenger risks also show thatthese risks tend to decay in each EU-country, which allows the development of theoverall passenger fatality risk for the total railway system in the EU to be analysed. Thefatality risk per billion train passenger kilometre fell from 1970 to 2000 by an average of5.5% per year, derived from the fitted exponential risk decay model shown in Figure 15.
Fig. 15 Rail passenger fatality risk 1970-2000 and forecast to 2010 for the 15 EU-countries
The mean annual number of train passenger fatalities in the EU decreased from about400 in the early 1970s to around 100 in 1999 and 2000. The rail passenger kilometre inthe 15 EU-nations increased from about 200 billion in 1970 to about 300 billion in 2000.The fitted risk curve shows that the expected fatality risk per billion train passengerkilometres is about 0.35 for 2001/2002 within the EU.
This means about 110 expected fatalities per year in 2001/2002, based on 313 billiontrain passenger kilometre per year. The number of train fatalities actually reported in2000 in the EU is 78. As can be seen in the figure the observed risks in most years are
22
close to or somewhat lower than the fitted exponential curve. Five exceptional yearshave markedly higher risk due to rail disasters with many fatalities in these years.
The latest rail disaster was the crash of the high-speed train in Germany in 1998. Suchdisasters seem to occur on average once in six years, and in such years the actual railpassenger fatality risk is much higher than the risk predicted by the exponential curve.Nonetheless these estimated risks are the best indicators of the underlying level of risk.
The mean annual number of rail staff fatalities decreased from almost 350 in the early1970s to 45 in 1998-2000. The corresponding average for third party fatalitiesdecreased from around 1,300 in the early 1970s to nearly 700 in the late 1980s, butincreased to over 800 in the period 1993-1996 and thereafter decreased again to about650 in 1999-2000. This would mean that train travel is many times more risky for otherpersons than for travellers. However, the exposure to risk for non-passenger fatalitiesshould not be measured by passenger kilometres. Their mortality risk, expressed asdeaths per 100 thousand inhabitants of the EU, is now about 0.01 for rail staff and 0.20for third party fatalities, compared to 0.03 for train passengers.
23
5 AIR PASSENGER SAFETY WITHIN THE EU
Air transport fatality statistics refer mainly to scheduled flights, because air travelfatalities on unscheduled (charter) flights are only partially reported by international airtransport organisations. A similar practice exists for private plane fatalities – they areneither registered worldwide nor for the EU. There are large variations in the annualdeath number of air passengers on scheduled flights within the EU. After 1980, fouryears had more than 200 fatalities and five years showed no deaths; the four years of1996 to 1999 inclusive had an average of about 35 crew and passenger deaths, while2000 had zero and 2001 had 117 fatalities (2001 was the worst year since 1989 with247 deaths).
In the ETSC Review on “Exposure data for travel risk assessment” the risk trend for airpassenger transport within the EU, therefore, was obtained from the world statistics bycorrections for the average share, duration or distance and occupancy for flights withinthe EU (ETSC, 1999). This revealed that air passenger fatality risks were reducedexponentially by an average of nearly 6% per year from about 0.24 per 100 million airpassenger kilometres in 1970 to about 0.04 for the expected risk in 1997 (ICAO, 1998).After 1997 the annual risks fluctuate, but have been lower than expected and decreasedto about 0.02 for scheduled flights in 2001 (ICAO, 2002). Based on the partiallyavailable world data, the estimated risk for unscheduled fights seems about twicehigher, while the intra-continental passenger share is estimated to be about 30% of thescheduled flights. Thereby the expected fatality risk per 100 million passenger kilometrefor civil aviation (scheduled and unscheduled flights) worldwide is updated by the fittedexponential decay function from 1970-2001 to the estimate of about 0.025 for2001/2002, where the estimated annual reduction is now more than 7%.
In contrast to road and rail, the rate of increase of air travel in the last decade has beennot less than the reduction in fatality risk (both about 7% per year), but the volume ofair travel declined after 11 September 2001. Therefore, the moving average of air traveldeaths in scheduled flights scarcely decreased in the last decade, but may now declinebecause of the slower growth of air travel after 2001.
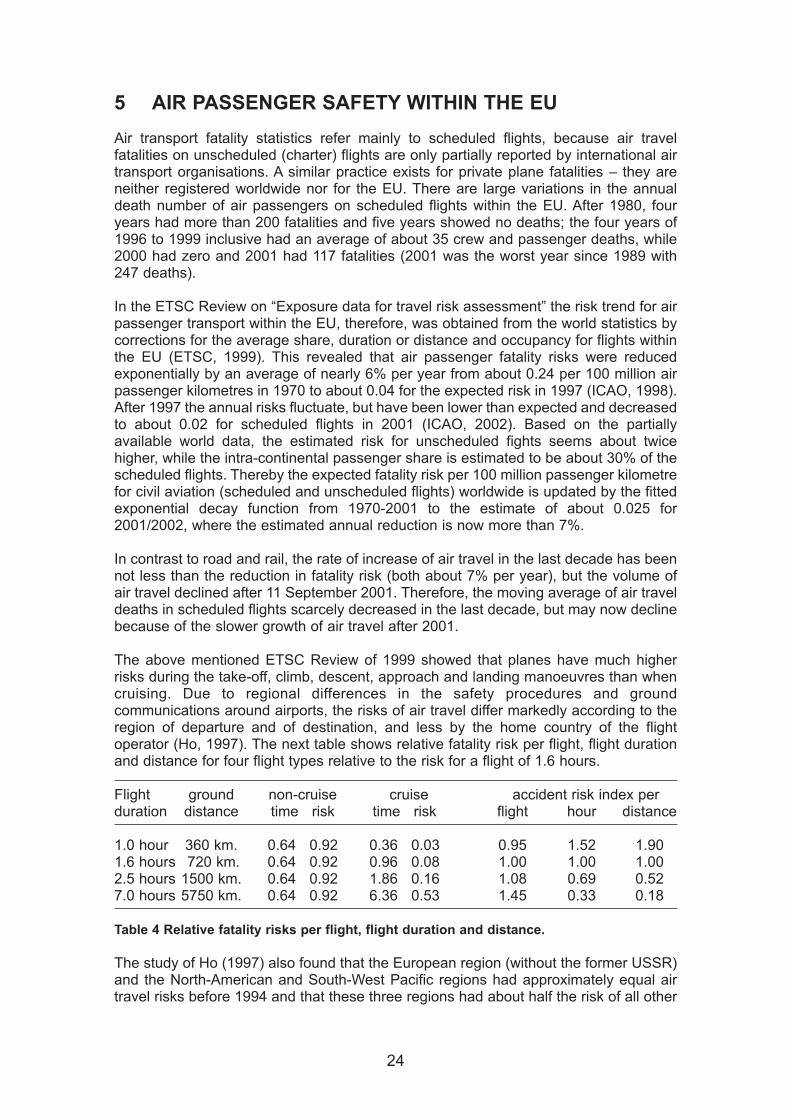
The above mentioned ETSC Review of 1999 showed that planes have much higherrisks during the take-off, climb, descent, approach and landing manoeuvres than whencruising. Due to regional differences in the safety procedures and groundcommunications around airports, the risks of air travel differ markedly according to theregion of departure and of destination, and less by the home country of the flightoperator (Ho, 1997). The next table shows relative fatality risk per flight, flight durationand distance for four flight types relative to the risk for a flight of 1.6 hours.
Flight ground non-cruise cruise accident risk index perduration distance time risk time risk flight hour distance
1.0 hour 360 km. 0.64 0.92 0.36 0.03 0.95 1.52 1.901.6 hours 720 km. 0.64 0.92 0.96 0.08 1.00 1.00 1.002.5 hours 1500 km. 0.64 0.92 1.86 0.16 1.08 0.69 0.527.0 hours 5750 km. 0.64 0.92 6.36 0.53 1.45 0.33 0.18
Table 4 Relative fatality risks per flight, flight duration and distance.
The study of Ho (1997) also found that the European region (without the former USSR)and the North-American and South-West Pacific regions had approximately equal airtravel risks before 1994 and that these three regions had about half the risk of all other
24
regions together. Flights within and between the three safer regions account for 65% ofall scheduled passenger flights (IATA, 1998). Thus the European risk as one of thesesafer regions can again be derived from the worldwide risk, because 65% times theEuropean risk plus twice the 35% of that risk equals the worldwide risk. Therefore, theair passenger risk per 100 million passenger kilometres for the European region relatesto that worldwide risk by the proportional factor of 1/(0.65 + 2 x 0.35) = 0.74. Thus therisk for all civil aviation flights within and from or to the EU for 2001/2002 is estimatedto be 0.74 x 0.025 = 0.0185. However, the fatality risk per passenger kilometres forflights within the EU (mean 1.6 hours) is greater than for all European flights (mean 2.5hours) by a factor 1.0/0.52 = 1.92 (shorter flight distance) times 1.25 (20% lesspassengers per flight). This indicates that the fatality risk would be 1.92 x 1.25 x 0.0185= 0.044 for civil aviation flights within the EU.
From this risk estimate, one can derive the expected fatalities or other risks that relateto other exposure measures by using the average flight factors of 1.6 hour duration, 720km ground distance, and 85 crew and passengers for about 6.5 million flights (includingthe estimate for unscheduled ones) per year in 2001/2002 between airports in the EU.The expected annual number of fatalities for the years 2001/2002 is about 175,estimated by 0.044 x 85 (flight occupants) x 6.5 (million flights) x 7.2 (100 km flightdistance)=175, which is higher than the 117 air travel fatalities for scheduled flights in2001 within the EU and much higher than the observed five year average of almost 50fatalities for scheduled flights in 1997-2001 within the EU. It likely means that the mainairport regions within the EU have become much safer than those in North America andthe South Pacific region (before 1994 these three regions had the same level of risk andwere twice safer than other regions).
The available data for scheduled flights within the EU from 1980 to 2001 (taken from thedatabase of the NLR, the Dutch Air Transport Research Institute) show by a fittedexponential risk decay that the estimated risk is almost 0.02 per 100 million passengerkilometre for 2001. Corrected for about 30% more passenger km of unscheduled flightswith a twice higher risk (probably due to shorter trips and more destinations to less safeairports than the main airports in the EU) it amounts to a risk of 0.025 per 100 millionpassenger kilometre, whereby the expected number of fatalities in civil aviation withinthe EU would be about 100 for 2001. It would mean that the civil aviation risks withinthe EU have decreased faster than estimated by the share in the world wide risks, ascalculated above and used for the risk assessment in the ETSC Report of 1999 for thecivil aviation risks up to 1997.
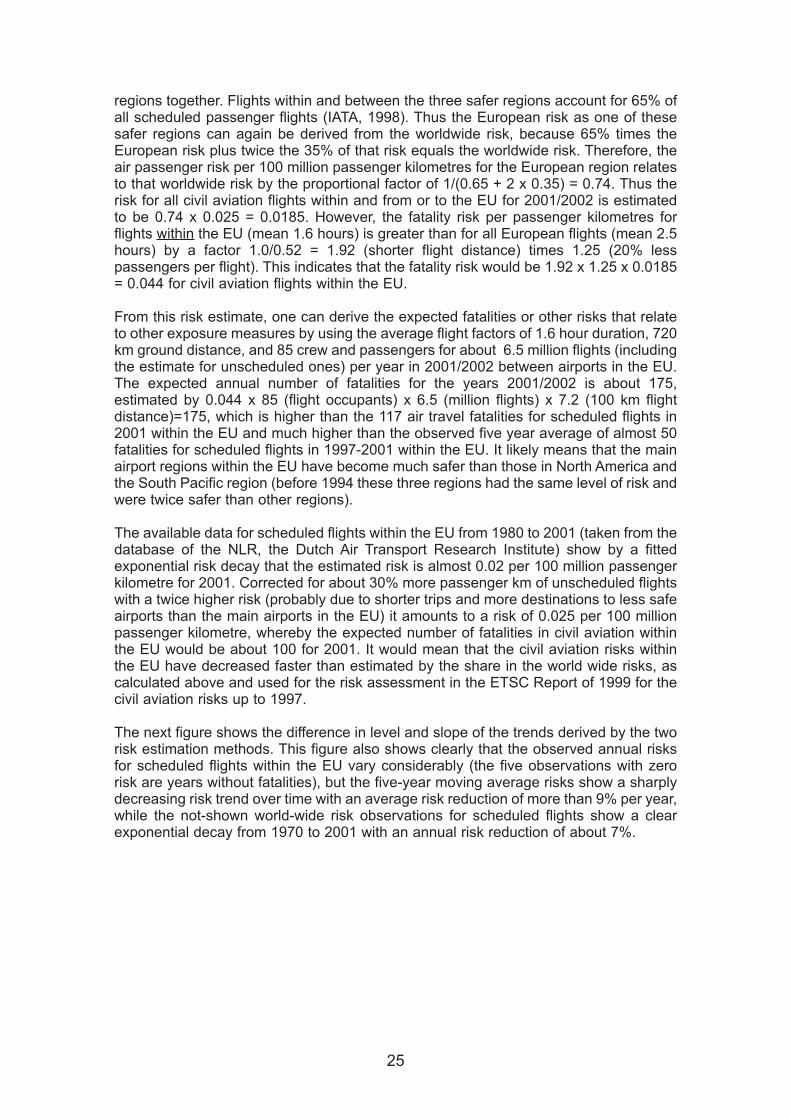
The next figure shows the difference in level and slope of the trends derived by the tworisk estimation methods. This figure also shows clearly that the observed annual risksfor scheduled flights within the EU vary considerably (the five observations with zerorisk are years without fatalities), but the five-year moving average risks show a sharplydecreasing risk trend over time with an average risk reduction of more than 9% per year,while the not-shown world-wide risk observations for scheduled flights show a clearexponential decay from 1970 to 2001 with an annual risk reduction of about 7%.
25
Fig. 16 Estimated risk trends for scheduled flights and civil aviation within the EU
Given the uncertainties in both estimation methods (with respect to unscheduled flights,variations of registered deaths, and estimates of passenger kilometres) it seems fair totake the risk value for 2001/2002 as the average of the estimated risks by both methods,that is (0.025 +0.044)/2=0.035 per 100 million air passenger kilometre in civil aviationwithin the EU for 2001/2002. It yields 140 expected fatalities in civil aviation within the EUfor 2001/2002. Its risk per 100 million passenger kilometre multiplied by 720/1.6=450km/h average ground speed becomes the risk per 100 million passenger travel hours as0.035 x 450 = 16. Summarised below are the estimated risks of civil aviation that arecomparable with other modes and the expected annual fatalities for 2001/2002.
All flights (incl. intercontinental) Domesticl and continentalWorldwide European (ex. USSR) flights within EU region
Fatalities/100million pass. km. 0.025 0.018 0.035Fatalities/100million pass. h. 15 11 16Expectedfatalities 1200 190 140
Table 5 Expected annual estimates for passenger safety in civil aviation for 2001/2002based on word-wide trends 1970-2001 and on trends 1980-2001 for Europeanflights
These estimates are lower than the extrapolated figures from the referred ETSC Reportof 1999 (Table 3, page 29), due to the likely faster reduction in civil aviation risk withinthe EU than worldwide. The recent decline of air travel (which might be temporary) mayfurther reduce the expected fatalities for the coming years. The average plane and trainrisks per distance are now equal, that is about 0.035 per 100 million passenger km, butit has been shown that the longer the flight, the less the risk per kilometre.Consequently, flights of more than 800 km ground distance are nowadays safer thansuch trips by (high speed) trains (the figure in 1998 was 1,200 km), while trips of lessthan 600 km distance become increasingly safer by (high speed) train than by plane.
26
6 PASSENGER RISK BY SEA TRANSPORT IN EU WATERS
Various risk statistics for maritime transport were summarised in the ETSC report on“Exposure data for travel risk assessment” (ETSC, 1999). Regional accident risk andexposure measures are of great importance for the size of rescue and assistance fleetsrequired by coastal states to minimise the consequences of ship disasters. Thefollowing table (from ETSC, 1999) shows how encounter exposure (frequency of shipspenetrating the area of nautical mile around another ship) is used to assess the effectsof vessel traffic services (VTS) on the collision rate (CR) per 100.000 encounters ofdifferent types.
Type CR Total CR (VTS) CR (no VTS) effectiveness
meeting 0.589 0.310 0.636 48.7%crossing 4.381 3.888 4.500 86.4%overtaking 0.640 0.104 0.765 13.6%all 0.817 0.533 0.871 61.2%
Table 6 Encounters exposure and the effects of Vessel traffic service on the collision rate
This table demonstrates the usefulness of relevant detailed exposure data for theassessment of the effectiveness of countermeasures. The use of encounter frequencyas exposure measure would also be relevant for other modes, especially in roadtransport, but hardly any research exists on this type of exposure in the other modes.However, this Review is concerned with personal safety on ships, not the frequency ofship disasters.
Casualty risks per ship type and size are given in the ETSC Report of 1999. It showsthat tankers and ships of more than 6 million kg cargo capacity have a casualty risk permillion nautical miles that is more than twice as high as for all vessels (about 2.8compared with about 1.35), while the casualty risk for ferries and roll-on/roll-offcontainer ships is almost half of that risk for all vessels. After the ESTONIA disaster in1994 the fatality risk of ferry travel in European waters from 1985 to 1994 (in total 1,408fatalities) was investigated and is given in the ETSC report as:
fatalities/million ferry hours 0.84fatalities/million ship kilometre 2.61fatalities/100 million passenger hours 14.80fatalities/100 million passenger kilometre 0.46
The ESTONIA disaster of 1994 with 850 fatalities dominates these reported risks. Theyear 1984 and the 8 years after 1994 show no ferry passenger fatalities in EU-waters. Theabove risks, therefore, can now be updated for the larger period 1984-2001 by acorrection factor of 10/18=0.555 because, unlike with the other modes, there has been noconsistent reduction in the fatality risk decay. The updated risk level cover now a longerperiod and are thus less dominated by the exceptional number of fatalities in 1994.
Thus, the updated fatality risks of ferry passengers that are comparable with othertransport modes’ risks become:
fatalities/100 mill. passenger hours 8.0fatalities/100 mill. passenger kilometres 0.25
27

Since the risk for ferries appears to be constant, the expected number of fatalities fromferry passenger transport in 2002 is 320 x 0.25=80 (assuming about 32 billion ferrypassenger kilometres on ferries within and to/from EU countries). About 80% of ferrydisasters do not involve passenger fatalities, while fatalities mainly occur when ferriescapsize. About 16% of ferry disasters are due to capsizing, and these account for about80% of the total of about 1,400 fatalities in ferry disasters in EU waters since 1983. Onefire and one collision account for about 300 other fatalities on ferries. Only about 6% offatalities on ferries are due to collisions. This is quite different to rail and road transport(for example: about 70% of the road fatalities in EU are due to collisions between roadusers and the other 30% are mainly due to single vehicle accidents, includingbicyclists).
28
7 RECOMMENDATIONS
1. Road safety needs more priority in the transport policies of EU Member States andthe EU, because 99% of all transport fatalities in the EU are caused by roadtransport. Road transport accounts for 88% of all passenger transport in the EU,but accounts for 100-times more deaths than all other modes together.
2. It is recommended that national and EU health policies recognise the relatively highmortality and injury incidence rates for road traffic.
3. The EU target of 50% road traffic fatality reduction between 2000 and 2010 to about20,000 fatalities in 2010 will not be achieved unless the EU takes additional actionsthat reduce the fatality risk more rapidly than in the past. Therefore, it isrecommended that further actions within the competence of the EU itself (mainlyvehicle safety regulations) are taken and that a EU road safety subsidy fund iscreated for financial incentives that support and trigger national road safety actionsand measures with a proven effectiveness.
4. Priority setting for transport safety must recognise the very high fatality risk ofmotorised two-wheelers (15 times the average road risk per kilometre travelled).
5. It is recommended that the safety of pedestrians and cyclists be improved, becausetheir fatality risks per kilometre are 7 to 9 times higher than for car travel.
6. Passenger transport policies of the EU and its countries should promote the use of(high speed) trains in long distance trips, because the fatality risk of air travel forground distances of less than 600 kilometres is higher than for trains.
7. Intermodal passenger transport policies have to recognise that large differencesexist between the risks of travel modes. The safety of walking and cycling needsalso to be improved in order to optimise the safety of public transport, due to thehigh risk of the necessary walking and/or cycling in the ‘before and after’ phases ofthese trips.
8. Initiatives to improve the recording of road travel volumes and fatalities are beingundertaken by the EU, but progress is lacking for rail travel in the EU, travel on EU-waters and inland waterways of the EU, and air travel by unscheduled flights andprivate planes within the EU. Moreover, serious injury risks for different travelmodes are hard to assess because the necessary incident and exposure data aredefined differently and not consistently gathered. It is recommended that researchand development as well as reporting harmonisation on these matters be initiatedby the EU.
Similar recommendations (except the third) were formulated in 1999 in the ETSCReport on “Exposure data for travel risk assessment”, but it is disappointing that theyhave had so little effect. In view of the EU-target that has been set and the urgency oftaking action to achieve the target, the recommendations need to be implemented soon.
29

30
REFERENCES
ETSC (1999) Exposure data for travel risk assessment: Current practices and futureneeds in the EU. Brussels
ETSC (1999) Crash risks in EU transport. Brussels
The references to statistics and literature are already given in the first of the abovementioned ETSC publications, while the updated data for road transport are mainlybased on the OECD-IRTAD database or, if absent for some countries, obtained fromnational reports or recent UN and IRF world road statistics yearbooks. The statistics forrail and air transport are taken respectively from the UIC-report on 2000 and the ICAOJournal Issue on 2001, both with the same reference as for 1998 given in the earlierETSC Report. Statistics for rail transport are also taken from
Railway Safety (2002) Annual Safety Performance Report 2001/02. London.
31

32