SAE Paper on Fatigue of Welds
13
Application of Fatigue Life Prediction Methods for GMAW Joints in Vehicle Structures and Frames 2011-01-0192 Published 04/12/2011 Hong Tae Kang Univ.ofMichigan-Dearborn Abo1hassan Khosrovaneh GM Mark Amaya Chrysler Jeep Platform Engrg John Bonnen Ford Motor Co Hua-Chu Shih U. S. Steel Shahuraj Mane University of Michigan-Dearbom Todd Link U. S. Steel . Ie ,..5 nternatlona ABSTRACT In the North American automotive industry, various advanced high strength steels (AHSS) are used to lighten vehicle structures, improve safety performance and fuel economy, and reduce harmful emissions. Relatively thick gages of AHSS are commonly joined to conventional high strength steels and/or mild steels using Gas Metal Arc Welding (GMAW) in the current generation body-in-white structures. Additionally, fatigue failures are most likely to occur at joints subjected to a variety of different loadings. It is therefore critical that automotive engineers need to understand the fatigue characteristics of welded joints. The Sheet Steel Fatigue Committee of the Auto/Steel Partnership (A/S-P) completed a comprehensive fatigue study on GMAW joints of both AHSS and conventional sheet steels includinQ: DP590 GA. SAE 1008. HSLA HR 420. DP 600 Copyright © 20 I 1 SAE International doi: 10.4271/2011·01-0192 HR, Boron, DQSK, TRIP 780 GI, and DP780 GI steels. Dissimilar meta] welds were made between DP590 GA and SAE 1008, DP 600 and SAE 1008, TRIP 780 and SAE 1008, DP 780 and SAE 1008, and Boron and HSLA. Fatigue behavior was evaluated for several different specimen geometries: single lap-shear, double lap-shear, butt weld, start-stop, and perch mount. Currently, many fatigue life prediction methods, such as structural stress approach, hot spot structural stress approach, notch stress approach, and local strain approach, are available to analyze GMA W joints. This study reviews two structural stress methods for fatigue life prediction of the welded joints. and it also assesses the two methods with previous A/S-P Sheet Steel Fatigue Committee fatigue test results.
-
Upload
dimitra-catsiorchis -
Category
Documents
-
view
41 -
download
4
description
SAE PAPER-Fatigue of Welds
Transcript of SAE Paper on Fatigue of Welds

Application of Fatigue Life Prediction Methods for GMAW Joints in Vehicle Structures and Frames
2011-01-0192
Published 04/12/2011
Hong Tae Kang Univ.ofMichigan-Dearborn
Abo1hassan Khosrovaneh GM
Mark Amaya Chrysler Jeep Platform Engrg
John Bonnen Ford Motor Co
Hua-Chu Shih U. S. Steel
Shahuraj Mane University of Michigan-Dearbom
Todd Link U. S. Steel
~.rl . Ie,..5 nternatlona
ABSTRACT
In the North American automotive industry, various advanced high strength steels (AHSS) are used to lighten vehicle structures, improve safety performance and fuel economy, and reduce harmful emissions. Relatively thick gages of AHSS are commonly joined to conventional high strength steels and/or mild steels using Gas Metal Arc Welding (GMAW) in the current generation body-in-white structures. Additionally, fatigue failures are most likely to occur at joints subjected to a variety of different loadings. It is therefore critical that automotive engineers need to understand the fatigue characteristics of welded joints.
The Sheet Steel Fatigue Committee of the Auto/Steel Partnership (A/S-P) completed a comprehensive fatigue study on GMA W joints of both AHSS and conventional sheet steels includinQ: DP590 GA. SAE 1008. HSLA HR 420. DP 600
Copyright © 20 I 1 SAE International
doi: 10.4271/2011·01-0192
HR, Boron, DQSK, TRIP 780 GI, and DP780 GI steels. Dissimilar meta] welds were made between DP590 GA and SAE 1008, DP 600 and SAE 1008, TRIP 780 and SAE 1008, DP 780 and SAE 1008, and Boron and HSLA. Fatigue behavior was evaluated for several different specimen geometries: single lap-shear, double lap-shear, butt weld, start-stop, and perch mount.
Currently, many fatigue life prediction methods, such as structural stress approach, hot spot structural stress approach, notch stress approach, and local strain approach, are available to analyze GMA W joints. This study reviews two structural stress methods for fatigue life prediction of the welded joints. and it also assesses the two methods with previous A/S-P Sheet Steel Fatigue Committee fatigue test results.

"Single Lap-Shear Start-Stop Bun Weld
~...o;.;;.-,,-,..,.=-l-_'_I' i~ Perch Mount
Figure 1. Specimen types used in Phase-I and Phase-2 fL]J.
INTRODUCTION Vehicle mass has direct effect on vehicle fuel consumption. Thus, design engineers must reduce vehicle mass without sacrificing crash performance. Ultimately, vehicle weight reduction is an outcome of the optimum balance between crashworthiness and vehicle structure durability.
Attractive mechanical properties make Advanced High Strength Steels (AHSS) suitable candidates for vehicle structures. However, the introduction of these materials into vehicle structures requires a deeper understanding of welded joint dUJability and the susceptibility of welded joints to fatigue crack initiation from stress concentrations. Generally, the structural performance of welds drives vehicle structural integrity. Thus, the Sheet Steel Fatigue Committee of the AI S-P initiated an investigation to compare the relative weld performance of AHSS with those of conventional steels and high strength low alloy (HSLA) steels.
AHSS are commonly welded to low carbon and HSLA members, and increasingly to other AHSS. Thus, the Committee elected to study the fatigue performance welded joints between two sheets of the same AHSS, and between AHSS and low carbon or HSLA steel. The AHSS materials examined in this study were dual phase (DP) 600, DP590, DP 780, transformation-induced plasticity (TRlP) 780, and Boron. HSLA 420, SAE 1008, and drawing quality special killed (DQSK) were the conventional steels used in this study.
The test results for Phase-I of this project were reported in references U, II and the test results of Phase-2 were published in QJ This paper contains the results of both Phase-l and Phase-2. Furthermore, two fatigue life prediction methods based on structural stress [1,,2,Q) were employed to estimate the fatigue life of the test coupons. Numerous researchers worked on structural stress approaches [1,~,2,lQ]
but only two approaches were employed in this study because they are most widely employed in automotive industry. Lastly, differences between the analysis and the test results are discussed.
EXPERIMENTAL PROCEDURE
WELD FABRlCATION Test specimens were fabricated with care to maintain geometrical consistency between specimens within a single stack-up group (e.g., Boron-HSLA420), and between similar thickness stack-up groups (e.g., between Boron-HSLA420 specimens and Boron-Boron). More specifically, the horizontal and vertical leg lengths of the thicker specimens (3.4 mm-3.4 mm) were held to be between 0.9 to 1.2 times the base mate/ial thicknesses. However, for the thinner specimens (1.6 mm-l.6 mm), the vertical leg length was the same as of the thicker specimens but the horizontal leg length was held to be between J.8 to 2.0 times the base material thickness. The welds were fabricated to be convex but no additional controlling parameters were used to maintain the toe radius or toe angle. Reference U] contains additional information.

Table 1. Materials, gages and specimens types tested in Phase_l and Phase_2 ("X" - Phase_l and "0" - Phase_2).
Gauge (mm) Single Lap-Shear Double Lap-Shear Start-StopMaterials Perch Mount
x xBoron 3.4
o oBoron to HSLA 3.4 o x x1.6
oDP590 GI 1.6 o DP590 GI Stripped 1.6 o o
DP590 HR 3.4 o x x3.4 x x
x1.6 o DQSK 1.6 x
xHSLA 3.4 x xo 3.4SAE1008 x x
TRIP780 1.6 x 1.6t03.4 xDP590 to SAEI008
DP600 to SAE I008 3.4 to 3.4 x DP780 to SAE 1008 1.6 to 3.4 x
TRIP780 to SAE I008 1.6t03.4 x
The weld gap was minimized, and the weld gap acceptance criterion was set to a maximum of 10% of the smallest sheet thickness in the lap shear specimen geometries. The welding parameters such as wire feed speed, welding speed, and voltage were also optimized to fabricate consistent welding specimens as discussed in reference Ul The test ~pecimens
were fabricated by robotic welding of long sheets using 70 ksi (480 MPa) filler wire. A water cooled clamping system was used to minimize warpage. To maintain consistency in specimen geometlY, test specimens were cut from larger welded sheets by waterjet, and the ends of the welds (the weld start and stop) were excluded by removing 20 mm from either end of the longer sheets. A separate set of specimens was used to examine the effects on fatigue life variability of weld starts and stops. An engineered weld gap was introduced for galvanized materials. A detailed discussion on the weld fabrication techniques used in the study may be found in reference I1J
SPECIMEN GEOMETRY The five different weld geometI;es used included single lapshear, double lap-shear, start-stop, butt weld and perch mount. Figure 1 shows the geometries of the specimens tested U, II· Table I shows information about the materials, thicknesses and specimen type used. If the two sheets to be welded were identical, the material is stated once. However,
if dissimilar materials were welded together (in terms of base material or thickness), then both materials are named in Table 1- The specimens tested for Phase-I were marked with "X" and for the ones tested for Phase-2 were marked \-vith "0". Gl stands for galvanized coated steels and Gl Stripped means that the GI is removed.
FATIGUE TESTS Load controlled fatigue tests were performed on aU specimens according to ASTM standard E466-07. The standard load ratio (PminlPma,J was R=O.I, although some
iterations were tested at an R-ratio of R=0.3, and those iterations are shaded in Table I. The fatigue results were obtained by testing three load levels and three repetitions at each load level. The criterion for the specimen failure was the full separation of the specimen. Fatigue tests were
discontinued when the specimen cycle count exceeded 5x 10⁶
cycles without failure, and those specimens were classified as runouts.
FATIGUE TEST RESULTS
Single Lap-Shear Fatigue Test Results Figure 2 shows the Phase-2 test results, and Figure 3 shows the test results from Phases- Land 2. Note that the results are normalized by dividing the load range by thickness for the single lap-shear and start-stop configurations. Specimens with thicknesses of J.6 and 3.4 mm were used. The data points inside the circle are runouts.

• ••
I.E+05
z ,; I E+04 ~D iO
c<: "0
'" ..s "0
~ I.E+03
" § &DP780. R-<-().1.1~1.61U1ll:z
6DP7R0. R~0..1. I~J 6mm
.l:loronIHSLA. R~O.I.' 1.4/34nul1 IE+02
IE-01 I.H04 I.E+05 IE+06 1£+07
Cycles of Failun:
Figure 2. Fatigue test results for single lap-shear specimens From Phase-I.
IE+05 -.-----------------,
E
~ ..... ~1.E+04
DP590. R ~ 0.1. r 1.6 - 0 •l>P590. R = OJ. r-16 -0 .SAEI008. R '0.1. 3.4li 1.£+03 • HSLA HR. R ~O.I. ,~3.4
.DP600. R = 0.1. I=.U 6DP600. R = 0.1. 1~.J.4
" is
• Bown. R ~ 0.1.1=3.4 .DP780. R ~ 0.1. ,-1.6 OPP780. R 0.3. ,-1.6 .Boron-HSLA. R = 0.1. 1=.1.4
:z
\.[+02
1.£+01 1.£-04 lE+05 I.E+06 IE+07
Cycle to Failure
Figure 3. Fatigue test results for single lap-shear specimens from Phase-l and Phase-2.
The results include all the 3.4 mm and 1.6 mm materials tested at load ratios ofR=O.1 and R=O.3. As can be seen in Figure 3, there does not appear to be a strong influence of parent metal strength on fatigue performance, and the R=O.3 load ratio data falls more or less on the same trend line. These two trends can be seen in this and subsequent figures. It is noteworthy to mention that more scatter was found with welds made with the thinner material (1.6 mm materials) and this increased scatter is attributed to the greater difficulty in making these joints, and in the resulting variability in the welding gap.
Double Lap-Shear Fatigue Test Results Figure 4 shows the results from Phase-2 testing of the double Jap-shear coupons, while Figure 5 shows the combined results from both Phases-l and 2. Specimens with thicknesses of 1.6 and 3.4 mm were used. No distinctive difference between the test specimens of different thickness was observed as was seen in the single lap-shear specimens. Also, the same observations made concerning the lap-shear specimens tests can be made here as well. There does not appear to be strong inf1uence of the parent metal strength on the joints, as well as the affect of load ratio on the strength of the joints. Also, the effect of sheet thickness on the fatigue life of double lap-shear specimens is not critical compared to that of single lap-shear specimens.
I.E+06
kDP590. R=O.I. ,= 1.6uilll
6 np590 Stripped. R=O.I. r~ 1.6mlll
BOlDn-HSLA. R~"O I. ,=3.4 .1.4null
~ I.E+05
" :0 c: '"or:
• • '0
.3 I.E+04
1.£+03
1.10,+03 J £.+04 I.HOS I.E+06 IJ: ,07 Cycles of Failure
Figure 4. Test results for double lap-shear specimens from Phase-2.
IE+06
ZI.E+OS
~ ~fJ
<= :.::"
• ~ -01 .-1 OP6<.Xl R-Q; 0"
• on,)?"'! I T'I~
OP!\lC, 001 ..1.6 .TIllP" C Mi...~6
P.'!!:IC: R I r-l ~ Boro.-HSL~ R-<l j t"';
."'JP-S~SA£I(03 it..!)...
1E+03
IE+03 1.£+04 IE+05 11'+06 1£+07 IE+08 Cycles 10 l'ailure
Figure 5. Fatigue lest results for double lap-shear specimenfromphases-l and 2.

Perch Mount Fatigue Test Results Perch mount specimens were fatigue tested under two different loading cases - normal loading and shear loading. Figure 8 shows the results, and reference [1] contains a complete description of how these tests were conducted. Please note that for this specimen the results were completed fully within Phase-I.
1.£+06 eDP600. R~O.I. '=3.4. Norn1~1 Lo~d
ODP600, R=0.3. 1=3.4, Nor"", I Load
.HSLA. R~O.I. r=3.4. Normal Load
Ii. DP600. R~O.I. 1=3.4, Shear Load
1.£+05 ADP600. R=O.3. ,=3.4. Shear Load ;Z
~ ~ •
OHSLA, R=O.I, 1=3.4. Shear Load
'""0
'" 0 •• ...J
1.£·'04 • -1.£+03 +--~.....~~......_~~ .......c--~~'"'t-~~........(
1.£+02 1.£+03 1.£+04 1.£+05 1.£+06 1.£+07 Cycles 10 Failure
Figure 8. Fatigue test results for perch mount specimens.
FATIGUE ANALYSIS PROCEDURE in the present study, the fatigue analysis of the fOUf types of welded joints was examined (all specimen configurations except butt weld) using two different structural stress approaches, Fermer and co-workers [!I and Dong [2]. These methods were selected since they are heavily used in the automotive industry and are employed by two major fatigue analysis packages (Please note that this paper does not intend to promote any commercial software used in this study). The predicted fatigue life of the welded joints from these approaches was compared with fatigue test results.
FERMER APPROACH This method was developed by Fermer and co-workers [1] for fatigue life prediction of welded thin sheet structures. The heart of it is a calculated structural (hot-spot or geometrical) stress with nodal forces and moments obtained from finite element (FE) analysis. Also, the structural stress has strong relationship with the local stress state that results in fatigue failure at the welded joint. The following modeling techniques were recommended (1).
• 4-node shell elements are used for all thin sheet structures and welds.
• The shell elements represent the mean surfaces of the thin sheet structures.
I.E+05
E E :Z oJ I.E+04 1;1) c
c2 '0
o '" --l '0
.~ I.E+03
§ o Z
I.E+02
E E :Z .,; ;:'0 I.E+04
~ '0 g --l
1$ N
;;; IE+03 F i5
Z
il.i.~ A ...... Atli. orn 0 .r.-
OlD 0
Ii.HSLA_HR. R~O.I. r~3.4 mm
_Boron-HSLA_HR. R~O.I, 1~3.4lTUn
.DP590_HR. R~O.I. 1=3.4mm
ODP590_GI. R~O.I. 1~1.6rnrn
ADP590_GI_Slripped. R=O.I, 1= 1.6rnm
I.E+03 I.E+04 I.E+05 IE+06 IE+07
Cycles to Failure
Figure 6. Fatigue test results for start-stop lap-shear specimens from Phase-2.
I.E+05 ...----------------...,
.OP590_HR,R=O.I. r 3.4 .HSLAJJR, R=0.1.1~3.4
Boron.HSLA_HR. R=O.I, r=3.4 • DP600,R=0.1, 1~3.4
ODP600. R=O.3. 1=3.4 .DP590. GI_Slnpped, R~O.I, '~1.6
Xf)P590. GJ. R~O.I, 1~1.6
I.E+02 -I-~~~"+-~~~""'+-~~~.......,-~~~
I.E+03 I.E+04 I.E+05 I.E+06 I.E+07 Cycles to Failure
Figure 7. Fatigue test results for start-stop lap-shear specimens from Phase-l and Phase-2.
Start-Stop Lap-Shear Fatigue Test Results The effect of weld starts and stops on fatigue performance was analyzed using the start-stop specimens. Weld starts tend to suffer from incomplete fusion and tend to be relatively flat compared to the center of the wel~ and weld stops tend to have some mounding up of weld metal because the welding torch pushes weld metal ahead of it. Figures 6 and 1 show the fatigue results for the start-stop Jap-shear specimens for Phase-2 and Phases- J and 2 respectively. Please note that, as before, the data were normalized to remove thickness effects. Again, the observation made for lap shear and double lap shear tests may be made here as well. There does not appear to be strong influence of the parent metal strength on the joints, as well as the affect of load ratio on the strength of the joints. Also, more scatter has been noticed with the thinner material.

• There is an offset by tl2 at the nodes of the shell elements along the weldline.
• The thickness of weld shell elements is the effective weld throat size.
• The optimal element size is about 10 mm. The FE mesh does not include the small detail radii of the weld.
The weld toe, the locus of points along the weldJine where the weld fillet meets the sheet, is a common location for fatigue failure of GMAW joints. It is generally believed that the normal stresses perpendicular to the weldline at the weld toe contributes to the fatigue failure of the weld. The structw-al stress amplitude (cr-.L) is defined by the combination
of the bending moment along the weld line and the normal stress perpendicular to the weld line. The structural stress amplitude can be defined as shown below [1].
[2m,. (y)z _ n< (y) (3 (
(I)
where the bending stress represents the first term and normal stress the second term in the equation. The distance from the mean surface to the location of interest is z, and the sheet thickness is t. my (y) and nx (y) are a line moment and a line
force along the weldline, and are defined as Equation 2 and 2, respectively.
m =- M 1-- +M () 2( [YJ YJ y Y lv yl lv )'2 lv
(2)
n ()=- N 1-- +N 2 [ [YJ YJx Y lv xl l, x2 l,.
(3)
where, Iy is the element edge length between the two grid
points. The nodal moments (My (y)) and nodal forces (Nx (y))
obtained from FE analysis at the grid points. Structural stresses are calculated at grid points at each element.
By modeling the specimen configurations used in this study, the fatigue life of the welded joint was calculated using the struetw-al stress. This approach uses two S-N curves; one tor bending and one for structural stress - both curves were developed by Fermer. To use this approach a bending ratio (r), which is the ratio of bending stress to the structural stress, is needed. Based on the r-ratio an S-N curve can be interpolated between the two curves which indicate the specific loading condition of the welded joint.
DONG APPROACH This method is based on the structural stress approach proposed by Dong W. The structural stress is defined as the superposition of the membrane stress and bending stress at the critical location of a welded joint. The structural stress (l7s) is presented as Equation 4
J; 6m <Y., =---.!.-+--'
[ - [2
(4)
where the first telm is membrane stress and the second term is bending stress. t represents the sheet thickness,j; is the line
force at node i, and m; is tbe line moment at node i.
The line forces can be converted from nodal forces using the simultaneous equations shown in Equation 5 [Q]. The line moment equations can be obtained in a similar manner.
·1
~ ~ 0 0 b 3 6 6 F:III (I + I,)~ !l. 0J; F16 J 6
r ,J; (I, +/,)0 !l- '.!..
6 3 6
r l~,-,. r.-I (I•., ~./. I)~ 0 0 0 !.:d 6 6 3
(5)
Where F 1'p2,F3 ... 'pn-1 are nodal forces In the local
coordinate systems at the grid points.
Mesh-insensitive equivalent structural stress range is then derived as shown in Equation 6. A fracture mechanics concept is incorporated into this equation: crack growth for a single-edge-notch subjected to remote stresses. The structural stress components (bending and membrane stress terms) were treated as equivalent far-field stresses applied to the singleedge-notched specimen [Q].
t.<Y s-----"'---- = C /1/ N /1/
2-m I
t 2/1/ J(r ),;, (6)
\Vhere C and m are material constants, and I(r) is a dimensionless function of bending ratio (r) that takes account of the loading mode effect. Equation 6 becomes the equation for the master S-N curve when In is equal to 3.6.
FINITE ELEMENT MODELING All the welded joints except the butt welds were modeled using 4-node shell elements in this study. Element size at the vicinity of the weldline was almost the same for all FE
models studied. The shell elements in the weld area were offset by 1/2 from the location of the weld toe, and the effective weld throat thickness was assigned to the weld elements according to [±]. Figure 10 shows the FE model of the single lap-shear specimen with loading and boundary conditions. One end was constrained in all translational and rotational directions. At the point of loading the longitudinal direction the nodes were free to translate. FE models for the double lap-shear and the start-stop shared the same loading and boundary conditions.
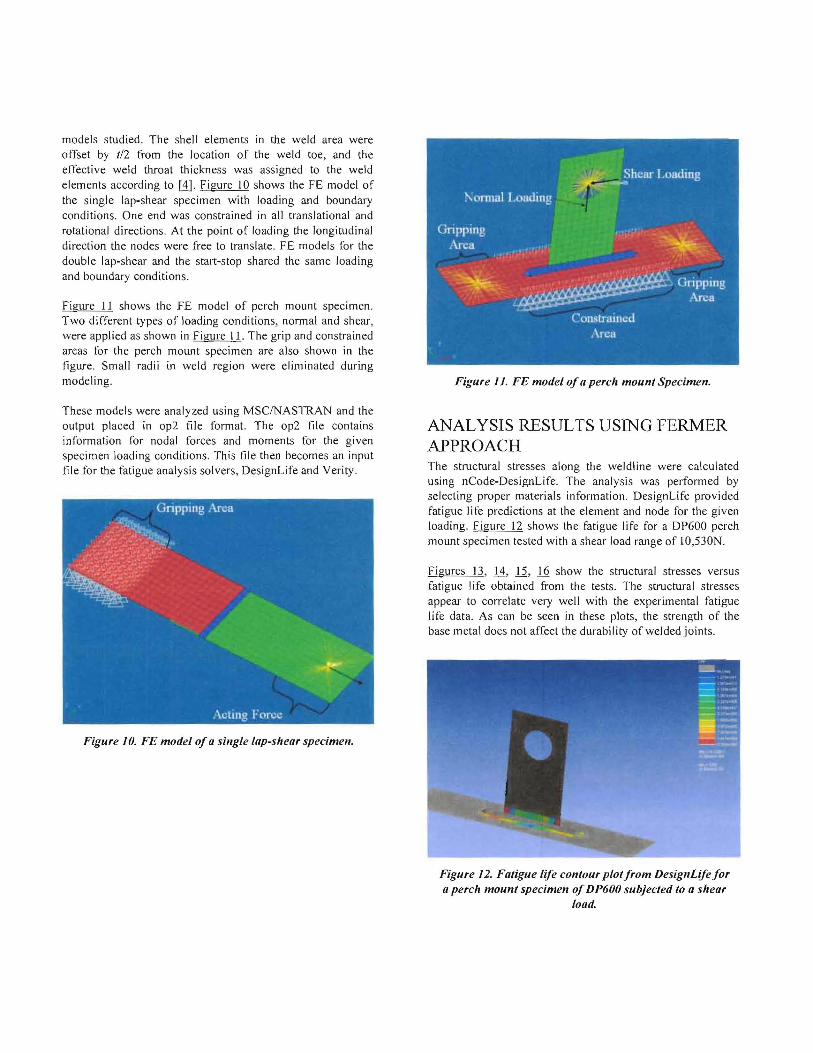
Figure 11 shows the FE model of perch mount specimen. Two different types of loading conditions, normal and shear, were applied as shown in Figure /1. The grip and constrained areas for the perch mount specimen are also shown in the figure. Small radii in weld region were eliminated during modeling.
These models were analyzed using MSCINASTRAN and the output placed in op2 file format. The op2 file contains information for nodal forces and moments for the given specimen loading conditions. This file then becomes an input file for the fatigue analysis solvers, DesignLife and Verity.
Figure 10. FE model ofa single lap-shear specimen.
Figure 11. FE model ofa perch mount Specimen.
ANALYSIS RESULTS USING FERMER APPROACH The structural stresses along the weldline were calculated using nCode-DesignLife. The analysis was performed by selecting proper materials information. DesignLife provided fatigue life predictions at the element and node for the given loading. figure 12 shows the fatigue life for a DP600 perch mount specimen tested with a shear load range of 1O,5JON.
Figures 13, 14, 12, .lQ show the structural stresses versus fatigue Iife obtained from the tests. The structural stresses appear to correlate very well with the experimental fatigue life data. As can be seen in these plots, the strength of the base metal does not affect the durabil ity of welded joints.
Figure 12. Fatigue life contour plotfromDesignLifefor a perch mount specimen ofDP600 subjected to a shear
load.

I.E+04
R' = 0.85
c.. :2: '"
I.E+03,,; eo c:
0::'"<n <n ~
.. OP590. R =0.1, 1~1.6if! 6DP590. R = 0.3. 1=1.6
E .SAE.lOO~. R=0.I.I~3.4I.E+02U" .IfSLA HR. R = 0.1. ,=3.4
" .OP600. R = 0.1. 1=3.4 ~ f), OP60n. R =0.3. 1~3.4
.Boroll. R ~ 0.1. \=3.4 lI:DP7~O. R=O.I.\ ~1.6
XDP780. R=O.3. \-1.6 .DoronlHSLA, R=O.I. 1=3.4
I.E+OI -+-~""""~_~~~~r-~""""~ __~~~~
I.E+03 I.E+04 I.E+05 1.10+06 1£+07 Cycle to Failure
Figure 13. Experimental/atigue life versus structural stress obtained/ront Fermer's method/or single lap
shear specimens.
I.E+04
R' = 079
'"
11I¥!OOtJ.j)SAEI1IIISIJ~I.R 0.1 nr:5?O.n 0.1.1 1.(1
.IISL\ 1U1It QLl.~ 4
A Ul'hUO. f.t - 0 \.1-3.<1
• OIYiliO.R-U.I. I J.t.
r--.s- LIOO8.K 01,1 ,4
&.01'6f'lI, f.t • U.I.I~~ .j
.1:kw0l1oJ{ 0.1.I.\.4
c.. 2: ,,; ~01.E+03
'"0::
DP'SQQ, H 0.).1 1.(, • IRJP7I:\O, R--{l,l 1"1,6
"DQS;;:, R fl 1.1"'1 (. DP......OGI. R n 1.1-1 6
I)r~ ...o (II SlrlPI~ll. R 0.1, I l.r. 8oroll-IIS( 1\, I{ OJ, r'~ oj
UI'S'}QSI\I-.1UOll,R"U.I,t -I (,3..1 +lRlriSUSA!.:IOOx,R U 1,1 1.<t.3.4
)(DPnOSAUOOk.I~:OI,t J.(,J .....
1.£+0 I t.=:':::::=~==:::::;:::::::=:::::::;:::::::;::::=:::::;::j I.E+03 1.£+04 I.E+05 I.E+06 IE+07
Cycles to Failure
Figure 14. Experimental/atigue life versus structural stress obtained/rom Fermer's method/or double lap
shear specimens.
1.£+04
c.. :2: 61I.E+03
'"
c 0::'"<n <n !" a ro2 I.E+02 " 2
U5
I.E+OI
R' = 0.73
-~IIlIt.......
.OP590_HR,R=O.1. ~3.4
.HSLA_I-lR, R~O.I, 1=34
Boron-HSLAjjR. R=O.I. 1=3.4 .OP600,R~0.1. 1=3.4
<>OP600. R=0.3. 1-3.4
01'590. GI_Stripped.R=O.I. ~1.6
XDP590.GI. R~0.1.1=1.6
1.£+03 1.£+04 1£+05 I.E+06 I.E+07
Cycles to Failure
Figure 15. Experimental/atigue life versus structural stress obtained/rom Fermer's method/or start-stop
I.E+04
c.. '" 2: 61I.E+03 c:
0::'"'" <n
~ U5 e '" I.E+02 u 2
U5
JE+OI
1.£+02
specimens.
R' = 0.83
e[)P600. R"'iJ.I, \~3.4. Nonnal Lo.d
OL>P600, R=O.3. 1=3.4. Normal Load
.IISLA. R=O.I. 1=3.4. Nonnal Load
... OP600. R~O.I., 3.4, Sh"",- Load
.o.OP600. R~O.3. 1·-3.4. Shear Load
DHSLA, R~O.I, 1=3.4. ShOal Load
1.£+03 1.£+04 I.E+05 I.C+06 I.E+07
Cycles (0 Fai lure
Figure 16. Experimental/atigue life versus structural stress obtained/rom Fermer's method/or perch mount
specimens.
Figures 17, Ill., l.2., 20 show the predicted fatigue life obtained from DesignLife versus the expelimental fatigue life for different specimen configurations. In general, there is a good correlation between the analysis and test results. The 45 degree line represents perfect correlation between the experiment and analysis. Due to the scatter inherent in fatigue testing, lines which are a factor of 3 on either side of perfect line have also been plotted. A correlation is considered good if it lies within the factor of3 scatter bands. DesignLife overestimated the fatigue life for some of the single lap-shear and start-stop specimens as shown in Figures 17 and l.2., Furthermore, it under-estimated most of the perch mount specimens as shown in Figure 20. Please note that the material failure criterion for DesignLife is based on a through

thickness crack, while the fatigue tests were run until full separation of the specimen. For the Jap-shear specimens, the crack initiated at the center and propagated, while for the perch mount specimens the crack initiated from the edge and propagated. Our conclusion is that this may contribute to the over prediction and under prediction for the lap-shear and perch mount specimens, respectively.
I.E+07 , , ,. ,
:IX 'So ~ S c: , ., ' I.E+06U x ,. .,~ xx' X~,. c.. A, "t::. i ,2 OJ IE+OS"- / rJr>5'X1.R 111,1 Ilj '" S , nl"~i){}R-01.1-10
~ .SAllU03. R - 0.1. ,"'J -4U"' >-. , .IISLt\ HR. R 0 1.1<.\ ~
U " , "~W600, R . () 1, t 34I.E+04 II' .6 DI"600. R... 0.3.1 1'~
, .Uoron.R"IJ.I.t )..1
/ XDf'>7Sn.I{-OI,I·I.6
" :t<nnso. R. OJ, r' I 6
", .• lkofonl~.lS',A. R 0.1.\ 3.4. 1£+03
IE+03 1.£+04 I D·OS I. E+06 I.E+07 Cycle to Failure, Experimenr
Figure 17. Predictedfatigue life from Fermer's method versus experimentalfatigue life for the single lap-shear
specimens.
IE+07
c: S 1.£+06 U '0 ~
c..
i => I.E+OS .~
"
U
~
" "' >-. IE+04 u
I.E+03
I.E+03 1.£+04 IE+OS I.E+06 J .E+07
Cycles to Failure, Experiment
Figure 18. Predictedfatigue life from Fermer's method versus experimentalfatigue life for the double lap-shear
specimens.
1.£+07
I.E+06
c: a U '0£ IE+OS
I.E+04
1.£+03
Ol)Pf,oo,1{ 0.3,1 14
.DI>~I>O.til SUlppcd.R-o.I.t~16
)(DP590. (j1.1{ 0 I. I 1.6
/ .IJSl.A IUt R-O 1,1-3,4
Hu,oo HSI ~-\Jlll K-0 I. ,.. 3 4
.IJP(,{IUt n.I.I~].4.
1.10+03 IE+04 I.E+OS I.E+06 1.£+07
Cycles to Failure, Experiment
Figure 19. Predictedfatigue life from Fermer's method vs experimental fatigue life for the start-stop specimens.
I.E+07 .01"600, It .() I. I -].4, Normall Q;.ld
ODP600. Rc(l,l.1 ] ·1.l'-'ornt;IJ LUJd
_.,SI.,\, R 0.1. I .1.,1, ~\lrmalload
c: I.E+06 .W'f.... IIJ. I{-«I.l. I '.'I. t)kh::lr l ....:id
S 6.Dfl6OO. It -0.3. I' .3 ". SIlcurlA)k1 U cnSLA, t{ o. I. I 3 4, Shc::Jr LtD<!'0 e IE.,.OS /
i "
2 / OJ / /" IE-04 / /
/"' '"
//
/
"/ /
" d'
/
/
/.U">-. / / " u ~. ;.:IE+03 -
/ / /
/ -IE+02
IE+02 I.E+03 I.E+04 IE+OS 1£+06 I.E+07
Cycles to Failure, Experimel\l
Figure 20. Predictedfatigue life from Fermer's method vs experimentalfatigue life for the perch mount
specimens.
ANALYSIS RESULTS USING DONG APPROACH To use Verity, a weld definition file is required (2). The structural stresses along the weldline, as defined in the weld definition file, are then calculated. Only fatigue damage at the weld elements was evaluated because the highest structural stress is experienced in the vicinity of the weJdline. In the software, constant amplitude loading with the desired R-ratio was used. The analysis was then performed by selecting the correct crack propagation based material information. In this analysis, the material selected was Steel with a 50% failure equivalent structural stress S-N curve.

Verity provided the fatigue life information for both the elements and nodes for the given loading. Figure 2l shows the log-life contour plot for the DP600 perch mount specimen tested at a shear load range of 10,530 N. Figures 22, 23, 24, 25 show the maximum structural stresses versus fatigue life obtained from tests. Maximum structural stresses appear to correlate very well with the experimental fatigue life data.
Figure 21. Log-Life contour plotfor a perch nwunt specimen ofDP600 subjected to a shear load.
I.E+04 R' =0.81
C>. '" :: I.E+03 bJ) c ~ •
~ 1.£+02 U
"DP590, R -0.1, -1.6 OP590. R-0.3.1-[6--eli 2
.SAEI008, R~0.1,,=3.4 .HSlA HR. R~0.1,1=3.4
"DP600.ll =01.1~3.4 A OP600, R - 0.3.1=3.4 , .Boron, R=O.I, 3.4 )( DP780, R=O.I, 1= 1.6
XDP780 Rc-0.3. '-1.6 • Boro -iSLA R 0.1 I.E+OJ
1.£+03 I.E+04 I.E+05 I.E+06 1.£+07 Cycle to Failure
Figure 22. Experimentalfatigue life versus structural stress obtainedfrom Dong's methodfor single lap-shear
specimens.
I.E+04
g:, 2:
%l, I.E+03 c ~ ~ ~
eli ""§tJ I.E+02 2 IWfl()I~J <l)I::OM·II.ISt3.'l).R-~.1
cii opsw, R 0 J,l 16
.. txJ.SK. J{. 0.1.1 16 I)PVXl GI Slripp;.-d, It I) J. \ 1.6
.DP5')IVSAXIUO~.R 0.1.1 I (,J ~
Xll!'1l;O·SI,Fll)(l.'( R () J.l 1"., l
I.E+OI
R2 =0.81
.SAEIOOIJ.R-1J 1.1-l.4
.DPNIO.R 0.1.1 J~
_Ektr.lILR 0.1,1 J. ... 01'590. It (J.l.l l.(,
.TRJr780.R: ul ..... lfJ IJPS90 Cl. n-O.I ,-1.6 o.:.oo·HSLA.ll 01. l-JA
• RtP~jSAJ·IOO3,I{.") I,rl.u/J.J
I.E+03 I.E+04 I.E+05 I,E+06 1.£+07
Cycles to Failure
Figure 23. Experimental fatigue life versus structural stress obtainedfrom Dong's methodfor double lap-shear
specimens.
I.E+04
'" ~
2: ., on I.E+03 c '" c:.: ~ ~
~ eli E ::l I.E+02 t 2
cii
1.£+01
I.E+03 I.E+04 1£+05 1.E+06 IE+07
Cycles to Failure
Figure 24. Experimental fatigue life versus structural stress obtainedfrom Dong's methodfor start-stop
specimens.
R' = 0.66
~. ~ .. 0 0
.DP590_HR,R~.I, ,~J.4
.HSLA_HR, R=O.I, r3.4 Boron-HSlA...HR, R=O.1. 1=3.4
• DP600.R~O.I, ,~3.4
o DP600. R=O.3, 1=3.4 DP590. GI_Sllipped,R=O.1. 1=1.6
XDP590. GI. R=O.I. 1=1.6

~ 1.F.+U6
'0 ~ l'
0.. ~
'"~ I.E-I-OS ~
'" ~ l.L .. DP590, R =. 0.1 ••-1.6
"u ~ ~ DP590, R - OJ, r= 1.6
",'" .SAEI008,R=0.1,1=3,4
C I.E+04 . , " .HSLAHR,R=0.1,t=3,4
"OP600, R ~ 0.1,1=3,4 '" A DP600. R 0.3. [=3,4
~ eBoron. R = 0.1. 1-3,4 '" X OP780. R=O.I. to 1.6
, XDP7RO. R=OJ. t=1.6 I.E+03
I.E+03 I.E+07I.E+06I.E+05I.E+04
Cycle 10 Failure. Experiment
IE+{)4
R'= 0.88
OJ 0.. ~ ....e. ~ I.E+03 <= OJ
a::
e '" IE+02U :;J
e;,
.OP600, R~{).I. 1=3,4. Normal Load ODP600, R~0.3. t=3,4, Nonnal Load .HSLA. R~O.I, 1=3,4, Normal Load ....OP600, R~U.I, 1~3,4. Shear Load aDP600. R=0.3 .•=3.4. Shear Load DHSLA. R~O.I. 1=3,4, Shear Load
IE+OI
100E+02 1.00E+03 1.00E+04 100E+05 1.00E+06 1.00E+07
Cycles to Failure
Figure 25. Experimental fatigue life versus structural stress obtainedfrom Dong's methodfor perch mount
specimens.
Figures 26, 27, 28, 29 show plots of the predicted fatigue life versus the experimental fatigue life. Verity over-estimated the fatigue life of some of the single lap-shear and start-stop specimens as shown in Figure 26 and 28. Furthermore, it under-estimated the long life region for shear loading in the perch mount specimens, as shown in Figure 29.
I.E+07
Figure 26. Fatigue lives predicted by Dong's method versus experimentalfatigue life for the single lap-shear
specimens.
1.£+07
I.E+06 "'2 U '0 l'
0..
] J.E+OS
u-S '" " ~ I.E+04 u
1.£+03
I.EI03 I.E+04 1.10+05 I.E,' 06 1 EI07
Cyclt:s 10 Failure, Experiment
Figure 27. Fatigue lives predicted by Dong's method versus experimentalfatigue life for the double lap-shear
specimens.
I.E+07
I.E+06
" .~
~ d: ~·I.E+05
u" S
" ~I.E+{)4 U
I.E+03
I.E+03 1.10+04 I.E+05 I.E 1·06 I.E+07 Cycles 10 Failure, Experiment
Figure 28. Fatigue lives predicted by Dong's method versus experimental fatigue life for the start-stop
specimens.

I.E+07 -DPGOO. R~O.I. r=3.4, Normal Load
ODP600. R=0.3. 1-3.4. Normal Load
.HSLA. R=O.I. t=3.4, Normal Load
"'DPGOO. RO"O.I, [=3.4, Shear Load ,
.o-OPGOO, R=0.3. 1=3.4, Shear Load ,
DHSLA. R~O.1. 1~3.4, SI1«" Loull"~1.£+05 ,
, " o
,," ..... .0
GI.E+04 " .. .IlUilI]U , , , r>U
, "IE+03 , 1.£+02
I.E+02 I.E+03 1£+04 1.1.: '05 I.E+06 Cycles 10 Failure, E:<.perimeol
Figure 29. Fatigue lives predicted by Dong's method versus experimentalfatigue life for the perch mount
specimens.
CONCLUSIONS The following conclusions were reached based on this study:
• For welded joints with simi lar weld geometries, parent metal strength does not affect the fatigue strength of welded joints.
• Sheet thickness is the most dominant factor in the fatigue strength of single lap GMAW joints in this study.
• Unlike in base metal tests, mean stress does not significantly influence the fatigue life of GMA W joints for the range of mean stresses tested.
• Scatter increased for thinner materials, especially for welds with dissimilar grades, partly because of greater weld variability for welding thinner sheet.
• Joints with weld stops and starts did not significantly impact joint fatigue performance compared to joints with no starts and stops.
• Both fatigue prediction methods, Ferner's and Dong's, provided reasonable correlations to test data.
REFERENCES 1. Iyengar, R., Bonnen, J., Young, E., Maatz, D. et aI., "Influence of Weld Process Parameters on the Geometric Variability of the Gas-Metal Arc Welds," SAE Technical Paper 2009-01-1549,2009, doi: 10.4271/2009-01-1549.
2. Bonnen, J., Mandapati, R., Kang, 1-1., Iyengar, R. et aI., "Durability of Advanced High Strength Steel Gas Metal Arc Welds," SAE Inl 1. Mater. Manu!, 2(1):155-171, 2009, doi: 10.4271/2009-01-0257.
3. Kang, H., Khosrovaneh, A., Link, T., Bonnen, J. et aI., "The Effect of Welding Dimensional Variability on Fatigue
I.E+07
Life of Gas Metal Arc Welding Joints," SAE Technical Paper 2011-01-0196,2011, doi: I0.4271/2011-0 1-0 196.
4. Fermer, M., Andreasson, M., and Frodin, B., "Fatigue Life Prediction of MAG-Welded Thin-Sheet Structures," SAE Technical Paper 982311, 1998, doi: 10.4271/9823 II.
5. Dong, P. "A Structural Stress Definition and Numerical Implementation for Fatigue Analysis of Welded Joints," Inl 1. a/Fatigue 23, 2001, pp. 865-876.
6. Dong, P., Mesh-Insensitive Structural Stress Method for Fatigue Evaluation of Welded Struclures, Ballelle SS lIP Training Course Materials, Battelle Memorial Institute, 2005.
7. Petershagen, H., Fricke, W., Massel, T., "Application of the local approach to the fatigue strength assessment of welded structures in ships," lIW Doc. XlII-1409-91, International Institute of Welding, 1991.
8. Radaj, D., Design and analysis of fatigue-resistant welded structures, Abington Publ., Cambridge, 1990.
9. Fricke, W., Bogdan, R., "Determination of hot spot stress in structural members with in-plane notches using a coarse element mesh," llW-Doc. XlII-1870-0 I, International Institute of Welding, 200 l.
10. Doerk, 0., Fricke, W., Weissenborn, c., ''Comparison of different calculation methods for structural stresses at welded joints," International Journal of Fatigue, Vol. 25, 2003, pp. 359-369.
ACKNOWLEDGMENTS
The authors would like to acknowledge the kind support of the Department of Energy in providing the funding through U. S. Automotive Materials Partnership and DOE Contract No. DE-FC05-020R22910 for project ASP160. The support of this work by the Department of Energy should not be taken as a guarantee that the data is correct.
The authors of this report would like to thank the other members of the Sheet Steel Fatigue Team who participated in project guidance and data evaluation but elected not to take part in the final analysis and report writing. We would also like to thank the Auto/Steel Partnership for its financial support and Bart Clark, our A/S-P manager for logistical support.
Disclaimer: This report was prepared as an account of work sponsored by an agency of the United States Govemment. Neither the United States Government nor any agency thereof, nor any of their employees, makes any warranty. express or implied, or assumes any legal liability or responsibility for the accuracy, completeness, or usefulness of any information, apparatus, product, or process disclosed, or represents that its use would not infringe privately owned rights. Reference herein to any specific commercial product,

process. or service by trade name, trademark, manufacturer or otherwise does not necessarily constitute or imply its endorsement, recommendation or favoring by the United States Government or any agency thereof. The views and opinions of authors expressed herein do not necessarily state or reflect those of the United States Government or any agency thereof.
TIle Engineering Meeliugs Board bas approved this paper [or publjcarioo. ft has successfuJly completed SAE's peer review process lUlder the supervision afthe seSSion
orgaruzer This process requi.res a millimulD of Lhree (3) reviews by industry experrs.
All righls reserved. No paTl oflhis publication may be reproduced, stored Ul a rt:trieval system, or transll1jUtd, in any fonn or by auy means, electronic, mechanical, photocopyi.ug, recording, or olhcnvisc, without the prior writtco permission of SAE.
ISSN 0148-7191
Positioos aud opinions advanced in ttus paper arc Lhose of the aulhor(s) and not necessarily lhosc ofSAE. The aul.hor IS solely respoosible for the COlllenl of the paper.
SAE Cus(omer Service: Tel: 877-606-7323 (inside USA and Caoada) Tel: 724-776-4970 (outside USA) Fax: 724-776-0790 Email: [email protected] SAE Web Address: http://www.sac.org Printed in USA
SAEInternational"

![Fatigue Testing of Pipeline Welds and Heat …and the fatigue crack growth rate (FCGR) [10], unlike results observed with monotonically increasing loading such as tensile strength](https://static.fdocuments.in/doc/165x107/5e587e86c4154c6fd13029fa/fatigue-testing-of-pipeline-welds-and-heat-and-the-fatigue-crack-growth-rate-fcgr.jpg)