Sadbhav Engineering (SADENG) -...
12
November 20, 2014 ICICI Securities Ltd | Retail Equity Research Result Update Geared up for robust growth… • The topline grew 58.4% YoY to | 594.6 crore on the back of strong execution and was above our expectation of | 469.3 crore • However, the EBITDA margin contracted 32 bps YoY to 10.0% and was lower than our expectation of 10.5%. This was mainly as additional resources and working capital need to be infused in three of the projects in irrigation sector. Sadbhav Engineering has to take over these projects from sub-contractor GKC that went to CDR • Net profit de-grew 28.1% YoY to | 10.2 crore as it reported a tax credit of | 18.7 crore in Q2FY14. On the PBT front, it grew 107% YoY to | 17.0 crore and was significantly ahead of our expectation of | 6.8 crore • The order book stands at | 8,346 crore, implying a book to bill ratio of 3.1x on a TTM basis, providing strong visibility for growth over the next few years. On the back of strong visibility, SEL has guided for 25% revenue growth guidance in FY15E Fund raising through QIP, warrants conversion to boost growth… SEL has raised | 248.4 crore via QIP by issuing ~1.2 crore shares at a fixed price of | 216/share. In addition to that, warrants conversion to 0.8 crore of equity share at the price of | 116 per share has led to infusion of | 92.8 crore by promoters, where | 23.2 crore was already received at the time of issue of share warrants. The proceeds from this would be used to meet future working capital and equipment capex. Hence, we have incorporated increase in equity in our financials and valuation. NHAI awarding to be key; equity requirement largely in place … NHAI has rolled out ~72 projects of which 38 projects worth ~| 34,000 crore are in the request for proposal (RFP) stage while 34 projects worth ~| 31,000 crore are in the request for quotation (RFQ) stage. We believe SEL is well placed to benefit from this huge opportunity. Currently, SEL has an equity commitment of | 250 crore (~| 85 crore already infused) over the next two years for the current BOT portfolio. To fund the same, it intends to use proceeds from securitisation of the Ahmedabad Ring Road, along with NCD proceeds of | 130 crore at SIPL. Consequently, we do not see any equity gap in the current SIPL BOT portfolio. As on date, SEL has done capex of | 98 crore and as per the management no further capex is required in any verticals. Hence, we believe SEL is well placed in terms of equity and capex requirement to beg road projects up to worth of | 5,000- 6,000 crore. Strong visibility in construction business… The current order book stands at | 8,346 crore, at 3.1x FY14 revenues providing strong revenue visibility. Based on this, we anticipate SEL’s growth should be back on track and anticipate that standalone revenues and net income will grow at a CAGR of 23.7% and 25.4%, respectively, during FY14-16E. Going ahead, we also anticipate that the EBITDA margin will improve 20 bps to 10.8% during FY14-16 due to higher proportion of revenues from the high margin mining segment. SEL remains our top pick in the sector; maintain BUY… SEL remains our top pick in the sector on the back of a strong order book providing revenue visibility, well funded equity for BOT projects portfolio, strong execution track record and better earning CAGR. We maintain our BUY recommendation with an SOTP based target price of | 290. We have valued SEL’s 80% stake in SIPL (BOT subsidiary) at | 150/share and construction business at | 140/share (at 8x FY16 EV/EBITDA). Rating matrix Rating : Buy Target : | 290 Target Period : 12 months Potential Upside : 16% What’s Changed? Target Changed from | 265 to | 290 EPS FY15E Unchanged EPS FY16E Changed from | 8.6 to | 9.8 Rating Unchanged Quarterly Performance Q2FY15 Q2FY14 YoY (%) Q1FY15 QoQ (%) Revenue 594.6 375.4 58.4 685.5 -13.3 EBITDA 59.6 38.8 53.5 71.5 -16.6 EBITDA (%) 10.0 10.3 -32 bps 10.4 -41 bps PAT 10.2 28.1 -64 27.0 -62 Key Financials (| Crore) FY13 FY14 FY15E FY16E Net Sales 1,811.0 2,358.1 2,933.1 3,608.7 EBITDA 155.7 249.4 314.5 390.5 Net Profit 74.1 106.2 115.2 166.9 EPS (|) 4.3 6.2 6.7 9.8 Valuation summary (x) FY13 FY14 FY15E FY16E P/E 58.0 40.5 37.3 25.7 Target P/E 67.0 46.8 43.1 29.7 EV / EBITDA 32.3 21.0 15.8 12.9 P/BV 5.2 4.5 3.1 2.8 RoNW (%) 9 11.1 8.4 10.9 RoCE (%) 7.8 10.2 9.5 11.4 Stock data Particular Amount Market Capitalization | 4296.2 Crore Total Debt | 1025.7 Crore Cash and Investments | 76.2 Crore EV (| Crore) | 5245.7 Crore 52 week H/L 270 / 71 Equity capital | 17.1 Crore Face value | 1 Price performance (%) Return % 1M 3M 6M 12M Sadbhav Engg 16.3 12.5 39.4 240.0 Ashoka Buildcon 14.3 (4.7) 13.8 172.1 IRB Infra 21.2 7.6 61.9 222.7 Analyst Deepak Purswani, CFA [email protected] Nikunj Gala [email protected] Sadbhav Engineering (SADENG) | 251
Transcript of Sadbhav Engineering (SADENG) -...
November 20, 2014
ICICI Securities Ltd | Retail Equity Research
Result Update
Geared up for robust growth… • The topline grew 58.4% YoY to | 594.6 crore on the back of strong
execution and was above our expectation of | 469.3 crore • However, the EBITDA margin contracted 32 bps YoY to 10.0% and
was lower than our expectation of 10.5%. This was mainly as additional resources and working capital need to be infused in three of the projects in irrigation sector. Sadbhav Engineering has to take over these projects from sub-contractor GKC that went to CDR
• Net profit de-grew 28.1% YoY to | 10.2 crore as it reported a tax credit of | 18.7 crore in Q2FY14. On the PBT front, it grew 107% YoY to | 17.0 crore and was significantly ahead of our expectation of | 6.8 crore
• The order book stands at | 8,346 crore, implying a book to bill ratio of 3.1x on a TTM basis, providing strong visibility for growth over the next few years. On the back of strong visibility, SEL has guided for 25% revenue growth guidance in FY15E
Fund raising through QIP, warrants conversion to boost growth… SEL has raised | 248.4 crore via QIP by issuing ~1.2 crore shares at a fixed price of | 216/share. In addition to that, warrants conversion to 0.8 crore of equity share at the price of | 116 per share has led to infusion of | 92.8 crore by promoters, where | 23.2 crore was already received at the time of issue of share warrants. The proceeds from this would be used to meet future working capital and equipment capex. Hence, we have incorporated increase in equity in our financials and valuation. NHAI awarding to be key; equity requirement largely in place …
NHAI has rolled out ~72 projects of which 38 projects worth ~| 34,000 crore are in the request for proposal (RFP) stage while 34 projects worth ~| 31,000 crore are in the request for quotation (RFQ) stage. We believe SEL is well placed to benefit from this huge opportunity. Currently, SEL has an equity commitment of | 250 crore (~| 85 crore already infused) over the next two years for the current BOT portfolio. To fund the same, it intends to use proceeds from securitisation of the Ahmedabad Ring Road, along with NCD proceeds of | 130 crore at SIPL. Consequently, we do not see any equity gap in the current SIPL BOT portfolio. As on date, SEL has done capex of | 98 crore and as per the management no further capex is required in any verticals. Hence, we believe SEL is well placed in terms of equity and capex requirement to beg road projects up to worth of | 5,000-6,000 crore. Strong visibility in construction business… The current order book stands at | 8,346 crore, at 3.1x FY14 revenues providing strong revenue visibility. Based on this, we anticipate SEL’s growth should be back on track and anticipate that standalone revenues and net income will grow at a CAGR of 23.7% and 25.4%, respectively, during FY14-16E. Going ahead, we also anticipate that the EBITDA margin will improve 20 bps to 10.8% during FY14-16 due to higher proportion of revenues from the high margin mining segment. SEL remains our top pick in the sector; maintain BUY… SEL remains our top pick in the sector on the back of a strong order book providing revenue visibility, well funded equity for BOT projects portfolio, strong execution track record and better earning CAGR. We maintain our BUY recommendation with an SOTP based target price of | 290. We have valued SEL’s 80% stake in SIPL (BOT subsidiary) at | 150/share and construction business at | 140/share (at 8x FY16 EV/EBITDA).
Rating matrix Rating : BuyTarget : | 290Target Period : 12 monthsPotential Upside : 16%
What’s Changed?
Target Changed from | 265 to | 290EPS FY15E UnchangedEPS FY16E Changed from | 8.6 to | 9.8Rating Unchanged
Quarterly Performance
Q2FY15 Q2FY14 YoY (%) Q1FY15 QoQ (%)Revenue 594.6 375.4 58.4 685.5 -13.3EBITDA 59.6 38.8 53.5 71.5 -16.6EBITDA (%) 10.0 10.3 -32 bps 10.4 -41 bpsPAT 10.2 28.1 -64 27.0 -62
Key Financials (| Crore) FY13 FY14 FY15E FY16ENet Sales 1,811.0 2,358.1 2,933.1 3,608.7 EBITDA 155.7 249.4 314.5 390.5 Net Profit 74.1 106.2 115.2 166.9 EPS (|) 4.3 6.2 6.7 9.8
Valuation summary
(x) FY13 FY14 FY15E FY16EP/E 58.0 40.5 37.3 25.7 Target P/E 67.0 46.8 43.1 29.7 EV / EBITDA 32.3 21.0 15.8 12.9 P/BV 5.2 4.5 3.1 2.8 RoNW (%) 9 11.1 8.4 10.9 RoCE (%) 7.8 10.2 9.5 11.4
Stock data Particular AmountMarket Capitalization | 4296.2 CroreTotal Debt | 1025.7 CroreCash and Investments | 76.2 CroreEV (| Crore) | 5245.7 Crore52 week H/L 270 / 71Equity capital | 17.1 CroreFace value | 1
Price performance (%)
Return % 1M 3M 6M 12M
Sadbhav Engg 16.3 12.5 39.4 240.0
Ashoka Buildcon 14.3 (4.7) 13.8 172.1
IRB Infra 21.2 7.6 61.9 222.7
Analyst
Deepak Purswani, CFA [email protected]
Nikunj Gala [email protected]
Sadbhav Engineering (SADENG) | 251
ICICI Securities Ltd | Retail Equity Research Page 2
Variance analysis Q2FY15 Q2FY15E Q2FY14 YoY (Chg %) Q1FY15 QoQ (Chg %) Comments
Income from Operation 594.6 469.3 375.4 58.4 685.5 -13.3 The revenue was higher than our expectation on the back of strong execution
Other Income 1.8 1.6 1.9 -3.7 1.6 15.6
Construction Expenses 482.8 387.2 298.2 61.9 571.3 -15.5Employee Cost 24.5 11.7 13.4 83.5 19.5 25.6Other expenditure 27.7 21.1 25.0 10.5 23.1 19.5Total Expenditure 535.0 420.0 336.6 59.0 614.0 -12.9
EBITDA 59.6 49.3 38.8 53.5 71.5 -16.6EBITDA Margin (%) 10.0 10.5 10.3 -32 bps 10.4 -41 bps Margin contraction was mainly as additional resources and working
capital needs to be infused in three of the projects in irrigation sector
Depreciation 22.3 22.0 11.4 95.0 22.0 1.6Interest 22.1 22.1 21.1 4.9 22.1 0.0
PBT 17.0 6.8 8.2 107.1 29.0 -41.4Taxes 6.8 1.7 -19.9 -134.4 2.0 240.5 There was tax credit worth | 18.7 crore for earlier years in Q2FY14Reported PAT 10.2 5.1 28.1 -63.8 27.0 -62.4Adjustments 0.0 0.0 0.0 0.0Adjusted PAT 10.2 5.1 28.1 -63.8 27.0 -62.4
Source: Company, ICICIdirect.com Research Change in estimates
(| Crore) Old New % Change Old New % Change CommentsRevenue 2,933.1 2,933.1 0.0 3,348.7 3,608.7 7.8 Incorporated opportunities from expected NHAI awarding in FY16EEBITDA 313.1 314.5 0.4 360.9 390.5 8.2EBITDA Margin (%) 10.7 10.7 4 bps 10.8 10.8 4 bps UnchangedPAT 100.7 115.2 14.4 129.2 166.9 29.2EPS (|) 6.7 6.7 0.4 8.6 9.8 13.4
FY15E FY16E
Source: Company, ICICIdirect.com Research Assumptions
FY13 FY14 FY15E FY16E FY15E FY16EOrder inflow 4,403 2,317 2,921 4,305 2,921 3,805 Incorporated opportunities from expected NHAI awarding in FY16EOrder inflow (Y-o-Y%) 35 -47 26 47 26 30Order backlog 10,143 8,941 8,902 9,359 8,902 8,859Execution rate % (avg) 20 25 33 40 33 38
Current Earlier
Source: Company, ICICIdirect.com Research
ICICI Securities Ltd | Retail Equity Research Page 3
Company Analysis
BOT segment update…
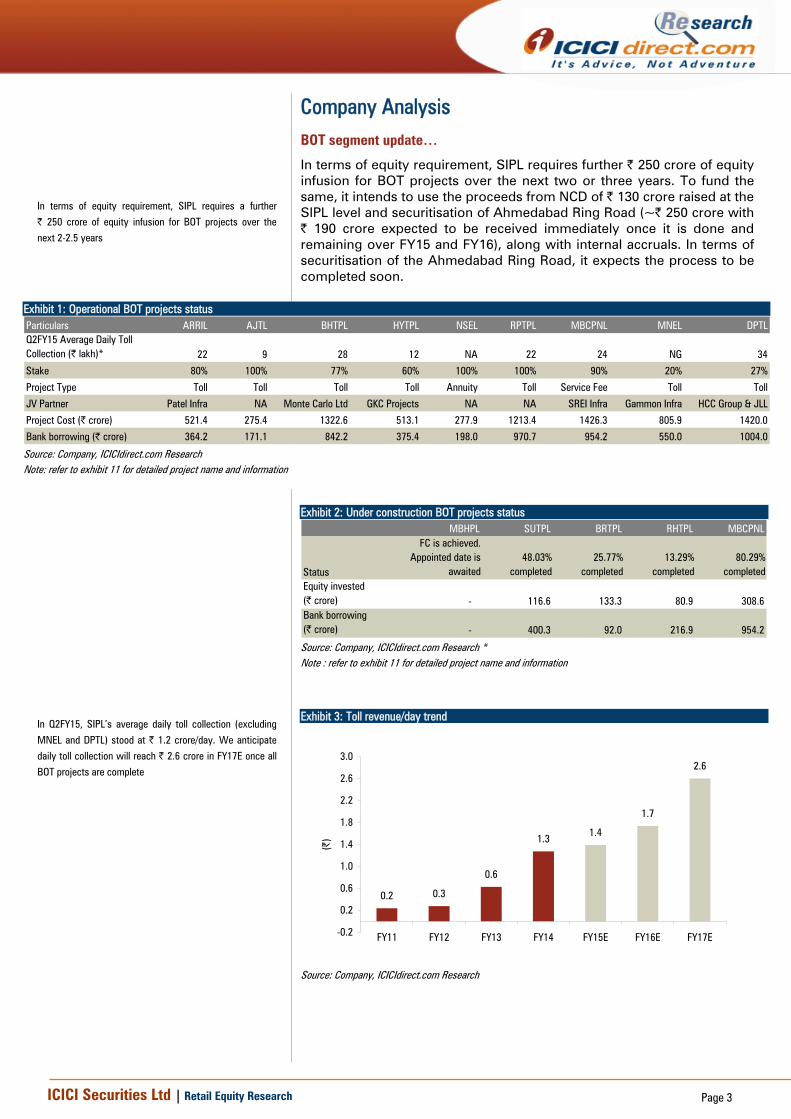
In terms of equity requirement, SIPL requires further | 250 crore of equity infusion for BOT projects over the next two or three years. To fund the same, it intends to use the proceeds from NCD of | 130 crore raised at the SIPL level and securitisation of Ahmedabad Ring Road (~| 250 crore with | 190 crore expected to be received immediately once it is done and remaining over FY15 and FY16), along with internal accruals. In terms of securitisation of the Ahmedabad Ring Road, it expects the process to be completed soon.
Exhibit 1: Operational BOT projects status Particulars ARRIL AJTL BHTPL HYTPL NSEL RPTPL MBCPNL MNEL DPTLQ2FY15 Average Daily Toll Collection (| lakh)* 22 9 28 12 NA 22 24 NG 34
Stake 80% 100% 77% 60% 100% 100% 90% 20% 27%
Project Type Toll Toll Toll Toll Annuity Toll Service Fee Toll Toll
JV Partner Patel Infra NA Monte Carlo Ltd GKC Projects NA NA SREI Infra Gammon Infra HCC Group & JLL
Project Cost (| crore) 521.4 275.4 1322.6 513.1 277.9 1213.4 1426.3 805.9 1420.0
Bank borrowing (| crore) 364.2 171.1 842.2 375.4 198.0 970.7 954.2 550.0 1004.0 Source: Company, ICICIdirect.com Research Note: refer to exhibit 11 for detailed project name and information
Exhibit 2: Under construction BOT projects status
MBHPL SUTPL BRTPL RHTPL MBCPNL
Status
FC is achieved. Appointed date is
awaited48.03%
completed25.77%
completed13.29%
completed80.29%
completedEquity invested (| crore) - 116.6 133.3 80.9 308.6Bank borrowing (| crore) - 400.3 92.0 216.9 954.2
Source: Company, ICICIdirect.com Research * Note : refer to exhibit 11 for detailed project name and information
Exhibit 3: Toll revenue/day trend
0.2 0.3
0.6
1.3 1.4
1.7
2.6
-0.2
0.2
0.6
1.0
1.4
1.8
2.2
2.6
3.0
FY11 FY12 FY13 FY14 FY15E FY16E FY17E
(|)
Source: Company, ICICIdirect.com Research
In terms of equity requirement, SIPL requires a further
| 250 crore of equity infusion for BOT projects over the
next 2-2.5 years
In Q2FY15, SIPL’s average daily toll collection (excluding
MNEL and DPTL) stood at | 1.2 crore/day. We anticipate
daily toll collection will reach | 2.6 crore in FY17E once all
BOT projects are complete
ICICI Securities Ltd | Retail Equity Research Page 4
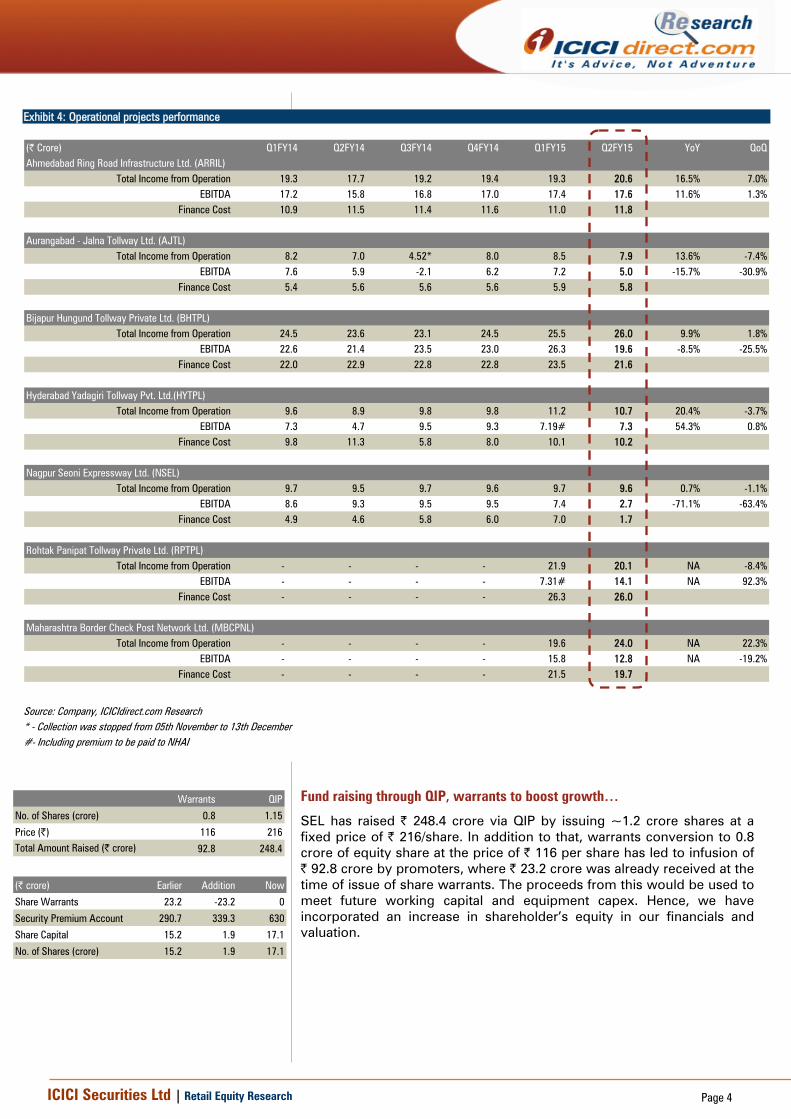
Exhibit 4: Operational projects performance
(| Crore) Q1FY14 Q2FY14 Q3FY14 Q4FY14 Q1FY15 Q2FY15 YoY QoQAhmedabad Ring Road Infrastructure Ltd. (ARRIL)
Total Income from Operation 19.3 17.7 19.2 19.4 19.3 20.6 16.5% 7.0%EBITDA 17.2 15.8 16.8 17.0 17.4 17.6 11.6% 1.3%
Finance Cost 10.9 11.5 11.4 11.6 11.0 11.8
Aurangabad - Jalna Tollway Ltd. (AJTL)Total Income from Operation 8.2 7.0 4.52* 8.0 8.5 7.9 13.6% -7.4%
EBITDA 7.6 5.9 -2.1 6.2 7.2 5.0 -15.7% -30.9%Finance Cost 5.4 5.6 5.6 5.6 5.9 5.8
Bijapur Hungund Tollway Private Ltd. (BHTPL)Total Income from Operation 24.5 23.6 23.1 24.5 25.5 26.0 9.9% 1.8%
EBITDA 22.6 21.4 23.5 23.0 26.3 19.6 -8.5% -25.5%Finance Cost 22.0 22.9 22.8 22.8 23.5 21.6
Hyderabad Yadagiri Tollway Pvt. Ltd.(HYTPL)Total Income from Operation 9.6 8.9 9.8 9.8 11.2 10.7 20.4% -3.7%
EBITDA 7.3 4.7 9.5 9.3 7.19# 7.3 54.3% 0.8%Finance Cost 9.8 11.3 5.8 8.0 10.1 10.2
Nagpur Seoni Expressway Ltd. (NSEL)Total Income from Operation 9.7 9.5 9.7 9.6 9.7 9.6 0.7% -1.1%
EBITDA 8.6 9.3 9.5 9.5 7.4 2.7 -71.1% -63.4%Finance Cost 4.9 4.6 5.8 6.0 7.0 1.7
Rohtak Panipat Tollway Private Ltd. (RPTPL)Total Income from Operation - - - - 21.9 20.1 NA -8.4%
EBITDA - - - - 7.31# 14.1 NA 92.3%Finance Cost - - - - 26.3 26.0
Maharashtra Border Check Post Network Ltd. (MBCPNL)Total Income from Operation - - - - 19.6 24.0 NA 22.3%
EBITDA - - - - 15.8 12.8 NA -19.2%Finance Cost - - - - 21.5 19.7
Source: Company, ICICIdirect.com Research * - Collection was stopped from 05th November to 13th December #- Including premium to be paid to NHAI
Fund raising through QIP, warrants to boost growth…
SEL has raised | 248.4 crore via QIP by issuing ~1.2 crore shares at a fixed price of | 216/share. In addition to that, warrants conversion to 0.8 crore of equity share at the price of | 116 per share has led to infusion of | 92.8 crore by promoters, where | 23.2 crore was already received at the time of issue of share warrants. The proceeds from this would be used to meet future working capital and equipment capex. Hence, we have incorporated an increase in shareholder’s equity in our financials and valuation.
Warrants QIP
No. of Shares (crore) 0.8 1.15
Price (|) 116 216Total Amount Raised (| crore) 92.8 248.4 (| crore) Earlier Addition Now
Share Warrants 23.2 -23.2 0
Security Premium Account 290.7 339.3 630
Share Capital 15.2 1.9 17.1
No. of Shares (crore) 15.2 1.9 17.1

ICICI Securities Ltd | Retail Equity Research Page 5
Robust construction order book to drive revenues, going ahead… Overall, SEL’s order book is currently healthy at | 8,346 crore, implying a book to bill ratio of 3.1x on a TTM basis providing visibility for the next couple of years. The strong order inflow in the irrigation and mining sector has reduced its dependence on the transportation segment. Over the past four years, SEL has improved its presence in the irrigation & mining segment from 26% of total order book as on FY11 to 56% as on Q2FY15. Similarly, the transportation segment now constitutes 44% of the order book vs. 74% in FY11. Given the strong order book, we expect construction revenues to grow at 23.7% CAGR in FY14-16E to | 3609 crore.
Exhibit 5: Quarterly order book trend
9240
9326
8941
8336
8346
4.64.1
3.83.4
3.1
6000
7000
8000
9000
10000
11000
Q2FY
14
Q3FY
14
Q4FY
14
Q1FY
15
Q2FY
15
(| c
rore
)
1.6
2.4
3.2
4.0
4.8
5.6
(x)
Order book Order book to bill ratio (RHS)
Source: Company, ICICIdirect.com, Research
Exhibit 6: Annual order book trend
69657554
10143
8941 89029359
4500
5500
6500
7500
8500
9500
10500
FY11 FY12 FY13 FY14 FY15E FY16E
(| c
rore
)
Source: Company, ICICIdirect.com, Research
Exhibit 7: Segmental break-up of order book
5146 4755 4596 4196 3703
2027 2054 1940 1872 1919
2068 2517 2405 2269 2724
0
2000
4000
6000
8000
10000
Q2FY14 Q3FY14 Q4FY14 Q1FY15 Q2FY15
(| c
rore
)
Road Irrigation Mining
Source: Company, ICICIdirect.com Research
Exhibit 8: Quarterly segmental revenue trend
142.3 109.4 117.8 160.0280.2 299.6
271.4174.1
323.9370.0 199.1 146.7
90.5
20.1
61.6
113.967.8
35.056.9
70.2
116.8
153.8
136.4111.9
0.0
200.0
400.0
600.0
800.0
1000.0
Q1FY14 Q2FY14 Q3FY14 Q4FY14 Q1FY15 Q2FY15
(| c
rore
)
BOT EPC Irrigation Sector Mining Sector
Source: Company, ICICIdirect.com, Research
Exhibit 9: Revenue to grow at 23.7% CAGR led by strong order book…
2,67
5.5
1,81
1.0
3,60
8.7
2,35
8.1
2,93
3.1
-
500
1,000
1,500
2,000
2,500
3,000
3,500
4,000
FY12 FY13 FY14 FY15E FY16E
(| c
rore
)
23.7% CAGR
Source: Company, ICICIdirect.com, Research
The order book stood at | 8,346 crore, 3.1x book to bill on
a TTM basis
The road sector dominates the order book with 44% of the
total order backlog. In the road segment, ~69% accounts for
BOT work while the remaining 31% accounts for EPC contracts
ICICI Securities Ltd | Retail Equity Research Page 6
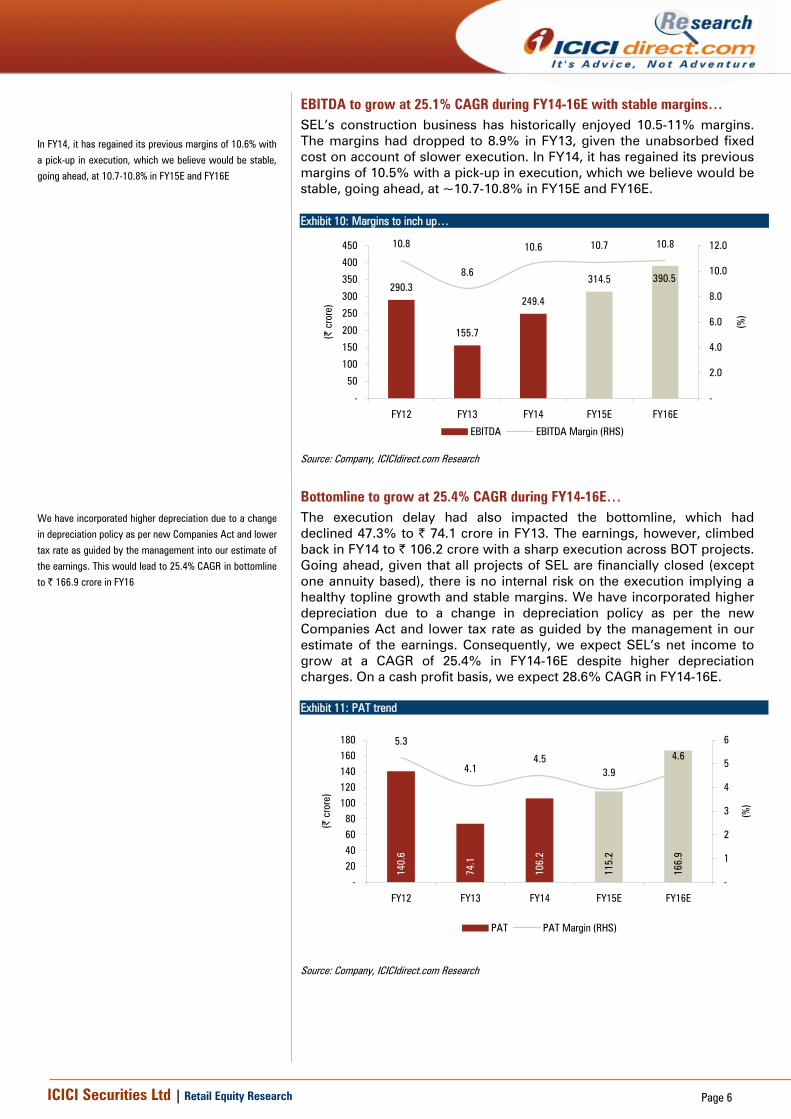
EBITDA to grow at 25.1% CAGR during FY14-16E with stable margins… SEL’s construction business has historically enjoyed 10.5-11% margins. The margins had dropped to 8.9% in FY13, given the unabsorbed fixed cost on account of slower execution. In FY14, it has regained its previous margins of 10.5% with a pick-up in execution, which we believe would be stable, going ahead, at ~10.7-10.8% in FY15E and FY16E. Exhibit 10: Margins to inch up…
290.3
155.7
249.4
314.5 390.5
10.8
8.6
10.6 10.7 10.8
-
50
100
150
200
250
300
350
400
450
FY12 FY13 FY14 FY15E FY16E
(| c
rore
)
-
2.0
4.0
6.0
8.0
10.0
12.0
(%)
EBITDA EBITDA Margin (RHS)
Source: Company, ICICIdirect.com Research
Bottomline to grow at 25.4% CAGR during FY14-16E… The execution delay had also impacted the bottomline, which had declined 47.3% to | 74.1 crore in FY13. The earnings, however, climbed back in FY14 to | 106.2 crore with a sharp execution across BOT projects. Going ahead, given that all projects of SEL are financially closed (except one annuity based), there is no internal risk on the execution implying a healthy topline growth and stable margins. We have incorporated higher depreciation due to a change in depreciation policy as per the new Companies Act and lower tax rate as guided by the management in our estimate of the earnings. Consequently, we expect SEL’s net income to grow at a CAGR of 25.4% in FY14-16E despite higher depreciation charges. On a cash profit basis, we expect 28.6% CAGR in FY14-16E. Exhibit 11: PAT trend
140.
6
74.1
106.
2
166.
9
115.
2
5.3
4.14.5
3.9
4.6
-20406080
100120140160180
FY12 FY13 FY14 FY15E FY16E
(| c
rore
)
-
1
2
3
4
5
6(%
)
PAT PAT Margin (RHS)
Source: Company, ICICIdirect.com Research
In FY14, it has regained its previous margins of 10.6% with
a pick-up in execution, which we believe would be stable,
going ahead, at 10.7-10.8% in FY15E and FY16E
We have incorporated higher depreciation due to a change
in depreciation policy as per new Companies Act and lower
tax rate as guided by the management into our estimate of
the earnings. This would lead to 25.4% CAGR in bottomline
to | 166.9 crore in FY16
ICICI Securities Ltd | Retail Equity Research Page 7
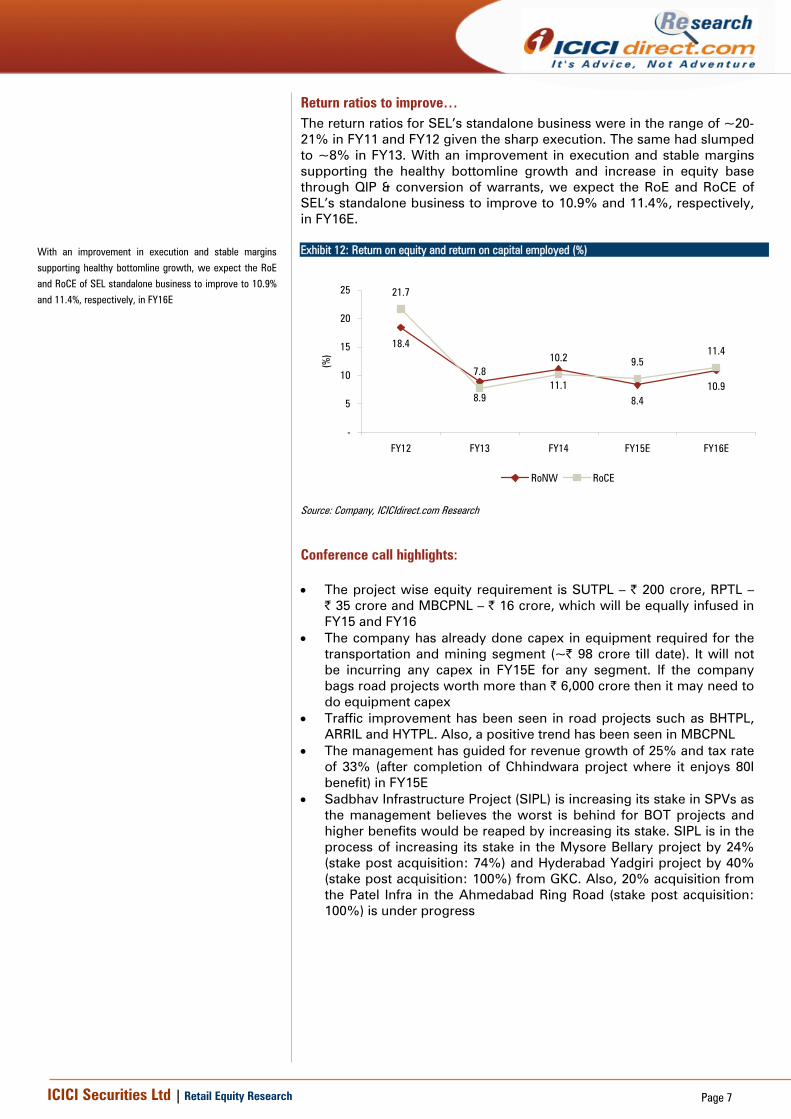
Return ratios to improve… The return ratios for SEL’s standalone business were in the range of ~20-21% in FY11 and FY12 given the sharp execution. The same had slumped to ~8% in FY13. With an improvement in execution and stable margins supporting the healthy bottomline growth and increase in equity base through QIP & conversion of warrants, we expect the RoE and RoCE of SEL’s standalone business to improve to 10.9% and 11.4%, respectively, in FY16E. Exhibit 12: Return on equity and return on capital employed (%)
18.4
10.98.4
11.18.9
21.7
7.810.2 9.5
11.4
-
5
10
15
20
25
FY12 FY13 FY14 FY15E FY16E
(%)
RoNW RoCE
Source: Company, ICICIdirect.com Research
Conference call highlights: • The project wise equity requirement is SUTPL – | 200 crore, RPTL –
| 35 crore and MBCPNL – | 16 crore, which will be equally infused in FY15 and FY16
• The company has already done capex in equipment required for the transportation and mining segment (~| 98 crore till date). It will not be incurring any capex in FY15E for any segment. If the company bags road projects worth more than | 6,000 crore then it may need to do equipment capex
• Traffic improvement has been seen in road projects such as BHTPL, ARRIL and HYTPL. Also, a positive trend has been seen in MBCPNL
• The management has guided for revenue growth of 25% and tax rate of 33% (after completion of Chhindwara project where it enjoys 80I benefit) in FY15E
• Sadbhav Infrastructure Project (SIPL) is increasing its stake in SPVs as the management believes the worst is behind for BOT projects and higher benefits would be reaped by increasing its stake. SIPL is in the process of increasing its stake in the Mysore Bellary project by 24% (stake post acquisition: 74%) and Hyderabad Yadgiri project by 40% (stake post acquisition: 100%) from GKC. Also, 20% acquisition from the Patel Infra in the Ahmedabad Ring Road (stake post acquisition: 100%) is under progress
With an improvement in execution and stable margins
supporting healthy bottomline growth, we expect the RoE
and RoCE of SEL standalone business to improve to 10.9%
and 11.4%, respectively, in FY16E
ICICI Securities Ltd | Retail Equity Research Page 8
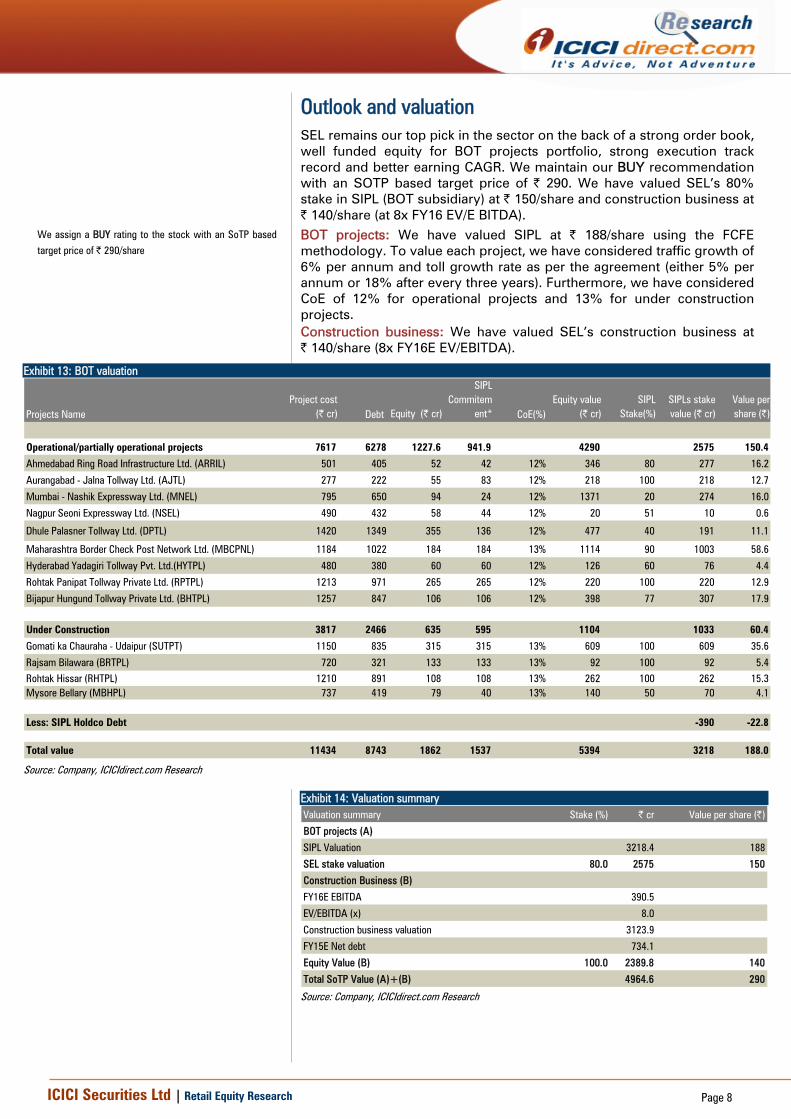
Outlook and valuation SEL remains our top pick in the sector on the back of a strong order book, well funded equity for BOT projects portfolio, strong execution track record and better earning CAGR. We maintain our BUY recommendation with an SOTP based target price of | 290. We have valued SEL’s 80% stake in SIPL (BOT subsidiary) at | 150/share and construction business at | 140/share (at 8x FY16 EV/E BITDA). BOT projects: We have valued SIPL at | 188/share using the FCFE methodology. To value each project, we have considered traffic growth of 6% per annum and toll growth rate as per the agreement (either 5% per annum or 18% after every three years). Furthermore, we have considered CoE of 12% for operational projects and 13% for under construction projects. Construction business: We have valued SEL’s construction business at | 140/share (8x FY16E EV/EBITDA).
Exhibit 13: BOT valuation
Projects NameProject cost
(| cr) Debt Equity (| cr)
SIPL Commitem
ent* CoE(%)Equity value
(| cr)SIPL
Stake(%)SIPLs stake value (| cr)
Value per share (|)
Operational/partially operational projects 7617 6278 1227.6 941.9 4290 2575 150.4
Ahmedabad Ring Road Infrastructure Ltd. (ARRIL) 501 405 52 42 12% 346 80 277 16.2
Aurangabad - Jalna Tollway Ltd. (AJTL) 277 222 55 83 12% 218 100 218 12.7
Mumbai - Nashik Expressway Ltd. (MNEL) 795 650 94 24 12% 1371 20 274 16.0
Nagpur Seoni Expressway Ltd. (NSEL) 490 432 58 44 12% 20 51 10 0.6
Dhule Palasner Tollway Ltd. (DPTL) 1420 1349 355 136 12% 477 40 191 11.1
Maharashtra Border Check Post Network Ltd. (MBCPNL) 1184 1022 184 184 13% 1114 90 1003 58.6
Hyderabad Yadagiri Tollway Pvt. Ltd.(HYTPL) 480 380 60 60 12% 126 60 76 4.4
Rohtak Panipat Tollway Private Ltd. (RPTPL) 1213 971 265 265 12% 220 100 220 12.9
Bijapur Hungund Tollway Private Ltd. (BHTPL) 1257 847 106 106 12% 398 77 307 17.9
Under Construction 3817 2466 635 595 1104 1033 60.4
Gomati ka Chauraha - Udaipur (SUTPT) 1150 835 315 315 13% 609 100 609 35.6
Rajsam Bilawara (BRTPL) 720 321 133 133 13% 92 100 92 5.4Rohtak Hissar (RHTPL) 1210 891 108 108 13% 262 100 262 15.3Mysore Bellary (MBHPL) 737 419 79 40 13% 140 50 70 4.1
Less: SIPL Holdco Debt -390 -22.8
Total value 11434 8743 1862 1537 5394 3218 188.0
Source: Company, ICICIdirect.com Research
Exhibit 14: Valuation summary Valuation summary Stake (%) | cr Value per share (|)
BOT projects (A)
SIPL Valuation 3218.4 188
SEL stake valuation 80.0 2575 150
Construction Business (B)
FY16E EBITDA 390.5
EV/EBITDA (x) 8.0
Construction business valuation 3123.9
FY15E Net debt 734.1
Equity Value (B) 100.0 2389.8 140
Total SoTP Value (A)+(B) 4964.6 290 Source: Company, ICICIdirect.com Research
We assign a BUY rating to the stock with an SoTP based
target price of | 290/share
ICICI Securities Ltd | Retail Equity Research Page 9
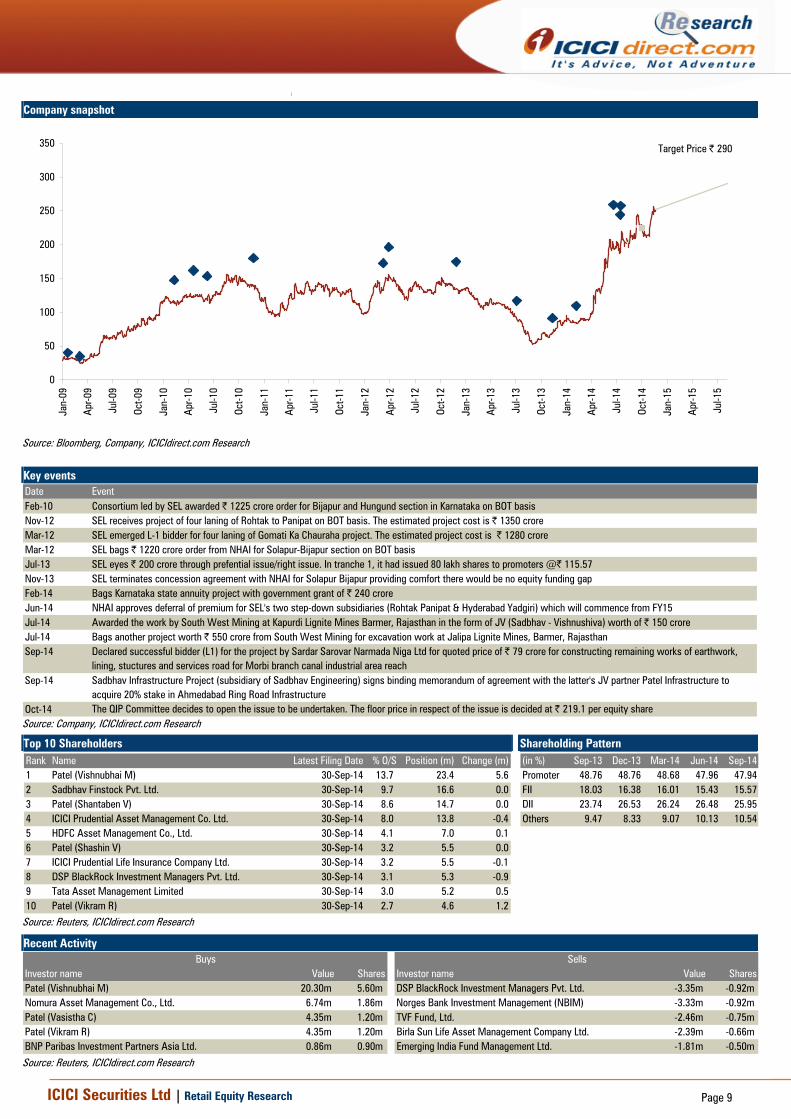
Company snapshot
0
50
100
150
200
250
300
350
Jan-
09
Apr-0
9
Jul-0
9
Oct-0
9
Jan-
10
Apr-1
0
Jul-1
0
Oct-1
0
Jan-
11
Apr-1
1
Jul-1
1
Oct-1
1
Jan-
12
Apr-1
2
Jul-1
2
Oct-1
2
Jan-
13
Apr-1
3
Jul-1
3
Oct-1
3
Jan-
14
Apr-1
4
Jul-1
4
Oct-1
4
Jan-
15
Apr-1
5
Jul-1
5
Target Price | 290
Source: Bloomberg, Company, ICICIdirect.com Research Key events Date EventFeb-10 Consortium led by SEL awarded | 1225 crore order for Bijapur and Hungund section in Karnataka on BOT basisNov-12 SEL receives project of four laning of Rohtak to Panipat on BOT basis. The estimated project cost is | 1350 croreMar-12 SEL emerged L-1 bidder for four laning of Gomati Ka Chauraha project. The estimated project cost is | 1280 croreMar-12 SEL bags | 1220 crore order from NHAI for Solapur-Bijapur section on BOT basisJul-13 SEL eyes | 200 crore through prefential issue/right issue. In tranche 1, it had issued 80 lakh shares to promoters @| 115.57Nov-13 SEL terminates concession agreement with NHAI for Solapur Bijapur providing comfort there would be no equity funding gapFeb-14 Bags Karnataka state annuity project with government grant of | 240 croreJun-14 NHAI approves deferral of premium for SEL's two step-down subsidiaries (Rohtak Panipat & Hyderabad Yadgiri) which will commence from FY15Jul-14 Awarded the work by South West Mining at Kapurdi Lignite Mines Barmer, Rajasthan in the form of JV (Sadbhav - Vishnushiva) worth of | 150 croreJul-14 Bags another project worth | 550 crore from South West Mining for excavation work at Jalipa Lignite Mines, Barmer, RajasthanSep-14 Declared successful bidder (L1) for the project by Sardar Sarovar Narmada Niga Ltd for quoted price of | 79 crore for constructing remaining works of earthwork,
lining, stuctures and services road for Morbi branch canal industrial area reachSep-14 Sadbhav Infrastructure Project (subsidiary of Sadbhav Engineering) signs binding memorandum of agreement with the latter's JV partner Patel Infrastructure to
acquire 20% stake in Ahmedabad Ring Road InfrastructureOct-14 The QIP Committee decides to open the issue to be undertaken. The floor price in respect of the issue is decided at | 219.1 per equity share
Source: Company, ICICIdirect.com Research
Top 10 Shareholders Shareholding Pattern Rank Name Latest Filing Date % O/S Position (m) Change (m)1 Patel (Vishnubhai M) 30-Sep-14 13.7 23.4 5.62 Sadbhav Finstock Pvt. Ltd. 30-Sep-14 9.7 16.6 0.03 Patel (Shantaben V) 30-Sep-14 8.6 14.7 0.04 ICICI Prudential Asset Management Co. Ltd. 30-Sep-14 8.0 13.8 -0.45 HDFC Asset Management Co., Ltd. 30-Sep-14 4.1 7.0 0.16 Patel (Shashin V) 30-Sep-14 3.2 5.5 0.07 ICICI Prudential Life Insurance Company Ltd. 30-Sep-14 3.2 5.5 -0.18 DSP BlackRock Investment Managers Pvt. Ltd. 30-Sep-14 3.1 5.3 -0.99 Tata Asset Management Limited 30-Sep-14 3.0 5.2 0.510 Patel (Vikram R) 30-Sep-14 2.7 4.6 1.2
(in %) Sep-13 Dec-13 Mar-14 Jun-14 Sep-14Promoter 48.76 48.76 48.68 47.96 47.94FII 18.03 16.38 16.01 15.43 15.57DII 23.74 26.53 26.24 26.48 25.95Others 9.47 8.33 9.07 10.13 10.54
Source: Reuters, ICICIdirect.com Research
Recent Activity
Investor name Value Shares Investor name Value SharesPatel (Vishnubhai M) 20.30m 5.60m DSP BlackRock Investment Managers Pvt. Ltd. -3.35m -0.92m Nomura Asset Management Co., Ltd. 6.74m 1.86m Norges Bank Investment Management (NBIM) -3.33m -0.92m Patel (Vasistha C) 4.35m 1.20m TVF Fund, Ltd. -2.46m -0.75m Patel (Vikram R) 4.35m 1.20m Birla Sun Life Asset Management Company Ltd. -2.39m -0.66m BNP Paribas Investment Partners Asia Ltd. 0.86m 0.90m Emerging India Fund Management Ltd. -1.81m -0.50m
Buys Sells
Source: Reuters, ICICIdirect.com Research

ICICI Securities Ltd | Retail Equity Research Page 10
.
Financial summary Profit and loss statement | Crore (| Crore) FY13 FY14 FY15E FY16ENet Sales 1,811.0 2,358.1 2,933.1 3,608.7Growth (%) -32.3 30.2 24.4 23.0Other Income 10.3 36.4 40.1 44.1Total Revenue 1,821.3 2,394.5 2,973.1 3,652.8Raw Material Expenses 268.4 377.9 415.7 457.2Construction Expenses 1,251.3 1,567.1 2,000.6 2,512.0Administrative Expenses 135.6 163.8 202.4 249.0Total Operating Expenditure 1,655.3 2,108.7 2,618.6 3,218.2EBITDA 155.7 249.4 314.5 390.5Growth (%) -30.6 27.4 24.2 22.9Interest 84.4 118.1 118.3 123.8Depreciation 31.8 47.4 82.6 88.1PBT 110.8 82.0 153.5 222.6Total Tax 36.8 -24.2 38.4 55.6PAT 74.1 106.2 115.2 166.9Growth (%) -47.3 43.3 8.5 45.0Exceptional Item (tax adjusted) 40.7 10.3 0.0 0.0Adjusted PAT 33.4 95.9 115.2 166.9Growth (%) 187.5 20.1 45.0EPS (Diluted) 4.3 6.2 6.7 9.8
Source: Company, ICICIdirect.com Research
Cash flow statement | Crore (| Crore) FY13 FY14 FY15E FY16EProfit after Tax 74.1 106.2 115.2 166.9Depreciation 31.8 47.4 82.6 88.1Cash Flow before WC changes 105.9 153.6 197.8 255.1Net Increase in CA -137.6 -332.2 -429.4 -533.4Net Increase in CL -41.2 145.7 246.1 289.2Cash Flow from Operating Act. -72.9 -33.0 14.5 10.9(Purchase)/Sale of FA -74.0 -215.3 -50.0 -50.0(Purchase)/Sale of Investments -206.2 17.4 0.0 0.0Increase/ (Decrease) in DTL 8.2 4.0 0.0 0.0Cash flow from Investing Act. -272.0 -193.9 -50.0 -50.0Inc / (Dec) in Equity Capital 0.1 0.1 2.0 0.0Inc / (Dec) in Secured Loan 340.5 216.7 50.0 50.0Inc / (Dec) in Unsecured Loan -26.3 46.0 0.0 0.0Change in Securities Premium 6.9 8.6 339.3 0.0Proceeds from Warrants 0.0 23.2 -23.2 0.0Payment of Div. & Div. Tax -10.5 -12.5 -14.0 -14.0Cash flow from Financing Act. 310.3 281.3 354.0 36.0Net Cash flow -34.6 54.4 318.6 -3.1Opening Cash/ Cash Equivalent 56.3 21.8 76.2 394.7Closing Cash/ Cash Equivalent 21.8 76.2 394.7 391.6
Source: Company, ICICIdirect.com Research
Balance sheet | Crore (| Crore) FY13 FY14 FY15E FY16ELiabilitiesEquity Capital 15.1 15.2 17.1 17.1Stock Option Premium outstanding 2.3 1.5 1.5 1.5Warrant Application Money 0.0 23.2 0.0 0.0Reserve and Surplus 815.1 917.4 1,357.8 1,510.7Total Shareholders funds 832.5 957.2 1,376.4 1,529.3Secured Loan 699.5 916.2 966.2 1,016.2Unsecured Loan 63.5 109.5 109.5 109.5Deferred Tax Liability 31.7 35.7 35.7 35.7Sources of funds 1,627.2 2,018.6 2,487.8 2,690.7AssetsGross Block 514.8 726.4 776.4 826.4Accumulated Depreciation 184.5 228.2 310.8 399.0Net Block 330.3 498.2 465.5 427.4
Investments 538.5 521.0 521.0 521.0
Inventory 102.2 163.8 203.8 250.7Debtors 778.2 751.7 938.6 1,154.8Loans and Advances 704.3 970.7 1,173.2 1,443.5Other Current Assets 15.7 46.4 46.4 46.4Cash 21.8 76.2 394.7 391.6Total Current Assets 1,622.1 2,008.8 2,756.7 3,286.9Creditors 647.4 887.9 1,104.4 1,358.7Provisions 216.2 121.5 151.1 185.9Net Current Assets 758.5 999.4 1,501.2 1,742.3
Application of funds 1,627.2 2,018.6 2,487.8 2,690.7
Source: Company, ICICIdirect.com Research
Key ratios FY13 FY14 FY15E FY16E
Per share data (|)EPS (Diluted) 4.3 6.2 6.7 9.8Cash EPS 6.2 9.0 11.6 14.9BV 48.6 55.9 80.4 89.3Operating profit per share 9.1 14.6 18.4 22.8Cash Per Share 1.3 4.5 23.1 22.9Operating Ratios (%)EBITDA Margin 8.6 10.6 10.7 10.8PBT / Net Sales 6.1 3.5 5.2 6.2PAT Margin 4.1 4.5 3.9 4.6Inventory days 19.2 20.6 22.9 23.0Debtor days 156.8 116.4 116.8 116.8Creditor days 130.5 137.4 137.4 137.4Return Ratios (%)RoE 8.9 11.1 8.4 10.9RoCE 7.8 10.2 9.5 11.4RoIC 7.9 11.6 11.7 14.0Valuation Ratios (x)P/E 58.0 40.5 37.3 25.7EV / EBITDA 32.3 21.0 15.8 12.9EV / Net Sales 2.8 2.2 1.7 1.4Market Cap / Sales 2.4 1.8 1.5 1.2Price to Book Value 5.2 4.5 3.1 2.8Solvency RatiosDebt / EBITDA 4.9 4.1 3.4 2.9Debt / Equity 0.9 1.1 0.8 0.7Current Ratio 1.9 2.0 2.2 2.1Quick Ratio 1.9 1.9 1.9 1.9
Source: Company, ICICIdirect.com Research
ICICI Securities Ltd | Retail Equity Research Page 11
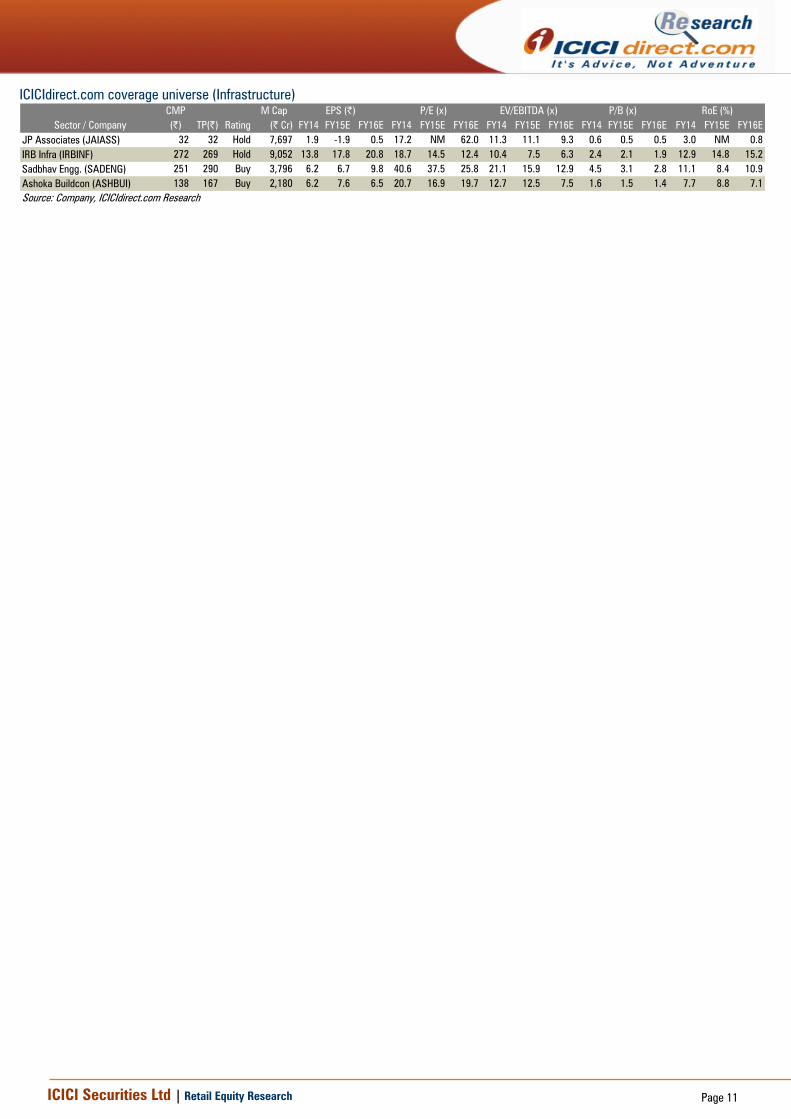
ICICIdirect.com coverage universe (Infrastructure) CMP M Cap(|) TP(|) Rating (| Cr) FY14 FY15E FY16E FY14 FY15E FY16E FY14 FY15E FY16E FY14 FY15E FY16E FY14 FY15E FY16E
JP Associates (JAIASS) 32 32 Hold 7,697 1.9 -1.9 0.5 17.2 NM 62.0 11.3 11.1 9.3 0.6 0.5 0.5 3.0 NM 0.8IRB Infra (IRBINF) 272 269 Hold 9,052 13.8 17.8 20.8 18.7 14.5 12.4 10.4 7.5 6.3 2.4 2.1 1.9 12.9 14.8 15.2Sadbhav Engg. (SADENG) 251 290 Buy 3,796 6.2 6.7 9.8 40.6 37.5 25.8 21.1 15.9 12.9 4.5 3.1 2.8 11.1 8.4 10.9Ashoka Buildcon (ASHBUI) 138 167 Buy 2,180 6.2 7.6 6.5 20.7 16.9 19.7 12.7 12.5 7.5 1.6 1.5 1.4 7.7 8.8 7.1Source: Company, ICICIdirect.com Research
Sector / CompanyRoE (%)EPS (|) P/E (x) EV/EBITDA (x) P/B (x)
ICICI Securities Ltd | Retail Equity Research Page 12
RATING RATIONALE ICICIdirect.com endeavours to provide objective opinions and recommendations. ICICIdirect.com assigns ratings to its stocks according to their notional target price vs. current market price and then categorises them as Strong Buy, Buy, Hold and Sell. The performance horizon is two years unless specified and the notional target price is defined as the analysts' valuation for a stock. Strong Buy: >15%/20% for large caps/midcaps, respectively, with high conviction; Buy: >10%/15% for large caps/midcaps, respectively; Hold: Up to +/-10%; Sell: -10% or more;
Pankaj Pandey Head – Research [email protected]
ICICIdirect.com Research Desk, ICICI Securities Limited, 1st Floor, Akruti Trade Centre, Road No 7, MIDC, Andheri (East) Mumbai – 400 093
ANALYST CERTIFICATION We /I, Deepak Purswani, CFA, PGDM (Finance); Nikunj Gala, MBA (CM) research analysts, authors and the names subscribed to this report, hereby certify that all of the views expressed in this research report accurately reflect our personal views about any and all of the subject issuer(s) or securities. We also certify that no part of our compensation was, is, or will be directly or indirectly related to the specific recommendation(s) or view(s) in this report. Analysts aren't registered as research analysts by FINRA and might not be an associated person of the ICICI Securities Inc.
Disclosures: ICICI Securities Limited (ICICI Securities) and its affiliates are a full-service, integrated investment banking, investment management and brokerage and financing group. We along with affiliates are leading underwriter of securities and participate in virtually all securities trading markets in India. We and our affiliates have investment banking and other business relationship with a significant percentage of companies covered by our Investment Research Department. Our research professionals provide important input into our investment banking and other business selection processes. ICICI Securities generally prohibits its analysts, persons reporting to analysts and their dependent family members from maintaining a financial interest in the securities or derivatives of any companies that the analysts cover.
The information and opinions in this report have been prepared by ICICI Securities and are subject to change without any notice. The report and information contained herein is strictly confidential and meant solely for the selected recipient and may not be altered in any way, transmitted to, copied or distributed, in part or in whole, to any other person or to the media or reproduced in any form, without prior written consent of ICICI Securities. While we would endeavour to update the information herein on reasonable basis, ICICI Securities, its subsidiaries and associated companies, their directors and employees (“ICICI Securities and affiliates”) are under no obligation to update or keep the information current. Also, there may be regulatory, compliance or other reasons that may prevent ICICI Securities from doing so. Non-rated securities indicate that rating on a particular security has been suspended temporarily and such suspension is in compliance with applicable regulations and/or ICICI Securities policies, in circumstances where ICICI Securities is acting in an advisory capacity to this company, or in certain other circumstances.
This report is based on information obtained from public sources and sources believed to be reliable, but no independent verification has been made nor is its accuracy or completeness guaranteed. This report and information herein is solely for informational purpose and may not be used or considered as an offer document or solicitation of offer to buy or sell or subscribe for securities or other financial instruments. Though disseminated to all the customers simultaneously, not all customers may receive this report at the same time. ICICI Securities will not treat recipients as customers by virtue of their receiving this report. Nothing in this report constitutes investment, legal, accounting and tax advice or a representation that any investment or strategy is suitable or appropriate to your specific circumstances. The securities discussed and opinions expressed in this report may not be suitable for all investors, who must make their own investment decisions, based on their own investment objectives, financial positions and needs of specific recipient. This may not be taken in substitution for the exercise of independent judgment by any recipient. The recipient should independently evaluate the investment risks. The value and return of investment may vary because of changes in interest rates, foreign exchange rates or any other reason. ICICI Securities and affiliates accept no liabilities for any loss or damage of any kind arising out of the use of this report. Past performance is not necessarily a guide to future performance. Investors are advised to see Risk Disclosure Document to understand the risks associated before investing in the securities markets. Actual results may differ materially from those set forth in projections. Forward-looking statements are not predictions and may be subject to change without notice.
ICICI Securities and its affiliates might have managed or co-managed a public offering for the subject company in the preceding twelve months. ICICI Securities and affiliates might have received compensation from the companies mentioned in the report during the period preceding twelve months from the date of this report for services in respect of public offerings, corporate finance, investment banking or other advisory services in a merger or specific transaction. It is confirmed that Deepak Purswani, CFA, PGDM (Finance); Nikunj Gala, MBA (CM) research analysts and the authors of this report have not received any compensation from the companies mentioned in the report in the preceding twelve months. Our research professionals are paid in part based on the profitability of ICICI Securities, which include earnings from Investment Banking and other business.
ICICI Securities or its subsidiaries collectively do not own 1% or more of the equity securities of the Company mentioned in the report as of the last day of the month preceding the publication of the research report.
It is confirmed that Deepak Purswani, CFA, PGDM (Finance); Nikunj Gala, MBA (CM) research analysts and the authors of this report or any of their family members does not serve as an officer, director or advisory board member of the companies mentioned in the report.
ICICI Securities may have issued other reports that are inconsistent with and reach different conclusion from the information presented in this report. ICICI Securities and affiliates may act upon or make use of information contained in the report prior to the publication thereof.
This report is not directed or intended for distribution to, or use by, any person or entity who is a citizen or resident of or located in any locality, state, country or other jurisdiction, where such distribution, publication, availability or use would be contrary to law, regulation or which would subject ICICI Securities and affiliates to any registration or licensing requirement within such jurisdiction. The securities described herein may or may not be eligible for sale in all jurisdictions or to certain category of investors. Persons in whose possession this document may come are required to inform themselves of and to observe such restriction.