S12-1 1. Inventory Management - 60 Min 2. JIT - 30 Min 3. Case Discussion - 30 Min 4. “Final”...
38
S12-1 1. Inventory Management 1. Inventory Management - 60 Min - 60 Min 2. JIT - 30 Min 2. JIT - 30 Min 3. Case Discussion - 30 3. Case Discussion - 30 Min Min 4. “Final” Problems - 60 4. “Final” Problems - 60 Min Min Agenda: Agenda:
-
date post
22-Dec-2015 -
Category
Documents
-
view
221 -
download
1
Transcript of S12-1 1. Inventory Management - 60 Min 2. JIT - 30 Min 3. Case Discussion - 30 Min 4. “Final”...

S12-1
1. Inventory Management - 60 Min1. Inventory Management - 60 Min
2. JIT - 30 Min2. JIT - 30 Min
3. Case Discussion - 30 Min3. Case Discussion - 30 Min
4. “Final” Problems - 60 Min4. “Final” Problems - 60 Min
Agenda: Agenda:

S12-2
Types of Inventory Raw material Work-in-progress Maintenance/repair/operating supply Finished goods
What is Inventory?What is Inventory?
Functions of inventory?

S12-3
The Functions of InventoryThe Functions of Inventory
To protect against lost sales - stock-outs To ”decouple” or separate various parts of the
production process To provide a stock of goods that will provide a
“selection” for customers To take advantage of quantity discounts To hedge against inflation and upward price changes

S12-4
Divides on-hand inventory into 3 classes A class, B class, C class
Basis is usually annual $ volume $ volume = Annual demand x Unit cost
Policies based on ABC analysis Develop class A suppliers more Give tighter physical control of A items Forecast A items more carefully
ABC AnalysisABC Analysis

S12-5
0
20
40
60
80
100
0 50 100% of Inventory Items% of Inventory Items
% Annual $ Usage% Annual $ Usage
AABB
CC
Class % $ Vol % ItemsA 80 15B 15 30C 5 55
Classifying Items as ABCClassifying Items as ABC
S12-6
Inventory CostsInventory Costs Holding costsHolding costs - associated with holding or
“carrying” inventory over time Ordering costsOrdering costs - associated with costs of
placing order and receiving goods Setup costsSetup costs - cost to prepare a machine or
process for manufacturing an order Excess at EOLExcess at EOL - mark down, scrap Stock-out costsStock-out costs - a negative cost of inventory.

S12-7
Fixed order-quantity models Economic order quantity Production order quantity Quantity discount
Probabilistic models
Fixed order-period models
Inventory ModelsInventory Models

S12-8
Order QuantityOrder Quantity
Annual CostAnnual Cost
Holding Cost Curve
Holding Cost CurveTotal Cost Curve
Total Cost Curve
Order (Setup) Cost CurveOrder (Setup) Cost Curve
Optimal Optimal Order Quantity (Q*)Order Quantity (Q*)
EOQ ModelEOQ ModelHow Much to Order?How Much to Order?

S12-9
Optimal Order Quantity
Expected Number of Orders
Expected Time Between Orders Working Days / Year
Working Days / Year
= =× ×
= =
= =
=
= ×
Q*D SH
ND
Q*
TN
dD
ROP d L
2
DD = Demand per year = Demand per year
SS = Setup (order) cost per order = Setup (order) cost per order
HH = Holding (carrying) cost = Holding (carrying) cost
dd = Demand per day = Demand per day
LL = Lead time in days = Lead time in days
EOQ Model EquationsEOQ Model Equations

S12-10
EOQ ModelEOQ ModelWhen To OrderWhen To Order
Reorder Reorder Point Point (ROP)(ROP)
TimeTime
Inventory LevelInventory Level
AverageAverageInventory Inventory
(Q*/2)(Q*/2)
Lead TimeLead Time
Optimal Optimal Order Order QuantityQuantity(Q*)(Q*)

S12-11
Answers how much to order and when to order
Allows partial receipt of material Other EOQ assumptions apply
Suited for production environment Material produced, used immediately Provides production lot size
Lower holding cost than EOQ model
Production Order Quantity ModelProduction Order Quantity Model

S12-12
POQ Model Inventory LevelsPOQ Model Inventory Levels
Inventory LeveInventory Levell
TimeTimeSupply Supply BeginsBegins
Supply Supply EndsEnds
Production portion of cycleProduction portion of cycle
Demand portion of cycle with no Demand portion of cycle with no supplysupply
S12-14
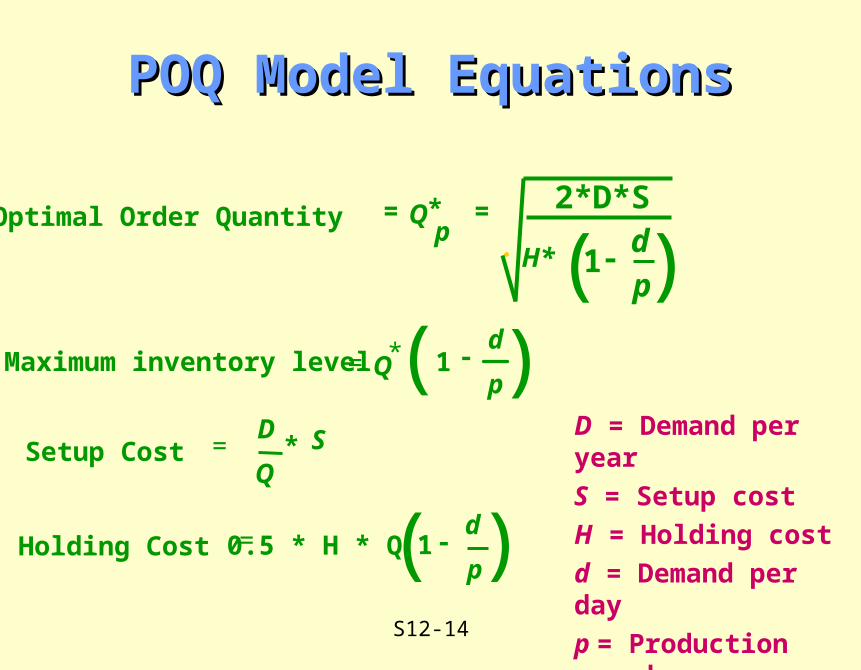
D = Demand per year
S = Setup cost
H = Holding cost
d = Demand per day
p = Production per day
POQ Model EquationsPOQ Model Equations
Optimal Order Quantity
Setup Cost
Holding Cost
= =
-
= *
= *
=
Q
H* dp
Q
D
QS
p*
1
(
0.5 * H * Q -d
p1
)-d
p1
( )
2*D*S
( )Maximum inventory level

S12-15
Answers how much to order & when to order
Allows quantity discounts Reduced price when item is purchased in larger
quantities Other EOQ assumptions apply
Trade-off is between lower price & increased holding cost
Quantity Discount ModelQuantity Discount Model

S12-16
Quantity Discount ModelQuantity Discount Model
Total cost = Setup cost + Holding cost + product cost
TC = (D/Q)(S) + (QH)/2 + PD
D = Annual Demand Q = Order QuantityS = Set or order costH = Holding cost P = Price

S12-17
Quantity Discount ModelQuantity Discount Model
TC = (D/Q)(S) + (QH)/2 + PD
Unit Cost Quantity Set Up Cost Holding Cost Product Cost Total Cost4.80$ 1,000 245.0$ 480.0$ 24,000.0$ 24,725.0$ 4.75$ 2,000 122.50$ 950.0$ 23,750.0$ 24,822.5$
Demand = 5,000 Set Up cost = 49$ Inventory cost + 20%
S12-18
Answer how much & when to order Considers Stock-out Costs Allow demand to vary
Follows normal distribution Other EOQ assumptions apply
Consider service level & safety stock Service level = 1 - Probability of stockout Higher service level means more safety stock
More safety stock means higher ROP
Probabilistic ModelsProbabilistic Models

S12-19
ROP Demand Safety Stock Holding Cost Stockout Cost Total Cost50 50 0 -$ 960$ 960$ 50 60 10 50$ 240$ 290$ 50 70 20 100$ 100$
Units Probability50 0.360 0.270 0.1
Holding cost = 5$ Stock-out cost = 40$ Orders per year 6
Probabilistic Model ExampleProbabilistic Model Example
1. Stock out = 10(.2)($40)6 + 20(.1)($40)(6) = $9602. Stock out = 10(.1)($40)6 = $240
1.2.

S12-20
Answers how much to order Orders placed at fixed intervals
Inventory brought up to target amount Amount ordered varies
No continuous inventory count Possibility of stockout between intervals
Useful when vendors visit routinely Example: P&G representative calls every 2 weeks
Fixed Period ModelFixed Period Model

S12-21
TimeTime
Inventory LevelInventory Level Target maximumTarget maximum
PeriodPeriod PeriodPeriodPeriodPeriod
Fixed Period ModelFixed Period ModelWhen to Order?When to Order?

S12-22
Waste is ‘anything other than the minimum amount of equipment, materials, parts, space, and worker’s time, which are absolutely essential to add value to the product.’
— Shoichiro Toyoda President, Toyota
Introductory QuotationIntroductory Quotation

S12-23
Management philosophy of continuous and forced problem solving
Supplies and components are ‘pulled’ through system to arrive where they are needed when they are needed.
JIT: Attacks waste
Anything not adding value to the product (From the customer’s perspective)
Exposes problems and bottlenecks caused by variability Achieves streamlined production
What is Just-in-Time?What is Just-in-Time?

S12-24
Overproduction Waiting Transportation Inefficient processing Inventory Unnecessary motion Product defects
Types of WasteTypes of Waste

S12-25
Push versus PullPush versus Pull
Push system: material is pushed into downstream workstations regardless of whether resources are available
Pull system: material is pulled to a workstation just as it is needed

S12-26
ResultsResults Queue and delay reduction, speeds throughput, frees
assets, and wins orders Quality improvement, reduces waste and wins orders Cost reductions, increases margin or reduces selling
price Variability reductions in the workplace, reduces
waste and wins orders Rework reduction, reduces waste and wins orders

S12-27
Incoming material and finished goods involve waste
Buyer and supplier form JIT partnerships JIT partnerships eliminate
Unnecessary activities In-plant inventory In-transit inventory Poor suppliers
SuppliersSuppliers

S12-28
Few Nearby Repeat business Analysis to enable desirable suppliers to become or stay
price competitive Competitive bidding mostly limited to new purchases Suppliers encouraged to extend JIT to their suppliers
Characteristics of JIT Partnerships Characteristics of JIT Partnerships SuppliersSuppliers

S12-29
Characteristics of JIT Partnerships Characteristics of JIT Partnerships QuantitiesQuantities
Steady output rate Frequent deliveries in small-lot quantities Long term contract agreements Minimal paperwork Delivery quantities fixed for whole contract term Little or no permissible overage or underage Suppliers package in exact quantities Suppliers reduce their production lot sizes or store
unreleased material
S12-30
Help suppliers to meet quality requirements Close relationship between buyers’ and suppliers
quality assurance people
Characteristics of JIT Partnerships Characteristics of JIT Partnerships QualityQuality

S12-31
Characteristics of JIT Partnerships Characteristics of JIT Partnerships ShippingShipping
Scheduling of inbound freight Gain control by use of company-owned or contract
shipping and warehousing

S12-32
Goals of JIT partnershipsGoals of JIT partnerships
Elimination of unnecessary activitiesElimination (reduction) of in-plant inventoryElimination (reduction) of in-transit inventoryElimination of poor suppliers

S12-33
JIT objective: Reduce movement of people and material Movement is waste!
JIT requires Work cells for product families Moveable or changeable machines Short distances Little space for inventory Delivery directly to work areas
LayoutLayout

S12-34
Process Layout Work Cell
SawSaw
LatheLathe
GrinderGrinder
HeatHeatTreatTreat
LatheLathe
Lathe
Lathe SawSaw
HeatHeatTreatTreat
GrinderGrinder
GrinderGrinder
PressPress
PressPress 1
1
2
3
45
2
6
SawSaw
PressPress
Work Cell versusWork Cell versus Process Layout Process Layout
S12-35
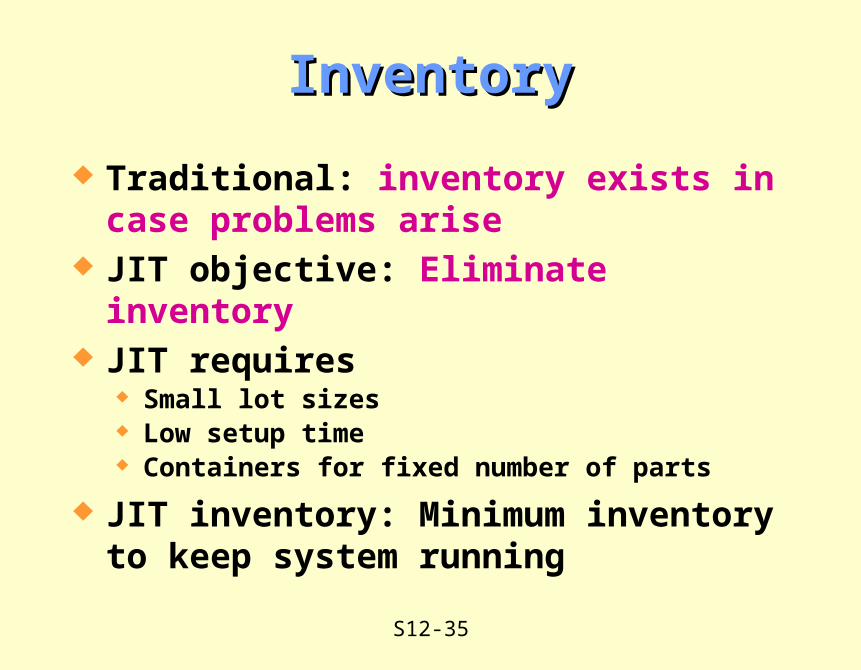
Traditional: inventory exists in case problems arise
JIT objective: Eliminate inventory JIT requires
Small lot sizes Low setup time Containers for fixed number of parts
JIT inventory: Minimum inventory to keep system running
InventoryInventory

S12-36
JIT Scheduling TacticsJIT Scheduling Tactics Communicate the schedule to suppliers Make level schedules Freeze part of the schedule Perform to schedule Seek one-piece-make and one-piece-move Eliminate waste Produce in small lots Use kanbans Make each operation produce a perfect part

S12-37
Japanese word for card Pronounced ‘kahn-bahn’ (not ‘can-ban’)
Authorizes production from downstream operations ‘Pulls’ material through plant
May be a card, flag, verbal signal etc. Used often with fixed-size containers
Add or remove containers to change production rate
KanbanKanban

S12-38
All activities involved in keeping equipment in working order
Done to prevent failure JIT requires
Scheduled & daily PM Operator performs PM
Knows machines Responsible for product quality
Preventive Maintenance (PM)Preventive Maintenance (PM)

S12-39
Milling
Painting
RivetBattens
Insert Studs
MountHinges
GlueApp.
Final Assem.
Tent
Plywood Stock
F/R Stock
Rear & Front Assembly FlowRear & Front Assembly Flow
B - 2,500
B - 1,500
B - 500
B - 1,500
B - 1,000


![d1h8zhhu5cz0pi.cloudfront.net...Foot massage 60 (60 min) 45 (45 min) $298 $228 DI]30 (additional 30 min) $168 30 Nail treatment (30 min) (30B) $268 Subject to Charge & 5% Gov. Tax30](https://static.fdocuments.in/doc/165x107/5f94c0ec4a63381f31202c80/-foot-massage-60-60-min-45-45-min-298-228-di30-additional-30-min-168.jpg)