S 2015-20 Da a : a- a Ta Waˆ - Ofwat
202
August 2014 Setting price controls for 2015-20 Draft price control determination notice: company-specific appendix – Thames Water
Transcript of S 2015-20 Da a : a- a Ta Waˆ - Ofwat

August 2014
Setting price controls for 2015-20
Draft price control determination notice:
company-specific appendix – Thames Water

Draft price control determination notice: company-specific appendix – Thames Water
1
Contents
A1 Draft determination – at a glance 2
A2 Wholesale water 4
A3 Wholesale wastewater 9
A4 Thames Tideway Tunnel 34
A5 Household retail 47
A6 Non-household retail 58
A7 Appointee 61
Annex 1: Wholesale costs 72
Annex 2: Household retail price control 78
Annex 3: Reconciling 2010-15 performance 80
Annex 4: Outcomes, performance commitments and outcome delivery incentives 103
Annex 5: Thames Tideway Tunnel Control – uncertainty 196
Correction
The return on regulated equity range for outcome delivery incentives and figure A7.1
on page 64, and figure AA4.2 on page 104 setting out the financial outcome delivery
incentives were updated on 26 September 2014.

Draft price control determination notice: company-specific appendix – Thames Water
2
Overview
This appendix sets out the details of the draft determination of price controls that are specific to
Thames Water. Our draft determination is based on Thames Water’s business plan as
submitted by 27 June and its responses to our subsequent queries.
Thames Water’s revised business plan has a number of strengths. The company has
addressed a number of our concerns from the risk-based review. In particular the company
remains below our cost assessment threshold on wholesale water and very close to our cost
threshold on wastewater. However, we have had to intervene in a number of areas. These
include adjusting for its performance in 2010-15 and removing the company’s proposed new
costs above the materiality threshold for the non-household control. In addition, we have made
other interventions around outcomes and the associated delivery incentives which are common
to all companies. The company also needs to provide further assurance ahead of final
determinations in some areas of its plan.
We support Thames Water’s proposal for a separate price control for the activities it will
undertake in respect of the Thames Tideway Tunnel (‘TTT’). While we note improvements in its
proposals for our regulation in this area, we are making significant interventions in order to
protect the interests of customers. We expect the company to make further representations on
the efficient cost of its TTT activities and the associated outcome delivery incentives, which we
will consider for our final determination.
It should be noted that in order for the price controls to protect the interests of consumers, we
consider that – in accordance with their licence obligations – companies must act in an
economic and efficient manner in all circumstances. For the avoidance of doubt, this obligation
overrides any individual incentive element.
This draft determination sets out the draft allowed revenues and K factors for Thames Water,
along with what they mean for average customer bills. We have summarised this information in
the ‘draft determination – at a glance section’. The draft determination also sets out:
the outcomes we expect the company to deliver under each price control;
the costs we are assuming the company will incur and, where appropriate, the
assumptions we have made to arrive at the allowed revenue for each price control;
the adjustments we are making to the wholesale water and wastewater price controls to
reflect the company’s performance in 2010-15; and
our assumptions on risk and reward, including the uncertainty mechanisms that form part
of each price control.

Draft price control determination notice: company-specific appendix – Thames Water
3
As part of this price review, we stated in ‘Setting price controls for 2015-20 – final methodology
and expectations for companies’ business plans’ (our ‘final methodology statement’) that we
would be setting separate price controls for wholesale and retail elements of the appointee
business. We explained that these separate controls would be binding, confirmed through the
modifications made to the price setting elements of companies’ licence conditions.
This means that the companies cannot recover more revenue than allowed under each specific
price control. The revenue allowance for each price control is determined by the costs specific
to that particular price control. This means that companies cannot cross-subsidise between
controls in terms of costs or revenues, which gives important benefits for providing more
effective incentives. It also supports the development of the relevant markets and in particular
those provided for by the Water Act 2014.
In response to our challenge at the risk-based review, Thames Water has proposed to introduce
a separate price control for its activities in respect of the Thames Tideway Tunnel. We support
the introduction of a separate price control for Thames Water's activities on the TTT Control.
This will require amendments to Thames Water’s licence aligned with the final determination.
We set out our proposals in section A4.
We have made this draft determination in accordance with our final methodology statement and
our statutory duties. We have also had regard to relevant guidance from the UK Government,
and where appropriate Welsh Government, and the principles of best regulatory practice to be
transparent, accountable, proportionate, consistent and targeted.
This draft determination is structured on an element-by-element basis and is separated into:
wholesale water;
wholesale wastewater;
Thames Tideway Tunnel;
household retail; and
non-household retail.
In each area, we have set out the relevant information after our interventions – that is, our draft
determination. In those areas in which we have intervened, we discuss the difference between
our view and the company view further in the specific annexes where appropriate.
At the appointee level, this draft determination sets out our view of the company’s financeability
over the period 2015-20.
Annexes 1 to 4 form part of the draft price control determination.
Draft price control determination notice: company-specific appendix – Thames Water
4
A1. Draft determination – at a glance
In this section we set out what the draft determination means:
for customers, with respect to the average bills they will pay and the outcomes that the
company will deliver in return; and
for the company, with respect to the allowed costs/expenditure, return on regulatory
equity (RoRE) range; financial ratios (under the notional structure) and the interventions
we made to the company’s revised plan.
It should be noted that on 6 August we informed Thames Water that very material differences
remain between its re-submitted plan and our assessment of efficient TTT Control. We did this
to give Thames Water (and other affected companies) as much time as possible to reflect on
its plan for the coming five-year period and reconsider its proposals in response to our draft
determinations. This may include submitting further compelling evidence that its TTT Control
cost proposals are efficient. Accordingly the information presented should be considered in the
context of the material gap in relation to TTT Control costs.

Draft price control determination notice: company-specific appendix – Thames Water
5
Combined average household bill (£)1
Note. The “Bill from company revised plan” is based on the data submitted by the company in its business plan but projected
using our financial model, thereby ensuring consistency with the draft determination projection. As a consequence the
company’s proposed bills illustrated above may not necessarily be the same as those described in the revised business plan.
Outcomes
Wholesale water Wholesale wastewater
Demonstrate to our customers and stakeholders that
they can trust us, that we are easy to do business with
and that we care
Demonstrate to our customers and stakeholders that
they can trust us, that we are easy to do business with
and that we care
We will provide a safe and reliable Water service that
complies with all necessary standards, is available when
our customers require it
We will provide a safe and reliable Wastewater service
that complies with all necessary standards and is
available when our customers require it
1 In addition the bills for Thames Water customers that receive both water and wastewater services will include the costs
associated with both the Thames Tideway Tunnel activities undertaken by Thames Water and the Infrastructure Provider (IP). The appointment of an IP is subject to a market procurement exercise and so the exact bill impact is uncertain at this stage. Thames included an estimate of the impact on customers’ bills of the IP costs in 2015-20 its June submission. The yellow bars in the chart above represent the estimated bill using Thames Water’s assumptions in respect of the pass through to the IP. We are not determining the IP’s allowed revenue as part of this price review, instead the calculation of revenue (particularly during construction) will be included in the project licence for the IP. The appointment of an IP is subject to a market procurement exercise, because of this the exact impact to customers’ bills is uncertain at this stage
Cumulative saving £18 over 2015-20

Draft price control determination notice: company-specific appendix – Thames Water
6
Wholesale water Wholesale wastewater
We will limit our impact on the environment and achieve
a socially responsible, sustainable business for future
generations, including reducing levels of leakage
We will limit our impact on the environment and achieve
a socially responsible, sustainable business for future
generations, including reducing levels of leakage
We will provide the level of customer service our
customers require, in the most economic and efficient
manner, to ensure that bills are no more than necessary
We will provide the level of customer service our
customers require, in the most economic and efficient
manner, to ensure that bills are no more than necessary
Retail TTT Control
Improving customer service by doing the basics
excellently and by getting things 'right first time'
Thames Water proposed no performance commitments
for the TTT Control in the June plan
Offer a choice of easy to use contact options
Improving cash collection from those that can pay and
helping those that are struggling to pay
Allowed costs/expenditure1
Wholesale Water Wastewater TTT
Totex – 2015-20 total (£m) 3,326.1 3,679.0 324.3
Allowed weighted average cost of capital (%) 3.70% 3.70% 3.70%
Allowed wholesale revenue in 2015-20 (£m) 3,966.7 4,404.3 215.9
Retail Household Non-household
Cost allowance – 2015-20 total (£m) 726.6
Margin (%) 1.00% 2.50%
Retail allowed revenue (£m) 817.8 151.0
Average bill per household customer – retail
component only (£) 33
1 Wholesale figures in 2012-13 prices and retail figures in nominal prices – this is consistent throughout the draft determination
unless otherwise stated.

Draft price control determination notice: company-specific appendix – Thames Water
7
RoRE ranges – appointee
Ofwat’s calculations of notional financeability ratios
Financial ratios for notional company Ofwat calculation
(average 2015-20)
Cash interest cover 2.82
Adjusted cash interest cover ratio (ACICR) – base case (average over five years) 1.40
Funds from operations/debt 8.64%
Retained cash flow/debt 6.10%
Gearing 64.17%
Dividend cover (profit after tax/dividends paid) 0.94
Regulatory equity/regulated earnings for the regulated company 16.66
RCV/EBITDA 11.57

Draft price control determination notice: company-specific appendix – Thames Water
8
Summary of interventions
Outcomes
Cap – We have imposed an overall cap and collar on outcome delivery incentives of +/- 2% of RoRE
Horizontal check – We have made four performance level targets more stretching.
Bottom up analysis -The reward for one incentive has been removed; we have adjusted the deadbands, caps and collars across a number of incentives; we have extended the commitments to 2019-20 across a number of performance commitments.
We have included three additional proposals for
performance commitments relating to the
Thames Tideway Tunnel separate control.
Wholesale costs
The company is below our water cost threshold.
Consistent with the approach for all companies
that are significantly below our threshold, we
have adapted our draft determination threshold
by capping our view of the cost threshold at 5%
above the company plan view of totex for water.
The company proposed wholesale water totex
of £3,249 million in its plan. Our initial threshold
(ie, after adjustments) is £3,773 million. Given
that the difference exceeds 5%, we have
capped the difference, resulting in a draft
determination threshold of £3,411 million.
The company proposed wholesale wastewater
totex of £3,744 million in its plan which is £22
million above our draft determination threshold
of £3,721 million.
We rejected some of the company’s wholesale
cost adjustments, or only partially allowed them.
For Thames Tideway Tunnel expenditure, the
company’s proposed costs of £655 million are
above our assessment for the draft
determination of £324 million.
Retail
We have rejected the company’s proposed
adjustment for increased household retail costs
resulting from the Thames Tideway Tunnel
(household).
We have adjusted the price base year for retail
costs (household and non-household).
We removed the company’s proposed new
costs above the level of the materiality threshold
(non-household).
Reconciling 2010-15 performance
We have adjusted both the water and
wastewater controls to a combined total of £27
million revenue and £42 million RCV in
customers’ favour. We have applied a shortfall
adjustment in respect of supply interruptions
and increased the company’s proposed shortfall
for wastewater infrastructure.
We have made further interventions in respect
of the costs claimed by the company in 2010-15
for Thames Tideway Tunnel.
Risk and reward
We have not intervened in this area.
Financeability and affordability
We have made technical adjustments to the
PAYG and RCV run off rates for the wastewater
control.
Thames Tideway Tunnel
We agree with Thames Water’s proposal to
adopt a separate price control for its
expenditure on the Thames Tideway Tunnel
(“TTT Control”) . However, we consider there is
no need for an automatic expiry date in the
licence as proposed by Thames Water and
indeed that this could operate against
customers’ interests in the long term.
Draft price control determination notice: company-specific appendix – Thames Water
9
A2. Wholesale water
A2.1 Company outcomes, performance commitments and
delivery incentives
A2.1.1 Outcomes, performance commitments and incentives
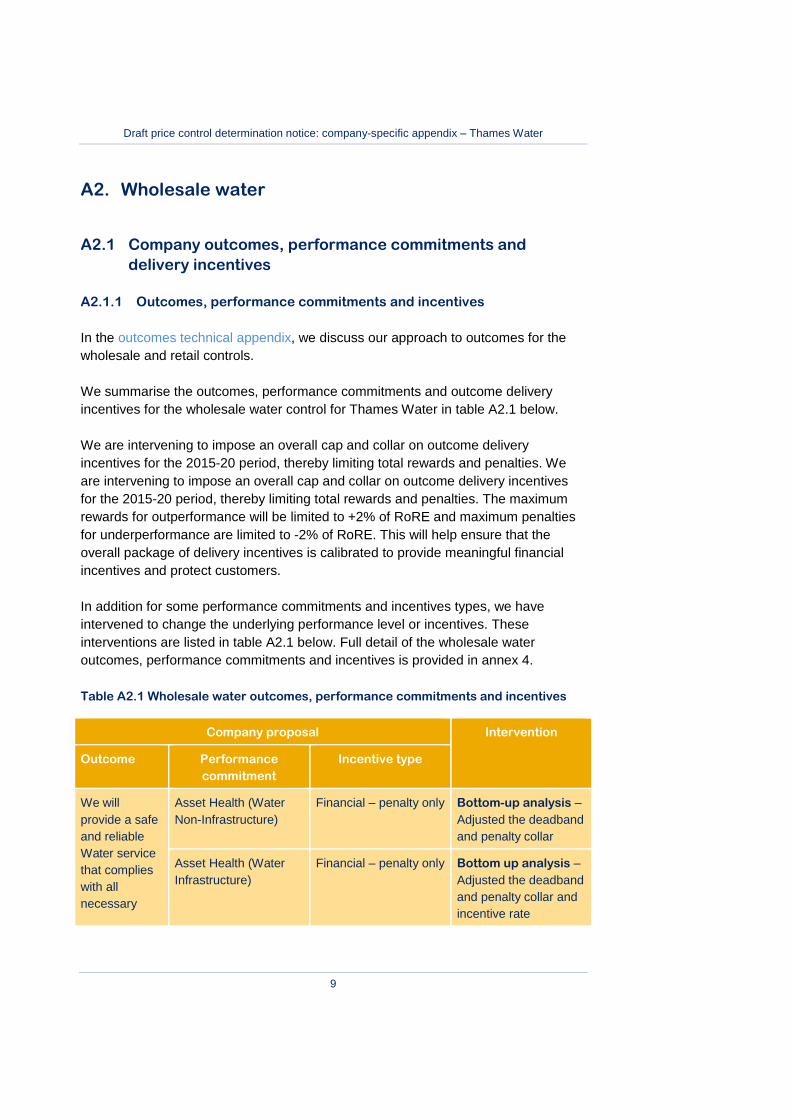
In the outcomes technical appendix, we discuss our approach to outcomes for the
wholesale and retail controls.
We summarise the outcomes, performance commitments and outcome delivery
incentives for the wholesale water control for Thames Water in table A2.1 below.
We are intervening to impose an overall cap and collar on outcome delivery
incentives for the 2015-20 period, thereby limiting total rewards and penalties. We
are intervening to impose an overall cap and collar on outcome delivery incentives
for the 2015-20 period, thereby limiting total rewards and penalties. The maximum
rewards for outperformance will be limited to +2% of RoRE and maximum penalties
for underperformance are limited to -2% of RoRE. This will help ensure that the
overall package of delivery incentives is calibrated to provide meaningful financial
incentives and protect customers.
In addition for some performance commitments and incentives types, we have
intervened to change the underlying performance level or incentives. These
interventions are listed in table A2.1 below. Full detail of the wholesale water
outcomes, performance commitments and incentives is provided in annex 4.
Table A2.1 Wholesale water outcomes, performance commitments and incentives
Company proposal Intervention
Outcome Performance
commitment
Incentive type
We will
provide a safe
and reliable
Water service
that complies
with all
necessary
Asset Health (Water
Non-Infrastructure)
Financial – penalty only Bottom-up analysis –
Adjusted the deadband
and penalty collar
Asset Health (Water
Infrastructure)
Financial – penalty only Bottom up analysis –
Adjusted the deadband
and penalty collar and
incentive rate
Draft price control determination notice: company-specific appendix – Thames Water
10
Company proposal Intervention
Outcome Performance
commitment
Incentive type
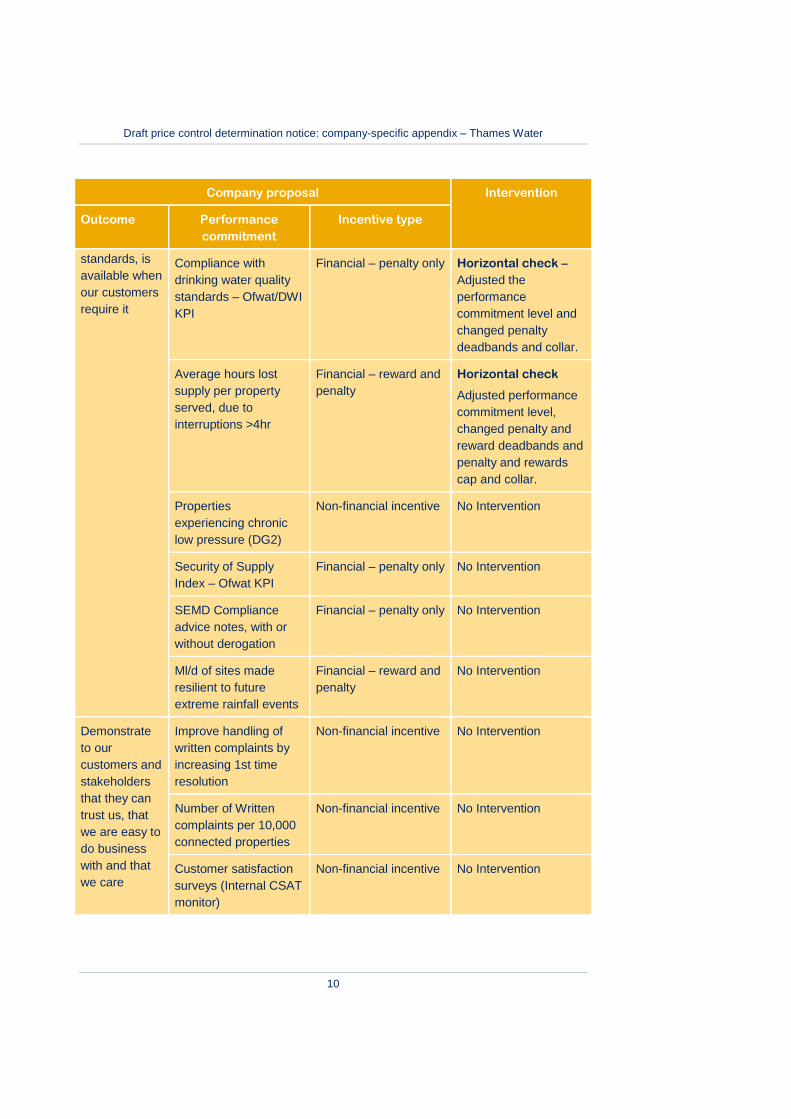
standards, is
available when
our customers
require it
Compliance with
drinking water quality
standards – Ofwat/DWI
KPI
Financial – penalty only Horizontal check –
Adjusted the
performance
commitment level and
changed penalty
deadbands and collar.
Average hours lost
supply per property
served, due to
interruptions >4hr
Financial – reward and
penalty
Horizontal check
Adjusted performance
commitment level,
changed penalty and
reward deadbands and
penalty and rewards
cap and collar.
Properties
experiencing chronic
low pressure (DG2)
Non-financial incentive No Intervention
Security of Supply
Index – Ofwat KPI
Financial – penalty only No Intervention
SEMD Compliance
advice notes, with or
without derogation
Financial – penalty only No Intervention
Ml/d of sites made
resilient to future
extreme rainfall events
Financial – reward and
penalty
No Intervention
Demonstrate
to our
customers and
stakeholders
that they can
trust us, that
we are easy to
do business
with and that
we care
Improve handling of
written complaints by
increasing 1st time
resolution
Non-financial incentive No Intervention
Number of Written
complaints per 10,000
connected properties
Non-financial incentive No Intervention
Customer satisfaction
surveys (Internal CSAT
monitor)
Non-financial incentive No Intervention

Draft price control determination notice: company-specific appendix – Thames Water
11
Company proposal Intervention
Outcome Performance
commitment
Incentive type
Reduced water
consumption from
issuing water efficiency
devices to customers
Financial – penalty only No Intervention
Provide a free repair
service for customers
with a customer side
leak outside of the
property
Non-financial incentive No Intervention
We will limit
our impact on
the
environment
and achieve a
socially
responsible,
sustainable
business for
future
generations,
including
reducing
levels of
leakage
Leakage
Financial – reward and
penalty
Bottom-up analysis -
Adjusted the penalty
collar in year 1 and
extended the incentive
to cover 2019-20.
Greenhouse gas
emissions from water
operations
Non-financial incentive No Intervention
We will educate our
existing and future
customers
Non-financial incentive No Intervention
Deliver 100% of agreed
measures to meet new
environmental
regulations
Financial – penalty only No Intervention
We will
provide the
level of
customer
service our
customers
require, in the
most
economic and
efficient
manner, to
Energy imported –
Energy exported
Non-financial incentive No Intervention

Draft price control determination notice: company-specific appendix – Thames Water
12
Company proposal Intervention
Outcome Performance
commitment
Incentive type
ensure that
bills are no
more than
necessary
Asset Health Water
Infrastructure
Asset Health Water
Non Infrastructure
Drinking Water Quality
Standards
Supply Interruptions
above 4 hours
(average minutes per
property)
Security of Supply
Index – Ofwat KPI
Leakage
Various Bottom-up analysis –
Extended the
performance
commitment and
incentive to cover
2019-20
A2.1.2 Outcome delivery and reporting
In the assurance technical appendix, we set out our proposed framework for the form
and level of reporting, monitoring and assurance we will seek from companies during
the five year regulatory period 2015-20 in relation to the delivery of their
commitments for the price review. This sets out three levels of assurance and the
opportunities available for a company to improve its category status through the
finalisation of the price controls and during the regulatory period itself.
We are satisfied with the company’s proposals for self reporting. But consistent with
the commentary in our assurance technical annex, we will need to consider the
categorisation of the company for assurance purposes at the final determination.
Thames Water’s proposed approach to the measurement, reporting and governance
of outcomes and our assessment of this approach is summarised in annex 4.

Draft price control determination notice: company-specific appendix – Thames Water
13
A2.2 Calculating the wholesale water price control
A2.2.1 Calculating allowed wholesale water expenditure
Our approach to calculating allowed wholesale expenditure is set out in the
wholesale water and wastewater technical appendix.
In its December plan, the company included wholesale water totex of £3,160 million.
This increased in its June plan to £3,249 million as a result of higher business rates
and re-allocations. This would be 14% below the (pre cap) basic cost threshold, post
additions, of £3,773 million. However, in line with the policy we have applied a 5%
cap on this which results in a revised draft determination threshold of £3,411 million.
It is also important to bear in mind that the actual gap is smaller than what would be
implied when looking at the totex gap. This is because the use of menus and our
approach to setting baselines reduces the difference. In the case of Thames Water
our approach would reduce the difference from 5% to 2.5%.
We also note that the company made representations to our cost models following
the publication of these in April. The representations made and our response is
summarised in wholesale water and wastewater technical appendix.
The proposed wholesale water allowed expenditure for Thames Water is detailed in
table A2.2 below. We provide a further breakdown of some of the calculations in
annex 1. Further information about our assessment of each claim is set out in the
populated version of the draft determination initial cost threshold models.
Table A2.2 Wholesale water allowed expenditure (£ million)
2015-16 2016-17 2017-18 2018-19 2019-20 Total
2015-20
Draft determination
cost threshold
3,411.1
Costs excluded from
menu
55.0
Menu cost baseline1 635.3 676.4 696.2 685.3 663.0 3,356.1
Company’s view of
menu costs2
3,197.5
Implied menu choice 95.3

Draft price control determination notice: company-specific appendix – Thames Water
14
2015-16 2016-17 2017-18 2018-19 2019-20 Total
2015-20
Allowed expenditure
from menu
627.8 668.4 687.9 677.2 655.2 3,316.5
Costs excluded from
menu
11.4 10.9 10.9 10.9 10.9 55.0
Total allowed
expenditure3
639.1 679.3 698.8 688.1 666.1 3,371.4
Less pension deficit
repair allowance
9.1 9.1 9.1 9.1 9.1 45.3
Totex for input to
PAYG
630.1 670.3 689.8 679.0 657.0 3,326.1
Notes:
1. Menu baseline is equal to the draft determination threshold less pension deficit recovery costs, third party costs and market opening costs related to 2014-15 (see annex 1).
2. Based on company plan totex minus costs for items excluded from the menu. 3. Includes pension deficit repair allowance.
A2.2.2 Calculation of revenues: pay as you go (PAYG) and regulatory capital
value (RCV)-run off
Table A2.3 shows the company’s proposed PAYG ratios and associated totex
recovery for wholesale water, which we have used as the basis for this draft
determination.
Table A2.3 Thames Water wholesale water PAYG ratios
2015-16 2016-17 2017-18 2018-19 2019-20 Total
Totex (£m) 630.1 670.3 689.8 679.0 657.0 3,326.1
PAYG % 54.6% 55.0% 58.4% 59.9% 61.7% 57.9%
Resulting PAYG (£m) 344.2 368.5 402.9 406.8 405.1 1,927.6
Table A2.4 shows the RCV run-off amounts included within the wholesale water
charge. This reflects a run-off rate of 4.96% in 2015-16 for the RCV as at 31 March
2015, this rates falls over the period to 2.82% in 2019-20 as proposed by Thames
Water. An asset life of 20 years is used for the totex additions to the RCV over 2015-
20.

Draft price control determination notice: company-specific appendix – Thames Water
15
Table A2.4 Thames Water wholesale water RCV run-off (£ million)
2015-16 2016-17 2017-18 2018-19 2019-20 Total
Run-off of 2015 RCV 234.6 192.9 140.7 121.5 114.1 803.8
RCV run-off of totex
additions
7.1 21.6 36.2 50.1 63.1 178.1
Total RCV run-off 241.7 214.5 176.9 171.6 177.1 981.9
A2.2.3 Return on the RCV
Our risk and reward guidance set out a single industry cost of capital for both
wholesale water and wastewater services of 3.7%. The company has accepted this
guidance, however it says this is predicated on us accepting its business plan in the
round.
In common with all other water and sewerage companies, we have used a cost of
capital of 3.7% in this draft determination. This results in a return on capital of £910
million over 2015-20.
Table A2.5 shows our calculation of the opening RCV at 1 April 2015 taking account
of the adjustments for 2010-15 performance discussed in section A2.2.4 below. The
average RCV, set out in table A2.6 for each year, takes into account the proportion
of totex additions to the RCV determined by the PAYG ratio and RCV run-off.
Table A2.5 Thames Water wholesale water opening RCV (£ million)
2015-16
Closing RCV 31 March 2015 4,812.4
Land sales -17.7
Adjustment for actual expenditure 2009-10 28.4
Adjustment for actual expenditure 2010-151 -69.9
Net adjustment from logging up, logging down and shortfalls -23.8
Other adjustments 0.0
Opening RCV 1 April 2015 4,729.4
Note:
1. The adjustment for actual expenditure in 2010-15 is explained further in annex 3 as part of the CIS adjustment.

Draft price control determination notice: company-specific appendix – Thames Water
16
Table A2.6 Thames Water wholesale water return on RCV (£ million)
2015-16 2016-17 2017-18 2018-19 2019-20
Opening RCV 4729.4 4773.6 4860.8 4970.8 5071.3
RCV additions (from totex) 285.8 301.8 286.9 272.2 251.9
Less RCV run-off 241.7 214.5 176.9 171.6 177.1
Closing RCV 4773.6 4860.8 4970.8 5071.3 5146.0
Average RCV (year average) 4751.5 4817.2 4915.8 5021.0 5108.7
Return on capital 175.7 178.1 181.8 185.7 188.9
A2.2.4 Reconciling 2010-15 performance
Our approach to reconciling 2010-15 performance is set out in the wholesale water
and wastewater technical appendix.
Thames proposed adjustments to the opening RCV and allowed revenue for the
wholesale water services to reconcile performance in 2010-15. We have intervened
and as a result the revenue adjustments for wholesale water have changed from £-
0.8 million to £-26.9 million.
We summarise these interventions and quantify the resulting adjustments within this
draft determination in Table A2.7 below. The impact on the opening RCV of 2010-15
adjustments is shown in table A2.5.
As noted in the table above, we have applied -£23.8 million in (net) adjustments
arising from logging up, logging down and shortfalls. The company did not raise any
shortfalling claims; we have intervened to apply a shortfall of £18.0 million (post
efficiency), relating to unplanned interruptions to supply exceeding 12 hours. Further
information on our interventions and rationale is set out in annex 3.

Draft price control determination notice: company-specific appendix – Thames Water
17
Table A2.7 Thames Water wholesale water revenue adjustments to reflect 2010-15
performance (£ million)
Area Intervention Why we did it Total 2010-15
Service incentive
mechanism
(SIM)
SIM performance
penalty has increased
To reflect updated
industry performance
in line with the
methodology.
-40.9
Revenue
correction
mechanism
(RCM)
We have intervened in
the following areas.
Back billing
FD09 assumptions
Number of
households billed
Outturn financial year
average RPI
We have concerns as
to whether the back
billing amounts put
forward by the
company are
compliant with
RAG4.04 and IN 11/04
and so have
disallowed these
claims.
We also have
concerns on FD09
assumptions and data
inconsistencies.
30.1
Opex incentive
allowance (OIA)
There are no
interventions in this
area.
n/a 0.0
Capital
expenditure
incentive scheme
(CIS)
There are no
interventions in this
area other than we
have included our view
of the applicable
change protocol
amounts.
n/a -16.1
Other
adjustments
There are no
interventions in this
area.
n/a 0.0
Total n/a n/a -26.9

Draft price control determination notice: company-specific appendix – Thames Water
18
A2.2.5 Calculation of allowed revenue
We set out the calculation of the allowed revenue for Thames Water’s wholesale
water control in table A2.8.
Overall, we consider that the company’s wholesale water revenue allowance should
be £790.7million in 2015-16, increasing by 1.3% to £800.6 million in 2019-20.
Table A2.8 Thames Water wholesale water allowed revenue (£ million)
2015-16 2016-17 2017-18 2018-19 2019-20 Total
Totex 630.1 670.3 689.8 679.0 657.0 3,326.1
PAYG ratio 54.64% 54.98% 58.41% 59.92% 61.66% -
Totex additions
to the RCV
285.8 301.8 286.9 272.2 251.9 1,398.5
RCV (year
average)
4,751.5 4,817.2 4,915.8 5,021.0 5,108.7 -
Wholesale allowed revenue build up:
PAYG1 353.3 377.6 412.0 415.9 414.2 1,972.9
Return on
capital
175.7 178.1 181.8 185.7 188.9 910.1
RCV run-off 241.7 214.5 176.9 171.6 177.1 981.9
Tax2 0.0 0.0 0.0 0.0 0.0 0.0
Income from
other sources
-5.9 -5.9 -5.9 -5.9 -5.9 -29.4
Reconciling
2010-15
performance
-5.4 -5.4 -5.4 -5.4 -5.4 -26.9
Ex ante
additional menu
income
3.7 3.9 4.0 4.0 3.8 19.5
Wholesale
allowed
revenue
adjustments
Equity Issuance 0.0 0.0 0.0 0.0 0.0 0.0

Draft price control determination notice: company-specific appendix – Thames Water
19
2015-16 2016-17 2017-18 2018-19 2019-20 Total
Cost
Revenue
solving
adjustment
0.0 0.0 0.0 0.0 0.0 0.0
Profiling
adjustments
0.0 0.0 0.0 0.0 0.0 0.0
Manual
adjustments
0.0 0.0 0.0 0.0 0.0 0.0
Capital
contributions
from connection
charges and
revenue from
infrastructure
charges
27.6 27.7 27.7 27.8 27.8 138.6
Final allowed
revenues
790.7 790.5 791.2 793.6 800.6 3,966.7
Notes:
1. PAYG includes the PAYG calculated from totex and the pension deficit repair allowance. 2. Including tax on adjustments for reconciling 2010-15 performance and ex-ante additional menu income.
A2.3 Uncertainty mechanisms
We outline our approach to uncertainty mechanisms in the risk and reward technical
appendix. In table A2.9 below, we set out Thames Water’s proposed wholesale
water uncertainty mechanisms and our assessment of these proposals.

Draft price control determination notice: company-specific appendix – Thames Water
20
Table A2.9 Thames Water proposals for wholesale water uncertainty mechanisms
Thames Water proposals Our assessment
Thames Water proposed an uncertainty
mechanism for water business rates with a
sharing rate of 75% customer and 25%
company.
We consider that the materiality,
comparability and control over risk criteria for
water business rates are met. We have
included a 75%:25% uncertainty mechanism
for all companies consistent with our prior
guidance and earlier draft determinations.
The specific text of this Notified Item and the
rationale for its inclusion in the draft
determination is set out in the risk and reward
technical appendix.

Draft price control determination notice: company-specific appendix – Thames Water
21
A3. Wholesale wastewater
In this chapter, we outline our draft determination for Thames Water’s wholesale
wastewater control, excluding the Thames Tideway Tunnel. We outline our draft
determination for the Thames Tideway Tunnel in the following chapter.
A3.1 Outcomes, performance commitments and incentives
In the outcomes technical appendix, we discuss our approach to outcomes for the
wholesale and retail controls.
We summarise the outcomes, performance commitments and outcome delivery
incentives for the wholesale wastewater control for Thames Water in table A3.1
below.
We are intervening to impose an overall cap and collar on outcome delivery
incentives for the 2015-20 period, thereby limiting total rewards and penalties. The
maximum rewards for outperformance will be limited to +2% of RoRE and maximum
penalties for underperformance are limited to -2% of RoRE. This will help ensure
that the overall package of delivery incentives is calibrated to provide meaningful
financial incentives and protect customers.
Similar to the water wholesale control, for some performance commitments and
incentives types we have intervened to change the underlying performance level or
incentives. These interventions are listed in table A3.1 below. Full detail of the
wholesale water outcomes, performance commitments and incentives is provided in
annex 4.
Table A3.1 Wholesale wastewater outcomes, performance commitments and
incentives
Company proposal Intervention
Outcome Performance
commitment
Incentive type
Demonstrate
to our
customers and
stakeholders
Improve handling of
written complaints by
increasing 1st time
resolution
Non-financial incentive No Intervention

Draft price control determination notice: company-specific appendix – Thames Water
22
Company proposal Intervention
Outcome Performance
commitment
Incentive type
that they can
trust us, that
we are easy to
do business
with and that
we care
Number of Written
complaints per 10,000
connected properties
Non-financial incentive No Intervention
Customer satisfaction
surveys (Internal CSAT
monitor)
Non-financial incentive No Intervention
We will
provide a safe
and reliable
Wastewater
service that
complies with
all necessary
standards and
is available
when our
customers
require it
Asset Health
Wastewater Non
Infrastructure
Financial – penalty only Bottom-up analysis –
Adjusted the penalty
deadband and collar
Asset Health
Wastewater
Infrastructure
Financial – penalty only Bottom up analysis –
Adjusted the penalty
deadband, penalty
collar and incentive
rate
Properties protected
from flooding due to
rainfall
Financial – reward and
penalty
Horizontal check –
Adjusted the
performance
commitment level, and
include specific penalty
for delayed delivery of
Counters Creek sewer
flooding scheme
Number of internal
flooding incidents,
excluding those due to
overloaded sewers
(SFOC)
Financial – reward and
penalty
Horizontal check -
Adjusted the
performance
commitment level and
changed penalty
deadbands and collar.
The rewards have
been removed and
s105A transferred
assets have been
included.

Draft price control determination notice: company-specific appendix – Thames Water
23
Company proposal Intervention
Outcome Performance
commitment
Incentive type
Contributing area
disconnected from
combined sewers by
retrofitting sustainable
drainage
Financial – reward and
penalty
No Intervention
Compliance with
SEMD (Security and
Emergency Measures
Directive) advice notes,
with or without
derogation
Financial – penalty only No Intervention
Population Equivalent
of sites made resilient
to future extreme
rainfall events
Financial – penalty only No Intervention
We will limit
our impact on
the
environment
and achieve a
socially
responsible,
sustainable
business for
future
generations,
including
reducing
levels of
leakage
Greenhouse gas
emissions from
wastewater operations
Non-financial incentive No Intervention
Total Category 1-3
pollution incidents from
sewage related
premises
Financial – reward and
penalty
Horizontal check -
Adjusted the penalty
rate and introduced a
gateway clause that
disallows rewards if a
category 1 or 2 incident
occurs. S105A
transferred assets have
been included
Sewage treatment
works discharge
compliance
Financial – penalty only No Intervention
Water bodies improved
or protected from
deterioration as a result
of TW activities
Non-financial incentive No Intervention
Satisfactory sludge
disposal compliance
Non-financial incentive No Intervention

Draft price control determination notice: company-specific appendix – Thames Water
24
Company proposal Intervention
Outcome Performance
commitment
Incentive type
We will educate our
existing and future
customers
Non-financial incentive No Intervention
Modelled reduction in
properties affected by
odour
Financial – reward and
penalty
Bottom-up analysis
Reward cap lowered in
years 4 and 5
Deliver 100% of agreed
measures to meet new
environmental
regulations
Financial – penalty only No Intervention
Reduce Phosphorus in
rivers to help improve
aquatic plant wildlife
quality
Financial – reward and
penalty
Bottom-up analysis
Introduced a timeline
for delivery and
clarified the incentive
rates.
We will
provide the
level of
customer
service our
customers
require, in the
most
economic and
efficient
manner, to
ensure that
bills are no
more than
necessary
Energy imported –
Energy exported
Non-financial incentive No Intervention
Draft price control determination notice: company-specific appendix – Thames Water
25
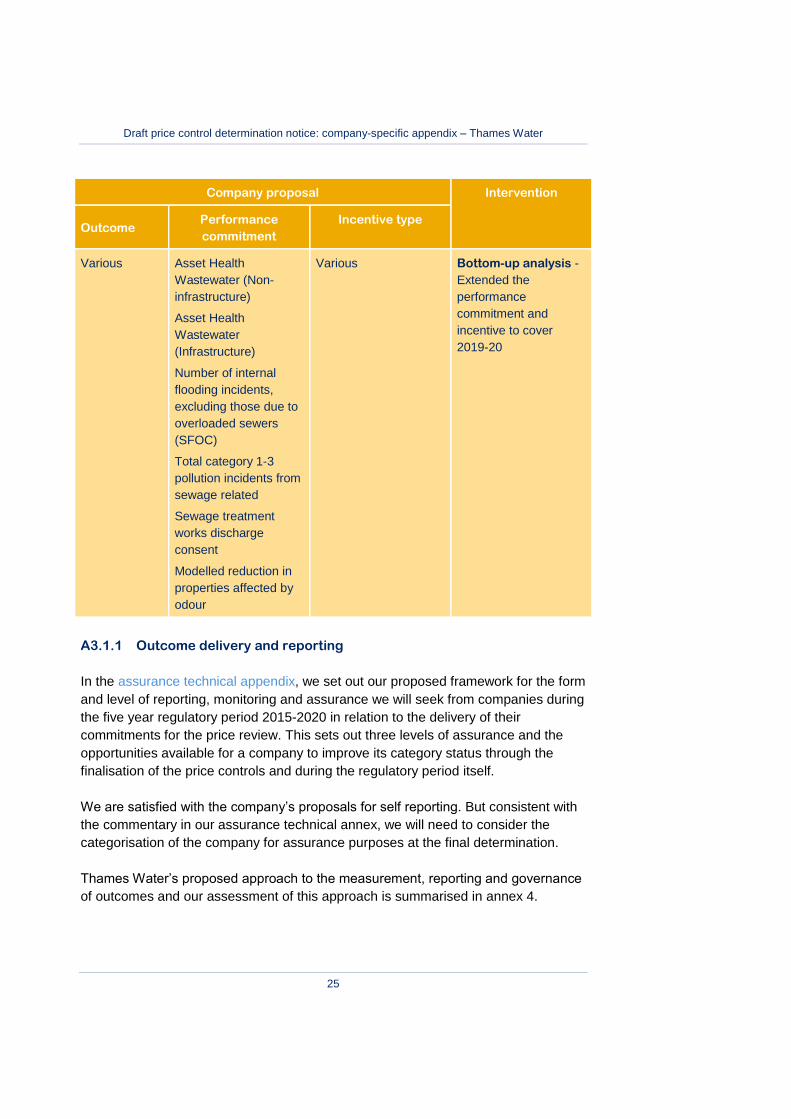
Company proposal Intervention
Outcome Performance
commitment
Incentive type
Various Asset Health
Wastewater (Non-
infrastructure)
Asset Health
Wastewater
(Infrastructure)
Number of internal
flooding incidents,
excluding those due to
overloaded sewers
(SFOC)
Total category 1-3
pollution incidents from
sewage related
Sewage treatment
works discharge
consent
Modelled reduction in
properties affected by
odour
Various Bottom-up analysis -
Extended the
performance
commitment and
incentive to cover
2019-20
A3.1.1 Outcome delivery and reporting
In the assurance technical appendix, we set out our proposed framework for the form
and level of reporting, monitoring and assurance we will seek from companies during
the five year regulatory period 2015-2020 in relation to the delivery of their
commitments for the price review. This sets out three levels of assurance and the
opportunities available for a company to improve its category status through the
finalisation of the price controls and during the regulatory period itself.
We are satisfied with the company’s proposals for self reporting. But consistent with
the commentary in our assurance technical annex, we will need to consider the
categorisation of the company for assurance purposes at the final determination.
Thames Water’s proposed approach to the measurement, reporting and governance
of outcomes and our assessment of this approach is summarised in annex 4.

Draft price control determination notice: company-specific appendix – Thames Water
26
A3.2 Calculating the wholesale wastewater price control-
excluding TTT
In its December business plan, Thames Water included the costs associated with the
delivery of its elements of the Thames Tideway Tunnel (TTT) within its wholesale
wastewater control. As part of our feedback on the risk-based review, we raised
particular concerns around this, in particular, the company provided insufficient
evidence to justify that the uncertainty mechanisms it proposed to apply to these
activities would represent best value to customers.
We subsequently explored with Thames Water the possibility of a separate price
control for its activities on the TTT (the TTT Control). Thames Water has since
proposed that the delivery of its components of the TTT could be delivered via a
separate price control in its June plan.
We support the introduction of a separate, binding price control for the Thames
Water activities within a separate TTT Control. The wholesale wastewater costs for
Thames Water therefore exclude any costs for the TTT Control, which are
considered in section A4. Thames Water has provided business plan table
information for Thames Water appointee with and without the TTT Control, in some
instances it has provided data on just the TTT Control in the business plan tables.
But as it has not provided separate financial tables for the TTT Control, this has
implications for financial modelling as discussed in section A3.2.2.
A3.2.1 Calculating allowed wholesale wastewater expenditure
Our approach to calculating allowed wholesale expenditure is set out in the
wholesale water and wastewater technical appendix.
In the December plan, Thames Water proposed wholesale wastewater totex of
£3,799 million (excluding the impact of the Thames Tideway Tunnel). This reduced
in its June plan to £3,744 million, largely due to reduction in costs claimed for NEP5.
We calculated the draft determination threshold at £3,721 million, giving rise to a
difference of £22 million or 0.6%. We did consider making adjustments for wholesale
wastewater in its revised plan. Our draft determination threshold is £3,721 million
after consideration of adjustments proposed by the company, this included the full
amount included by Thames – £130 million – in respect of the NEP5 programme.
We also note that the company made representations to our cost models following
the publication of these in April. The representations made and our response is
summarised in wholesale water and wastewater technical appendix.

Draft price control determination notice: company-specific appendix – Thames Water
27
With an implied menu choice of 99.9, the company is very close to our totex
threshold.
The proposed wholesale wastewater allowed expenditure for Thames Water is
detailed in table A3.2 below. A further breakdown of some of the calculations is
provided in annex 1. Further information about our assessment of each claim is set
out in the populated version of draft determination initial cost threshold models.
Table A3.2 Wholesale wastewater allowed expenditure (£ million)
2015-16 2016-17 2017-18 2018-19 2019-20 Total
Draft determination
cost threshold
(excluding TTT)
3,721.3
Costs excluded from
menu
62.1
Menu cost baseline1 823.3 770.1 776.3 689.9 599.7 3,659.2
Company’s view of
menu costs2
3,656.5
Implied menu choice 99.9
Allowed expenditure
from menu
823.1 770.0 776.1 689.8 599.5 3,658.5
Costs excluded from
menu
12.8 12.3 12.3 12.3 12.3 62.1
Total allowed
expenditure3
835.9 782.3 788.4 702.1 611.9 3,720.6
Less pension deficit
repair allowance
8.3 8.3 8.3 8.3 8.3 41.7
Totex for input to
PAYG
827.6 774.0 780.1 693.8 603.5 3,679.0
Notes:
1. Menu baseline is equal to the draft determination threshold less pension deficit recovery costs, third party costs and market opening costs related to 2014-15 (see annex 1).
2. Based on company plan totex minus costs for items excluded from the menu. 3. Includes pension deficit repair allowance.

Draft price control determination notice: company-specific appendix – Thames Water
28
A3.2.2 Calculation of revenues: PAYG and RCV-run off
Table A3.3 shows the PAYG ratios and associated totex recovery for wholesale
wastewater, which we have used as the basis for this draft determination.
As a consequence of its financial modelling approach, the company has to apply
blended PAYG and RCV run-off rates for the TTT Control and wholesale wastewater
control. We have applied zero PAYG and RCV run-off to the TTT Control (see
section A4). However, as a consequence of our cost assessment for the TTT Control
(where we reduced the cost allowance, also see section A4), we have made
technical adjustments to the PAYG and RCV run off rates proposed by the company,
which are applied to the wastewater control to maintain zero PAYG and RCV run off
for the TTT Control. This ensures that wastewater and TTT revenues are correct.
Table A3.3 Thames Water wholesale wastewater PAYG ratios
2015-16 2016-17 2017-18 2018-19 2019-20 Total
Totex (£m) 827.6 774.0 780.1 693.8 603.5 3,679.0
PAYG % 43.7% 47.7% 48.0% 53.3% 59.5% 50.4%
Resulting PAYG (£m) 362.0 368.8 374.5 369.8 359.1 1,834.2
Table A3.4 shows the RCV run-off amounts included within the wholesale
wastewater charge. This reflects a run-off rate of 5.29% for the RCV as it stands on
31 March 2015 and 23 years for the totex additions to the RCV over 2015-20.
Table A3.4 Thames Water wholesale wastewater RCV run-off (£ million)
2015-16 2016-17 2017-18 2018-19 2019-20 Total
Run-off of 2015 RCV 291.1 263.2 240.7 232.4 239.8 1267.2
RCV run-off of totex
additions
10.2 29.2 46.9 62.8 75.2 224.1
Total RCV run-off 301.3 292.4 287.6 295.1 314.9 1491.3
A3.2.3 Return on the RCV
As discussed in section A2.2.3, the company has accepted our risk and reward
guidance (subject to us accepting its plan as a whole as discussed in section
A2.2.3). In common with all other water and sewerage companies, we have used a

Draft price control determination notice: company-specific appendix – Thames Water
29
cost of capital of 3.7% in this draft determination. This results in a return on capital of
£1071.2 million over 2015-20.
Table A3.5 shows our calculation of the opening RCV at 1 April 2015 taking account
of the adjustments for 2010-15 performance discussed in section A3.2.4 below. The
average RCV, set out in table A3.6 below for each year, takes into account the
proportion of totex additions to the RCV determined by the PAYG ratio and RCV run-
off.
Table A3.5 Thames Water wholesale wastewater opening RCV (£ million)
Thames
(excluding
TTT)
TTT
2015-16 2015-16
Closing RCV 31 March 2015 6147.0 316.0
Land sales -23.7 0.0
Adjustment for actual expenditure 2009-10 -88.6 0.5
Adjustment for actual expenditure 2010-151 -235.1 0.0
Net adjustment from logging up, logging down and
shortfalls
-191.5 481.1
Other adjustments2 -101.3 0.0
Opening RCV 1 April 2015 –including TTT 5506.9 797.5
Note:
1. The adjustment for actual expenditure 2010-15 is explained further in annex 3 as part of the CIS adjustment. 2. Logging up adjustments include logging up amounts relating to Thames Tideway Tunnel expenditure for
2010-15 (£482 million) and a logging down amount proposed by the company ( £101 million) in respect of 2005-10 s203 expenditure.
Table A3.6 Thames Water wholesale wastewater return on RCV (£ million)
2015-16 2016-17 2017-18 2018-19 2019-20
Opening RCV 5,506.9 5,671.2 5,784.0 5,902.0 5,930.9
RCV additions (from totex) 465.6 405.1 405.6 324.0 244.4
Less RCV run-off 301.3 292.4 287.6 295.1 314.9
Closing RCV 5,671.2 5,784.0 5,902.0 5,930.9 5,860.4

Draft price control determination notice: company-specific appendix – Thames Water
30
2015-16 2016-17 2017-18 2018-19 2019-20
Average RCV (year average) 5,589.0 5,727.6 5,843.0 5,916.5 5,895.7
Return on capital 206.7 211.8 216.0 218.8 218.0
A3.2.4 Reconciling 2010-15 performance
Our approach to reconciling 2010-15 performance is set out in the wholesale water
and wastewater technical appendix.
Thames proposed adjustments to the opening RCV and allowed revenue for the
wholesale water services to reconcile performance in 2010-15. We have intervened
and as a result the revenue adjustment for wholesale water has changed from -£51.2
million to -£52.6 million.
We summarise these interventions and quantify the resulting adjustments within this
draft determination in table A3.7 below. The impact on the opening RCV of 2010-15
adjustments is shown in table A3.5 above. As noted in the table above, we have
applied -£191.5 million in (net) adjustments arising from logging up, logging down
and shortfalls. Thames Water proposed shortfalling adjustments totalling £16.1
million in respect of its performance on pollution incidents and flooding other causes.
We have intervened and increased the shortfall to £38.1 million (post efficiency)
overall. Further information on our interventions and rationale is set out in annex 3.
Table A3.7 Thames Water wholesale wastewater revenue adjustments to reflect
2010-15 performance (£ million)
Area Intervention Why we did it Total 2010-15
Service incentive
mechanism (SIM)
SIM performance
penalty has
increased
To reflect updated
industry
performance
statistics and
application of
methodology
-43.3

Draft price control determination notice: company-specific appendix – Thames Water
31
Area Intervention Why we did it Total 2010-15
Revenue correction
mechanism (RCM)
We have intervened
in the following
areas:
Back billing
FD09 assumptions
Number of
households billed
Outturn financial
year average RPI
We have concerns
as to whether the
back billing amounts
put forward by the
company are
compliant with
RAG4.04 and IN
11/04 and so have
disallowed these
claims.
We also have
concerns on FD09
assumptions and
data inconsistencies.
66.7
Opex incentive
allowance (OIA)
There are no
interventions in this
area.
n/a 0.0
Capital expenditure
incentive scheme
(CIS)
There are no
interventions in this
area other than we
have included our
view of the
applicable change
protocol amounts.
n/a -76.0
Other adjustments 0.0
Total n/a n/a -52.6
A3.2.5 Calculation of allowed revenue
The calculation of the allowed revenue for Thames Water’s wholesale wastewater
control is shown in table A3.8.
Overall, we consider that Thames Water’s wholesale wastewater revenue allowance
should be £871.4 million in 2015-16, increasing by 2.5% to £893.6 million in 2019-
20.
Table A3.8 Thames Water wholesale wastewater allowed revenue (£ million)
2015-16 2016-17 2017-18 2018-19 2019-20 Total

Draft price control determination notice: company-specific appendix – Thames Water
32
2015-16 2016-17 2017-18 2018-19 2019-20 Total
Totex 827.6 774.0 780.1 693.8 603.5 3,679.0
PAYG ratio 43.7% 47.7% 48.0% 53.3% 59.5% -
Totex additions 465.6 405.1 405.6 324.0 244.4 1,844.8
RCV (year average) 5,589.0 5,727.6 5,843.0 5,916.5 5,895.7 -
Wholesale allowed revenue build up:
PAYG1 370.3 377.1 382.8 378.1 367.5 1,875.8
Return on capital 206.7 211.8 216.0 218.8 218.0 1,071.2
RCV run-off 301.3 292.4 287.6 295.1 314.9 1,491.3
Tax2 0.0 0.0 0.0 0.0 0.0 0.0
Income from other
sources
-11.4 -11.4 -11.4 -11.4 -11.4 -56.8
Reconciling 2010-15
performance
-10.5 -10.5 -10.5 -10.5 -10.5 -52.6
Ex ante additional
menu income
0.1 0.1 0.1 0.1 0.1 0.3
Capital contributions
from connection
charges and revenue
from infrastructure
charges
15.0 15.0 15.0 15.0 15.1 75.1
Final allowed
revenues
871.4 874.5 879.6 885.2 893.6 4,404.3
Notes:
1. PAYG includes the PAYG calculated from totex and the pension deficit repair allowance. 2. Including tax on adjustments for reconciling 2010-15 performance and ex ante additional menu income
A3.3 Uncertainty mechanisms
We outline our approach to uncertainty mechanisms in the risk and reward technical
appendix. In table A3.9 below, we set out Thames Water’s proposed wholesale
wastewater uncertainty mechanisms and our assessment of these proposals.

Draft price control determination notice: company-specific appendix – Thames Water
33
Table A3.9 Thames Water proposals for wholesale wastewater uncertainty
mechanisms
Thames Water proposals Our assessment
Thames Water did not propose any
uncertainty mechanisms beyond those
that will already form part of the
regulatory framework for 2015-20.

Draft price control determination notice: company-specific appendix – Thames Water
34
A4. Thames Tideway Tunnel
A4.1 Separate price control
The Thames Tideway Tunnel (TTT) is the main tunnel component of a solution to
reduce overflows of untreated sewage into the River Thames in order to achieve
compliance with the Urban Wastewater Treatment Directive. The Government has
specified the project to be delivered by a third party Infrastructure Provider (IP) given
the size and complexity of the project.
We are not determining the IP’s revenues at this price review. Instead the IP’s
revenues (particularly during the construction phase) will be determined through its
licence in light of the outcomes of a competitive procurement process for an IP. We
intend to consult on a licence for the IP (and necessary associated modifications to
Thames Water's licence) this Autumn
Thames still has an important role on the project during construction and into
operations including: carrying out the procurement of an IP; obtaining the necessary
planning consents to deliver the project; carrying out design for the project; acquiring
the land necessary for construction activities to commence; delivering some of the
site enabling works; and works to prepare for the interface between the TTT and the
rest of the sewerage system.
Up until 31 March 2015 Thames Water will have spent nearly £800m on developing
the project. Its June business plan forecast costs of £655 million for Thames Water’s
activities on the project between 2015 and 2020; an increase from the £508 million
included in the December plan.
As set out in section A3.2, Thames Water proposed that the delivery of its
components of the TTT could be delivered via a separate price control in its June
plan (the ‘TTT Control’).
We support the introduction of a separate price control for the Thames Water's
activities on the TTT as there are a number of benefits to this approach, including
increased transparency; and separation of activities with different risk profiles and
the provisions of bespoke (and focused) uncertainty mechanisms. Overall, we
consider that separately regulating this part of the value chain better protects
customers’ interests.
This approach will require an amendment to Condition B of Thames Water's licence
to align with the final determination. Thames Water did not provide its proposed
Draft price control determination notice: company-specific appendix – Thames Water
35
licence modifications with its June plan, but has subsequently provided a suite of
licence conditions to accommodate the separate price control at a working level. We
understand that Thames Water's licence proposals have not been formally endorsed
by its Board; the modifications remain part of ongoing discussions with the company
and will be subject to a separate licence consultation.
However, a key aspect of Thames Water's proposed modification is that this price
control (and Thames Water's TTT RCV) will automatically fold back into Thames
Water’s wastewater control in 2020. We consider there is no need for an automatic
expiry date in the licence as proposed by Thames Water and indeed that this could
operate against customers’ interests in the long term. Should Thames Water
continue to pursue a licence modification on these terms, we expect it to set out
clearly in its representations how it is in the customer interest for the TTT price
control to automatically fold back into the wastewater price control in 2020.
A4.2 Company outcomes, performance commitments and
delivery incentives
A4.2.1 Outcomes, performance commitments and incentives
In the outcomes technical appendix, we discuss our approach to outcomes.
Thames did not propose any outcome delivery incentives or performance
commitments for it activities on the TTT in its June business plan submission.
In response to our request, Thames Water has subsequently developed an initial set
of performance commitments for the TTT although these were neither tested with
customers nor approved by Thames Water's Board. Given Thames Water's key role
in the timely delivery of the project, we consider that customers would not be
adequately protected without performance commitments and incentives in this area.
The performance commitments Thames Water has proposed are a helpful starting
point. Using the company’s proposals, we have outlined what we consider to be the
three key performance commitments and associated incentives for the project in
annex 4. We have reflected these commitments in the RoRE ranges for the TTT
control and the appointee.
Thames will need to develop the performance commitments further including how it
will measure and report against its performance and engage with its customers to
understand their views. Thames Water will also need to update the performance

Draft price control determination notice: company-specific appendix – Thames Water
36
commitments should it commit to take on additional activities to limit the extent of
delays to the project if there is a delay to the appointment of an IP.
As explained in the outcomes technical appendix, we are proposing the introduction
of an aggregate cap on rewards and collar on penalties from the outcome delivery
incentives. Details of how the cap/collar will operate are set out in section A5 of the
Outcomes Technical Appendix.
There are a small number of specific exclusions from the cap/collar. The following
Performance Commitment for Thames Water has been excluded from the cap/collar:
Thames Tideway Tunnel: We will limit the extent of delays on the overall programme
timeline
We summarise the outcomes, performance commitments and outcome delivery
incentives for the TTT Control for Thames Water in table 4.1 below. Full detail of the
proposed TTT Control outcomes, performance commitments and incentives is
provided in annex 4.
Table A4.1 TTT Control outcomes, performance commitments and incentives
Outcome Performance
commitment
Incentive
type
Intervention
Thames Water is
committed to
improving outcomes
for customers and for
the environment,
notably by
intercepting
significant sewage
discharges into the
tidal river Thames,
working together with
the IP to ensure the
timely and cost-
efficient delivery of
the TTT project
Thames did not
propose any
performance
commitments in its
June business plan
n/a Include three performance
commitments for Thames
Water's activities on the
TTT:
Limit the extent of delays
to the overall programme
timeline (financial –
penalty only).
Engage effectively with
the IP, and other
stakeholders, both in
terms of integration and
assurance (reputational).
Engage with customers
to build understanding of
the TTT project
(reputational).

Draft price control determination notice: company-specific appendix – Thames Water
37
A4.2.2 Outcome delivery and reporting
In the assurance technical appendix, we set out our proposed framework for the form
and level of reporting, monitoring and assurance we will seek from companies during
the five-year regulatory period 2015-20 in relation to the delivery of their
commitments for the price review. This sets out three levels of assurance and the
opportunities available for a company to improve its category status through the
finalisation of the price controls and during the regulatory period itself.
We are satisfied with the company’s proposals for self reporting that it has applied
for the performance commitments across the wholesale and retail control (as
summarised in annex 4). We expect Thames Water to set out how it will apply its
reporting proposals for the performance commitments it develops in respect of the
TTT Control.
A4.3 Calculating the TTT price control
A4.3.1 Calculating allowed TTT expenditure
Our approach to calculating allowed TTT Control expenditure follows the approach
adopted for the wholesale water and wastewater controls as set out in the wholesale
water and wastewater technical appendix. The proposed TTT Control allowed
expenditure for Thames Water is detailed in table 4.2 below.
Its June business plan submission, Thames Water set out its TTT Control costs as a
single cost exclusion claim to the wholesale wastewater control. It further split these
into three sub-menu exclusion claims relating to Thames Water's view of whether the
costs were for: typical activities, atypical activities or land acquisition. Typical costs
are for activities which Thames Water considers are broadly consistent with its usual
regulated activities. Atypical costs are either for activities which Thames Water
considers are not in line with its usual regulated activities or are subject to a high-
level of uncertainty.
Thames Water proposed different cost sharing rates for these different types of cost:
typical (50:50); atypical (90:10); and land (100:0). It proposed these cost sharing
arrangements would lie outside the operation of the wholesale wastewater menu.
annex 5 sets out Thames Water's proposals and our approach for the draft
determination.
In addition, within the business plan, Thames Water further broke its costs down into
individual cost areas and the principal activities within those cost areas.

Draft price control determination notice: company-specific appendix – Thames Water
38
In respect of the costs and activities included in the atypical category (in the
company’s business plan), we assessed that nearly all of the costs should be
categorised as relating to typical business as usual activities. Where some of these
costs related to activities that are uncertain, we have proposed that uncertainty
mechanisms could apply. We discuss these issues further in table A4.8.
While we have not included the financial consequences of the implied menu choice
for the draft determination we proposed to adopt a cost menu, using the menu for
wholesale wastewater for all costs excluding land, for the final determination. This is
in order to provide Thames Water with the same incentives and opportunities under
which the rest of the industry are being exposed. A menu will maintain an incentive
on Thames Water to provide accurate information on Thames Water until it makes its
menu choice2 and (together with the proposed uncertainty mechanisms) will further
help mitigate the risk to the company around our cost challenge. It will provide the
company with discretion to choose its cost performance sharing rate based on its
own view of appropriate P50 cost (in line with our approach on the wholesale
controls). As land costs (and land income) will remain subject to the 100:0 sharing
rate (as set out in annex 5) these costs will be excluded in the menu3.
This approach is contingent on Thames Water providing a reasonable response to
our challenges on efficient P50 costs, treatment of uncertainty, and providing,
through its representations, a firm proposal on consequences from the decision on
planning permission (which is expected to be made in September)4. We set out our
assessment of the costs proposed by Thames Water in ‘Protecting customers where
there are very material differences between companies’ re-submitted plans and
2 Within the range 80 to 130 as set out in the wholesale water and wastewater technical appendix.
3 At the 2009 price review, we agreed a 100:0 sharing mechanism for costs to acquire land rights for
the project and also any associated income. Normally, under licence Condition K, income from land disposal is shared 50:50 between customers and the company. Given the extensive land rights needed for the project but the clear intention to dispose of these once they were no longer required, we were concerned that customers would not fully benefit from the income arising from the disposal of land, though they had financed the acquisition through increased bills. We considered it was appropriate that customers fully benefit from the net proceeds from rental income and the disposal of project land. We therefore agreed a 100:0 sharing of costs for land acquisition and income from the project land.
4 The Secretary of State for Department of Communities and Local Government, and the Secretary of
State for Defra will make the decision on whether to grant planning permission for the project.

Draft price control determination notice: company-specific appendix – Thames Water
39
Ofwat’s wholesale cost assessment’, we provide further detail on our cost
assessment in annex 1.
Finally, as explained above on 6 August we informed Thames Water that very
material differences remain between its re-submitted plan and our assessment of
efficient TTT Control. We did this to give Thames (and other affected companies) as
much time as possible to reflect on its plan for the coming five-year period and
reconsider its proposals in response to our draft determinations.
Table A4.2 TTT allowed expenditure (£ million)
2015-16 2016-17 2017-18 2018-19 2019-20 Total
Ofwat’s assessment of
costs eligible for menu
cost baseline1,
84.4 59.2 56.1 51.5 26.5 277.7
Allowed expenditure
from menu
Not modelled for the purposes of the draft determination. Our
intention is to adopt the wholesale wastewater menu for the final
determination.
Costs excluded from
menu (that is, land
costs under 100:0
sharing)2
22.7 14.0 2.8 6.0 1.0 46.6
Total allowed
expenditure3,4 107.1 73.2 59.0 57.6 27.5 324.3
Notes:
1. We profiled our view of expenditure based on the company’s profile, after taking into account that £110m of delay to the appointment of the IP was included in 2015-16
2. Land costs will be set outside of the menu 3. See annex 1 and the populated version of draft determination initial cost threshold models for further details
of our cost assessment 4. Numbers may not add due to rounding
A4.3.2 Calculation of PAYG rates and RCV run-off
Thames did not request any PAYG or RCV run-off for the TTT Control in its June
business plan. This is because the project will not be operational in 2015-20 and will
not deliver long-term benefits to customers until after 2020. Because the TTT will be
completed post-2020, there is no RCV run-off for the TTT Control in the 2015-20
period. This is consistent with usual accounting practice for depreciation and the
absence of customer benefit from the RCV until after the project is operational.

Draft price control determination notice: company-specific appendix – Thames Water
40
Thames did however propose an asset life of around 133 years in the business plan
for totex additions. We did not use this asset life in the draft determination to be
consistent with the view that there will be no RCV run-off in 2015-20. As explained
above, this is in line with usual accounting practice.
.A.4.3.3 Return on the RCV
Table A4.3 shows our calculation of the opening RCV at 1 April 2015 taking account
of the adjustments for 2010-15 performance discussed in section A4.3.4 below.
Table A4.3 Thames Water TTT opening RCV (£ million)
2015-16
Allocation of RCV from the wholesale wastewater control as at 31
March 20151.
316.0
Land sales2 0
Adjustment for actual expenditure 2009-10 0.5
Adjustment for actual expenditure 2010-2015 0
Net adjustment from logging up, logging down and shortfalls3. 481.1
Other adjustments 0
Opening RCV 1 April 2015 797.5
Note:
RCV included at PR09 for logging up in 2008-09 and 2009-10, and £261.5m included for 2010-15. This has been reallocated from the wholesale wastewater control.
1. Income from land is netted off capex in the logging up adjustment, in the line “net adjustment from logging up, logging down and shortfall”
2. Net of income from land
Table A4.4 Thames Water TTT return on RCV (£ million)
2015-16 2016-17 2017-18 2018-19 2019-20
Opening RCV 797.5 904.7 977.9 1,036.8 1,094.4
RCV additions (from totex) 107.1 73.2 59.0 57.6 27.5
Less RCV run-off 0.0 0.0 0.0 0.0 0.0
Closing RCV 904.7 977.9 1,036.8 1,094.4 1,121.9
Average RCV (year average) 851.1 941.3 1,007.3 1,065.6 1,108.1

Draft price control determination notice: company-specific appendix – Thames Water
41
2015-16 2016-17 2017-18 2018-19 2019-20
Return on capital 31.5 34.8 37.2 39.4 41.0
Table A4.5 TTT adjustments for financing costs in 2010-15 (£ million)
2015-16 2016-17 2017-18 2018-19 2019-20 Total
Financing costs
revenue adjustment
6.4 6.4 6.4 6.4 6.4 32.0
A4.3.4 Reconciling 2010-15 performance
At PR09 we allowed £261.5m for development and land activity over the period
2010-15 through the price limit. We also logged up (to the RCV) £54.5m for
additional expenditure Thames Water had incurred between 2008-2010. At the time
we recognised that there was still considerable uncertainty around the project
timetable. As a result Thames Water may incur additional expenditure. Therefore we
committed to log up efficient additional expenditure. We provided a notified item for
land costs so that Thames Water could ask for price controls to be reopened before
PR14 should land costs increase materially. We also excluded these costs from CIS.
In its June business plan, Thames Water proposed to log up costs of £597.0m that
were in addition to the expenditure allowed at PR09. Of this £300.2m was for
acquiring land rights for the project and £296.8m was for development and delivery
of the project. Thames Water provided sufficient evidence to justify £481.5m of its
requested costs; but did not do so for the remaining £115.5m.
We summarise our views and the associated interventions in table A4.6 below. The
interventions are explained in more detail in annex 3. The impact on the opening
RCV of 2010-15 adjustments is shown in table A4.3

Draft price control determination notice: company-specific appendix – Thames Water
42
Table A4.6 Thames Tideway Tunnel change protocol adjustments (£million)
.Area Intervention Why we did it Total 2010-15
Land – logging up We have intervened
in the following
areas:
Accrued deferred
lease payments
Possible double
counting in 2014-
15 forecast costs
We do not consider
that customers
should pay for lease
payments before
Thames Water has
incurred them.
Customers should
not pay twice for the
acquisition of a land
right.
£-46.5m
Other costs (non-
land) – logging up
We intervened in
Thames Water's
forecast for 2014-15
Thames did not
provide sufficient
evidence to
demonstrate that its
forecast costs were
likely to occur in
2014-15 and that
they were efficient
£-68.9m
Total £-115.5m
Notes:
1. Numbers may not add due to rounding
A4.3.5 Calculation of allowed revenue
The calculation of the allowed revenue for Thames Water’s TTT Control is shown in
table A4.7.
Table A4.7 Thames Water TTT allowed revenue (£ million)
2015-16 2016-17 2017-18 2018-19 2019-20 Total
Totex 107.1 73.2 59.0 57.6 27.5 324.3
PAYG ratio 0.0% 0.0% 0.0% 0.0% 0.0% -
Totex additions 107.1 73.2 59.0 57.6 27.5 324.3
RCV (year average) 851.1 941.3 1,007.3 1,065.6 1,108.1 -

Draft price control determination notice: company-specific appendix – Thames Water
43
2015-16 2016-17 2017-18 2018-19 2019-20 Total
Wholesale allowed revenue build up:
PAYG 0.0 0.0 0.0 0.0 0.0 0.0
Return on capital 31.5 34.8 37.2 39.4 41.0 183.9
RCV run-off 0.0 0.0 0.0 0.0 0.0 0.0
Tax 0.0 0.0 0.0 0.0 0.0 0.0
Financing costs for
2010-15
6.4 6.4 6.4 6.4 6.4 32.0
Final allowed
revenues 37.9 41.2 43.6 45.8 47.4 215.9
Notes:
1. The company used the capital contributions from the connection charges line in the financial model to input income from land rental in the company’s plan. As we have included this as an RCV adjustment, we have corrected the capital contributions line to zero.
A4.4 Uncertainty mechanisms
As set out in our risk and reward technical appendix, we understand that companies
face uncertainty about future costs and revenues and that appropriate risk sharing
mechanisms provide companies with incentives to reduce costs and provide better
services.
Table A4.8 Thames Water proposals for the TTT Control – uncertainty mechanisms
Thames Water proposals Our assessment
Alternative cost sharing rates for costs
assessed as ‘typical’ and ‘atypical’ costs.
We have reviewed the costs and activities
included in the atypical category in the
company’s business plan. We assessed
that nearly all of the costs should be
categorised as relating to typical, business
as usual activities.
Where costs are identified as atypical, this
is due to the uncertainties associated with
(i) the outcome of the planning consent
process and (ii) the timing of the award of
the licence to the Infrastructure Provider

Draft price control determination notice: company-specific appendix – Thames Water
44
Thames Water proposals Our assessment
(IP).
We explain our proposals in respect of the
uncertainty mechanism in section A4.4.1
and provide further detail of our
assessment of Thames Water’s proposed
mechanisms in annex 5.
Uncertainty mechanisms to deal with tax
implications associated with both the
separate TTT Control within the next
period and the inter-relationship between
Thames Water and the IP.
Our financial modelling shows there is no
tax payable by Thames Water in the
period 2015-20 due to the availability of
capital allowances and tax losses.
Moreover, there is significant headroom
available at the level of the Appointee
before tax would be payable. Given this,
we consider that uncertainty mechanisms
are unnecessary over 2015-20 on grounds
of materiality.
We understand that given the unique
delivery model for the project, the relevant
tax treatment of the project (including both
the IP delivered elements and the Thames
Water delivered elements) is still to be
agreed with HMRC. This suggests this risk
is still partly within the company’s control.
A4.4.1 Proposed uncertainty mechanism for the draft determination
For the TTT Control, we have considered risk and uncertainty consistent with the
framework for PR14 overall. We have applied the wholesale cost of capital to the
TTT Control, and in doing so we have taken into account our view that Thames
Water retains appropriate ownership of the design (and associated liability) of the
works it has carried out for the overall TTT project. We have also taken account of
the fact that there are areas of the TTT Control which face lower risk than the
“business as usual” wholesale wastewater control (such as the treatment of land
costs); and the available mechanisms to mitigate unique material risks where they
are largely out of Thames Water's control.
As set out in ‘Setting price controls for 2015-20 – risk and reward guidance’ there are
a range of standard industry uncertainty mechanisms that apply to the wholesale
controls. We consider that mechanisms relating to RPI indexation, five-yearly price
reviews, totex sharing rates, the flexibility provided by ODIs and the interim
Draft price control determination notice: company-specific appendix – Thames Water
45
determination of K (IDoK) and substantial effects provisions all have merits in
respect of the TTT Control.
In respect of the IDoK mechanism itself, it is possible to incorporate this within the
licence triggers that may be enduring such as a Relevant Changes of Circumstance
(RCC) already within company licences, or to adopt Notified Items through the price
control itself which are in place for the duration of the price control.
We discuss our rationale in response to the specific proposals by Thames Water in
table AA5.1 in annex 5. Our proposals for addressing uncertainty in the TTT Control
are summarised below:
We propose to adopt a bespoke IDoK mechanism for the TTT Control for
specified circumstances that are beyond management control. In addition, we
propose a mechanism that would allow certain, specified costs to be logged
up at the next price review if Thames Water does not reopen price controls
before the next price review.
The uncertainty mechanism would only apply to net additional costs that arise
from the reallocation of scope of work from the IP to Thames Water in order to
secure efficient project delivery in the event of delay to the appointment of the
IP (where this is beyond Thames Water’s control).
We are considering whether to allow a company specific Relevant Change of
Circumstance (RCC) in Thames Water's licence for changes to the scope of
the project (as set out in the Specification Notice or Preparatory Works
Notice5) where it changes Thames Water's obligations on the project.
We propose to include a bespoke materiality threshold in the licence of 10%
of RCV for an interim determination mechanism for the TTT Control. This
means in aggregate Thames Water's additional costs would need to be at
least equal to10% of the RCV in the TTT Control before it could ask for prices
to be reopened.
We propose to adopt a triviality threshold of 2% to each notified item that
would apply to the 2015-20 totex baseline for Thames Water's activities on the
TTT.
5 The Secretary of State issued a project specification notice on 5 June 2014. This requires Thames
to start a competitive procurement process for an IP to finance and build the tunnel. The specification notice defines the work to be delivered by an IP, while the preparatory works notice sets out the work that Thames shall carry out on the project and also identifies other activities which Thames may need to deliver.
Draft price control determination notice: company-specific appendix – Thames Water
46
We propose to revisit the potential requirement for an uncertainty mechanism,
ahead of final determinations, once the outcome of the planning consent
process is known.
Our proposals are made on the basis that the amendments to Thames
Water’s licence are enduring. We consider this will provide investors with
confidence that the licence mechanism would not need to be subject to further
review at the 2019 price review while work in the TTT project continues into
the 2020-25 period.

Draft price control determination notice: company-specific appendix – Thames Water
47
A5. Household retail
A5.1 Company outcomes, performance commitments and
delivery incentives
In the outcomes technical appendix, we discuss our approach to outcomes for the
wholesale and retail controls.
We summarise the outcomes, performance commitments and outcome delivery
incentives for the household retail control for Thames Water in table A5.1 below.
For some performance commitments and incentives types, we have intervened to
change the underlying performance level or incentives. These interventions are listed
in table A5.1 below. Full detail of the wholesale water outcomes, performance
commitments and incentives is provided in annex 4.
Table A5.1 Household retail outcomes, performance commitments and incentives
Company proposal Intervention
Outcome Performance
commitment
Incentive type
Offer a choice
of easy to use
contact
options
Implement new online
account management
for customers
supported by web-chat
Financial – penalty only Bottom-up analysis:
Introduce-value based
penalty for years 4 and
5 to fully compensate
customers in the event
of delay
Improving
cash collection
from those
that can pay
and helping
those that are
struggling to
pay
Increase the number of
customers on a
payment plan
(excluding Thames
Tideway Tunnel)
Non-financial incentive Bottom-up analysis:
Remove the Thames
Tideway Tunnel
exclusion
Increase cash
collection rates
(excluding Thames
Tideway Tunnel)
Non-financial incentive Bottom-up analysis:
Remove the Thames
Tideway Tunnel
exclusion

Draft price control determination notice: company-specific appendix – Thames Water
48
Company proposal Intervention
Outcome Performance
commitment
Incentive type
Minimise the number of
written complaints
received from
customers
Non-financial incentive No Intervention
Improve handling of
written complaints by
increasing first time
resolution
Non-financial incentive No Intervention
Improve customer
satisfaction of Retail
customers (charging
and billing services
only)
Non-financial incentive No Intervention
Improve customer
satisfaction of Retail
customers (operations
contact centre)
Non-financial incentive No Intervention
Increase the number of
bills based on actual
meter reads (in cycle)
Non-financial incentive No Intervention
Service Incentive
Mechanism (SIM)
Reward and penalty Horizontal check: PC
added (industry wide
incentive)
A5.1.1 Outcome delivery and reporting
In the assurance technical appendix, we set out our proposed framework for the form
and level of reporting, monitoring and assurance we will seek from companies during
the five-year regulatory period 2015-20 in relation to the delivery of their
commitments for the price review. This sets out three levels of assurance and the
opportunities available for a company to improve its category status through the
finalisation of the price controls and during the regulatory period itself
We are satisfied with the company’s proposals for self reporting. But consistent with
the commentary in our assurance technical annex, we will need to consider the
categorisation of the company for assurance purposes at the final determination.

Draft price control determination notice: company-specific appendix – Thames Water
49
Thames Water’s proposed approach to the measurement, reporting and governance
of outcomes and our assessment of this approach is summarised in annex 4.
A5.2 Costs
Our approach to the household retail control is set out in the household retail
technical appendix.
A5.2.1 Allocation of costs
In table A5.2 below, we summarise our assessment of Thames Water’s cost
allocation methodology.
Table A5.2 Our assessment of Thames Water’s cost allocation methodology
Area assessed Assessment
No potential material misallocations Fail
Adequate assurance provided Pass
Reconciliation to regulatory accounts and December business plan provided Pass
Correct price base used Fail
The company has submitted information to suggest that it has allocated its costs in
line with our guidance. We will use the company’s costs, but note the following
issues and actions associated with the company’s approach to the allocation of
costs:
the company has not allocated the following costs between retail and wholesale
in accordance with our guidance – IT costs (telephony) and facilities, building and
grounds maintenance.
the company has not allocated debt management between household and non-
household in accordance with our guidance.
the company has not allocated doubtful debts between household and non-
household in accordance with our guidance. It has allocated this cost based on
the write-offs over a five-year period. We understand that this is due to limitations
in the company’s systems which mean that it cannot allocate the movement in its
doubtful debt provision specifically between household and non-household.
the company has not complied with the principal use guidance with respect to the
allocation of capital costs and depreciation; and

Draft price control determination notice: company-specific appendix – Thames Water
50
the company has not used the prescribed customer number ratio of 1.3 for dual
service customers when allocating its costs between household and non-
household using customer numbers.
While reviewing the company’s cost allocations, we also noted that the company had
submitted tables R3 and R4 in 2013-14 outturn prices. This is not in line with our
guidance which required these tables to be prepared in 2012-13 base year prices.
We have amended our models to deflate the company’s household and non-
household costs to 2012-13 base year prices.
We have noted some concerns with the allocation of costs in the company’s plan, in
particular that the June plan was not in line with revised guidance. In order to
address the issues that we have identified, we expect the company to submit the
following information to us in its representations:
a cross-check of its allocation of doubtful debts based on write offs against an
allocation based on the movement in outstanding debt and present us with the
results of this cross-check (that is, how different would the allocation between
household and non-household be based on the movement in outstanding debt
from 31 March 2013 to 31 March 2014);
a revised table R3 and R4 with capital costs and depreciation allocated in
accordance with our guidance;
a calculation of what the allocation of costs would be between household and
non-household using the correct customer number ratio for dual service
customers of 1.3 and allocating debt management between household and non-
household in accordance with our guidance (on a sample basis if required); and
where this calculation gives a difference to the current business plan allocation in
excess of our materiality threshold for allocations between household and non-
household (greater than 2% of R4 line 1) reallocate these costs in tables R3 and
R4.
A5.2.2 Adjustments
In table A5.3 below, we outline Thames Water’s proposed average cost to serve
(ACTS) adjustments and our assessment of these proposals. The adjustments
proposed by Thames Water and Ofwat are quantified in table A5.3. Our approach to
assessing adjustment claims is set out in the household retail technical appendix.

Draft price control determination notice: company-specific appendix – Thames Water
51
Table A5.3 Thames Water proposals for ACTS adjustments
Adjustment assessment criteria
Adjustment Value
(£m
over
2015-
20)
Materiality Beyond
efficient
management
control
Impact
company in
materially
different way
Value of
adjustment
appropriate
Thames
Tideway
Tunnel
13.5 Fail n/a n/a n/a
Thames Water sought an ACTS adjustment for increased retail costs due to the
Thames Tideway Tunnel (TTT). Thames Water proposes that this adjustment is
necessary to cover additional costs (principally comprising bad debt and
commissions) that arise from Thames Water acting as the principal to the billing
arrangements with the Infrastructure Provider6. The value of the company’s
proposed adjustment in its original business plan was £24.9m, but Thames Water
reduced this to £13.5m in its revised business plan.
We reject Thames Water’s proposal for an ACTS adjustment for increased retail
costs due to the Thames Tideway Tunnel (TTT). Thames Water’s revised adjustment
value is no longer material and, hence in line with our methodology, cannot be
allowed as an adjustment to the ACTS.
Regardless of the materiality of the proposed adjustment, Thames Water did not
provide sufficiently convincing and consistent evidence regarding the scale of the
impact of TTT-related bill increases on its retail costs vis-à-vis other drivers of these
retail costs.
Thames Water’s evidence on its management practices relating to the costs for
which an adjustment was sought (bad debt, customer contacts and commissions)
was mixed and, in some instances, incomplete.
6 The Infrastructure Provider is the entity that will undertake the tunnelling activities in respect of the
delivery of the Thames Tideway Tunnel.

Draft price control determination notice: company-specific appendix – Thames Water
52
Table A5.4 Household retail adjustments (£ million, nominal prices)
2015-16 2016-17 2017-18 2018-19 2019-20 Total
Adjustments proposed in Thames Water’s business plan
Thames Tideway Tunnel 1.035 1.796 2.802 3.758 4.094 13.485
Pension deficit repair
costs
1.555 1.555 1.555 1.555 1.555 7.776
Adjustments included
in business plan
2.590 3.351 4.357 5.313 5.649 21.261
Adjustments included in draft determination
Thames Tideway Tunnel 0.000 0.000 0.000 0.000 0.000 0.000
Pension deficit repair
costs
1.627 1.627 1.627 1.627 1.627 8.137
Adjustments included
in draft determination
1.627 1.627 1.627 1.627 1.627 8.137
Note:
There will be no indexation for retail price controls.
A5.2.3 New costs
In table A5.4 below, we outline Thames Water’s proposed ‘new costs’ and our
assessment of these proposals. The new costs included in this draft determination
are quantified in table A5.5.
Table A5.5 Thames Water proposals for household retail new costs
New costs assessment criteria
Value (£m
over 2015-
20)
Materiality Need Options and
CBA
Robustness
of costs
Customer
protection
86.9 Fail Fail Fail Fail Pass
Thames Water sought an allowance for new costs associated with a new billing
system. The value of the company’s proposed adjustment was £73.4m. An
investment of £25.7m in a new billing system was also included in Thames Water’s
business plan for the previous price control period, 2010-15.

Draft price control determination notice: company-specific appendix – Thames Water
53
In addition, the £13.5m for additional retail costs due to TTT are included in the new
cost assessment. These have not been allowed as an adjustment as they are
immaterial.
Thames Water also included a net incremental reduction in expenditure of £-10.2m
in its business plan due to the following outcomes:
Outcome A: Improve customer service by ‘doing the basics’ to an excellent
standard and by getting things 'right first time';
Outcome B: Offer a choice of easy to use contact options; and
Outcome C: Improve cash collection from those customers that can pay
and helping those customers who are struggling to pay.
The change in expenditure associated with these outcomes has not been factored
into the calculation of new costs or the setting of household retail expenditure as this
was identified late in our process. These changes to expenditure and the evidence
supporting them will be considered when setting final determinations.
Thames Water’s proposed new costs are not material regardless of whether the
additional retail costs due to TTT are included or excluded. This is because the
increases in costs are offset by Thames Water’s forecast efficiency savings.
However, funding for a billing system was included in both the company’s 2010 –
2015 business plan and the 2015 – 2020 business plan. As the funding included in
the previous price control was not spent replacing the billing system, we are
concerned that allowing for this investment in the 2015 – 2020 period would result in
customers paying twice. We raised this concern at the risk-based review conducted
in early 2014, and have consequently reassessed the evidence supporting this
specific cost:
The need for the investment is supported by an assessment of the risks of
continuing to use old systems and the benefits of improving customer service.
Thames Water has provided evidence setting out its view that the proposed
investments are cost-beneficial, although there are some issues with this
evidence. The costs and benefits of several options are not quantified and so the
proposed solution is not demonstrated to be the most cost beneficial.
There is no evidence that the costs have been market tested or otherwise shown
to be robust.
The SIM will provide some protection to customers. In addition, customers are
protected from failure to make this investment through an ODI, which we have
intervened on to strengthen the penalties, as the original proposal gives
significant leeway for late delivery. There is no customer recompense for the fact

Draft price control determination notice: company-specific appendix – Thames Water
54
that the funding that Thames Water has already received for this investment has
been invested elsewhere.
As these proposed new costs do not result in material increases in Thames Water's
costs due to other efficiency savings (ie the costs remain below the materiality
threshold), we have allowed these new costs in our draft determination. However,
our final decision regarding these new costs will be made in Thames Water‘s final
determination and we would expect to see further evidence supporting these
investments, as well as proposals for how to protect customers in the event that the
investment does not deliver as envisaged. We will also consider whether short-falling
is required for the investments in the previous price control period.
Table A5.6 New household retail costs (£/customer)
Value
Modification made to 2013-14 CTS for ACTS calculation 0.0
Note:
There will be no indexation for retail price controls from this 2012-13 price base.
A5.3 Calculating the allowed revenues
Using the average industry allowances per customer and the projected customer
numbers in the company’s revised business plan; we have calculated the total
allowed household retail revenues including the efficiency challenge and the
household retail net margin.
For the purposes of calculating the retail net margin we have included revenue
arising from the TTT control and the pass through of revenue to the IP. In calculating
the effect of the margin we have reallocated the revenue that Thames Water implies
will be passed to the IP in 2015-16 to 2016-17. This is consistent with the approach
Thames Water has proposed for the IP given the appointment of the IP is expected
to be after bills have been issued for 2015-16. As the actual revenue that will be
passed through to the IP is not known at this stage we will consider a true-up for the
impact on the pass through of revenue to the IP on the calculation of the net margin
when we next set price controls, if material.
A5.3.1 Net margins
The table below shows the household retail net margin over 2015-20.

Draft price control determination notice: company-specific appendix – Thames Water
55
Table A5.7 Household retail net margins (%)
2015-16 2016-17 2017-18 2018-19 2019-20
Household retail net margin 1.00% 1.00% 1.00% 1.00% 1.00%
Table A5.8 below sets out the components of the allowed household retail revenue.
Table A5.8 Components of the allowed household retail revenue (nominal prices)
2013-14 2015-16 2016-17 2017-18 2018-19 2019-20
Company cost to serve (£/customer)
Unmetered single service
customers
20.29
Unmetered water and
wastewater customers
26.38
Metered water only
customers
35.89
Metered wastewater only
customers
23.82
Metered water and
wastewater customers
42.16
Industry average cost to serve (£/customer)
Unmetered single service
customers
21.02
Unmetered water and
wastewater customers
27.11
Metered water only
customers
24.37
Metered wastewater only
customers
33.66
Metered water and
wastewater customers
27.33
Allowed cost to serve1 (£/customer)
Unmetered single service
customers
19.49 19.94 19.80 19.86 19.05

Draft price control determination notice: company-specific appendix – Thames Water
56
2013-14 2015-16 2016-17 2017-18 2018-19 2019-20
Unmetered water and
wastewater customers
25.33 25.92 25.74 25.82 24.76
Metered water only
customers
32.70 30.77 28.24 25.92 25.10
Metered wastewater only
customers
22.96 23.36 23.17 23.18 22.36
Metered water and
wastewater customers
38.73 36.94 34.38 32.08 31.02
Total allowed (£ million)
Cost to serve (excluding
net margin)
144.5 147.4 146.1 145.6 142.9
Forecast household
wholesale charge
(including forecast RPI2)3
1,816.1 1,948.3 2,053.1 2,191.6 2,332.4
Household retail revenue
(including an allowance for
the net margin)4
161 165 164 165 163
Notes:
There will be no indexation for retail price controls.
1. Allowed cost to serve includes pension deficit repair costs. 2. The household wholesale charge includes forecast RPI so that the total household retail revenue can be
displayed on the same price base as other retail costs. 3. The allocation of allowed wholesale revenue to different wholesale charges will be at the company’s
discretion, subject to charging rules and licence conditions. Wholesale charges includes IP revenue for the purposes of calculating retail margin.
4. This number is indicative as allowed revenue will depend upon actual customer numbers.
A5.4 Uncertainty mechanisms
We outline our approach to uncertainty mechanisms in the risk and reward technical
appendix. In table A5.9 below, we set out Thames Water’s proposed household retail
uncertainty mechanisms and our assessment of these proposals.
Table A5.9 Thames Water proposals for household retail uncertainty mechanisms
Thames Water proposals Our assessment

Draft price control determination notice: company-specific appendix – Thames Water
57
Thames Water did not propose any
uncertainty mechanisms beyond those that
will already form part of the regulatory
framework for 2015-20.

Draft price control determination notice: company-specific appendix – Thames Water
58
A6. Non-household retail
In the non-household retail technical appendix, we outline our overall approach to
the non-household retail price control. Further information regarding our
observations on companies’ proposals for their non-household retail price controls is
set out in IN 14/14 – 2014 price review – non-household customer engagement
ahead of draft determination representations.
In this chapter, we provide details of Thames Water’s non-household retail draft
determination.
A6.1 Indicative non-household retail total revenue
Table A6.1 below shows the indicative total of non-household allowed revenue. The
table is indicative, as it does not assume any gains or losses from competition or
impacts from the company charging customers at levels different to the relevant
default tariffs for the projected customers in each customer type.
Table A6.1 Indicative non-household retail total revenue price control including
net margins (£ million, nominal prices)
2015-16 2016-17 2017-18 2018-19 2019-20
Indicative non-household
retail total revenue price
control including net margins
29 30 30 31 31
Note:
There will be no indexation for retail price controls from this price base. The non-household wholesale charge
includes forecast RPI so that the total non-household retail revenue can be displayed on the same price base as
other retail costs. Figures exclude retail services to developers and revenues associated with miscellaneous
charges. Retail revenue has been calculated using wholesale revenue that includes IP revenue for the purposes
of calculating retail margin.
A6.2 Net margins
The company proposed net margins that summated in aggregate to 2.5%. This is in
line with our risk and reward guidance. We have therefore accepted the company’s
proposals.
Draft price control determination notice: company-specific appendix – Thames Water
59
A6.3 Cost proposals
Below we set out our interventions on the company’s costs, including for:
Consistency with existing policy, including for example ensuring that
companies’ cost information is presented in a consistent price base and
pension deficit costs are presented as per our stated policy; and
Cost escalation, including for example material new investments or increases
in costs or requests for input cost allowances.
The table requirements stipulated the use of 2012-13 prices. The company did not
deflate its costs; therefore we have deflated its submission from 2013-14 prices to
2012-13 prices.
In ‘IN 13/17: Treatment of companies’ pension deficit repair costs at the 2014 price
review’ we explained how we would treat the costs associated with water companies
reducing the deficits in their defined benefit pension schemes at the 2014 price
review. Where companies’ proposals have differed from our calculations we have
over-written their proposals in line with our overall approach.
This resulted in the company’s proposals being adjusted from £1.000 million over the
control period, to £1.304 million.
Overall the company’s proposed costs increase by more than our non-household
retail materiality threshold of 5.3% between 2015 and 2020. We therefore assessed
the evidence presented in the company’s plan.
The company proposed £4 million for ‘additional activity preparing for market
opening’, and £4.6 million for ‘central market costs’. Both these items are costs
associated with preparing for market opening, and as such, should be supported by
evidence on their size and need. Sufficient evidence in this area has not been
provided.
In addition, the company has submitted a capex plan totalling £26.2 million covering
base IT capex of around £5.7 million, and investment to replace the company’s old
legacy customer billing system of around £20.5 million.
The company refers to the same supporting appendix as for the IT investment in the
household retail control, even though the company is proposing to develop two
distinct systems, one for household and one for non-household. The referenced
appendix makes little reference to the investment in the non-household control,

Draft price control determination notice: company-specific appendix – Thames Water
60
focusing on the larger household customer billing system. There is therefore
insufficient evidence on the need, costs or benefits for a new customer relationship
management and billing system (CRM) for non-household customers. Furthermore,
there is no clear explanation of how the value of this investment was derived. We
have therefore reduced the company’s new costs down to our materiality threshold.
In total (including the pension deficit repair cost and price base adjustments), this
resulted in the company’s proposed costs being adjusted from £116.136 million over
the control period to £96.170 million.

Draft price control determination notice: company-specific appendix – Thames Water
61
A7. Appointee
In this section we discuss at an appointee level:
bills and k factors;
return on regulated equity
financeability; and
affordability
A7.1 Bills and K factors
Table A7.1 below sets out the allowed revenues we have assumed in our draft
determination for Thames Water to deliver its:
statutory duties;
outcomes; and
associated performance commitments.
It also sets out the average customer bills on the basis of the draft determination.
Table A7.1 Thames Water’s draft determination – K factors, allowed revenues and
customer bills (in 2012-13 average prices)A
2015-16 2016-17 2017-18 2018-19 2019-20 Total
Wholesale water –
allowed revenues
(£m)1
790.7 790.5 791.2 793.6 800.6 3,966.7
Wholesale water –
K (%)2 0.00% -0.02% 0.18% 0.12% 0.69%
Wholesale
wastewater (excl.
TTT) – allowed
revenues (£m)
871.4 874.5 879.6 885.2 893.6 4,404.3
Wholesale
wastewater (excl.
TTT)2 – K (%)
0.00% 0.35% 0.70% 0.44% 0.76%
TTT only – allowed
revenues (£m) 37.9 41.2 43.6 45.8 47.4 215.9

Draft price control determination notice: company-specific appendix – Thames Water
62
2015-16 2016-17 2017-18 2018-19 2019-20 Total
TTT2, 5 only – K (%) 0.00% 8.81% 6.03% 4.74% 3.24%
Retail household
allowed revenue
(£m)
160.7 164.6 164.3 164.9 163.4 817.8
Retail non-household
expected revenue
(£m)
29.1 29.7 30.1 30.7 31.3 151.0
Average household
bill – water (£) 197 196 194 193 193
Average household
bill – wastewater
(excl. TTT) (£)
154 158 155 154 154
Average household
bill – TTT only (£)5 6 6 7 7 7
Average household
bill – wastewater incl.
TTT (£)
160 165 162 161 161
Average household
bill – combined (£)3, 4 339 343 338 337 337
Average household
bill – IP (£), 6 2 6 12 20 26
Average household
bill – incl. IP (£) 341 349 350 357 363
Average household
bill – TTT and IP only
(£)
8 12 19 27 33
Notes:
A Wholesale and TTT figures in 2012-13 prices and retail figures in nominal prices.
1. The allowed revenue for our draft determination is based on an implied menu choice. The company will have the opportunity to make its own menu choice, which will impact on its allowed revenues and customers’ bills.
2. As discussed in the wholesale water and wastewater technical appendix, K is set to zero for 2015-16 for wholesale water and wastewater because there are no directly equivalent wholesale revenues for 2014-15 (because of the new price review structure). As such, there is no reference point against which to express a change in K.
3. The average combined household bill is not equal to the sum of the average household water bill and the average household wastewater bill due to the use of the economies of scope factor in the household retail price control.
4. It should be noted the average household bill illustrated above reflects a notional allocation (by Ofwat but based on the company’s split of household and non-household customers) of the overall wholesale revenue

Draft price control determination notice: company-specific appendix – Thames Water
63
requirement across Thames Water’s household and non-household customer base. In practice, this will depend upon the structure of wholesale charges implemented by Thames Water.
5. We have not attempted to profile the TTT bill impact. 6. The average household bill that relates to the IP is uncertain at this stage. The IP revenues are not
determined by Ofwat in the IP’s construction phase. Instead this will be determined by a competitive procurement exercise and the terms of the IP’s licence. The bill profile presented here is the one estimated by Thames Water in its June plan.
We note that customer bills in the regulatory period from 2020 will be affected by
Thames Water’s performance in the forthcoming regulatory period in relation to costs
and the regulatory incentives in place for performance delivery and revenue
projection performance.
The bills for Thames Water's customers receiving its wastewater services will also
include the Thames Tideway Tunnel activities undertaken by Thames Water (TTT
Control) and the Infrastructure Provider (IP). The exact bill impact arising from the IP
is uncertain at this stage. Thames Water included an estimate of the impact on
customers’ bills in its June submission which is represented in the table above.
A7.2 Return on regulated equity range
We set out our approach to calculating the expected range in RoRE in the risk and
reward technical appendix. The composition of the RoRE range for Thames Water at
an appointee level is shown in table A7.2 and Figure A7.1 below.
Table A7.2 Thames Water’s RoRE ranges
Lower bound (%)
(appointee)
Upper bound (%)
(appointee)
Overall -4.8% +2.8%
ODIs -1.8% +0.5%
Totex -2.0% +1.4%
Financing -0.7% +0.7%
SIM -0.4% +0.2%
Commentary:
The whole company RoRE range is from 0.9% to 8.5%, with a base case of 5.7%. This
translates to a downside impact of -4.8% and an upside variance of +2.8% as shown in the
table.
Thames Water has modelled totex performance variance by applying a Monte Carlo
methodology to detailed data about its underlying cost drivers and to macro-economic

Draft price control determination notice: company-specific appendix – Thames Water
64
variables. We consider its approach to be robust and the resultant RoRE impacts, ranging
from -2.0% to +1.4%, are broadly in line with other companies. We have not made any
adjustments for our interventions on totex or inclusion of menu for TTT Control costs.
The ODI range proposed by Thames Water was from -1.1% to +0.6%. We have adjusted this
to -1.8% to +0.5% to take account of the interventions in respect of the TTT control.
Thames Water’s estimate for financing risk, which is ±0.7% of RoRE, assumed
autocorrelation , as well as the variation in interest rates. Thames Water modelled the
spread between corporate bond rates and UK government rates in a similar way. We
consider that this approach overestimates financing risk in a number of ways. For example it
treats forecast and non-forecast changes in interest rates as the same and it treats UK
government rates and corporate interest rate spreads as independent. However, as
financing risk is a relatively small component of the RoRE range, we have not intervened to
adjust the rate for the purpose of draft determination and will consider any further evidence
on appropriate range in final determination.
Thames Water has estimated its SIM range based on maximum reward and penalties (+6%
to -12% of household revenue) reflecting its view that it would be feasible for it to achieve a
SIM outturn at either end of the range. While Thames Water has had the lowest SIM score of
any water company for the last two years, we consider that this range is appropriate given
the company’s ambition in this area.
Figure A7.1 Thames Water RoRE range – appointee
Source:
Ofwat calculations based on information from Thames Water

Draft price control determination notice: company-specific appendix – Thames Water
65
A7.3 Financeability
We have compared the financial ratios provided by Thames Water and our
calculation of its financial ratios implied by the company’s business plan proposals
submitted on 27 June, when both are prepared on a notional basis. We illustrate
these in table A7.3 below. The final column of table A7.3 sets out the financeability
ratios based on our draft determination revenues and costs.
Table A7.3 Company and Ofwat notional financial ratio calculations based on the
company business plan and notional financial ratios based on our draft
determination
Financial ratios for
notional company
Financial ratio
calculations based on the
company business plan
(average 2015-20)
Financial ratio
calculations based on our
draft determination
(average 2015-20)
Company
calculation
Ofwat
calculation
Cash interest cover 2.59 2.68 2.82
Adjusted cash interest cover
ratio (ACICR) – base case
(average over five years)
1.25 1.31 1.40
Funds from operations/debt 7.38% 7.99% 8.64%
Retained cash flow/debt 4.99% 5.51% 6.10%
Gearing 64.62% 64.80% 64.17%
Dividend cover (profit after
tax/dividends paid)
0.63 0.74 0.94
Regulatory equity/regulated
earnings for the regulated
company
18.12 16.59 16.66
RCV/EBITDA 12.45 12.02 11.57
Commentary:
Financial ratios: Thames Water has provided Board assurance that it is financeable on an
actual and notional basis. On a notional basis its target credit rating is BBB+. Thames
Water consider its notional financeability ratios are consistent with a BBB rating. These
ratios are set out above. In order to meet its target rating, it has proposed to adjust notional
dividends and increase the level of index linked debt to improve its financial ratios. Thames

Draft price control determination notice: company-specific appendix – Thames Water
66
Water believes that on the basis of these adjustments, it is financeable on the notional
capital structure, but that this would not provide a return which is commensurate with the
risk which equity assumes. Thames Water has provided third party assurance on its
notional financeability. Our notional ratios are above the company’s calculations, taking
account of our interventions in its plan and also appear broadly consistent with the
company’s target ratios as set out in its plan. As set out below, Thames Water has elected
not to use PAYG ratios to manage any financeability issues following adoption of the
wholesale cost of capital and retail margins consistent with risk and reward guidance. This
has resulted in ratios that are below many other companies on a notional basis. Consistent
with PR14 methodology, we expect companies to take responsibility for their financeability
and to appropriately balance customer and company interests in their use of PAYG/RCV
run off rates. Thames Water has proposed to pass through the full benefits of weighted
average cost of capital (WACC) reduction in 2015-20 period and this results in lower ratios,
nonetheless these are still consistent with an investment grade credit rating. On this basis
we consider that there is sufficient evidence that the company is financeable for the draft
determination.
PAYG changes: Thames Water has slightly adjusted its PAYG rates from its December
plan – from 57% to 58% for water and from 45% to 42% for wastewater. The June plan is
broadly neutral on PR09 equivalent basis. The PAYG rate is 100% of opex plus IRE and
101% of opex plus IRE expensed, with Thames Water expensing 96% of its IRE.
Pass through of WACC reduction: Thames Water has not materially adjusted its PAYG
or RCV run offs in response to the reduction in the WACC between December and June.
Therefore all the benefit of the WACC reduction has been passed back to customers in
2015-20.
Conclusion on intervention: As our financial ratios are higher than Thames Water's,
consistent with an investment grade credit rating and the company’s ratios reflect its
decision on how to use PAYG and RCV run off rates we consider that the draft
determinations are financeable and we do not propose to intervene in the company’s plan
on the grounds of financeability. As the company has passed through all of the WACC
change to customers in 2015-20 then we do not propose to intervene on PAYG. The
company will need to consider the implications of our wholesale cost interventions in the
draft determination for its choice of PAYG and RCV run off rates in its response to the draft
determination, including appropriate engagement with its CCG. Any engagement with
customers on financeability should be undertaken on the basis of notional financeability.
Table A7.4 sets out the PAYG and RCV run-off rates which shows whether revenue
has been brought forward compared to the December plan and the impact that this
has on RCV growth and longer term affordability and financeability. This also reflects
our adjustments to PAYG and RCV run-off rates to ensure that wastewater and TTT
Control revenues are correct, following our assessment of costs in relation to the
TTT Control as set out in section A3.3.2.
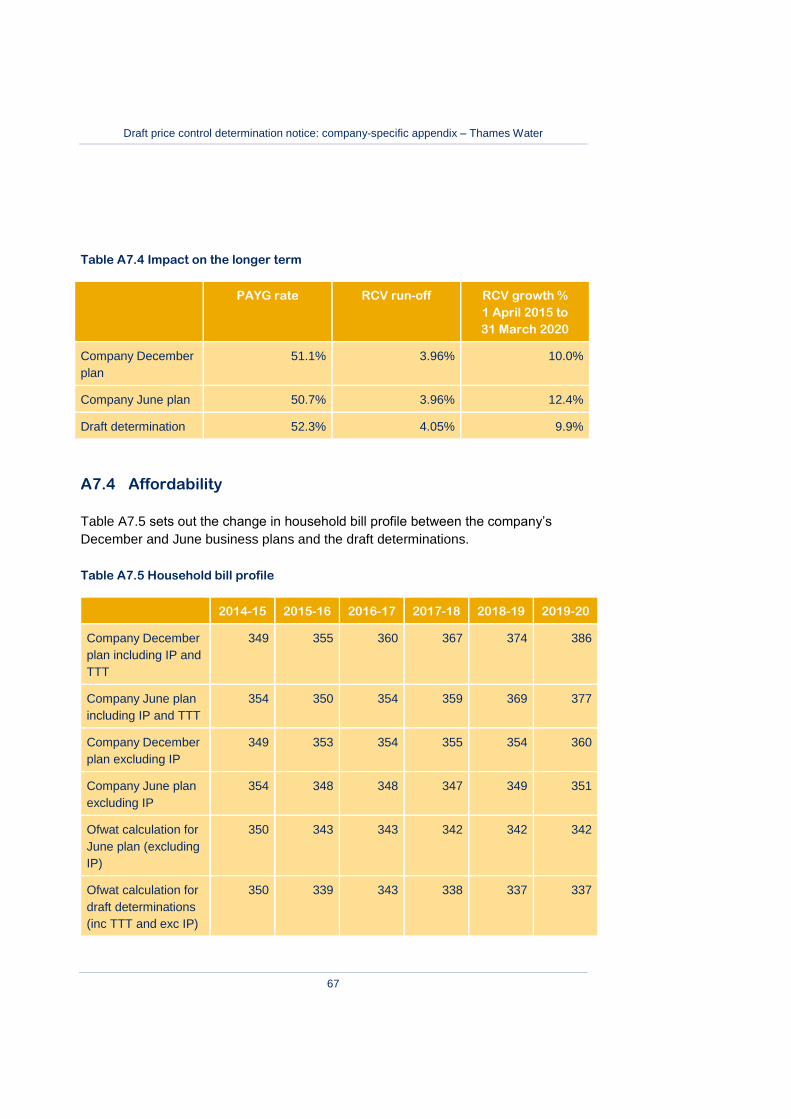
Draft price control determination notice: company-specific appendix – Thames Water
67
Table A7.4 Impact on the longer term
PAYG rate RCV run-off RCV growth %
1 April 2015 to
31 March 2020
Company December
plan
51.1% 3.96% 10.0%
Company June plan 50.7% 3.96% 12.4%
Draft determination 52.3% 4.05% 9.9%
A7.4 Affordability
Table A7.5 sets out the change in household bill profile between the company’s
December and June business plans and the draft determinations.
Table A7.5 Household bill profile
2014-15 2015-16 2016-17 2017-18 2018-19 2019-20
Company December
plan including IP and
TTT
349 355 360 367 374 386
Company June plan
including IP and TTT
354 350 354 359 369 377
Company December
plan excluding IP
349 353 354 355 354 360
Company June plan
excluding IP
354 348 348 347 349 351
Ofwat calculation for
June plan (excluding
IP)
350 343 343 342 342 342
Ofwat calculation for
draft determinations
(inc TTT and exc IP)
350 339 343 338 337 337

Draft price control determination notice: company-specific appendix – Thames Water
68
2014-15 2015-16 2016-17 2017-18 2018-19 2019-20
Company
assessment of IP bill
impact
0 2 6 12 20 26
DD average
household bill
including IP
350 341 349 350 357 363
DD average
household bill
excluding TTT and IP
350 334 336 332 330 329
DD average
household bill TTT
- 6 6 7 7 7
Companies have not necessarily used the same method of calculating household
bills as Ofwat – for example, we have included economies of scope for household
retail when calculating combined water and sewerage bills. So the Ofwat calculations
are not directly comparable to the company plans. We have not intervened to
reprofile bills as the draft determination’s bill profile is similar to the company’s
business plan, albeit starting from a lower level.
Table A7.6 sets out the reasons why this draft determination is assessed as
affordable. It describes key changes in relation to Thames Water’s December
business plan that we assessed as unaffordable. We note in particular that the
company has a range of measures in place to support customers with affordability
problems which we assess as sufficient. We have introduced a performance
commitment that requires Thames Water to engage with its customers to build
understanding of the Thames Tideway Tunnel project.

Draft price control determination notice: company-specific appendix – Thames Water
69
Table A7.6 Business plan affordability assessment
Commentary
Acceptability In the risk-based review assessment of affordability, we
identified Thames Water as required to submit further evidence
to demonstrate the affordability of its plan. Thames Water had
used an econometric model to predict that 78% of its customers
would find its December submission acceptable. However, the
company did not provide the underlying data for its model; we
were unable to replicate the results and the results were not
consistent with evidence gathered directly from customers in the
same or similar surveys.
The company has responded to our challenge by conducting
further research in June 2014. This ‘Final acceptability testing’
discarded the econometric modelling approach in the
company’s December submission. Instead it was able to test
the bill profile consistent with its June submission directly with a
representative sample of customers.
Overall, 59% of respondents stated that the company’s plan
with the TTT was acceptable and without the TTT acceptability
rose to 85%. The company tested its plan with customers from
each of its wastewater only areas (where other WoCs provide
the water service). Acceptability in these areas was slightly
lower at 55%.
17% of household respondents identified concerns with
affordability as the reason for finding the plan unacceptable.
This equates to roughly 1 in 6 and is broadly consistent with the
1 in 8 who identified that they always or sometimes struggle to
pay their bills. 46% of these respondents stated the plan was
acceptable compared to 57% who stated they do not have any
problems paying their bills.
Identification of
affordability issues and
appropriate support
measures
During our risk-based review we found the range of measures in
place to support customers with affordability problems as
sufficient. Nevertheless the company has added to the package
of support albeit driven by external factors outside of the price
review. The company will now donate a £10m tax refund from
HMRC to its Customer Assistance Fund (that helps customers
in arrears to become regular payers). This increases donations
in 2015-20 from around £12m to around £22m. Combined with
the proposals in its December plan that included a new social
tariff and customer visits we have concluded that its package of
measures is appropriate to assist customers with affordability

Draft price control determination notice: company-specific appendix – Thames Water
70
Commentary
problems.
Longer-term
affordability – cost
recovery tools
During the risk-based review, we concluded that the company
had not directly engaged with its customers on future
affordability. We also concluded that there appeared to be
significant increases in PAYG for water and wastewater
between 2015-20 and 2020-25 and that the impact of these
movements on customers’ bills had not been explained or that
customers supported them.
The company has addressed our challenges in two ways. Its
new acceptability research included an additional question on
the acceptability of the likely bill profile between 2020-25 and
dedicated research exploring customers’ support for moving
revenue between the two price control periods.
The company’s final acceptability testing found that a forecast
bill level of £70 to £80 above the current bill level in 2020-25
was found to be acceptable to 42% of respondents and
unacceptable to 48%.
The company research into bill profiles linked to revenue
allocation found a clear preference from participants for steadily
increasing bill profiles during 2015-25 over profiles that delayed
price increases until the later years.
The company states it has not used PAYG for affordability or
financeability reasons and it has only used RCV run off rates to
smooth customer bills.
Overall, the company has successfully explored customer
preferences for price movements and revenue collection over
time. The company has also clearly identified customer levels of
acceptability for possible price changes between 2020 and
2025. Although it has identified that there is a lack of customer
support for longer term price increases associated with the TTT,
the company does set out plans to continually engage with its
customers on this issue. This includes communicating across a
range of media, an ongoing research programme to monitor
changing views, promotion of support measures such as its
social tariff and ongoing engagement with hard-to-reach groups.
The CCG also supports the need for the company to have a
dedicated strategy for communicating with all its wastewater
customers throughout 2015-20 its justification for the Tunnel
and its cost. The CCG would also expect Thames Water to work
in close co-operation with the water only companies that bill on
its behalf.

Draft price control determination notice: company-specific appendix – Thames Water
71
Commentary
Consistent with these views we have introduced a performance
commitment that will require Thames Water to engage with its
customers to build understanding of the project.
Longer-term
affordability – ODIs
The company carried out customer research to establish the
level of support for different ODI options. The research found
that predictability of bills was important to almost all customers
to allow them to budget and manage their bills. However, there
was also support for bills to be linked to service and
performance although having a limit to the scope of possible
impact on bills was an important caveat. Most customers were
shown to support a bill range linked to performance of +/- 1% to
1.5% which has the potential to add between £8 and £12 to
customer bills. The company’s CCG supported the Company’s
approach to its new customer research and thought the
company’s plan appropriately represented consumers’ views.

Draft price control determination notice: company-specific appendix – Thames Water
72
Annex 1 Wholesale costs
Establishing draft determination thresholds
Our approach to establishing draft determination thresholds is outlined in the
wholesale water and wastewater technical appendix.
In the tables below, we provide some information on the company-specific numbers
that support these calculations.
We also provide detail on our cost assessment for the TTT control.
Further information about our assessment of each claim is set out in the populated
version of draft determination initial cost threshold models.
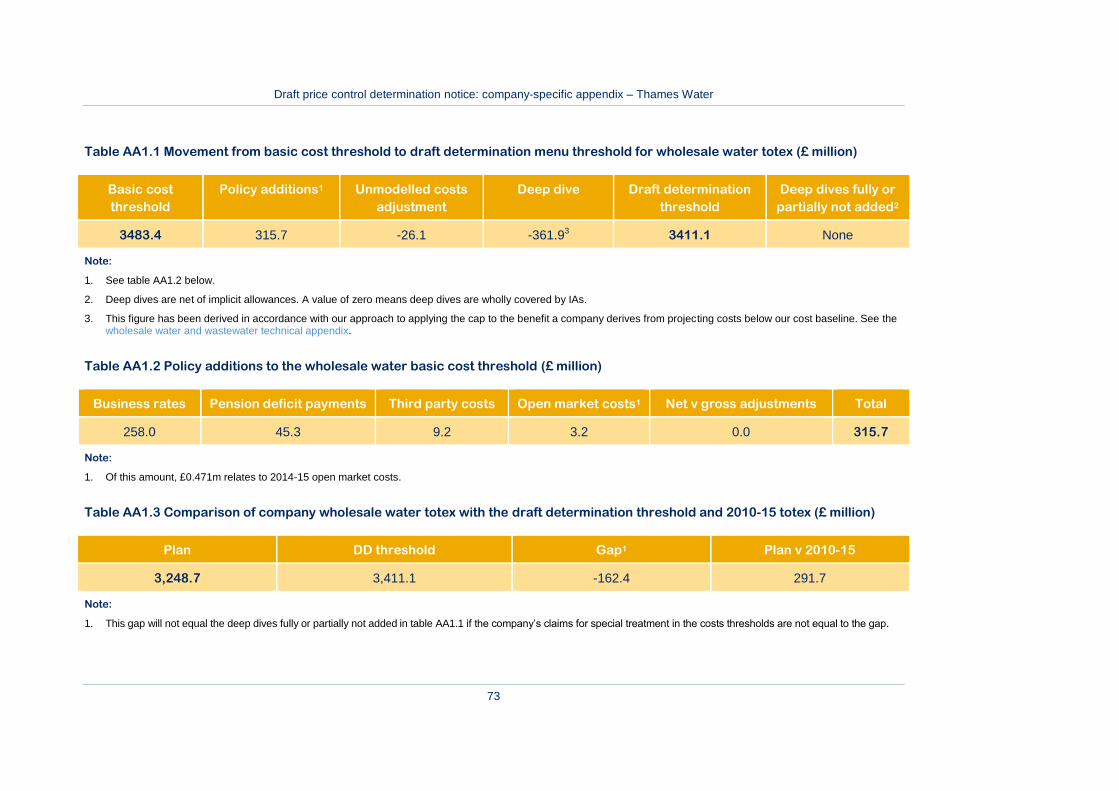
Draft price control determination notice: company-specific appendix – Thames Water
73
Table AA1.1 Movement from basic cost threshold to draft determination menu threshold for wholesale water totex (£ million)
Basic cost
threshold
Policy additions1 Unmodelled costs
adjustment
Deep dive Draft determination
threshold
Deep dives fully or
partially not added2
3483.4 315.7 -26.1 -361.93 3411.1 None
Note:
1. See table AA1.2 below.
2. Deep dives are net of implicit allowances. A value of zero means deep dives are wholly covered by IAs.
3. This figure has been derived in accordance with our approach to applying the cap to the benefit a company derives from projecting costs below our cost baseline. See the wholesale water and wastewater technical appendix.
Table AA1.2 Policy additions to the wholesale water basic cost threshold (£ million)
Business rates Pension deficit payments Third party costs Open market costs1 Net v gross adjustments Total
258.0 45.3 9.2 3.2 0.0 315.7
Note:
1. Of this amount, £0.471m relates to 2014-15 open market costs.
Table AA1.3 Comparison of company wholesale water totex with the draft determination threshold and 2010-15 totex (£ million)
Plan DD threshold Gap1 Plan v 2010-15
3,248.7 3,411.1 -162.4 291.7
Note:
1. This gap will not equal the deep dives fully or partially not added in table AA1.1 if the company’s claims for special treatment in the costs thresholds are not equal to the gap.

Draft price control determination notice: company-specific appendix – Thames Water
74
Table AA1.4 Wholesale water deepdive claims
Company proposal Assessment DD allowance
Claim Amount
sought
Implicit
allowance
Need CBA Robust costs Assessment Amount
allowed
The company has made no wholesale water deep-dive claims
Table AA1.5 Movement from basic cost threshold to draft determination threshold for wholesale wastewater totex (£ million)
Basic cost
threshold
Policy
additions
Unmodelled costs
adjustment
Private sewage
pumping stations
NEP5 Deep dive Draft
determination
threshold
Deep dives
fully or partially
not added2
3,059.1 238.9 -63.3 94.3 130.2 262.3 3,721.3 121
Note:
1. See table AA1.6 below. 2. Deep dives are net of implicit allowances. A value of zero means deep dives are wholly covered by IAs.
Table AA1.6 Policy additions to the wholesale wastewater basic cost threshold (£ million)
Business rates Pension deficit payments Third party costs Open market costs1 Net v gross adjustments Total
174.0 41.7 20.0 3.2 0.0 238.9
Note:
1. Of this amount, £0.480m relates to 2014-15 open market costs.

Draft price control determination notice: company-specific appendix – Thames Water
75
Table AA1.7 Comparison of company wholesale wastewater totex with the draft determination threshold and 2010-15 totex
(£ million)
Plan DD threshold Gap Plan v 2010-15
3,743.6 3,721.3 22.3 -1,797.9
Note:
1. This gap will not equal the deep dives fully or partially not added in table AA1.5 if the company’s claims for special treatment in the costs thresholds are not equal to the gap.
Table AA1.8 Summary of wholesale wastewater deep dive assessments (excluding TTT)
Company proposal Assessment DD allowance
Claim Amount
sought
Implicit
allowance
Need CBA Robust costs Assessment Amount
allowed
Environmental
compliance (NEP5
only)
130.2 0 Pass Pass Pass Accept 130.2
Deephams STW 206.6 7.0 Pass Pass Partial pass Accept 199.6
Lee Tunnel
including Shaft G
61.7 0 Pass Pass Pass Accept 61.7
Hydraulic sewer
flooding
protection:
Counters Creek
256.8 170.2 Pass Pass Fail Reject 0

Draft price control determination notice: company-specific appendix – Thames Water
76
Company proposal Assessment DD allowance
Claim Amount
sought
Implicit
allowance
Need CBA Robust costs Assessment Amount
allowed
Hydraulic sewer
flooding
protection: named
schemes; flips;
infiltration
reduction,
mitigation, opex
101.2 67.1 Fail Fail Fail Reject 0
Note:
1. In its June submission the company also included representations on the totex models. Our analysis and conclusions on this claim have been set out in annex 1 to the wholesale water and wastewater technical appendix.
Its June business plan submission set out Thames TTT costs as a cost exclusion claim to the wholesale wastewater control. It further split these into three sub-menu exclusion claims relating to Thames Water's view of whether the costs were for: typical activities; atypical activities (depending on whether these were assessed to carry a level of risk that was broadly consistent with the rest of its regulated activities); or land acquisition activities. In addition, within Thames Water's business plan these costs were broken down into individual cost areas and principal activities within those cost areas. able AA1.9 Summary of TTT Control deepdive assessment
Company proposal Assessment DD allowance
Claim Amount
sought
Need CBA Robust costs Customer
protection
Assessment Amount allowed
Resilience £109.6m Pass Fail Fail Fail Fail £0m
Risk £135.9m Pass n/a Partial Pass n/a Partially accept £30.3m

Draft price control determination notice: company-specific appendix – Thames Water
77
Company proposal Assessment DD allowance
Claim Amount
sought
Need CBA Robust costs Customer
protection
Assessment Amount allowed
Inflation £13.8m Pass n/a Fail Fail Fail £0m
Construction £209.8m Pass Pass Partial Pass Partial Pass Partially accept £182.1m
Land £83.7m Partial Pass n/a Partial Pass Fail Partially accept £51.0m
Indirect costs £63.9m Partial Pass Partial Pass Partial Pass Fail Partially accept £21.3m
Development
costs2
£18.0m Pass n/a Pass Fail Partially accept £18.0m
Corporate
overheads2
£21.1m Pass n/a Pass Fail Partially accept £21.1m
Notes:
1. Thames submitted one cost exclusion claim (divided into three menu exclusion claims). We have broken down the claim into the separate cost areas and assessed them on each of the gateways. Table AA1.10 sets these challenges out in more detail.
2. Development costs and corporate overheads have only been partially accepted due to their failure under the customer protection gateway. Because we passed the costs under need and robust costs tests we included the costs in full. However, this allowance is subject to Thames Water's representations on performance commitments, incentives and other issues for example, planning and indirect costs.
3. See section A4 for more information on TTT price control.

Draft price control determination notice: company-specific appendix – Thames Water
78
Annex 2 Household retail revenue modification
We outline our approach to revenue modification in the household retail price control
in the household retail technical appendix.
Table AA2.1 sets out the amount per customer, by customer type, that allowed
revenues will be modified by if outturn customer numbers differ from forecast
customer numbers. Table AA2.2 sets out the baseline number of customers.
Table AA2.1 Household retail allowed revenue modification factors by class of
customer (£/customer)
Revenue modification per: 2015-16 2016-17 2017-18 2018-19 2019-20
Unmetered water only customer 21.66 22.27 22.26 22.49 21.77
Unmetered wastewater only
customer
21.66 22.27 22.26 22.49 21.77
Unmetered water and
wastewater customer
28.16 28.95 28.93 29.24 28.30
Metered water only customer 36.35 34.37 31.74 29.35 28.69
Metered wastewater only
customer
25.52 26.09 26.04 26.24 25.56
Metered water and wastewater
customer
43.05 41.26 38.65 36.33 35.46
Note:
There will be no indexation for retail price controls
Table AA2.2 Assumed number of customers for household retail total revenues
(000s)
Number of customers 2015-16 2016-17 2017-18 2018-19 2019-20
Unmetered water only 32.1 32.1 32.1 32.1 32.1
Unmetered wastewater only 1109.3 992.5 872.7 751.5 637.1
Unmetered water and
wastewater
2154.7 2070.2 1956.9 1826.8 1693.8
Metered water only 15.5 15.5 15.5 15.5 15.5
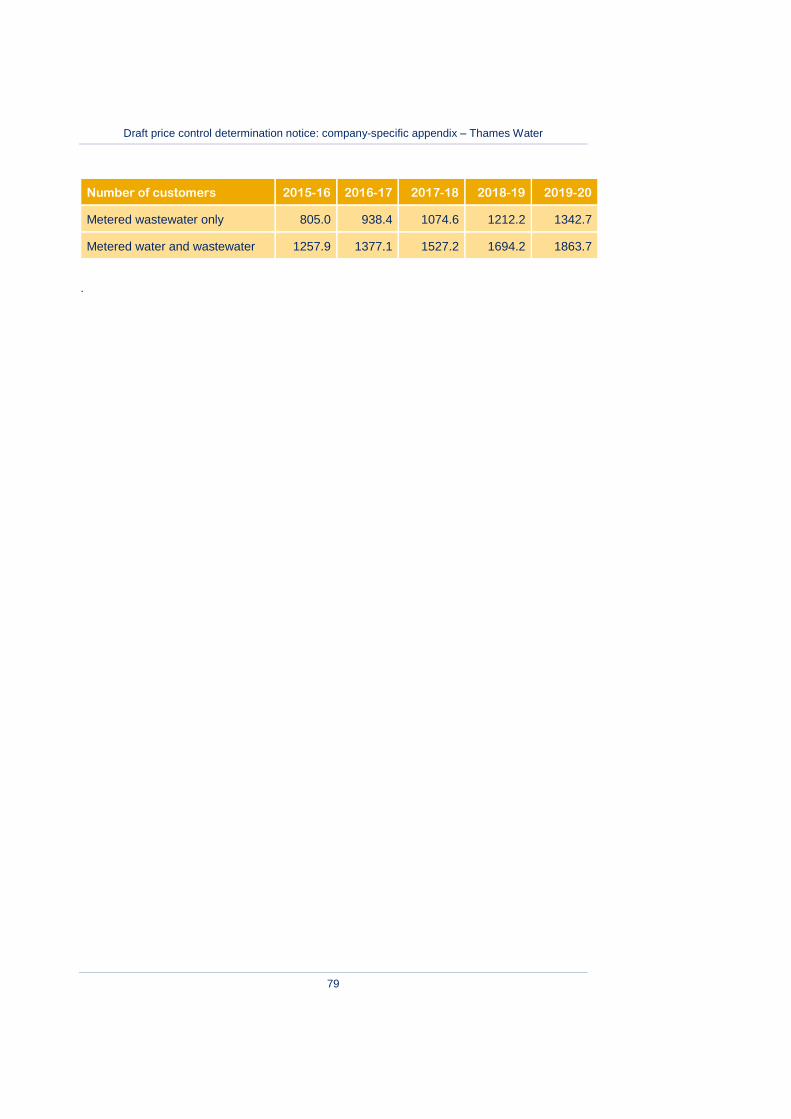
Draft price control determination notice: company-specific appendix – Thames Water
79
Number of customers 2015-16 2016-17 2017-18 2018-19 2019-20
Metered wastewater only 805.0 938.4 1074.6 1212.2 1342.7
Metered water and wastewater 1257.9 1377.1 1527.2 1694.2 1863.7
.

Draft price control determination notice: company-specific appendix – Thames Water
80
Annex 3 Reconciling 2010-15 performance
We set out our methodology for calculating the adjustments to 2015-20 wholesale price controls resulting from the company’s
actual performance during the 2010-15 period in the wholesale water and wastewater technical appendix.
In this annex, we set out the draft determination adjustments to 2015-20 price controls for Thames Water resulting from the
company’s actual performance during the 2010-15 period.
As part of the draft determination of the 2010-15 adjustments we have undertaken detailed calculations within our models for the
RCM, OIA, CIS and serviceability shortfalls. While we have included an explanation of our interventions within this annex, each
model covers the detail of the specific calculation. Similarly, our detailed calculations behind the midnight adjustments such as land
sales (but excluding those relating to the change protocol) are contained within the RCV midnight adjustment model. A copy of any
of these models is available on request.
Table AA3.1 below compares the company’s view of the required revenue adjustments included in its revised business plan for
each of the incentive tools for water and wastewater services, with our own view. Our view reflects our understanding of the
company’s performance using these incentives, based on information provided in its revised business plan and subsequent query
responses. The table also shows other adjustments, such as those relating to tax resulting from the company’s actual performance
during the 2010-15 period.
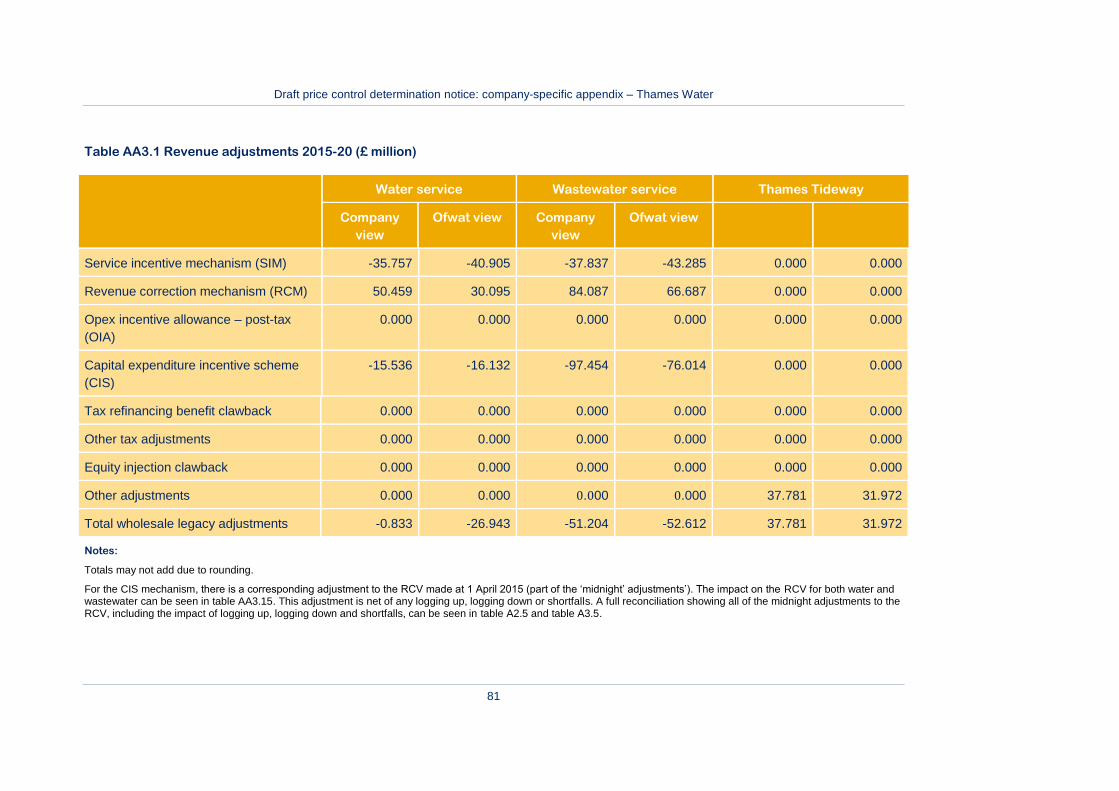
Draft price control determination notice: company-specific appendix – Thames Water
81
Table AA3.1 Revenue adjustments 2015-20 (£ million)
Water service Wastewater service Thames Tideway
Company
view
Ofwat view Company
view
Ofwat view
Service incentive mechanism (SIM) -35.757 -40.905 -37.837 -43.285 0.000 0.000
Revenue correction mechanism (RCM) 50.459 30.095 84.087 66.687 0.000 0.000
Opex incentive allowance – post-tax
(OIA)
0.000 0.000 0.000 0.000 0.000 0.000
Capital expenditure incentive scheme
(CIS)
-15.536 -16.132 -97.454 -76.014 0.000 0.000
Tax refinancing benefit clawback 0.000 0.000 0.000 0.000 0.000 0.000
Other tax adjustments 0.000 0.000 0.000 0.000 0.000 0.000
Equity injection clawback 0.000 0.000 0.000 0.000 0.000 0.000
Other adjustments 0.000 0.000 0.000 0.000 37.781 31.972
Total wholesale legacy adjustments -0.833 -26.943 -51.204 -52.612 37.781 31.972
Notes:
Totals may not add due to rounding.
For the CIS mechanism, there is a corresponding adjustment to the RCV made at 1 April 2015 (part of the ‘midnight’ adjustments’). The impact on the RCV for both water and wastewater can be seen in table AA3.15. This adjustment is net of any logging up, logging down or shortfalls. A full reconciliation showing all of the midnight adjustments to the RCV, including the impact of logging up, logging down and shortfalls, can be seen in table A2.5 and table A3.5.
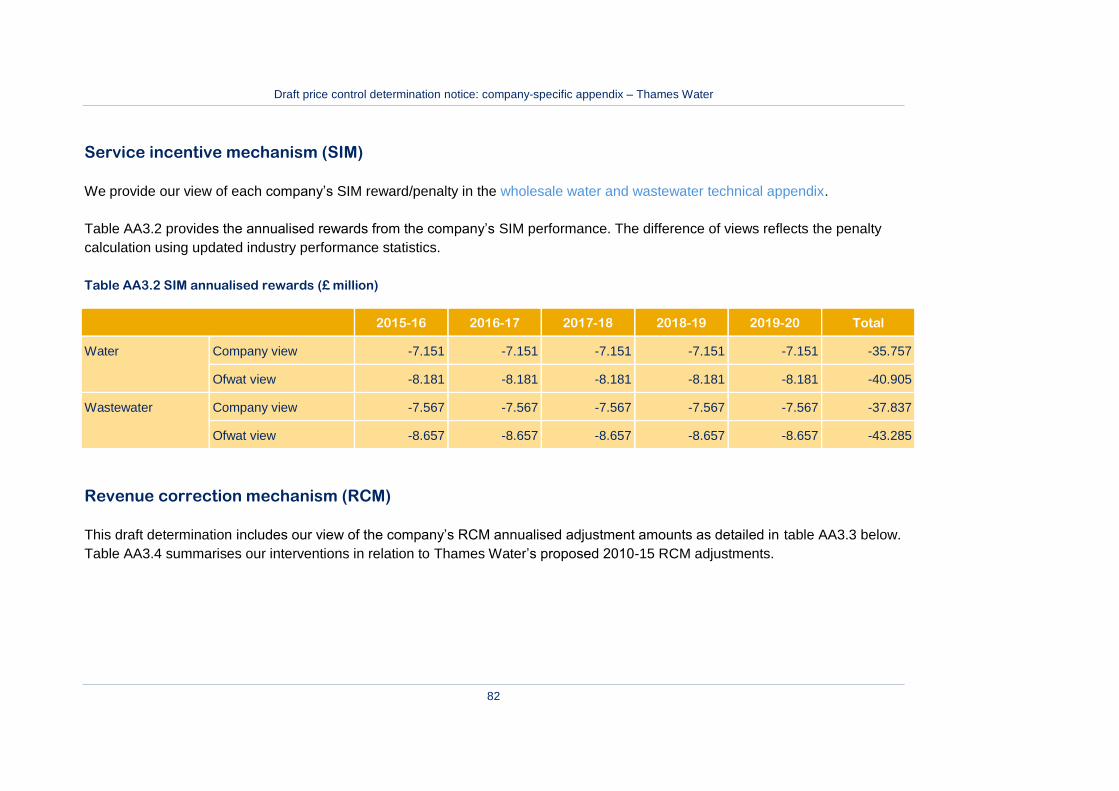
Draft price control determination notice: company-specific appendix – Thames Water
82
Service incentive mechanism (SIM)
We provide our view of each company’s SIM reward/penalty in the wholesale water and wastewater technical appendix.
Table AA3.2 provides the annualised rewards from the company’s SIM performance. The difference of views reflects the penalty
calculation using updated industry performance statistics.
Table AA3.2 SIM annualised rewards (£ million)
2015-16 2016-17 2017-18 2018-19 2019-20 Total
Water Company view -7.151 -7.151 -7.151 -7.151 -7.151 -35.757
Ofwat view -8.181 -8.181 -8.181 -8.181 -8.181 -40.905
Wastewater Company view -7.567 -7.567 -7.567 -7.567 -7.567 -37.837
Ofwat view -8.657 -8.657 -8.657 -8.657 -8.657 -43.285
Revenue correction mechanism (RCM)
This draft determination includes our view of the company’s RCM annualised adjustment amounts as detailed in table AA3.3 below.
Table AA3.4 summarises our interventions in relation to Thames Water’s proposed 2010-15 RCM adjustments.

Draft price control determination notice: company-specific appendix – Thames Water
83
Table AA3.3 RCM annualised adjustments for 2015-20 (£ million)
2015-16 2016-17 2017-18 2018-19 2019-20 Total
Water Company view 10.092 10.092 10.092 10.092 10.092 50.459
Ofwat view 6.019 6.019 6.019 6.019 6.019 30.095
Wastewater Company view 16.817 16.817 16.817 16.817 16.817 84.087
Ofwat view 13.337 13.337 13.337 13.337 13.337 66.687
Table AA3.4 Interventions on proposed 2010-15 RCM adjustments
Area of intervention What we did Why we did it
Back billing amounts Our assumptions for the draft determination did not
include the back-billed amounts claimed by the
company.
We have concerns as to whether the back billing
amounts being claimed by the company are compliant
with RAG4.04 and IN11/04.
The company has not demonstrated that:
it has received all outstanding back-billed
amounts due from the customer;
it has claimed for back-billed amounts where
the inaccuracy of the charging is the
customer’s fault; and
it has taken a reasonable, fair and appropriate
approach for the back-billed amounts claimed.
The company’s proposed alternative approach to
recognising the back-billed amounts based on its cash

Draft price control determination notice: company-specific appendix – Thames Water
84
Area of intervention What we did Why we did it
collection rates has not been fully evidenced and so
we have not included it in our determination
assumptions.
FD09 assumptions Adjusted for our assumptions applied at FD09. There are differences between the company’s and our
view of the FD09 determination applied in the
company’s populated RCM model.
Number of households billed Our assumptions for the draft determination use the
data the company submitted in its business plan
table R3 to calculate our view of the RCM
adjustment compared with the values in the
company RCM model.
There were inconsistencies with the number
households billed between business plan table R3
and the company’s populated RCM model.
Outturn financial year average
RPI
Our assumptions for the outturn financial year
average RPI, in the draft determination, use the
data that the company submitted in its business
plan table A9 to calculate our view of the RCM
adjustment compared with the values in the
company RCM model.
There are inconsistencies with the outturn financial
year average RPI between table A9 and the
company’s populated RCM model.
Operating expenditure incentive allowance (OIA)
Table AA3.5below summarises the company’s view and our view of the incentive allowances for 2015-20. Table AA3.4 summarises
our interventions in relation to Thames Water’s proposed 2010-15 OIA adjustments.

Draft price control determination notice: company-specific appendix – Thames Water
85
Table AA3.5 Operating expenditure incentive allowances for 2015-20 (£ million)
2015-16 2016-17 2017-18 2018-19 2019-20 Total
Water service
Incentive allowance
(post-tax)
Company view 0.000 0.000 0.000 0.000 0.000 0.000
Ofwat view 0.000 0.000 0.000 0.000 0.000 0.000
Wastewater service
Incentive allowance
(post-tax)
Company view 0.000 0.000 0.000 0.000 0.000 0.000
Ofwat view 0.000 0.000 0.000 0.000 0.000 0.000
Table AA3.6 Interventions on proposed 2010-15 OIA adjustments
Area of intervention What we did Why we did it
There are no interventions in this
area.
n/a n/a
Change protocol (logging up, logging down and shortfalls)
Table AA3.7 and table AA3.8 below summarise Thames Water’s view and our baseline view of total adjustments to:
capex included in the CIS reconciliation;

Draft price control determination notice: company-specific appendix – Thames Water
86
adjustments for Thames Tideway Tunnel; and
the FD09 opex assumptions used in the calculation of the opex incentive revenue allowances.
Table AA3.9 summarises our interventions in relation to Thames Water’s proposed change protocol adjustments.
Table AA3.7 Summary of post-efficiency capex for logging up, logging down and shortfalls (£ million)
2009-10 to 2014-15 – post-
efficiency capex
Water service Wastewater service Total service
Company view Ofwat view Company view Ofwat view Company view Ofwat view
Logging up (two-sided) 0.000 0.000 73.806 76.149 73.806 76.149
Logging down (two-sided) 0.000 0.000 -222.165 -229.951 -222.165 -229.951
Shortfalls (one-sided) 0.000 -5.788 0.000 0.000 0.000 -5.788
Thames Tideway Tunnel3 596.983 481.529 596.983 481.529
Notes:
1. Includes two-sided adjustments from the PR09 agreed overlap programme as set out in table AA3.13.
2. We exclude shortfalls for serviceability from the CIS reconciliation, but instead make direct adjustments to the RCV in 2015-16. We do this to allow the actual capex the
company incurred in seeking to maintain serviceability, to be reflected in the rewards or penalties earned through the scheme. This is also to ensure customers are not
required to pay for the regulatory output the company has failed to deliver.
3. Thames Tideway Tunnel was not included in CIS at PR09. This logging up forms part of the opening RCV for the TTT Control

Draft price control determination notice: company-specific appendix – Thames Water
87
Table AA3.8 Summary of post-efficiency opex for logging up, logging down and shortfalls included in the opex incentive allowance
calculation (£ million)
2009-10 to 2014-15 – post-
efficiency opex
Water service Wastewater service Total service
Company view Ofwat view Company view Ofwat view Company view Ofwat view
Logging up 0.000 0.000 39.176 27.318 39.176 27.318
Logging down 0.000 0.000 -1.471 -1.462 -1.471 -1.462
Shortfalls 0.000 -0.518 0.000 0.000 0.000 -0.518
Shortfalls for serviceability 0.000 0.000 -3.691 -3.691 -3.691 -3.691
Table AA3.9 Interventions on proposed 2010-15 change protocol adjustments (includes Thames Tideway Tunnel)
Area of intervention What we did Why we did it
Security and Emergencies
Measures Direction (SEMD)
delays – Shortfall
The company did not propose a legacy
adjustment in relation to the delivery risk
associated with the SEMD programme on the
grounds of triviality. Several elements of the
programme are currently at risk of slippage into
the next price control period, 2015-20.
We have assessed the information provided by
the company and determined that a shortfall
should be applied to reflect the late delivery.
We are shortfalling £6.050m capex and £0.544m
The company has not included the relevant SEMD
schemes in the overlap programme. As the outputs
are still to be delivered, albeit late, it is therefore
appropriate to assess the variance to FD09
assumptions as a shortfall. Triviality does not apply in
the case of the shortfalling mechanism. In
determining the shortfall amount we have utilised
values from FD09. These have been indexed (using
COPI for capex and RPI for opex) to 2012-13 prices.

Draft price control determination notice: company-specific appendix – Thames Water
88
Area of intervention What we did Why we did it
opex.
In post efficiency terms these values are
£5.788m (capex) and £0.518m (opex).
Private Sewers – Logging up We have applied a challenge to the capex
proposed. We have reduced the pre-efficiency
capex from the £25.74m proposed by the
company to £23.991m.
We have also applied a challenge to the opex
proposed as we considered the claimed costs
were not entirely attributable to the transfer, did
not entirely represent additional costs or were
not adequately substantiated. As a result we
have reduced the pre-efficiency opex from the
£39.65m proposed by the company to
£27.632m.
In post-efficiency terms the value of the logging
up claim is now £22.531m (capex) and
£27.250m (opex).
Our view of costs is based on our determination of
the company’s 2013 IDoK application, revised in the
light of new information.
Consequently our assessment has changed due to
the extra information provided.
In particular, our view has changed in two key areas:
i) revised data from all companies has altered the
industry average unit costs (capex per collapse and
opex per blockage) consequently the gap between
the company’s unit costs and the industry average,
and ii) the disapplication of catch-up and ongoing
efficiency adjustments that were made in error at the
risk-based review to costs that already incorporated
an efficiency challenge.
Shaft G – Logging up There are no interventions for this scheme. We are
accepting the company’s proposed logging up claim
There are no interventions for this scheme. We are
accepting the company’s proposed logging up claim
Counters Creek – Logging up There are no interventions for this scheme. We are
accepting the company’s proposed logging up claim
There are no interventions for this scheme. We are
accepting the company’s proposed logging up claim
DG5 Sewer Flooding Programme We have applied a challenge to the pre- The company based its approach using figures
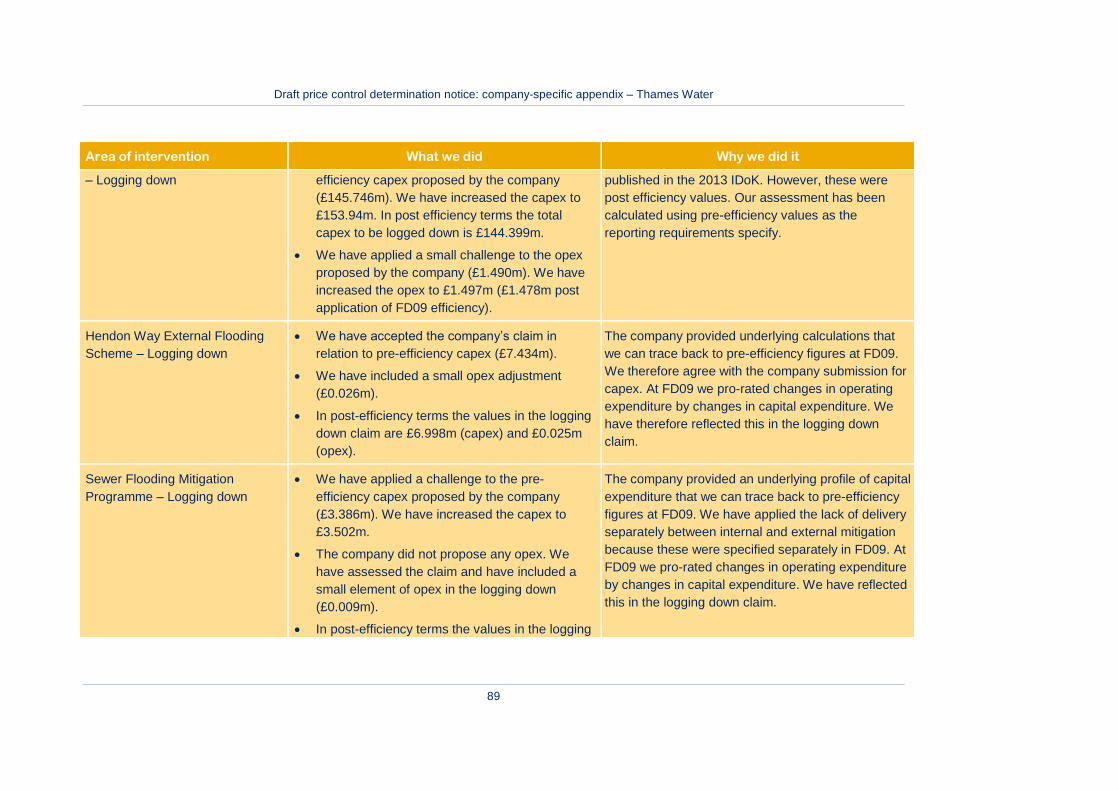
Draft price control determination notice: company-specific appendix – Thames Water
89
Area of intervention What we did Why we did it
– Logging down efficiency capex proposed by the company
(£145.746m). We have increased the capex to
£153.94m. In post efficiency terms the total
capex to be logged down is £144.399m.
We have applied a small challenge to the opex
proposed by the company (£1.490m). We have
increased the opex to £1.497m (£1.478m post
application of FD09 efficiency).
published in the 2013 IDoK. However, these were
post efficiency values. Our assessment has been
calculated using pre-efficiency values as the
reporting requirements specify.
Hendon Way External Flooding
Scheme – Logging down
We have accepted the company’s claim in
relation to pre-efficiency capex (£7.434m).
We have included a small opex adjustment
(£0.026m).
In post-efficiency terms the values in the logging
down claim are £6.998m (capex) and £0.025m
(opex).
The company provided underlying calculations that
we can trace back to pre-efficiency figures at FD09.
We therefore agree with the company submission for
capex. At FD09 we pro-rated changes in operating
expenditure by changes in capital expenditure. We
have therefore reflected this in the logging down
claim.
Sewer Flooding Mitigation
Programme – Logging down
We have applied a challenge to the pre-
efficiency capex proposed by the company
(£3.386m). We have increased the capex to
£3.502m.
The company did not propose any opex. We
have assessed the claim and have included a
small element of opex in the logging down
(£0.009m).
In post-efficiency terms the values in the logging
The company provided an underlying profile of capital
expenditure that we can trace back to pre-efficiency
figures at FD09. We have applied the lack of delivery
separately between internal and external mitigation
because these were specified separately in FD09. At
FD09 we pro-rated changes in operating expenditure
by changes in capital expenditure. We have reflected
this in the logging down claim.

Draft price control determination notice: company-specific appendix – Thames Water
90
Area of intervention What we did Why we did it
down claim are £3.302m (capex) and £0.009m
(opex).
Deephams upgrade scheme –
Logging down
There are no interventions for this scheme. We are
accepting the company’s proposed logging down
claim.
There are no interventions for this scheme. We are
accepting the company’s proposed logging down
claim
Lee Tunnel – Logging down There are no interventions for this scheme. We are
accepting the company’s proposed logging down
claim.
There are no interventions for this scheme. We are
accepting the company’s proposed logging down
claim
Thames Tideway Tunnel: Land –
logging up
Total intervention £46.5m comprised of:
Reversal of Thames Water's accrued
deferred lease payments in 2013-14 (£5.2m).
Adjustment to the company’s claim for land
costs in 2014-15 by £42.6m in customers’
favour.
£2.7m due to difference in income
assumptions.
About £4m higher due to difference in allocation
between land and other costs. Overall cost neutral
to Thames.
We do not consider customers should pay for
deferred payments before Thames Water incurs
them.
Thames’ June business plan stated that its view of
land costs had increased from its 2014-15 forecast
(presented to us in February 2014). One reason was
an acquisition slipping from 2013-14 to 2014-15.
However, the cost of this site was included in
Thames Water's February forecast for land
acquisition and therefore no uplift is required. We
consider this request is double counting
Thames’ plan did not clearly set out its income
assumptions. We have therefore used the view of
income included in Thames Water interim
determination application in 2013.

Draft price control determination notice: company-specific appendix – Thames Water
91
Area of intervention What we did Why we did it
Thames Tideway Tunnel: Other
costs (‘non-land’) – logging up
Total intervention £68.9m comprised of:
£65m reduction to Thames Water's 2014-15
costs.
About £4m reduction due to difference in
allocation between land and other costs.
Thames has not provided sufficient evidence to justify
proposed costs for 2014-15 and why these are
economic and efficient. Thames Water’s submission
forecast costs of £187m, which contradicts evidence
provided to us elsewhere. Our assessment is based
on Thames Water’s July 2014 programme board
report which forecast 2014-15 ‘non-land’ expenditure
to be lower than Thames Water's business plan
proposal. We have applied a ten per cent efficiency
challenge due to insufficient evidence that costs are
efficient.
Service standard outputs
The final determination supplementary reports in 2009 contained defined project(s) where the primary output was the service
standard specified7. These outputs were set out to recognise that companies may decide to prioritise investment differently in order
7 In the final determination supplementary reports we said: “Both the project activity (as proposed in your final business plan) and the service standard are the
defined output. You must demonstrate delivery of the stated service standard output through the June return. The service standard output is the primary output. We recognise that companies may decide to prioritise activity differently in order to achieve the service output in a more efficient manner. All material changes to the project activity must be reported and explained through your June return.”

Draft price control determination notice: company-specific appendix – Thames Water
92
to achieve the service output in a more innovative and efficient manner, while still holding the company to account for the benefits
to customers and the environment.
Where companies have not reported progress on these service standards, we would have expected them to demonstrate
achievement of the service standards to both customers and Ofwat as part of the price review process.
We have considered applying shortfalls equal to the cost of the FD09 project(s) with defined service standards. However, in many
cases there is some evidence that the projects and activities have been delivered, but there is a lack of compelling evidence that
the service standards specified have been achieved.
For the purposes of these draft determinations, we will not applying shortfalls on this issue conditional upon this
information being provided as part of companies’ draft determination representations. We would expect companies to
respond to this issue in their representations. If they do not provide adequate evidence to demonstrate achievement of the service
standards set out, then they should assume that we will apply a shortfall equal to the costs assumed for the project(s) at FD09
within our final determinations in December 2014.
Serviceability performance
Table AA3.10 below summarises our serviceability assessments for Thames Water and table AA3.11 quantifies the value and
impact of any serviceability shortfall on the RCV. Table AA3.12 summarises our interventions in relation to Thames Water’s
proposed adjustments for serviceability.

Draft price control determination notice: company-specific appendix – Thames Water
93
Table AA3.10 Serviceability assessments for 2010-151
2010-11 2011-12 2012-13 2013-14 2014-152
Water (infrastructure) Company view Stable Stable Stable Stable Stable
Ofwat view Stable Stable Stable Marginal Marginal
Water (non-
infrastructure)
Company view Stable Stable Stable Stable Stable
Ofwat view Stable Stable Stable Stable Stable
Wastewater
(infrastructure)
Company view Stable Stable Marginal Marginal Stable
Ofwat view Stable Marginal Deteriorating Deteriorating Deteriorating
Wastewater (non-
infrastructure)
Company view Stable Stable Stable Stable Stable
Ofwat view Stable Stable Stable Stable Stable
Notes:
1. Assessments are based on actual and forecast performance submitted in the company’s revised business plans. 2. Assessments for 2014-15 are based on forecast data and are subject to review once actual performance data becomes available.
Table AA3.11 Impact of serviceability shortfalls on the RCV (£ million)
2009-10 to 2014-15 Water Wastewater Total
Amount subtracted from RCV Company view 0.0 -16.1 -16.1
Ofwat view -18.0 -38.1 -56.1

Draft price control determination notice: company-specific appendix – Thames Water
94
Table AA3.12 Interventions on proposed 2010-15 serviceability adjustments
Area of intervention What we did Why we did it
Unplanned interruptions to supply
exceeding 12 hours
For the purposes of the draft determination, we have
assumed a shortfall adjustment of £19.5m (£18.0m
post efficiency) for marginal performance in this
indicator. In accordance with our shortfall calculation
methodology the shortfall (which has been applied
for 2013-14) has not been capped, the scaling
factor8 for this year is below 2 standard deviations.
The overall scale of the shortfall does not exceed
50% of the sub-service capital expenditure and
therefore no further cap has been applied.
We would expect the company to demonstrate its
latest performance as part of its representations and
in advance of the final determination.
The company has had two breaches of the upper
control limit in 2010-11 and 2013-14. The company
states that there were two events in 2013-14 that
resulted in a large number of unplanned interruptions.
The company states that these events were caused
by power failures that occurred due to severe
weather in the winter of 2013-14. Based upon the
commentary provided by the company, we consider
that the company has not provided sufficient
evidence to demonstrate that the interruptions to
supply that occurred were outside of its control and
could not have been mitigated by company action.
The company has not evidenced that all possible
mitigation measures were in place to minimise the
impact of the supply interruptions (such as alternative
supplies and alternative power generators).
Therefore for the purposes of the draft determination
we have assumed a shortfall adjustment for this
8 Shortfall calculation methodology is detailed within the wholesale water and wastewater technical appendix 3.

Draft price control determination notice: company-specific appendix – Thames Water
95
Area of intervention What we did Why we did it
indicator.
Pollution incidents (Cat 1, 2 and
3)
For the purposes of the draft determination, we have
calculated a scale of shortfall that is greater than
that offered by the company. The company’s
proposed shortfall was £10.8m, we have calculated
a shortfall of £26.6m (£24.4m post efficiency) for
deteriorating performance in this indicator. In
accordance with our shortfall calculation
methodology we have applied a cap at 2 standard
deviations to the shortfall in each year between
2012-13 and 2013-14, to limit the impact of specific
measures and scaling factors9. The overall scale of
the shortfall does not exceed 50% of the sub-service
capital expenditure and therefore no further cap has
been applied.
We would expect the company to demonstrate its
latest performance as part of its representations and
in advance of the final determination.
The company has had two breaches of the upper
control limit, in 2012-13 and 2013-14, they are also
predicting to be above the upper control limit in 2014-
15. The company has recognised the performance as
marginal and offered a shortfall of £10.8m. However,
we do not consider the company’s own valuation of
the shortfall to be sufficient for the level of failure.
Therefore for the purposes of the draft determination
the assumed shortfall is based on our calculation.
9 The shortfall calculation methodology is detailed within the wholesale water and wastewater appendix.

Draft price control determination notice: company-specific appendix – Thames Water
96
Area of intervention What we did Why we did it
Flooding other causes For the purposes of the draft determination, we have
calculated a scale of shortfall that is greater than
that offered by the company. The company’s
proposed shortfall was £4.3m, we have calculated a
shortfall of £11.0m (£10.1m post efficiency) for
deteriorating performance in this indicator. In
accordance with our shortfall calculation
methodology the shortfall (which has been applied
for 2011-12, 2012-13 and 2013-14) has not been
capped, the scaling factors10 in these years are
below 2 standard deviations. The overall scale of the
shortfall does not exceed 50% of the sub-service
capital expenditure and therefore no further cap has
been applied.
We would expect the company to demonstrate its
latest performance as part of its representations and
in advance of the final determination.
The company has had three breaches of the upper
control limit in 2011-12, 2012-13 and 2013-14. The
company states that performance is recovering and is
forecasting performance to be below the upper
control limit in 2014-15. The company has recognised
the performance as marginal and has offered a
shortfall of £4.3m. However, we do not consider the
company’s own valuation of the shortfall to be
sufficient for the level of failure. Therefore for the
purposes of the draft determination the assumed
shortfall is based on our calculation.
10 Shortfall calculation methodology is detailed within the wholesale water and wastewater appendix.

Draft price control determination notice: company-specific appendix – Thames Water
97
Area of intervention What we did Why we did it
Sewer blockages For the purposes of the draft determination we have
assumed no intervention. We are accepting the
company’s proposed shortfall of £3.1m capex and
£3.7m opex.
The company has offered a shortfall for failure to
achieve the enhanced service level output for
blockages. We agree that the enhanced service level
has not been achieved and have accepted the
company proposed value.
The 2009 agreed overlap programme
Table AA3.13 below confirms the 2009 agreed overlap programme assumptions included in this draft determination. Table AA3.14
summarises our interventions in relation to Thames Water’s proposed adjustments for the PR09 agreed overlap programme.
Table AA3.13 PR09 agreed overlap programme adjustments and assumptions (£ million)
2010-15 2015-20
Two-sided adjustment for inclusion in the CIS Expenditure forecasts to complete the projects
Capex Opex Capex Opex
Water service Company view 0.000 0.000 0.000 0.000
Ofwat view 0.000 0.000 0.000 0.000
Wastewater service Company view 0.000 0.000 207.746 1.447
Ofwat view 3.987 0.000 207.746 1.447

Draft price control determination notice: company-specific appendix – Thames Water
98
Table AA3.14 Interventions on proposed 2010-15 PR09 agreed overlap programme adjustments
Area of intervention What we did Why we did it
Deephams STW upgrade We accepted the company’s proposed logging down
capex of £41.340m (pre efficiency) as agreed in the
IDoK due to delays in scheme delivery and we
accepted the company’s latest forecast totex to
complete the scheme.
The logging down value was confirmed in our IDoK
for the company in 2013. Because the cost of the
whole project is forecast to be lower than the original
FD09 assumptions post efficiency, we have accepted
the company’s latest totex forecast of £206.597m in
2015-20 to complete the scheme without further
challenge on the efficiencies.
Swindon network We have made a small logging up adjustment in
2010-15 to reflect the increased capex by the
company during the period compared to original
FD09 assumptions post efficiency.
We have accepted the company’s latest forecast
totex to complete the scheme.
The company is forecasting the whole cost of the
project to be lower than the original FD09
assumptions post efficiency. Therefore we have:
a) made a two-sided adjustment in 2010-15 to ensure
the company is not penalised in the CIS reconciliation
for the increased expenditure in the period; and
b) accepted the company’s lower totex forecast of
£2.596m in 2015-20 to complete the scheme without
further challenge on the efficiencies.
Capital expenditure incentive scheme (CIS)
Table AA3.15 provides details of the CIS ratios and performance incentive. It also gives the:
monetary amounts of the CIS performance reward or penalty;

Draft price control determination notice: company-specific appendix – Thames Water
99
true-up adjustment to 2015-20 allowed revenues; and
midnight adjustment to the closing 2014-15 RCV.
Table AA3.16 then sets out the profiled values of the revenue adjustments in each year 2015-20.
Table AA3.15 Legacy true-up adjustments
Water service Wastewater service Total service
Restated FD09 CIS bid ratio Company view 125.264 108.820
Ofwat view 125.700 124.806
Outturn CIS ratio Company view 107.171 99.907
Ofwat view 107.545 99.601
Incentive reward/penalty (%) Company view -2.841 -0.089
Ofwat view -2.885 0.484
Reward/penalty (£m) Company view -41.446 -2.699 -44.145
Ofwat view -41.934 14.652 -27.282
Adjustments to 2015-20 revenue (£m) Company view -14.466 -90.743 -105.209
Ofwat view -15.021 -70.779 -85.801
CIS adjustment to RCV (£m) Company view -75.655 -388.859 -464.514
Ofwat view -75.655 -388.859 -464.514

Draft price control determination notice: company-specific appendix – Thames Water
100
Water service Wastewater service Total service
Commentary:
The company has correctly applied the published Ofwat methodology.
In carrying out our assessment, we have included our view of the applicable change protocol amounts.
Notes:
The restated FD09 CIS bid ratio takes account of the adjustments for the change protocol (Table AA3.7) and the 2009 agreed overlap programme (table AA3.13).
The reward/(penalty) is adjusted for the additional income included in the 2010-15 determination and the financing cost on the difference between actual spend and capital expenditure assumed in the 2010-15 determination to derive the value of the adjustment to 2015-20 revenue.
The adjustment to 2015-20 revenue values shown in this table assume a single year adjustment in the first year, and do not include the NPV profiling used for the draft determination.
Table AA3.16 Profiled revenue adjustments from the CIS reconciliation (£ million)
2015-16 2016-17 2017-18 2018-19 2019-20 Total
Water Company view -3.107 -3.107 -3.107 -3.107 -3.107 -15.536
Ofwat view -3.226 -3.226 -3.226 -3.226 -3.226 -16.132
Wastewater Company view -19.491 -19.491 -19.491 -19.491 -19.491 -97.454
Ofwat view -15.203 -15.203 -15.203 -15.203 -15.203 -76.014
Other adjustments
Table AA3.17 below confirms the assumptions included in this draft determination with respect to the following adjustments:

Draft price control determination notice: company-specific appendix – Thames Water
101
tax refinancing benefit clawback;
other tax adjustments;
equity injection clawback; and
other adjustments.
Table AA3.17 Other adjustments 2015-20 (£ million)
Water service Wastewater
service
Thames Tideway
Commentary
Company
view
Ofwat
view
Company
view
Ofwat
view
Company
View
Ofwat
View
Tax
refinancing
benefit
clawback
0.000 0.000 0.000 0.000 No adjustment was proposed by the company.
Other tax
adjustments
0.000 0.000 0.000 0.000 No adjustment was proposed by the company.
Equity
injection
clawback
0.000 0.000 0.000 0.000 No adjustment was proposed by the company.
Other
adjustments
0.000 0.000 0.000 0.000
37.781 31.972
Adjustment to the RCV consist of a deduction of
£101.300 million in respect of s203 spend in 2005-
10 as proposed in the business plan and an
increase of £481.529m leading to a total of
£380.2m RCV adjustment for logged up amounts

Draft price control determination notice: company-specific appendix – Thames Water
102
Water service Wastewater
service
Thames Tideway
Commentary
Company
view
Ofwat
view
Company
view
Ofwat
view
Company
View
Ofwat
View
for the Thames Tideway Tunnel which were not
included in the CIS calculations. These
adjustments are made to the TTT Control.

Draft price control determination notice: company-specific appendix – Thames Water
103
Annex 4 Outcomes, performance commitments and outcome delivery incentives
This chapter sets out in detail the performance commitments and outcome delivery incentives (ODIs) for the company’s wholesale
water, wholesale wastewater, TTT and household retail outcomes, presented in that order.
The two figures below first provide an overview of these performance commitments and ODIs. Figure AA4.1 shows the balance
between reward and penalty, penalty only and reputational incentives in the package of incentives for the company and Figure
AA4.2 shows the potential financial impact of each of the financial incentives.
Figure AA4.1 The composition of the package of ODIs
Reward and penalty Penalty only Non-financial
Wholesale water 3 7 9
Wholesale wastewater 5 7 8
Thames Tideway Tunnel 0 1 2
Household retail 1 1 7
Total 9 16 26

Draft price control determination notice: company-specific appendix – Thames Water
104
Figure AA4.2 Overview of financial ODIs

Draft price control determination notice: company-specific appendix – Thames Water
105
Figure AA4.2 graph shows the potential financial consequences of the individual financial ODIs. The figures represent the penalties
and rewards associated with the p10 and p90 scenarios over the 5 years (2015-16 to 2019-20). This means there is a 10% chance
of performance being higher or lower than these assumed levels. In most cases the potential maximum will be bigger but is very
unlikely to occur. The p10 and p90 scenarios therefore represent a more realistic estimate of potential financial impacts.
As explained in the outcomes technical appendix, we are proposing the introduction of an aggregate cap on rewards and collar on
penalties from the outcome delivery incentives. Details of how the cap/collar will operate are set out in section A5 of the Outcomes
Technical Appendix.
There are a small number of specific exclusions from the cap/collar. For Thames Water, the exclusion is as follows: Thames
Tideway Tunnel: We will limit the extent of delays on the overall programme timeline
Tables AA4.3, AA4.4, AA4.5 and AA4.6 set out a more detailed explanation of our interventions in the company’s wholesale water,
wholesale wastewater, household retail and Thames Tideway Tunnel outcomes.
Table AA4.3 Summary of interventions on wholesale water outcomes, performance commitments and incentives
PC/ODI affected What we did Why we did it
B1 – Asset Health Water
Infrastructure
Removed the penalty collar
Removed the penalty deadband
Adjusted the penalty incentive
rate
Rolled forward the incentive
structure to include 2019-20
The interventions ensure that the company is incentivised to maintain
performance, and appropriate penalties are in place for under or poor
performance.
Thames Water proposed a collar of four changes in status across the
price control period, 2015-20. We do not consider that this provides
customers with adequate protection from serious deterioration in the
health of the non-infrastructure assets and have removed the collar
entirely.

Draft price control determination notice: company-specific appendix – Thames Water
106
PC/ODI affected What we did Why we did it
Thames Water proposed to include a penalty deadband which
required non-stable performance to be reported for two consecutive
years before a penalty is applied. We do not believe this appropriately
compensates customers for non-stable performance in a single year
and have removed the deadband completely.
The penalty incentive rate has been increased by 25% to provide an
additional incentive and stronger protection to customers, in
recognition that the company has been subject to shortfalls for the
2010-2015 period for serviceability (water infrastructure) as a result of
poor performance.
Thames Water did not propose any financial penalties for 2019-20 for
this performance commitment, stating that this would be undertaken
as part of the next price review process. We consider that it is more
appropriate to outline the incentive structures for 2019-20 prior to the
reporting period and, as such, have rolled forward the incentive
structure from 2018-19 to 2019-20.
B2 – Asset Health Water Non
Infrastructure
Removed the penalty collar
Removed the penalty deadband
Rolled forward the incentive
structure to include 2019-20
The interventions ensure that the company is incentivised to maintain
performance, and appropriate penalties are in place for under or poor
performance.
Thames Water proposed a collar of four changes in status across the
price control period. We do not consider that this provides customers
with adequate protection from serious deterioration in the health of the
non-infrastructure assets and have removed the collar entirely.
Thames Water proposed to include a penalty deadband which

Draft price control determination notice: company-specific appendix – Thames Water
107
PC/ODI affected What we did Why we did it
required non-stable performance to be reported for two consecutive
years before a penalty is applied. We do not believe this appropriately
compensates customers for non-stable performance in a single year
and have removed the deadband completely.
Thames Water did not propose any financial penalties for 2019-20 for
this performance commitment, stating that this would be undertaken
as part of the next price review process. We consider that it is more
appropriate to outline the incentive structures for 2019-20 prior to the
reporting period and, as such, have rolled forward the incentive
structure from 2018-19 to 2019-20.
B3 – Drinking Water Quality
Standards
Adjusted the PC level for 2017 -
18 to 2019-20
Changed penalty deadbands and
collar.
Rolled forward the incentive
structure to include 2019-20
We have intervened following a review of drinking water quality across
all companies to ensure that the company is incentivised to achieve
upper quartile performance.
The interventions for the PC and ODI ensure that the company is
incentivised to deliver upper quartile performance by 2017-18.
We have changed the deadbands to ensure that the company has a 2
year glide path to deliver upper quartile performance,
Thames Water did not propose any financial penalties for 2019-20 for
this performance commitment, stating that this would be undertaken
as part of the next price review process. We consider that it is more
appropriate to outline the incentive structures for 2019-20 prior to the
reporting period and, as such, have rolled forward the incentive
structure from 2018-19 to 2019-20.
The Company has defined Outcome Delivery Incentives for drinking
water quality compliance with a penalty at less than 100%. This

Draft price control determination notice: company-specific appendix – Thames Water
108
PC/ODI affected What we did Why we did it
penalty represents an incentive to the company to not reduce its
compliance with water quality measures. This threshold represents the
point at which financial incentives will be applied to the company
through the price setting process. All companies are subject to
drinking water quality obligations regulated by the DWI, which are the
overriding statutory obligations that a water company must comply
with as part of their Section 37 obligations. The company’s Board has
confirmed as part of its business plan submission that it will comply
with all relevant statutory obligations
B5 – Supply Interruptions above 4
hours (average minutes per
property)
Adjusted the PC level to upper
quartile for 2017-18 to 2019-20,
and adjusted in intervening years
to reflect glide path
Changed the penalty and reward
deadbands and penalty and
rewards cap and collar.
Rolled forward the incentive
structure to include 2019-20
The interventions for the PC and ODI ensure that the company is
incentivised to deliver upper quartile performance by 2017-18.
We have intervened following a review of interruptions across all
companies to ensure that the company is incentivised to achieve
upper quartile performance.
This has led to changes. We have changed to the deadbands to
ensure that the company has a 2 year glide path to deliver upper
quartile performance, while rewards can only be earned for genuine
outperformance.
Thames Water did not propose any financial penalties for 2019-20 for
this performance commitment, stating that this would be undertaken
as part of the next price review process. We consider that it is more
appropriate to outline the incentive structures for 2019-20 prior to the
reporting period and, as such, have rolled forward the incentive
structure from 2018-19 to 2019-20.
B6 – Security of Supply Index – Rolled forward the incentive Thames Water did not propose any financial penalties for 2019-20 for

Draft price control determination notice: company-specific appendix – Thames Water
109
PC/ODI affected What we did Why we did it
Ofwat KPI structure to include 2019-20 this performance commitment, stating that this would be undertaken
as part of the next price review process. We consider that it is more
appropriate to outline the incentive structures for 2019-20 prior to the
reporting period and, as such, have rolled forward the incentive
structure from 2018-19 to 2019-20.
C2 – Leakage Adjusted Penalty Collar in Year 1.
Rolled forward the incentive
structure to include 2019-20
The penalty collar has been adjusted to ensure that an appropriate
penalty range is in place for non-delivery in 2015-16.
Thames Water did not propose any financial penalties for 2019-20 for
this performance commitment, stating that this would be undertaken
as part of the next price review process. We consider that it is more
appropriate to outline the incentive structures for 2019-20 prior to the
reporting period and, as such, have rolled forward the incentive
structure from 2018-19 to 2019-20.
Table AA4.4 Summary of interventions on wholesale wastewater outcomes, performance commitments and incentives
PC/ODI affected What we did Why we did it
B1 – Asset Health Wastewater
(Non-infrastructure)
Removed the penalty collar
Removed the penalty deadband
Rolled forward the incentive
structure to include 2019-20
The interventions ensure that the company is incentivised to maintain
performance, and appropriate penalties are in place for under or poor
performance.
Thames Water proposed a collar of four changes in status over 2015-
20. We do not consider that this provides customers with adequate
protection from serious deterioration in the health of the non-
infrastructure assets and have removed the collar entirely.

Draft price control determination notice: company-specific appendix – Thames Water
110
PC/ODI affected What we did Why we did it
Thames Water proposed to include a penalty deadband which
required non-stable performance to be reported for two consecutive
years before a penalty is applied. We do not believe this appropriately
compensates customers for non-stable performance in a single year
and have removed the deadband completely.
Thames Water did not propose any financial penalties for 2019-20 for
this performance commitment, stating that this would be undertaken
as part of the next price review process. We consider that it is more
appropriate to outline the incentive structures for 2019-20 prior to the
reporting period and, as such, have rolled forward the incentive
structure from 2018-19 to 2019-20.
B2 – Asset Health Wastewater
(Infrastructure)
Removed the penalty collar
Removed the penalty deadband
Adjusted the penalty incentive
rate
Include the transferred network
Rolled forward the incentive
structure to include 2019-20
The interventions ensure that the company is incentivised to maintain
performance, and appropriate penalties are in place for under or poor
performance.
Thames Water proposed a collar of four changes in status over 2015-
20. We do not consider that this provides customers with adequate
protection from serious deterioration in the health of the non-
infrastructure assets and have removed the collar entirely.
Thames Water proposed to include a penalty deadband which
required non-stable performance to be reported for two consecutive
years before a penalty is applied. We do not believe this appropriately
compensates customers for non-stable performance in a single year
and have removed the deadband completely.
The penalty incentive rate has been increased by 25% to provide an
additional incentive and stronger protection to customers, in

Draft price control determination notice: company-specific appendix – Thames Water
111
PC/ODI affected What we did Why we did it
recognition that the company has been subject to shortfalls for the
2010-2015 period for serviceability (wastewater infrastructure) as a
result of poor performance.
In line with our approach, incidents occurring on the network
transferred under s105A of the Water Industry Act have been included
in this performance commitment.
Thames Water did not propose any financial penalties for 2019-20 for
this performance commitment, stating that this would be undertaken
as part of the next price review process. We consider that it is more
appropriate to outline the incentive structures for 2019-20 prior to the
reporting period and, as such, have rolled forward the incentive
structure from 2018-19 to 2019-20.
B3 – Properties protected from
flooding due to rainfall
Include the transferred network
Increase the expected value to be
delivered by the performance
commitment
Introduce a Counters Creek
specific penalty
In line with our approach, incidents occurring on the network
transferred under s105A of the Water Industry Act have been included
in this performance commitment.
As part of the horizontal review of internal sewer flooding, it was
identified that Thames Water had a degree of catch up required to
reach upper quartile performance. Therefore, the value of benefit that
this performance commitment will deliver has been increased in line
with the degree of catch up required by Thames Water to reach upper
quartile performance.
In addition, the penalty structure proposed by Thames Water did not
include any penalty for the late delivery of the Counters Creek
scheme. Therefore, we have introduced an additional penalty,
equivalent to the annual benefit value of the Counters Creek scheme

Draft price control determination notice: company-specific appendix – Thames Water
112
PC/ODI affected What we did Why we did it
to apply in the event that the scheme is late, and in each subsequent
year that it is not delivered.
B4 – Number of internal flooding
incidents, excluding those due to
overloaded sewers (SFOC)
Include the transferred network
Remove the reward
Reduce the committed
performance level and alter the
penalty deadbands and collar
Roll forward the incentive
structure to include 2019-20
In line with our approach, incidents occurring on the network
transferred under s105A of the Water Industry Act have been included
in this performance commitment.
The company attempted to demonstrate it was stretching its
performance based on improvements from 2012-13 over 2010-15. Our
analysis showed that Thames Water was one of three companies
actually showing a net deterioration in performance 2010-15 and are
being shortfalled for this. We have, therefore, removed the reward
element of this incentive completely.
We have intervened following a review of internal flooding incidents
across all companies to ensure that the company is incentivised to
achieve upper quartile performance. Therefore, the committed
performance levels has been reduced to upper quartile in 2017-18 to
2019-20 and reduced in 2015-16 and 2016-17 to reflect the 2 year
glide path. The penalty deadbands and penalty collars have also been
adjusted.
Thames Water did not propose any financial penalties for 2019-20 for
this performance commitment, stating that this would be undertaken
as part of the next price review process. We consider that it is more
appropriate to outline the incentive structures for 2019-20 prior to the
reporting period and, as such, have rolled forward the incentive
structure from 2018-19 to 2019-20.

Draft price control determination notice: company-specific appendix – Thames Water
113
PC/ODI affected What we did Why we did it
C2 – Total category 1-3 pollution
incidents from sewage related
premises
Include the transferred network
Increase the penalty rate
Include a clause which prevents
rewards being earned for
category 1 and 2 incidents
Roll forward the incentive
structure to include 2019-20
In line with our approach, incidents occurring on the network
transferred under s105A of the Water Industry Act have been included
in this performance commitment.
The penalty rate proposed by the company was less than the average
incremental cost (AIC) per incident. We do not consider that this fully
incentivises the company to reduce pollution incidents. Therefore we
have increased the penalty rate to equal the AIC.
We have intervened following a review of sewerage service pollution
incidents across all companies to ensure that the company is
incentivised to achieve upper quartile performance. Thames
Water is already proposing upper quartile performance so no changes
were required. We have included a ‘gateway clause’ which precludes
the company from earning a reward in any single year that a category
1 or 2 incident occurs. This clause has been included as it was
proposed by the company during the clarification process following the
27 June submission.
Thames Water did not propose any financial penalties for 2019-20 for
this performance commitment, stating that this would be undertaken
as part of the next price review process. We consider that it is more
appropriate to outline the incentive structures for 2019-20 prior to the
reporting period and, as such, have rolled forward the incentive
structure from 2018-19 to 2019-20.
C3 – Sewage treatment works
discharge consent
Roll forward the incentive
structure to include 2019-20
Thames Water did not propose any financial penalties for 2019-20 for
this performance commitment, stating that this would be undertaken
as part of the next price review process. We consider that it is more
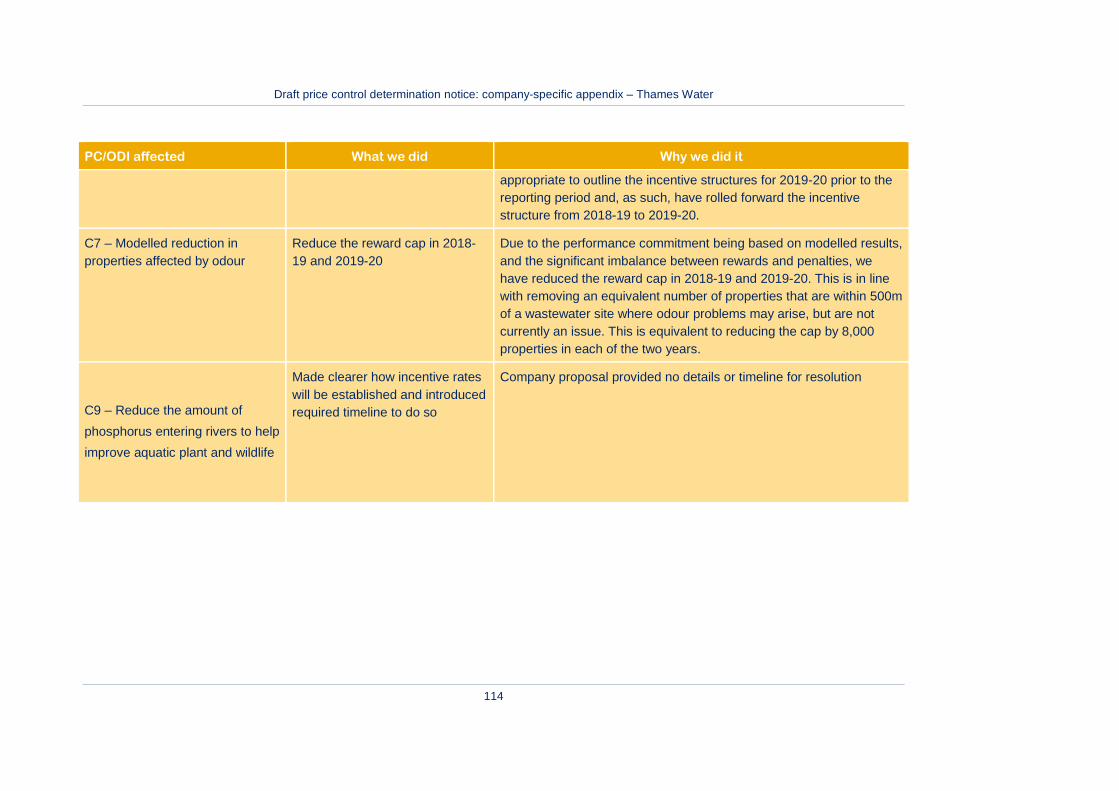
Draft price control determination notice: company-specific appendix – Thames Water
114
PC/ODI affected What we did Why we did it
appropriate to outline the incentive structures for 2019-20 prior to the
reporting period and, as such, have rolled forward the incentive
structure from 2018-19 to 2019-20.
C7 – Modelled reduction in
properties affected by odour
Reduce the reward cap in 2018-
19 and 2019-20
Due to the performance commitment being based on modelled results,
and the significant imbalance between rewards and penalties, we
have reduced the reward cap in 2018-19 and 2019-20. This is in line
with removing an equivalent number of properties that are within 500m
of a wastewater site where odour problems may arise, but are not
currently an issue. This is equivalent to reducing the cap by 8,000
properties in each of the two years.
C9 – Reduce the amount of
phosphorus entering rivers to help
improve aquatic plant and wildlife
Made clearer how incentive rates
will be established and introduced
required timeline to do so
Company proposal provided no details or timeline for resolution

Draft price control determination notice: company-specific appendix – Thames Water
115
Table AA4.5 Summary of interventions on household retail outcomes, performance commitments and incentives
PC/ODI affected What we did Why we did it
B1 – Implement new online
account management system
Introduce value-based penalties
for year 4 and year 5
The new account management system is expected to bring annual
benefits to customers of £6.5m. However, the penalty structure
proposed by Thames Water would not have compensated customers
in the event that delivery of the system was delayed. Therefore, in
addition to the penalty proposed by Thames Water, we have
introduced a value-based penalty for years 4 and 5 to fully
compensate customers in the event of late delivery.
RA6 – Service Incentive
Mechanism (SIM)
Introduce the Ofwat SIM incentive SIM will continue to operate in the 2015–20 as a comparative industry
metric, therefore we have included it as part of the package of
incentives. The reward and penalty will be determined by Ofwat.
RC1 – Increase the number of
customers on a payment plan
(excluding Thames Tideway
Tunnel)
Remove Thames Tideway Tunnel
exclusion
Number of customers on payment plan should not be impacted by the
Thames Tideway Tunnel, so the Thames Tideway Tunnel exclusion
has been removed
RC2 – Increase cash collection
rates (excluding Thames Tideway
Tunnel)
Remove Thames Tideway Tunnel
exclusion
Thames is the principal to the billing arrangement with the
Infrastructure Provider. This is different to other water company
arrangements where a water company may collect for another
company as a billing agent under contractual arrangements outside of
the regulatory business. As Thames Water is acting as a principal (ie it
has the direct interface with customers and carries bad debt) the
exclusion on cash collection rates is not appropriate.

Draft price control determination notice: company-specific appendix – Thames Water
116
Table AA4.6 Summary of interventions on Thames Tideway outcomes, performance commitments and incentives
PC/ODI affected What we did Why we did it
T1 – We will limit the extent of
delays on the overall programme
timeline
Introduced the PC Thames Water has a number of key activities which must be delivered
to limit the extent of any delays to the programme. This performance
commitment will give visibility to these activities as well as financially
penalise the company for delays in construction activities needed to
allow the Infrastructure Provider access to the sites.
T2 – We will engage effectively
with the IP, and other
stakeholders, both in terms of
integration and assurance
Introduced the PC The successful delivery of the project will require Thames Water to
work well with the IP and other stakeholders, therefore effective
engagement is important. For this reason we are including
performance commitments ensure that Thames Water is actively
seeking the views of those stakeholders to identify ways in which it
can operate and engage more effectively to deliver the Tideway
Tunnel.
T3 – We will engage with our
customers to build understanding
of the Thames Tideway Tunnel
project
Introduced the PC It is important that Thames Water focuses on the customer
understanding of the Tideway Tunnel as well as the construction
activities to deliver it. This is both in terms of the overall customer
base who are funding the project, and the more local issues caused
by construction activities.

Draft price control determination notice: company-specific appendix – Thames Water
117
Outcome delivery and reporting
In the outcomes technical appendix, we outline a framework against which we have
assessed Thames Water’s proposals in relation to outcome delivery and reporting.
The table below summarises Thames Water’s proposed approach to the
measurement, reporting and governance of outcomes and our assessment of
this approach.
Table A2.8 Thames Water’s proposals for outcome delivery and reporting
Thames Water proposals Our assessment
In the June submission, Thames Water
provided information on the processes for
Governance and Accountability, Audit and
Assurance, and Transparency and
Publication for reporting performance over
the 2015 – 20 period.
For the performance commitments, the
company will set out methodology
statements which outline the processes and
procedures for collecting data and
calculating the metrics to ensure
consistency in the approach to reporting
performance. The data is reviewed monthly,
quarterly and annually by the Board and
Executive team.
For 2015 – 20, the company is proposing to
build on the existing audit and assurance
process in place for the 2010 – 15 period. In
addition to the use of internal and external
audit teams to assure the systems and
processes from which performance data is
collected and reported, the company is
proposing to:
Appoint an independent assessor for
the full price control period
Set-up a customer group (following
on from the CCG) to review and
challenge the performance reporting
and assurance process.
In our methodology statement we set out our
expectation that companies should
demonstrate that their proposed PCs can be
measured and recorded consistently and that
they will have the appropriate governance
and quality assurance processes in place to
achieve this. We also expect companies to
be transparent with customers about their
performance against their outcomes and
commitments.
Thames Water has provided sufficient
evidence demonstrating the approach it will
undertake to ensure the PCs will be
measured and reported consistently, and the
proposed governance and assurance
processes. Therefore, we have accepted the
company’s proposals
In time, we may develop further information
requirements with regard to outcomes, as we
review and change current requirements
relating to performance indicators and each
company’s annual risk and compliance
statement.

Draft price control determination notice: company-specific appendix – Thames Water
118
Thames Water proposals Our assessment
obtain independent third party
assurance on the methodology and
technical issues, for performance
commitments where a degree of
judgement and discretion is involved
in the calculation – for example
through a peer review with relevant
experts.
The company is proposing to report
performance through the existing regulatory
publication process, comprising of:
Annual Performance Report
(incorporating the KPI dashboard)
Annual Report and Financial
Statements (which also includes the
risk and compliance statement)
Regulatory accounts
The company proposes to commit to
undertaking further customer engagement
and research to understand the level of
detail and frequency that customers would
prefer to receive about the performance
against outcomes.
In the remainder of this section, we provide the following information on each
performance commitment we are proposing as part of this draft determination.
The name and detailed definition of the performance commitment.
The type of incentive.
The performance commitment level.
For financial incentives:
the limits on rewards and penalties (caps and collars) and neutral
zones (deadbands) as applicable11; and
11 In general, the cap or collar is the level of service at which the maximum penalty or reward occurs
and a deadband is the level of service at which the incentive first applies. However, where a greater than or less than symbol precedes the figure this denotes that the maximum or initial incentive only occurs if service is greater than or less than this level.

Draft price control determination notice: company-specific appendix – Thames Water
119
the incentive rates.
Additional details on the measure.
Where Ofwat has not accepted the company’s proposals, the nature of the
intervention made is also explained.
Appendix 1 of our final methodology statement contains a number of worked
examples that illustrate how the different incentive types will operate.
We have intervened in relation to a number of performance commitments proposed
by the company. Where our intervention is to remove the performance commitment
in question, details and reasoning are provided in table AA4.1 at the end of this
annex. Where we have amended the company’s proposed incentive but retained the
performance commitment, we have intentionally set out our interventions below
using a strikethrough. What this means is that we have rejected the proposal that
has been struck through and instead we have either used a different value or not
included a value at all (for example, in the case of some rewards).
Following submission of its business plan on 27 June 2014, Thames Water was
given the opportunity to amend and clarify its proposed outcome delivery incentives
following a number of queries raised by us. While Thames Water was supportive of a
number of potential changes, it set out that its formal position remained as set out in
its June Submission. Where we have included these changes within our draft
determination they have, therefore, been shown as interventions.
Thames Water proposed a number of reward and penalty structures which were only
active until 2018-19, stating that 2019-20 would be based on forecast performance
and, as such, should form the first year of the incentive package designed as part of
the price review process in 2019. We do not consider that this provides customers
with appropriate protection for 2019-20 and we have, therefore, intervened by rolling
forward the incentive structure from 2018-19 to include 2019-20.
Thames Water will be able to finalise its proposed menu choice and affected ODI
calibrations following our consideration of responses to these proposals.

Draft price control determination notice: company-specific appendix – Thames Water
120
Table AA4.7 Performance commitments that we have added to this draft
determination
Performance
commitment
Reason for its addition
Household Retail
Service Incentive
Mechanism (SIM)
SIM will continue to operate in the 2015 – 20 period as a
comparative industry metric, therefore we have included it as part
of the package of incentives. The reward and penalty will be
determined by Ofwat.
T1 – We will limit the
extent of delays on the
overall programme
timeline
Thames did not propose any outcome delivery incentives or
performance commitments for it activities on the TTT in its June
business plan submission.
In response to our request, Thames Water has subsequently
developed an initial set of performance commitments for the TTT
although these were neither tested with customers nor approved
by Thames Water's Board. Given Thames Water's key role in the
timely delivery of the project, we consider that customers would
not be adequately protected without performance commitments
and incentives in this area.
The performance commitments Thames Water has proposed are
a helpful starting point. Using the company’s proposal, we have
outlined what we consider to be the three key performance
commitments and associated incentives for the project. Thames
Water will need to develop the performance commitments further
including how it will measure and report against its performance
and engage with its customers to understand their views. Thames
Water will also need to update the performance commitments
should it commit to take on additional activities to limit the extent
of delays to the project if there is a delay to the appointment of an
IP.
T2 – We will engage
effectively with the IP,
and other stakeholders,
both in terms of
integration and
assurance
T3 – We will engage
with our customers to
build understanding of
the Thames Tideway
Tunnel project

Draft price control determination notice: company-specific appendix – Thames Water
121
Wholesale water outcome A: Demonstrate to our
customers and stakeholders that they can trust us, that
we are easy to do business with and that we care
Performance commitment WA1: Improve handling of written
complaints by increasing 1st time resolution
Detailed definition of performance measure: The percentage of written complaints
relating to the wholesale water business (excluding metering) which are resolved at
the first stage, without the need for escalation.
Incentive type: Reputational
Performance commitments
Starting
level
Committed performance levels
Unit 2014-15 2015-16 2016-17 2017-18 2018-19 2019-20
PC % 90% 95% 95% 95% 95% 95%
Additional details
Necessary detail on
measurement units
The measurement unit is the proportion of written complaints
relating to water services (excluding metering) that are resolved
first time, without the need for escalation.
Frequency of PC
measurement and any
use of averaging
Performance commitment reported at the end of each financial
year and reviewed through independent assurance process.
_________________________________

Draft price control determination notice: company-specific appendix – Thames Water
122
Performance commitment WA2: Number of Written complaints per
10,000 connected properties
Detailed definition of performance measure: The number of written complaints
about water operational activity per 10,000 connected properties that receive water
services from Thames Water.
Incentive type: Reputational
Performance commitments
Starting
level
Committed performance levels
Unit 2014-15 2015-16 2016-17 2017-18 2018-19 2019-20
PC Number of
written
complaints
per 10,000
connected
properties
11.66 10.64 9.61 8.58 7.55 6.53
Additional details
Necessary detail on
measurement units
Measurement units are the number of written complaints about
water operational activity per 10,000 connected properties that
receive water services from Thames Water.
The activities carried out between the wholesale water and retail
price controls will be managed through a service level agreement
(SLA), which will cover, among other things, information integrity
and accuracy across the separate business functions.
This is rounded to two decimal places
Frequency of PC
measurement and
any use of
averaging
Performance commitment reported at the end of each financial year
and reviewed through independent assurance process.

Draft price control determination notice: company-specific appendix – Thames Water
123
Performance commitment WA3: Customer satisfaction surveys
(Internal CSAT monitor)
Detailed definition of performance measure: The average customer satisfaction
score for customer contacts relating to the wholesale water operational activity, using
Thames Water’s internal CSAT monitor.
Incentive type: Reputational
Performance commitments
Starting
level
Committed performance levels
Unit 2014-15 2015-16 2016-17 2017-18 2018-19 2019-20
PC Score
1:5
4.10 4.35 4.45 4.50 4.55 4.60
Additional details
Necessary detail on
measurement units
Measurement unit is the average customer satisfaction score for
customer contacts relating to water operational activity
Frequency of PC
measurement and any
use of averaging
Performance commitment reported at the end of each financial
year and reviewed through independent assurance process.
_________________________________
Performance commitment WA4: Reduced water consumption from
issuing water efficiency devices to customers
Detailed definition of performance measure: Reduced water consumption
(demand) measured in Ml/D, achieved from issuing water efficiency devices to
customers. The calculation of the demand reduction from these devices follows
Ofwat guidelines (Ofwat – June Return Reporting Requirements, 2011) and is
reported as part of the annual return.
Incentive type: Financial – penalty only

Draft price control determination notice: company-specific appendix – Thames Water
124
Performance commitments
Unit Starting
level
Committed performance levels
2014-15 2015-16 2016-17 2017-18 2018-19 2019-20
PC Reduced
demand
Ml/d
4.24 15.45
Penalty collar Reduced
demand
Ml/d
11.70
Penalty
deadband
Reduced
demand
Ml/d
15.45
Incentive rates
Incentive type Performance levels
(Reduced demand Ml/d)
Incentive rate (£m/ Reduced
demand Ml/d)
Lower Upper
Penalty 11.70 15.45 0.870
Additional details
Necessary detail on
measurement units
Measurement unit is the cumulative reduction in
demand (in Ml/d) by the end of 2015-20 from issuing
water efficiency devices to customers. The calculation
of the demand reduction from these devices follows
Ofwat guidelines (Ofwat – June Return Reporting
Requirements, 2011) and is reported as part of the
Annual Return.
Frequency of PC measurement
and any use of averaging
The penalty applies to performance at the end of
2015-20. This will be calculated at PR19 based on
actuals for years 1-4 and forecasts for year 5 of 2015-
20. Performance against the commitment will be
measured annually.
Timing and frequency of Penalties will be calculated at PR19, to be applied in

Draft price control determination notice: company-specific appendix – Thames Water
125
rewards/penalties 2020-25
Form of reward/penalty Adjustment to revenue
_________________________________
Performance commitment WA5: Provide a free repair service for
customers with a customer side leak outside of the property
Detailed definition of performance measure: The number of properties where
Thames Water provides a free repair service to customers with a customer side leak
outside their property. These are additional targeted properties, above the
company’s annual baseline number (10,000), aligned with the roll out of its
progressive metering programme.
Incentive type: Reputational
Performance commitments
Starting
level
Committed performance levels
Unit 2014-15 2015-16 2016-17 2017-18 2018-19 2019-20
PC Number
against
target
above
baseline
no.
10,000
baseline
1170 1450 1410 900 890
Additional details
Necessary detail on
measurement units
Measurement unit is the number of properties where Thames
Water provides a free repair service to customers with a
customer side leak outside their property
Frequency of PC
measurement and any
use of averaging
Performance commitment reported at end of each financial year
and reviewed through independent assurance process.

Draft price control determination notice: company-specific appendix – Thames Water
126
Wholesale water outcome B: We will provide a safe and
reliable Water service that complies with all necessary
standards and is available when our customers require it
Performance commitment WB1: Asset Health Water Infrastructure
Detailed definition of performance measure: The Asset Health status in each
year of 2015-20, based on independently assessed performance against a basket of
key indicators that represent the health of the infrastructure assets.
The Asset Health measure for water infrastructure is made on the basis of indicators
of bursts, unplanned interruptions to supply, iron mean zonal non-compliance,
inadequate pressure, planned network rehabilitation and customer complaints of
discolouration and white water.
Incentive type: Financial – penalty only
Performance commitments
Unit Starting
level
Committed performance levels
2014-15 2015-16 2016-17 2017-18 2018-19 2019-20
PC Composite
index
Stable Stable Stable Stable Stable Stable
Penalty
collar
Composite
index
Marginal
or
Deteriorating
Marginal
or
Deteriorating
Marginal
or
Deteriorating
Marginal
or
Deteriorating
Deterioratin
g
Penalty
deadband
Composite
index
Marginal Marginal Marginal Marginal
Incentive rates
Incentive type Performance levels (status) Incentive rate
(£m/status
decrement/year) Lower Upper
Penalty 1 Deteriorating
Marginal Stable 5.75 4.6

Draft price control determination notice: company-specific appendix – Thames Water
127
Incentive type Performance levels (status) Incentive rate
(£m/status
decrement/year) Lower Upper
Penalty 2 Deteriorating Marginal 4.6
Additional details
Necessary detail
on measurement
units
Measurement unit is the Asset Health status in each year of 2015-20,
based on independently assessed performance against a basket of
key indicators that represent the health of the infrastructure or non-
infrastructure assets, and therefore the service being provided to
current and future customers.
The Asset Health measure for water infrastructure is made on the
basis of indicators of bursts, unplanned interruptions to supply, iron
mean zonal non-compliance, inadequate pressure, planned network
rehabilitation and customer complaints of discolouration and white
water.
Frequency of PC
measurement and
any use of
averaging
The penalty applies to performance in each of the first four years of
2015-20. This will be calculated at PR19 based on actuals for years
1-4 and forecasts for year 5. Performance against the commitment
will be measured annually.
Timing and
frequency of
rewards/penalties
Penalties will be calculated at PR19, to be applied in 2020-25
Form of
reward/penalty
Adjustment to revenue
Any other
information or
clarifications
relevant to correct
application of
incentive
The penalty incentive rate applies to a single change in status, where
stable to marginal and marginal to deteriorating each represent a
single change in status.
The penalty collar is set at the level of four changes in status for each
of infrastructure and non-infrastructure. For example, the penalty
collar would apply in four persistent years of marginal status, two
years of deteriorating status, or one year of deteriorating status and
two years of marginal status.
Marginal status represents the effective penalty deadband, as no
penalty is earned until performance is assessed as marginal.
Penalties start to occur in the event of a single year of two or more
consecutive years of marginal or deteriorating status (except where
marginal or deteriorating status occurs in the fourth year of 2015-20,
the last year where the ODI applies), with penalties applying in each

Draft price control determination notice: company-specific appendix – Thames Water
128
year where the status is below stable.
The table below illustrates how the penalty would apply in two
different scenarios:
2015-16 2016-17 2017-18 2018-19 2019-20 Penalty
Scenario 1 –
Performance
Marginal Deteriorating Marginal Stable -
Scenario 1 –
Penalty
£4.6m £9.2m £4.6m 0 - £18.4m
Scenario 2 –
Performance
Stable Marginal Stable Marginal -
Scenario 2 –
Penalty
0 0 0 £4.6m - £4.6m
_________________________________
Performance commitment WB2: Asset Health Water Non
Infrastructure
Detailed definition of performance measure: The Asset Health status in each
year of 2015-20, based on performance against a basket of key indicators that
represent the health of the non-infrastructure assets.
The Asset Health measure for water non-infrastructure is made on the basis of
indicators of Disinfection Index, Reservoir Integrity Index, Drinking Water Quality
Compliance Measures – Turbidity, Drinking Water Quality Compliance Measures –
Enforcement actions, Process Control Index, and Water Quality Customer
Complaints for chlorine and hardness.
Incentive type: Financial – penalty only
Performance commitments
Unit Starting
level
Committed performance levels
2014-15 2015-16 2016-17 2017-18 2018-19 2019-20
PC Composite
index
Stable Stable Stable Stable Stable Stable

Draft price control determination notice: company-specific appendix – Thames Water
129
Penalty
collar
Composite
index
Marginal
or
Deteriorating
Marginal
or
Deteriorating
Marginal
or
Deteriorating
Marginal
or
Deteriorating
Deterioratin
g
Penalty
deadband
Composite
index
Marginal Marginal Marginal Marginal
Incentive rates
Incentive type Performance levels (status) Incentive rate
(£m/status
decrement/year) Lower Upper
Penalty 1 Deteriorating
Marginal
Stable 4.6
Penalty 2 Deteriorating Marginal 4.6
Additional details
Necessary detail
on measurement
units
Measurement unit is the Asset Health status in each year of 2015-20,
based on independently assessed performance against a basket of
key indicators that represent the health of the infrastructure or non-
infrastructure assets, and therefore the service being provided to
current and future customers.
The Asset Health measure for water non-infrastructure is made on
the basis of indicators of disinfection, reservoir integrity, drinking
water quality compliance – turbidity and enforcement actions, process
control and water quality customer complaints for chlorine, monitored
complaints for hardness.
Frequency of PC
measurement and
any use of
averaging
The penalty applies to performance in each of the first four years of
2015-20. This will be calculated at PR19 based on actuals for years
1-4 and forecasts for year 5. Performance against the commitment
will be measured annually.
Timing and
frequency of
rewards/penalties
Penalties will be calculated at PR19, to be applied in 2020-25
Form of
reward/penalty
Adjustment to revenue
Any other
information or
The penalty incentive rate applies to a single change in status, where
stable to marginal and marginal to deteriorating each represent a

Draft price control determination notice: company-specific appendix – Thames Water
130
clarifications
relevant to correct
application of
incentive
single change in status.
The penalty collar is set at the level of four changes in status for each
of infrastructure and non-infrastructure. For example, the penalty
collar would apply in four persistent years of marginal status, two
years of deteriorating status, or one year of deteriorating status and
two years of marginal status.
Marginal status represents the effective penalty deadband, as no
penalty is earned until performance is assessed as marginal.
Penalties start to occur in the event of a single year of two or more
consecutive years of marginal or deteriorating status (except where
marginal or deteriorating status occurs in the fourth year of 2015-20,
the last year where the ODI applies), with penalties applying in each
year where the status is below stable.
The table below illustrates how the penalty would apply in two
different scenarios:
2015-
16
2016-17 2017-18 2018-19 2019-20 Penalty
Scenario 1 –
Performance
Marginal Deteriorating Marginal Stable -
Scenario 1 –
Penalty
£4.6m £9.2m £4.6m 0 - £18.4m
Scenario 2 –
Performance
Stable Marginal Stable Marginal -
Scenario 2 –
Penalty
0 0 0 £4.6m - £4.6m
_________________________________
Performance commitment WB3: Compliance with drinking water
quality standards – Ofwat/DWI KPI
Detailed definition of performance measure: Compliance with drinking water
quality standards – Ofwat/DWI KPI, is the mean zonal compliance in the year for
water quality parameters. It is an existing KPI which is reported annually to Ofwat
and the DWI.
Incentive type: Financial – penalty only

Draft price control determination notice: company-specific appendix – Thames Water
131
Performance commitments
Unit Starting
level
Committed performance levels
2014-15 2015-16 2016-17 2017-18 2018-19 2019-20
PC %
compliance
99.94% 99.94% 99.94% 100%
99.94%
100%
99.94%
100%
99.95%
Penalty
collar
%
compliance
99.91% 99.91% 99.94%
99.91%
99.94%
99.91%
99.94%
Penalty
deadband
%
compliance
99.93% 99.93% 99.96%
99.93%
99.96%
99.93%
99.96%
Incentive rates
Incentive type Performance levels (%) Incentive rate
(£m/0.01 pp
/year) Lower Upper
Penalty 99.91% 99.96% 99.93% 3.855
Additional details
Necessary detail on
measurement units
The measurement unit is the mean zonal compliance in the
year, as currently reported to the DWI.
Performance is rounded to the nearest two decimal places for
the purpose of applying the ODI
Frequency of PC
measurement and any
use of averaging
The penalty applies to annual performance in each of the first
four years of 2015-20. Performance against the commitment will
be measured annually.
Timing and frequency
of rewards/penalties
Penalties will be calculated at PR19, to be applied in 2020-25
Form of reward/penalty Adjustment to revenue
_________________________________

Draft price control determination notice: company-specific appendix – Thames Water
132
Performance commitment WB4: Properties experiencing chronic
low pressure (DG2)
Detailed definition of performance measure: This measure is the previous Ofwat
DG2 measure, which shows the number of properties at the end of the reporting year
experiencing chronic low pressure.
Incentive type: Reputational
Performance commitments
Starting
level
Committed performance levels
Unit 2014-15 2015-16 2016-17 2017-18 2018-19 2019-20
PC No. of
properties
34 34 34 34 34 34
Additional details
Necessary detail on
measurement units
Measurement unit is previous DG2 measure showing the
number of properties at the end of the reporting year
experiencing chronic low pressure
Frequency of PC
measurement and any
use of averaging
Performance commitment reported at end of each financial year
and reviewed through independent assurance process.
Performance commitment WB5: Average hours lost supply per
property served, due to interruptions >4hr
Detailed definition of performance measure: This is the annual, average number
of hours lost supply per property served, due to interruptions >4hr, from both planned
and unplanned events. A cap (20,000) applies to the number of property hours
counted for any single incident.
Incentive type: Financial – reward and penalty

Draft price control determination notice: company-specific appendix – Thames Water
133
Performance commitments
Starting
level
Committed performance levels
Unit 2014-15 2015-16 2016-17 2017-18 2018-19 2019-20
PC Hours lost
supply per
property
served
0.13 0.12
0.13
0.12
0.13
0.11
0.13
0.11
0.13
0.11
0.13
Penalty
collar
Hours lost
supply per
property
served
0.15 0.15 0.14
0.15
0.15
0.14
0.15
0.14
Penalty
deadband
Hours lost
supply per
property
served
0.13
0.13
0.13
0.11
0.13
0.11
0.13
0.11
Reward
deadband
Hours lost
supply per
property
served
0.13
0.11
0.13
0.11
0.13
0.11
0.13
0.11
0.13
0.11
Reward
cap
Hours lost
supply per
property
served
0.10
0.06
0.10
0.06
0.10
0.06
0.10
0.06
0.10
0.06
Incentive rates
Incentive type Performance levels (hours lost
per property served)
Incentive rate
(£m/0.01 hours
lost per property
served/year) Lower Upper
Penalty 0.15 0.11 0.13 5.335
Reward 0.11 0.13 0.06 0.10 3.125
Additional details
Necessary detail on Measurement unit is the average number of hours lost

Draft price control determination notice: company-specific appendix – Thames Water
134
measurement units supply per property served, due to interruptions >4hr,
from both planned and unplanned events. A cap (20,000)
applies to the number of property hours for any single
incident.
Performance will be rounded to two decimal places
Frequency of PC
measurement and any use of
averaging
The penalty applies to annual performance in the first four
years of 2015-20. This will be calculated at PR19 based
on actuals for years 1-4. Performance against the
commitment will be measured annually.
Timing and frequency of
rewards/penalties
Penalties will be calculated at PR19, to be applied in
2020-25
Form of reward/penalty Adjustment to revenue
_________________________________
Performance commitment WB6: Security of Supply Index – Ofwat
KPI
Detailed definition of performance measure: This is the existing annual Security
of Supply (SOSI) index. This measure is reported and audited as part of the Annual
Return process.
Incentive type: Financial – penalty only
Performance commitments
Unit Starting
level
Committed performance levels
2014-15 2015-16 2016-17 2017-18 2018-19 2019-20
PC Index 100 100 100 100 100 100
Penalty collar Index 97 97 97 97

Draft price control determination notice: company-specific appendix – Thames Water
135
Incentive rates
Incentive type Performance levels (index) Incentive rate
(£m/index
point/year) Lower Upper
Penalty 97 100 2.230
Additional details
Necessary detail on
measurement units
Measurement unit is the existing annual security of supply
(SOSI) index. This measure is reported and audited as part of
the annual return process. The calculation matches the method
for current annual reporting.
Frequency of PC
measurement and any
use of averaging
The penalty applies to annual performance in the first four years
of 2015-20. This will be calculated at PR19 based on actuals for
years 1-4. Performance against the commitment will be
measured annually.
Timing and frequency
of rewards/penalties
Penalties will be calculated at PR19, to be applied in 2020-25
Form of reward/penalty Adjustment to revenue
_________________________________
Performance commitment WB7: Compliance with SEMD advice
notes (with or without derogation)
Detailed definition of performance measure: Compliance with SEMD (Security
and Emergency Measures Directive) Advice Notes, with or without derogation.
These are the advice notes issues by Defra and written by CPNI (the Centre for
Protection of National Infrastructure).
Incentive type: Financial – penalty only

Draft price control determination notice: company-specific appendix – Thames Water
136
Performance commitments
Unit Starting
level
Committed performance levels
2014-15 2015-16 2016-17 2017-18 2018-19 2019-20
PC %
compliance
100% 100%
Penalty
collar
%
compliance
0%
Incentive rates
Incentive type Performance levels (%) Incentive rate
Lower Upper
Penalty 0% 100% 40% of annualised costs
saved through scope
reduction
Additional details
Necessary detail on
measurement units
This measures compliance with the SEMD Advice Notes to
deliver a secure supply of water and resilience in supply.
Frequency of PC
measurement and any
use of averaging
The penalty applies to performance at the end of 2015-20. This
will be calculated at PR19 based on actuals for years 1-4 and
forecasts for year 5 of 2015-20. Performance against the
commitment will be measured annually.
Timing and frequency
of rewards/penalties
Penalties will be calculated at PR19, to be applied in 2020-25
Form of reward/penalty Adjustment to revenue
Any other information
or clarifications
relevant to correct
application of incentive
This incentive will return 40% of any 2015-20 revenue as a
result of reductions in scope used to estimate the SEMD cost for
Thames Water’s 27 June 2014 submission. This will be in
addition to the 50% of costs returned after the totex menu
reward. For the avoidance of doubt, this does not apply to cost
increases or to cost reductions as a result of efficiencies.
Incentives will be applied in 2020-25 on an NPV-neutral basis.

Draft price control determination notice: company-specific appendix – Thames Water
137
_________________________________
Performance commitment WB8: Ml/d of sites made resilient to
future extreme rainfall events
Detailed definition of performance measure: The capacity (in Ml/d) of water
treatment works where Thames Water has invested to protect supply from extreme
weather events (defined as a 1:100 rainfall event), by the end of 2015-20.
This will be measured by the successful delivery of the proposed solutions to protect
supply from the identified sites. Ml/d will be measured from the design capacity of the
sites.
Incentive type: Financial – reward and penalty
Performance commitments
Starting
level
Committed performance levels
Unit 2014-15 2015-16 2016-17 2017-18 2018-19 2019-20
PC Ml/d
cumulative
n/a 1015
Penalty
collar
Ml/d
cumulative
812
Reward cap Ml/d
cumulative
1218
Incentive rates
Incentive type Performance levels (Ml/d
cumulative)
Incentive rate
(£m/Ml/d
cumulative) Lower Upper
Penalty 812 1015 0.005
Reward 1015 1218 0.005

Draft price control determination notice: company-specific appendix – Thames Water
138
Additional details
Necessary detail on
measurement units
Measurement unit is the capacity (in Ml/d) of water treatment works where Thames Water has invested to protect supply from extreme weather events, by the end of 2015-20
Frequency of PC
measurement and any
use of averaging
The penalty applies to performance at the end of 2015-20. This
will be calculated at PR19 based on actuals for years 1-4 and
forecasts for year 5 of 2015-20. Performance against the
commitment will be measured annually.
Timing and frequency
of rewards/penalties
Penalties will be calculated at PR19, to be applied in 2020-25
Form of reward/penalty Adjustment to revenue

Draft price control determination notice: company-specific appendix – Thames Water
139
Wholesale water outcome C: We will limit our impact on
the environment and achieve a socially responsible,
sustainable business for future generations, including
reducing levels of leakage
Performance commitment WC1: Greenhouse gas emissions from
water operations
Detailed definition of performance measure: The greenhouse gas emissions (in
kilo tonnes of CO2 equivalent) from water operations.
This performance measure takes into account all forecast movements in the use of
energy and emissions, including impacts from Thames Water’s wider investment
programme and efficiency activities. Its specific programme is optimised at a
company-wide level and then allocated to water or wastewater service based on
each site-specific solution in the preferred programme. This performance
commitment is allocated 100% to Wholesale Water, being delivered solely by
solutions on water sites.
Incentive type: Reputational
Performance commitments
Starting
level
Committed performance levels
Unit 2014-15 2015-16 2016-17 2017-18 2018-19 2019-20
PC Kt CO2e 247.8 227.0 185.0 166.1 146.6 136.2
Additional details
Necessary detail on
measurement units
Measurement unit is the greenhouse gas emissions (in kilo
tonnes of CO2 equivalent) from water operations
Frequency of PC
measurement and any use
of averaging
Performance commitment reported at end of each financial
year and reviewed through independent assurance
process.
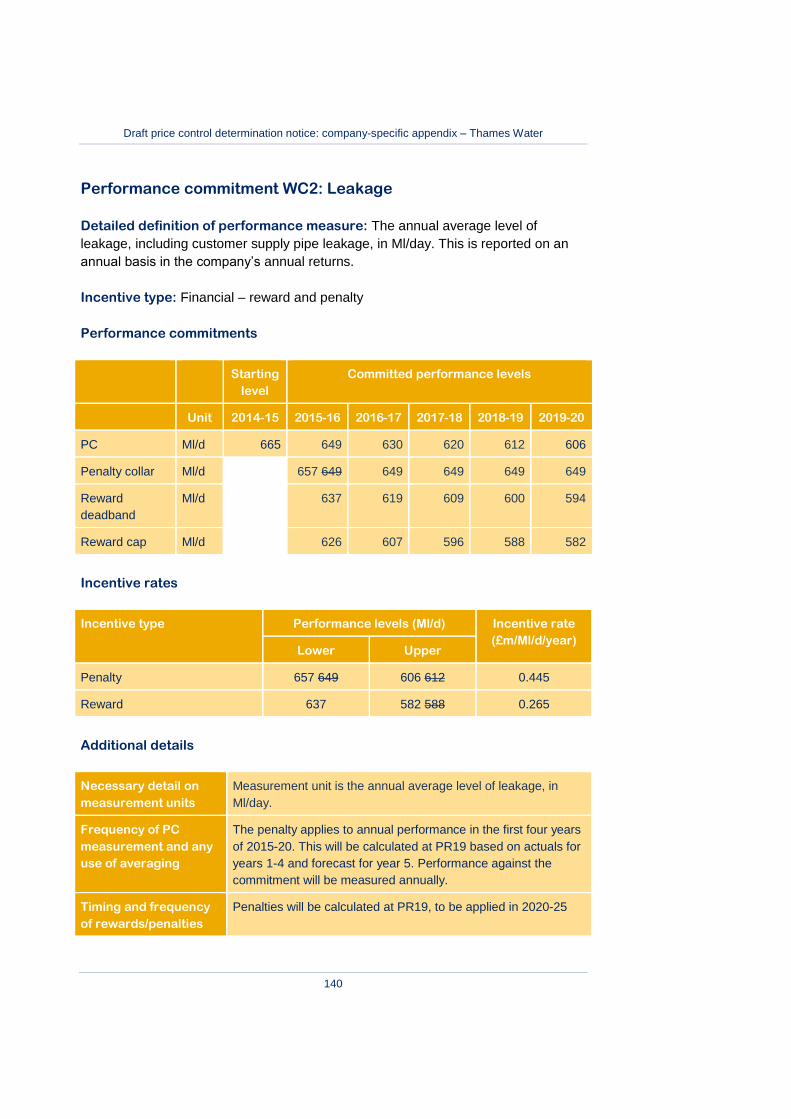
Draft price control determination notice: company-specific appendix – Thames Water
140
Performance commitment WC2: Leakage
Detailed definition of performance measure: The annual average level of
leakage, including customer supply pipe leakage, in Ml/day. This is reported on an
annual basis in the company’s annual returns.
Incentive type: Financial – reward and penalty
Performance commitments
Starting
level
Committed performance levels
Unit 2014-15 2015-16 2016-17 2017-18 2018-19 2019-20
PC Ml/d 665 649 630 620 612 606
Penalty collar Ml/d 657 649 649 649 649 649
Reward
deadband
Ml/d 637 619 609 600 594
Reward cap Ml/d 626 607 596 588 582
Incentive rates
Incentive type Performance levels (Ml/d) Incentive rate
(£m/Ml/d/year) Lower Upper
Penalty 657 649 606 612 0.445
Reward 637 582 588 0.265
Additional details
Necessary detail on
measurement units
Measurement unit is the annual average level of leakage, in
Ml/day.
Frequency of PC
measurement and any
use of averaging
The penalty applies to annual performance in the first four years
of 2015-20. This will be calculated at PR19 based on actuals for
years 1-4 and forecast for year 5. Performance against the
commitment will be measured annually.
Timing and frequency
of rewards/penalties
Penalties will be calculated at PR19, to be applied in 2020-25

Draft price control determination notice: company-specific appendix – Thames Water
141
Form of reward/penalty Adjustment to revenue
_________________________________
Performance commitment WC3: Abstraction Incentive Mechanism
(AIM)
Detailed definition of performance measure: This is a new measure being
developed by Ofwat for an industry-wide incentive, to apply during 2015-20. Thames
Water will align the measure with the detailed definition to be formed by Ofwat, which
the company understands will be score-based using abstracted volume at identified
sites.
Incentive type: Reputational
Performance commitments
Unit Starting
level
Committed performance levels
2014-15 2015-16 2016-17 2017-18 2018-19 2019-20
PC Score TBC TBC TBC TBC TBC
Additional details
Necessary detail on
measurement units
n/a – measurement units will be defined as the incentive is
developed.
Frequency of PC
measurement and any
use of averaging
n/a – frequency of measurement will be defined as the incentive
is developed.
Performance commitment WC4: We will educate our existing and
future customers
Detailed definition of performance measure: This measures the number of
children directly engaged each year through Thames Water’s education programme
on water supply, including working in schools, educational visits and site open days.

Draft price control determination notice: company-specific appendix – Thames Water
142
Incentive type: Reputational
Performance commitments
Starting
level
Committed performance levels
Unit 2014-15 2015-16 2016-17 2017-18 2018-19 2019-20
PC No. of
children
directly
engaged
14,000 15,000 16,000 17,000 18,000 20,000
Additional details
Necessary detail on
measurement units
The measurement unit is the number of children Thames
Water has directly engaged each year in its water education
programme.
Frequency of PC
measurement and any
use of averaging
Performance commitment reported at end of each financial
year and reviewed through independent assurance process.
_________________________________
Performance commitment WC5: Deliver 100% of agreed measures
to meet new environmental regulations
Detailed definition of performance measure: The proportion of agreed measures
completed to meet new environmental regulations. Agreed measures are defined as:
water schemes listed on NEP4; and
low flow and drought management plan schemes.
The list of schemes currently agreed is listed in the Performance Commitment
Response WC5 (27 June 2014)
Incentive type: Financial – penalty only

Draft price control determination notice: company-specific appendix – Thames Water
143
Performance commitments
Unit Starting
level
Committed performance levels
2014-15 2015-16 2016-17 2017-18 2018-19 2019-20
PC % agreed
schemes
completed
n/a 100%
Penalty
collar
% agreed
schemes
completed
0%
Incentive rates
Incentive type Performance levels (%) Incentive
Lower Upper
Penalty
0% 100%
40% of 2015-20
costs reduced
through scope
reductions
Additional details
Necessary detail on
measurement units
This measures compliance with the Environment Agency agreed
schemes for the agreed measures to meet new environmental
regulations
Frequency of PC
measurement and any
use of averaging
The penalty applies to performance at the end of 2015-20. This
will be calculated at PR19 based on actuals for years 1-4 and
forecasts for year 5 of 2015-20. Performance against the
commitment will be measured annually.
Timing and frequency
of rewards/penalties
Penalties will be calculated at PR19, to be applied in 2020-25
Form of reward/penalty Adjustment to RCV
Any other information
or clarifications
relevant to correct
application of incentive
This incentive will return 40% of any 2015-20 cost as a result of
reductions in scope used to estimate the 27 June 2014
submission. This will be in addition to the 50% of costs returned
after the totex menu reward. For the avoidance of doubt, this

Draft price control determination notice: company-specific appendix – Thames Water
144
does not apply to cost increases or to cost reductions as a result
of efficiencies.
Incentives will be applied in 2020-25 on an NPV-neutral basis.

Draft price control determination notice: company-specific appendix – Thames Water
145
Wholesale water outcome D: We will provide the level of
customer service our customers require, in the most
economic and efficient manner, to ensure that bills are no
more than necessary
Performance commitment WD1: Energy imported less energy
exported
Detailed definition of performance measure: The net reduction in energy from
the grid (energy imported less energy exported) measured in gigawatt hours (GWh),
achieved by improving the energy efficiency of assets and increasing self-generation
percentage across water operations.
This performance measure takes into account all forecast movements in the use of
energy, including impacts from Thames Water’s wider investment programme and
efficiency activities. The specific programme is optimised at a company-wide level
and then allocated to water or wastewater service based on each site-specific
solution in the preferred programme. This performance commitment is allocated
100% to wholesale water, being delivered solely by solutions on water sites.
Incentive type: Reputational
Performance commitments
Starting
level
Committed performance levels
Unit 2014-15 2015-16 2016-17 2017-18 2018-19 2019-20
PC GWh 505 494 483 472 472 476
Additional details
Necessary detail on
measurement units
Measurement unit is the net energy imported by wholesale water
operations in GWh.
Frequency of PC
measurement and any
use of averaging
Performance commitment reported at end of each financial year
and reviewed through independent assurance process.

Draft price control determination notice: company-specific appendix – Thames Water
146
Wholesale wastewater outcome A: Demonstrate to our
customers and stakeholders that they can trust us, that
we are easy to do business with and that we care
Performance commitment SA1: Improve handling of written
complaints by increasing first time resolution
Detailed definition of performance measure: The percentage of written
complaints relating to the wholesale wastewater business which are resolved at the
first stage, without the need for escalation.
Incentive type: Reputational
Performance commitments
Starting
level
Committed performance levels
Unit 2014-15 2015-16 2016-17 2017-18 2018-19 2019-20
PC % 90% 95% 95% 95% 95% 95%
Additional details
Necessary detail on
measurement units
Measurement units are the percentage of wastewater
operational written complaints resolved first time.
Frequency of PC
measurement and any
use of averaging
Performance commitment reported at end of each financial year
and reviewed through independent assurance process.
_________________________________
Performance commitment SA2: Number of Written complaints per
10,000 connected properties
Detailed definition of performance measure: The number of written complaints
about wastewater operational activity per 10,000 connected properties that receive
wastewater services from Thames Water.

Draft price control determination notice: company-specific appendix – Thames Water
147
Incentive type: Reputational
Performance commitments
Starting
level
Committed performance levels
Unit 2014-15 2015-16 2016-17 2017-18 2018-19 2019-20
PC Number of
written
complaints
per 10,000
connected
properties
8.05 7.60 7.15 6.70 6.25 5.80
Additional details
Necessary detail on
measurement units
Measurement unit is the number of written complaints about
wastewater operational activity per 10,000 connected
properties that receive wastewater services from Thames
Water.
This is rounded to two decimal places.
Frequency of PC
measurement and any use
of averaging
Performance commitment reported at the end of each
financial year and reviewed through independent assurance
process.
_________________________________
Performance commitment SA3: Customer satisfaction surveys
(Internal CSAT monitor)
Detailed definition of performance measure: The average customer satisfaction
score for customer contacts relating to wastewater operational activity, using
Thames Water’s internal CSAT Monitor.
Incentive type: Reputational

Draft price control determination notice: company-specific appendix – Thames Water
148
Performance commitments
Starting
level
Committed performance levels
Unit 2014-15 2015-16 2016-17 2017-18 2018-19 2019-20
PC Score 1:5 4.30 4.55 4.60 4.65 4.65 4.70
Additional details
Necessary detail on
measurement units
Measurement unit is the average customer satisfaction score
for customer contacts relating to wastewater operational
activity
Frequency of PC
measurement and any use
of averaging
Performance commitment reported at the end of each
financial year and reviewed through independent assurance
process.

Draft price control determination notice: company-specific appendix – Thames Water
149
Wholesale wastewater outcome B: We will provide a safe
and reliable Wastewater service that complies with all
necessary standards and is available when our customers
require it
Performance commitment SB1: Asset Health Wastewater Non
Infrastructure
Detailed definition of performance measure: The Asset Health status in each
year of 2015-20 based on independently assessed performance against a basket of
key indicators that represent the health of the non-infrastructure assets.
The Asset Health measure for wastewater non-infrastructure is made on the basis of
indicators of unconsented pollution incidents, the percentage of sewage treatment
works discharges failing numeric consents, and the total population equivalent
served by sewage treatment works failing look-up table consents.
Incentive type: Financial – penalty only
Performance commitments
Unit Starting
level
Committed performance levels
2014-15 2015-16 2016-17 2017-18 2018-19 2019-20
PC Composite
index
Stable Stable Stable Stable Stable Stable
Penalty
collar
Composite
index
Marginal
or
Deteriorating
Marginal
or
Deteriorating
Marginal
or
Deteriorating
Marginal
or
Deteriorating
Deterioratin
g
Penalty
deadband
Composite
index
Marginal Marginal Marginal Marginal
Incentive rates
Incentive type Performance levels (status) Incentive rate
(£m/status
decrement Lower Upper

Draft price control determination notice: company-specific appendix – Thames Water
150
/year)
Penalty 1 Deteriorating
Marginal Stable 4.505
Penalty 2 Deteriorating Marginal 4.505
Additional details
Necessary detail
on measurement
units
The measurement unit is the Asset Health status in each year of
2015-20, based on independently assessed performance against a
basket of key indicators that represent the health of the infrastructure
or non-infrastructure assets, and therefore the service being provided
to current and future customers.
The Asset Health measure for wastewater non-infrastructure is made
on the basis of indicators of unconsented pollution incidents, the
percentage of sewage treatment works discharges failing numeric
consents, and the total population equivalent served by sewage
treatment works failing look-up table consents.
Frequency of PC
measurement and
any use of
averaging
The penalty applies to performance in each of the first four years of
2015-20. This will be calculated at PR19 based on actuals for years
1-4 and forecast performance for year 5. Performance against the
commitment will be measured annually.
Timing and
frequency of
rewards/penalties
Penalties will be calculated at PR19, to be applied in 2020-25
Form of
reward/penalty
Adjustment to revenue
Any other
information or
clarifications
relevant to correct
application of
incentive
The penalty incentive rate applies to a single change in status, where
stable to marginal and marginal to deteriorating each represent a
single change in status.
The penalty collar is set at the level of four changes in status for each
of infrastructure and non-infrastructure. For example, the penalty
collar would apply in four persistent years of marginal status, two
years of deteriorating status, or one year of deteriorating status and
two years of marginal status.
Marginal status represents the effective penalty deadband, as no
penalty is earned until performance is assessed as marginal.
Penalties start to occur in the event of two or more consecutive years
a single year of marginal or deteriorating status (except where
marginal or deteriorating status occurs in the fourth year of 2015-20,

Draft price control determination notice: company-specific appendix – Thames Water
151
the last year where the ODI applies), with penalties applying in each
year where the status is below stable.
The table below illustrates how the penalty would apply in two
different scenarios:
2015-16 2016-17 2017-18 2018-19 2019-20 Penalty
Scenario 1 –
Performance
Marginal Deteriorating Marginal Stable -
Scenario 1 –
Penalty
£4.5m £9.0m £4.5m 0 - £18.0m
Scenario 2 –
Performance
Stable Marginal Stable Marginal -
Scenario 2 –
Penalty
0 0 0 £4.5m - £4.5m
_________________________________
Performance commitment SB2: Asset Health Wastewater
Infrastructure
Detailed definition of performance measure: The Asset Health status in each
year of 2015-20, based on independently assessed performance against a basket of
key indicators that represent the health of the infrastructure assets. The Asset Health
measure for wastewater infrastructure is made on the basis of indicators of number
of sewer collapses, number of blockages, unconsented category 1 to 3 pollution
incidents and properties internally flooded due to other causes. This includes assets
transferred under section 105A of the Water Industry Act.
Incentive type: Financial – penalty only
Performance commitments
Unit Starting
level
Committed performance levels
2014-15 2015-16 2016-17 2017-18 2018-19 2019-20
PC Composite
index
Stable Stable Stable Stable Stable Stable
Penalty Composite Marginal
or
Marginal
or
Marginal
or
Marginal
or
Deterioratin

Draft price control determination notice: company-specific appendix – Thames Water
152
collar index Deteriorating Deteriorating Deteriorating Deteriorating g
Penalty
deadband
Composite
index
Marginal Marginal Marginal Marginal
Incentive rates
Incentive type Performance levels (status) Incentive rate
(£m/status
decrement/year) Lower Upper
Penalty 1 Deteriorating
Marginal Stable 4.505 5.6
Penalty 2 Deteriorating Marginal 4.505
Additional details
Necessary detail
on measurement
units
The measurement unit is the Asset Health status in each year of
2015-20, based on performance against a basket of key indicators
that represent the health of the infrastructure or non-infrastructure
assets, and therefore the service being provided to current and future
customers.
Frequency of PC
measurement and
any use of
averaging
The penalty applies to performance in each of the first four years of
2015-20. This will be calculated at PR19 based on actuals for years
1-4 and forecast performance for year 5. Performance against the
commitment will be measured annually.
Timing and
frequency of
rewards/penalties
Penalties will be calculated at PR19, to be applied in 2020-25
Form of
reward/penalty
Adjustment to revenue

Draft price control determination notice: company-specific appendix – Thames Water
153
Any other
information or
clarifications
relevant to correct
application of
incentive
The penalty incentive rate applies to a single change in status, where
stable to marginal and marginal to deteriorating each represent a
single change in status.
The penalty collar is set at the level of four changes in status for each
of infrastructure and non-infrastructure. For example, the penalty
collar would apply in four persistent years of marginal status, two
years of deteriorating status, or one year of deteriorating status and
two years of marginal status.
Marginal status represents the effective penalty deadband, as no
penalty is earned until performance is assessed as marginal.
Penalties start to occur in the event of two or more consecutive years
a single year of marginal or deteriorating status (except where
marginal or deteriorating status occurs in the fourth year of 2015-20,
the last year where the ODI applies), with penalties applying in each
year where the status is below stable.
The table below illustrates how the penalty would apply in two
different scenarios:
2015-16 2016-17 2017-18 2018-19 2019-20 Penalty
Scenario 1 –
Performance
Marginal Deteriorating Marginal Stable -
Scenario 1 –
Penalty
£4.5m £9.0m £4.5m 0 - £18.0m
Scenario 2 –
Performance
Stable Marginal Stable Marginal -
Scenario 2 –
Penalty
0 0 0 £4.5m - £4.5m
_________________________________
Performance commitment SB3: Properties protected from
flooding due to rainfall
Detailed definition of performance measure: The number of properties which
receive further protection from flooding due to rainfall by the end of 2015-20, at the
estimated frequency and severity of flooding as detailed in Thames Water’s business
plan.
The ODI is set based on annualised benefits which are determined using a matrix
(Table 5 in PCR SB3, 27 June 2014) which sets out different values depending on

Draft price control determination notice: company-specific appendix – Thames Water
154
the change in probability and severity of flooding for a particular property. The
proposed annual benefit is £30.434m £20.053m; rewards are earned for delivering
greater annual benefit and penalties for lesser annual benefit.
Further details on the operation of the PC and ODI (including worked examples) are
provided in PCR SB3 (27 June 2014).
Incentive type: Financial – reward and penalty
Performance commitments
Starting
level
Committed performance levels
Unit 2014-15 2015-16 2016-17 2017-18 2018-19 2019-20
PC Properties
protected
n/a 2127
Penalty
collar
Equivalent
property
numbers
1459
Reward
cap
Equivalent
property
numbers
2753
Incentive rates
Incentive type Performance levels (equivalent
properties protected)
Incentive rate
Lower Upper
Penalty 1459 2127 Determined by
reference to actual
costs and benefits
matrix
Reward 2127 2753 Determined by
reference to actual
costs and benefits
matrix

Draft price control determination notice: company-specific appendix – Thames Water
155
Additional details
Necessary detail on
measurement units
The measurement unit for the PC is the number of properties
further protected from flooding due to rainfall by the end of 2015-
20. The ODI is based on the actual benefits delivered, which are
presented for illustration as equivalent property numbers (further
details provided below).
Frequency of PC
measurement and any
use of averaging
The penalty and reward apply to performance at the end of
2015-20. This will be calculated at PR19 based on actuals for
years 1-4 and forecasts for year 5 of 2015-20. Performance
against the commitment will be measured annually.
Timing and frequency
of rewards/penalties
Rewards and penalties will be calculated at PR19, to be applied
in 2020-25
Form of reward/penalty Adjustment to RCV
Any other information
or clarifications
relevant to correct
application of incentive
The ODI calculation will be based on the actual costs and
benefits associated with the specific solutions delivered (for
rewards) or not delivered (for penalties) against the commitment,
which will depend on the type of solution, the severity of the
flooding and the probability of flooding occurring.
The process for determining incentive rates per property is
defined up front, using the formula:
Penalty or Reward incentive rate =
(annualised incremental WTP – annualised incremental cost) +
(company’s totex incentive rate * incremental cost)
The exact incentive rate and size of the ODI true-up will be
determined by Thames Water, ex post at PR19, with necessary
independent assurance provided by the Independent Experts
Group. The annual willingness to pay for the ODI calculation will
be determined by the annualised benefits matrix in table 5 in
PCR SB3 (27 June 2014), which sets out the different values
depending on the change in probability and severity of flooding
for a particular property. These values are applied to both
outperformance and underperformance.
The incremental costs for the ODI calculation will be based on
the difference between allowed and actual costs as a result of
changes in scope (for the avoidance of doubt, cost changes as a
result of other factors, for example, inflation risk, would be
treated outside the ODI in the totex menu).
The penalty collar is financial (set at £54m), calculated as the
penalty that would be incurred at the p10 estimate of
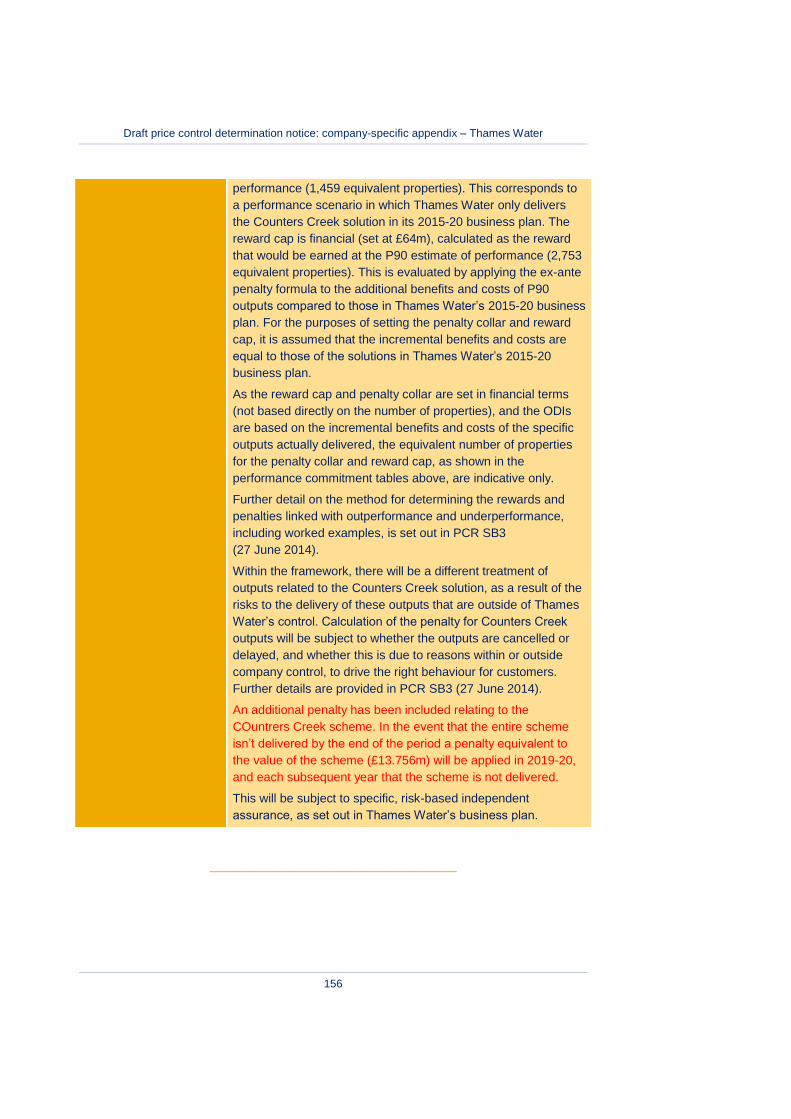
Draft price control determination notice: company-specific appendix – Thames Water
156
performance (1,459 equivalent properties). This corresponds to
a performance scenario in which Thames Water only delivers
the Counters Creek solution in its 2015-20 business plan. The
reward cap is financial (set at £64m), calculated as the reward
that would be earned at the P90 estimate of performance (2,753
equivalent properties). This is evaluated by applying the ex-ante
penalty formula to the additional benefits and costs of P90
outputs compared to those in Thames Water’s 2015-20 business
plan. For the purposes of setting the penalty collar and reward
cap, it is assumed that the incremental benefits and costs are
equal to those of the solutions in Thames Water’s 2015-20
business plan.
As the reward cap and penalty collar are set in financial terms
(not based directly on the number of properties), and the ODIs
are based on the incremental benefits and costs of the specific
outputs actually delivered, the equivalent number of properties
for the penalty collar and reward cap, as shown in the
performance commitment tables above, are indicative only.
Further detail on the method for determining the rewards and
penalties linked with outperformance and underperformance,
including worked examples, is set out in PCR SB3
(27 June 2014).
Within the framework, there will be a different treatment of
outputs related to the Counters Creek solution, as a result of the
risks to the delivery of these outputs that are outside of Thames
Water’s control. Calculation of the penalty for Counters Creek
outputs will be subject to whether the outputs are cancelled or
delayed, and whether this is due to reasons within or outside
company control, to drive the right behaviour for customers.
Further details are provided in PCR SB3 (27 June 2014).
An additional penalty has been included relating to the
COuntrers Creek scheme. In the event that the entire scheme
isn’t delivered by the end of the period a penalty equivalent to
the value of the scheme (£13.756m) will be applied in 2019-20,
and each subsequent year that the scheme is not delivered.
This will be subject to specific, risk-based independent
assurance, as set out in Thames Water’s business plan.
_________________________________

Draft price control determination notice: company-specific appendix – Thames Water
157
Performance commitment SB4: Number of internal flooding
incidents, excluding those due to overloaded sewers (SFOC)
Detailed definition of performance measure: The number of incidents of internal
other causes flooding per year on Thames Water’s legacy sewerage network (that is,
prior to the transfer of private sewers in October 2011) including those from sewers
that transferred to the company in October 2011 and pumping stations that will
transfer in 2016. Other causes flooding can be caused by blockages, collapses and
equipment failures (which also include ‘blowbacks’ during jetting).
Incentive type: Financial – reward and penalty only
Performance commitments
Starting
level
Committed performance levels
Unit 2014-15 2015-16 2016-17 2017-18 2018-19 2019-20
PC Incidents 1209
953
1120
953
1039
953
943 953 943
953
943
953
Penalty
collar
Incidents 1339
1154
1339
1154
1073
1154
1073
1154
1073
Penalty
deadband
Incidents 1209
1024
1209
1024
943
1024
943
1024
943
Reward
deadband
Incidents 943
882
943
882
943
882
943
882
943
Reward
cap
Incidents 895
834
895
834
895
834
895
834
895
Incentive rates
Incentive type Performance levels (no. of
incidents)
Incentive rate
(£m/
incidents/year) Lower Upper
Penalty 943 1154 1339 1024 0.090
Reward 1083 882 1083 834 0.055

Draft price control determination notice: company-specific appendix – Thames Water
158
Additional details
Necessary detail on
measurement units
The measurement unit is the number of incidents of internal
other causes flooding per year on Thames Water’s legacy
sewerage network including those from sewers that transferred
to the company in October 2011 and pumping stations that will
transfer in 2016. (that is, prior to the transfer of private sewers in
October 2011). Other causes flooding can be caused by
blockages, collapses and equipment failures (which also include
‘blowbacks’ during jetting). Certain mitigation events are defined
under the company’s assurance procedures.
Frequency of PC
measurement and any
use of averaging
The penalty applies to annual performance in the first four years
of 2015-20. This will be calculated at PR19 based on actuals for
years 1-4. Performance against the commitment will be
measured annually.
Timing and frequency
of rewards/penalties
Penalties will be calculated at PR19, to be applied in 2020-25
Form of reward/penalty Adjustment to revenue
_________________________________
Performance commitment SB5: Contributing area disconnected
from combined sewers by retrofitting sustainable drainage
Detailed definition of performance measure: The number of hectares of
contributing area (that is, local impermeable area that would normally contribute to
surface water run-off into a combined sewer) disconnected from the combined
sewers by fitting sustainable drainage measures.
Incentive type: Financial – reward and penalty
Performance commitments
Starting
level
Committed performance levels
Unit 2014-15 2015-16 2016-17 2017-18 2018-19 2019-20
PC Hectares
cumulative
n/a 20

Draft price control determination notice: company-specific appendix – Thames Water
159
Starting
level
Committed performance levels
Unit 2014-15 2015-16 2016-17 2017-18 2018-19 2019-20
Penalty
collar
Hectares
cumulative
10
Reward
cap
Hectares
cumulative
50
Incentive rates
The costs of retrofitting sustainable urban drainage have been subject to a challenge
through cost assessment. Given the incentive rates are cost-based we have also
considered whether it is appropriate to reduce the incentive rate in line with the cost
assessment challenge. However, given the significant benefit value determined per
hectare we have concluded that no intervention is appropriate.
Incentive type Performance levels (Hectares) Incentive rate
(£m/hectares
cumulative) Lower Upper
Penalty 10 20 0.515
Reward 20 50 0.470
Additional details
Necessary detail on
measurement units
The measurement unit is the number of hectares of contributing
area (that is, local impermeable area that would normally allow
surface water to run-off into a combined sewer) disconnected
from the combined sewers by fitting sustainable drainage
measures such as water butts, permeable paving, rain gardens
and green roofs
Frequency of PC
measurement and any
use of averaging
The penalty and reward apply to performance at the end of
2015-20. This will be calculated at PR19 based on actuals for
years 1-4 and forecasts for year 5 of 2015-20. Performance
against the commitment will be measured annually.
Timing and frequency
of rewards/penalties
Rewards and penalties will be calculated at PR19, to be applied
in 2020-25
Form of reward/penalty Adjustment to revenue

Draft price control determination notice: company-specific appendix – Thames Water
160
Any other information
or clarifications
relevant to correct
application of incentive
This commitment is not applicable for separate surface/foul
sewer networks and while surface water may still ultimately drain
to the combined sewer, the peak flow must be substantially
reduced to green field run-off rates
_________________________________
Performance commitment SB6: Compliance with SEMD (Security
and Emergency Measures Directive) advice notes, with or without
derogation
Detailed definition of performance measure: Compliance with SEMD (Security
and Emergency Measures Directive) Advice Notes, with or without derogation.
These are the advice notes issues by Defra and written by CPNI (the Centre for
Protection of National Infrastructure).
Incentive type: Financial – penalty only
Performance commitments
Unit Starting
level
Committed performance levels
2014-15 2015-16 2016-17 2017-18 2018-19 2019-20
PC %
compliance
100% 100%
Penalty
collar
%
compliance
0%
Incentive rates
Incentive type Performance levels (%) Incentive rate
Lower Upper
Penalty
0% 100%
40% of
annualised
costs saved
through scope
reduction
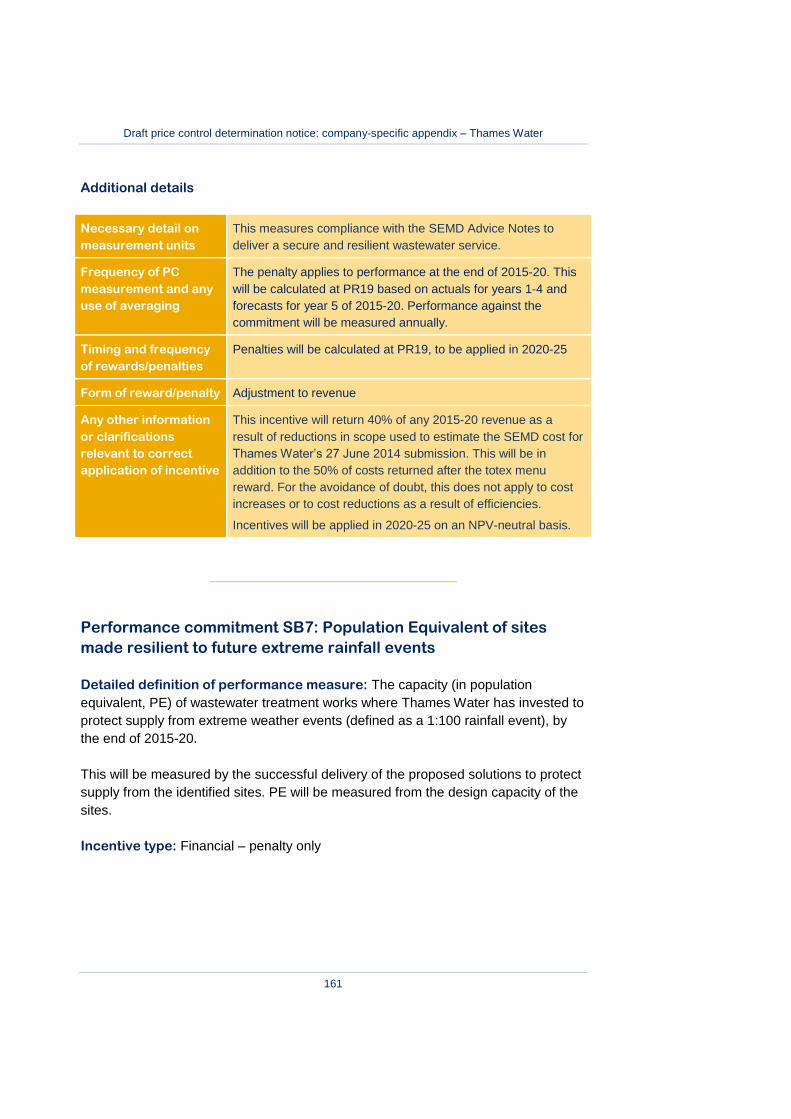
Draft price control determination notice: company-specific appendix – Thames Water
161
Additional details
Necessary detail on
measurement units
This measures compliance with the SEMD Advice Notes to
deliver a secure and resilient wastewater service.
Frequency of PC
measurement and any
use of averaging
The penalty applies to performance at the end of 2015-20. This
will be calculated at PR19 based on actuals for years 1-4 and
forecasts for year 5 of 2015-20. Performance against the
commitment will be measured annually.
Timing and frequency
of rewards/penalties
Penalties will be calculated at PR19, to be applied in 2020-25
Form of reward/penalty Adjustment to revenue
Any other information
or clarifications
relevant to correct
application of incentive
This incentive will return 40% of any 2015-20 revenue as a
result of reductions in scope used to estimate the SEMD cost for
Thames Water’s 27 June 2014 submission. This will be in
addition to the 50% of costs returned after the totex menu
reward. For the avoidance of doubt, this does not apply to cost
increases or to cost reductions as a result of efficiencies.
Incentives will be applied in 2020-25 on an NPV-neutral basis.
_________________________________
Performance commitment SB7: Population Equivalent of sites
made resilient to future extreme rainfall events
Detailed definition of performance measure: The capacity (in population
equivalent, PE) of wastewater treatment works where Thames Water has invested to
protect supply from extreme weather events (defined as a 1:100 rainfall event), by
the end of 2015-20.
This will be measured by the successful delivery of the proposed solutions to protect
supply from the identified sites. PE will be measured from the design capacity of the
sites.
Incentive type: Financial – penalty only

Draft price control determination notice: company-specific appendix – Thames Water
162
Performance commitments
Starting
level
Committed performance levels
Unit 2014-15 2015-16 2016-17 2017-18 2018-19 2019-20
PC PE
cumulative
1,700,000
Penalty
collar
PE
cumulative
1,360,000
Incentive rates
Incentive type Performance levels (PE
cumulative)
Incentive rate
(£/PE
cumulative) Lower Upper
Penalty 1,360,000 1,700,000 0.71
Additional details
Necessary detail on
measurement units
The measurement unit is the cumulative capacity (in population
equivalent) of wastewater treatment works made resilient to
flooding by the end of 2015-20.
Frequency of PC
measurement and any
use of averaging
The penalty applies to performance at the end of 2015-20. This
will be calculated at PR19 based on actuals for years 1-4 and
forecasts for year 5 of 2015-20. Performance against the
commitment will be measured annually.
Timing and frequency
of rewards/penalties
Penalties will be calculated at PR19, to be applied in 2020-25
Form of reward/penalty Adjustment to revenue

Draft price control determination notice: company-specific appendix – Thames Water
163
Wholesale wastewater outcome C: We will limit our impact
on the environment and achieve a socially responsible,
sustainable business for future generations, including
reducing levels of leakage
Performance commitment SC1: Greenhouse gas emissions from
wastewater operations
Detailed definition of performance measure: This is the greenhouse gas
emissions (in kilo tonnes of CO2 equivalent) from wastewater operations. This
performance measure takes into account all forecast movements in the use of
energy and emissions, including impacts from Thames Water’s wider investment
programme and efficiency activities. The company’s specific programme is optimised
at a company-wide level and then allocated to water or wastewater service based on
each site-specific solution in the preferred programme. This performance
commitment is allocated 100% to wholesale wastewater, being delivered solely by
solutions on wastewater sites.
Incentive type: Reputational
Performance commitments
Starting
level
Committed performance levels
Unit 2014-15 2015-16 2016-17 2017-18 2018-19 2019-20
PC Kt CO2e 394.6 368.1 322.5 290.5 269.6 260.6
Additional details
Necessary detail on
measurement units
The measurement unit is the greenhouse gas emissions (in kilo
tonnes of CO2 equivalent) from wastewater operations
Frequency of PC
measurement and any
use of averaging
Performance commitment reported at the end of each financial
year and reviewed through independent assurance process.

Draft price control determination notice: company-specific appendix – Thames Water
164
Performance commitment SC2: total Category 1-3 pollution
incidents from sewage related premises
Detailed definition of performance measure: The total annual number of
pollution incidents (category 1, 2 and 3) from sewage related premises, on Thames
Water’s legacy assets (that is, prior to the transfer of private sewers in October
2011), including both consented and unconsented incidents, and those from sewers
that transferred to the company in October 2011 and pumping stations that will
transfer in 2016. The source of information for this performance commitment is the
Environment Agency’s National Incident Recording System (NIRS) database. The
pollution sources for this commitment include sewage treatment works, storm tanks,
combined sewer overflows, foul sewers, pumping stations, rising mains and other.
This measure does not include category 4 incidents, consistent with historical
regulatory reporting to Ofwat.
Incentive type: Financial – reward and penalty
Performance commitments
Starting
level
Committed performance levels
Unit 2014-15 2015-16 2016-17 2017-18 2018-19 2019-20
PC Category 1
and 2
Incidents/C
ategory 3
incidents
0/340
316
0/340
316
0/340
316
0/340
316
0/340
316
0/340
316
Penalty
collar
Category 1
and 2
Incidents/C
ategory 3
incidents
-/465
441
-/465
441
-/465
441
-/465
441
-/465
Penalty
deadband
Category 1
and 2
Incidents/C
ategory 3
incidents
0/400
376
0/400
376
0/400
376
0/400
376
0/400
Reward
deadband
Category 1
and 2
0/263
239
0/263
239
0/263
239
0/263
239
0/263

Draft price control determination notice: company-specific appendix – Thames Water
165
Starting
level
Committed performance levels
Unit 2014-15 2015-16 2016-17 2017-18 2018-19 2019-20
Incidents/C
ategory 3
incidents
Reward cap Category 1
and 2
Incidents/C
ategory 3
incidents
0/229
205
0/229
205
0/229
205
0/229
205
0/229
Incentive rates
Incentive type Performance levels (incidents) Incentive rate
(£m/incident/year) Lower Upper
Penalty 465 441 400 376 0.130 0.065
Reward 263 239 229 205 0.130
Additional details
Necessary detail on
measurement units
The measurement unit is the total number of pollution incidents
(category 1, 2 and 3) from sewage related premises, including
both consented and unconsented incidents and those from
sewers that transferred to the company in October 2011 and
pumping stations that will transfer in 2016. The source of
information for this performance commitment is the Environment
Agency’s National Incident Recording System (NIRS) database.
The pollution sources for this commitment include Sewage
Treatment Works, Storm Tanks, Combined Sewer Overflows,
Foul Sewers, Pumping Stations, Rising Mains and Other.
Certain mitigation events are defined under the company’s
assurance procedures.
Frequency of PC
measurement and any
use of averaging
The penalty applies to annual performance in all years of 2015-
20. This will be calculated at PR19 based on actuals for years 1-
4 and forecast for year 5. Performance against the commitment
will be measured annually.

Draft price control determination notice: company-specific appendix – Thames Water
166
Timing and frequency
of rewards/penalties
Penalties will be calculated at PR19, to be applied in 2020-25
Form of reward/penalty Adjustment to revenue
Any other information
or clarifications
relevant to correct
application of incentive
Rewards in each year over which the ODI applies will be subject
to the attainment of zero serious pollution incidents that year. If a
category 1 or 2 pollution incident occurs in a given year of 2015-
20, a reward may not be earned for performance in the same
year. This ‘gateway’ to rewards is applicable on a year by year
basis and the occurrence of a category 1 or 2 pollution incident
in a given year of 2015-20 will not limit the ability to earn
rewards in future years.
Penalties will be applied for all category 1 and 2 incidents, as
well as category 3 incidents that fall above the deadband.
_________________________________
Performance commitment SC3: Sewage treatment works
discharge compliance
Detailed definition of performance measure: The percentage of sewage
treatment works with discharges compliant with numeric environmental permits in
each year. This is an existing measure which is assessed annually by the EA
through MD109 reporting.
Incentive type: Financial – penalty only
Performance commitments
Unit Starting
level
Committed performance levels
2014-15 2015-16 2016-17 2017-18 2018-19 2019-20
PC %
compliance
98.88% 98.88% 98.88% 98.88% 98.88% 98.88%
Penalty
collar
%
compliance
96.61% 96.61% 96.61% 96.61% 96.61%

Draft price control determination notice: company-specific appendix – Thames Water
167
Incentive rates
Incentive type Performance levels (%) Incentive rate
(£m/pp.
compliance/year) Lower Upper
Penalty 96.61% 98.88% 3.820
Additional details
Necessary detail on
measurement units
This is the continuance of an existing measure showing the
percentage of sewage treatment works with discharges
compliant with numeric environmental permits in each year and
is assessed annually by the EA through MD109 reporting.
The measurement units are rounded to the nearest two decimal
places and the incentive rate should be applied in proportion.
Frequency of PC
measurement and any
use of averaging
The penalty applies to annual performance in all years of 2015-
20. This will be calculated at PR19 based on actuals for years 1-
4 and forecast for year 5. Performance against the commitment
will be measured annually.
Timing and frequency
of rewards/penalties
Penalties will be calculated at PR19, to be applied in 2020-25
Form of reward/penalty Adjustment to revenue
Performance commitment SC4: Water bodies improved or
protected from deterioration as a result of TW activities
Detailed definition of performance measure: The number of water bodies
improved or protected by catchment management solutions, to control phosphorus
and other pollutants, as part of an innovative pilot programme. This measure does
not directly relate to a statutory requirement and is not a formal requirement of Defra,
Natural England, the DWI or the Environment Agency.
Incentive type: Reputational
Performance commitments
Starting
level
Committed performance levels

Draft price control determination notice: company-specific appendix – Thames Water
168
Unit 2014-15 2015-16 2016-17 2017-18 2018-19 2019-20
PC No. of water
bodies
improved
n/a 13
Additional details
Necessary detail on
measurement units
This performance commitment is for the number of water bodies
improved by catchment management solutions to control
phosphorus. This measure does not directly have a statutory
requirement and is not a formal requirement of Defra, Natural
England, the DWI or the Environment Agency.
Frequency of PC
measurement and any
use of averaging
Performance commitment reported at end of each financial year
and reviewed through independent assurance process.
_________________________________
Performance commitment SC5: Satisfactory sludge disposal
compliance
Detailed definition of performance measure: The percentage compliance of the
company’s wastewater sludge with all relevant legislation and best practice
guidance, such as The Sludge (Use in Agriculture) Regulations 1989; The ADAS
Safe Sludge Matrix (2001); The Nitrates Regulations (2008; 2013); Waste
Management Licensing (amendment and related provisions) Regulations 2005.
Incentive type: Reputational
Performance commitments
Starting
level
Committed performance levels
Unit 2014-15 2015-16 2016-17 2017-18 2018-19 2019-20
PC %
compliance
100% 100% 100% 100% 100% 100%
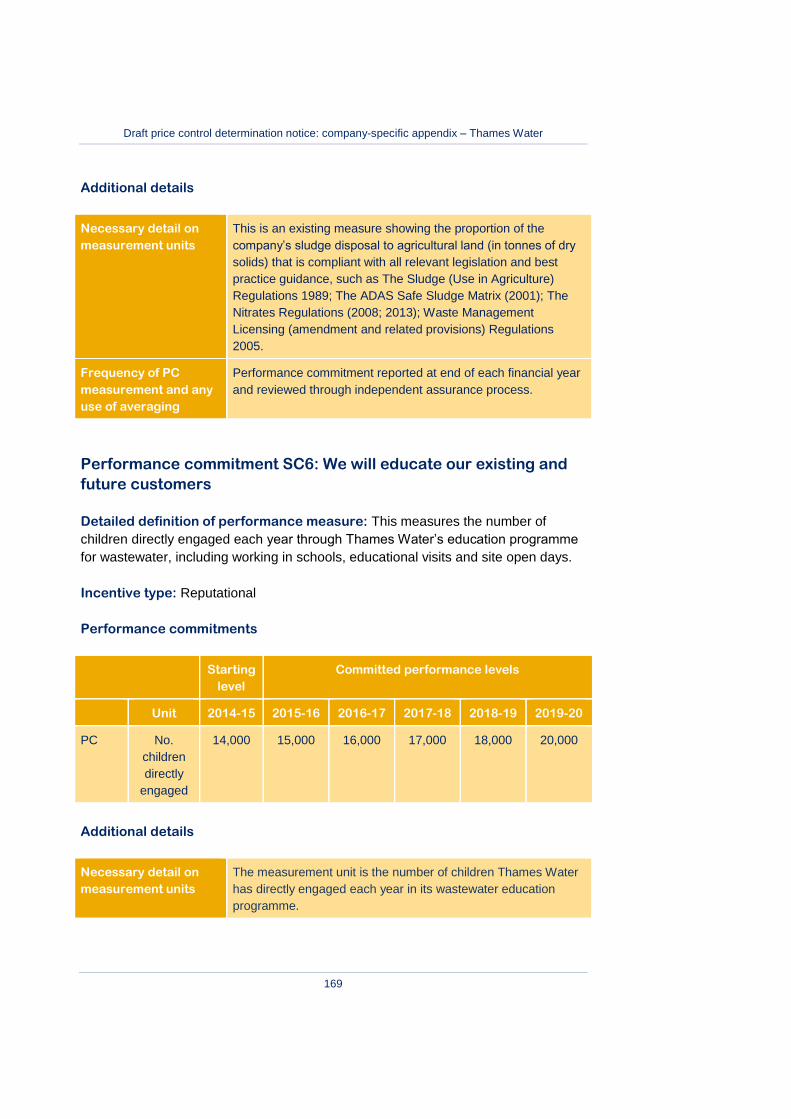
Draft price control determination notice: company-specific appendix – Thames Water
169
Additional details
Necessary detail on
measurement units
This is an existing measure showing the proportion of the
company’s sludge disposal to agricultural land (in tonnes of dry
solids) that is compliant with all relevant legislation and best
practice guidance, such as The Sludge (Use in Agriculture)
Regulations 1989; The ADAS Safe Sludge Matrix (2001); The
Nitrates Regulations (2008; 2013); Waste Management
Licensing (amendment and related provisions) Regulations
2005.
Frequency of PC
measurement and any
use of averaging
Performance commitment reported at end of each financial year
and reviewed through independent assurance process.
Performance commitment SC6: We will educate our existing and
future customers
Detailed definition of performance measure: This measures the number of
children directly engaged each year through Thames Water’s education programme
for wastewater, including working in schools, educational visits and site open days.
Incentive type: Reputational
Performance commitments
Starting
level
Committed performance levels
Unit 2014-15 2015-16 2016-17 2017-18 2018-19 2019-20
PC No.
children
directly
engaged
14,000 15,000 16,000 17,000 18,000 20,000
Additional details
Necessary detail on
measurement units
The measurement unit is the number of children Thames Water
has directly engaged each year in its wastewater education
programme.

Draft price control determination notice: company-specific appendix – Thames Water
170
Frequency of PC
measurement and any
use of averaging
Performance commitment reported at end of each financial year
and reviewed through independent assurance process.
_________________________________
Performance commitment SC7: Modelled reduction in properties
affected by odour
Detailed definition of performance measure: This is a new measure showing the
reduction in the number of properties affected by odour on a cumulative basis,
assessed through odour monitoring.
Odour modelling is carried out as part of the detailed design phase of a scheme
which confirms the point sources of odour and the reduction in emission rate
expected. The properties impacted are assessed by pre- and post-project odour
dispersion modelling.
Incentive type: Financial – reward and penalty
Performance commitments
Starting
level
Committed performance levels
Unit 2014-15 2015-16 2016-17 2017-18 2018-19 2019-20
PC Modelled
reduction in
properties
(cumulative)
14,311 0 793 1,771 6,593 6,593
Penalty
collar
Modelled
reduction in
properties
(cumulative)
0 0 0 0 3,874
Reward
cap
Modelled
reduction in
properties
(cumulative)
0 5,807 11,800 13,636
21,636
18,650
26,650

Draft price control determination notice: company-specific appendix – Thames Water
171
Incentive rates
Incentive type Performance levels (modelled
reduction in properties)
Incentive rate
(£/modelled
reduction in
properties/year) Lower Upper
Penalty 3,874 6,593 270
Reward 6,593 18,650 26,650 220
Additional details
Necessary detail on
measurement units
This is a new measure showing the reduction in the number of properties affected by odour. This is measured using a confirmation of point and area sources via odour dispersion modelling. The ODI is applied annually to the cumulative performance in each year. So, for example, a one year delay in reducing the incidence of odour by one modelled property would incur the annual penalty rate.
Frequency of PC
measurement and any
use of averaging
The penalty applies in each year to annual performance in all
five years of 2015-20. This will be calculated at PR19 based on
actuals for years 1-4 and forecast performance in year 5.
Performance against the commitment will be measured
annually.
Timing and frequency
of rewards/penalties
Penalties will be calculated at PR19, to be applied in 2020-25
Form of reward/penalty Adjustment to revenue
Any other information
or clarifications
relevant to correct
application of incentive
The penalty collar and reward caps represent an indicative level
of performance associated with the total financial value of the
penalty and reward over 2015-20. The penalty collar and reward
cap are binding as a total financial magnitude of £3m and
£6.66m £11m, respectively, over 2015-20 rather than as annual
levels of performance. In practice the collar and cap may be
reached through a number of profiles of performance over the
AMP.
_________________________________

Draft price control determination notice: company-specific appendix – Thames Water
172
Performance commitment SC8: Deliver 100% of agreed measures
to meet new environmental regulations
Detailed definition of performance measure: Proportion of agreed measures
completed to meet new environmental regulations. Agreed measures are defined as:
wastewater schemes listed on NEP4, except the Tideway Tunnel;
one successful application for first time sewerage;
11 specified WFD schemes to improve either biological oxygen demand
(BOD) or ammonia discharges;
13 specified WFD schemes to prevent water bodies deteriorating;
11 specified actions to enable Artificial and Heavily Modified Water bodies
under Thames Water ownership to achieve Good Ecological Potential; and
investigations into 192 intermittent discharges suspected of contributing to
WFD failures.
The Thames Tideway Tunnel is not included in this measure.
Incentive type: Financial – penalty only
Performance commitments
Unit Starting
level
Committed performance levels
2014-15 2015-16 2016-17 2017-18 2018-19 2019-20
PC % agreed
schemes
completed
n/a 100%
Penalty
collar
% agreed
schemes
completed
Do not
deliver
NEP5
Incentive rates
Incentive type Performance levels (%) Incentive rate
Lower Upper
Penalty Do not deliver
NEP5 100%
40% of cost
saved through
scope reduction

Draft price control determination notice: company-specific appendix – Thames Water
173
Additional details
Necessary detail on
measurement units
This measures compliance with the Environment Agency agreed
schemes for the agreed measures to meet new environmental
regulations
Frequency of PC
measurement and any
use of averaging
The penalty applies to performance at the end of 2015-20. This
will be calculated at PR19 based on actuals for years 1-4 and
forecasts for year 5 of 2015-20. Performance against the
commitment will be measured annually.
Timing and frequency
of rewards/penalties
Penalties will be calculated at PR19, to be applied in 2020-25
Form of reward/penalty Adjustment to RCV
Any other information
or clarifications
relevant to correct
application of incentive
This incentive will return 40% of the NEP5 2015-20 cost as a
result of reductions in scope used to estimate the 27 June 2014
submission. This will be in addition to the 50% of costs returned
after the totex menu reward. For the avoidance of doubt, this
does not apply to cost increases or to cost reductions as a result
of efficiencies.
If the final requirements are lower than Thames Water has
anticipated, the company will return 90% of the allowed costs
back to customers. If the final requirements are higher, the
company will seek to first reprioritise the schemes it will deliver
in 2015-20 and seek to complete the programme in the early
part of 2020-25, in advance of the regulatory deadline of
December 2021. If the overall level of investment is broadly
equivalent but slightly different from the specific schemes
Thames Water has identified, the company proposes that
schemes could be swapped, as long as certain criteria are met.
Investment has a regulatory requirement.
The Environment Agency agrees to the change.
The forecast cost to deliver the measure is broadly
equivalent.
Where benefits are applicable, the new scheme offers
greater or equivalent benefits.
Any residual regulatory requirements can be delivered in 2020-
25 or a transition period at the end of 2015-20.
Incentives will be applied in 2020-25 on an NPV-neutral basis.
_________________________________

Draft price control determination notice: company-specific appendix – Thames Water
174
Performance commitment SC9: Reduce the amount of phosphorus
entering rivers to help improve aquatic plant and wildlife
Detailed definition of performance measure: The amount of phosphorus
removed from rivers through the final NEP5 schemes by the end of 2015-20,
measured as kilograms per day. The delivery of NEP5 schemes will be reported and
signed-off independently by the Environment Agency through its annual MD109
report.
Load reductions are to be set on a theoretical basis using permitting data to
overcome seasonal, weather and measurement impacts and thereby keeping it
transparent and simple to regulate. Where no permitted phosphorus limit exists, the
assumed final effluent concentration will be considered to be 6 mg/l. This is the
average final effluent discharge concentration of phosphorus across all measured
sites where no phosphorus limit currently exists in the permit. Thames Water
proposes that the Environment Agency verifies the assumed load reductions.
Incentive type: Financial – reward and penalty
Performance commitments
Starting
level
Committed performance levels
Unit 2014-15 2015-16 2016-17 2017-18 2018-19 2019-20
PC Kg
removed/
day
n/a 151.8
Penalty collar Kg
removed/
day
0
Reward cap Kg
removed/
day
199
Incentive rates
Incentive type Performance levels (kg
removed/day)
Incentive rate
Lower Upper

Draft price control determination notice: company-specific appendix – Thames Water
175
Penalty 0.0 151.8 Determined by
reference to actual
costs and benefits
using reliable
projections as
soon as available
(and to be
included in annual
report on
outcomes
performance no
later than 2016-
17)
Reward 151.8 199 Determined by
reference to actual
costs and benefits
using reliable
projections as
soon as available
(and to be
included in annual
report on
outcomes
performance no
later than 2016-
17)
Additional details
Necessary detail on
measurement units
The measurement unit is kg/day of phosphorus removed from
rivers through the final NEP5 schemes, when confirmed, by the
end of 2015-20. Delivery of NEP5 schemes will continue to be
reported and signed-off independently by the Environment
Agency through its annual MD109 report. Thames Water
proposes that the Environment Agency would also verify the
assumed load reductions.
Frequency of PC
measurement and any
use of averaging
The penalty and reward apply to performance at the end of
2015-20. This will be calculated at PR19 based on actuals for
years 1-4 and forecasts for year 5 of 2015-20. Performance
against the commitment will be measured annually after the final
requirements are confirmed in January 2016.

Draft price control determination notice: company-specific appendix – Thames Water
176
Timing and frequency
of rewards/penalties
Rewards and penalties will be calculated at PR19, to be applied
in 2020-25
Form of reward/penalty Adjustment to RCV
Any other information
or clarifications
relevant to correct
application of incentive
The ODIs are based on the actual costs and benefits associated
with the specific solutions delivered against the commitment,
which will depend on the type of solution and the benefits
delivered through P reduction.
The annual benefits will be determined by the same method for
calculating the benefits of the 2015-20 programme.
Further details and worked examples are provided in PCR SC9
(27 June 2014).

Draft price control determination notice: company-specific appendix – Thames Water
177
Wholesale wastewater outcome D: We will provide the
level of customer service our customers require, in the
most economic and efficient manner, to ensure that bills
are no more than necessary
Performance commitment SD1: Energy imported less energy
exported
Detailed definition of performance measure: This is the net reduction in energy
from the grid (energy imported less energy exported) measured in gigawatt hours
(GWh), achieved by improving the energy efficiency of assets and increasing the
self-generation percentage across wastewater operations.
This performance measure takes into account all forecast movements in the use of
energy, including impacts from Thames Water’s wider investment programme and
efficiency activities. The specific programme is optimised at a company-wide level
and then allocated to water or wastewater service based on each site-specific
solution in the preferred programme. This performance commitment is allocated
100% to wholesale wastewater, being delivered solely by solutions on wastewater
sites.
Incentive type: Reputational
Performance commitments
Starting
level
Committed performance levels
Unit 2014-15 2015-16 2016-17 2017-18 2018-19 2019-20
PC GWh 457 428 392 329 303 295
Additional details
Necessary detail on
measurement units
The measurement unit is the net energy imported by wholesale
wastewater operations in GWh.
Frequency of PC
measurement and any
use of averaging
Performance commitment reported at end of each financial year
and reviewed through independent assurance process.

Draft price control determination notice: company-specific appendix – Thames Water
178
Household retail outcome A: Improving customer service
by doing the basics excellently and by getting things 'right
first time'
Performance commitment RA1: Minimise the number of written
complaints received from customers
Detailed definition of performance measure:
The number of written complaints relating to charging and billing, per 10,000
connected properties.
Incentive type: Reputational
Performance commitments
Starting
level
Committed performance levels
Unit 2014-15 2015-16 2016-17 2017-18 2018-19 2019-20
PC Number of
written
complaints
per 10,000
connected
properties
16 16 17 18 17 15
Additional details
Necessary detail on
measurement units
The measurement unit is the number of written
complaints relating to charging and billing, per 10,000
connected properties.
Thames Water has allocated written complaints
based on the CCWater allocations in its 2012-13
complaints report. The allocation between household
and non-household is based on Thames Water’s
finance cost allocation (94% household and 6% non-
household).
This is rounded to the nearest integer.
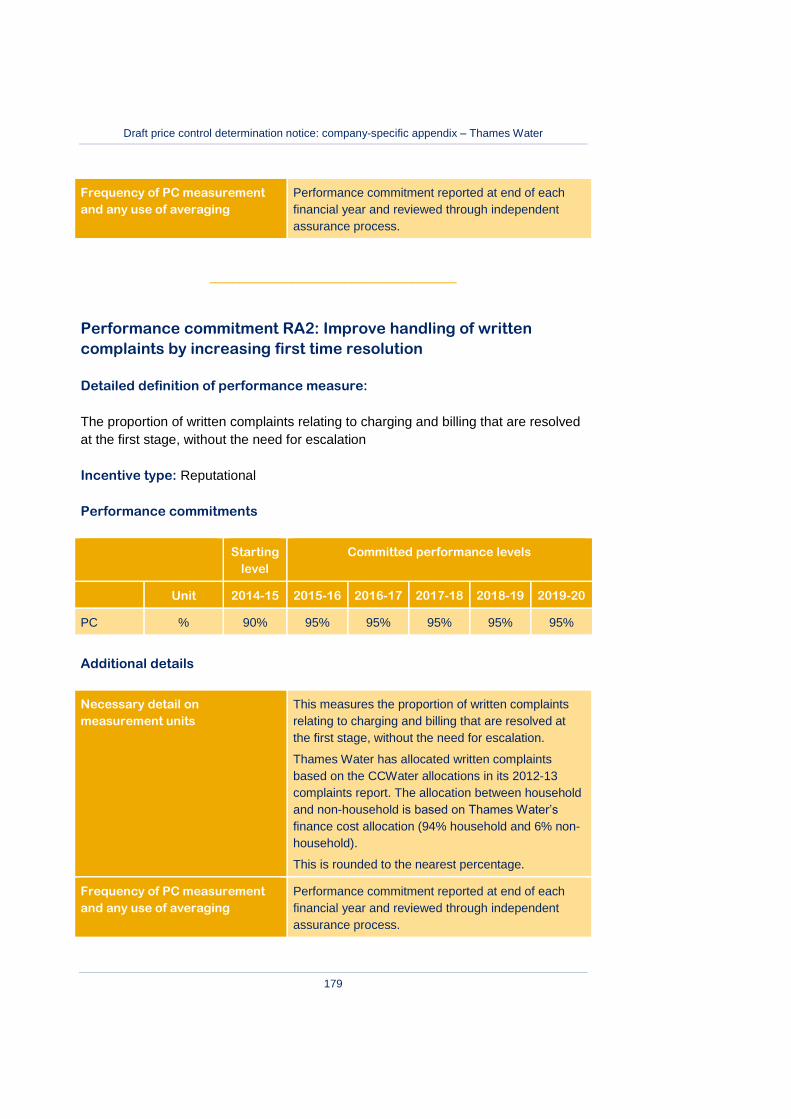
Draft price control determination notice: company-specific appendix – Thames Water
179
Frequency of PC measurement
and any use of averaging
Performance commitment reported at end of each
financial year and reviewed through independent
assurance process.
_________________________________
Performance commitment RA2: Improve handling of written
complaints by increasing first time resolution
Detailed definition of performance measure:
The proportion of written complaints relating to charging and billing that are resolved
at the first stage, without the need for escalation
Incentive type: Reputational
Performance commitments
Starting
level
Committed performance levels
Unit 2014-15 2015-16 2016-17 2017-18 2018-19 2019-20
PC % 90% 95% 95% 95% 95% 95%
Additional details
Necessary detail on
measurement units
This measures the proportion of written complaints
relating to charging and billing that are resolved at
the first stage, without the need for escalation.
Thames Water has allocated written complaints
based on the CCWater allocations in its 2012-13
complaints report. The allocation between household
and non-household is based on Thames Water’s
finance cost allocation (94% household and 6% non-
household).
This is rounded to the nearest percentage.
Frequency of PC measurement
and any use of averaging
Performance commitment reported at end of each
financial year and reviewed through independent
assurance process.

Draft price control determination notice: company-specific appendix – Thames Water
180
_________________________________
Performance commitment RA3: Improve customer satisfaction of
retail customers – charging and billing service
Detailed definition of performance measure:
The average customer satisfaction score (from a scale of 1 to 5) for the charging and
billing services by the household retail business, using Thames Water’s internal
CSAT monitor.
Incentive type: Reputational
Performance commitments
Starting
level
Committed performance levels
Unit 2014-15 2015-16 2016-17 2017-18 2018-19 2019-20
PC Mean score
out of 5
4.40 4.45 4.55 4.45 4.60 4.65
Additional details
Necessary detail on
measurement units
The measurement unit is the customer satisfaction
score (out of 1 to 5) for the charging and billing
services.
This is based on the average customer score from
Thames Water’s internal CSAT monitor, which is
based on ‘resolved contacts’ aligned with SIM in
2010-15. The coding of customer feedback to
charging and billing services is done in the internal
CSAT tool and is quality checked each month.
This is rounded to two decimal places.
Frequency of PC measurement
and any use of averaging
Performance commitment reported at end of each
financial year and reviewed through independent
assurance process.
_________________________________

Draft price control determination notice: company-specific appendix – Thames Water
181
Performance commitment RA4: Improve customer satisfaction for
retail customers – operations contact centre
Detailed definition of performance measure:
The average customer satisfaction score (from a scale of 1 to 5) for the operational
contact services by the household retail business, using Thames Water’s internal
CSAT monitor.
Incentive type: Reputational
Performance commitments
Starting
level
Committed performance levels
Unit 2014-15 2015-16 2016-17 2017-18 2018-19 2019-20
PC Mean score
out of 5 4.40 4.45 4.52 4.57 4.60 4.65
Additional details
Necessary detail on
measurement units
The measurement unit is the customer satisfaction
score (out of 1 to 5) for the operational contact
centre.
This is based on the average customer score from
Thames Water’s internal CSAT monitor, which is
based on ‘resolved contacts’, aligned with SIM in
2010-15. The coding of customer feedback to
operational contact centre is done in the internal
CSAT tool and is quality checked each month.
This is rounded to two decimal places.
Frequency of PC measurement
and any use of averaging
Performance commitment reported at end of each
financial year and reviewed through independent
assurance process.
_________________________________
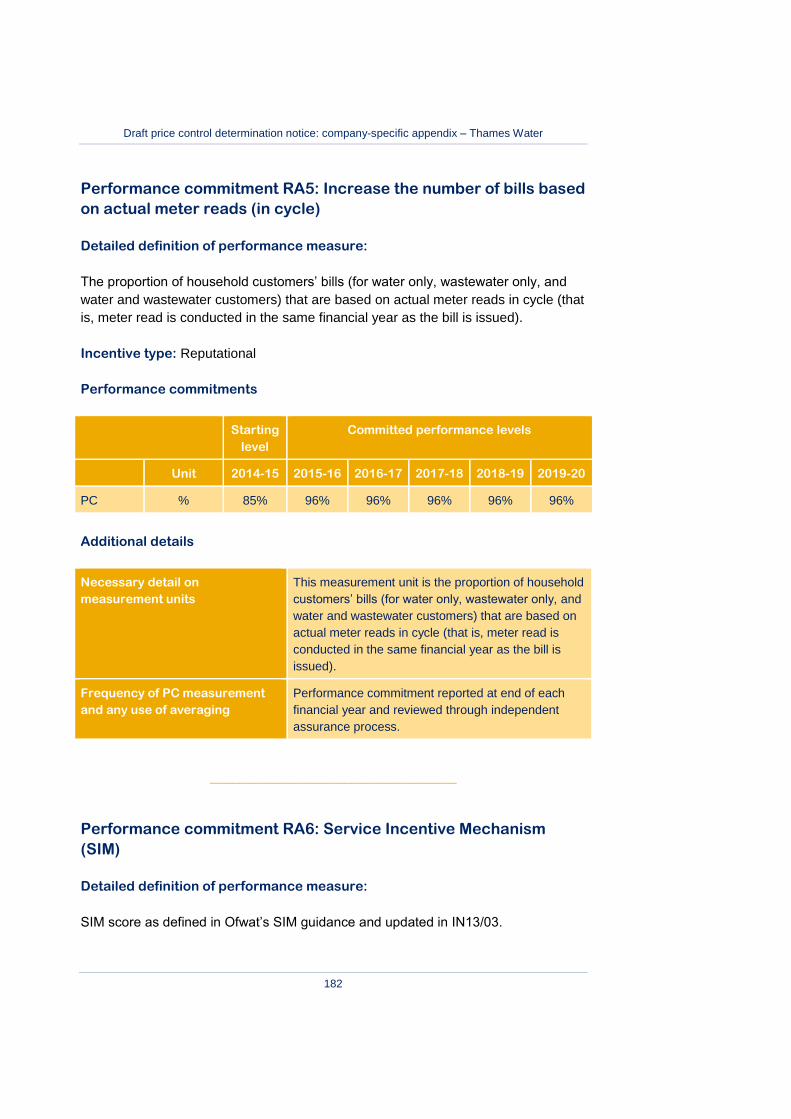
Draft price control determination notice: company-specific appendix – Thames Water
182
Performance commitment RA5: Increase the number of bills based
on actual meter reads (in cycle)
Detailed definition of performance measure:
The proportion of household customers’ bills (for water only, wastewater only, and
water and wastewater customers) that are based on actual meter reads in cycle (that
is, meter read is conducted in the same financial year as the bill is issued).
Incentive type: Reputational
Performance commitments
Starting
level
Committed performance levels
Unit 2014-15 2015-16 2016-17 2017-18 2018-19 2019-20
PC % 85% 96% 96% 96% 96% 96%
Additional details
Necessary detail on
measurement units
This measurement unit is the proportion of household
customers’ bills (for water only, wastewater only, and
water and wastewater customers) that are based on
actual meter reads in cycle (that is, meter read is
conducted in the same financial year as the bill is
issued).
Frequency of PC measurement
and any use of averaging
Performance commitment reported at end of each
financial year and reviewed through independent
assurance process.
_________________________________
Performance commitment RA6: Service Incentive Mechanism
(SIM)
Detailed definition of performance measure:
SIM score as defined in Ofwat’s SIM guidance and updated in IN13/03.

Draft price control determination notice: company-specific appendix – Thames Water
183
Incentive type: Reward and Penalty
Performance commitments
Starting
level
Committed performance levels
Unit 2014-15 2015-16 2016-17 2017-18 2018-19 2019-20
PC Score tbc tbc tbc tbc tbc
Additional details
Necessary detail on
measurement units
Ofwat determined reward and penalty incentive
Frequency of PC measurement
and any use of averaging
Annual
Timing and frequency of
rewards/penalties
Penalties and rewards will be calculated at PR19, to
be applied in 2020-25
Form of reward/penalty Adjustment to Revenue
Any other information or
clarifications relevant to correct
application of incentive
Ofwat determined reward and penalty incentive

Draft price control determination notice: company-specific appendix – Thames Water
184
Household retail outcome B: Offer a choice of easy to use
contact options
Performance commitment RB1: Implement new online account
management for customers supported by web-chat
Detailed definition of performance measure:
The delivery of the new online self-serve channel. Delivery is measured by the ‘go
live’ date being achieved by the end of the relevant financial year (that is, 31 March).
‘Go Live’ is defined as it being used to bill customers, update accounts, capture
contacts, record payments, and for online account management that Thames
Water’s customers can sign up for to use the new service. It will also provide the
functionality to deliver alternative tariffs.
Incentive type: Financial – penalty only
Performance commitments
Unit Starting
level
Committed performance levels
2014-15 2015-16 2016-17 2017-18 2018-19 2019-20
PC Status Limited
online
Limited
online
Limited
online
New
online
self-serve
channel
Online
self-serve
channel
Online self-
serve channel
Penalty
collar
Status CRMB billing
system not
commissioned
nor on track for
2020-25
delivery
Penalty
deadband
Status CRMB
billing
system
does not
‘go live’
CRMB billing
system does
not ‘go live’

Draft price control determination notice: company-specific appendix – Thames Water
185
Incentive rates
Incentive type Performance levels (status) Incentive rate
(£/status) Lower Upper
Penalty CRMB billing
system does not ‘go
live’
£6.5m in years 4 and 5
Penalty CRMB billing
system not
commissioned
or on track for
2020-25
delivery
CRMB billing
system does not ‘go
live’
Additional £20.5m
applicable in year 5 (total
2015-20 allowed cost in
ACTS adjustment plus
premium)
Additional details
Necessary detail on
measurement units
The measurement unit is the delivery of the new online
self-serve channel. Delivery is measured by the ‘go live’
date being achieved by the end of the relevant financial
year (that is, 31 March).
Frequency of PC
measurement and any use of
averaging
Performance commitment reported at end of each
financial year and reviewed through independent
assurance process.
Timing and frequency of
rewards/penalties
Penalties will be calculated at PR19, to be applied in
2020-25
Form of reward/penalty Adjustment to revenue
Any other information or
clarifications relevant to
correct application of
incentive
This commitment is fully enabled by the system and has
a commitment to ‘go live’ as being by the end of 2017-
18. ‘Go Live’ would be defined as it being used to bill
customers, update accounts, capture contacts, record
payments, and for online account management that
Thames Water’s customers can sign up for to use the
new service. It will also provide the functionality to
deliver alternative tariffs.
Failure of the system to ‘go live’ will incur a penalty of
£6.5m in each of years 4 and 5, based on the
annualised benefit value to customers.
In addition, an ODI penalty of up to a maximum of the
allowed 2015-20 cost (depreciation charge net of opex

Draft price control determination notice: company-specific appendix – Thames Water
186
savings, which is equal to £18.6m) plus a 10% premium
to ensure that Thames Water has an incentive to deliver
the system, resulting in a maximum penalty of £20.5m.
The ODI penalty relates to whether the system ‘goes
live’ in 2015-20 and, if not, whether this is due to causes
within reasonable management control. The plan will be
to roll-out the system to all customers, with ‘go live’
being the start of this roll-out to customers. ‘Reasonable
management control’ will depend on the specific
circumstances, but the test is whether the issue could
have been foreseen and/or efficiently mitigated by a
prudent company.
The ODI therefore works as follows under four possible
outcomes:
1. The system ‘goes live’ in 2015-20 (that is, by 31
March 2020), roll out to all customers has started
in 2015-20, and a plan is available to complete
the roll out in 2020-25
No ODI penalty for year 5. £6.5m penalty
applies in year 4 if ‘go live date is after 31st
March 2019.
2. The system ‘goes live’ in 2015-20 but to a lower
specification than planned (for example, limited
functionality, or the plan is to roll out the system
to only a subset of customers)
ODI penalty to return appropriate portion of
allowed 2015-20 cost (plus 10% premium).
Penalty is calculated by Thames Water and
verified by an independent third party, in line
with approach to independent assurance for
all ODIs. In addition, £6.5m penalty in year 4
if ‘go live’ date is after 31 March 2019.
3. The system does not ‘go live’ in 2015-20, due to
unforeseen reasons outside reasonable
management control (for example, legislative or
market changes, significant contractual dispute),
but Thames Water can demonstrate mitigating
actions and is on track for full system roll out in
2020-25
£6.5m penalty to compensate customers for
lost benefit for both years 4 and year 5. Need
to ensure 2020-25 funding to deliver the
system does not double-count 2015-20
funding. This is subject to third party

Draft price control determination notice: company-specific appendix – Thames Water
187
verifications and assurance, in line with
approach to independent assurance for all
ODIs
4. The system does not ‘go live’ in 2015-20, where:
(i) this is due to reasons within reasonable
management control; or (ii) Thames Water is not
on track for full system roll out in 2020-25
ODI penalty of £20.5m (that is, equal to
allowed 2015-20 depreciation net of opex
savings plus 10% premium). This is subject
to third party verifications and assurance, in
line with approach to independent
assurance for all ODIs. In addition, £6.5m
penalty for both years 4 and year 5 to
compensate customers for the lost benefit of
the system.
Performance and the financial ODI will be assured
independently; Thames Water will report performance in
a transparent manner to its customers, stakeholders and
Customer Group. Thames Water will publish progress
against this performance commitment on an annual
basis, providing transparency to customers and ensuring
incentives for the company remain current.

Draft price control determination notice: company-specific appendix – Thames Water
188
Household retail outcome C: Improving cash collection
from those that can pay and helping those that are
struggling to pay
Performance commitment RC1: Increase the number of customers
on payment plans
Detailed definition of performance measure:
The percentage of customers (water only, wastewater only, and water and
wastewater) paying their bill using a direct debit payment plan. The performance
commitment excludes the effect of the Thames Tideway Tunnel.
Incentive type: Reputational
Performance commitments
Starting
level
Committed performance levels
Unit 2014-15 2015-16 2016-17 2017-18 2018-19 2019-20
PC % 52% 53% 54% 54% 57% 60%
Additional details
Necessary detail on
measurement units
This measures the percentage of customers (water
only, wastewater only, and water and wastewater)
paying their bill using a direct debit payment plan.
Frequency of PC measurement
and any use of averaging
Performance commitment reported at end of each
financial year and reviewed through independent
assurance process.

Draft price control determination notice: company-specific appendix – Thames Water
189
Performance commitment RC2: Increase cash collection rates
Detailed definition of performance measure: The percentage of cash collected
from the billing in that year. This includes all household customers. The performance
commitment excludes the effect of the Thames Tideway Tunnel.
Incentive type: Reputational
Performance commitments
Starting
level
Committed performance levels
Unit 2014-15 2015-16 2016-17 2017-18 2018-19 2019-20
PC % 88.6% 89.0% 89.5% 90.0% 90.0% 91.0%
Additional details
Necessary detail on
measurement units
The measurement unit is the percentage of cash
collected from the billing in that year. This includes all
household customers.
Frequency of PC measurement
and any use of averaging
Performance commitment reported at end of each
financial year and reviewed through independent
assurance process.

Draft price control determination notice: company-specific appendix – Thames Water
190
Thames Tideway Tunnel outcome: Thames Water is
committed to improving outcomes for customers and for
the environment, notably by intercepting significant
sewage discharges into the tidal River Thames, working
together with the IP to ensure the timely and cost-efficient
delivery of the TTT project
Performance commitment T1: We will limit the extent of delays on
the overall programme timeline
Detailed definition of performance measure: TWUL will work positively to limit
the extent of delays on the project. This performance commitment has three strands.
A. Successful procurement of the Infrastructure Provider.
B. Acquisition of land rights for the project (subject to planning permission).
C. Completion of construction activities and timely availability of sites to the IP.
Performance commitments: T1A – Successful procurement of the Infrastructure
Provider
Incentive type: Reputational
Starting
level
Committed performance levels
Unit 2014-15 2015-16 2016-17 2017-18 2018-19 2019-20
PC Status IP award
(according
to the
project
timetable)
Thames to confirm the expected IP award date for the final determination.
Thames Water proposed an allowance for additional work to be carried out prior to
the procurement of the IP; we have not included this within our draft determination. If
Thames Water justifies the inclusion of this allowance for our final determination then
we would be minded to introduce a penalty only incentive to ensure customers are
compensated in the event the IP is procured at an earlier date.

Draft price control determination notice: company-specific appendix – Thames Water
191
Performance commitments: T1B – Acquisition of land rights for the project
(subject to planning permission).
Incentive type: Reputational
Starting
level
Committed performance levels
Unit 2014-15 2015-16 2016-17 2017-18 2018-19 2019-20
PC Acquire land access rights in line with programme in the development
consent order (DCO) and programme timetable to be agreed with
Ofwat
Additional details
Necessary detail on
measurement units
Thames will monitor and report against the extent of delays
to acquisition of land rights. Thames Water will publish
information from its planning permission and/or its
programme timetable setting out by when rights must be
acquired. We understand that this timetable may be
impacted by the outcome of the DCO and this will be
confirmed post the DCO.
Performance commitments: T1C – Completion of category 2 and 3 construction
works and timely availability of sites to the IP.
Incentive type: Financial – penalty only
Starting
level
Committed performance levels
Unit 2014-15 2015-16 2016-17 2017-18 2018-19 2019-20
PC Number
of sites
0 0 0 5 12 7
Penalty deadband Number
of sites
0 0 5 12 7
Penalty collar Number
of sites
0 0 0 0 0

Draft price control determination notice: company-specific appendix – Thames Water
192
The final delivery profile will be agreed post the award of the Main Works contracts
after the process to optimise the programme.
Incentive rates
Incentive type Performance levels (status) Incentive rate (status)
Lower Upper
Penalty 0 12 £2.217m per site
Additional details
Necessary detail on
measurement units
Thames Water will monitor the extent of programme
delays.
To monitor the delivery of T1C, Thames Water will
publish details from Appendix 5 annex 4 – Detailed
information on construction activities (submitted on
27 June 2014), setting out the Category 2 and 3
activities by year and providing further site-specific
details for example, when the site needs to be
vacated for the IP to begin work. Costs and details of
Cat 1 works have been redacted from the published
document for reasons of commercial confidentiality.
This delivery profile is currently subject to change as
it undergoes a process of optimisation. The final
delivery profile will be confirmed no later than the
award of the Infrastructure Provider contract.
Frequency of PC measurement
and any use of averaging
Performance commitment reported at the end of each
financial year and reviewed through independent
assurance process
Timing and frequency of
rewards/penalties
Penalties will be calculated annually and applied to
the total five-year position in 2015-20. Rewards and
penalties to be calculated at PR19, to be applied at
2020-25
Form of reward/penalty RCV adjustment

Draft price control determination notice: company-specific appendix – Thames Water
193
Any other information or
clarifications relevant to correct
application of incentive
The penalty rate is based on our view of the
annualised average incremental cost per site of the
category 2 and 3 works. A 25% increase has been
applied.
Each site can only be penalised for delayed delivery
once within the AMP period.
_________________________________
Performance commitment T2: We will engage effectively with the
IP, and other stakeholder, both in terms of integration and
assurance
Detailed definition of performance measure: Thames Water and the IP will need
to work effectively together to achieve a successful outcome for the project. Thames
Water will need to work closely with the IP, and other stakeholders, to seek to deliver
its activities on a timely and efficient basis.
Incentive type: Reputational
Performance commitments
Starting
level
Committed performance levels
Unit 2014-15 2015-16 2016-17 2017-18 2018-19 2019-20
PC Status n/a Engage
effectively
with IP
and other
stakeholde
rs
Engage
effectively
with IP
and other
stakeholde
rs
Engage
effectively
with IP
and other
stakeholde
rs
Engage
effectively
with IP
and other
stakeholde
rs
Engage
effectively
with IP
and other
stakeholde
rs
Additional details
Necessary detail on
measurement units
Thames Water will monitor delivery of this
commitment using the following measures:
In assessing and reporting performance against this
commitment, Thames Water will seek views from the

Draft price control determination notice: company-specific appendix – Thames Water
194
IP and other relevant parties including any
Independent Expert appointed by the IP, Ofwat and
Defra. Thames will develop a standard approach to
obtain this information, and commence monitoring
from the date of the IP award.
Frequency of PC measurement
and any use of averaging
Performance commitment reported at the end of each
financial year.
Any other information or
clarifications relevant to correct
application of incentive
A summary of the results will be published annually.
_________________________________
Performance commitment T3: We will engage with our customers
to build understanding of the Thames Tideway Tunnel project
Detailed definition of performance measure: TWUL will undertake a programme
of ongoing engagement with our customers and collaborate with water-only
companies to understand and measure customers’ views.
Incentive type: Reputational
Performance commitments – To be determined
Starting
level
Committed performance levels
Unit 2014-15 2015-16 2016-17 2017-18 2018-19 2019-20
PC Improvin
g trend
Improvin
g trend
Improvin
g trend
Improvin
g trend
Improving
trend
Additional details
Necessary detail on
measurement units
Thames Water will design and commission suitable
customer research to understand and measure
customer views, including on key indicators such as
awareness of the TTT, understanding of why it is
needed, support for the project, acceptability of bill
impacts and their perceived affordability.

Draft price control determination notice: company-specific appendix – Thames Water
195
Thames Water will collaborate with the water-only
companies and licensed retail suppliers operating in
its region to develop a joined up communications
strategy.
Thames Water will consider both the overall
customer base as well as more local issues,
particularly around communities impacted by
construction works.
The performance commitment should be determined
during 2015-20 based on the outcomes of this work
on the ongoing research and communications
strategy.
Frequency of PC measurement
and any use of averaging
A summary of the results will be published at least
annually.

Draft price control determination notice: company-specific appendix – Thames Water
196
Annex 5 Thames Tideway Tunnel Control – uncertainty
We set out our proposals for uncertainty mechanisms for the TTT Control in section A4.4. We set out further detail on Thames
Water’s proposals and our assessment of the uncertainty mechanism in the table below.
Table AA5.1 Thames Water proposals for TTT Control uncertainty mechanisms
Thames Water proposals Our assessment
Thames Water proposed:
50:50 (customers : Thames) cost
sharing for costs that carry a similar
level of risk to the rest of Thames
Water's activities (typical costs);
90:10 cost sharing for costs that carry
a difference level of risk to the rest of
Thames Water's activities; and,
100:0 cost sharing for land.
Thames Water proposed all ‘atypical’
activities to be funded at its assessment
of P50 costs, with a 90:10 cost sharing
rate and a cap and collar for atypical
costs at P10 and P90 such that there was
100% pass through of costs to customers
above P90 and 100% return of costs to
customers below P10.
Our review of the costs and activities included in the atypical category in the company’s
business plan, showed that nearly all of the costs could be better categorised as relating to
typical, business as usual activities.
In some cases the atypical nature of the costs is due to the uncertainties associated with (i)
the outcome of the planning consent process and (ii) the timing of the award of the licence
to the Infrastructure Provider (IP).
Our assessment has focused on: the materiality of the costs, the extent to which
management can control the outcome, the extent to which the risk is unique to the Thames
Tideway project, and whether the it is reasonable for customers to bear the risk.
Materiality – both uncertainties above introduce material specific risks to the delivery of
the overall programme. At the extreme, the outcome of the planning process could be a
requirement for Thames Water to resubmit its planning application which could be material
to the company in terms of costs and delay to the project.
Management control – the outcome of the planning process is now out of the
management control of Thames Water. The timing of the award of the licence to the IP
introduces risks including those that are beyond management control. However, there is
scope for Thames Water to influence the impact of planning decisions on the company

Draft price control determination notice: company-specific appendix – Thames Water
197
Thames Water proposals Our assessment
In addition, Thames Water proposed
variations to the base costs by agreement
with Ofwat due to (i) scope swaps in the
programme of work allocated to Thames
Water and the IP both pre- and post-
licence award to the IP and (ii) the impact
of planning.
once risks materialise. This is also true for the delay to the appointment of an IP.
Unique risk – these risks are unique to Thames Water. There is currently uncertainty
around the outcome of the planning process which is expected to be known in September
2014. The outcome may provide increased certainty in respect of the timing and activities
to be carried out by Thames. However there are a range of scenarios where the impact on
Thames Water may be no more certain than it is today. There is also uncertainty around
the timing of the award of the licence to the IP, although this is at least partly within
Thames Water’s control.
Reasonable for customers to bear – facilitated by a separate price control, our
approach is to consider risk in the round for the TTT price control, and for this risk to be
appropriately remunerated by the cost of capital. On this basis we are concerned that
Thames Water's proposed 90:10 cost sharing rate (with 100% pass through above P90
and base cost variations by agreement with Ofwat) may not provide adequate incentives
on Thames Water to deliver its obligations efficiently for customers.
Reasonable for customers to bear – facilitated by a separate price control, our
approach is to consider risk in the round for the TTT price control, and for this risk to be
appropriately remunerated by the cost of capital. On this basis we are concerned that
Thames Water's proposed 90:10 cost sharing rate (with 100% pass through above P90
and base cost variations by agreement with Ofwat) may not place adequate incentives on
Comment [NW1]: Consider using 'to'

Draft price control determination notice: company-specific appendix – Thames Water
198
Thames Water proposals Our assessment
Thames Water to deliver its obligations efficiently for customers.
We discuss our proposals in respect of an uncertainty mechanism for the TTT control
below. However, due to the uncertainty around the outcome of the planning process, we
have deferred a decision on how to handle the consequences until after the outcome is
known. We will revisit both the appropriate allowed costs and the potential requirement for
associated uncertainty mechanisms for the final determination.
For land costs and income from land, we agreed a 100:0 sharing mechanism at the 2009
price review and we propose to continue with this approach to ensure customers benefit
fully from any income in relation to the project land throughout the construction period and
that customers receive the full benefit of proceeds from the disposal of this land as the
project nears completion.
Changes in scope (between Thames
Water and the IP)
Thames proposed that all changes in
scope between Thames Water and the IP
should be subject to an uncertainty
mechanism.
As discussed above, there is a risk that this timetable may be delayed by circumstances
that could be outside of Thames Water's control.
This could result in reallocation of activities to Thames Water that would otherwise have
been undertaken by the IP (for example, to keep the overall programme on track) and that
are in the interests of customers and the environment.
We propose an uncertainty mechanism where there is delay to the appointment of the IP
from the expected date (Thames will need to confirm this date for final determinations).
This could be dealt with by a PR19 true up mechanism and a bespoke, two-way notified
item for this price control period.
The uncertainty mechanism would address only the efficient, net change in costs to
Thames Water that arise from the reallocation of scope from the IP to Thames (and
Thames Water to the IP) to secure efficient project delivery in the light of any delay to the
appointment of the IP. We would expect Thames Water to demonstrate how such ‘scope
swaps’ are in customers’ interests. Moreover, we expect Thames Water to demonstrate
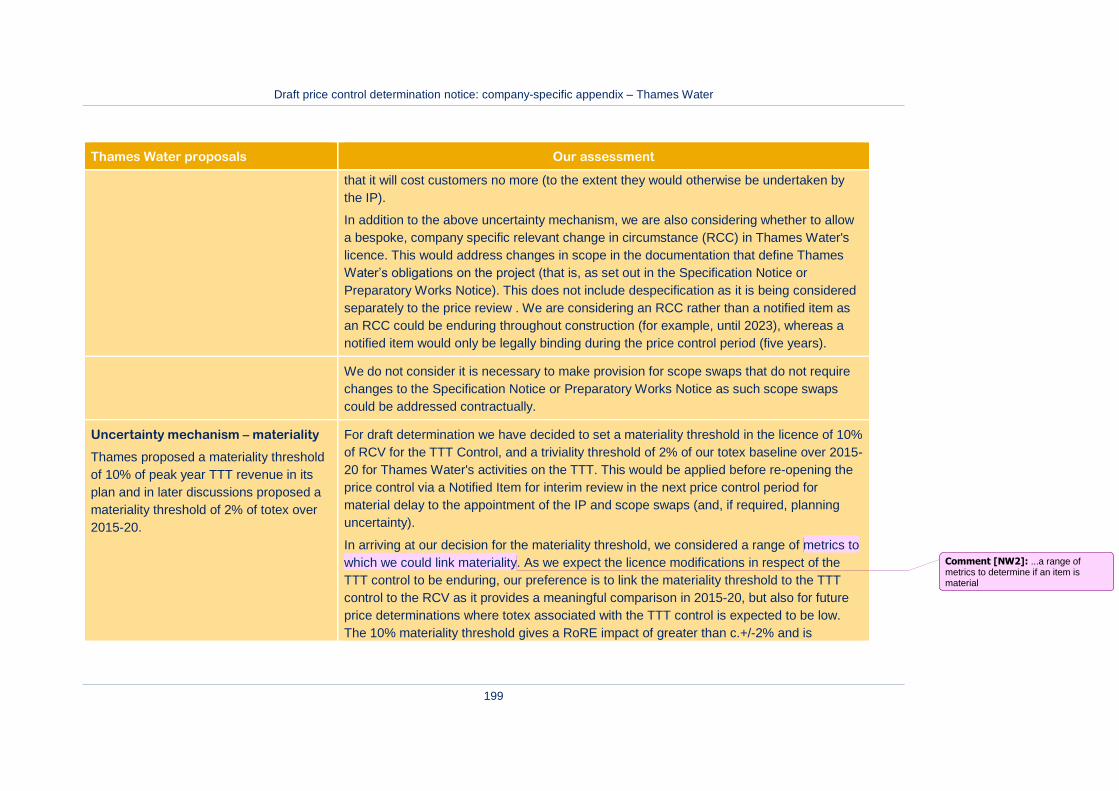
Draft price control determination notice: company-specific appendix – Thames Water
199
Thames Water proposals Our assessment
that it will cost customers no more (to the extent they would otherwise be undertaken by
the IP).
In addition to the above uncertainty mechanism, we are also considering whether to allow
a bespoke, company specific relevant change in circumstance (RCC) in Thames Water's
licence. This would address changes in scope in the documentation that define Thames
Water’s obligations on the project (that is, as set out in the Specification Notice or
Preparatory Works Notice). This does not include despecification as it is being considered
separately to the price review . We are considering an RCC rather than a notified item as
an RCC could be enduring throughout construction (for example, until 2023), whereas a
notified item would only be legally binding during the price control period (five years).
We do not consider it is necessary to make provision for scope swaps that do not require
changes to the Specification Notice or Preparatory Works Notice as such scope swaps
could be addressed contractually.
Uncertainty mechanism – materiality
Thames proposed a materiality threshold
of 10% of peak year TTT revenue in its
plan and in later discussions proposed a
materiality threshold of 2% of totex over
2015-20.
For draft determination we have decided to set a materiality threshold in the licence of 10%
of RCV for the TTT Control, and a triviality threshold of 2% of our totex baseline over 2015-
20 for Thames Water's activities on the TTT. This would be applied before re-opening the
price control via a Notified Item for interim review in the next price control period for
material delay to the appointment of the IP and scope swaps (and, if required, planning
uncertainty).
In arriving at our decision for the materiality threshold, we considered a range of metrics to
which we could link materiality. As we expect the licence modifications in respect of the
TTT control to be enduring, our preference is to link the materiality threshold to the TTT
control to the RCV as it provides a meaningful comparison in 2015-20, but also for future
price determinations where totex associated with the TTT control is expected to be low.
The 10% materiality threshold gives a RoRE impact of greater than c.+/-2% and is
Comment [NW2]: ...a range of metrics to determine if an item is material

Draft price control determination notice: company-specific appendix – Thames Water
200
Thames Water proposals Our assessment
equivalent to over 10% of totex included in this draft determination.
For triviality, we propose to adopt Thames Water's proposal for the materiality threshold of
2% of totex. The triviality threshold will not be embedded in the licence and would be used
for notified items and at the next price review to allow Thames Water to log up efficient
costs in relation material IP delay and scope swaps (and, if required, planning uncertainty).
We will determine the triviality threshold for future price control periods at the relevant price
review that is, we will determine the triviality threshold for period 2020-25 at the 2019 price
review.
We expect Thames Water to set out its view on triviality and materiality in its
representations to us. We also expect Thames Water to set out its views on whether the
mechanism would better protect consumers if it could also be triggered should there be a
reduction to the scope of activities that are undertaken by Thames Water.

Ofwat (The Water Services Regulation Authority) is a non-ministerial
government department. We are responsible for making sure that the water
sector in England and Wales provides customers with a good quality and
efficient service at a fair price.
www.ofwat.gov.uk
Ofwat
Centre City Tower
7 Hill Street
Birmingham B5 4UA
Phone: 0121 644 7500
Fax: 0121 644 7699
Website: www.ofwat.gov.uk
Email: [email protected]
Photograph © freepixels.com
Printed on 75% minimum de-inked post-consumer waste paper
August 2014
© Crown copyright 2014
You may reuse this information (excluding logos) free of charge in any
format or medium, under the terms of the Open Government Licence v2.0.
To view this licence, visit http://www.nationalarchives.gov.uk/doc/open-
government-licence/version/2 or email [email protected].
Where we have identified any third party copyright information, you will
need to obtain permission from the copyright holders concerned.
Any enquiries regarding this publication should be sent to us at
This document is also available from our website at www.ofwat.gov.uk.