Ofwat SIM Survey · PDF file2 Introduction and Objectives Ofwat uses the SIM survey to measure...
51
1 Ofwat SIM Survey 2013/14 Annual Report Andrew Magee Matt Counsell April 2014 J2499
Transcript of Ofwat SIM Survey · PDF file2 Introduction and Objectives Ofwat uses the SIM survey to measure...

1
Ofwat SIM Survey 2013/14 Annual Report
Andrew Magee
Matt Counsell
April 2014
J2499
2
Introduction and Objectives
Ofwat uses the SIM survey to measure and track
the quality of service delivery of all 19 water
companies in the UK, based on every aspect of
customers’ direct experiences with them.
The overall objective of the research is to provide
a robust, comparable measure of how satisfied
consumers are with the end-to-end handling and
resolution of an actual recent billing, water or
sewerage issue by their water company.
A cross-section of customer experiences is
required, including all major reasons for contact
across all contact routes.
Robust data is needed on an annual basis to
provide:
• Comparative performance between different
water companies
• Trends of performance for individual water
companies
• Comparative performance of the water sector as
a whole versus energy, telecoms, broadband
and council service providers.
Data for 2011-12, 2012-13 and 2013-14 will be
used to support decisions on financial incentives
in 2014.

3
Sample Design and Structure
The vast majority of water company enquiries are
billing related. However, the survey sample is split
evenly between Billing and respective Operational
contacts, ensuring that all contact types are treated
with equal importance.
For the purpose of comparing overall satisfaction
between companies, water/sewerage company data
is weighted to 50% billing/25% water operations/
25% waste water operations. Water only company
data is weighted 50% billing/50% water operations.
Direct comparisons can be made between
companies with regard to billing and respective
operational results.
Per Company
Per annum
(800)
Per wave
(200)
Water & Sewerage Companies (WASCs)
Billing 267 66/67
Water Service
Operations 267 66/67
Waste Water
Service
Operations
266 66/67
Water Only Companies (WOCs)
Billing 400 100
Water Service
Operations 400 100

4
Sampling Principles
The samples from each of the 19 water
companies should be comparable:-
• Samples should be drawn from the same
time period, to minimise any risk of any
seasonal or short-term factors (fluctuating
demand or weather)
Ideally, each wave’s sample should be based on a
single week’s worth of contacts
Many of the smaller companies (and a few of the
bigger companies) include up to 8 weeks’ worth
of contacts to provide sufficient volume in each
category:
• Bournemouth, Cambridge, Dee Valley,
Portsmouth and South West Water provided
insufficient water ops sample to achieve the
full quotas on some waves.
• Nevertheless, sufficient sample information
was provided to provide an annual sample
size of at least 550 interviews (see page 8 for
full details), which remains a robust sample,
with results accurate to ±4.2%.
Fieldwork is completed within a tight timescale
following query resolution. A short timescale
keeps the issue fresh in the consumer’s mind.
All resolved customer contacts from the sampling
period should be included (including contacts by
telephone, online, in writing and by visit) to
provide a representative view of the customer
experience.

5
Sample Management The minimum information requirement was telephone number, reason for contact and date of resolution,
with contact name and domestic/commercial flag highly desirable. The following sample management
process is followed:-
Data files merged
Sample files
de-duplicated
1 in n sample
procedure
Missing data
tele-numbered
Sample files
de-duplicated
Companies can provide up to 10 separate data
files
De-duplicate on both telephone and account
numbers. Other unusable records removed
Ensures a representative sample is extracted for the
survey (in terms of commercial/domestic
customers, contact channel etc.)
Maximises representativeness of the sample
Tele-matched telephone numbers may be
duplicates of those already in sample

6
Fieldwork
Research was carried out using CATI, from
McCallum Layton’s Telephone Unit in Leeds.
Each water company’s interviews were
undertaken by multiple interviewers (an average
of 61 different interviewers per company over the
course of the year) to reduce the possibility of
interviewer bias.
The interview averages 12 minutes in length.
Industry comparison questions were asked in Q3
to contrast perceptions of the water industry to
other, similar service providers.
Demographic and socio-economic questions were
asked in Q4. While the sample was broadly
representative of the UK as a whole, younger age-
groups were slightly under-represented compared
to older age groups.
The survey is conducted on a quarterly basis; key
dates for each wave in 2013/14 are below:-
Wave Sampling Week Fieldwork Dates
Q1
2013/14
8th - 14th April
2013
10th April – 11th
May 2013.
Q2
2013/14
5th – 11th
August 2013
14th August – 7th
September 2013
Q3
2013/14
21st – 27th
October 2013
30th October –
22nd November
2013
Q4
2013/14
3rd – 9th
February 2014
12th February -
7th March 2014
Companies with limited sample may have had a
sampling period beginning up to 3 weeks earlier than
the sampling week (ie 4 weeks before fieldwork
commences) and, in some cases, running through the
fieldwork period also.

7
Performance Indicator and Weighting
The survey produces a single comparable
performance indicator (Q60) based on
customers’ overall satisfaction with their
experience.
• A mean score is reported between 1 and 5,
where 1 means ‘very dissatisfied’ and 5
means ‘very satisfied’
To enable comparisons of results between
companies, WASC data is weighted to 50%
billing/25% water operations/25% waste water
operations.
Additional weighting is required for Bristol
Water and Wessex Water as both companies’
billing enquiries are handled by the same call
centre. In total, 167 billing interviews are
obtained from customers contacting this call
centre each quarter.
800 interviews
per company pa
Per Company pa Unweighted
base
Weighted
base
Water And Sewerage Companies
Billing 267 400
Water service
operational
267 200
Waste water service
operational
266 200
Water Only Companies
Billing 400 400
Water service
operational
400 400

8
Total Interviews Completed 2013/14
* NB The same Bristol/Wessex shared billing
interviews appear next to both Bristol and
Wessex in the table.
Total Number of Interviews Completed in 2013/14
Affinity Water 800
Anglian Water 809
Bournemouth Water 705
Bristol Water 1,071*
Cambridge Water 712
Dee Valley Water 720
Northumbrian Water 804
Portsmouth Water 793
Severn Trent Water 804
South East Water 804
South Staffs Water 804
South West Water 732
Southern Water 798
Sutton & East Surrey Water 678
Thames Water 806
United Utilities Water 804
Welsh Water 808
Wessex Water 1,212*
Yorkshire Water 811
Total 14,804
At the 95% confidence level, these sample sizes
provide overall levels of accuracy for individual
percentages of at least:
16,800: ± 0.75%
800: ±3.5%
267: ±6.0%
200: ±6.9%
For significant differences between subgroups,
the following thresholds apply at the 95%
confidence level:
16,800 vs 16,800: ± 1.1%
800 vs 800: ±4.9%
267 vs 267: ±8.5%
267 vs 200: ±9.2%
200 vs 200: ±9.8%

9
Sample Quality

10
Total Number of Individual Records Sent
Total number of resolved contacts sent by each company. Duplicates removed.
*Bristol and Wessex Billing contacts are all shown in both Bristol and Wessex sample figures.
The number of useable, individual customer records provided by each water company varies markedly
depending on their size. In general, WASCs are able to provide a higher volume of resolved contacts than
WOCs as they have a larger customer base.
WASC Records Received
Thames 247,068
Severn Trent 182,097
Yorkshire 142,305
Northumbrian 103,745
United Utilities 101,576
Wessex 75,379
Anglian 72,455
Southern 68,139
Welsh 60,390
South West 48,807
WOC Records Received
Bristol 81,216
Affinity 70,099
South East 38,739
South Staffs 21,050
Sutton 17,103
Portsmouth 15,127
Dee Valley 9,411
Cambridge 8,440
Bournemouth 8,397
11
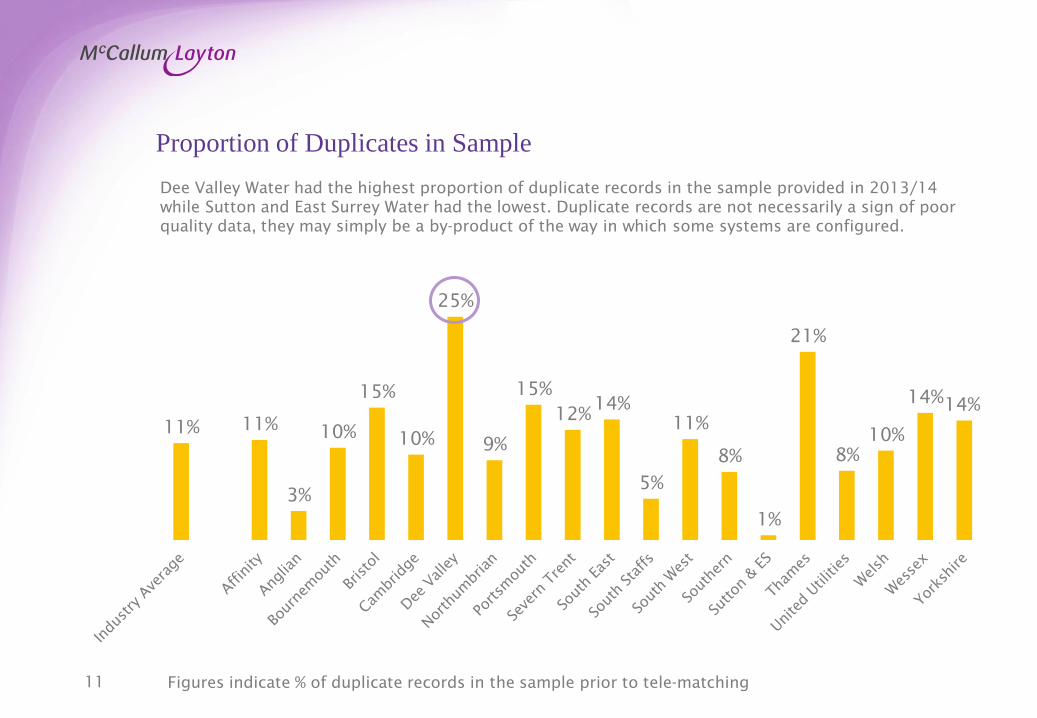
Proportion of Duplicates in Sample
11% 11%
3%
10%
15%
10%
25%
9%
15%
12% 14%
5%
11%
8%
1%
21%
8%
10%
14% 14%
Dee Valley Water had the highest proportion of duplicate records in the sample provided in 2013/14
while Sutton and East Surrey Water had the lowest. Duplicate records are not necessarily a sign of poor
quality data, they may simply be a by-product of the way in which some systems are configured.
Figures indicate % of duplicate records in the sample prior to tele-matching

12
Proportion Sent for Number Matching
15%
26%
8% 8%
12%
17% 18%
6%
27%
11%
13%
6%
12% 11%
27%
10%
18%
25%
15%
18%
The proportion of records without a useable telephone number indicates the quality of sample and how
up-to-date company records are.
Around one-quarter of the Portsmouth, Sutton and East Surrey, Affinity and Welsh Water samples had to
be sent for number matching as telephone numbers were not present or incomplete.
Northumbrian and South Staffs Water’s sample contained the highest proportion of valid telephone
numbers.
Figures indicate % of records without useable telephone number.
13
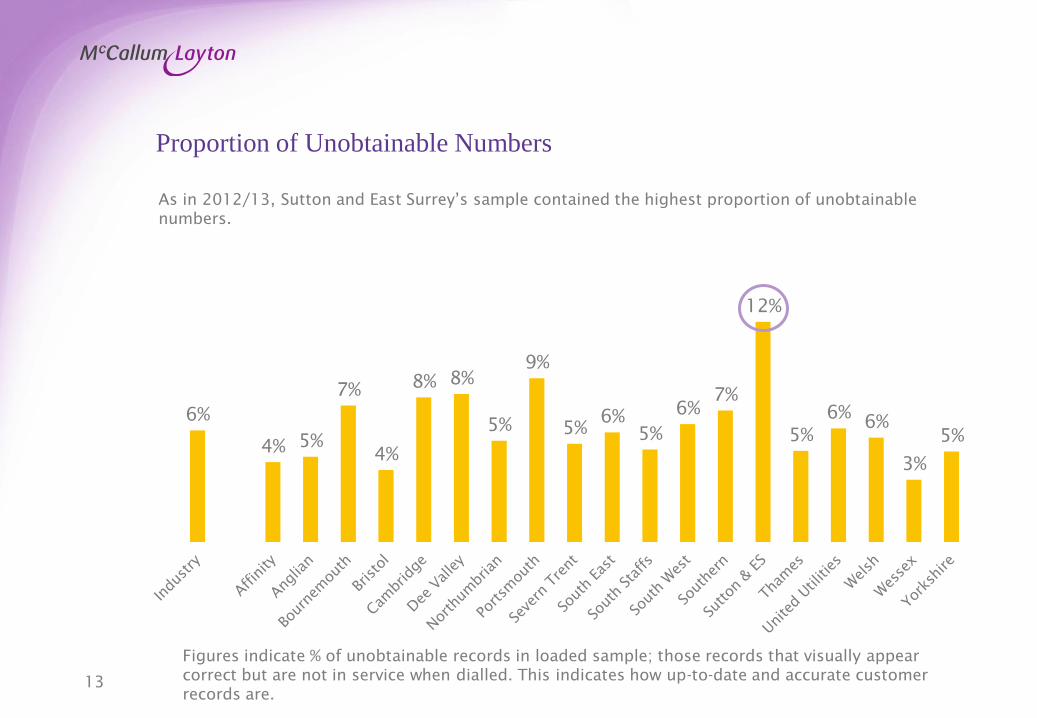
Proportion of Unobtainable Numbers
As in 2012/13, Sutton and East Surrey’s sample contained the highest proportion of unobtainable
numbers.
Figures indicate % of unobtainable records in loaded sample; those records that visually appear
correct but are not in service when dialled. This indicates how up-to-date and accurate customer
records are.
6%
4% 5%
7%
4%
8% 8%
5%
9%
5% 6%
5%
6%
7%
12%
5%
6% 6%
3%
5%

14
Total Proportion of Useable Records
Figures indicate % of useable records (excluding duplicates) after removing those without telephone
numbers that cannot be tele-matched and unobtainable numbers. The higher the figure, the more
representative the sample is.
The proportion of useable records across the industry was inline with 2012/13. Northumbrian and South
Staffs had the highest proportion of useable records in the sample and Sutton and East Surrey the least.
80%
73%
87%
83%
85%
76% 75%
89%
68%
85%
81%
89%
83% 83%
65%
85%
78%
74%
83%
79%
15
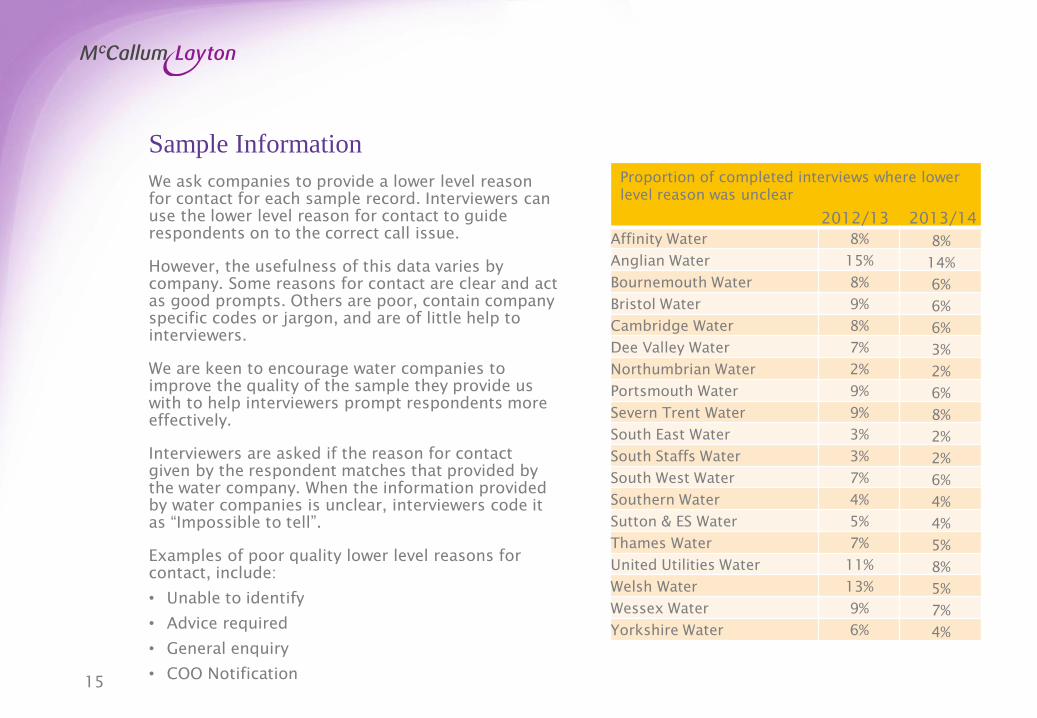
We ask companies to provide a lower level reason
for contact for each sample record. Interviewers can
use the lower level reason for contact to guide
respondents on to the correct call issue.
However, the usefulness of this data varies by
company. Some reasons for contact are clear and act
as good prompts. Others are poor, contain company
specific codes or jargon, and are of little help to
interviewers.
We are keen to encourage water companies to
improve the quality of the sample they provide us
with to help interviewers prompt respondents more
effectively.
Interviewers are asked if the reason for contact
given by the respondent matches that provided by
the water company. When the information provided
by water companies is unclear, interviewers code it
as “Impossible to tell”.
Examples of poor quality lower level reasons for
contact, include:
• Unable to identify
• Advice required
• General enquiry
• COO Notification
Proportion of completed interviews where lower
level reason was unclear
Affinity Water 8% 8%
Anglian Water 15% 14%
Bournemouth Water 8% 6%
Bristol Water 9% 6%
Cambridge Water 8% 6%
Dee Valley Water 7% 3%
Northumbrian Water 2% 2%
Portsmouth Water 9% 6%
Severn Trent Water 9% 8%
South East Water 3% 2%
South Staffs Water 3% 2%
South West Water 7% 6%
Southern Water 4% 4%
Sutton & ES Water 5% 4%
Thames Water 7% 5%
United Utilities Water 11% 8%
Welsh Water 13% 5%
Wessex Water 9% 7%
Yorkshire Water 6% 4%
Sample Information
2012/13 2013/14

16
Weighted Three Year Results

17
Combined Three Year Weighted Score
We have combined the weighted score from each
wave of the SIM survey to produce an overall
weighted SIM score.
Each of the twelve waves from 2011/12 to
2013/14 have been included in the calculation.
Scores for each company are based on around
2,400 interviews.
Results for South Staffordshire Water and
Cambridge Water have been merged, weighted to
account for the varying customer base of each
company (81% SSW and 19% Cambridge).
In addition, results for the three Affinity Water
brands in 2011/12 and 2012/13 have been
combined to give one score for the company. The
following weightings were applied:
• Affinity Central 89.5%;
• Affinity East 5.2%; and
• Affinity South East 5.3%

18
Satisfaction by Company (Q60 - Weighted Data)
Weighted scores for each company for the three year period of SIM are shown below.
Company Q60 Confidence Interval† Rank Significant Difference
Anglian (a) 4.63 +/- 0.03 1 Significantly Above Industry Average
Welsh (b) 4.58 +/- 0.04 2 Significantly Above Industry Average
South Staffs (c) 4.57 +/- 0.03 3 Significantly Above Industry Average
Portsmouth (d) 4.57 +/- 0.04 3 Significantly Above Industry Average
Wessex (e) 4.57 +/- 0.04 3 Significantly Above Industry Average
Bournemouth (f) 4.52 +/- 0.04 6 Significantly Above Industry Average
Bristol (g) 4.51 +/- 0.04 7 Significantly Above Industry Average
Dee Valley (h) 4.51 +/- 0.04 7 Significantly Above Industry Average
Yorkshire (i) 4.49 +/- 0.04 9 Significantly Above Industry Average
Northumbrian (j) 4.47 +/- 0.04 10 Significantly Above Industry Average
Industry Average 4.41 +/- 0.01
United Utilities (k) 4.39 +/- 0.04 11 In-line with Industry Average
Affinity (l) 4.33 +/- 0.03 12 Significantly Below Industry Average
Sutton and ES (m) 4.30 +/- 0.05 13 Significantly Below Industry Average
Severn Trent (n) 4.26 +/- 0.05 14 Significantly Below Industry Average
Southern (o) 4.26 +/- 0.05 14 Significantly Below Industry Average
South East (p) 4.24 +/- 0.05 16 Significantly Below Industry Average
South West (q) 4.13 +/- 0.05 17 Significantly Below Industry Average
Thames (r) 4.00 +/- 0.05 18 Significantly Below Industry Average
†Confidence intervals are calculated at the 95% confidence level
19
Industry Key Annual Results

20
Notes To Charts
In the following charts, significant differences
in results are indicated by a letter next to the
higher of the figures being compared
corresponding to the letter in the column
description.
For example, on Page 22, the letter ‘h’ next to
the result for Billing and Waste signifies that
customers contacting their water company with
billing and waste queries are on average
significantly more satisfied than those with a
Clean Water query (column labelled ‘h’).
The first three charts indicate weighted overall
satisfaction scores (to allow a direct comparison
between WOCs and WASCs). The remaining
results are unweighted.

21
Overall Satisfaction with Query Handling (Q60 - Weighted)
4.48 4.49 4.48 4.46 4.46 4.47
4.54cde
4.53h
4.40
4.51h 4.50
kl
4.28
4.09
For the first year since the survey began WASCs performed as well as WOCs for query handling.
Customers tended to be significantly more satisfied with the handling of Billing or Wastewater queries
than Clean Water contacts whilst those who contacted their water company by phone were much more
positive than those using other means.
Company Type Survey Wave Contact Type Initial Comms
Channel
Satisfaction Mean Score out of 5, where 5 = very satisfied

22
Overall Satisfaction with Query Handling (Q60 - Weighted)
4.21
4.10
4.32 4.37
4.11
3.87
4.34a
4.27a
4.40a
4.43a
4.24a 4.26
a
4.44ab
4.37ab
4.50ab
4.50ab
4.38ab
4.35
ab
4.48abc
4.49abc
4.48ab
4.53abc
4.40ab
4.51abc
Industry WASC WOC Billing Water Waste
2010/11 (a) 2011/12 (b) 2012/13 (c) 2013/14 (d)
Customer satisfaction has significantly improved across the industry as a whole each year since the
survey began Billing and Wastewater contacts and WASCs drove the improvement in 2013/14.
Satisfaction Mean Score out of 5, where 5 = very satisfied

23
Satisfaction by Company (Q60 - Weighted Data)
4.66
4.63
4.62
4.62
4.62
4.62
4.56
4.56
4.53
4.52
4.52
4.51
4.48
4.41
4.39
4.38
4.25
4.21
4.03
Anglian
South Staffs
Northumbrian
Welsh
Wessex
Yorkshire
Portsmouth
United Utilities
Cambridge
Bristol
Dee Valley
Bournemouth
Severn Trent
Southern
Sutton & ES
Affinity
South East
South West
Thames
WOC
WASC
This year saw an improved performance from a number of WASCs. WASCs made up five of the top six
companies in 2013/14 compared to only two of the top seven in 2012/13.
Indicates significant change compared to 2012/13
24
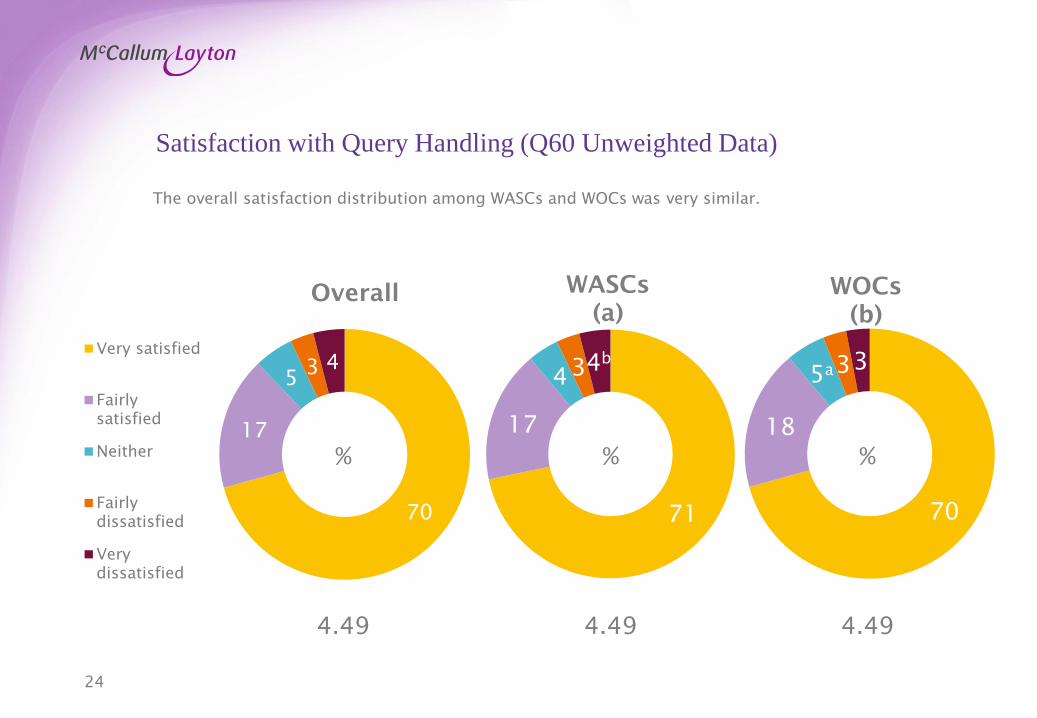
71
17
4 3 4
b
WASCs
(a)
Satisfaction with Query Handling (Q60 Unweighted Data)
70
18
5a 3 3
WOCs
(b)
The overall satisfaction distribution among WASCs and WOCs was very similar.
70
17
5 3 4
Overall
Very satisfied
Fairly
satisfied
Neither
Fairly
dissatisfied
Very
dissatisfied
% % %
4.49 4.49 4.49
25
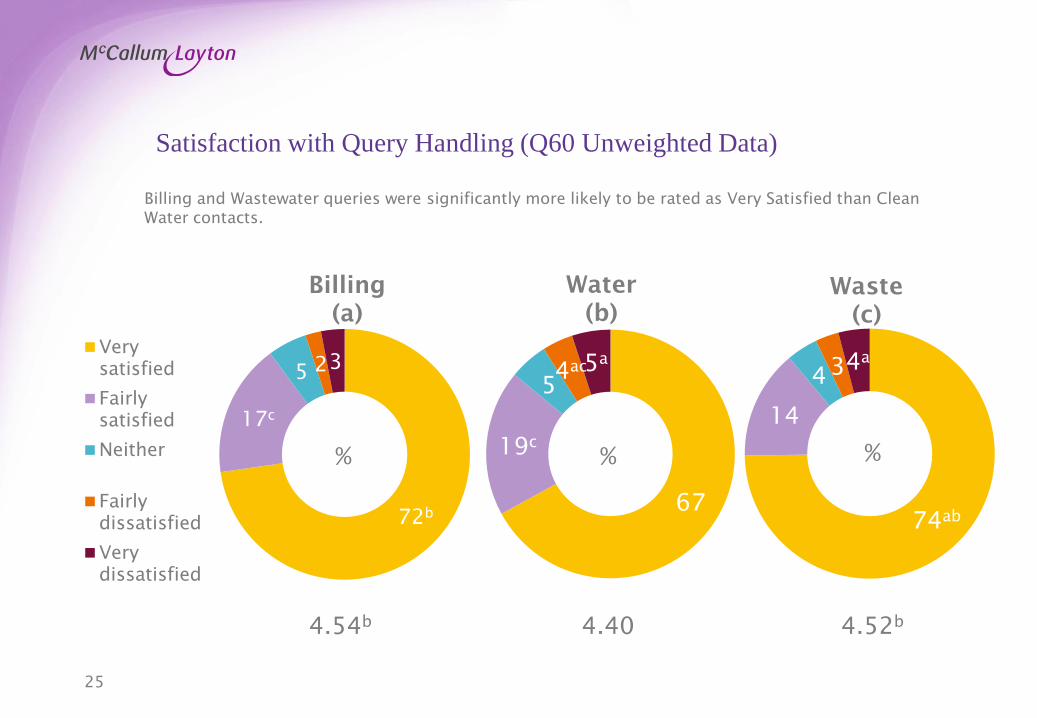
Satisfaction with Query Handling (Q60 Unweighted Data)
Billing and Wastewater queries were significantly more likely to be rated as Very Satisfied than Clean
Water contacts.
67
19c
5 4
ac 5
a
Water
(b)
74ab
14
4 3 4
a
Waste
(c)
72b
17c
5 2 3
Billing
(a)
Very
satisfied
Fairly
satisfied
Neither
Fairly
dissatisfied
Very
dissatisfied
4.54b 4.40 4.52
b
% % %

26
Reason for Contact
The top ten most common reasons for contact are detailed below. The proportion of respondents who
had contacted their water company to change address increased from 8% in 2012/13 to 10% in 2013/14.
Other reasons for contact showed little change.
Number of
Respondents
Proportion of
Respondents
Proportion
Satisfied
About a blockage in the sewer/drains 1,604 11% 92%
Due to a recent move, or planning to move 1,490 10% 93%
To make a payment 1,243 8% 93%
No supply/water gone off 1,153 8% 87%
Payment plan/direct debit set-up/query 1,059 7% 92%
Because of a water leak/burst on the road 709 5% 83%
About defective/dangerous water equipment† 709 5% 88%
Regarding the low pressure of my tap water 674 5% 87%
A query about a water bill 667 5% 85%
Because of a water leak/burst on my property 599 4% 79%
†Including stop taps, manhole covers, hydrants, raised/sunken chambers
27
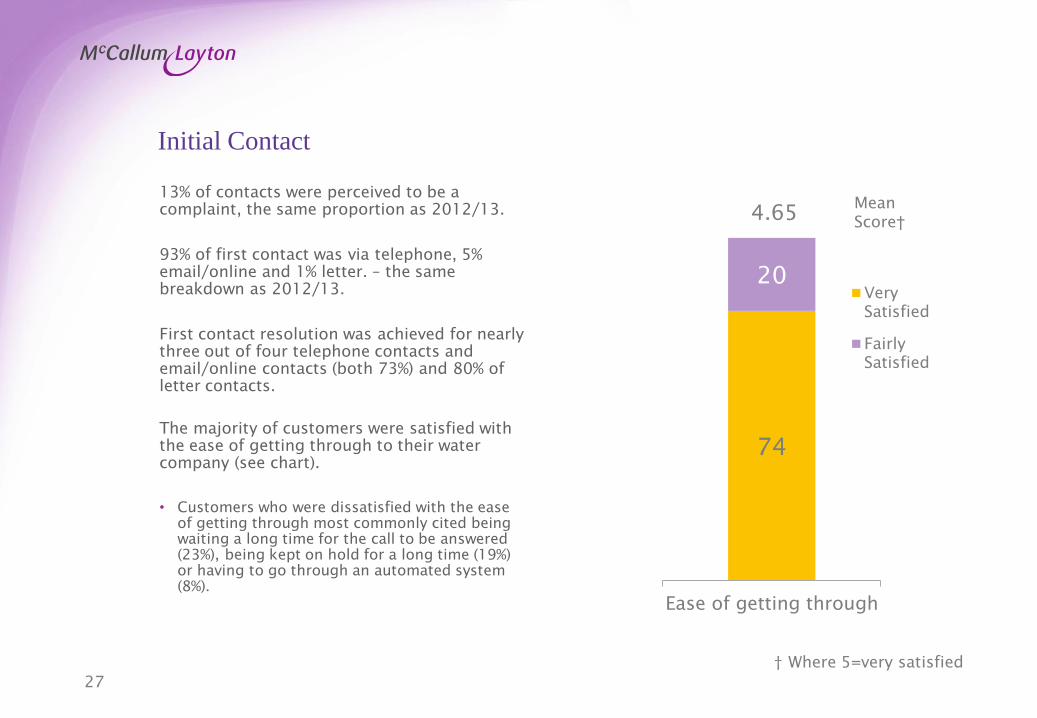
13% of contacts were perceived to be a
complaint, the same proportion as 2012/13.
93% of first contact was via telephone, 5%
email/online and 1% letter. – the same
breakdown as 2012/13.
First contact resolution was achieved for nearly
three out of four telephone contacts and
email/online contacts (both 73%) and 80% of
letter contacts.
The majority of customers were satisfied with
the ease of getting through to their water
company (see chart).
• Customers who were dissatisfied with the ease
of getting through most commonly cited being
waiting a long time for the call to be answered
(23%), being kept on hold for a long time (19%)
or having to go through an automated system
(8%).
74
20
Ease of getting through
Very
Satisfied
Fairly
Satisfied
Initial Contact
4.65 Mean
Score†
† Where 5=very satisfied

28
Call centre staff were positively perceived
in terms of their knowledge &
professionalism and helpfulness & attitude.
Both of these measures are key drivers of
overall satisfaction.
Call centre staff made promises or
commitments to customers in around half
(47%) of cases. More than four out of five
(81%) of commitments were met in full
while 5% were not met at all.
80
75
14 17
Helpfulness and
attitude
Knowledge and
professionalism
Very
Satisfied
Fairly
Satisfied
Call Centre Staff
4.72 4.65 Mean
Score†
† Where 5=very satisfied
29
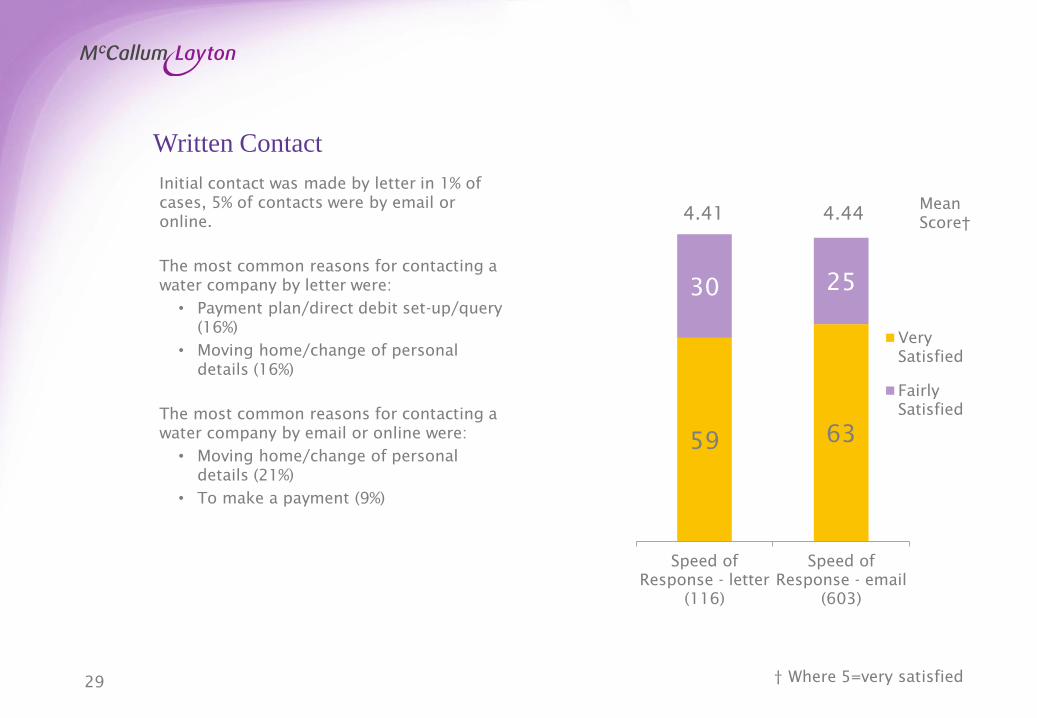
Initial contact was made by letter in 1% of
cases, 5% of contacts were by email or
online.
The most common reasons for contacting a
water company by letter were:
• Payment plan/direct debit set-up/query
(16%)
• Moving home/change of personal
details (16%)
The most common reasons for contacting a
water company by email or online were:
• Moving home/change of personal
details (21%)
• To make a payment (9%)
59 63
30 25
Speed of
Response - letter
(116)
Speed of
Response - email
(603)
Very
Satisfied
Fairly
Satisfied
Written Contact
Mean
Score† 4.41 4.44
† Where 5=very satisfied
30
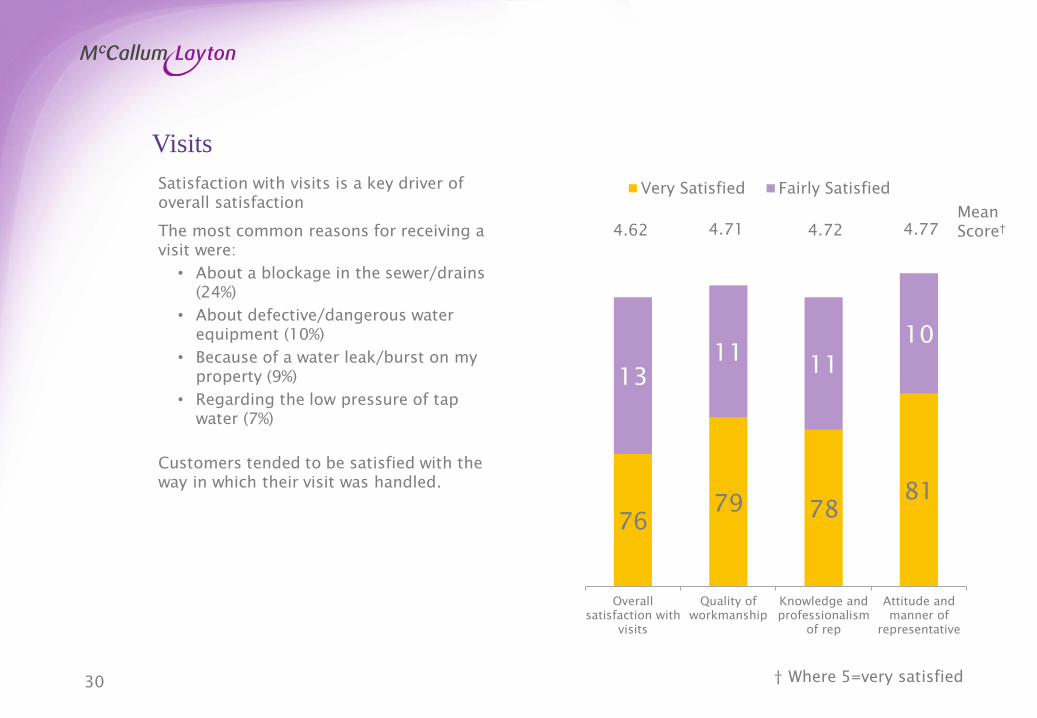
Satisfaction with visits is a key driver of
overall satisfaction
The most common reasons for receiving a
visit were:
• About a blockage in the sewer/drains
(24%)
• About defective/dangerous water
equipment (10%)
• Because of a water leak/burst on my
property (9%)
• Regarding the low pressure of tap
water (7%)
Customers tended to be satisfied with the
way in which their visit was handled.
76
79 78
81
13
11 11
10
Overall
satisfaction with
visits
Quality of
workmanship
Knowledge and
professionalism
of rep
Attitude and
manner of
representative
Very Satisfied Fairly Satisfied
Visits
Mean
Score† 4.62 4.71
† Where 5=very satisfied
4.72 4.77
31
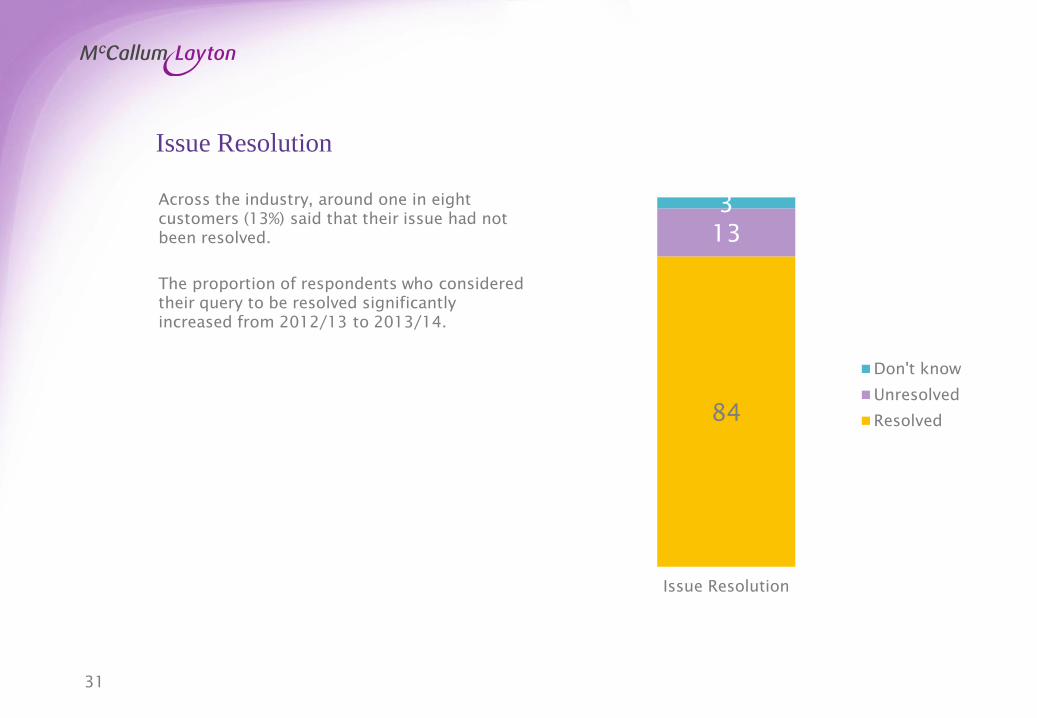
Issue Resolution
Across the industry, around one in eight
customers (13%) said that their issue had not
been resolved.
The proportion of respondents who considered
their query to be resolved significantly
increased from 2012/13 to 2013/14.
84
13
3
Issue Resolution
Don't know
Unresolved
Resolved
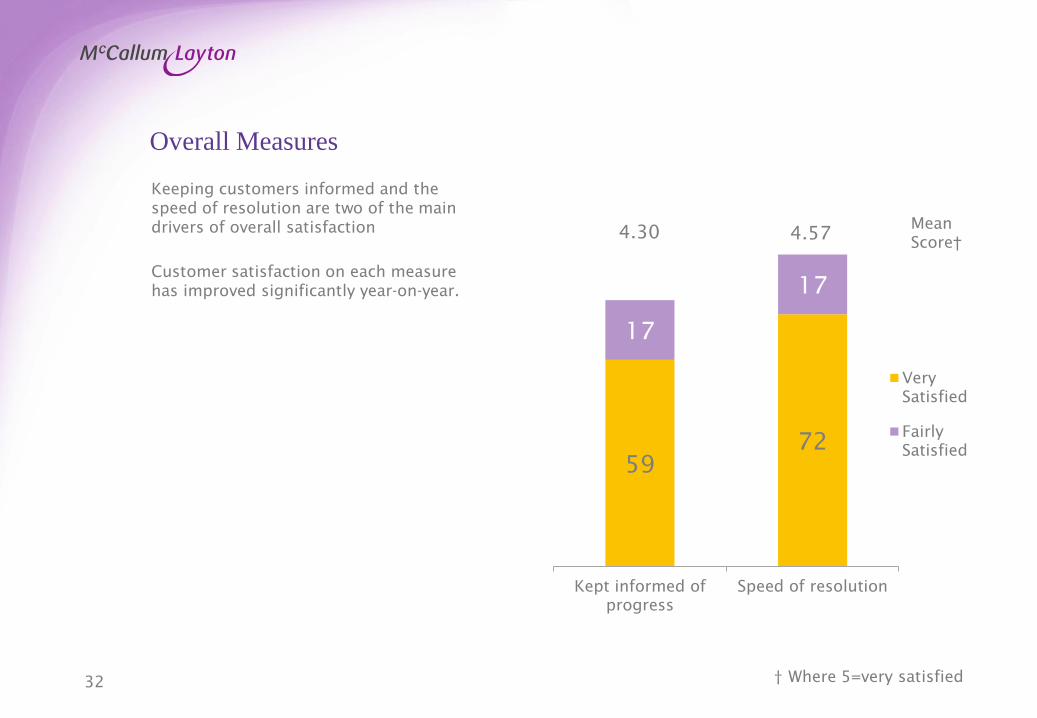
32
Keeping customers informed and the
speed of resolution are two of the main
drivers of overall satisfaction
Customer satisfaction on each measure
has improved significantly year-on-year.
59
72
17
17
Kept informed of
progress
Speed of resolution
Very
Satisfied
Fairly
Satisfied
Overall Measures
Mean
Score† 4.30 4.57
† Where 5=very satisfied

33
In Quarter 3, we asked respondents if they had been in contact with any other, similar service providers
during the previous three months. Customer satisfaction with the service received within the water
industry is significantly higher than that provided by any of the comparable service providers.
Industry Comparison
† Where 5=very satisfied
70
40 36 29 30 29
18
27 26
30 28 24
Water industry
(a)
Local authority
(b)
Mobile Telephone
Supplier
(c)
Broadband
supplier
(d)
Energy company
(e)
Landline
telephone industry
(f)
Very Satisfied Fairly Satisfied
Mean
Score† 4.48
bcdef 3.80
cdef 3.57
f 3.24 3.48
f 3.45

34
Key Driver Analysis

35
Key Drivers
We undertook Non-Parametric Correlation Analysis based on interviews in 2013/14 to identify the
individual aspects of service behind the Overall Satisfaction (Q60) results. Our analysis found seven
primary driving factors behind the Q60 score, with being kept informed the most important.
The Response Rate is the percentage of the sample who experienced the attribute and were able to
provide an answer (the higher the response rate, the greater the number of customers who experience
this attribute).
The Importance Index is the correlation coefficient rebased to an index where 100 = average strength in
driving overall satisfaction.
Response Rate
Correlation
Coefficient
Importance
Index
Q54. Satisfaction with being kept informed 62% 0.759 130
Q58. Satisfaction with time taken to resolve 84% 0.717 123
Q53. Satisfaction with overall visits 29% 0.681 117
Q6d. Satisfaction with knowledge and
professionalism of person you spoke to 84% 0.612 105
Q6c. Satisfaction with helpfulness and attitude of
person you spoke to 84% 0.607 104
Q6a. Satisfaction with ease of getting through to
someone 84% 0.574 98
Q7. Taking responsibility for the issue 84% 0.416 71
Q4b Number of phone calls made 93% 0.307 53

36
3.72
3.97a
4.17ab
4.30
abc
2010/11
(a)
2011/12
(b)
2012/13
(c)
2013/14
(d)
Key Driver Change Over Time
4.41 4.49a
4.59ab
4.57ab
2010/11
(a)
2011/12
(b)
2012/13
(c)
2013/14
(d)
4.29 4.47
a 4.56
ab 4.62
abc
2010/11
(a)
2011/12
(b)
2012/13
(c)
2013/14
(d)
4.42 4.52a 4.61
ab 4.65
abc
2010/11
(a)
2011/12
(b)
2012/13
(c)
2013/14
(d)
4.53 4.62a 4.68
ab 4.72
abc
2010/11
(a)
2011/12
(b)
2012/13
(c)
2013/14
(d)
4.47 4.56a 4.63
ab 4.65
abc
2010/11
(a)
2011/12
(b)
2012/13
(c)
2013/14
(d)
Being Kept Informed Time Taken to Resolve Satisfaction with Visits
Staff Knowledge and Professionalism Staff Helpfulness and Attitude Ease of Contacting
Satisfaction scores for each of the key drivers are shown below. Other than time taken to resolve, satisfaction
has significantly improved on each of the measures year-on-year.
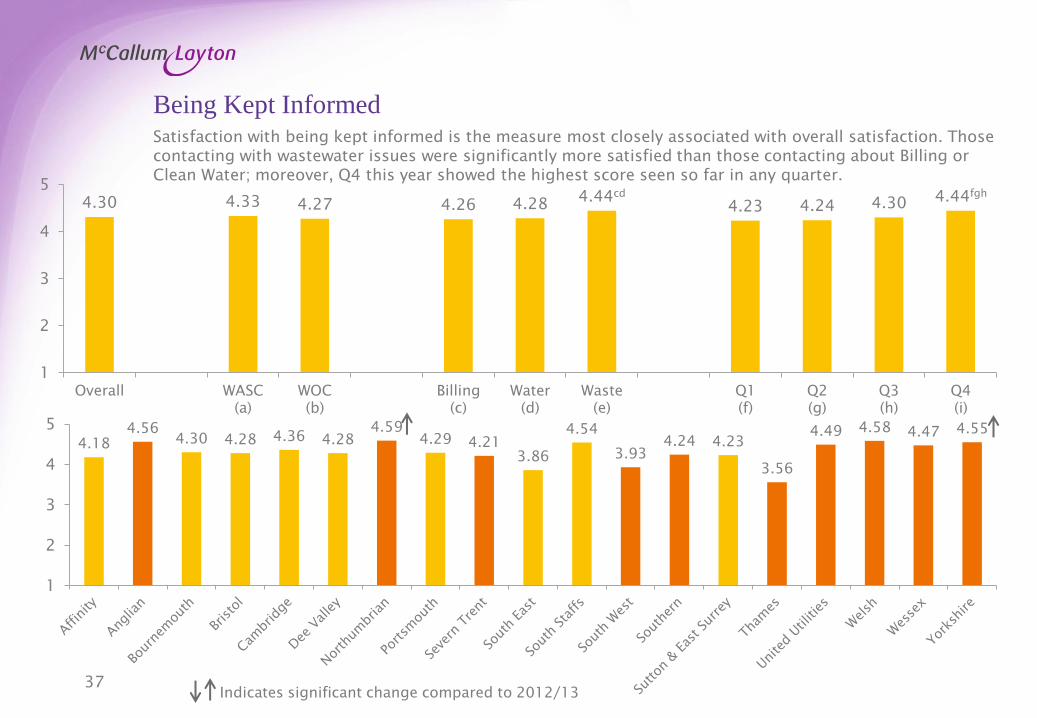
37
4.30 4.33 4.27 4.26 4.28 4.44
cd
4.23 4.24 4.30 4.44
fgh
1
2
3
4
5
Overall WASC
(a)
WOC
(b)
Billing
(c)
Water
(d)
Waste
(e)
Q1
(f)
Q2
(g)
Q3
(h)
Q4
(i)
Being Kept Informed
4.18
4.56
4.30 4.28 4.36 4.28
4.59
4.29 4.21
3.86
4.54
3.93
4.24 4.23
3.56
4.49 4.58 4.47 4.55
1
2
3
4
5
Satisfaction with being kept informed is the measure most closely associated with overall satisfaction. Those
contacting with wastewater issues were significantly more satisfied than those contacting about Billing or
Clean Water; moreover, Q4 this year showed the highest score seen so far in any quarter.
Indicates significant change compared to 2012/13

38
4.57 4.57 4.58 4.65d
4.44 4.65
d
4.54 4.52 4.58fg
4.63fgh
1
2
3
4
5
Overall WASC
(a)
WOC
(b)
Billing
(c)
Water
(d)
Waste
(e)
Q1
(f)
Q2
(g)
Q3
(h)
Q4
(i)
Time Taken to Resolve
4.44 4.69 4.62 4.66 4.64 4.66 4.71 4.67
4.53 4.36
4.62
4.35 4.46 4.54
4.17
4.57 4.71 4.71 4.64
1
2
3
4
5
Customers tended to be significantly more satisfied with the time taken to resolve Billing and Wastewater
queries than Clean Water ones.
Indicates significant change compared to 2012/13
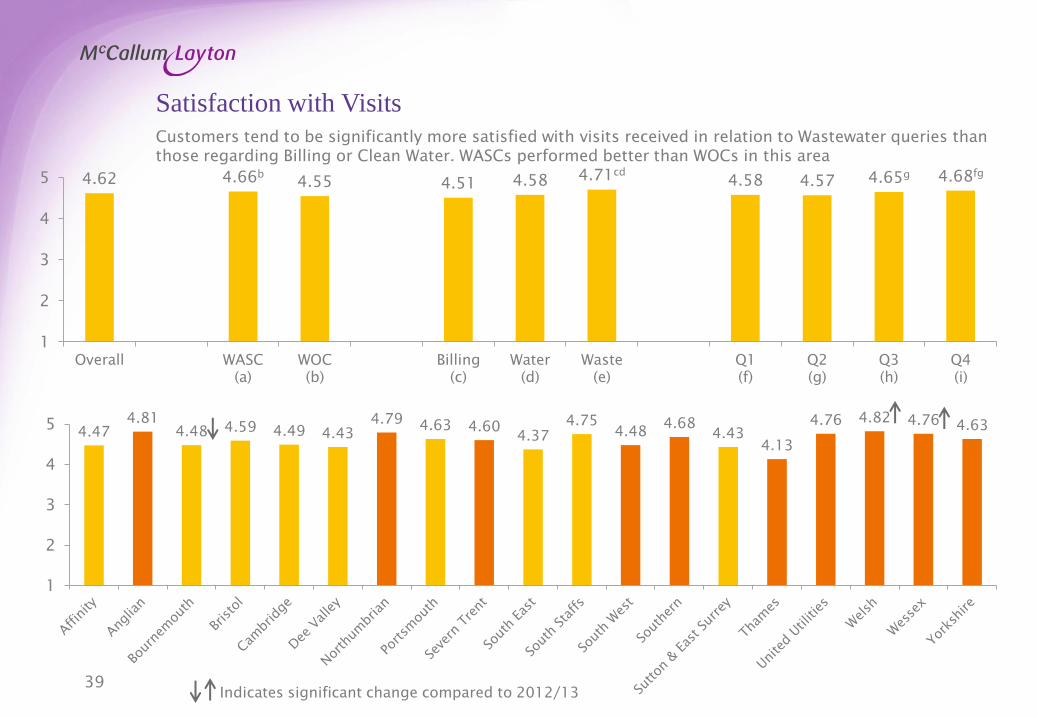
39
4.62 4.66b
4.55 4.51 4.58 4.71
cd
4.58 4.57 4.65g 4.68
fg
1
2
3
4
5
Overall WASC
(a)
WOC
(b)
Billing
(c)
Water
(d)
Waste
(e)
Q1
(f)
Q2
(g)
Q3
(h)
Q4
(i)
Satisfaction with Visits
4.47
4.81
4.48 4.59 4.49 4.43
4.79 4.63 4.60
4.37
4.75
4.48 4.68
4.43
4.13
4.76 4.82 4.76 4.63
1
2
3
4
5
Customers tend to be significantly more satisfied with visits received in relation to Wastewater queries than
those regarding Billing or Clean Water. WASCs performed better than WOCs in this area
Indicates significant change compared to 2012/13

40
4.65 4.65 4.65 4.69d 4.59 4.69
d 4.62 4.65 4.64 4.69
fgh
1
2
3
4
5
Overall WASC
(a)
WOC
(b)
Billing
(c)
Water
(d)
Waste
(e)
Q1
(f)
Q2
(g)
Q3
(h)
Q4
(i)
Staff Knowledge and Professionalism
4.60 4.76
4.65 4.71 4.67 4.71 4.76 4.69 4.59 4.43
4.75 4.50
4.65 4.61
4.31
4.69 4.75 4.75 4.67
1
2
3
4
5
The knowledge and professionalism of call centre staff has significantly improved each year since the SIM
survey began. In 2013/14, Billing and Wastewater both significantly outperformed Clean Water.
Indicates significant change compared to 2012/13

41
4.72 4.72 4.71 4.72 4.69 4.78cd
4.70 4.71 4.71 4.75fgh
1
2
3
4
5
Overall WASC
(a)
WOC
(b)
Billing
(c)
Water
(d)
Waste
(e)
Q1
(f)
Q2
(g)
Q3
(h)
Q4
(i)
Staff Helpfulness and Attitude
4.67 4.82
4.70 4.76 4.76 4.75 4.81 4.78 4.63
4.50
4.80 4.55
4.73 4.68 4.48
4.74 4.81 4.80 4.77
1
2
3
4
5
Call centre staff helpfulness and attitude was the highest rated of all measures – 82% of respondents were
very satisfied with the helpfulness and attitude of the person spoken to over the phone. This was
particularly true of wastewater queries.
Indicates significant change compared to 2012/13

42
4.65 4.64 4.67a 4.64 4.64 4.71
cd 4.63 4.64 4.65 4.69
fgh
1
2
3
4
5
Overall WASC
(a)
WOC
(b)
Billing
(c)
Water
(d)
Waste
(e)
Q1
(f)
Q2
(g)
Q3
(h)
Q4
(i)
Ease of Contacting Call Centre
4.53 4.71 4.71 4.71 4.76 4.71 4.76 4.70 4.60
4.48 4.73
4.46 4.59 4.68
4.26
4.67 4.77 4.75 4.73
1
2
3
4
5
Satisfaction with the ease of contacting water companies was generally high and significantly increased in
2013/14 compared to other years. WOCs and those with wastewater queries were the most positive.
Indicates significant change compared to 2012/13
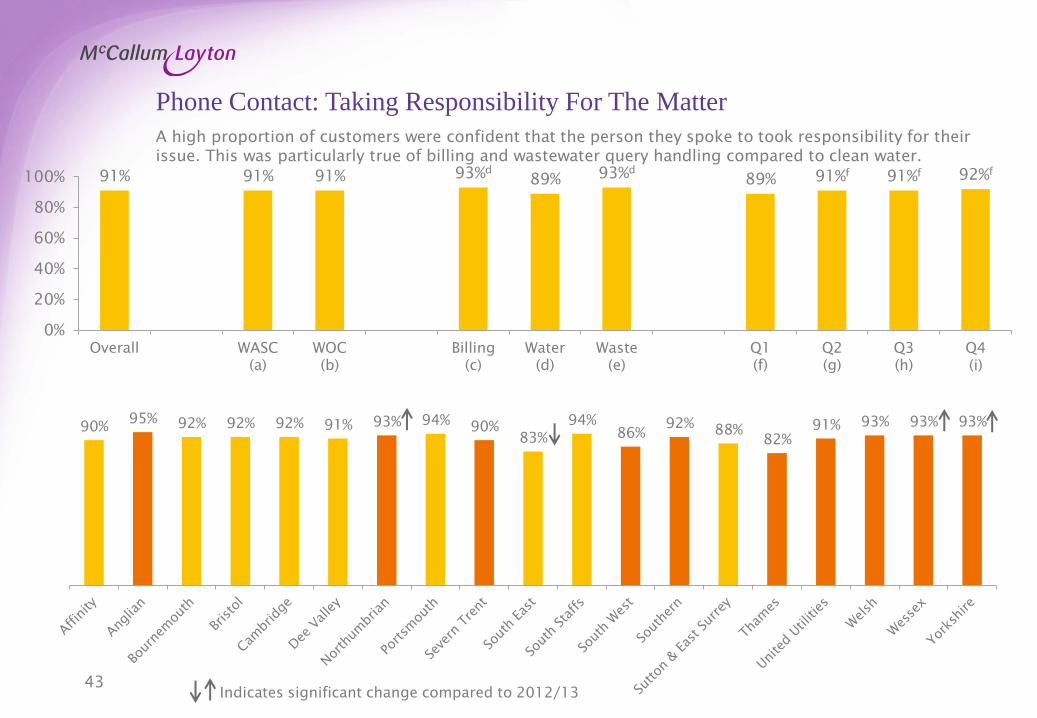
43
91% 91% 91% 93%d
89% 93%
d
89% 91%f 91%
f 92%
f
0%
20%
40%
60%
80%
100%
Overall WASC
(a)
WOC
(b)
Billing
(c)
Water
(d)
Waste
(e)
Q1
(f)
Q2
(g)
Q3
(h)
Q4
(i)
Phone Contact: Taking Responsibility For The Matter
90% 95%
92% 92% 92% 91% 93% 94% 90%
83%
94%
86% 92%
88% 82%
91% 93% 93% 93%
A high proportion of customers were confident that the person they spoke to took responsibility for their
issue. This was particularly true of billing and wastewater query handling compared to clean water.
Indicates significant change compared to 2012/13
44
Other Indicators

45
Other Indicators
69% 74%
a 72% 74%
a
2010/11
(a)
2011/12
(b)
2012/13
(c)
2013/14
(d)
53%
61%ac
56%
59%a
2010/11
(a)
2011/12
(b)
2012/13
(c)
2013/14
(d)
75% 78%
a
81%ab
84%
abc
2010/11
(a)
2011/12
(b)
2012/13
(c)
2013/14
(d)
First Call Resolution Same Day Query Resolution Matter Resolved
The proportion of resolved queries (from the customer’s perspective) has steadily increased over time.

46
73% 72% 73% 74% 71% 73% 71% 72% 74%
a 75%
ab
0%
10%
20%
30%
40%
50%
60%
70%
80%
Overall WASC
(a)
WOC
(b)
Billing
(c)
Water
(d)
Waste
(e)
Q1
(f)
Q2
(g)
Q3
(h)
Q4
(i)
Phone Contact: First Call Resolution
74% 77%
71% 71% 73% 73% 75% 72% 73% 75%
78%
67% 72% 70%
57%
77% 76% 73%
76%
There was a significant increase in first call resolution in Q3 and Q4 of 2013/14 relative to earlier quarters.
Indicates significant change compared to 2012/13

47
52% 52% 52%
57%d
45%
55%d
50% 50% 53%
fg
55%fg
0%
10%
20%
30%
40%
50%
60%
Overall WASC
(a)
WOC
(b)
Billing
(c)
Water
(d)
Waste
(e)
Q1
(f)
Q2
(g)
Q3
(h)
Q4
(i)
Same Day Query Resolution
54% 55% 49%
52% 54% 57%
60%
48% 48%
68%
42%
50% 50%
41% 43%
51%
60% 55%
48%
Of those queries that had been resolved, billing and waste queries were most likely to be resolved on the
same day they were reported.
Indicates significant change compared to 2012/13

48
84% 83% 83% 85%de
83% 81% 84%c 85%
c 82%
85%c
Overall WASC
(a)
WOC
(b)
Billing
(c)
Water
(d)
Waste
(e)
Q1
(f)
Q2
(g)
Q3
(h)
Q4
(i)
Matter Resolved
84% 87%
81% 80% 85%
82% 84% 84% 86% 87% 90%
82% 83%
76% 73%
89% 84%
81% 87%
Customers with a Billing query were significantly more likely to consider their issue resolved than either
Clean or Wastewater respondents.
Indicates significant change compared to 2012/13

49
CONCLUSIONS
50
Conclusions
Since the SIM customer experience survey
commenced in 2011/12 the water industry as a
whole has significantly improved its handling of
customer queries year-on-year.
This improvement has been most marked in the
handling of wastewater queries, however
satisfaction with handling of billing and clean
water queries has also substantially increased.
The consequence of this is that whereas in
previous years WOCs generally tended to perform
better than WASCs, in 2013/14 both types of
company achieved similarly high scores.
The overall results for customer satisfaction have
been driven by significant improvements year-on-
year in several key areas of the query resolution
process, most notably keeping customers
informed of progress, performance of call centre
staff, ease of contacting water companies and
satisfaction with visits. Moreover, there has also
been a significant rise in the proportion of
consumers aware their matter has been resolved.
As has been the case in every previous wave of
research, customer experience of query handling
in the water industry is substantially more positive
than in other sectors – 88% of water customers are
satisfied compared to a maximum of 67% of those
contacting other types of organisations.
Overall it is clear that SIM has been key in driving
up standards of customer service for water
company contactors across the industry.

51
Tel: +44 (0)113 237 5590
Fax: +44 (0)113 237 5599
www.McCallum-Layton.co.uk
McCallum Layton
Bramley Grange
Skeltons Lane
Thorner, Leeds
LS14 3DW
Defining a clear direction for
Insert Client Logo