RXU &'3 &OLPDWH &KDQJH 4XHVWLRQQDLUH ... - vodafone.com
76
Vodafone Group CDP Climate Change Questionnaire 2020 Tuesday, August 18, 2020 1 C2 General Welcome to your CDP Climate Change Questionnaire 2020 C0. Introduction C0.1 (C0.1) Give a general description and introduction to your organization. Vodafone Group is one of the world’s leading technology communications providers, connecting people and organisations of all sizes to the digital society. We have extensive experience in connectivity, convergence and the Internet of Things, as well as championing mobile financial services and digital transformation in emerging markets. Vodafone Group has mobile operations in 22 countries, partners with mobile networks in 42 more, and fixed broadband operations in 17 markets. As of 31 March 2020, Vodafone Group had 362 million customers, including 115 million mobile customers, 25 million broadband customers and 22 million TV customers in Europe and 168 million mobile customers in Africa.. For more information, please visit: www.vodafone.com. C0.2 (C0.2) State the start and end date of the year for which you are reporting data. Start date End date Indicate if you are providing emissions data for past reporting years Reporting year April 1, 2019 March 31, 2020 No C0.3 (C0.3) Select the countries/areas for which you will be supplying data. Albania Czechia Democratic Republic of the Congo Egypt Germany Ghana Greece Hungary Ireland Italy Lesotho Malta
Transcript of RXU &'3 &OLPDWH &KDQJH 4XHVWLRQQDLUH ... - vodafone.com

Vodafone Group CDP Climate Change Questionnaire 2020 Tuesday, August 18, 2020
1
C2 General
Welcome to your CDP Climate Change
Questionnaire 2020
C0. Introduction
C0.1
(C0.1) Give a general description and introduction to your organization. Vodafone Group is one of the world’s leading technology communications providers,
connecting people and organisations of all sizes to the digital society. We have extensive
experience in connectivity, convergence and the Internet of Things, as well as championing
mobile financial services and digital transformation in emerging markets.
Vodafone Group has mobile operations in 22 countries, partners with mobile networks in 42
more, and fixed broadband operations in 17 markets. As of 31 March 2020, Vodafone Group
had 362 million customers, including 115 million mobile customers, 25 million broadband
customers and 22 million TV customers in Europe and 168 million mobile customers in Africa..
For more information, please visit: www.vodafone.com.
C0.2
(C0.2) State the start and end date of the year for which you are reporting data.
Start date End date Indicate if you are providing emissions data for past
reporting years
Reporting
year
April 1,
2019
March 31,
2020
No
C0.3
(C0.3) Select the countries/areas for which you will be supplying data. Albania
Czechia
Democratic Republic of the Congo
Egypt
Germany
Ghana
Greece
Hungary
Ireland
Italy
Lesotho
Malta

Vodafone Group CDP Climate Change Questionnaire 2020 Tuesday, August 18, 2020
2
C2 General
Mozambique
Portugal
Romania
South Africa
Spain
Turkey
United Kingdom of Great Britain and Northern Ireland
United Republic of Tanzania
C0.4
(C0.4) Select the currency used for all financial information disclosed throughout your
response. EUR
C0.5
(C0.5) Select the option that describes the reporting boundary for which climate-
related impacts on your business are being reported. Note that this option should
align with your chosen approach for consolidating your GHG inventory. Operational control
C1. Governance
C1.1
(C1.1) Is there board-level oversight of climate-related issues within your
organization? Yes
C1.1a
(C1.1a) Identify the position(s) (do not include any names) of the individual(s) on the
board with responsibility for climate-related issues.
Position of
individual(s)
Please explain
Other C-Suite
Officer
The Group External Affairs Director has ultimate and direct responsibility for climate
change, sustainability strategy and performance. The Group External Affairs
Director reports directly to the CEO and is a member of The Group Executive
Committee. This top level executive committee has responsibility for reviewing
climate change performance and receives formal periodic updates on climate
change strategy and progress via the Group External Affairs Director.
The Group External Affairs Director leads the "Planet Steerco" which discusses,
analyses and presents existing and new targets to the Executive Committee for

Vodafone Group CDP Climate Change Questionnaire 2020 Tuesday, August 18, 2020
3
C2 General
approval or discussion, for example setting 100% Renewable Electricity
acceleration target or carbon reduction commitments progress and TCFD strategy.
Other C-Suite
Officer
The Group Technology Officer has responsibility for energy use and overseeing
performance of the network including overseeing energy efficiency improvements.
The Group Technology Officer reports directly to the CEO and also a member of
the Group Executive Committee.
C1.1b
(C1.1b) Provide further details on the board’s oversight of climate-related issues.
Frequency with
which climate-
related issues are
a scheduled
agenda item
Governance
mechanisms into which
climate-related issues
are integrated
Please explain
Scheduled – some
meetings
Reviewing and guiding
strategy
Reviewing and guiding
major plans of action
Reviewing and guiding
risk management policies
Reviewing and guiding
annual budgets
Reviewing and guiding
business plans
Setting performance
objectives
Monitoring
implementation and
performance of objectives
Overseeing major capital
expenditures,
acquisitions and
divestitures
Monitoring and
overseeing progress
against goals and targets
for addressing climate-
related issues
The Board reviewed and approved Vodafone
Group’s ‘Purpose Strategy’, by which decisions and
actions within the company should be made. This
includes a goal to reduce our environmental impact
by half and reduce greenhouse gas emissions by
50% by 2025. The board approves any new target
and strategy.
As a multi-disciplinary topic, the Board receives
regular updates across various business units on
progress towards this goal and other climate related
topics. As such, the board has oversight of
performance across these targets and if progress is
satisfactory, requiring corrective action as
necessary.
The Board also has control over budgets,
acquisitions, capital expenditure and allocation of
resources including those related to purpose
(including climate, energy efficiency and renewable
energy).
The Group External Affairs Director receives weekly
updates from the Sustainable Business Team which
include any climate-related issues of relevance to
the company. Where of significant importance, this
is then communicated to the Group Executive
Committee.
Furthermore progress against goals and targets are
also reported annually through the publication of the

Vodafone Group CDP Climate Change Questionnaire 2020 Tuesday, August 18, 2020
4
C2 General
Annual Report which is signed off at Board level.
C1.2
(C1.2) Provide the highest management-level position(s) or committee(s) with
responsibility for climate-related issues.
Name of the position(s)
and/or committee(s)
Responsibility Frequency of reporting to the
board on climate-related
issues
Other C-Suite Officer, please
specify
Group External Affairs Director
Both assessing and managing
climate-related risks and
opportunities
More frequently than quarterly
Other, please specify
Head of Sustainable Business Team
Both assessing and managing
climate-related risks and
opportunities
More frequently than quarterly
Other C-Suite Officer, please
specify
Group Technology Officer
Managing climate-related risks and
opportunities
As important matters arise
Other, please specify
Group Director SDGs, Sustainability and Foundation
Both assessing and managing
climate-related risks and
opportunities
More frequently than quarterly
C1.2a
(C1.2a) Describe where in the organizational structure this/these position(s) and/or
committees lie, what their associated responsibilities are, and how climate-related
issues are monitored (do not include the names of individuals). Group External Affairs Director
The Group External Affairs Director reports directly to the CEO and is a member of The Group
Executive Committee. The Group Executive Committee sits at the highest level of the
organisation.
This top level executive committee has responsibility for reviewing climate change performance
and receives formal periodic updates on climate change strategy/Purpose strategy and
progress via the Group External Affairs Director.
The Group External Affairs Director has responsibility for Sustainable Business issues,
transformational goals and sustainability targets as the owner of the "Planet" agenda, one of
three key areas of Vodafone's articulated Purpose. Responsibility includes energy and carbon
action, assessments, targets and sustainability reporting and disclosures. They are best placed
to monitor, measure and enact change throughout the organisation.

Vodafone Group CDP Climate Change Questionnaire 2020 Tuesday, August 18, 2020
5
C2 General
Furthermore the Group External Affairs director owns the working group for the Planet pillar as
part of the Purpose strategy and receives regular updates on progress and input into potential
new and existing initiatives. As well as hosting the Planet steerco which meets at least every 2
months.
Group Technology Officer
Group Technology Officer has responsibility for energy use, energy efficiency and equipment
upgrades. They receive regular updates on progress across the wider energy efficiency
investment programme. They are also a member of the Board and report on progress against
energy reduction actions and targets.
Group Director, SDGs, Sustainable Business, Foundations
The Group Director, SDGs, Sustainable Business, Foundations has responsibility for the
sustainability and SDG agenda, strategy and Sustainable Business Team. They report into the
Group External Affairs Director on a broad range of topics across the "Purpose", which includes
the "Planet" topics and climate issues. They support the Sustainable Business Team in
developing and executing the sustainability strategy.
Head of Sustainable Business Team
The Head of the Sustainable Business Team manages the Environment Manager who has
responsibility to collect, analyse and report on climate change; to create and monitor climate
related programmes and actions and influence change throughout the organisation. The role
also includes the responsibility for the carbon reduction goals to 2025, SBTi commitments and
Planet pillar actions to "reduce our environmental impact by half from 2017 to 2025" which
includes carbon emissions. The Head of the Sustainable Business Team regularly updates the
Group External Affairs Director on developments and progress in this area.
C1.3
(C1.3) Do you provide incentives for the management of climate-related issues,
including the attainment of targets?
Provide incentives for the
management of climate-related
issues
Comment
Row
1
Yes Executive share grant is linked to ESG measures,
including climate change and carbon reduction
performance across the company.
C1.3a
(C1.3a) Provide further details on the incentives provided for the management of
climate-related issues (do not include the names of individuals).
Entitled to incentive Type of
incentive
Activity
inventivized
Comment
Vodafone Group CDP Climate Change Questionnaire 2020 Tuesday, August 18, 2020
6
C2 General
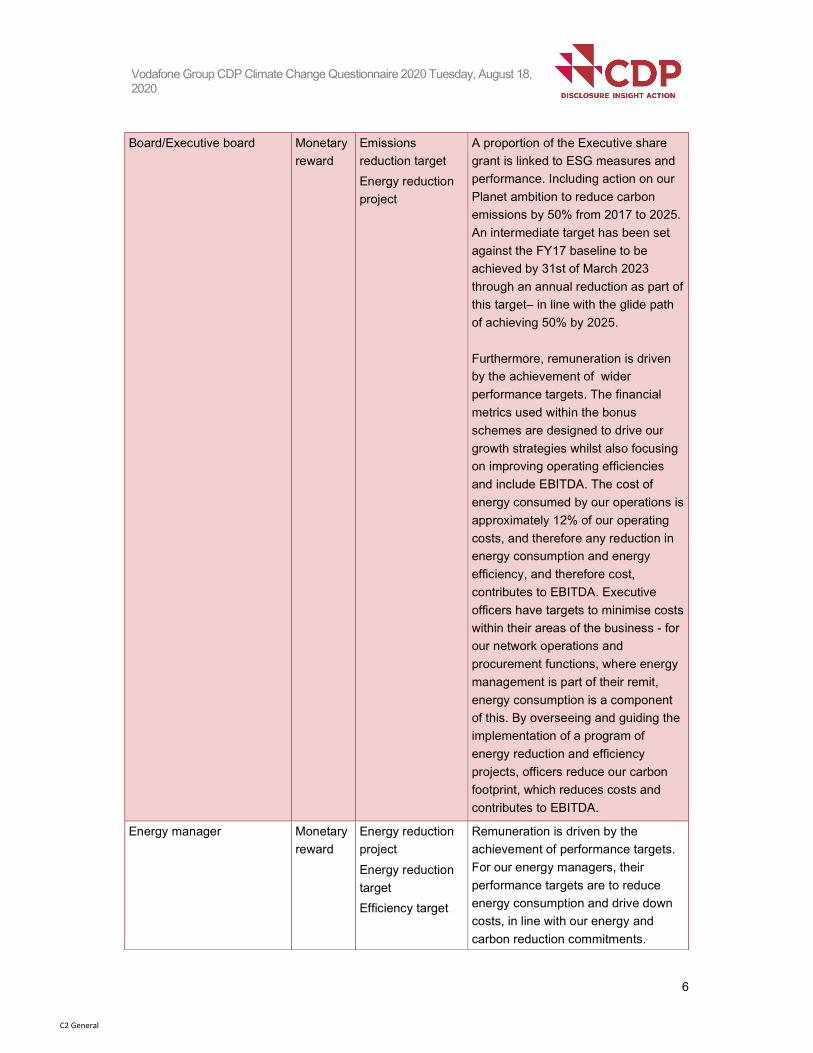
Board/Executive board Monetary
reward
Emissions
reduction target
Energy reduction
project
A proportion of the Executive share
grant is linked to ESG measures and
performance. Including action on our
Planet ambition to reduce carbon
emissions by 50% from 2017 to 2025.
An intermediate target has been set
against the FY17 baseline to be
achieved by 31st of March 2023
through an annual reduction as part of
this target– in line with the glide path
of achieving 50% by 2025.
Furthermore, remuneration is driven
by the achievement of wider
performance targets. The financial
metrics used within the bonus
schemes are designed to drive our
growth strategies whilst also focusing
on improving operating efficiencies
and include EBITDA. The cost of
energy consumed by our operations is
approximately 12% of our operating
costs, and therefore any reduction in
energy consumption and energy
efficiency, and therefore cost,
contributes to EBITDA. Executive
officers have targets to minimise costs
within their areas of the business - for
our network operations and
procurement functions, where energy
management is part of their remit,
energy consumption is a component
of this. By overseeing and guiding the
implementation of a program of
energy reduction and efficiency
projects, officers reduce our carbon
footprint, which reduces costs and
contributes to EBITDA.
Energy manager Monetary
reward
Energy reduction
project
Energy reduction
target
Efficiency target
Remuneration is driven by the
achievement of performance targets.
For our energy managers, their
performance targets are to reduce
energy consumption and drive down
costs, in line with our energy and
carbon reduction commitments.

Vodafone Group CDP Climate Change Questionnaire 2020 Tuesday, August 18, 2020
7
C2 General
Meeting or exceeding targets
determines an individual's
performance rating for the year, which
in turn determines the scale of any
financial reward. A larger decrease in
energy consumption through energy
reduction or efficiency projects will
generally lead to a better performance
rating and therefore a greater financial
reward. Implementing energy
reduction and efficiency projects helps
us to meet our group emissions target.
Environment/Sustainability
manager
Monetary
reward
Emissions
reduction target
Energy reduction
target
Supply chain
engagement
Company
performance
against a climate-
related
sustainability index
Remuneration (in the form of salary
and bonus schemes) is driven by the
achievement of performance targets.
Our environment and sustainability
managers have performance targets
to drive carbon performance,
minimising our internal footprint; drive
progress towards our energy and
carbon transformational goals and to
leverage the transformational impacts
of our products and services to enable
carbon savings for our customers.
Meeting or exceeding performance
targets determines an individual's
performance rating for the year, which
in turn determines the scale of any
pay rise or bonus payment. A better
performance leads to an enhanced
financial reward.
Process operation manager Monetary
reward
Emissions
reduction target
Energy reduction
target
Efficiency target
Supply chain
engagement
Remuneration is driven by the
achievement of performance targets.
For our technology managers, their
performance targets are to improve
performance of our network while also
reducing energy consumption and
drive down energy costs, in line with
our new energy and carbon reduction
commitments. Meeting or exceeding
targets determines an individual's
performance rating for the year, which
in turn determines the scale of any
financial reward. A larger decrease in
energy consumption through energy

Vodafone Group CDP Climate Change Questionnaire 2020 Tuesday, August 18, 2020
8
C2 General
reduction or efficiency projects will
generally lead to a better performance
rating and therefore a greater financial
reward. Implementing energy
reduction and efficiency projects in
turn, helps us to meet our group
emissions target.
Other, please specify
Group Director, SDGs, Sustainable Business, Foundations
Monetary
reward
Emissions
reduction target
Energy reduction
target
Company
performance
against a climate-
related
sustainability index
Other (please
specify)
Sustainability Strategy
Remuneration (in the form of salary
and bonus schemes) is driven by the
achievement of performance targets.
The Group Director, SDGs,
Sustainable Business, Foundations
has performance targets to drive
sustainability improvement
performance; drive progress towards
our energy and carbon
transformational goals and to leverage
the transformational impacts of our
products and services to enable
carbon savings for our customers.
Meeting or exceeding performance
targets determines an individual's
performance rating for the year, which
in turn determines the scale of any
pay rise or bonus payment. A better
performance leads to an enhanced
financial reward.
C2. Risks and opportunities
C2.1
(C2.1) Does your organization have a process for identifying, assessing, and
responding to climate-related risks and opportunities? Yes
C2.1a
(C2.1a) How does your organization define short-, medium- and long-term time
horizons?
From
(years)
To
(years)
Comment
Short-
term
0 5 Vodafone has undertaken a high level TCFD aligned climate change
risk and opportunity analysis. As part of this process we used scenario

Vodafone Group CDP Climate Change Questionnaire 2020 Tuesday, August 18, 2020
9
C2 General
based analysis aligned to the Bank of England’s reference climate
scenarios – being used to stress test UK financial system against
climate change.
The scenarios are modelled to a thirty-year timespan, out to 2050 to
align to the Paris agreement and other net zero 2050 targets.
For climate related analysis, the short term analysis period is from
2020 to 2025, which covers the immediate impacts already being
experience and the expected impacts over the next five years. Shorter
term risks and opportunities depend on the scenario and level of action
taken. Under the "Early Smooth" transition there are greater
transformational changes such as legislation and changing consumer
behaviours, while under the "business as usual" scenario these short
term impacts are less likely.
Medium-
term
5 15 Vodafone has undertaken a high level TCFD aligned climate change
risk and opportunity analysis. As part of this process we used scenario
based analysis aligned to the Bank of England’s reference climate
scenarios – being used to stress test UK financial system against
climate change.
The scenarios are modelled to a thirty-year timespan, out to 2050 to
align to the Paris agreement and other net zero 2050 targets.
For climate related analysis, the medium term analysis period is from
2025 to 2035, which covers the medium term impacts expected to
occur in the future. Medium term risks are dependent on the scenario
chosen and how early action is taken with significant differences
between the three scenarios on both risks and opportunities.
Long-
term
15 30 Vodafone has undertaken a high level TCFD aligned climate change
risk and opportunity analysis. As part of this process we used scenario
based analysis aligned to the Bank of England’s reference climate
scenarios – being used to stress test UK financial system against
climate change.
The scenarios are modelled to a thirty-year timespan, out to 2050 to
align to the Paris agreement and other net zero 2050 targets.
For climate related analysis, the Long term analysis period is from
2035 to 2050, which covers the longer term impacts expected to be
experienced under the different climate scenarios, with a range of
temperature increases from <1.5c to >3c under different scenarios.
Each scenario has very different risk and opportunities over both
physical and transitional areas over this time horizon.

Vodafone Group CDP Climate Change Questionnaire 2020 Tuesday, August 18, 2020
10
C2 General
C2.1b
(C2.1b) How does your organization define substantive financial or strategic impact
on your business? As part of out TCFD aligned climate risk and opportunity scenario analysis Vodafone assess
substantive financial or strategic impact in relation to risks and opportunities across 5 areas and
4 levels from low to very high, as well as over 5 levels of likelihood. The 5 impact categories
are: Brand (reputation), Customers, Financial, Operational and Legal & Regulatory.
For example:
The 4 levels of impact for Financial category risk are:
Very High: Loss of revenue or reduction in EBITDA in excess of 10% vs. plan
High: Loss of revenue or reduction in EBITDA by more than 5% but less than 10% vs. plan
Medium: Loss of revenue or reduction in EBITDA by more than 2.5% but less than 5% vs. plan
Low: Loss of revenue or reduction in EBITDA of up to 2.5% vs. plan
The 4 levels of impact for Financial category opportunities are:
Very High: Gain in revenue or increase in EBITDA in excess of 10% vs. plan
high: Gain revenue or increase in EBITDA by more than 5% but less than 10% vs. plan
Medium: Gain in revenue or increase in EBITDA by more than 2.5% but less than 5% vs. plan
Low: Gain in revenue or increase in EBITDA of up to 2.5% vs. plan
Substantive financial or strategic impact on the business is a combination of the likelihood of
the risk or opportunity occurring and the level of impact it would have, as well as our risk
appetite or level of mitigation costs associated with it.
C2.2
(C2.2) Describe your process(es) for identifying, assessing and responding to climate-
related risks and opportunities.
Value chain stage(s) covered Direct operations
Upstream
Downstream
Risk management process Integrated into multi-disciplinary company-wide risk management process
Frequency of assessment More than once a year
Time horizon(s) covered Short-term

Vodafone Group CDP Climate Change Questionnaire 2020 Tuesday, August 18, 2020
11
C2 General
Medium-term
Long-term
Description of process We recognise that climate change poses a number of physical risks (i.e. caused by the
increased frequency and severity of extreme weather events) and transition-related risks
(i.e. economic, technology or regulatory challenges related to moving to a greener
economy) for our business. We are currently on a journey to align internal processes to
the recommendations of the Taskforce on Climate-Related Financial Disclosures
(TCFD)
The process to assess the materiality of climate-related risks and opportunities follows
industry and sectoral relevant benchmark data and takes into consideration our principal
risks.
We adopted three scenarios in line with the Bank of England's reference climate
scenarios, as outlined in their consultation document released in December 2019 (The
2021 biennial exploratory scenario on the financial risks from climate change). We
conduct the required assessments to quantify the business impacts of all material
climate-related risks under each scenario and over different time horizons to better
understand the financial value at risk across service revenue, EBITDA and Free cash
flow.
The outputs of the scenario analysis are used to either adjust existing policies or
developing new ones, especially looking at opportunities to improve our business
resilience and continuity. It also informs the assessment of our long term viability and
allow us to validate the priority areas of focus for climate action and within our
environmental targets and actions.
Key risk and opportunity areas arising from the scenario base climate risk and
opportunity assessment are as follow:
• (Transitional Risk) Growing external pressures and demands for action negatively
impact revenues from those companies late to react and trigger an increase in taxation
and energy prices with direct impact on our costs.
• (Transitional Risk) Global focus on energy efficiency increases the likelihood of new
regulation impacting energy intensive assets, however it carries an opportunity with the
application of new technologies, both a potential increase in costs but also opportunity
to sell more energy efficiency solutions such as "smart" IoT metering.
• (Physical Risk) Increase in temperature and frequency of extreme weather events (e.g.
heat waves, storms) leads to higher energy consumption for cooling and affects the
quality of radio frequency and wireless transmission, in addition to damaging equipment
and harming people’s wellbeing.
If of sufficient priority, climate change risks and opportunities are included in monthly
reports to the Executive Committee. Otherwise an annual update is provided as part of
the annual reporting process, risks are then reviewed and identified every 6 months.
Vodafone Group CDP Climate Change Questionnaire 2020 Tuesday, August 18, 2020
12
C2 General
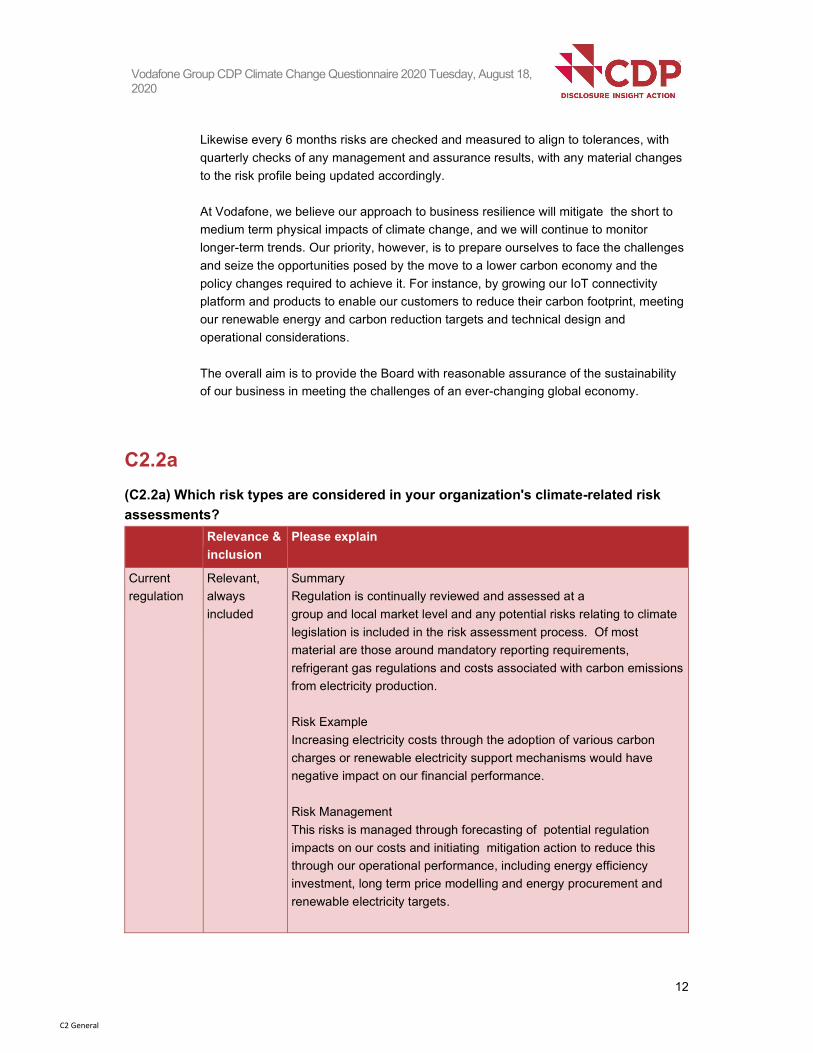
Likewise every 6 months risks are checked and measured to align to tolerances, with
quarterly checks of any management and assurance results, with any material changes
to the risk profile being updated accordingly.
At Vodafone, we believe our approach to business resilience will mitigate the short to
medium term physical impacts of climate change, and we will continue to monitor
longer-term trends. Our priority, however, is to prepare ourselves to face the challenges
and seize the opportunities posed by the move to a lower carbon economy and the
policy changes required to achieve it. For instance, by growing our IoT connectivity
platform and products to enable our customers to reduce their carbon footprint, meeting
our renewable energy and carbon reduction targets and technical design and
operational considerations.
The overall aim is to provide the Board with reasonable assurance of the sustainability
of our business in meeting the challenges of an ever-changing global economy.
C2.2a
(C2.2a) Which risk types are considered in your organization's climate-related risk
assessments?
Relevance &
inclusion
Please explain
Current
regulation
Relevant,
always
included
Summary
Regulation is continually reviewed and assessed at a
group and local market level and any potential risks relating to climate
legislation is included in the risk assessment process. Of most
material are those around mandatory reporting requirements,
refrigerant gas regulations and costs associated with carbon emissions
from electricity production.
Risk Example
Increasing electricity costs through the adoption of various carbon
charges or renewable electricity support mechanisms would have
negative impact on our financial performance.
Risk Management
This risks is managed through forecasting of potential regulation
impacts on our costs and initiating mitigation action to reduce this
through our operational performance, including energy efficiency
investment, long term price modelling and energy procurement and
renewable electricity targets.

Vodafone Group CDP Climate Change Questionnaire 2020 Tuesday, August 18, 2020
13
C2 General
Emerging
regulation
Relevant,
sometimes
included
Summary
Vodafone engages with national and multinational legislative bodies
regarding potential regulation where relevant to our business, for
example the EU commission.
Risk Example
A material risk is potential additional costs associated with carbon
pricing for energy use which could increase costs of purchasing
electricity or new regulations around IoT, spectrum use or 5G
connectivity. This could affect our network and the carbon reduction
enablement of our network offers.
Risk management
Regulation is continually reviewed and assessed at a group and local
market level and any potential risks relating to climate legislation are
included in the risk assessment. Strong engagement with legislative
bodies identifies potential emerging legislative changes. Such changes
are assessed as to their potential impact and, if deemed material,
action is taken to understand and influence legislation or undertake
mitigation plans. For example supporting the EU Green Deal proposals
for a digital, resilient and green recovery.
Technology Relevant,
always
included
Summary
Vodafone continually looks to improve performance through new and
emerging technologies, working with suppliers and customers to
reduce the climate related issues of technology.
Risk Example
IoT or 5G connectivity are technologies with the potential to disrupt our
business both positively and negatively regarding climate. For
example, the additional technology could increase energy and cooling
requirements on our base stations but also provide energy savings
through smart connected solutions.
Risk Management
We work with our suppliers to improve the efficiency of our equipment
to reduce energy use and cooling requirements through the
development of innovative solutions. For example trialling several
novel technologies on our network to measure and monitor potential
savings and identifying any new opportunities.
Overall technology changes are not deemed as significant climate risks
to the business, they may have some risks through higher energy or
cooling requirements from newer or expanded technologies (such as
5G) but also may offer opportunities for increased efficiency (improved

Vodafone Group CDP Climate Change Questionnaire 2020 Tuesday, August 18, 2020
14
C2 General
cooling from free cooling or improvements in air conditioning). There
are also opportunities to enable efficiency improvements and carbon
savings throughout society through new technologies and connected
devices enabling customer carbon savings.
Legal Relevant,
sometimes
included
Summary
Although legal risks are regularly assessed, there is not deemed to be
a significant potential for litigation claims regarding climate change
across Vodafone Group.
Example risk
We are a significant user of electricity and associated carbon
emissions which could mean a small potential for litigation if it is
deemed that insufficient action has been taken to reduce this impact.
Risk Management
Legal risks and implications are continually reviewed as part of the risk
management process which considers our potential litigation risks and
addresses any issues if relevant.
However, as an industry we are deemed as part of the solution rather
than the problem with regards to climate change. Our connectivity
solutions can help our customers and wider society to achieve energy
and resource efficiency improvements through the use of IoT and
connected solutions, such as smart monitoring of buildings to reduce
energy use. Furthermore we are actively reducing our carbon
emissions and climate impacts.
Market Relevant,
always
included
Summary
Vodafone is a purchaser of communications and ICT technology, while
our main commodity use is energy (electricity).
Risk Example
The technology we use is not deemed to be at risk from climate
change while technological advances are continually improving energy
efficiency, however risks of increase electricity prices due to carbon
taxation do exist.
Risk management
Carbon pricing and additional costs for energy purchasing are included
in assessments of long term risks and opportunities, these are a key
driver of energy efficiency projects and energy/carbon transformational
goals. Energy costs, including potential carbon costs, are forecast up
to 2025 with the associated risks included.

Vodafone Group CDP Climate Change Questionnaire 2020 Tuesday, August 18, 2020
15
C2 General
Through action to improve energy efficiency, purchase renewable
electricity and future purchase energy these risks can be managed.
Reputation Relevant,
always
included
Summary
Reputation is a significant factor in our consideration of risk.
Risk Example
There is some potential reputational risk from climate change: the ICT
sector is expected to be an increasing user of electricity and
associated emissions which could have a negative reputational impact.
Risk Management
We have set targets to reduce our carbon emissions and purchase
renewable electricity sources.
Vodafone, and other telecommunication companies, are also seen as
the provider and enabler of solutions to reduce climate change with
associated reputation benefits through connected devices and IoT.
We see our ability to reduce our own impact and help our customers as
a positive impact on our reputation if managed well through actively
addressing our impact and offering solutions for our customers to
reduce their own.
Acute
physical
Relevant,
always
included
Summary
There is potential for increased risk from climate related changes in the
frequency/intensity of acute physical incidents
Risk Example
Localised flooding or significant storm events are considered within risk
assessments at a local level and appropriately mitigated against
through physical design features of sites or redundancy of systems.
Risk Management
Maintaining an active and sufficient network and services is vital to our
operations and as such is prioritised when designing our systems and
infrastructure. We operate a highly dispersed network with inherent
resilience against localised events. Vodafone also has extensive
resilience planning in place for various scenarios once a risk has been
deemed material.
Chronic
physical
Relevant,
always
included
Summary
The potential for long term increases in temperature (and other climate
effects) are considered with regards to the impact on our technology,
especially cooling requirements.

Vodafone Group CDP Climate Change Questionnaire 2020 Tuesday, August 18, 2020
16
C2 General
Risk Example
There is a potential for increasing cooling demand, with associated
energy costs, however improving technological efficiency gains are
also expected driven by cost saving efficiencies of reducing cooling
demands. These additional potential cooling costs are considered in
energy modelling exercises.
Risk Management
Chronic physical changes are deemed to occur over longer time
frames than that of the upgrade/replacement cycle of our equipment
and technology, which has an expected life span of several years
before becoming obsolete and being replaced/upgraded. Therefore
many long term changes are addressed through an ongoing basis,
during the replacement and upgrade cycle of our equipment and
facilities. The acceptable operational conditions will be assessed for
the lifetime of the equipment, including any expected increases in
temperature (or other climate changes expected).
C2.3
(C2.3) Have you identified any inherent climate-related risks with the potential to have
a substantive financial or strategic impact on your business? Yes
C2.3a
(C2.3a) Provide details of risks identified with the potential to have a substantive
financial or strategic impact on your business.
Identifier Risk 1
Where in the value chain does the risk driver occur? Direct operations
Risk type & Primary climate-related risk driver Emerging regulation
Carbon pricing mechanisms
Primary potential financial impact Increased direct costs
Company-specific description Increase in taxation & price of purchased products/energy - increased costs on energy
procurement at Vodafone sites through taxation of energy or carbon costs.

Vodafone Group CDP Climate Change Questionnaire 2020 Tuesday, August 18, 2020
17
C2 General
Vodafone is a significant consumer of energy which is used to power our networks to
provide connectivity for our customers. In 2019/20, Vodafone's network and buildings
consumed 5,541 GWh of energy. Marginal increases in energy costs through carbon
taxes and regulation can have an impact on our operating costs.
Any changes to fuel costs or subsidies – either for fossil fuels or renewable generation
would impact on our operating costs. Changes in taxation or regulations linked to energy
consumption and the potential removal of subsidies for renewable energy also present a
risk.
Time horizon Medium-term
Likelihood More likely than not
Magnitude of impact Low
Are you able to provide a potential financial impact figure? Yes, a single figure estimate
Potential financial impact figure (currency) 400,000,000
Potential financial impact figure – minimum (currency)
Potential financial impact figure – maximum (currency)
Explanation of financial impact figure Energy consumption accounted for approximately 12% of Vodafone's operating
expenditure in 2019/20. We undertook financial modelling which shows that carbon
taxation and subsidy removal could add nearly €400M to our annual energy bill in from
2018 over the next 10 years.
Cost of response to risk 375,000,000
Description of response and explanation of cost calculation We have an extensive programme of energy minimisation measures taking place across
our networks, which include network modernisation, changes in cooling and air
conditioning and changes to fuel mix to become less reliant on fossil fuels. The cost of
on going energy efficiency improvements to reduce energy demand and purchasing
renewable electricity varies across our network but includes annual costs in the region
of 75 million euros per year for 5 years, estimated to total 375 million euros by 2025

Vodafone Group CDP Climate Change Questionnaire 2020 Tuesday, August 18, 2020
18
C2 General
target years. Of the 75 million the majority of the costs are on technological
improvements improving efficiencies of our network (70 million) and a smaller proportion
for renewable electricity (5 million).
Actions taken to reduce risk includes:
1. Dynamic thermal management to reduce energy consumption from cooling in our
technology centres, resulting in an average 9% reduction in energy consumption in
those sites.
2. A energy procurement strategy to reduce our reliance on fossil fuels, for example
using hybrid solar battery generators in place of pure diesel generators.
3. A new energy innovation Goal to address the environmental impact from our
electricity consumption, of reducing our carbon emissions by 50% by 20205. The
development of this goal identified potential additional energy efficiency savings we can
undertake to further reduce our primary energy demand through investment in energy
efficiency improvements.
4. A goal to purchase 100% renewable electricity by 2025 to help manage the risk of
any potential additional carbon prices.
5. Additional capital spend on further energy efficiency measures including replacing
older equipment with more efficient alternatives (such a SRAN technology) and
implementation of energy saving software features.
Capital costs can vary greatly depending on the initiative within the programme and may
lead to reduced long term costs as well as upfront costs. Additional operating costs
associated with renewable electricity are market dependent, with some markets offering
potential energy saving through lower cost long term electricity contracts and PPAs.
Comment
Identifier Risk 2
Where in the value chain does the risk driver occur? Direct operations
Risk type & Primary climate-related risk driver Chronic physical
Rising mean temperatures
Primary potential financial impact Increased indirect (operating) costs
Company-specific description Increased energy costs associated with climate related increases in temperature and
other environmental aspects with impacts on operational performance of our technology
Vodafone Group CDP Climate Change Questionnaire 2020 Tuesday, August 18, 2020
19
C2 General
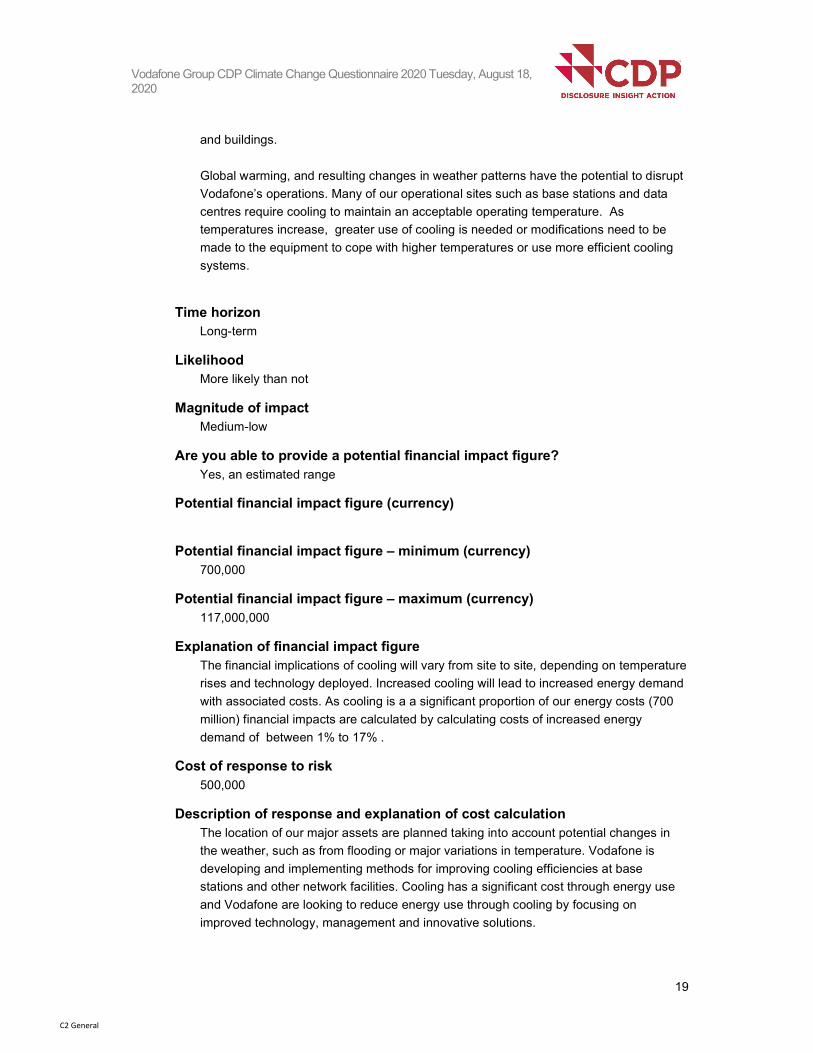
and buildings.
Global warming, and resulting changes in weather patterns have the potential to disrupt
Vodafone’s operations. Many of our operational sites such as base stations and data
centres require cooling to maintain an acceptable operating temperature. As
temperatures increase, greater use of cooling is needed or modifications need to be
made to the equipment to cope with higher temperatures or use more efficient cooling
systems.
Time horizon Long-term
Likelihood More likely than not
Magnitude of impact Medium-low
Are you able to provide a potential financial impact figure? Yes, an estimated range
Potential financial impact figure (currency)
Potential financial impact figure – minimum (currency) 700,000
Potential financial impact figure – maximum (currency) 117,000,000
Explanation of financial impact figure The financial implications of cooling will vary from site to site, depending on temperature
rises and technology deployed. Increased cooling will lead to increased energy demand
with associated costs. As cooling is a a significant proportion of our energy costs (700
million) financial impacts are calculated by calculating costs of increased energy
demand of between 1% to 17% .
Cost of response to risk 500,000
Description of response and explanation of cost calculation The location of our major assets are planned taking into account potential changes in
the weather, such as from flooding or major variations in temperature. Vodafone is
developing and implementing methods for improving cooling efficiencies at base
stations and other network facilities. Cooling has a significant cost through energy use
and Vodafone are looking to reduce energy use through cooling by focusing on
improved technology, management and innovative solutions.

Vodafone Group CDP Climate Change Questionnaire 2020 Tuesday, August 18, 2020
20
C2 General
Our network is inherently distributed and continually upgraded to account for new and
improving technologies, this cycle of improvements allows for ongoing assessment of
the local conditions and setting equipment specifications appropriately to meet any
rising temperatures or other climate conditions.
The management costs associated with this issue are estimated to be €100-500k per
annum. This does not include capital costs which vary greatly for each initiative in the
programme. Additional energy and cooling reduction technologies/practices will help
improve the efficiency of cooling and reduce additional costs, therefore costs could be
avoided through savings leading to net cost savings.
Comment
Identifier Risk 3
Where in the value chain does the risk driver occur? Downstream
Risk type & Primary climate-related risk driver Reputation
Increased stakeholder concern or negative stakeholder feedback
Primary potential financial impact Decreased revenues due to reduced demand for products and services
Company-specific description Reputation damage from customer/stakeholder perception of lack of action on climate
change.
Customer awareness of climate change, and sustainable development more broadly, is
increasing. Our customers expect that we operate our business responsibly. In practical
terms, this means reducing the environmental impact of the products and services we
provide. If we fail to keep pace with the changes in customer expectation, with regard to
reducing the environmental impact of our products, we may lose market share. Many of
Vodafone’s corporate customer base expect high standards of environmental
performance, and we are frequently asked for information. Further more our
shareholders expect us to operate in a responsible manner including taking action to
reduce our environmental impact.
Time horizon Medium-term
Likelihood Likely

Vodafone Group CDP Climate Change Questionnaire 2020 Tuesday, August 18, 2020
21
C2 General
Magnitude of impact Medium
Are you able to provide a potential financial impact figure? Yes, a single figure estimate
Potential financial impact figure (currency) 2,000,000,000
Potential financial impact figure – minimum (currency)
Potential financial impact figure – maximum (currency)
Explanation of financial impact figure We have previously estimated that approximately €2bn worth of sales activity is
dependent on meeting customer requirements on climate change. Without appropriate
management, there is a risk that some of this value would be lost. This cost is based
upon a proportion of our customers which state environmental performance is a
significant factor in their decisions.
Cost of response to risk 38,000,000
Description of response and explanation of cost calculation We ensure customers who want information on our climate change credentials can
access information easily. We provide open and transparent information on our website.
In 2017 we set new public energy and carbon goals of purchasing 100% renewable
electricity and a 40% carbon reduction by 2025, as well as joining RE100. This has been
increased to a 50% carbon reduction last year to align with a 1.5c science based target
and increasing awareness of the importance of reducing our carbon emissions.
We are investing in more efficient equipment, deploying energy-saving software features
and introducing innovative on-site energy generation at our base stations and in our
technology centres.
Energy efficiency initiatives in technology centres include:
- integrating energy efficiency requirements within our supplier selection processes;
- implementing free air-cooling solutions and adiabatic solutions;
- increasing the temperature set point in our data centre server rooms and switching
centres; and
- implementing innovations such as dynamic thermal management systems and eco-
mode features on power conversion systems.
The costs for managing reputation risks are embedded throughout the company and the
decisions we make across all of our operations. It is expected that moving to 100%
renewable electricity will cost the company potentially 38 million Euros from 2017 to

Vodafone Group CDP Climate Change Questionnaire 2020 Tuesday, August 18, 2020
22
C2 General
2025, however there are also potential savings through great efficiency and long term
strategic energy purchasing (PPAs) or greater use of on site renewable energy sources.
Comment
C2.4
(C2.4) Have you identified any climate-related opportunities with the potential to have
a substantive financial or strategic impact on your business? Yes
C2.4a
(C2.4a) Provide details of opportunities identified with the potential to have a
substantive financial or strategic impact on your business.
Identifier Opp1
Where in the value chain does the opportunity occur? Direct operations
Opportunity type Products and services
Primary climate-related opportunity driver Development and/or expansion of low emission goods and services
Primary potential financial impact Increased revenues resulting from increased demand for products and services
Company-specific description New and expanded business opportunities through climate and energy efficiency
focused business solutions.
Vodafone’s Internet of Things (IoT) services make a significant contribution to the
reduction of emissions arising from its customers’ own operations. We have machine-to-
machine services bringing network intelligence and optimising energy use to a wide
variety of machines, devices and processes. Vodafone is a leading mobile provider in
IoT – with more than 100 million connections. Our research in 2016 found that 76% of
businesses surveyed say that IoT will be ‘critical’ to their success and nearly 50% are
already using IoT to support large-scale business transformation. We have seen
consistent year on year growth of IoT solutions including those related with energy and
carbon efficiency savings. We estimate that over 30% of our IoT products help our
customers to reduce their carbon emissions.

Vodafone Group CDP Climate Change Questionnaire 2020 Tuesday, August 18, 2020
23
C2 General
Key examples of Vodafone IoT applications which increased during 2019/20 include:
smart metering, using our connectivity to collect and analyse data on energy use in real
time; smart cities, bringing networked intelligence to the civil infrastructure relied upon
by the world’s growing urban populations through applications such as road traffic
management and advanced street lighting; smart logistics, embedding IoT technologies
within delivery vehicles to optimise route management, vehicle maintenance and driver
behaviour – applications which can reduce fuel consumption by up to 30%.
Time horizon Short-term
Likelihood Virtually certain
Magnitude of impact Medium-high
Are you able to provide a potential financial impact figure? Yes, an estimated range
Potential financial impact figure (currency)
Potential financial impact figure – minimum (currency) 5,000,000
Potential financial impact figure – maximum (currency) 200,000,000
Explanation of financial impact figure Industry analysed figures show mobile IoT network revenues are forecasted to have
grown at a CAGR of 23.3 percent from € 8.0 billion in 2015 to approximately € 22.8
billion in 2020. Vodafone is a leading mobile provider in IoT.
Cost to realize opportunity 0
Strategy to realize opportunity and explanation of cost calculation These opportunities are managed by Vodafone Business who are developing and
delivering a range of products and services from energy data management to fleet
management solutions and selling these services to Vodafone's enterprise clients.
Vodafone has previously linked its IoT business strategy to an emissions reduction
target and continues to measure, monitor and report our performance. We estimate that
the total emissions avoided as a consequence of our IoT technologies and services was
6.9 million tonnes CO2e in 2019/20 or 4 tonnes of CO2e for each tonne emitted through
our own operations.
Vodafone services enable companies and individuals to adapt to the associated
changing costs. We have many case studies and examples of how we are responding to
this opportunity – for example, we provide one of the UK’s largest providers of

Vodafone Group CDP Climate Change Questionnaire 2020 Tuesday, August 18, 2020
24
C2 General
telematics solution with connectivity. There are strong commercial incentives to reduce
fuel costs – and, as a consequence, reduce overall emissions. Telematics use our IoT
connections to transmit data from vehicles to fleet managers in order to identify
opportunities for efficiencies and improvements. One customer – achieved fuel savings
of 4.8% in its UK fleet in just one year.
Vodafone is already offering the opportunities, so no additional cost beyond that of
ongoing business costs associated with increasing our customer base and improving
our service offering are expected.
Comment
Identifier Opp2
Where in the value chain does the opportunity occur? Direct operations
Opportunity type Energy source
Primary climate-related opportunity driver Use of lower-emission sources of energy
Primary potential financial impact Reduced indirect (operating) costs
Company-specific description A shift towards low carbon renewable electricity can offer an opportunity for reduced
operational costs. More specifically long term Power Purchase Agreements (PPA) from
a renewable electricity generator can offer fixed electricity costs over long term (10+
years). This will hedge against any expected increases in electricity costs from carbon
taxation or transition costs. Additionally in a number of our markets the current PPA
strike price is lower than that available on the traditional national grid.
Time horizon Medium-term
Likelihood More likely than not
Magnitude of impact Low
Are you able to provide a potential financial impact figure? Yes, an estimated range

Vodafone Group CDP Climate Change Questionnaire 2020 Tuesday, August 18, 2020
25
C2 General
Potential financial impact figure (currency)
Potential financial impact figure – minimum (currency) 0
Potential financial impact figure – maximum (currency) 100,000,000
Explanation of financial impact figure Cost benefits vary by market and are dependent on the development of the PPA market
per operating country and the difference in cost between PPA and other electricity
contracts over the lifetime of the PPA. Vodafone has undertaken market specific
analysis of current and likely future costs of purchasing electricity from a variety of
sources and a number of renewable energy providers. These indicate that in some
markets there is potential for lower costs from PPAs than traditional contracts over the
life of the contract. However these are estimations based upon market projections,
therefore the reported financial impacts covers a large range across the company.
Last year Vodafone spent approximately 700 million euros on energy (principally
electricity), as many PPA contracts last 5-15 years, a saving across all of our energy
spend of 1.5% a year for 10 years would be approximately over 100 million euros.
Cost to realize opportunity 0
Strategy to realize opportunity and explanation of cost calculation Each market has undergone an energy modelling exercise to predict the expected
electricity market price up to and beyond 2025. Combined with a current market
estimation of available PPA deals following a global RFI there is a phased approach to
sign PPA deals where advantageous depending on market conditions.
No additional cost, part of business practice, potential additional staff resources but
included within business as usual costs.
Comment
Identifier Opp3
Where in the value chain does the opportunity occur? Direct operations
Opportunity type Resource efficiency
Vodafone Group CDP Climate Change Questionnaire 2020 Tuesday, August 18, 2020
26
C2 General
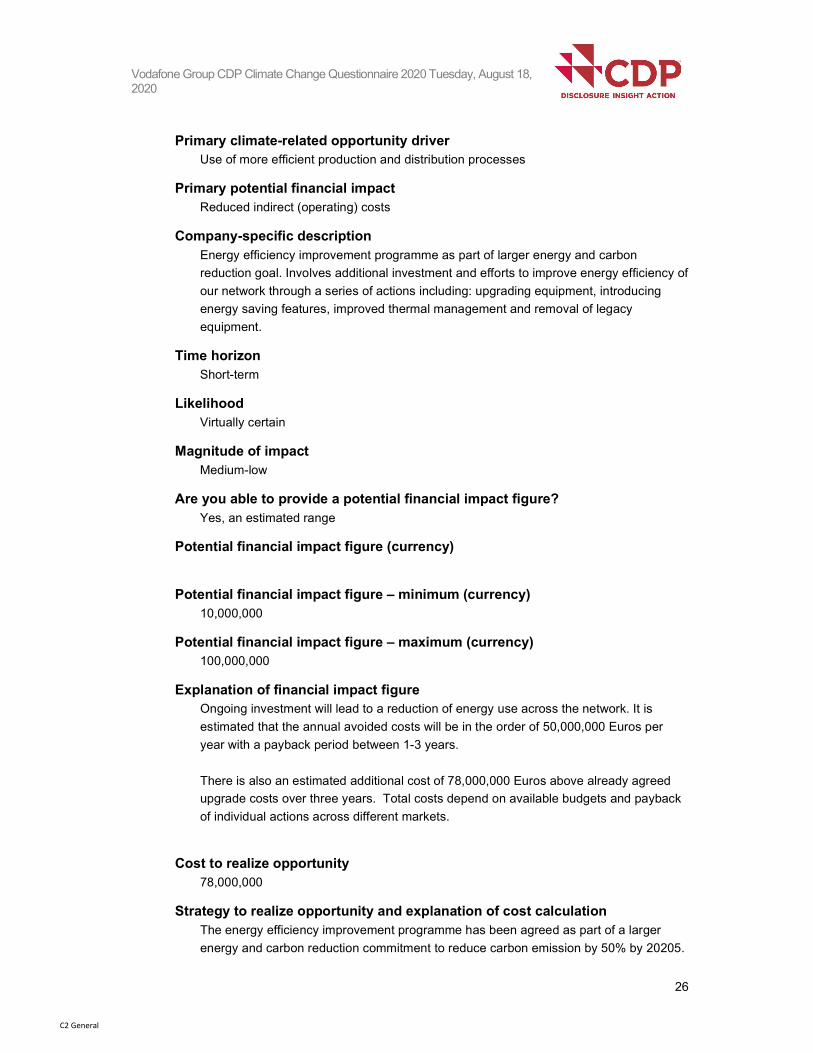
Primary climate-related opportunity driver Use of more efficient production and distribution processes
Primary potential financial impact Reduced indirect (operating) costs
Company-specific description Energy efficiency improvement programme as part of larger energy and carbon
reduction goal. Involves additional investment and efforts to improve energy efficiency of
our network through a series of actions including: upgrading equipment, introducing
energy saving features, improved thermal management and removal of legacy
equipment.
Time horizon Short-term
Likelihood Virtually certain
Magnitude of impact Medium-low
Are you able to provide a potential financial impact figure? Yes, an estimated range
Potential financial impact figure (currency)
Potential financial impact figure – minimum (currency) 10,000,000
Potential financial impact figure – maximum (currency) 100,000,000
Explanation of financial impact figure Ongoing investment will lead to a reduction of energy use across the network. It is
estimated that the annual avoided costs will be in the order of 50,000,000 Euros per
year with a payback period between 1-3 years.
There is also an estimated additional cost of 78,000,000 Euros above already agreed
upgrade costs over three years. Total costs depend on available budgets and payback
of individual actions across different markets.
Cost to realize opportunity 78,000,000
Strategy to realize opportunity and explanation of cost calculation The energy efficiency improvement programme has been agreed as part of a larger
energy and carbon reduction commitment to reduce carbon emission by 50% by 20205.
Vodafone Group CDP Climate Change Questionnaire 2020 Tuesday, August 18, 2020
27
C2 General
The roll out of best practice across all operating markets, using known actions and
savings across the network is on-going. For example, removing legacy equipment from
within base stations to remove energy use of redundant equipment. This roll out is
estimated to cost 78,000,000 euros across the business.
Comment
C3. Business Strategy
C3.1
(C3.1) Have climate-related risks and opportunities influenced your organization’s
strategy and/or financial planning? Yes, and we have developed a low-carbon transition plan
C3.1a
(C3.1a) Does your organization use climate-related scenario analysis to inform its
strategy? Yes, qualitative and quantitative
C3.1b
(C3.1b) Provide details of your organization’s use of climate-related scenario analysis.
Climate-related
scenarios and models
applied
Details
RCP 2.6 Scenarios used, inputs, assumptions, and analytical methods:
Science Based Approach to Target Setting in line with the 1.5 Degrees
Scenario.
Time Horizons:
Short term – 2017 – 2025
Longer term – 2010 -2050
Areas of organisation considered:
Entire Group
Results of scenario analysis:
In 2017, Vodafone set new carbon and renewable energy targets
covering all of our scope 1 and 2 emissions across the whole Group.
These targets used a science-based approach, based on an absolute
reduction of GHG emissions. Starting with our 2010 GHG emissions, we
tracked a 40-year reduction trajectory to 2050, taken from the European
Vodafone Group CDP Climate Change Questionnaire 2020 Tuesday, August 18, 2020
28
C2 General
66% emission mitigation scenario (2010-50 Representative
Concentration Pathway 2.6)11. Our GHG emissions increased between
2010 and 2017, so our target is set with the aim of acting sooner rather
than later, to bring our emissions in line with the 66% reduction
trajectory within eight years: by 2025, rather than meeting it at 2050.
This is appropriate as there was no telco industry specific reduction
pathway and, although we had a global coverage, we have a significant
presence in Europe which has a higher decarbonisation requirement
than our operations in Africa and the rest of the world.
This results in a steeper 40% reduction from a 2017 baseline, by 2025,
to bring us onto the 66% trajectory.
Since this target was set, the IPCC released its latest assessment which
recommended that a 1.5°C above pre-industrial levels would have
significantly lower impacts than 2°C. We recalculated our trajectory
under a 1.5°C scenario using the same method and in 2019 increased
our reduction commitment to 50% by 2025 from the same 2017
baseline.
How have the results informed business strategy:
This commitment was incorporated into a wider business strategy,
(Purpose business strategy which is embedded throughout all business
decisions), which included a commitment to reduce our environmental
impact by 50% by 2025.
This strategy and target is deemed ambitious as it requires significant
action over a short time frame with regards to what is achievable over
our geographic footprint. For example, renewable electricity availability
is currently poor in many of our developing markets so the time frames
and reduction is assessed with consideration to this and to the growing
demand for data over our networks.
Case study:
Furthermore, the Purpose strategy has informed specific functions'
actions to reduction their environmental impact (of which carbon is a
principal impact) as well as business offerings. Such examples include
offering more and new low carbon solutions to our business customers,
low impact and higher efficiency products for our mobile and broadband
customers and working with our supply chain to reduce our associated
carbon emissions.

Vodafone Group CDP Climate Change Questionnaire 2020 Tuesday, August 18, 2020
29
C2 General
Other, please specify
Bank of England 2021 biennial exploratory scenario on the financial risks from climate change
Scenarios used, inputs, assumptions, and analytical methods:
Vodafone has undertaken a high level TCFD aligned climate change
risk and opportunity analysis. As part of this process we used scenario
based analysis aligned to the Bank of England’s reference climate
scenarios – being used to stress test UK financial system against
climate change.
Time horizons:
The scenarios are modelled to a thirty-year timespan, out to 2050 to
align to the Paris agreement and other net zero 2050 targets.
Areas of organisation considered:
Entire Group.
Results of scenario analysis:
We adopted three scenarios in line with the Bank of England's reference
climate scenarios, as outlined in their consultation document released in
December 2019 (The 2021 biennial exploratory scenario on the financial
risks from climate change). We conduct the required assessments to
quantify the business impacts of all material climate-related risks under
each scenario and over different time horizons to better understand the
financial value at risk across service revenue, EBITDA and Free cash
flow.
How have the results informed business strategy:
The outputs of the scenario analysis are used to either adjust existing
policies or developing new ones, especially looking at opportunities to
improve our business resilience and continuity. It also informs the
assessment of our long term viability and allow us to validate the priority
areas of focus for climate action and within our environmental targets
and actions.
Case Study:
For example the reputation risks from not taking urgent action have
informed our decision to commit to setting a 1.5C Science Based Target
and sign up to the UN Business Ambition to 1.5C pledge.
C3.1d
(C3.1d) Describe where and how climate-related risks and opportunities have
influenced your strategy.
Have climate-related
risks and
opportunities
Description of influence

Vodafone Group CDP Climate Change Questionnaire 2020 Tuesday, August 18, 2020
30
C2 General
influenced your
strategy in this area?
Products and
services
Yes Description
Vodafone have a number of products which enable our
customers to reduce their carbon emissions through
improved efficiency of operations. Principally through the
use of IoT and connected "smart" solutions.
Action
As climate risks and action to reduce carbon emissions and
impacts increase we have identified new and increasing
business opportunities to offer expanded or new products
and services to our clients to support their management of
climate issues.
These opportunities were identified previously and
continually monitored to identify trends and new
opportunities. We are providing these services and products
now and expect continual growth in these areas over the
next 10 years. The growth of carbon reduction products are
services are a key focus of our Business function and
customer functions which is driven by the overall Purpose
and Planet focused strategy.
Example
For example monitoring and measuring of energy use and
optimisation via IoT smart meters which can provide data
across a large number of sites and aggregate the data to
identify outliers which may indicate sub optimal
performance. We are currently offering this product and
service and expect it to expand over the coming years.
While also investigating new and expanded opportunities in
this and other climate related areas.
Supply chain
and/or value
chain
Yes Description
We have identified a number of risks from climate change
within our own operations and that of our supply chain as
part of our scenario based risk and opportunity assessment.
Action
We recognise the risk from a changing climate across
multiple physical and transition factors and the mitigation
required. This also includes our scope 3 emissions of which

Vodafone Group CDP Climate Change Questionnaire 2020 Tuesday, August 18, 2020
31
C2 General
approximately a third of our emissions are from purchased
goods and services. These risks could become material
risks over the short, medium and long term, for example
cross boarder carbon adjustment taxes on imported goods
from high carbon manufacturing regions could directly add
procurement costs over the next two years, while an
increase in acute physical risks such as storm events could
increase supply chain disruption over a longer term,
Therefore we have taken multiple actions across our
purchasing and supplier engagement strategy to encourage
and support our suppliers to measure, monitor, report and
take action to reduce their carbon emissions over the next
five years.
We also have immediate assessments of our suppliers
action on climate and environmental performance which
influences our procurement decisions currently.
Example
For example as part of our RFQ process suppliers are
asked to complete questions on their carbon and climate
processes and management, those who perform better
have a higher weighted score and are preferentially chosen
over other organisations which are not taking action (and
therefore are at higher risk from climate change).
Investment in
R&D
Yes Description
As part of Vodafone's move to reduce our own
environmental impact and carbon emissions, and avoid
reputation risks, Vodafone is currently investing in energy
efficiency, renewable electricity and zero carbon energy
solutions.
Action
This investment is currently on going and is spread across
all our sites and activities, focusing on projects with the
most feasible payback periods. The magnitude of impact on
Vodafone is low, the additional costs and resources
invested are carefully considered to have low payback
periods which saves the company money over the medium
and long term.
Example
For example investment and research includes: novel
cooling technologies, on site renewable generation and low
emission alternatives. Further to this there is additional

Vodafone Group CDP Climate Change Questionnaire 2020 Tuesday, August 18, 2020
32
C2 General
investment in energy efficiency across our organisation to
reduce the risk of increasing prices and any potential
carbon taxation. These actions are taking place currently
and are expected to continue over the short and medium
term.
Operations Yes Description
Some minor impacts from climate change risks such as
increase cooling requirements or weather events are
expected. While greater opportunities from tackling climate
change in our operations and supporting our customers to
achieve their carbon ambitions.
Action
Some new investment and design considerations to cope
with increasing temperatures are considered. While
improved efficiency and low carbon solutions help to reduce
our carbon and climate impact as part of the Purpose and
Planet strategy. Action is being taken now and will continue
into the short and medium term.
Example
A key part of the Purpose and Planet strategy includes
reducing the impact we have on the environment across all
functions and focusing on how to reduce this while growing
as a business. This strategy is agreed and being
implemented. This offers opportunities to further increase
the ambition and action to reduce our impact and to expand
into new business areas and improve our competitive
advantages.
C3.1e
(C3.1e) Describe where and how climate-related risks and opportunities have
influenced your financial planning.
Financial planning
elements that have
been influenced
Description of influence
Row
1
Revenues
Direct costs
Capital
expenditures
Capital allocation
Description of impact: Revenues
There are Potential new opportunities from IoT connected devices to
help customers drive their resource reduction goals. Vodafone is
actively seeking an increase in IoT customers as part of continuing
business activities. This could be a potential driver of growth across the
company in the short and medium term.

Vodafone Group CDP Climate Change Questionnaire 2020 Tuesday, August 18, 2020
33
C2 General
Access to capital
Magnitude of impact: Revenues
There is a potential for loss of customers from reputational damage if
Vodafone is not seen to be addressing the issues of climate change.
One of the key drivers of 2025 energy and carbon transformational goals
is in maintaining good reputation on addressing issues of climate
change. Action in this area can maintain and enhance customer
satisfaction with our service and not only avoid loss of customers, but
also potentially gain customers..
The overall magnitude of impact following the setting of 2025 targets is
deemed low for negative impacts on our business, with a small short
term impact if insufficient action is taken over the next two years. While
the magnitude of positive revenue growth from positive reputation and
new revenue streams is greater over the medium and longer term,
leading to positive overall impacts.
Description of influence: Operating Costs
Current and future increased energy costs from greater cooling
requirements due to higher ambient temperatures and higher costs of
sourcing renewable electricity, including costs of building onsite
generation and switching from diesel generators to hybrid systems, all of
which have potential to increase operating costs across the organisation,
these are in the order of 1-2% of total annual energy spend.
How risks and opportunities have influence financial planning: Operating
Costs
Additional energy saving initiatives and action to reduce energy demand
from cooling and improve energy efficiency have begun to be
implemented to address the potential risks. These should help reduce
energy costs over the longer term but have short term cost increases.
Energy costs are one of the most significant costs across the company
therefore any increased costs are undesirable. Over the short term this
impact will have a medium additional cost on our purchasing of
equipment and renewable energy, longer term the total impact will be
lower due to potential savings and lower costs.
Description of influence: Capital Allocation
Greater capital expense on improving energy efficiency to reduce energy
use, more onsite renewable energy generation and alternative energy
sources. More investment in equipment with greater resilience to
increasing temperatures.
How risks and opportunities have influence financial planning: Capital
Allocation
Additional costs are often assessed against a short payback period

Vodafone Group CDP Climate Change Questionnaire 2020 Tuesday, August 18, 2020
34
C2 General
(commonly 3 years), this shows the potential for long term savings
through taking action now to address potential risks and increases in
costs associated with climate change.
Furthermore there are also potentially new investment opportunities into
new technologies and business practices to take advantage of
opportunities to connect more IoT devices and help customers reduce
their resource use and/or improve efficiency. This is expected to lead to
an increase in number and volume of customer IoT connections and
corresponding business growth over the medium to long term, following
a short term cost the longer term impact will be positive, business case
dependent.
New capital expenditure on on-site renewable energy generation.
Increases self-generation capacity and lowers carbon emissions,
increased capital input but removes equivalent fuel costs over lifetime of
the project.
Description of influence: Access to capital
There is an ongoing opportunity for capital raising against energy
efficiency, carbon reduction and IoT enabled customer reduction
programmes through processes such as green bonds or other
environmentally focused capital mechanisms.
How risks and opportunities have influence financial planning: Access to
capital
Vodafone has set out a green bond framework and in 2019 issues a 750
million Euro Green Bond against the frame work, reported on in 2020
including spend and associated environmental savings. In the future
there could be further use of these mechanisms to access capital at
potentially lower rates.
These could be in the order of hundreds of millions, in line with our
investment programme of energy efficiency and upgrade measures,
meaning the potential positive impact can be relatively significant
compared to none "green" finance over a short to longer term.
C3.1f
(C3.1f) Provide any additional information on how climate-related risks and
opportunities have influenced your strategy and financial planning (optional).

Vodafone Group CDP Climate Change Questionnaire 2020 Tuesday, August 18, 2020
35
C2 General
C4. Targets and performance
C4.1
(C4.1) Did you have an emissions target that was active in the reporting year? Absolute target
C4.1a
(C4.1a) Provide details of your absolute emissions target(s) and progress made
against those targets.
Target reference number Abs 1
Year target was set 2018
Target coverage Company-wide
Scope(s) (or Scope 3 category) Scope 1+2 (market-based)
Base year 2017
Covered emissions in base year (metric tons CO2e) 2,033,439
Covered emissions in base year as % of total base year emissions in selected
Scope(s) (or Scope 3 category) 100
Target year 2025
Targeted reduction from base year (%) 50
Covered emissions in target year (metric tons CO2e) [auto-calculated] 1,016,719.5
Covered emissions in reporting year (metric tons CO2e) 1,842,715
% of target achieved [auto-calculated]

Vodafone Group CDP Climate Change Questionnaire 2020 Tuesday, August 18, 2020
36
C2 General
18.7587628643
Target status in reporting year Underway
Is this a science-based target? Yes, we consider this a science-based target, but this target has not been approved as
science-based by the Science-Based Targets initiative
Please explain (including target coverage) We set new targets, published in 2018, using FY 16-17 as a baseline with a target
reduction of 40% by FY 24-25. In order to align with a 1.5C science based target
approach his was updated to a 50% carbon reduction in 2019, against the same FY 16-
17 baseline and to be achieved by FY 24-25. Vodafone has also publicly committed to
setting a Science Based Target aligned to 1.5C with the SBTi and the UN Business
Ambition 1.5C pledge, this will cover all of our Scope 1, 2 and 3 emissions aligning
reductions to the ITC industry pathway to keep warming below 1.5C.
Target reference number Abs 2
Year target was set 2019
Target coverage Company-wide
Scope(s) (or Scope 3 category) Scope 1+2 (market-based) +3 (upstream & downstream)
Base year 2020
Covered emissions in base year (metric tons CO2e) 13,767,374
Covered emissions in base year as % of total base year emissions in selected
Scope(s) (or Scope 3 category) 100
Target year 2050
Targeted reduction from base year (%) 100
Covered emissions in target year (metric tons CO2e) [auto-calculated] 0

Vodafone Group CDP Climate Change Questionnaire 2020 Tuesday, August 18, 2020
37
C2 General
Covered emissions in reporting year (metric tons CO2e) 13,767,374
% of target achieved [auto-calculated] 0
Target status in reporting year New
Is this a science-based target? Yes, we consider this a science-based target, but this target has not been approved as
science-based by the Science-Based Targets initiative
Please explain (including target coverage) In September 2019 Vodafone publicly committed to reach Net Zero Emissions by 2050,
this corresponds to a 100% reduction in our Scope 1, 2 and 3 emissions from a 2020
baseline year by 2050, an absolute reduction of 100% of our emissions of 13,767,374
tonnes CO2e.
The target requires a minimum of 3.3% annual reduction from 2020 for 30 years to
reach zero by 2050 at the latest. This target is aligned with limiting global temperature
rise to 1.5°C above pre-industrial levels and reaching net-zero emissions by no later
than 2050.
In addition new intermediate targets are currently being set which will cover the medium
term beyond our 2025 targets but before this long term 2050 target (discussed above),
it is intended to have the intermediate target approved by the Science Based Targets
initiative but this has not been achieved within this reporting period. These intermediate
targets will align with an annual reduction of 3.3% as per this target.
C4.2
(C4.2) Did you have any other climate-related targets that were active in the reporting
year? Target(s) to increase low-carbon energy consumption or production
Other climate-related target(s)
C4.2a
(C4.2a) Provide details of your target(s) to increase low-carbon energy consumption
or production.
Target reference number

Vodafone Group CDP Climate Change Questionnaire 2020 Tuesday, August 18, 2020
38
C2 General
Low 1
Year target was set 2017
Target coverage Company-wide
Target type: absolute or intensity Absolute
Target type: energy carrier Electricity
Target type: activity Consumption
Target type: energy source Renewable energy source(s) only
Metric (target numerator if reporting an intensity target) Percentage
Target denominator (intensity targets only)
Base year 2017
Figure or percentage in base year 12
Target year 2025
Figure or percentage in target year 100
Figure or percentage in reporting year 26
% of target achieved [auto-calculated] 15.9090909091
Target status in reporting year Underway
Is this target part of an emissions target? It is expected that by moving to 100% renewable electricity we will greatly reduce our
total carbon emissions, thus supporting our carbon target.
Is this target part of an overarching initiative?

Vodafone Group CDP Climate Change Questionnaire 2020 Tuesday, August 18, 2020
39
C2 General
RE100
Please explain (including target coverage) Target is to source 100% of our purchased electricity from renewable sources by 2025
across our global footprint, using a combination of energy efficiency, on site self
generation, PPAs, green electricity tariffs and unbundled certificates depending on
availability in the market. The principals of additionality are followed as best as possible.
C4.2b
(C4.2b) Provide details of any other climate-related targets, including methane
reduction targets.
Target reference number Oth 1
Year target was set 2020
Target coverage Company-wide
Target type: absolute or intensity Absolute
Target type: category & Metric (target numerator if reporting an intensity
target) Other, please specify
Other, please specify
Carbon enablement target.
Target denominator (intensity targets only)
Base year 2020
Figure or percentage in base year 0
Target year 2030
Figure or percentage in target year 350,000,000
Figure or percentage in reporting year 6,934,270

Vodafone Group CDP Climate Change Questionnaire 2020 Tuesday, August 18, 2020
40
C2 General
% of target achieved [auto-calculated] 1.98122
Target status in reporting year Underway
Is this target part of an emissions target? This is a complementary target which focuses on our ability to support our customers to
reduce their emissions.
Is this target part of an overarching initiative? No, it's not part of an overarching initiative
Please explain (including target coverage) From a base year of 2020 Vodafone will support customers to reduce their emissions by
350,000,00 tonnes CO2e over the 10 years to 2030. This is a cumulative value
achieved through our IoT enablement services, such as smart metering solutions,
connected telematics in vehicles and a number of other (mostly IoT) focused carbon
enablement service.
C4.3
(C4.3) Did you have emissions reduction initiatives that were active within the
reporting year? Note that this can include those in the planning and/or
implementation phases. Yes
C4.3a
(C4.3a) Identify the total number of initiatives at each stage of development, and for
those in the implementation stages, the estimated CO2e savings.
Number of
initiatives
Total estimated annual CO2e savings in metric
tonnes CO2e (only for rows marked *)
Under investigation 20 0
To be implemented* 25 107,964
Implementation
commenced*
40 271,835
Implemented* 45 193,867
Not to be implemented 0 0
C4.3b
(C4.3b) Provide details on the initiatives implemented in the reporting year in the table
below.

Vodafone Group CDP Climate Change Questionnaire 2020 Tuesday, August 18, 2020
41
C2 General
Initiative category & Initiative type Energy efficiency in production processes
Process optimization
Estimated annual CO2e savings (metric tonnes CO2e) 68,806
Scope(s) Scope 2 (market-based)
Voluntary/Mandatory Voluntary
Annual monetary savings (unit currency – as specified in C0.4) 3,500,000
Investment required (unit currency – as specified in C0.4) 22,200,000
Payback period 4-10 years
Estimated lifetime of the initiative 11-15 years
Comment Enabling energy saving features across mobile network basestation sites.
Initiative category & Initiative type Energy efficiency in production processes
Process optimization
Estimated annual CO2e savings (metric tonnes CO2e) 106,153
Scope(s) Scope 1
Scope 2 (market-based)
Voluntary/Mandatory Voluntary
Annual monetary savings (unit currency – as specified in C0.4) 5,630,000
Investment required (unit currency – as specified in C0.4) 289,650,000
Payback period

Vodafone Group CDP Climate Change Questionnaire 2020 Tuesday, August 18, 2020
42
C2 General
4-10 years
Estimated lifetime of the initiative 6-10 years
Comment Hardware upgrades across 14,000 sites to install new SRAN equipment which has
much greater efficiency improvement, there less use of grid electricity and lower diesel
use during back up or off grid sites.
Initiative category & Initiative type Low-carbon energy generation
Solar PV
Estimated annual CO2e savings (metric tonnes CO2e) 5,745
Scope(s) Scope 1
Scope 2 (market-based)
Voluntary/Mandatory Voluntary
Annual monetary savings (unit currency – as specified in C0.4) 120,000
Investment required (unit currency – as specified in C0.4) 2,400,000
Payback period 4-10 years
Estimated lifetime of the initiative 16-20 years
Comment Upgrade of back up generators from diesel to solar PV battery hybrid power cubes,
reducing demand for grid electricity and diesel consumption and associated emissions.
Initiative category & Initiative type Energy efficiency in buildings
Heating, Ventilation and Air Conditioning (HVAC)
Estimated annual CO2e savings (metric tonnes CO2e) 13,163

Vodafone Group CDP Climate Change Questionnaire 2020 Tuesday, August 18, 2020
43
C2 General
Scope(s) Scope 1
Scope 2 (market-based)
Voluntary/Mandatory
Annual monetary savings (unit currency – as specified in C0.4) 226,000
Investment required (unit currency – as specified in C0.4) 12,000,000
Payback period 4-10 years
Estimated lifetime of the initiative 11-15 years
Comment A number of efficiency improvements in cooling, heating and HVAC systems, reducing
total need for cooling with associated reduction in scope 1 emissions from refrigerant
gases and reduction in scope 2 emissions from lower electricity use.
C4.3c
(C4.3c) What methods do you use to drive investment in emissions reduction
activities?
Method Comment
Compliance with regulatory
requirements/standards
Vodafone complies with all regulatory requirements in the markets it
operates in. Including those related to energy and carbon emissions,
such as EU Energy directive.
Employee engagement Employees across the business are encouraged to plan and budget
for emission reduction activities, and to identify emission saving
projects to be put forward for approval.
An awareness raising e-learning tool has also been released to
increase employee engagement.
Furthermore, engagement campaigns grouped under a
#RedLovesGreen campaign with active engagement and discussion
programmes and nominated "Energy Champions" and "Energy
Gurus" to be local champions has been launched.
Financial optimization
calculations
We have developed business cases for a number of energy-saving
initiatives, looking at whole-life costing and incorporating cost of
carbon in future energy cost predictions.
Vodafone Group CDP Climate Change Questionnaire 2020 Tuesday, August 18, 2020
44
C2 General
C4.5
(C4.5) Do you classify any of your existing goods and/or services as low-carbon
products or do they enable a third party to avoid GHG emissions? Yes
C4.5a
(C4.5a) Provide details of your products and/or services that you classify as low-
carbon products or that enable a third party to avoid GHG emissions.
Level of aggregation Group of products
Description of product/Group of products "Internet of Things" Technologies enabling the avoidance of emissions by customers
through energy saving, monitoring, data gathering, associated efficiency savings. Of
these IoT connections we estimate that 31% enable low carbon efficiency savings.
Are these low-carbon product(s) or do they enable avoided emissions? Avoided emissions
Taxonomy, project or methodology used to classify product(s) as low-carbon
or to calculate avoided emissions Evaluating the carbon-reducing impacts of ICT
% revenue from low carbon product(s) in the reporting year 1
Comment We have had the customer carbon avoidance data independently calculated and
verified by a third party and state that for every tonne of carbon we emit ourselves our
connectivity enables 3.8 tonnes of carbon to be avoided by our customers.
C5. Emissions methodology
C5.1
(C5.1) Provide your base year and base year emissions (Scopes 1 and 2).
Scope 1
Base year start April 1, 2016
Base year end

Vodafone Group CDP Climate Change Questionnaire 2020 Tuesday, August 18, 2020
45
C2 General
March 31, 2017
Base year emissions (metric tons CO2e) 300,248
Comment Adjusted baseline from previous submissions to account for new acquisitions.
Scope 2 (location-based)
Base year start April 1, 2016
Base year end March 31, 2017
Base year emissions (metric tons CO2e) 2,344,511
Comment Adjusted baseline from previous submissions
Scope 2 (market-based)
Base year start April 1, 2016
Base year end March 31, 2017
Base year emissions (metric tons CO2e) 2,033,439
Comment Adjusted baseline from previous submissions
C5.2
(C5.2) Select the name of the standard, protocol, or methodology you have used to
collect activity data and calculate emissions. The Greenhouse Gas Protocol: A Corporate Accounting and Reporting Standard (Revised
Edition)
C6. Emissions data
C6.1
(C6.1) What were your organization’s gross global Scope 1 emissions in metric tons
CO2e?

Vodafone Group CDP Climate Change Questionnaire 2020 Tuesday, August 18, 2020
46
C2 General
Reporting year
Gross global Scope 1 emissions (metric tons CO2e) 279,143
Comment
C6.2
(C6.2) Describe your organization’s approach to reporting Scope 2 emissions.
Row 1
Scope 2, location-based We are reporting a Scope 2, location-based figure
Scope 2, market-based We are reporting a Scope 2, market-based figure
Comment
C6.3
(C6.3) What were your organization’s gross global Scope 2 emissions in metric tons
CO2e?
Reporting year
Scope 2, location-based 1,664,535
Scope 2, market-based (if applicable) 1,563,571
Comment
C6.4
(C6.4) Are there any sources (e.g. facilities, specific GHGs, activities, geographies,
etc.) of Scope 1 and Scope 2 emissions that are within your selected reporting
boundary which are not included in your disclosure? No

Vodafone Group CDP Climate Change Questionnaire 2020 Tuesday, August 18, 2020
47
C2 General
C6.5
(C6.5) Account for your organization’s gross global Scope 3 emissions, disclosing
and explaining any exclusions.
Purchased goods and services
Evaluation status Relevant, calculated
Metric tonnes CO2e 3,710,272
Emissions calculation methodology Calculated using an Environmentally Extended Economic Input Output (EEIO) approach
– this uses macro-economic modelling to determine the GDP value of different sectors
of the economy, and to associate that with the GHG emissions incurred by those
sectors. At its simplest, the total GHG emissions of the sector are divided by the total
GDP value generated by the sector to produce an emissions factor of x kg CO2e/€
value. By multiplying these emissions factors by the amount we spend on goods and
services in each sector, we can obtain a rough estimate of our emissions for purchased
goods and services.
Percentage of emissions calculated using data obtained from suppliers or
value chain partners 100
Please explain
Capital goods
Evaluation status Relevant, calculated
Metric tonnes CO2e 0
Emissions calculation methodology Calculated using an Environmentally Extended Economic Input Output (EEIO) approach
– this uses macro-economic modelling to determine the GDP value of different sectors
of the economy, and to associate that with the GHG emissions incurred by those
sectors. At its simplest, the total GHG emissions of the sector are divided by the total
GDP value generated by the sector to produce an emissions factor of x kg CO2e/€
value. By multiplying these emissions factors by the amount we spend on goods and
services in each sector, we can obtain a rough estimate of our emissions for purchased
goods and services.

Vodafone Group CDP Climate Change Questionnaire 2020 Tuesday, August 18, 2020
48
C2 General
Percentage of emissions calculated using data obtained from suppliers or
value chain partners 100
Please explain Emissions are included in purchased goods and services, above, as EEIO was
conducted across all suppliers.
Fuel-and-energy-related activities (not included in Scope 1 or 2)
Evaluation status Relevant, calculated
Metric tonnes CO2e 691,975
Emissions calculation methodology Upstream fuel and energy emissions are calculated by applying emissions factors
produced by BEIS to Vodafone fuel and energy consumption data.
Percentage of emissions calculated using data obtained from suppliers or
value chain partners 100
Please explain Emissions reductions included as part of energy management programmes.
Upstream transportation and distribution
Evaluation status Not relevant, explanation provided
Please explain Transportation and distribution of products between tier 1 suppliers and our operations
has been determined as not materially significant to Vodafone's Scope 3 emissions and
has not been calculated this year. In 2016-17 Vodafone assessed all scope 3 emissions
and used the results of this to determine which scope 3 emissions were relevant and
material. Upstream transportation and distribution was deemed to be 1.4% of total
scope 3 emissions with little opportunity for influence and of low risk. Each year a
qualitative assessment of any significant changes to the scale or influenceability is
undertaken to assess if this assessment is still true, therefore this category was not
calculated this year.
Waste generated in operations
Evaluation status Not relevant, calculated
Metric tonnes CO2e 722

Vodafone Group CDP Climate Change Questionnaire 2020 Tuesday, August 18, 2020
49
C2 General
Emissions calculation methodology Calculated by applying emissions factors from BEIS to data for waste generated by
Vodafone ready for treatment and disposal
Percentage of emissions calculated using data obtained from suppliers or
value chain partners 100
Please explain Not materially significant to Vodafone's Scope 3 emissions. We are not a waste-
intensive business, and any waste which is produced is in immaterial quantities of office
waste. Network equipment is reused wherever possible, or failing that recycled, but the
emissions from this process are not material. In 2016-17 Vodafone assessed all scope 3
emissions and used the results of this to determine which scope 3 emissions were
relevant and material. Waste generated in operations was deemed to be 0% of total
scope 3 emissions with little opportunity for influence and of low risk. Therefore this
category was calculated, but deemed not relevant
Business travel
Evaluation status Relevant, calculated
Metric tonnes CO2e 50,558
Emissions calculation methodology Calculated by applying emissions factors from BEIS to distances travelled for business
by different modes (air, rail, taxi and personal car).
Percentage of emissions calculated using data obtained from suppliers or
value chain partners 100
Please explain Transportation of employees for business-related activities. Measures in place to
minimise emissions from business travel.
Employee commuting
Evaluation status Not relevant, explanation provided
Please explain Not materially significant to Vodafone's Scope 3 emissions. In 2016-17 Vodafone
assessed all scope 3 emissions and used the results of this to determine which scope 3
emissions were relevant and material. Employee commuting was deemed to be 0.2% of
total scope 3 emissions. Each year a qualitative assessment of any significant changes
to the scale or influenceability is undertaken to assess if this assessment is still true,

Vodafone Group CDP Climate Change Questionnaire 2020 Tuesday, August 18, 2020
50
C2 General
therefore this category was not calculated this year. However, Vodafone does
encourage sustainable travel options for staff commuting, these are undertaken at a
local market level with incentives such as: public transport season ticket loans, bike to
work schemes, office showers and changing facilities, green travel week promotions,
allowing remote and home working.
Upstream leased assets
Evaluation status Relevant, calculated
Metric tonnes CO2e 50,438
Emissions calculation methodology Emissions have been estimated either by dividing the cost of electricity and diesel for
these sites by unit price/kwh, or by extrapolating based on number of leased sites and
an average emission value per site obtained from Vodafone owned sites.
Percentage of emissions calculated using data obtained from suppliers or
value chain partners 100
Please explain Operation of assets leased by Vodafone, including third-party network sites. This
includes sites leased from Ghana and Tanzania
Downstream transportation and distribution
Evaluation status Not relevant, explanation provided
Please explain Transport and distribution of sold products are assessed as not materially significant to
Vodafone's Scope 3 emissions. In 2016-17 Vodafone assessed all scope 3 emissions
and used the results of this to determine which scope 3 emissions were relevant and
material. Downstream Transportation and Distribution was deemed to be 0.7% of total
scope 3 emissions with little opportunity for influence and of low risk. Each year a
qualitative assessment of any significant changes to the scale or influenceability is
undertaken to assess if this assessment is still true, therefore this category was not
calculated this year.
Processing of sold products
Evaluation status Not relevant, explanation provided
Please explain Not relevant to Vodafone – we do not produce products for further processing.
Therefore no scope 3 emissions associated with this activity.

Vodafone Group CDP Climate Change Questionnaire 2020 Tuesday, August 18, 2020
51
C2 General
Use of sold products
Evaluation status Relevant, calculated
Metric tonnes CO2e 2,096,048
Emissions calculation methodology Calculated by multiplying the number of products sold by the energy usage for that
product and electricity emissions factors on a country basis. The total is the sum of all
values.
Percentage of emissions calculated using data obtained from suppliers or
value chain partners 100
Please explain Emissions from the use of goods and services sold by Vodafone, principally from the
energy used by network equipment – such as routers – and the energy required to
charge mobile devices.
End of life treatment of sold products
Evaluation status Not relevant, explanation provided
Please explain Not materially significant to Vodafone's Scope 3 emissions. In 2016-17 Vodafone
assessed all scope 3 emissions and used the results of this to determine which scope 3
emissions were relevant and material. End of life treatment of sold products was
deemed to be 0% of total scope 3 emissions. Each year a qualitative assessment of any
significant changes to the scale or influenceability is undertaken to assess if this
assessment is still true, therefore this category was not calculated this year.
Downstream leased assets
Evaluation status Not relevant, explanation provided
Please explain Not relevant to Vodafone - we do not have equipment or assets that we own and lease
to third parties.
Franchises
Evaluation status Not relevant, explanation provided
Please explain

Vodafone Group CDP Climate Change Questionnaire 2020 Tuesday, August 18, 2020
52
C2 General
Operation of franchises, including branded Partner Markets and franchise retail stores.
Obtained data from majority of partner markets. Not materially significant to Vodafone's
Scope 3 emissions. In 2016-17 Vodafone assessed all scope 3 emissions and used the
results of this to determine which scope 3 emissions were relevant and material.
Franchises were deemed to be 1.1% of total scope 3 emissions. Each year a qualitative
assessment of any significant changes to the scale or influenceability is undertaken to
assess if this assessment is still true, therefore this category was not calculated this
year. However, Vodafone does have minimum standards that franchises have to follow
which include elements relating to energy use, efficiency and climate change.
Investments
Evaluation status Relevant, calculated
Metric tonnes CO2e 5,324,647
Emissions calculation methodology For joint ventures in Australia, India, Kenya and the Netherlands, Scope 1 and 2
emissions are based on actuals and Scope 3 emissions are extrapolated from
Vodafone’s emissions. A percentage of Scope 1 and 2 emissions is reported based on
our equity share.
Percentage of emissions calculated using data obtained from suppliers or
value chain partners 100
Please explain Operation of investments not included in Scope 1 or 2 – our joint ventures in Australia,
India, Kenya and the Netherlands. Our tower company joint ventures in India (Indus),
and the UK (CTIL) and Greece (Victus) are included in Scope 3 – leased assets and
Scope 1 and 2 emissions respectively.
Other (upstream)
Evaluation status Not relevant, explanation provided
Please explain No other relevant or material upstream GHG emissions
Other (downstream)
Evaluation status Not relevant, explanation provided
Please explain No other relevant or material upstream GHG emissions.

Vodafone Group CDP Climate Change Questionnaire 2020 Tuesday, August 18, 2020
53
C2 General
C6.7
(C6.7) Are carbon dioxide emissions from biogenic carbon relevant to your
organization? No
C6.10
(C6.10) Describe your gross global combined Scope 1 and 2 emissions for the
reporting year in metric tons CO2e per unit currency total revenue and provide any
additional intensity metrics that are appropriate to your business operations.
Intensity figure 230
Metric numerator (Gross global combined Scope 1 and 2 emissions, metric
tons CO2e) 1,842,715
Metric denominator Other, please specify
Petabyte of Data
Metric denominator: Unit total 8,010
Scope 2 figure used Market-based
% change from previous year 39
Direction of change Decreased
Reason for change This was achieved due to continued mobile data traffic growth, while maintaining a flat
energy consumption through efficiency measures and a shift towards purchasing
renewable electricity. For example, dynamic thermal management within our data
centres reducing the total cooling requirement with associated reduction in energy use
and carbon emissions per unit of data transferred over our mobile network.

Vodafone Group CDP Climate Change Questionnaire 2020 Tuesday, August 18, 2020
54
C2 General
C7. Emissions breakdowns
C7.1
(C7.1) Does your organization break down its Scope 1 emissions by greenhouse gas
type? Yes
C7.1a
(C7.1a) Break down your total gross global Scope 1 emissions by greenhouse gas
type and provide the source of each used greenhouse warming potential (GWP).
Greenhouse
gas
Scope 1 emissions (metric tons of
CO2e)
GWP Reference
CO2 218,806 IPCC Fourth Assessment Report (AR4 -
100 year)
1
CH4 61 IPCC Fourth Assessment Report (AR4 -
100 year)
2
N2O 2,629 IPCC Fourth Assessment Report (AR4 -
100 year)
3
HFCs 57,646 IPCC Fourth Assessment Report (AR4 -
100 year)
4
1As per UK reporting requirements AR4 is used for annual report.
2As per UK reporting requirements AR4 is used for annual report.
3As per UK reporting requirements AR4 is used for annual report.
4As per UK reporting requirements AR4 is used for annual report.
C7.2
(C7.2) Break down your total gross global Scope 1 emissions by country/region.
Country/Region Scope 1 emissions (metric tons CO2e)
Albania 2,599
Czechia 1,351
Egypt 94,188
Germany 20,445

Vodafone Group CDP Climate Change Questionnaire 2020 Tuesday, August 18, 2020
55
C2 General
Ghana 10,105
Greece 12,817
Hungary 1,257
Ireland 993
Italy 3,995
Malta 159
Portugal 1,902
Romania 2,339
South Africa 16,055
Spain 8,151
Turkey 14,003
United Kingdom of Great Britain and Northern Ireland 9,806
Lesotho 1,136
United Republic of Tanzania 5,997
Mozambique 7,739
Democratic Republic of the Congo 28,096
C7.3
(C7.3) Indicate which gross global Scope 1 emissions breakdowns you are able to
provide. By business division
C7.3a
(C7.3a) Break down your total gross global Scope 1 emissions by business division.
Business division Scope 1 emissions (metric ton CO2e)
Network 142,948
Office 11,607
Retail 6,596
Transport (Fleet) 60,346
Refrigerants and Fire Suppressants 57,646
C7.5
(C7.5) Break down your total gross global Scope 2 emissions by country/region.
Country/Region Scope 2,
location-
based
Scope 2,
market-
based
Purchased and
consumed
electricity, heat,
Purchased and
consumed low-carbon
electricity, heat, steam or
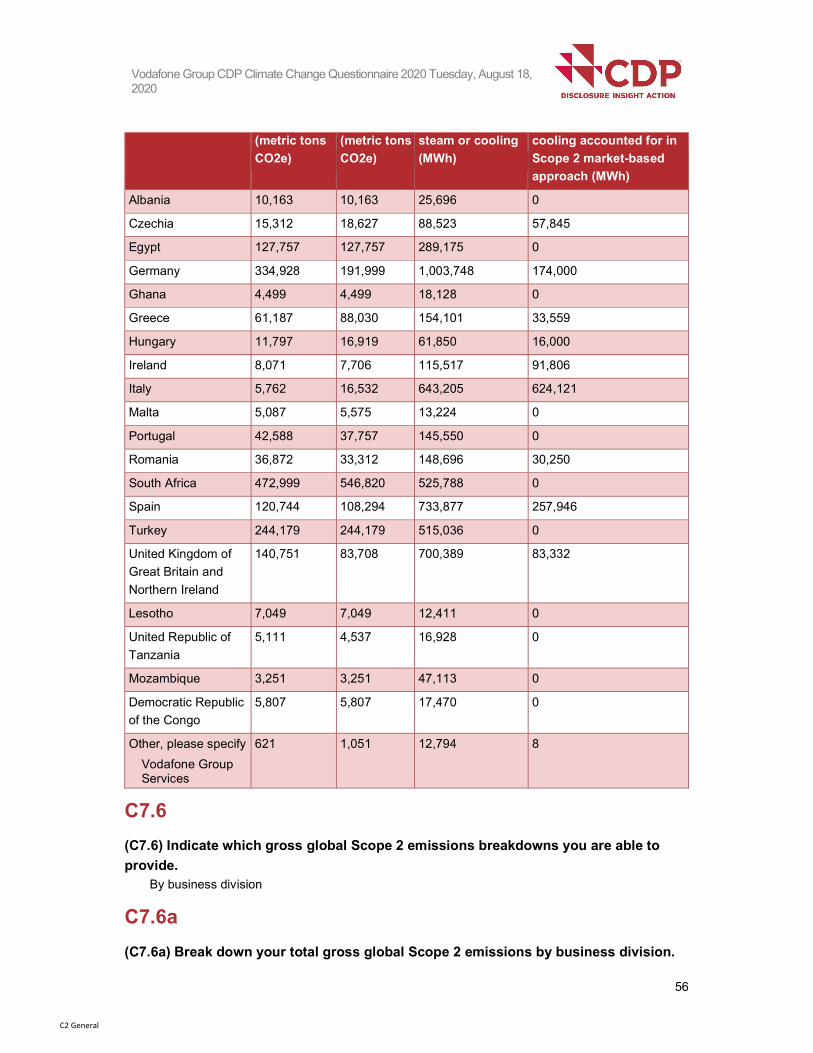
Vodafone Group CDP Climate Change Questionnaire 2020 Tuesday, August 18, 2020
56
C2 General
(metric tons
CO2e)
(metric tons
CO2e)
steam or cooling
(MWh)
cooling accounted for in
Scope 2 market-based
approach (MWh)
Albania 10,163 10,163 25,696 0
Czechia 15,312 18,627 88,523 57,845
Egypt 127,757 127,757 289,175 0
Germany 334,928 191,999 1,003,748 174,000
Ghana 4,499 4,499 18,128 0
Greece 61,187 88,030 154,101 33,559
Hungary 11,797 16,919 61,850 16,000
Ireland 8,071 7,706 115,517 91,806
Italy 5,762 16,532 643,205 624,121
Malta 5,087 5,575 13,224 0
Portugal 42,588 37,757 145,550 0
Romania 36,872 33,312 148,696 30,250
South Africa 472,999 546,820 525,788 0
Spain 120,744 108,294 733,877 257,946
Turkey 244,179 244,179 515,036 0
United Kingdom of
Great Britain and
Northern Ireland
140,751 83,708 700,389 83,332
Lesotho 7,049 7,049 12,411 0
United Republic of
Tanzania
5,111 4,537 16,928 0
Mozambique 3,251 3,251 47,113 0
Democratic Republic
of the Congo
5,807 5,807 17,470 0
Other, please specify
Vodafone Group Services
621 1,051 12,794 8
C7.6
(C7.6) Indicate which gross global Scope 2 emissions breakdowns you are able to
provide. By business division
C7.6a
(C7.6a) Break down your total gross global Scope 2 emissions by business division.

Vodafone Group CDP Climate Change Questionnaire 2020 Tuesday, August 18, 2020
57
C2 General
Business
division
Scope 2, location-based (metric tons
CO2e)
Scope 2, market-based (metric tons
CO2e)
Network 1,581,384 1,478,659
Office 75,619 78,769
Retail 7,531 6,144
Transport 0 0
C7.9
(C7.9) How do your gross global emissions (Scope 1 and 2 combined) for the
reporting year compare to those of the previous reporting year? Decreased
C7.9a
(C7.9a) Identify the reasons for any change in your gross global emissions (Scope 1
and 2 combined), and for each of them specify how your emissions compare to the
previous year.
Change in
emissions
(metric tons
CO2e)
Direction
of change
Emissions
value
(percentage)
Please explain calculation
Change in
renewable
energy
consumption
161,804 Decreased 8.03 Renewable electricity use as a share of
total grid electricity increased by
10.35% compared to last year (from
15.55% to 25.90%). 161,804 tonnes
CO2e is a 10.35% proportion of total
Scope 2 emissions this year.
161,804 (tonnes reduction) / 2,014,586
(previous year Sc 1 + 2 emissions) *
100 = 8.03% decrease
Other
emissions
reduction
activities
162,211 Decreased 8.05 Energy saving measures resulted in a
carbon reductions through reduced
energy use. This is calculated from the
total carbon reduction compared to last
year (note re-baselined to remove
divestment), then removing the savings
attributed to increased renewable
electricity, as above.
162,211 (tonnes reduction) / 2,014,586

Vodafone Group CDP Climate Change Questionnaire 2020 Tuesday, August 18, 2020
58
C2 General
(previous year Sc 1 + 2 emissions) *
100 = 8.05% decrease
Divestment 3,345 Decreased 0.17 Divestment of our operations in New
Zealand. 3,345 tonnes of carbon
reported last year removed from our
total emissions for this year (0.17%).
Note divestments are removed from
historic data each year.
3,345 (tonnes reduction) / 2,014,586
(previous year Sc 1 + 2 emissions) *
100 = 0.17% decrease
Acquisitions 18,549 Increased 0.92 Acquisition of new assets within our
existing market of Greece, new assets
are responsible for an 18.4% increase
scope 1 and 2 carbon within Greek
market. 18,549 tonnes of carbon are
equivalent to 1% of all Group
emissions. Note previous year's were
rebaselined to include this additional
proportion of emissions.
18,549 (tonnes reduction) / 2,014,586
(previous year Sc 1 + 2 emissions) *
100 = 0.92% increase
Mergers No Mergers
Change in
output
Although data use grew massively
(with greater energy requirements) this
was offset through greater energy
efficiency savings. It is not possible to
dis-aggregate these affects.
Change in
methodology
No significant change in methodology
Change in
boundary
No change in boundary
Change in
physical
operating
conditions
No change in physical operation
conditions
Unidentified None known
Other None known.

Vodafone Group CDP Climate Change Questionnaire 2020 Tuesday, August 18, 2020
59
C2 General
C7.9b
(C7.9b) Are your emissions performance calculations in C7.9 and C7.9a based on a
location-based Scope 2 emissions figure or a market-based Scope 2 emissions
figure? Market-based
C8. Energy
C8.1
(C8.1) What percentage of your total operational spend in the reporting year was on
energy? More than 10% but less than or equal to 15%
C8.2
(C8.2) Select which energy-related activities your organization has undertaken.
Indicate whether your organization undertook this energy-
related activity in the reporting year
Consumption of fuel (excluding
feedstocks)
Yes
Consumption of purchased or
acquired electricity
Yes
Consumption of purchased or
acquired heat
Yes
Consumption of purchased or
acquired steam
No
Consumption of purchased or
acquired cooling
No
Generation of electricity, heat,
steam, or cooling
Yes
C8.2a
(C8.2a) Report your organization’s energy consumption totals (excluding feedstocks)
in MWh.
Heating
value
MWh from
renewable
sources
MWh from non-
renewable
sources
Total (renewable
and non-renewable)
MWh

Vodafone Group CDP Climate Change Questionnaire 2020 Tuesday, August 18, 2020
60
C2 General
Consumption of fuel
(excluding feedstock)
LHV (lower
heating
value)
0 492,181 492,181
Consumption of
purchased or acquired
electricity
1,368,867 3,916,211 5,285,078
Consumption of
purchased or acquired
heat
0 4,142 4,142
Consumption of self-
generated non-fuel
renewable energy
5,886 5,886
Total energy
consumption
1,374,753 4,412,533 5,787,286
C8.2b
(C8.2b) Select the applications of your organization’s consumption of fuel.
Indicate whether your organization undertakes this
fuel application
Consumption of fuel for the generation of
electricity
Yes
Consumption of fuel for the generation of
heat
No
Consumption of fuel for the generation of
steam
No
Consumption of fuel for the generation of
cooling
No
Consumption of fuel for co-generation or
tri-generation
No
C8.2c
(C8.2c) State how much fuel in MWh your organization has consumed (excluding
feedstocks) by fuel type.
Fuels (excluding feedstocks) Other, please specify
Diesel (stationary )
Heating value LHV (lower heating value)

Vodafone Group CDP Climate Change Questionnaire 2020 Tuesday, August 18, 2020
61
C2 General
Total fuel MWh consumed by the organization 175,179
MWh fuel consumed for self-generation of electricity
MWh fuel consumed for self-generation of heat
Emission factor 2.68697
Unit kg CO2e per liter
Emissions factor source Source: UK Government GHG Conversion Factors for Company Reporting (2019)
(BEIS)
Comment
Fuels (excluding feedstocks) Other, please specify
Petrol (stationary)
Heating value LHV (lower heating value)
Total fuel MWh consumed by the organization 2,227
MWh fuel consumed for self-generation of electricity
MWh fuel consumed for self-generation of heat
Emission factor 2.31495
Unit kg CO2e per liter
Emissions factor source Source: UK Government GHG Conversion Factors for Company Reporting (2019)
(BEIS)
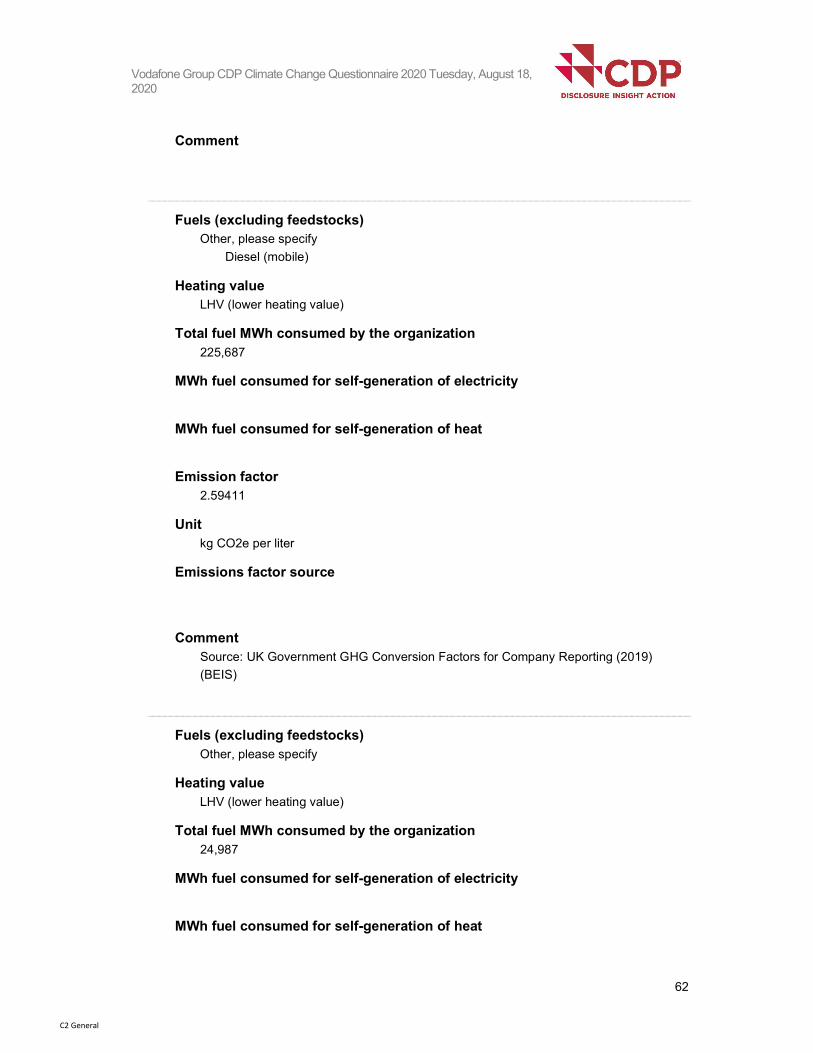
Vodafone Group CDP Climate Change Questionnaire 2020 Tuesday, August 18, 2020
62
C2 General
Comment
Fuels (excluding feedstocks) Other, please specify
Diesel (mobile)
Heating value LHV (lower heating value)
Total fuel MWh consumed by the organization 225,687
MWh fuel consumed for self-generation of electricity
MWh fuel consumed for self-generation of heat
Emission factor 2.59411
Unit kg CO2e per liter
Emissions factor source
Comment Source: UK Government GHG Conversion Factors for Company Reporting (2019)
(BEIS)
Fuels (excluding feedstocks) Other, please specify
Heating value LHV (lower heating value)
Total fuel MWh consumed by the organization 24,987
MWh fuel consumed for self-generation of electricity
MWh fuel consumed for self-generation of heat

Vodafone Group CDP Climate Change Questionnaire 2020 Tuesday, August 18, 2020
63
C2 General
Emission factor 2.20904
Unit kg CO2e per liter
Emissions factor source Source: UK Government GHG Conversion Factors for Company Reporting (2019)
(BEIS)
Comment
Fuels (excluding feedstocks) Natural Gas
Heating value LHV (lower heating value)
Total fuel MWh consumed by the organization 64,101
MWh fuel consumed for self-generation of electricity
MWh fuel consumed for self-generation of heat
Emission factor 0.18443
Unit kg CO2e per KWh
Emissions factor source Source: UK Government GHG Conversion Factors for Company Reporting (2019)
(BEIS)
Comment
C8.2d
(C8.2d) Provide details on the electricity, heat, steam, and cooling your organization
has generated and consumed in the reporting year.
Total Gross
generation
(MWh)
Generation that is
consumed by the
organization (MWh)
Gross generation
from renewable
sources (MWh)
Generation from
renewable sources that is

Vodafone Group CDP Climate Change Questionnaire 2020 Tuesday, August 18, 2020
64
C2 General
consumed by the
organization (MWh)
Electricity 5,886 5,886 5,886 5,886
Heat
Steam
Cooling
C8.2e
(C8.2e) Provide details on the electricity, heat, steam, and/or cooling amounts that
were accounted for at a zero emission factor in the market-based Scope 2 figure
reported in C6.3.
Sourcing method Power purchase agreement (PPA) with a grid-connected generator with energy attribute
certificates
Low-carbon technology type Wind
Country/region of consumption of low-carbon electricity, heat, steam or
cooling United Kingdom of Great Britain and Northern Ireland
MWh consumed accounted for at a zero emission factor 83,332
Comment Single PPA agreement with a named local wind farm in the UK power delivered through
the grid with the accompanying REGOs
Sourcing method Green electricity products (e.g. green tariffs) from an energy supplier, supported by
energy attribute certificates
Low-carbon technology type Low-carbon energy mix
Country/region of consumption of low-carbon electricity, heat, steam or
cooling Europe
MWh consumed accounted for at a zero emission factor 1,285,536

Vodafone Group CDP Climate Change Questionnaire 2020 Tuesday, August 18, 2020
65
C2 General
Comment Multiple supplier arrangements across Europe from a number of generation sources.
Each green tariff agreement is sourced with certificates and preference is given to: in
country generation sources, newer generation (<5 years) and preference give to wind
and solar generation as per our renewable sourcing hierarchy. However, we cannot
determine exactly what mix of generation sources are provided as certificates are not
available until the end of the year.
C9. Additional metrics
C9.1
(C9.1) Provide any additional climate-related metrics relevant to your business.
C10. Verification
C10.1
(C10.1) Indicate the verification/assurance status that applies to your reported
emissions.
Verification/assurance status
Scope 1 Third-party verification or assurance process in place
Scope 2 (location-based or market-based) Third-party verification or assurance process in place
Scope 3 Third-party verification or assurance process in place
C10.1a
(C10.1a) Provide further details of the verification/assurance undertaken for your
Scope 1 emissions, and attach the relevant statements.
Verification or assurance cycle in place Annual process
Status in the current reporting year Complete
Type of verification or assurance Limited assurance
Attach the statement

Vodafone Group CDP Climate Change Questionnaire 2020 Tuesday, August 18, 2020
66
C2 General
55842 Vodafone-ESG2020_AW5_V2.pdf
Page/ section reference Page 9-11 of the publicly available ESG Addendum report is the limited assurance
verification statement dated for year ending 31st March 2020.
Page 11 lists out the subject matter and values which received assurance, including
scope 1 emissions.
Relevant standard ISAE 3410
Proportion of reported emissions verified (%) 100
C10.1b
(C10.1b) Provide further details of the verification/assurance undertaken for your
Scope 2 emissions and attach the relevant statements.
Scope 2 approach Scope 2 location-based
Verification or assurance cycle in place Annual process
Status in the current reporting year
Type of verification or assurance Limited assurance
Attach the statement
55842 Vodafone-ESG2020_AW5_V2.pdf
Page/ section reference Page 9-11 of the publicly available ESG Addendum report is the limited assurance
verification statement dated for year ending 31st March 2020.
Page 11 lists out the subject matter and values which received assurance, including
scope 2 location -based emissions.
Relevant standard ISAE 3410
Proportion of reported emissions verified (%)

Vodafone Group CDP Climate Change Questionnaire 2020 Tuesday, August 18, 2020
67
C2 General
100
Scope 2 approach Scope 2 market-based
Verification or assurance cycle in place Annual process
Status in the current reporting year Complete
Type of verification or assurance Limited assurance
Attach the statement
55842 Vodafone-ESG2020_AW5_V2.pdf
Page/ section reference Page 9-11 of the publicly available ESG Addendum report is the limited assurance
verification statement dated for year ending 31st March 2020.
Page 11 lists out the subject matter and values which received assurance, including
scope 2 market-based emissions.
Relevant standard ISAE 3410
Proportion of reported emissions verified (%) 100
C10.1c
(C10.1c) Provide further details of the verification/assurance undertaken for your
Scope 3 emissions and attach the relevant statements.
Scope 3 category Scope 3: Business travel
Verification or assurance cycle in place Annual process
Status in the current reporting year Complete
Type of verification or assurance

Vodafone Group CDP Climate Change Questionnaire 2020 Tuesday, August 18, 2020
68
C2 General
Limited assurance
Attach the statement
55842 Vodafone-ESG2020_AW5_V2.pdf
Page/section reference Page 9-11 of the publicly available ESG Addendum report is the limited assurance
verification statement dated for year ending 31st March 2020.
Page 11 lists out the subject matter and values which received assurance, including
scope 3 based emissions.
Relevant standard ISAE 3410
Proportion of reported emissions verified (%) 100
C10.2
(C10.2) Do you verify any climate-related information reported in your CDP disclosure
other than the emissions figures reported in C6.1, C6.3, and C6.5? Yes
C10.2a
(C10.2a) Which data points within your CDP disclosure have been verified, and which
verification standards were used?
Disclosure
module
verification
relates to
Data verified Verification standard Please explain
C4. Targets and
performance
Renewable
energy products
International Standard
on Assurance
Engagements 3410 -
‘Assurance
Engagements on
Greenhouse Gas
Statements’ (ISAE
3410
As part of our limited assurance the
percentage of electricity from
renewable sources is one of the
underlying subject matter values
which are verified. See page 9-11 in
attached ESG Addendum Report
1
C5. Emissions
performance
Year on year
change in
emissions (Scope
1 and 2)
International Standard
on Assurance
Engagements 3410 -
‘Assurance
As part of our limited assurance the
change in scope 1 and 2 emissions is
one of the underlying subject matter
values which are verified. See page 9-

Vodafone Group CDP Climate Change Questionnaire 2020 Tuesday, August 18, 2020
69
C2 General
Engagements on
Greenhouse Gas
Statements’ (ISAE
3410
11 in attached ESG Addendum
Report
1
C6. Emissions
data
Year on year
change in
emissions (Scope
1)
International Standard
on Assurance
Engagements 3410 -
‘Assurance
Engagements on
Greenhouse Gas
Statements’ (ISAE
3410
As part of our limited assurance the
change in scope 1 is one of the
underlying subject matter values
which are verified. See page 9-11 in
attached ESG Addendum Report
1
C6. Emissions
data
Year on year
change in
emissions (Scope
2)
International Standard
on Assurance
Engagements 3410 -
‘Assurance
Engagements on
Greenhouse Gas
Statements’ (ISAE
3410
As part of our limited assurance the
change in scope 2 is one of the
underlying subject matter values
which are verified. See page 9-11 in
attached ESG Addendum Report
1
C6. Emissions
data
Year on year
change in
emissions (Scope
3)
International Standard
on Assurance
Engagements 3410 -
‘Assurance
Engagements on
Greenhouse Gas
Statements’ (ISAE
3410
As part of our limited assurance the
change in scope 3 is one of the
underlying subject matter values
which are verified. See page 9-11 in
attached ESG Addendum Report
1
C9. Additional
metrics
Other, please
specify
Ratio of IoT enabled savings to own Scope 1 and 2 emissions
International Standard
on Assurance
Engagements 3410 -
‘Assurance
Engagements on
Greenhouse Gas
Statements’ (ISAE
3410
As part of our limited assurance the
ratio of enabled carbon reduction
emissions compared to scope 1 and 2
emissions is one of the underlying
subject matter values which are
verified. See page 9-11 in attached
ESG Addendum Report
1
C5. Emissions
performance
Renewable
energy products
International Standard
on Assurance
Engagements 3410 -
As part of our limited assurance the
percentage of electricity from
renewable sources is one of the

Vodafone Group CDP Climate Change Questionnaire 2020 Tuesday, August 18, 2020
70
C2 General
‘Assurance
Engagements on
Greenhouse Gas
Statements’ (ISAE
3410
underlying subject matter values
which are verified. See page 9-11 in
attached ESG Addendum Report
1
C6. Emissions
data
Year on year
emissions
intensity figure
International Standard
on Assurance
Engagements 3410 -
‘Assurance
Engagements on
Greenhouse Gas
Statements’ (ISAE
3410
As part of our limited assurance the
change in emissions per PB of mobile
data emission intensity figure is one of
the underlying subject matter values
which are verified. See page 9-11 in
attached ESG Addendum Report
1
155842 Vodafone-ESG2020_AW5_V2.pdf
C11. Carbon pricing
C11.1
(C11.1) Are any of your operations or activities regulated by a carbon pricing system
(i.e. ETS, Cap & Trade or Carbon Tax)? No, and we do not anticipate being regulated in the next three years
C11.2
(C11.2) Has your organization originated or purchased any project-based carbon
credits within the reporting period? No
C11.3
(C11.3) Does your organization use an internal price on carbon? Yes
C11.3a
(C11.3a) Provide details of how your organization uses an internal price on carbon.
Objective for implementing an internal carbon price Drive energy efficiency
Drive low-carbon investment

Vodafone Group CDP Climate Change Questionnaire 2020 Tuesday, August 18, 2020
71
C2 General
GHG Scope Scope 2
Application Vodafone has used an internal carbon price to determine how energy and carbon costs
may change for our business. Vodafone uses an internal carbon price to forecast energy
costs for each of our business divisions and markets to come up with a value overall.
Actual price(s) used (Currency /metric ton) 10
Variance of price(s) used 0-20, the cost of carbon offsetting or potential carbon pricing and carbon taxes are used
to estimate costs and potential risks in the business.
Type of internal carbon price Implicit price
Offsets
Impact & implication Modelling of potential additional energy costs of fossil fuel based energy sources used
to drive business case for move towards renewable energy sources.
C12. Engagement
C12.1
(C12.1) Do you engage with your value chain on climate-related issues? Yes, our suppliers
Yes, other partners in the value chain
C12.1a
(C12.1a) Provide details of your climate-related supplier engagement strategy.
Type of engagement Compliance & onboarding
Details of engagement Included climate change in supplier selection / management mechanism
Code of conduct featuring climate change KPIs
Climate change is integrated into supplier evaluation processes
% of suppliers by number 95
% total procurement spend (direct and indirect)

Vodafone Group CDP Climate Change Questionnaire 2020 Tuesday, August 18, 2020
72
C2 General
95
% of supplier-related Scope 3 emissions as reported in C6.5 95
Rationale for the coverage of your engagement All major suppliers undertake an on boarding process which asks questions about their
environmental performance and carbon reductions, when flagged as non-compliant this
needs to be justified before they can be on boarded as an approved supplier to
Vodafone. Climate change and environmental performance is also a weighted category
in all RFQ processes with higher scores give to better performance. Furthermore, we
use of CDP supply chain data and other data gathered from suppliers to work with
suppliers on carbon reduction from major sources within our supply chain. This year,
138 (or 89%) of those suppliers asked to respond did so.
Impact of engagement, including measures of success Emphasises the importance of climate change to our suppliers and opens discussions
with suppliers who do not meet minimum requirements about what we expect from
them. Drives change through pressure to meet requirements.
This success is shown in the number and quality of CDP supply chain responses
through our engagement: 69% reported that they had set a structured target for GHG
emissions, while 99% and 97%% reported their scope 1 and scope 2 emissions
respectively.
Success will be measured by the number of suppliers who are reporting to CDP and
showing carbon reduction year on year, as well as the number who commit to their own
carbon targets (aligned to 1.5C science based targets) and the proportion of total spend
with suppliers with carbon reduction commitments and targets. For example over the
next 3 years the number of suppliers who are reporting carbon reductions increase, as
does the percentage of spend with suppliers who have set 1.5 aligned carbon reduction
targets.
Comment
Type of engagement Information collection (understanding supplier behavior)
Details of engagement Collect climate change and carbon information at least annually from suppliers
% of suppliers by number 2
% total procurement spend (direct and indirect) 70

Vodafone Group CDP Climate Change Questionnaire 2020 Tuesday, August 18, 2020
73
C2 General
% of supplier-related Scope 3 emissions as reported in C6.5 77
Rationale for the coverage of your engagement Engage our top 250 suppliers to report their carbon and energy data, renewable
electricity use and any targets via the CDP supply chain programme. Suppliers are
directly engaged on why it is important to respond and the value of responding and
taking action to both them and ourselves. There are also a number of awards and
recognition of those suppliers responding and taking significant action.
Impact of engagement, including measures of success 89% of requested suppliers responded to our information requests, much higher than
industry average. Of these 99% report scope 1 emissions and 97% report scope 2
emissions; furthermore 69% have emission reduction targets, all higher than the
industry average. Overall success is measured in the level of response and the number
of suppliers taking action to reduce their carbon emissions.
Comment
C12.1d
(C12.1d) Give details of your climate-related engagement strategy with other partners
in the value chain. On of the largest elements of our value chain and scope 3 emissions is that of our
investments, Joint Ventures and partner markets. We do not have operational control of these
organisations but through continual engagement we aim to influence and encourage carbon
reduction and sustainable action. This engagement includes sharing best practice, regular
(monthly) group calls, multi-day sustainable business workshops and specific engagement on
topics when requested. For example, one of our Joint Ventures: Saraficom has committed to
setting a science based target and we support their efforts through regular engagement, input
into strategy and supporting functions. Similarly a number of our Joint Ventures sent
sustainability representative to multiday sustainability workshop and bi-weekly sustainability
discussions.
C12.3
(C12.3) Do you engage in activities that could either directly or indirectly influence
public policy on climate-related issues through any of the following? Direct engagement with policy makers
Trade associations
Funding research organizations
C12.3a
(C12.3a) On what issues have you been engaging directly with policy makers?

Vodafone Group CDP Climate Change Questionnaire 2020 Tuesday, August 18, 2020
74
C2 General
Focus of
legislation
Corporate
position
Details of engagement Proposed legislative solution
Other,
please
specify
Green Deal
Support Vodafone supports the proposed EU
Green deal, we discuss the industry
position and how we can support a
"green, digital and resilient" economy
with members of the EU Commission
providing industry insight and
information.
Multiple and various including
purchasing of renewable
electricity, energy efficiency,
circular economy, carbon
taxation, digitalisation, labeling
and reporting requirements.
C12.3b
(C12.3b) Are you on the board of any trade associations or do you provide funding
beyond membership? Yes
C12.3c
(C12.3c) Enter the details of those trade associations that are likely to take a position
on climate change legislation.
Trade association BITKOM
Is your position on climate change consistent with theirs? Consistent
Please explain the trade association’s position BITKOM is the trade body for ICT in Germany. It supports the growth of energy
efficiency in the ICT sector and the adoption of renewable energy.
How have you influenced, or are you attempting to influence their position? Vodafone's Dr. Hannes Ametsreiter and Dr. Christoph Clément sit on the BITKOM
Board and communicate Vodafone Group's expectations regarding climate change.
Trade association BDI
Is your position on climate change consistent with theirs? Consistent
Please explain the trade association’s position

Vodafone Group CDP Climate Change Questionnaire 2020 Tuesday, August 18, 2020
75
C2 General
BDI is the trade body for German industry. BDI advocates for a number of
environmental initiatives including resource efficiency, the circular economy and energy
efficiency in buildings.
How have you influenced, or are you attempting to influence their position? Vodafone's Dr. Hannes Ametsreiter sits on the BDI presidum and communicates
Vodafone Group's expectations regarding climate change.
C12.3d
(C12.3d) Do you publicly disclose a list of all research organizations that you fund? No
C12.3f
(C12.3f) What processes do you have in place to ensure that all of your direct and
indirect activities that influence policy are consistent with your overall climate change
strategy? Vodafone's policy engagements are governed and coordinated by Group External Affairs. Any
policy engagement regarding energy and climate change must follow our environmental policy
requirements which set out our position on energy and climate change. External affairs
professionals within Vodafone are provided with training to ensure they are aware of the
requirements of the policy. Annually, as part of our environmental data collection process, we
ask all markets to describe the engagements they have taken place in. In this way, we ensure
that engagements are consistent with our overall climate change strategy.
C12.4
(C12.4) Have you published information about your organization’s response to climate
change and GHG emissions performance for this reporting year in places other than
in your CDP response? If so, please attach the publication(s).
Publication In mainstream reports
Status Complete
Attach the document
Vodafone Annual Report 2020 (1).pdf
55842 Vodafone-ESG2020_AW5_V2.pdf
Page/Section reference

Vodafone Group CDP Climate Change Questionnaire 2020 Tuesday, August 18, 2020
76
C2 General
Main Annual Report 2020 (ARA) - Planet (including climate change and energy)
information is integrated throughout the document.
Key sections include:
Our business at a glance - page 6
Our purpose - page 16
Our key performance indicators - page 26
Sustainable business - page 40
Risk management - page 62
In addition further sustainability data, information and KPIs can be found in the ESG
addendum (published with ARA)
Sustainability strategy - page 3
ESG performance data and assurance -page 6
Content elements Governance
Strategy
Risks & opportunities
Emissions figures
Emission targets
Other metrics
Comment
C15. Signoff
C-FI
(C-FI) Use this field to provide any additional information or context that you feel is
relevant to your organization's response. Please note that this field is optional and is
not scored. TO BE ADDED -RE100 spreadsheet
C15.1
(C15.1) Provide details for the person that has signed off (approved) your CDP climate
change response.
Job title Corresponding job category
Row 1 Vodafone Group CEO Chief Executive Officer (CEO)