RPSEA Final Report - National Energy Technology … Library/Research/Oil-Gas/enhanced oil... ·...
75
RPSEA Final Report 09123.11.Final Enhanced Oil Recovery from the Bakken Shale using Surfactant Imbibition Coupled with Gravity Drainage 09123-09 Dongmei Wang Petroleum Engineering Scientist Project members: Butler,R., Gosnold,W., LeFever,R., Mann, M., Weiser, A., Zhang,J. PREEC Team, Harold Hamm School of Geology & Geological Engineering University of North Dakota 81 Cornell St, Stop-8358 Grand Forks, ND, 58202 Co-Sponsor: North Dakota Industrial Commission Participants: CorsiTech, Hess Corporation, Tiorco Inc.
Transcript of RPSEA Final Report - National Energy Technology … Library/Research/Oil-Gas/enhanced oil... ·...

RPSEA Final Report
09123.11.Final
Enhanced Oil Recovery from the Bakken Shale using Surfactant
Imbibition Coupled with Gravity Drainage 09123-09
Dongmei Wang
Petroleum Engineering Scientist
Project members: Butler,R., Gosnold,W., LeFever,R., Mann, M., Weiser, A., Zhang,J.
PREEC Team, Harold Hamm School of Geology & Geological Engineering University of North Dakota 81 Cornell St, Stop-8358 Grand Forks, ND, 58202 Co-Sponsor: North Dakota Industrial Commission Participants: CorsiTech, Hess Corporation, Tiorco Inc.

II
LEGAL NOTICE
This report was prepared by University of North Dakota as an account of work sponsored by the Research Partnership to Secure Energy for America, RPSEA. Neither RPSEA members of RPSEA, the National Energy Technology Laboratory, the U.S. Department of Energy, nor any person acting on behalf of any of the entities:
a. MAKES ANY WARRANTY OR REPRESENTATION, EXPRESS OR IMPLIED WITH RESPECT TO ACCURACY, COMPLETENESS, OR USEFULNESS OF THE INFORMATION CONTAINED IN THIS DOCUMENT, OR THAT THE USE OF ANY INFORMATION, APPARATUS, METHOD, OR PROCESS DISCLOSED IN THIS DOCUMENT MAY NOT INFRINGE PRIVATELY OWNED RIGHTS, OR
b. ASSUMES ANY LIABILITY WITH RESPECT TO THE USE OF, OR FOR ANY AND
ALL DAMAGES RESULTING FROM THE USE OF, ANY INFORMATION, APPARATUS, METHOD, OR PROCESS DISCLOSED IN THIS DOCUMENT.
REFERENCE TO TRADE NAMES OR SPECIFIC COMMERCIAL PRODUCTS, COMMODITIES, OR SERVICES IN THIS REPORT DOES NOT REPRESENT OR CONSTIITUTE AND ENDORSEMENT, RECOMMENDATION, OR FAVORING BY RPSEA OR ITS CONTRACTORS OF THE SPECIFIC COMMERCIAL PRODUCT, COMMODITY, OR SERVICE.

III
Executive Summary
With its low permeability and oil-wet character, using existing methods, oil recovery factors of the
naturally fractured Bakken formation have only been a few percent of original oil in place. This project
investigates whether a new surfactant imbibition concept can significantly improve oil recovery from the
Bakken shale. This concept involves formulating special surfactant solutions that will alter the wettability
of the formation, without causing formation damage. This alteration should promote imbibition of a dilute
aqueous surfactant solution and increase oil displacement from the shale. The concept also relies on
exploitation of gravity for collection and recovery of the oil in the system from natural and hydraulic
fractures associated with horizontal wells.
In this project, we first tested the degree of imbibition for available waters in different portions of the
Bakken shale, to establish their true wetting state. We also investigated whether imbibition can be induced
using only pH or salinity variations. We then tested a number of surfactants to identify formulations that
will promote maximum imbibition into and oil displacement from Bakken shale cores. Based on those
laboratory results, we will produce a numerical model that incorporates the relevant physics of surfactant
imbibition and oil displacement for the Bakken shale. This model will then be used to assess the potential
of this surfactant imbibition process for existing completions within the Bakken shale and assess whether
alternative well completion/fracture configurations might provide higher oil recoveries.
Our major findings in the tasks “Surfactant formulation optimization and extension imbibition
experiments (Subtasks 4.1 and 4.3)” include: (1) Imbibition rate increases as the temperature increases in
the range tested. (2) Cationic surfactants with less carbon number heads exhibited a lower imbibition rate
and low capability for enhanced oil recovery. On the other hand, cationic surfactants with large carbon
numbers have a fast imbibition rate and strong effect on oil production at higher temperature, and also at
room temperature. (3) Nonionic surfactants also exhibit a favorable imbibition rate and oil recovery at high
temperature. (4) Oil was not imbibed out at room temperature with brine water and fresh water. Although
oil was recovered from rocks at high temperature, the very low imbibition rate indicates these were not
favorable aqueous liquids for increasing Bakken oil recovery. (5) Effective permeability was increased by
surfactant formulation compared to fresh water or brine water alone. Imbibition rate was increased due to a
higher permeability.
For the tasks of “Phase behavior studies and interfacial tension test (Subtask 4.4-4.5)”, we found: (1)
Optimal salinities can be estimated from curves showing the relationship between microemulsion phases
and corresponding oil/water volumes proportions for most selected surfactants at 2% concentrations at
lower temperatures. However, at higher temperatures, it was difficult to evaluate this effect in some
solutions due to the limited volumes recovered. (2) Without mixing alkaline in anionic surfactant solutions,
interfacial tensions (IFT) were reduced to 10-2
orders of magnitude at high temperature. Under the same
conditions, nonionic surfactants, amphoteric surfactants, and cationic surfactants reduced IFT up to10-1
order of magnitude. Concentrations of 0.1% were used in IFT measurements. (3) The optimal salinities
obtained by IFT curves are consistent with phenomena observed in the phase behavior studies at reservoir
temperatures near 90°C. (4) With optimal salinity, inverse Bond number NB-1
which dominates the IFT
reduction mechanism, could be decreased below a value of 1 in cores from the Middle member of Bakken.
For the task of “Wettability experiments (Subtask 4.2)”, we think: laboratory results suggest that
wettability change is the key mechanism if the surfactants show favorable behavior for oil recovery when
there is no obvious middle phase exhibited in the same temperature range.
IV
Based on the research results of task “ Numerical simulation and modeling of imbibition (Task 5)”, we
think: (1) based on numerical simulations, use of a surfactant imbibition process similar to one developed
on Bakken Well # 17450 could increase recovery of oil more than 10% over current production methods.
(2) Injection rate and production sequence apparently affect oil recovery. A reasonable injection rate and
production sequence should be considered completely when designing a field trial.
In the Bakken shale formation located in the middle of the Williston Basin, an increase of 1% in recovery
could lead to an increase of 2 - 4 billion barrels or more of domestic oil production. We will team with one
or more small producers during this project to field test our developments.
This three-year research project (Mar. 2011 to Mar. 2014) is funded by $500,000 from RPSEA (Research
Partnership to Secure Energy for America) and $125,000 by NDIC (North Dakota Industrial Commission).
CosiTech (NALCO Champion), Tiorco, and Hess Corporation are participants in this project.

V
Abstract
With its low permeability and oil-wet character, using existing methods, oil recovery factors of the
naturally fractured Bakken formation have only been a few percent of original oil in place. This project
investigates whether a new surfactant imbibition concept can significantly improve oil recovery from the
Bakken shale. This concept involves formulating special surfactant solutions that will alter the wettability
of the formation, without causing formation damage. This alteration should promote imbibition of a dilute
aqueous surfactant solution and increase oil displacement from the shale. The concept also relies on
exploitation of gravity for collection and recovery of the oil in the system from natural and hydraulic
fractures associated with horizontal wells.
In this project, we first tested the degree of imbibition for available waters in different portions of the
Bakken shale, to establish their true wetting state. We also investigated whether imbibition can be induced
using only pH or salinity variations. We then tested a number of surfactants to identify formulations that
will promote maximum imbibition into and oil displacement from Bakken shale cores. Based on those
laboratory results, we will produce a numerical model that incorporates the relevant physics of surfactant
imbibition and oil displacement for the Bakken shale. This model will then be used to assess the potential
of this surfactant imbibition process for existing completions within the Bakken shale and assess whether
alternative well completion/fracture configurations might provide higher oil recoveries.
By the end of December 2013, we accomplished all subtasks include laboratory research and numerical
simulation prediction. Based on the research results, we found: (1) Imbibition rate increases as the
temperature increases in the range tested. (2) Cationic surfactants with less carbon number heads exhibited
a lower imbibition rate and low capability for enhanced oil recovery. On the other hand, cationic
surfactants with large carbon numbers have a fast imbibition rate and strong effect on oil production at
higher temperature, and also at room temperature. (3) Nonionic surfactants also exhibit a favorable
imbibition rate and oil recovery at high temperature. (4) Oil was not imbibed out at room temperature with
brine water and fresh water. Although oil was recovered from rocks at high temperature, the very low
imbibition rate indicates these were not favorable aqueous liquids for increasing Bakken oil recovery. (5)
Effective permeability was increased by surfactant formulation compared to fresh water or brine water
alone. Imbibition rate was increased due to a higher permeability. (6) Optimal salinities can be estimated
from curves showing the relationship between microemulsion phases and corresponding oil/water volumes
proportions for most selected surfactants at 2% concentrations at lower temperatures. However, at higher
temperatures, it was difficult to evaluate this effect in some solutions due to the limited volumes recovered.
(7) Without mixing alkaline in anionic surfactant solutions, interfacial tensions (IFT) were reduced to 10-2
orders of magnitude at high temperature. Under the same conditions, nonionic surfactants, amphoteric
surfactants, and cationic surfactants reduced IFT up to10-1
order of magnitude. Concentrations of 0.1%
were used in IFT measurements. (8) The optimal salinities obtained by IFT curves are consistent with
phenomena observed in the phase behavior studies at reservoir temperatures near 90°C. (9) With optimal
salinity, inverse Bond number NB-1
which dominates the IFT reduction mechanism, could be decreased
below a value of 1 in cores from the Middle member of Bakken. (10) Laboratory results suggest that
wettability change is the key mechanism if the surfactants show favorable behavior for oil recovery when
there is no obvious middle phase exhibited in the same temperature range. (11) Compared with the current
production methods, the enhanced oil recovery of more than 10% could be achieved in a few years using
the surfactant imbibition process for Bakken Well #17450, based on numerical simulation prediction. (12)
Injection rate and production sequence apparently affect oil recovery. A reasonable injection rate and
production sequence should be considered completely when designing a field trial.

VI
Table of Contents
Cover page ……………..………………………………………………………………………I
Legal notice ……………..………………………………………………………………………II
Executive Summary ……………..…………………………………………………………… III
Abstract ……………..……………………………………………………………………… V
Table of Contents ……………..…………………………………………………………………VI
List of Tables………………………………………………………………………………… VII
List of Figures…………………………………………………………………………………VII
Acknowledgements……………………………………………………………………………IX
Chapter 1. Introduction…….………………………………………………………………………1
Chapter 2. Surfactant Formulation Preliminary Optimization………………………………….3
2.1 Methodology……………………….……………………………………………………3
2.2 Core preparation………………..……………….………………………………………4
2.3 Surfactant optimization procedures………………………………………………………4
2.4 Data analysis and discussion…………………………………………………………5
2.5 Summary………………………………………………………………………………10
Chapter 3. Wettability Experiments…………………………………………………………11
3.1 Methodology…….…………………………………………………………………11
3.2 Data analysis………………………………………………………………………13
3 .3 D iscussion………………….. ..…………………………………………………18
3.4 Summary…………………..……………………………………………………… 20
Chapter 4. Phase Behavior and Interfacial Tension Study…….…………………………………21
4.1 Methodology…….…………… .……………………………………………………21
4.2 Phase behavior study……………………………………………………………22
4 .3 In ter fac ia l t ens ion ( IFT) s tudy …………………….….…………………24
4 .4 Results analysis…………………….. …….………………….………………25
4 .5 Summary………………………………………………………………………… 26
Chapter 5. Extensive Imbibition Experiments……………………………………………………27
5.1 Imbibition rate and oil recovery………………………………………………27
5.2 Boundary condit ions………..…………………………………………………30
5 .3 D iscussion………………….. ..…………………………………………………30
5.4 Summary………………………………………………………………………… 31
Chapter 6. Ideal Numerical Simulation Model Building………………………………………32
6.1 Mathematical model………………..……………………………………………32
6.2 Ideal simulation model description………………………………………………33
6.3 Oil recovery…………………....…………………………………………………34
6.4 Surfactant concentration…….. ..………………………………………………34
6.5 Water salinity…………………....…………………………………………………34
6.6 Injection rate…………………....…………………………………………………34
6.7 Summary……………………………………………………………………………34
Chapter 7. Field-Scale Numerical Simulation Predication………………………………35
7.1 Well model………………..……………………………………………………………35
7.2 History match………………………………………………………………………36
7.3 Surfactant imbibition prediction...…………………………………………………36
7.4 Production sequence ……………....………………………………………………37
7.5 Injection rate…………………....…………………………………………………37
VII
7.6 Summary……………………………………………………………………………37
Chapter 8. Conclusions………………………………………..…………………………38
Nomenclature………………………………………………………………………………39
References…………………………………………………………………………………40
SI Metric Conversion Factors…………………………………………………………………43
List of Tables Table 1 Deliverable summary..………………………………………………………………….2
Table 2 Core plug description………………………………………………………………….3
Table 3 Summary of geological parameters and fluid saturations………………………….3
Table 4 Surfactant stability at high temperature……………………………………………….6
Table 5 XRD analysis of Bakken Well #15772……………………………………………….7
Table 6 Chemical analysis of Bakken Formation water…….……………………………….8
Table 7 pH values vs. oil recovery…………………………………………………………….9
Table 8 pH values vs. temperature…………………………………………………………….9
Table 9 Surfactant formulation optimization….……………………………………………….10
Table 10 Surfactant formulations for wettability tests………………………………………….13
Table 11 Wettability of Well #16433 at 23°C, D=25mm, L (Thickness) =2-4 mm……………13
Table 12 Dimensions and porosities of core from Well #16433 ………………….………….14
Table 13 Dimensions and porosities of core from Well #16771 …….………….………….14
Table 14 Wettability of Well #16771 at 90 to 120°C, D=38mm, L (Thickness) =13 m……….15
Table 15 Dimensions and porosities of core from Well #17450…….….………….…………16 Table 16(a) Wettability of Well #17450 at 60 to 120°C, D=38mm, L (Thickness) =4-52 mm, MC……….17
Table 16(b) Wettability of Well #17450 at 90 to 120°C, D=38mm, L (Thickness) =4-52 mm, MD…….17
Table 17 Surfactant formulations for phase behavior study………………….………………….22
Table 18 Surfactant formulations for IFT study………………………………………………….25
Table 19 Inverse Bond number NB-1
estimation (90°C)………………………………………….26
Table 20 Core sample dimension and porosity……….………………………………………….28
Table 21 Imbibition rate vs. time (optimal salinity, 120°C)…………………………………….29
Table 22 Parameters used in the simulation model………………………………………………36
Table 23 Production sequence effect on oil recovery………..………………………………….37
Table 24 Injection rate effect on oil recovery………………..………………………………….37
List of Figures Fig. 1 Partial core slabs of Well #16433………………………………………………………….45
Fig. 2 Clay flaking in brine water, 23°C.……………………………………………………..…45
Fig. 3 Temperature stability before and after 105°C aging with 30 % TDS-1……………..…46
Fig. 4 Temperature stability before and after 105°C aging with 30 % TDS-2…………..……46
Fig. 5 C1 alone aging at 23°C……….…………………………………………………………...46
Fig. 6 C1 after 30% alcohol added aging for 15 days……….……….…………………………...46
Fig. 7 58N with 30 % aging at 110°C for 15 days………….…………..…………………..…….47
Fig. 8 17A before and after 0.1% alkaline added aging at 110°C after 7 days …………………47
Fig. 9(a) Aging at 110°C and 30% TDS before 50 days…………..…………………..…………47
Fig. 9(b) Aging at 110°C and 30% TDS after 50 days ………………………………..…………47
Fig. 10 Temperature vs. oil recovery, 30%..............................………………………..………….47
Fig. 11 Temperature vs. oil recovery, 15%...................................... ………….…………………48
Fig. 12 Solution salinity vs. oil recovery…………………………………………………………48

VIII
Fig. 13 0.1% alkali added to surfactant samples……………………. ………….……………..49
Fig. 14 Effect of divalent content on oil recovery…………………………….………………..49
Fig. 15 Effect of surfactant concentration on oil recovery……………………….…………….50
Fig. 16 0.2% concentration of 17A effect...…………………………………………..………….50
Fig. 17 Co-surfactant aged before and after 50 days, and 17 days (right) ……………….….50
Fig. 18 Forced injection illustration for Method MB …………………………………………….50
Fig. 19 Scheme for spontaneous imbibition and forced injection by Method MC ………………51
Fig. 20 Scheme for spontaneous imbibition and forced injection by Method MD ….…………51
Fig. 21 Core sample location and well log curves for Well #16433……………..…………….51
Fig. 22 Core sample location and well log curves for Well #16771………… …….………….52
Fig. 23 Core sample location and well log curves for Well #17450……………………………52 Fig. 24a Phase behavior of S-2 at 23°C ………………………….…….……………..…………53
Fig. 24b Vo/Vs and Vw/Vs of S-2 at 23°C....................................................................…………53
Fig. 25 Phase behavior of S-2 at 120°C ……………………….…..………………..……………53
Fig. 26a Phase behavior of N-2512 at 23°C and 60°C ……………..……….……..……………54
Fig. 26b Vo/Vs and Vw/Vs of N-2512 at 60°C...........................................................…….………54
Fig. 27 Phase behavior of N-2512 at 120°C ………………………..……………..……………54
Fig. 28 Phase behavior of 58N at 120°C …………………………..……………..……………54
Fig. 29a Phase behavior of 17A at 23°C ………………………..……………..……………54
Fig. 29b Vo/Vs and Vw/Vs of 17A at 23°C...........................................................……………54
Fig. 30 Phase behavior of 17A at 90°C (0-30% TDS) ………………………....…………55
Fig. 31 Phase behavior of TA-15 at 90°C (0-30% TDS) ………………………..…………55
Fig. 32 Phase behavior of TA-15 at 120°C ………………………..……………..……………55
Fig. 33 IFT vs. salinity of surfactants at 90°C ………………………..…………...……………56
Fig. 34a IFT vs. salinity of N-2512 at three temperatures ………………………..……………56
Fig. 34b IFT vs. salinity of S-2 at three temperatures ………………………..……..……………57
Fig. 34c IFT vs. salinity of TA-15 at three temperatures ………………………..………………57
Fig. 34d IFT vs. salinity of 17A at three temperatures ………………………..…………………58
Fig. 35 Alkaline effect on IFT reduction at 90°C ……………………..…………...……………58
Fig. 36a Oil recovery at optimal salinity at 120°C vs. time………………………………..……59
Fig. 36b Oil recovery at optimal salinity at 120°C vs. dimensionless time………………..……59
Fig. 37 Oil recovery comparison at optimal salinity and formation water salinity………..……59
Fig. 38 Oil recovery comparison vs. boundary conditions at 120°C ……….……………..……60
Fig. 39 Illustration of ideal simulation model……………………….……………………..……60
Fig. 40 Oil recovery comparison between surfactant formulation imbibition and brine alone.61
Fig. 41 Surfactant concentration vs. oil recovery……………………….………………..……61
Fig. 42 Water salinity vs. oil recovery…………………………………..………………..……62
Fig. 43 Injection rate vs. oil recovery………………………………..………………….……62
Fig. 44 Well location map of Well #17450………………………………………………..……63
Fig. 45 Trajectory map of #17450 (left) and simulation model (right)….………………..……63
Fig. 46 3D simulation model of Well #17450 (scale is depth)……………………………..……64
Fig. 47 Drilling direction and perforation segments in Well #17450……………………..……64
Fig. 48 Illustration of hydraulic fractures distribution in Well #17450 and imbibition mechanism……………………65
Fig. 49 History matches on cumulative oil production and water cut in Well #17450………65
Fig. 50 Oil recovery effectiveness prediction for aqueous liquid imbibition in Well #17450…66
Fig. 51 Production sequence effect on oil recovery ………………………………………..……66
Fig. 52 Injection rate effect on oil recovery in Well #17450……………..…..……………..……67
IX
Acknowledgements
Funding for this project is provided by RPSEA through the “Ultra-Deepwater and
Unconventional Natural Gas and Other Petroleum Resources” program authorized by the U.S.
Energy Policy Act of 2005. RPSEA (www.rpsea.org) is a nonprofit corporation whose mission is
to provide a stewardship role in ensuring the focused research, development and deployment of
safe and environmentally responsible technology that can effectively deliver hydrocarbons from
domestic resources to the citizens of the United States. RPSEA, operating as a consortium of
premier U.S. energy research universities, industry, and independent research organizations,
manages the program under a contract with the U.S. Department of Energy’s National Energy
Technology Laboratory.
We thank the North Dakota Geological Survey Core Lab of North Dakota for providing core
samples, Hess Corporation for crude oil and core samples, and Tiorco Inc., CorsiTech (NALCO
Champion), Shell Chemicals, and Oil Chem Technologies for surfactant support. We thank
Computer Modeling group (CMG) and UT Austin for reservoir simulator support. We also thank
Ron Matheney, Nels Forsman, Hong Liu, Salowah Ahmed, and Yun Ji for providing laboratory
support. We thank the Environmental Analytical Research Laboratory of the University of North
Dakota for Bakken Formation water analysis.

Final Report, University of North Dakota, 09123-09 Page 1
Chapter 1. Introduction
Shale is an important source of oil and gas in North America. Most shale reservoirs have a low porosity and
ultra-low permeability with natural fractures. Shale formations have long been considered important source
rocks, capable of producing oil at economic rates when completed by hydraulically fractured horizontal
wells. However, with its low permeability and oil-wet character, using existing methods, the oil recovery
factors of the naturally fractured Bakken formation have only been a few percent of original oil in place. As
part of our investigation of chemical imbibition (using surfactant or brine formulations) to stimulate oil
recovery from shale, this report focuses on surfactant formulation optimization and wettability tests on
different parts of the Bakken formation. The ultimate objective of this research is to determine the potential
of surfactant formulations to imbibe into and displace oil from shale, and examine the viability of a field
application.
Project objective
The objective of this research project is to determine whether surfactant solutions can alter the wettability
of the Bakken shale formation (in North Dakota’s Williston Basin), so that oil recovery can be enhanced by
a mechanism involving imbibition. The project has two primary goals:
(1) Test the degree of imbibition in different wells of the Bakken shale using formation water to establish
the true wetting state. We investigate whether significant imbibition can be induced using only pH or
salinity variation in available waters.
(2) Investigate the ability of certain surfactant solutions to alter wettability of the Bakken shale. Such
alteration seeks to promote imbibition of dilute aqueous surfactant solutions and increase oil displacement
from the shale.
State of work
Tasks performed in this project include:
Task 1: Project Management Plan (PMP)
Task 2: Technology Status Assessment
Task 3: Technology Transfer
Task 4: Aqueous Solution Imbibition Evaluation
Subtask 4a: Surfactant formulation optimization
Subtask 4b: Wettability experiments
Subtask 4c: Imbibition experiments
Subtask 4d: Phase behavior study
Subtask 4e: Interfacial tension tests
Task 5: Numerical Simulation and Modeling of Imbibition
Subtask 5a: Ideal model building
Subtask 5b: Field-scale numerical simulation prediction
Task 6: Routine Reports and Other Activities
Work Progress and Deliverables Summary
By the end of December of 2013, the tasks listed above have all been completed and previously reported.
For Task 3—Technology transfer, in additional to constructing a public website for the project, we also
participated in four SPE and three RPSEA technical conferences. In these conferences, we published and
presented four SPE papers on Bakken oil recovery research: SPE 138521, 145510, 153853 and 167142.
Two of them were also published in the journal of SPE Reservoir Evaluation and Engineering. The
deliverable summary is shown in Table 1. Details of Task 4 to 5 are discussed in this report.

Final Report, University of North Dakota, 09123-09 Page 2
Table 1 — Deliverable summary
Deliverable Complete Date
Project Management Plan 4/18/2011, 1 month after the project kickoff date (3/18/2011)
Technology Status Assessment Report 4/18/2011, 1 month after the project kickoff date
Technology Transfer Plan 4/18/2011, 1 month after the project kickoff date
Website Construction 9/2011, and to be maintained for duration of 36 month project
Annual Report #1 3/18/2012, interim report for Task 4
Annual Report #2 3/18/2013, interim report for Task 4 & 5
Draft Final Report 12/31/2013, 3 months prior to project completion date
Presentation #1 & 2
SPE: 11/2/2011 in Denver, 4/16/2012 in Tulsa, 11/7/2013 in
Calgary
RPSEA: 4/10/2012 in Midland, 11/29/2012 in Houston,
10/17/2013 in Long Beach
Article publication # 1 SPE 138521, March 2011, SPERE&E
Article publication # 2 SPE 153853, December 2012, SPERE&E
Article publication # 3 “Mixing Oil and Water May Keep Bakken Wells Flowing”
January 31, 2014, “Bakken Oil Business Journal”
Final Report 12/23/2013
Report content
Chapter 2 discusses group formulations that promote imbibition while minimizing clay swelling and
formation damage. Experiments directed toward this goal involved balancing the temperature, pH, salinity,
and divalent cation content of aqueous fluids to enhance oil recovery from shale with ultra-low porosity
and permeability in the Middle Member of the Bakken Formation in the Williston Basin of North Dakota.
Chapter 3 discusses the wettability of different parts of the Bakken Formation. One goal of this research is
to identify if the wettability can be altered using surfactant formulations. The ultimate objective of this
research is to determine the potential of surfactant formulations to imbibe into and displace oil from shale,
and examine the viability of a field application. Chapter 4 discusses the phase behavior between brine
water, surfactant solutions, and Bakken oil. IFT (Interfacial Tension) changes with optimal salinity of
selected surfactant solutions also discussed in this chapter. Chapter 5 discusses the results of extensive
imbibition testing using water only and surfactant formulations in an imbibition glass cell. The surfactant
imbibition effect using the optimal salinities was investigated. In the Chapter 6 of this report, we discuss an
ideal numerical model to scale the laboratory results. Based on the ideal model simulation, we think the
numerical simulation performance basically support our laboratory results on oil recovery by surfactant
imbibition. Lastly, in Chapter 7, a field-scale numerical simulation prediction to estimate oil production in
reservoir-scale matrix blocks is discussed. Fracture dimensions in an actual well were considered. A history
match of oil production and water cut was included in the surfactant imbibition prediction work.
Our research results, along with detail documentation can be found on our web site at
https://www.und.edu/instruct/dwang/Research.

Final Report, University of North Dakota, 09123-09 Page 3
Chapter 2. Surfactant Formulation Preliminary Optimization
This chapter investigates an idea for chemical imbibition using surfactant formulations to stimulate oil
recovery from oil shale. One goal of this research task is to identify a formulation that promotes imbibition
while minimizing clay swelling and formation damage. Experiments directed toward this goal involved
balancing the temperature, pH, salinity, and divalent cation content of aqueous fluids to enhance oil
recovery from the shale with ultra-low porosity and permeability in the Middle Member of the Bakken
formation in the Williston Basin of North Dakota. The ultimate objective of this research is to determine
the potential of surfactant formulations to imbibe into and displace oil from shale, and examine the viability
of a field application.
2.1 Methodology
Previous research and the mineralogical analysis on core samples from well #15722 of Bakken
(https://www.dwr/nd.gov/oil/gas/) indicated that formation damage from aqueous contact is a concern
for shale formations. Consequently, it is important to understand clay chemistry so that a surfactant
formulation can be developed to enhance imbibition while causing minimum formation damage.
Surfactant formulations were studied by examining different factors that affect spontaneous imbibition.
First, brines with different water compositions were examined as imbibing fluids. Later, surfactant
solutions were used. A fixed imbibing period was employed before a new imbibing fluid was introduced.
Using oil from the Bakken Formation in the Williston Basin, significant differences in recoveries were
observed and calculated during the period of application of the surfactant.
Porous Media
The tested rock plugs came from the Middle Member of Bakken Formation, Well #16433, Lars Rothie 32-
29H. Generally, the core samples tested were from the Middle Member at a depth of 10613−10649 ft and
consisted of gritty shale and limestone, with poor to almost no porosity (Fig. 1). Table 2 shows the
characteristics of the core materials used in the experiments. Core plugs were 25 mm in diameter and 1 to 5
mm in thickness. Average geological parameters and fluid saturations of core samples are listed in Table 3.
In order to provide reliable experimental results, our results in the following studies were obtained using
average values for cores of varying depth.
Table 2 — Core plug descriptions
Sample resource Depth, ft Color Lithology, depositional environment, and other
attributes
Middle Member of
Bakken 10613-10649
Light to dark grey,
light brown to tan
Very fine crystalline, argillaceous, thinly
laminated, gritty, limey shale.
Table 3 — Summary of geological parameters and fluid saturations
Sample Depth
Dean-Stark Fluid Saturation Clean Dry Sample
Oil
% Pore Volume
Water
% Pore Volume
Gas Permeability,
md
Porosity,
fraction
10613 ~ 10649 26.81 32.04 4.68E-2 0.059
Test Fluids
Cores were saturated with crude oil from the Bakken Formation in the Williston basin of North Dakota
(Well H. Davidson 2-11H). The API gravity was 43.2°API, and oil density 0.82 g/cm3 at 23.2°C. Brine
water was selected because its salinity is characteristic of the Bakken Formation.

Final Report, University of North Dakota, 09123-09 Page 4
Surfactants: 17 surfactant samples were selected as imbibition candidates and compared at different
temperatures listed in Table 3.
Brines: Waters with 0% TDS (distilled water), 7.5% TDS, 15% TDS, and 30% TDS were used as imbibing
fluids.
NaCl, KCl, CaCl2, and MgCl2: These salts were used to change salinity of the aqueous phase based on the
chemical analysis in Table 4.
Na2CO3 & NaBO2•4H2O: These alkaline chemicals were used to change pH of the aqueous phase.
2.2 Core preparation
(1) Cut and polish the rock slabs into 1 to 5 mm thin slices. Clean surfaces of slices with toluene, and dry
slices at 105°C for 24 hours. Measure dry weights of slices, taken as W0.
(2) Measure length (thickness) and diameters at 5-10 locations for each core. All measurements deviated
less than ±0.01 mm from the average value.
(3) Vacuum sample rocks for 2 to 3 hours, and then saturate the core slices with the oil sufficiently until no
gas bubbles are seen exiting the core. Remove the oil from the surface of the slices. Weigh the slices after
saturation, taking this weight as Woil.
2.3 Surfactant optimization procedures
(1) Based on the chemical (Ca2+
, Mg2+
, K+, Na
+) concentrations of the formation water (Table 4), prepare
the brines with 0 − 30 %TDS brine and surfactant solutions. Filter the waters.
(2) Test water, oil, and surfactant viscosity with a Brookfield viscometer at various temperatures.
(3) Measure water and oil density with a density meter, DA-300 at various temperatures from 23 to 90°C.
Extrapolate the data based the temperature trend lines at temperatures higher than 90°C. Here, we assumed
water density is assumed equal to surfactant solution density under the same salinity and temperature. The
liquid densities change with temperatures and salinities.
(4) Place surfactant samples into laboratory oven at a specific temperature for 15 days to observe changes
in the samples of increasing temperature. Particularly test at high temperatures above 100°C. Surfactant
samples were sealed in glass bottles with temperature tolerance caps.
(5) Select surfactant samples that are stable at high temperature with a specific salinity, then immerse the
slice into the aqueous solutions, and imbibe brine or surfactant solution into the core samples with one
surface of slice closed for 24 to 48 hours, depending on thickness of core plugs.
(6) Weigh slices after imbibition, taken as Wa . Estimate oil recovery using Eq. 1.
(7) Set up different temperatures in the oven. Repeat Steps 5 to 6 to estimate the oil produced (Eq. 1).
(8) Change solution salinity; then repeat Steps 5 to 6.
(9) Change pH of surfactant samples with 0.1−0.25 wt% of alkaline chemicals. Repeat Steps 5 to 6 to
estimate the oil produced (Eq. 1).
(10) Change divalent cation content in the brine and surfactant solution. Repeat Steps 5 to 6 to estimate the
oil produced with Eq. 1.
(11) Change surfactant concentrations. Repeat Steps 5 to 6 to estimate the oil produced according to Eq. 1.
])1//[()(100% )( OOIPWWOOIP oswoila ……………………………. (1)
Here, water density is assumed equal to surfactant solution density under the same salinity and temperature.
The liquid densities change with temperatures and salinities.
2.4 Data Analysis and Discussion
2.4.1 Initial Aqueous Solution Screening
Laboratory tests were performed at the room temperature (23.2°C) with a salinity of 30% TDS brine.

Final Report, University of North Dakota, 09123-09 Page 5
Imbibition tests involved 17 surfactants. Most surfactants were found to increase the oil recovery, from
3.47 to 60.67%, compared to oil recovery by brine water alone (3.23%). Among the brine water and
surfactant samples, some core flakes were produced in brine without surfactant during imbibition, as shown
in Fig. 2. The amount of oil recovered with brine was small compared to the amount from surfactant
imbibition. An anionic alkyl benzene sulfonate surfactant of medium MW (molecular weight) was not
soluble between 15 – 30% TDS salinity, and therefore dropped from further testing.
2.4.2 Temperature Stability Study at High Salinity
Surfactant samples were studied for high temperature stability from 105°C to 120°C with brine containing
5% cationic divalent ions. 20~50 ml of each surfactant solution with 15−30 % TDS were sealed into vials
with temperature-tolerant caps. These vials were put into a laboratory oven at a fixed temperature. All
surfactants in Table 4 remained in aqueous solutions for 15 days to confirm stability of the surfactants.
In Table 4, five surfactant structures were studied for temperature stability: anionic surfactants with
sulfonate or sulfate groups, amphoteric surfactants with dimethyl amine oxide groups, and nonionic
surfactants with ethylene glycol butyl ether or ethoxylate groups. Concentrations of these surfactant
solutions were diluted to 0.1 wt%. Several observations were noted:
A. For solution salinity of 30% TDS:
(1) Ethoxylate surfactant, internal olefin sulfonate anionic surfactants, and amine oxide amphoteric
surfactants were more stable than other surfactants at a temperature of 105°C. In Figs. 3 and 4, Surfactants
17A, 17B, 58N, S2 were clear liquids before and after 15 days. (2) One linear alpha olefin sulfonate (C-2)
and one ethylene glycol butyl ether (SS-1688) was slightly cloudy after 15 days at 105°C. These surfactants
were supposed to work as co-surfactants. (3) Other surfactants (C-1, SS-7593) were cloudy in 30 wt %
TDS brine at 105°C and experienced phase transitions (Fig. 4) at high temperature—making them unusable
by themselves. However, after 0.3 wt% alcohol was added, the surfactant formulations became clear, as
shown in Figs. 5 and 6. (4) Sulfonates with carboxylate heads were unacceptable at high temperature at
salinity of 30% TDS. C-8 (low MW) clouded heavily (Fig. 4), S-12 (medium MW) and S-14 (Alcohol
ethoxy sulfate) precipitated and were not stable at 15 days, as did olefin sulfonate O332. (5) Ethoxylate
alcohol surfactant-58N showed good stability at 110°C for 15 days (Fig. 7). (6) For amphoteric
surfactants,17A, 17B, and 12J, an ultrathin layer with a brown color developed on the top of the solution at
110°C and 120°C after aging. Some clay flaking occurred as molecules of 17A reacted with divalent ions in
salt water. However, at a different pH in 17A solution, this brown color disappeared (Fig. 8). Figs. 9(a) and
9(b) show surfactants S2, 58B and 17A before and after 50 days aging at 110°C, showing good stability at
high temperature.
B. For solution salinity of 15% TDS:
Most surfactants in Table 3 showed good temperature stability at 105°C with 15 %TDS. Surfactants
ethoxylate alcohol-58N, Alcohol alkoxy sulfate-771, and N969 showed good stability at 120°C for 15 days
with 15 %TDS under Bakken conditions. When comparing surfactant stability for two salinities, more
surfactants were stable at lower salinities (15 wt %) than at the higher salinities (30 wt %).
Three surfactants [amphoteric (17A), nonionic (58N) and anionic (S2)] were selected for imbibition
studies, as discussed in the next section.
Final Report, University of North Dakota, 09123-09 Page 6
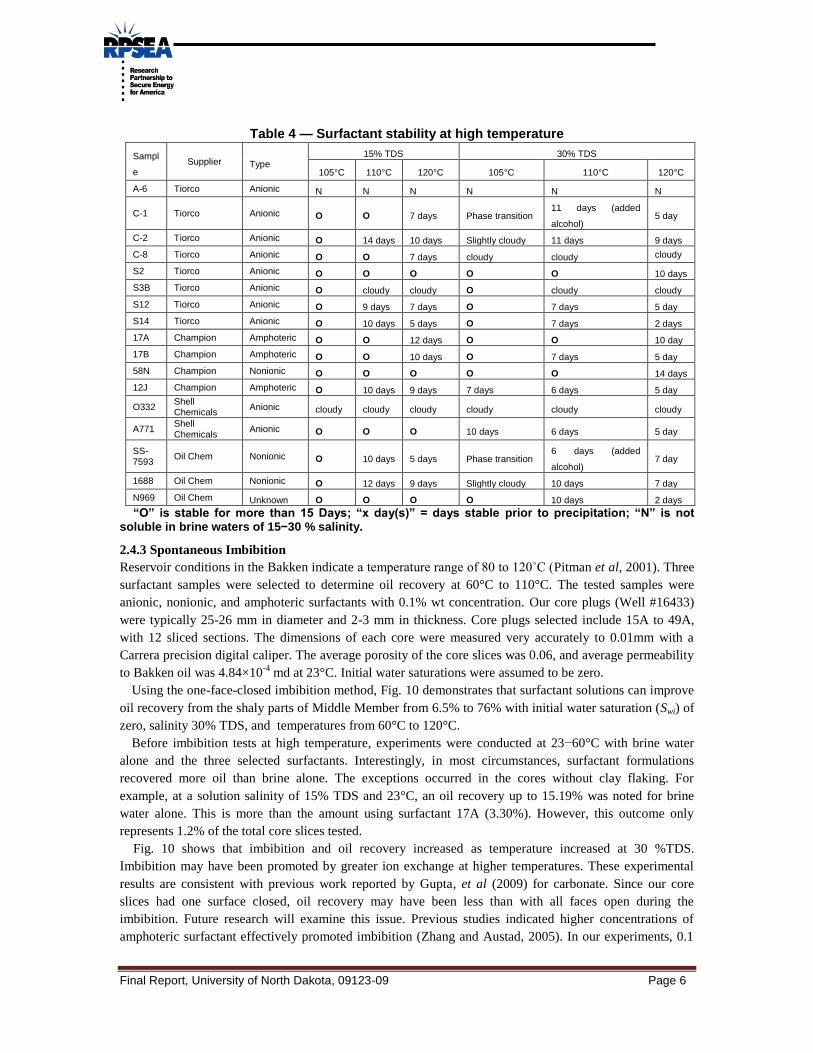
Table 4 — Surfactant stability at high temperature
Sampl
e Supplier Type
15% TDS 30% TDS
105°C 110°C 120°C 105°C 110°C 120°C
A-6 Tiorco Anionic N N N N N N
C-1 Tiorco Anionic O O 7 days Phase transition 11 days (added
alcohol) 5 day
C-2 Tiorco Anionic O 14 days 10 days Slightly cloudy 11 days 9 days
C-8 Tiorco Anionic O O 7 days cloudy cloudy cloudy
S2 Tiorco Anionic O O O O O 10 days
S3B Tiorco Anionic O cloudy cloudy O cloudy cloudy
S12 Tiorco Anionic O 9 days 7 days O 7 days 5 day
S14 Tiorco Anionic O 10 days 5 days O 7 days 2 days
17A Champion Amphoteric O O 12 days O O 10 day
17B Champion Amphoteric O O 10 days O 7 days 5 day
58N Champion Nonionic O O O O O 14 days
12J Champion Amphoteric O 10 days 9 days 7 days 6 days 5 day
O332 Shell Chemicals
Anionic cloudy cloudy cloudy cloudy cloudy cloudy
A771 Shell Chemicals
Anionic O O O 10 days 6 days 5 day
SS-7593
Oil Chem Nonionic O 10 days 5 days Phase transition 6 days (added
alcohol) 7 day
1688 Oil Chem Nonionic O 12 days 9 days Slightly cloudy 10 days 7 day
N969 Oil Chem Unknown O O O O 10 days 2 days
“O” is stable for more than 15 Days; “x day(s)” = days stable prior to precipitation; “N” is not soluble in brine waters of 15−30 % salinity.
2.4.3 Spontaneous Imbibition
Reservoir conditions in the Bakken indicate a temperature range of 80 to 120˚C (Pitman et al, 2001). Three
surfactant samples were selected to determine oil recovery at 60°C to 110°C. The tested samples were
anionic, nonionic, and amphoteric surfactants with 0.1% wt concentration. Our core plugs (Well #16433)
were typically 25-26 mm in diameter and 2-3 mm in thickness. Core plugs selected include 15A to 49A,
with 12 sliced sections. The dimensions of each core were measured very accurately to 0.01mm with a
Carrera precision digital caliper. The average porosity of the core slices was 0.06, and average permeability
to Bakken oil was 4.84×10⁻⁴
md at 23°C. Initial water saturations were assumed to be zero.
Using the one-face-closed imbibition method, Fig. 10 demonstrates that surfactant solutions can improve
oil recovery from the shaly parts of Middle Member from 6.5% to 76% with initial water saturation (Swi) of
zero, salinity 30% TDS, and temperatures from 60°C to 120°C.
Before imbibition tests at high temperature, experiments were conducted at 23−60°C with brine water
alone and the three selected surfactants. Interestingly, in most circumstances, surfactant formulations
recovered more oil than brine alone. The exceptions occurred in the cores without clay flaking. For
example, at a solution salinity of 15% TDS and 23°C, an oil recovery up to 15.19% was noted for brine
water alone. This is more than the amount using surfactant 17A (3.30%). However, this outcome only
represents 1.2% of the total core slices tested.
Fig. 10 shows that imbibition and oil recovery increased as temperature increased at 30 %TDS.
Imbibition may have been promoted by greater ion exchange at higher temperatures. These experimental
results are consistent with previous work reported by Gupta, et al (2009) for carbonate. Since our core
slices had one surface closed, oil recovery may have been less than with all faces open during the
imbibition. Future research will examine this issue. Previous studies indicated higher concentrations of
amphoteric surfactant effectively promoted imbibition (Zhang and Austad, 2005). In our experiments, 0.1
Final Report, University of North Dakota, 09123-09 Page 7
wt % concentration of surfactant was always used. This might explain why lower oil recoveries for 17A
were less than for the other two types of surfactants. Later work will focus on the effects of surfactant
concentration on imbibition. On the other hand, for Surfactant 17A, we noted core variations produced
different results. As mentioned above, the brown color after high temperature aging indicated a reaction
whereby surfactant and ions exchanged/adsorbed on Bakken clays. It is also possible that there was less oil
to recover compared to the other two surfactants, or clay flaking was unique to the particular core slice.
Also Fig. 10 shows that the anionic surfactant, S2, produced more oil as the temperature increased to
120°C.
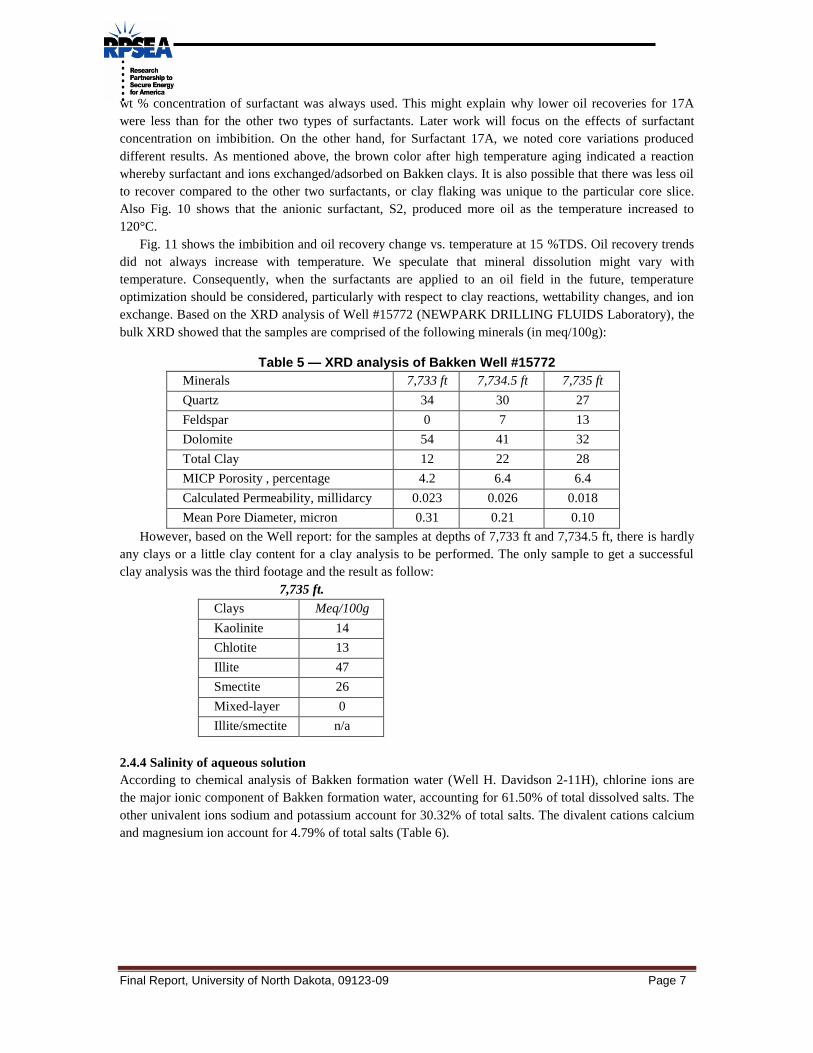
Fig. 11 shows the imbibition and oil recovery change vs. temperature at 15 %TDS. Oil recovery trends
did not always increase with temperature. We speculate that mineral dissolution might vary with
temperature. Consequently, when the surfactants are applied to an oil field in the future, temperature
optimization should be considered, particularly with respect to clay reactions, wettability changes, and ion
exchange. Based on the XRD analysis of Well #15772 (NEWPARK DRILLING FLUIDS Laboratory), the
bulk XRD showed that the samples are comprised of the following minerals (in meq/100g):
Table 5 — XRD analysis of Bakken Well #15772
Minerals 7,733 ft 7,734.5 ft 7,735 ft
Quartz 34 30 27
Feldspar 0 7 13
Dolomite 54 41 32
Total Clay 12 22 28
MICP Porosity , percentage 4.2 6.4 6.4
Calculated Permeability, millidarcy 0.023 0.026 0.018
Mean Pore Diameter, micron 0.31 0.21 0.10
However, based on the Well report: for the samples at depths of 7,733 ft and 7,734.5 ft, there is hardly
any clays or a little clay content for a clay analysis to be performed. The only sample to get a successful
clay analysis was the third footage and the result as follow:
7,735 ft.
Clays Meq/100g
Kaolinite 14
Chlotite 13
Illite 47
Smectite 26
Mixed-layer 0
Illite/smectite n/a
2.4.4 Salinity of aqueous solution
According to chemical analysis of Bakken formation water (Well H. Davidson 2-11H), chlorine ions are
the major ionic component of Bakken formation water, accounting for 61.50% of total dissolved salts. The
other univalent ions sodium and potassium account for 30.32% of total salts. The divalent cations calcium
and magnesium ion account for 4.79% of total salts (Table 6).

Final Report, University of North Dakota, 09123-09 Page 8
Table 6 — Chemical analysis of Bakken formation water
Analyte Detection limit, mg/L Result in sample, mg/L Methodology
Salinity 300,000 Cond. meter
Inorganic carbon 0.2 16.5 TOC analyzer
Cl- 0.05 184,500 Ion chromatography
Na- 0.02 85,322 FAAS
K- 0.05 5,643 FAAS
Ca2+
0.2 13,177 FAAS
Mg2+
0.01 1,175 FAAS
Based on the relative properties indicated in Table 4, brine waters with four salinities were prepared with
the following TDS values: 0%, 7.5% TDS, 15% TDS, and 30% TDS. Inorganic carbon was neglected.
Fig. 12 shows the relationship between TDS of surfactant solutions and oil recovery at 90°C.
Experiments used salinities ranging from 0% to 30% TDS. Core plugs were labeled 31B and 49A (Bakken
Well #16433). The results indicate: (1) At high temperature, no imbibition or oil recovery occurred using
distilled water or surfactant solutions in distilled water. This phenomenon might be due to clay swelling
during imbibition. Rock flakes were observed after brine contact (see Fig. 2). According to clay analysis
(X-ray diffraction) of core samples from Well AnSBRO Loucks 44-30 (Bakken Formation in North
Dakota), the major mineral is illite—47 meq/100g of total minerals
(https://www.dmr.nd.gov/oilgas/FeeServices/wfiles/15/W15722.pdf). Theoretically, illite could be swelled
by fresh water. (2) For the amphoteric surfactant 17A, the optimum salinity for maximum oil recovery is 15%
TDS. For the other two surfactants (anionic and nonionic), 30 %TDS promoted more oil production from
the core plugs.
For salinity optimization, surfactant-brine and surfactant-oil-brine phase behaviors are also very
important factors affecting oil recovery. Phase behavior was be studied in the next phase of work.
2.4.5 pH Changes.
Alkali was added to change the brine pH in our study, using a Cole Parmer model 510 pH meter to
monitorthe solution pH before imbibition. Generally, alkali reduces adsorption of surfactants onto rocks.
Two alkalis were studied: (1) With Na2CO3, a precipitate formed at 0.1 wt% Na2CO3 (Fig. 13) due to the
presence of Ca2+
and Mg2+
. This alkali is not suitable with high salinity and hard brines. (2) With
NaBO2.4H2O, no precipitation was observed at 0.1 wt% NaBO2.4H2O mixed with brine (Fig. 11). In
experiments with hard brine, this alkali can be added to the surfactant solutions to increase pH in future
testing.
Table 7 shows results of changing pH with 0.1 to 0.25 wt% NaBO2.4H2O at 90°C and 30 wt% salinity.
No precipitation was observed. Core plugs with thickness 1 to 5mm were labeled 31B, 46A, and 49A (Well
#16433). Anionic surfactant S2 was more stable at higher alkali concentrations than the other two
surfactant types. Based on Table 7, as the additive content increased from 0% to 0.1%, oil recoveries
increased for all three surfactants. However, when the alkali content was increased to 0.25%, oil recovery
only increased for the anionic surfactant. Table 8 shows, for a given surfactant, as the temperature and
alkali content was increased from 23°C to 90°C, and 0.1% to 0.25%, respectively, the pH of target aqueous
solutions was found to decrease.
In Table 7, we noticed that for NaBO2.4H2O, the pH change was small as the alkaline content increased
(i.e., pH only increased 0.1 units for surfactant 58N when the alkali content increased from 0.1% to 0.25%).
The pKa (dissociation constant) for this alkali is about 9.24 (Goldberg 2002,
http://en.wikipedia.org/wiki/Borate#cite_note-2). Because the buffer capacity for sodium metaborate is
greatest near the pKa, the pH trends toward the pKa during dissolution—thus explaining observed pH
behavior at room temperature in Table 6. Values for pKa are known to be sensitive to temperature

Final Report, University of North Dakota, 09123-09 Page 9
(http://wiki.answers.com/Q/What_is_pka_value_for_sodium_bicarbonate#ixzz1O3owAFzA). Table 6
suggests that the pKa may be closer to 8.8 at 90°C. For sodium carbonate (at room temperature), the pKa is
10.35. Thus, pH values when using sodium bicarbonate to be greater than those for sodium metaborate.
Table 7 —pH values vs. oil recovery
(90°C, 0.1% surfactant concentration, 30% TDS, and 5% divalent content)
Alkali content, wt%
Sample
0 0.1 0.25
pH Oil
recovery,% pH
Oil recovery,%
pH Oil
recovery,%
17A 7.51 9.19 8.75 10.33 8.83 5.88
58N 5.91 15.42 8.71 18.29 8.81 10.61
S2 7.24 12.87 8.67 13.08 8.77 13.61
Table 8 —pH values vs. temperature
Alkali content, wt%
Sample
0 0.1 0.25
pH, 23.2°C
pH, 90°C
pH, 23.2°C
pH, 90°C
pH, 23.2°C
pH, 90°C
17A 7.42 7.51 8.88 8.75 9.19 8.83
58N 5.34 5.91 8.94 8.71 9.32 8.81
S2 7.84 7.24 8.76 8.67 9.11 8.77
2.4.6 Divalent Cation Content
Fig. 14 shows the results of varying the content of divalent cations in imbibing aqueous liquids. (Salinity
was fixed at 30% TDS and temperature at 90°C). Core plugs 42B and 49A from Well #16433 were 1~
3mm thick. The lower curve in Fig. 13 shows that variations in divalent cation content had little effect on
oil recovery when imbibing brine only. However, the three surfactant formulations experienced a maximum
in oil recovery when the divalent cation content was 5 wt%. Increasing or decreasing the divalent cation
content (hardness of solution) above the optional 5% significantly reduced imbibition and oil displacement
(Fig. 14). The CEC (cation exchange capacity) values in three cores (Well AnSBRO Loucks 44-30) were
4.1, 7.1, and 10.6 meq/100 g. These CEC values are considered low, suggesting the content of reactive
clays is low (see https://www.dmr.nd.gov/oilgas/FeeServices/wfiles/15/W15722.pdf).
2.4.7 Surfactant Concentration
Fig. 15 shows the effect of varying the surfactant concentration in imbibing aqueous liquids. (Salinity was
held constant at 30% TDS and temperature at 90°C. Core plugs 41 and 49A from Well #16433 were 3−5
mm in thick. For the anionic surfactant 17A, a maximum oil recovery was noted at 0.1% surfactant. At the
highest surfactant concentration (0.2%), the core sample flaked (as shown in Fig. 16). For the anionic
surfactant S2, as concentration increased from 0.05 to 0.1%, oil recovery increased with no additional
increase beyond 0.2%. For the amphoteric surfactant 58N, as concentration increased, oil recovery
decreased.
2.4.8 Optimal Surfactant Formulation
Table 8 summarizes results of many experimental tests for Surfactants 17A, 58N, and S2 at 90°C. For
amphoteric surfactant 17A, the optimal formulation contained 0.1 wt% surfactant, 0.1% alkali (NaBO2.4H2O),
and 15 % TDS salinity--achieving 10.12% oil recovery at 90°C. For nonionic surfactant 58N, the optimal

Final Report, University of North Dakota, 09123-09 Page 10
formulation contained 0.05 wt% surfactant, 0.1% alkali (NaBO2.4H2O), and 30% TDS salinity--achieving
19.12% oil recovery at 90°C. For the anionic surfactant S2, the optimal formulation contained 0.2 wt%
surfactant, 0.25% alkali (NaBO2.4H2O), and 30 % TDS salinity--achieving 14.05% oil recovery at 90°C. Table
9 shows that addition of alkali improved oil recovery for all three surfactants.
We also studied co-surfactant solutions thermal stability under 90°C and 110°C conditions. These co-
surfactants including Linear Alpha Olefin Sulfonate + Ethanol (30%), Higher Olefin Sulfonate + Ethylene
glycol butyl ether (50%), Internal Olefin Sulfonate + Ethylene glycol butyl ether, and Med Mw Alkyl
Sulfonate-carboxylate + Ethylene glycol butyl ether(50%). The experimental results show that two co-
surfactant formulations : Linear Alpha Olefin Sulfonate + Ethanol (30%), and Internal Olefin Sulfonate +
Ethylene glycol butyl ether had good thermal stability when the salinity was 30 % TDS at 0.1%
concentration after aging 50 days (Fig. 17). Additional testing was performed to find the optimal surfactant formulation to alter the wettability of
Bakken shale, and further enhance oil recovery for aqueous imbibition with all faces open using large size
core samples and a larger variety of lithologies.
Table 9 —Surfactant formulations optimization
Surfactant Concentration,% Alkaline additive,% Salinity, % TDS Oil Recovery,%
17A, amphoteric 0.1 0 15 8.30
0.1 0.1 15 10.12
58N, nonionic 0.1 0 30 15.42
0.05 0.1 30 19.12
S2, anionic 0.1 0 30 12.87
0.2 0.25 30 14.05
C1+Ethanol 0.1 0 30 11.13
1688+S3B 0.1 0 30 6.82
Alkaline: NaBO2.4H2O, 90°C
2.5 Summary
Laboratory studies were conducted to find surfactant formulations best suited to imbibe into and enhance
oil recovery from Bakken shale. Even though our Bakken core samples had significant lithological
variations compared to our previous study on Pierre shale (Wang, 2010), aqueous fluid (surfactant
solutions) exhibited definitive imbibition. Additional experiments are planned to test more core samples
and further explore the role of these findings before taking our results from the lab to the field.
Although more extensive investigations are needed, the following preliminary results can be highlighted:
(1) Ethoxylate nonionic surfactant, internal olefin sulfonate anionic surfactants, and amine oxide
amphoteric surfactant were more stable than the other surfactants at temperatures of 105−120°C. They were
effective in imbibing and displacing oil at high temperatures.
(2) Sodium carbonate (added to increase alkalinity) precipitated with divalent cations in the saline brines
(15-30 % TDS). Sodium metaborate may help increase alkalinity without precipitation in the brine. (3) Ethoxylate nonionic surfactant and an internal olefin sulfonate anionic surfactant were more tolerant of
high salinity than other surfactants and displayed higher oil recoveries at high temperature. For Bakken
cores, surfactants did not imbibe effectively using distilled or low salinity water.
(4) For a given surfactant, there is an optimum hardness level. Excess or insufficient divalent cation content
significantly reduces imbibition and oil displacement.
(5) Clay flaking of shale was observed when contacting (a) brine without surfactant, and (b) an amine oxide
amphoteric surfactant in brine. However, for Case (b), changing the pH of the surfactant solution may
reduce flaking.
(6) For a given surfactant, oil recovery can be maximized by identifying an optimal surfactant
concentration, brine salinity, sodium metaborate concentration, and divalent cation content.
(7) Proper co-surfactant formulations show potential for increased oil recovery.

Final Report, University of North Dakota, 09123-09 Page 11
Chapter 3. Wettability Experiments
This chapter examines if the wettability can be altered using surfactant formulations. Using the modified
Amott-Harvey test, the wettability was determined for cores from three wells from different portions of the
Bakken Formation. The tests were performed under reservoir conditions (90-120°C, 150–300 g/L
formation water salinity) with Bakken crude oil. Cleaned cores (cleaned by toluene/methanol) and
untreated cores (sealed, native state) were investigated. Bakken shale cores were generally oil-wet or
intermediate-wet before introduction to the surfactant formulation. The four surfactant formulations that we
tested consistently altered the wetting state of Bakken cores toward water-wet. These surfactants
consistently imbibed to displace significantly more oil than brine alone. Four of the surfactant imbibition
tests provided EOR values of 6.80% to 10.16% OOIP, incremental over brine imbibition. Ten surfactant
imbibition tests provided EOR values of 15.65% to 25.40% OOIP. Thus, imbibition of surfactant
formulations appears to have a substantial potential to improve oil recovery from the Bakken formation.
For comparison, recovery factors using the existing production methods may be only on the order of a few
percent OOIP.
3.1 Methodology
Wettability was studied by a modified Amott-Harvey method, using cores from different depths in three
Bakken wells. Certain aqueous surfactant formulations were tested for their capability to alter wettability of
shale rocks. For a given core, spontaneous aqueous imbibition was assessed in an Amott-Harvey cell, while
the residual oil saturation and connate water saturation were obtained by core flooding with 20-30 pore
volumes of fluid. Our oil was from the Bakken Formation in southeast Williams County, North Dakota.
The crude oil viscosity was 2.0 cp at room temperature. Cores from one well were tested at room
temperature. For cores from the other two wells, wettability tests were conducted at reservoir temperature
(90-120°C) and salinity (15-30% TDS). Four main cations (Na+, K
+, Ca
2+, and Mg
2+) were present in our
brine, with mol% ratios of 87.7%, 3.4%, 7.8% and 1.1%, respectively. Thus, monovalent cations were up to
ten times more prevalent than the divalent cations. In order to verify our test methodology, we used four
approaches to measure the Amott-Harvey index, labeled MA, MB, MC and MD. Liquid imbibition and
injection volumes were obtained by weight measurements.
For method MA, we selected ores from the Middle Member of Bakken from Well Lars Rothie 32-29H
(#16433) in eastern Mckenzie County. Residual oil saturation and connate water saturation were obtained
by centrifuge. Core slice thickness varied from 2 mm to 5 mm, and the test temperature was 23°C.
For method MB, core plugs were from Well EN Ruland 3328H-1 (#16771) in western Mountrail County.
Reservoir temperature varied from 90-120°C. Forced injection occurred using the coreflood setup shown in
Fig. 18. Core slice thickness varied from 13 mm to 15 mm. Liquid imbibition and injection volumes were
obtained by weight measurements.
For method MC, core plugs were from Well AV Wrigley 0607H-1 (#17450) in northwest Burke County.
Reservoir temperature varied from 90-120°C. Forced injection occurred using the coreflood setup shown in
Fig. 19. Cores slice thickness varied from 13 mm to 50 mm. Core samples were wrapped with a silicone
Rescue™ tape to seal the cylinder surface. Liquid imbibition and injection volumes were obtained by
burette readings.
For method MD, core plugs were also from Well #17450. A Hassler core holder was employed during
both imbibition and injection, as shown in Fig. 20. The reservoir temperature varied from 90-120°C.
Overburden pressure was applied to the confined core. Cores samples thickness varied from 40 mm to 50
mm. Liquid imbibition and injection volumes were obtained by burette readings.
Other test procedures included:
Step 1: Filter the crude oil and brine waters through Whatman 4™ filter paper.

Final Report, University of North Dakota, 09123-09 Page 12
Step 2: Measure oil viscosity using a Brookfield viscometer with UL-Adapter at various temperatures.
Step 3: For regular core plugs (slices), wash with toluene to clean chemicals from rocks, wash them again
with methanol to clean out brine, and then dry cores under at 105°C for 24 hours. For sealed core plugs,
remove tin foil from cores carefully, and jump to Step 4.
Step 4: Measure core plug (slices) diameter and thickness with Carrera precision calipers. We routinely
measured the length (thickness) and diameters at 5-10 locations for each core. All measurements were
within ±0.01 mm of the average value—ensuring the consistency of surfaces.
Step 5: Vacuum the shale material for 1 hour for core thin slices, or 2 to 3 hours for thicker cores (13 mm
to 50 mm) to remove any gas from the lines and core.
Step 6: Soak the cores in crude oil to saturate them for 24 hours.
Unless specified differently, the water salinity was 30 % (300,000 mg/L).
Equations 2 to 6 were used to calculate the Amott-Harvey index. For Methods MA and MB, we used
Eqs. 2 and 3 (Dake, 1977 and Amott, 1969); while for Methods MC and MD, we used Eqs. 4 and 5
(Glover, 2001).
orwr
wrww
SS
SSI
1 ................................................................................................................................... (2)
orwr
oroo
SS
SSI
1 ................................................................................................................................... (3)
injectionimbibition
imbibitionw
VwVw
Vw
................................................................................................................... (4)
injectionimbibition
imbibition
VoVo
Voo
.................................................................................................................... (5)
AI=Iw-Io ..................................................................................................................................................... (6)
Where, AI =Amott-Harvey index, oI = Harvey index, wI = Amott index, So= oil saturation during oil
imbibition, Sor= residual oil saturation after water imbibition, Sw= water saturation during water imbibition,
Swr= irreducible water saturation after oil imbibition, imbibitionVo = oil volume spontaneously imbibed,
injectionVo =oil volume increase by forced injection, imbibitionVw = water volume spontaneously imbibed,
injectionVw =water volume increase by forced injection, o = ratio of spontaneous oil imbibition to total oil
imbibition, w = ratio of spontaneous water imbibition to total water imbibition.
Porous Media. The tested rock plugs came from the Middle Member of Bakken Formation, in Well
#16433, Lars Rothie 32-29H, and the Upper shale and Middle Member in Well # 17450, AV Wrigley
0607-H1 and Well #16771, EN Reland 3328H-1. Generally, the core samples tested were gritty shale and
shaly layers in siltstone, limestone, and dolomite, with poor to almost no porosity. Core plugs were 25 mm
in diameter and 1 to 50 mm in thickness. For the Middle Member, permeability to Bakken oil for core
samples was typically about 7 microdarcys, while porosity averaged 4.4%. Permeability for the Upper
Shale was considerably less (by 2-3 orders of magnitude) than for the Middle member, although porosity
values were comparable.(Core properties are shown in Table 12 to Table 14 and Fig. 21 to Fig. 23 Here, all
tested core samples were from same wells — Well #16433, Well #16771, and Well #17450 as previous
section discussed, and also in the following sections).
Test Fluids. Cores were saturated with Bakken crude oil from Well #16434 H. Davidson 2-11H. The API
gravity was 43.2°API, and oil density 0.777 g/cm3 at 23.2°C. Brine water was selected because its salinity
is characteristic of the Bakken Formation.

Final Report, University of North Dakota, 09123-09 Page 13
Surfactants: Aqueous surfactant formulations as imbibition candidates included: (1) 0.1% C1+30% TDS
brine, (2) 0.1% S2 + 0.1-0.25% alkaline +30% TDS brine, (3) 0.05% 58N+ 0.1-0.2% alkaline + 30% TDS
brine, and (4) 0.1% 17A +0.1-0.2% alkaline +15% TDS brine. They were compared at different
temperatures. Compositions (Table 10) were based on our earlier surfactant formulation optimization
studies (Wang et al. 2011b).
Brines: Waters with 15 to 30 % TDS were used as imbibing fluids.
NaCl, KCl, CaCl2, and MgCl2: These salts were used to change salinity of the aqueous phase based on the
work in Wang et al. 2011b).
NaBO2•4H2O: This alkaline chemical was used to change pH of the aqueous phase. It buffered our
solutions at pH values from 8.4 to 9. Without the alkaline buffer, solution pH values typically ranged from
5.6 to 6.8.
Table 10—Surfactant formulations for wettability tests
Surfactant Concentration,% Alkaline additive,% Salinity, % TDS Type
17A 0.1 0.1 or 0.2 15 Amphoteric, Dimethyl Amine Oxide
58N 0.05 0.1 or 0.2 30 Nonionic, Alcohols Ethoxylated
S2 0.1 0.1 or 0.25 30 Anionic, Internal Olefin Sulfonate
C1 0.1 0 30 Anionic, Linear α-Olefin Sulfonate
Alkaline: NaBO2.4H2O
3.2 Data Analysis
3.2.1 Wettability Test for Well #16433 Cores
We selected cores from the Middle Member of Bakken from Well 32-29H (#16433) shown in Fig. 21. Most
core slices tested from this well were gritty and limey shale from depths of 10613 to 10649 ft
(http://www.dmr.nf.gov/oilgas/FeeServices/wfiles/16/W16433.pdf). For this well, the water saturation (Sw)
and oil saturation (So) were first obtained by spontaneous imbibition (after 24 hours). Then, the residual oil
saturation (Sor) and the initial water saturation (Swi) were obtained by centrifuge (our Method MA)—using a
HERMLE Labnet Z 206A (centrifuged 48 hours with 4600 rpm spinning rate). Cores slices thickness
varied from 2 mm to 5 mm, and the test temperature was 23°C. The Amott-Harvey index was calculated
based on Eqs. 2, 3 and 6.
Table 11 shows wettability test results for Well #16433 with the surfactant formulation: 0.1% C1+30%
TDS brine. Cores from two depths in the Middle Member of this well indicated weak oil wettability
characteristics at 23°C. Wettability altered from weakly oil-wet to neutral-wet after imbibing the C1
surfactant formulation. (pH was 5.85 for the C1 formulation, compared with 5.60 for brine water only.) The
average residual oil saturation decreased 9.2%, and incremental oil recovery by surfactant was 8.52%. The
well-logging curves and core photos are shown in Fig. 21. The rock porosity was obtained experimentally
(Wang et al. 2011a) as Table 12 shows.
Table 11—Wettability of Well #16433 at 23°C, D=25 mm, L (Thickness) =2-4 mm
Sample Aqueous liquid wI oI AI Wettability
Sor
Sor
decrease, %
Re
%
EOR
%
13C Brine water
C1 formulation
0.299
0.489
0.484
0.486
-0.184
0.002
Weakly oil wet
Neutral wet
0.848
0.735 11.30
15.24
25.39 10.16
15B Brine water
C1 formulation
0.327
0.497
0.481
0.487
-0.150
0.010
Weakly oil wet
Neutral wet
0.838
0.767 7.10
16.20
23.08 6.88
Re is oil recovery by liquid imbibition or by centrifugation, and EOR is incremental oil recovery by surfactant
vs. water. For Core Samples 13C and 15B, the wettability test was conducted with brine water first, with Sw=0 at
the start of the test. Then, starting with Sw=2.54% for Core 13C and with 0.01% for Core 15B, the test was
repeated using the C1 formulation.

Final Report, University of North Dakota, 09123-09 Page 14
Table 12—Dimensions and porosities of cores from Well #16433
Core Location Length, mm Diameter, mm Porosity, volume fraction
13C Middle Member 1.80 24.79 0.094
15B Middle Member 4.61 24.92 0.045
Length: Thickness
3.2.2 Wettability Test for Well #16771 Cores
For Well #16771, we selected cores from both the Upper Bakken shale and Middle Member (Fig. 22).
Lithology included black shale, with of limestone in the Upper shale at depths of 10274 to 10310 ft, and
shaly siltstone in the Middle Member at depths of 10311 to 10340 ft
(http://www.dmr.nf.gov/oilgas/FeeServices/wfiles/16/W16771.pdf). Sw and So were obtained by imbibition
with liquid (top of core surface open for 48 hours), and Sor or Swi were obtained by forced injection of 20-30
pore volumes (using Method MB, as illustrated in Fig. 19). Core thickness was 13 mm, and the test
temperature ranged from 90 to 120°C. The Amott-Harvey index was calculated based on Eqs. 2, 3 and 6.
Core samples were tightly wrapped with a temperature-tolerant tape before placement in the core holder (to
prevent leakage from the radial surface during flooding). In Tables 14 and Table 16, core samples labeled
with the same first three digit sequence (e.g., 1-10) were cut from the same core in same depth range.
Samples were of similar lithology. Core dimensions and porosities are listed in Table 13.
Table 13 shows the wettability test results for Well #16771 for several surfactant formulations, with
compositions of 0.05% 58N + 0.1-0.2% alkaline + 30% brine, 0.1% S2 + 0.1-0.25% alkaline + 30% brine
and 0.1% 17A + 0.1% alkaline + 30% brine. Cores from three depths in the Upper shale and the Middle
Member of this well were tested for wettability at 90-120°C and variable alkaline content. Wettability was
altered from oil-wet to water-wet after imbibing 58N, 17A and S2 surfactant formulations (with alkaline).
Consistent with ideas expressed by Hamouda and Karoussi (2008) the wettability tended toward stronger
water-wetness after exposure to the alkaline surfactant formulations. In Table 14, we note that brine
imbibition worked very well for Core 1-46-2 before using Surfactant 17A. Even so, after Surfactant 17A
imbibition, oil recovery still increased by 9.62 %OOIP, and the residual oil decreased by 7.70%.
Table 13—Dimensions and porosities of cores from Well #16771
Core Location Length mm
Diameter mm
Porosity volume fraction
1-10-1 Upper Shale 12.36 38.14 0.034
1-10-2 Upper Shale 13.13 38.64 0.034
1-32-2 Middle Member 13.90 38.08 0.066
1-32-3 Middle Member 13.71 38.12 0.064
1-36-1 Middle Member 14.08 38.09 0.066
1-36-3 Middle Member 13.71 30.48 0.075
1-46-2 Middle Member 13.87 38.05 0.073
1-46-3 Middle Member 13.76 38.08 0.069
1-50-2 Middle Member 13.87 38.05 0.069
1-50-3 Middle Member 13.76 38.08 0.069
Length: Thickness

Final Report, University of North Dakota, 09123-09 Page 15
Table 14— Wettability of Well #16771 at 90 to 120°C, D=38 mm, L (Thickness) =13 mm
Sample Aqueous liquid Tem.
°C
pH(22°C)
wI oI AI
Wettability Sor
Sor
decrease
%
Re
%
EOR
%
Alkaline content
% Value
1-10-1
1-10-1
1-10-2
Brine water
58N formulation
Brine water
90
0.00
0.10
0.10
5.60
8.71
8.48
0.100
0.180
0.050
0.500
0.000
0.525
-0.400
0.180
-0.475
Oil wet
Water wet
Oil wet
0.803
0.646
0.911
15.70
19.69
35.45
8.82
15.76
1-32-2
1-32-3
58N formulation
58N formulation 90
0.10
0.20
8.71
9.00
0.987
0.500
0.949
0.000
0.038
0.500
Weak water wet
Water wet
0.884
0.723 16.10
11.56
27.69 16.13
1-36-1
1-36-1
1-36-3
Brine water
S2 formulation
S2 formulation
90
0.00
0.10
0.25
5.60
8.61
9.03
0.451
0.857
1.000
0.868
0.456
0.000
-0.417
0.420
1.000
Oil wet
Water wet
Water wet
0.672
0.161
0.142
51.10
53.00
32.74
49.32
54.67
16.58
20.93
1-46-2 Brine water
17A formulation 110
0.00
0.10
5.60
8.44
0.260
0.833
0.770
0.750
-0.511
0.083
Oil wet
Weak water wet
0.220
0.143 7.70
77.98
87.56 9.62
1-50-3
1-50-1
Brine water
S2 formulation 120
0.00
0.25
5.60
9.03
0.162
0.762
0.531
0.310
-0.369
0.542
Oil wet
Water wet
0.629
0.266 47.80
37.09
62.60 24.24
In Core Samples 1-10-1, 1-36-1 and 1-46-2, the wettability test was conducted with brine water first, with Sw=0 at the start of the test. Then, starting with
Sw=0.01%, Sw=11.42% and 16.40% respectively, the test was repeated using the 58N,S2, and 17A formulations, respectively.

Final Report, University of North Dakota, 09123-09 Page 16
3.2.3 Wettability Test for Well #17450 Cores
Well #17450 cores were selected from the Upper shale (depths of 7338 ft and 7341 ft) and the Middle
Member (depths of 7431 ft and 7349 ft), as Fig. 19 shows. The lithology was moderately hard, fissile,
carbonaceous black shale with traces of disseminated pyrite both in the Upper shale and the Middle
Member (http://www.dmr.nf.gov/oilgas/FeeServices/wfiles/16/W17450.pdf). Two methods were applied to
cores from this well: (1)—MC, where Sw and So were obtained by spontaneous imbibition for 48 hours, and
Sor or Swi were obtained by forced injection of 20-30 pore volumes as illustrated in Fig. 20; and (2)—MD,
where Sw and So were obtained by imbibition (with all rock surfaces open) for 48 hours, and Sor and Swi
were obtained by forced injection of 20-30 pore volumes using a Hassler cell as illustrated in Fig. 3. Core
thickness varied from 13 mm to 50 mm (mostly using sealed, preserved cores), and the test temperature
ranged from 90 to 120°C. Overburden pressure was applied to the cores when using Method MD. The
Amott-Harvey index was calculated based on Eqs. 4 and 5. When using Method MC, core samples were
tightly wrapped with temperature tolerant tape (silicone Rescue™) before they were put into the core
holder. Core dimensions and porosities are shown in Table 15.
Fig. 18 illustrates the injection system. In this method, an ISCO Model DX-100™ syringe pump was
used. The pump (which has a built-in pressure transducer) provides a wide range of flow rates (from 0.001
to 60 cm3/min) for pressures up to 10,000 psi (690 bars or 70 MPa). Valves A and B are two-way valves to
control flow of distilled water to/from the pump. Valve C is a two-way by-pass valve that is used during
evacuation and saturation of the core slice. Valves D, E, F are three-way valves that control fluid
input/outflow for the transfer cylinder. The core holder accommodates cylindrical core slices that are 25-26
mm in diameter and 0-10 mm in thickness, at pressures up to 3,000 psi (207 bars or 20.7 MPa).
Table 16 shows the wettability test results for Well #17450 with the surfactant formulations: (1) 0.05%
58N + 0.1-0.2% alkaline + 30% brine, (2) 0.1% S2 + 0.1-0.25 alkaline + 30% brine, and (3) 0.1% 17A +
0.1-0.2 alkaline + 15% brine. (Core properties are shown in Table 15.) Three findings were noted from
Table 6. First, some cores from the Upper shale (1-42, 1-45) of this well indicated neutral wetting at 60 to
90°C. Core 1-36 (from the top of the Upper shale) was oil-wet, as was Core 1-45. Second, cores from the
Middle Member of the same well exhibited neutral-, mixed- or oil- wetting characteristics (Cores 1-48A, 1-
51, 1-56, 1-69A, and 1-70). Third, the sealed core plugs (1-48A, 1-51A, 1-69A) were not cleaned with
toluene or methanol before testing in order to preserve the original wetting condition. Incremental oil
recovery attributed to surfactant imbibition for these cores was comparable to those for the cleaned cores
(Table 16).
Table 15—Dimensions and porosities of cores from Well #17450
Core Location Length mm
Diameter mm
Porosity volume fraction
1-36A Upper Shale 41.34 38.68 0.037
1-42-1 Upper Shale 5.78 24.85 0.036
1-42-2 Upper Shale 5.60 25.04 0.036
1-45-1 Upper Shale 4.15 38.29 0.061
1-45-2 Upper Shale 13.57 38.02 0.060
1-48A Middle Member 51.14 38.00 0.016
1-51A Middle Member 51.33 38.25 0.029
1-56-1 Middle Member 14.68 38.00 0.063
1-56-2 Middle Member 14.01 38.02 0.074
1-69A Middle Member 52.11 38.70 0.016
1-72-1 Middle Member 10.11 38.03 0.064
1-72-2 Middle Member 10.17 38.02 0.051
1-72-3 Middle Member 10.25 38.00 0.030
Length: Thickness

Final Report, University of North Dakota, 09123-09 Page 17
Table 16 (a)—Wettability of Well #17450 at 60 to 120°C, D=38 mm, L(Thickness )=4-52 mm, MC
Sample Aqueous liquid Tem.
°C
pH(22°C)
w o ow Wettability Sor
Sor
decrease
%
Re
%
EOR
%
Alkaline content
% Value
1-42-1
1-42-2
Brine water
C1 formulation 60
0.00
0.00
5.60
5.85
0.498
0.501
0.498
0.465
0.000
0.036
Neutral wet
Weak water wet
0.410
0.322 8.80
32.16
40.04 8.08
1-45-1
1-45-2
Brine water
17A formulation 90
0.00
0.10
5.60
8.44
0.247
0.500
0.454
0.500
-0.207
0.000
Oil wet
Neutral wet
0.756
0.569 18.70
24.39
46.03 21.64
1-51A
sealed
Brine water
17A formulation 110
0.00
0.10
5.60
8.44
0.269
1.000
0.519
0.518
-0.250
0.482
Oil wet
Water wet
0.293
0.225 6.80
70.69
77.48 6.80
1-56-1
1-56-2
Brine water
S2 formulation 110
0.00
0.25
5.60
9.03
0.500
0.278
0.500
0.002
0.000
0.276
Neutral wet
Water wet
0.765
0.577 18.80
23.52
42.37 20.85
1-70-1
1-70-2
Brine water
S2 formulation 120
0.00
0.25
5.60
9.03
1.000
0.538
1.000
0.392
0.000
0.146
Neutral wet
Water wet
0.788
0.633 15.50
21.18
36.73 15.65
Here, for Core Sample 1-51A, the wettability test was conducted with brine water first, with Sw=0 at the start of the test. Then starting with Sw=0.01%, the test
was repeated using the 17A formulation.
Table 16(b)—Wettability of Well #17450 cores at 90 to120°C, D=38 mm, L(Thickness )=41-52 mm, MD
Sample Aqueous liquid Tem.
°C
pH(22°C)
w o ow Wettability Sor
Sor
decrease, %
Re
%
EOR
%
Alkaline content
% Value
1-48A
sealed
Brine water
17A formulation 90
0.00
0.10
5.60
8.44
0.601
0.470
0.959
0.360
-0.358
0.110
Oil wet
Weak water wet
0.697
0.519 17.8
30.30
48.10 18.2
1-36A Brine water 120 0.00 5.60 0.000 0.810 -0.810 Oil wet 0.803 N/A 0.00 N/A
1-69A
sealed
Brine water
58N formulation 120
0.00
0.10
5.60
8.70
1.000
0.508
1.000
0.000
0.000
0.508
Neutral wet
Water wet
0.352
0.098 25.40
64.83
90.23 25.40
Note: sealed means that the core plug was sealed with wax and tin foil until tested. Cores were not cleaned by toluene and methanol, so presumably they had
their original wettability.

Final Report, University of North Dakota, 09123-09 Page 18
3.3 Discussion
3.3.1 Experimental Method
As mentioned above, four approaches were employed to measure the Amott-Harvey index in this study.
Because of the challenges in measuring wettability under our conditions, four methods were examined to
identify the best method, or at least, find a consistent direction in the results. Of the many cores that we
tested, about one-third of the results were not useable due to apparatus failure or errors in data collection.
Each of our four methods had positive and negative aspects. For Method MA, core plugs were weighed
before and after spontaneous imbibition and before and after forced fluid injection. The advantage to this
method is that weight measurements can be very accurate (i.e., to 0.0001 grams in our case). For Method
MA, a centrifuge was used to drive cores to residual saturations. This is a relatively easy and reliable
method. However, since we did not have a way to maintain temperature at 90-120°C during centrifugation,
we could only use the method for studies at room temperature. Also, our centrifuge was not large enough to
accommodate 3.8-cm-diameter cores.
For Method MB (used for core plugs from Well #16771, core plugs were weighed before and after
spontaneous imbibition and before and after forced fluid injection (just as for Method MA). During
injection, the coreflooding apparatus shown in Fig. 17 was used. This apparatus allowed flooding to occur
at 90-120°C. However, errors can be introduced because of cooling and/or evaporation during the time that
the core was removed from the core holder and the weight measurement was made. Also, if any part of the
rock (e.g., small grains or core pieces) becomes separated from the main core, the core can incorrectly
appear to experience a weight loss, even though water has displaced less-dense oil.
Methods MC and MD were used for core plugs from Well #17450. Imbibition and injection volumes
were determined by readings on burets. Although readings are fairly accurate, they can have larger error
bars than weight measurements. Also, if oil or water adheres to the core surface or an interior part of the
flow line, it may not be displaced to the burette for measurement.
Experimental results are shown in Tables 11 and 12 for Method MA, in Tables 13 and 14 for Method
MB, in Tables 16(a) and 15 for Method MC, and in Tables 16(b) and 15 for Method MD. For all methods,
exposure to a surfactant formulation was found to shift the wetting state toward water-wet. Also, for all but
one case, Core 1-46 in Table 14, exposure to a surfactant formulation resulted in more oil recovery by
imbibition than exposure to brine alone. Specifically, the EOR (i.e., incremental for surfactant imbibition
over brine imbibition) was 6.88% to 10.16% in Table 11, 16.58% to 24.24% in Table 14 (excluding Core 1-
46), 6.8% to 21.64% in Table 16(a), and 18.2% to 25.4% in Table 16(b).
3.3.2 Initial Core Wettability
In this phase of work, we tested 30 core samples from three wells from different portions of the Bakken
Formation in North Dakota using a modified Amott-Harvey method. Among the tested cores, 1/3 of sample
results were not be useable due to apparatus failure that resulted in data reading errors. However, our
results demonstrated that the Bakken shale cores were generally oil-wet or intermediate-wet before
introduction to the surfactant formulation. This result was consistent with an NMR study by Elijah et al.
(2011). In their study, three shales from Eagle Ford, Barnett, and Floyd Formation showed oil-wetness or
mix-wetness when the shales imbibed brine or oil (dodecane).
3.3.3 Oil Saturation after Brine Imbibition
A significant variation occurred in oil saturations achieved after brine imbibition. For 12 cases, the oil
saturation after brine imbibition ranged from 0.629 to 0.911 (Tables 11, 14, and 16). However, in four cases
(Cores 1-46-2, 1-42-1, 1-51A, and 1-69A) oil saturations of 0.220 and 0.410 were reached during brine
imbibition. We will conduct more imbibition tests in cores with similar properties to verify this exception
to our results. Even though we note that brine was imbibed in some cases, brine sometimes did not imbibe
at all (e.g., Case 1-36A in Table 16).
3.3.4 Effect of Alkaline
Final Report, University of North Dakota, 09123-09 Page 19
In Table 14, Cores 1-10-1 and 1-10-2 were tested to see if the simple addition of 0.1% sodium metaborate
to the brine could enhance imbibition (i.e., no surfactant). Interestingly for these cases, oil recovery was
noticeably less with the alkaline present. Also note in Table 15(a), for Cores 1-42-1 and 1-42-2, a C1
surfactant formulation without added alkaline improved oil recovery by 8.08% OOIP over brine imbibition.
For most of our other tests, alkaline was typically added to our surfactant formulations because the
literature suggested that its presence should reduce surfactant retention and enhance imbibition. The above
mentioned results may bring this concept into question when applied to shale. On the other hand, we have
two sets of experiments listed in Table 14 (Cores 1-32-2 vs. 1-32-3; and Cores 1-36-1 vs. 1-36-3) where
addition of 0.2-0.25% alkaline provided noticeably higher recoveries than for 0.1% alkaline. Of course, we
recognize that many more experiments are needed to establish the positive and negative contributions of the
alkaline material.
3.3.5 Effect of Surfactant Formulation
The most important findings from work thus far is that the surfactant formulations (1) consistently altered
the wetting state of Bakken cores toward water-wet and (2) consistently (i.e., in all cases but one) imbibed
to displace significantly more oil than brine alone. Thus, imbibition of surfactant formulations appears to
have substantial potential to improve oil recovery from the Bakken Formation. (Recall that recovery factors
using the existing production methods may be only on the order of a few percent OOIP.) Five of the
surfactant imbibition tests (Cores 13C, 15B, 1-10-2, 1-42-2, and 1-51A) provided EOR values of 6.8% to
10.16% OOIP, incremental over brine imbibition. Nine surfactant imbibition tests (Cores 1-32-3, Cores 1-
36-1, 1-36-3, 1-50-1, 1-45-2, 1-56-2, 1-70-2, 1-48A, and 1-69A) provided EOR values of 15.65% to 25.4%
OOIP.
The four surfactants examined in this work (17A, 58N, S2, and C1) were selected because they showed
the best performances during our preliminary studies (Wang et al. 2011a,b). However, it is not obvious that
any one of these surfactants performed definitively better than the others during our experiments. On the
whole, all show potential for providing positive recovery values.
3.3.6 Upper Shale vs. Middle Member
Most of the surfactant tests were performed using cores from the Middle Member of the Bakken.
Generally, cores from the Upper Shale showed responses to surfactant imbibition that were consistent with
that seen in the Middle Member. In particular, Upper Shale Core 1-42-2 provided 8.08% OOIP EOR, while
Upper Shale Core 1-45-2 provided 21.64% OOIP EOR (Table 16). As mentioned earlier, four cases were
noted where brine imbibition provided exceptionally low oil saturations. We presume that subtle lithology
differences played a role in this exceptional behavior. Generally, the Upper Shale is lithologically similar to
the Lower Member and consists of dark-gray to brownish-black to black, slightly calcareous, organic-rich
shale. The maximum thickness can reach 9 m (28 ft) for the upper member in North Dakota. Both upper
and lower shales have a low porosity with ultra-low permeability. For the Middle member, lithologies vary
from argillaceous dolostones and siltstones to clean, quartz-rich arenites and oolitic limestones. These self-
sourced reservoirs are over-pressured. The porosity was determined to be 2-3%, with one-tenth of the
volume or 0.2% being in micro-fractures. The ratio of fracture to matrix permeability was 100 to 1, with an
effective permeability for the fracture system of 0.6 md.
3.3.7 Preserved (Sealed) vs. Cleaned Cores
Incremental recoveries from preserved (sealed) cores (Cores 1-51A, 1-48A, and 1-69A) ranged from 6.8%
to 25.4% OOIP (Table 16). This is effectively the same range as in cleaned cores.
3.3.8 Effect of Temperature and Porosity
We performed experiments at 23°C, 60°C, 90°C, 110°C, and 120°C. No definitive effect of temperature is
apparent at this time. Porosity values for our cores ranged from 1.6% to 9.4% (Tables 12, 13, and 15).
Surfactant effectiveness did not appear to correlate with porosity. For the Surfactant 17A formulation, note

Final Report, University of North Dakota, 09123-09 Page 20
that Core 1-48A (1.6% porosity) experienced 18.2% OOIP incremental oil (from surfactant imbibition
compared with brine imbibition), while Core 1-45-2 (6.0% porosity) experienced 21.64% OOIP EOR.
3.4 Summary
(1) Bakken shale cores were generally oil-wet or intermediate-wet (before introduction to the surfactant
formulation).
(2) The four surfactant formulations that we tested consistently altered the wetting state of Bakken cores
toward water-wet.
(3) These four surfactants consistently imbibed to displace significantly more oil than brine alone. Four of
the surfactant imbibition tests provided EOR values of 6.8% to 10.16% OOIP, incremental over brine
imbibition. Ten surfactant imbibition tests provided EOR values of 15.65% to 25.4% OOIP. Thus,
imbibition of certain surfactant formulations appears to have substantial potential to improve oil recovery
from the Bakken formation. For comparison, recovery factors using the existing production methods may
be only on the order of a few % OOIP.
(4) Positive results were generally observed with all four surfactants: 17A, 58N, S2, and C1. From our
work to date, no definitive correlation is evident in surfactant effectiveness versus (1) temperature, (2) core
porosity, (3) whether the core was from the Upper Shale or the Middle Member, and (4) whether the core
was preserved (sealed) or cleaned prior to use.

Final Report, University of North Dakota, 09123-09 Page 21
Chapter 4. Phase Behavior and Interfacial Tension Study
In general, increasing salinity of an aqueous phase (brine) decreases the solubility of an ionic surfactant.
The surfactant is driven out of brine as electrolyte concentration increases. Thus, brine salinity has a
significant effect on phase behavior (Green and Willhite, 1998). For an ideal system, multiphase behavior
is divided into three classes (called Windsor type). Furthermore, if the third phase forms within a certain
range of surfactant concentration, an optimal salinity exists. Here, the third phase is called the
Microemulsion phase.
4.1 Methodology
Phase behavior
At lower temperatures of 23°C to 60°C, glass tubes were used to test phase behavior. The tubes are
autoclaving tubes which have a protective coating to prevent or reduce the hazards of breakage and
shattered glass, and any leakage of toxic or corrosive chemicals. Aqueous solutions (surfactant with brine
and crude oil from Bakken) were mixed in a ratio of 50% of oil, 0.05%-0.2% of surfactant (v/v), and the
remainder was brine in different tubes of 20 mL total capacity with sealed caps. In one test case, surfactant
solution concentrations ranged from 0.05% to 0.2%. The tubes were placed in the laboratory oven for 42
days. In the second case, concentrations were 2.0% and the test period 21 days.
For higher temperatures of 90°C to 120°C, an encased-pipette (2 mL) was immersed in 20 mL tubes. The
silicon oil reduces heat loss when samples are taken out of the oven for photographing. The encased-
pipette test was modified after a method developed at Rice University (Puerto, et al, 2012).
In both methods, samples were left to equilibrate at the test temperature after mixing. Typically, they
were briefly removed during equilibration and shaken by hand a few times. This procedure was continued
until phase volumes remained unchanged. Photographs were taken at different time intervals. All tubes or
pipettes were marked by fine graduations to clearly indicate changing levels of water and oil over time.
IFT Measurement
IFT measurements between oil and surfactant were conducted at temperatures of 30, 60, 90° C by means of
a M6500 Spinning drop Tensiometer (Grace Instrument Company, TX). All surfactants were studied with
and without an alkaline present.
Porous Media. The tested rock plugs came from the Middle Member of Bakken Formation in Well #
17450, AV Wrigley 163-94-0607H-1 at depth of 7347 to 7401 ft. Generally, the core samples tested were
gritty shale and shale interbedded with siltstone, limestone and dolomite, with poor to zero porosity. Core
plugs were 38 mm in diameter and 38 to 50 mm in thickness. For the Middle Member, permeability to
Bakken oil for our core samples was typically around 6 microdarcys, while porosity averaged 5%.
Test Fluids. Cores were saturated with Bakken crude oil from Well #16083, B.L. Davidson 2-11H, 155-
96-1102-2. The API gravity was 43.2°API, and oil density 0.82 g/cm3 at 23.2°C. Brine water salinity was
characteristic of the Bakken Formation.
Surfactants: Aqueous surfactant candidates included: (1) internal olefin sulfonate anionic surfactant, (2)
ethoxylated alcohol nonionic surfactant, (3) ethoxylated tallow amine cationic surfactant, and (4) dimethyl
amine oxide amphoteric surfactant. They were compared at different salinities for phase behavior and IFT
measurement. Compositions were based on our earlier surfactant formulation optimization studies (Wang et
al. 2011b). Details for each case are shown in Table 1 to Table 5.
Brines: Waters with 0% to 30% TDS were used during phase behavior and IFT studies.
NaCl, KCl, CaCl2, and MgCl2: These salts were used to change salinity of the aqueous phase based on the
work of Wang et al. 2011b.
NaBO2•4H2O: This alkaline chemical was used to change pH of the aqueous phase. It buffered solutions to

Final Report, University of North Dakota, 09123-09 Page 22
pH values of 8.4 to 9.
4.2 Phase Behavior Study
In general, increasing salinity of an aqueous phase (brine) decreases the solubility of an ionic surfactant.
The surfactant is driven out of brine as electrolyte concentration increases. Thus, brine salinity has a
significant effect on phase behavior (Green and Willhite, 1998). For an ideal system, multiphase behavior
is divided into three classes which are called Windsor types (Windsor, 1954). Furthermore, if the third
phase forms within a certain range of surfactant concentration, an optimal salinity exists. Here, the third
phase is called the microemulsion phase (Healy, et al, 1976).
A candidate surfactant for use in EOR can be affected by (1) crude oil effective alkane carbon number
(EACN), (2) temperature, (3) salinity, and (4) surfactant carbon number. For Bakken oil, EACN typically
varies from C6 (hexane) to C10 (Decane) based on analysis of reservoir fluid composition from Well
#15845, Nelson Farms 1-24H ((http://www.dmr.nf.gov/oilgas/FeeServices/wfiles/16/W15845.pdf). In our
study, test temperatures varied from 23°C to 120°C and salinity varied from 0 to 30% TDS. Here, Chemical
compositions included NaCl, KCl, CaCl2, and MgCl2, based on analysis of Bakken formation water. Four
main cations (Na+, K
+, Ca
2+, and Mg
2+) are present in our brine, with mol % ratios of 87.7%, 3.4%, 7.8%
and 1.1%, respectively.
Six surfactant formulations with different molecular structures were investigated for phase behavior at
various water salinities using surfactant-brine liquids and crude oil from the Bakken Formation (Table 17).
Preliminary optimal salinity of surfactant solutions was determined by the change in phase behavior.
Optimal salinity was further examined in conjunction with testing of interfacial tension (IFT) changes
between oil and water, and results included in the next section. In order to observe the microemulsion
phase phenomena, 0.05~0.1% and 2% concentrations of surfactant were adopted.
Table 17 — Surfactant formulations for phase behavior study
Surfactant Type Molecular structure Concentration Added reagent Manufacturer
C-1 Anionic Linear alpha olefin sulfonate 0.1% 30% ethanol Tiorco
S-2 Anionic Internal olefin sulfonate 0.1% 0.1% NaBO2.4H2O Tiorco
S-2 Anionic Internal olefin sulfonate 2% Tiorco
58N Nonionic Alcohols, ethoxylated 0.05% 0.1% NaBO2.4H2O CorsisTech
58N Nonionic Alcohols, ethoxylated 2% CorsisTech
N 2512 Nonionic Alcohols, ethoxylated 0.1% CorsisTech
N 2512 Nonionic Alcohols, ethoxylated 2% CorsisTech
17A Amphoteric Dimethyl amine oxide 0.1% 0.1% NaBO2.4H2O CorsisTech
17A Amphoteric Dimethyl amine oxide 2% CorsisTech
TA-15 Cationic Ethoxylated tallow amines 0.2% Tiorco
At the high temperature (80-120°C) and high salinity (15-30% TDS) conditions of Bakken reservoirs,
the surfactant must remain chemically stable during the period of imbibition, which might last several
years. Moreover, precipitation or other undesirable phase separations must be avoided when using these
surfactants. Initial screening of surfactant behavior at high temperature and high salinity conditions was
discussed in SPE 145510 (Wang, et al 2011). The following discussion focuses on salinity optimization
based on phase behavior between surfactants, brine, and crude oil for the various surfactant formulations
shown in Table 17.
In the following discussion, all surfactants are assumed to be in the microemulsion phase (Green and
Willhite, 1998).
Final Report, University of North Dakota, 09123-09 Page 23
Based on laboratory experimental results, for most of the very dilute surfactants with concentrations of
0.05-0.2%, very thin layers of the microemulsion phase (~0.1 mL) appeared at lower temperatures (23°C
to 60°C). However, this amount is too small to determine an optimal salinity even after aging a long time
(~42 days). Consequently, the following discussions only focus on the five surfactants with 2% solution
concentration. A salinity range of 0% TDS to 30% TDS was tested and these five surfactants were soluble
in this range.
4.2.1 Anionic internal olefin sulfonate surfactant
Surfactant S-2 (low molecular weight internal olefin sulfonate) with 2% concentration remained clear at 0
~30% TDS salinity from very beginning of the test at 120°C, and beginning of aging. Observations of
solubility indicated that S-2 was cloudy at 23°C and 60°C when the salinity was 30% TDS.
For an overall composition of 50% oil, 48% brine, and 2% surfactant, four 10-mL samples with different
salinities were mixed and allowed to equilibrate at 23°C, and 0.2 mL samples to equilibrate at 120°C. A
microemulsion phase formed after 2 hours aging for all four salinities, except for a cloudy volume at 30%
TDS salinity. After 14 days, microemulsion phases stabilized in the two samples with salinities of 0% at
23°C. As Fig. 1a shows, phase behavior changed to upper phase (15 % TDS) from middle phase (0% TDS).
At a temperature of 120°C, phase behavior changed to middle phase (10.0 % TDS) from lower phase (7.5,
8.5% TDS), and then to upper phase (12.5~15 5TDS) after 9 days stabilization, as Fig. 25 shows.
Plots of Vo/Vs and Vw/Vs are shown in Fig. 24b corresponding to the appearance of phase behavior after
equilibration at room temperature (23°C, Fig. 24a). Based on these data, the optimal salinity is 7.5% TDS
for Vo/Vs= Vw/Vs = 1 at 23°C. However, when temperature was changed to 120°C, the optimal salinity could
not be determined by Vo/Vs and Vw/Vs plots even though there small amounts of microemulsion phases
formed as shown in Fig. 25. We assumed the optimal salinity was 10.0% TDS based on observations when
the temperature was 120°C.
Here, Vo= oil volume in the microemulsion phase, Vw= water volume in the microemulsion phase, and
Vs= surfactant volume assumed to be in microemulsion.
4.2.2 Ethoxylated alcohol nonionic surfactant
Two surfactants, 58N with lower carbon number and N-2512 with higher carbon number, were studied.
Mixtures of both surfactants were clear at all salinities (0~30%) from the very start of testing at 23~
120°C at concentrations of 2%. A large phase behavior change occurred in N- 2512 at 10 days aging when
the temperature was 23°C, as Fig.3 illustrates. Based on observation, the optimal salinity cannot be
confirmed at 23°C, but at the very least, we estimate the optimal salinity for this situation would be
large (close to 30% TDS ). When temperature is increased to 60°C, the optimal salinity is 26.5% TDS at
Vo/Vs and Vw/Vs = 4, as Fig. 28a and 28b shows. The phase behavior stabilized after 16 days. In Fig. 27,
we assume that the colored liquid in the lower part of the tubes (30% TDS) was not a transparent
microemulsion phase. It might be a component that diffused from the oil phase into the water phase,
and the color change represents a concentration gradient.
In the higher temperature range from 90°C to 120°C, both surfactants show upper phase status even
though a tiny microemulsion phase can be observed in N-2512, as shown in Fig. 29. This phenomenon
indicates this kind of surfactant is more hydrophobic at high temperature when mixed with Bakken oil,
especially for the low carbon number surfactant, 58N (Fig. 30). However, our previous studies (SPE
145510, and SPE 153853) proved this kind of surfactant also shows favorable oil recovery under the
current salinity ranges. Perhaps, for each surfactant, the question is "How does it displace oil?”—possibly
indicating that wettability change is the key mechanism— not IFT reduction where no emulsion phase
forms at high temperature in detailed salinity scans. Additional IFT studies are needed.

Final Report, University of North Dakota, 09123-09 Page 24
4.2.3 Dimethyl Amine Oxide amphoteric surfactant
Fig. 31a and 31b show the appearance and phase volumes at 23°C for this surfactant at 2% concentration.
Optimal salinity at 23°C was 8.43% TDS for Vo/Vs and Vw/Vs = 3.75. However, at high temperatures from
90°C to 120°C, this surfactant shows lower phase status in all tests over a broad salinity range (0 ~ 30%
TDS), including detailed scans (7.5~15 TDS%). This indicates Surfactant 17A is somewhat hydrophilic at
high temperature when mixed with Bakken oil. It also suggests that wettability change is the key
mechanism responsible for the favorable oil recovery over the same temperature range. Phase behavior of
17A at 90°C is shown in Fig. 32a and Fig.32b.
4.2.4 Ethoxylated tallow amines cationic surfactant
Phase behavior of Surfactant TA-15 at high temperature 90 and 120°C is shown in Fig. 33 and Fig. 34.
Lower phase was observed after aging for days up to 90°C, and more upper phase after aging for days up to
120°C, if the very small volume of third phase (dark color in the middle part of the figures) is ignored.
Laboratory results indicate this kind of surfactant exhibits a hydrophilic character at high temperature, and
then the switches to hydrophobic character as temperature is increased, when mixed with Bakken oil.
4.3 Interfacial tension (IFT) Study
Surfactant treatment of a fractured reservoir is very different from traditional surfactant–alkaline or
surfactant-alkaline-polymer (ASP) floods that need ultra-low IFT (10-2~10
-3). For a surfactant-aided
gravity drainage process in fractured reservoirs, the target oil recovery will be driven toward a residual
saturation value. Even though the IFT values between surfactants and oil in this research are not expected
in the ultra-low range (10-2~10
-3), the reduction should still be low enough compared to IFT between brine
water and oil for sufficiently rapid oil drainage into the fracture system under gravity. The efficiency of this
process is determined by a combination of capillary, gravity, and viscous forces.
Based on the research of Adibhatla and Mohanty (2006), when the oil-wet cores with a negative
capillary pressure are immersed in a surfactant solution, oil displacement will be determined by the inverse
Bond number (Eq. 7). For water alone, the macroscopic inverse Bond number, NB-1
, may be greater than 1.
However, if IFT is lowered, NB-1
may become less than 1, and the surfactant solution will diffuse into the
core and change IFT and wettability. This aqueous invasion into the core drives the oil out. As wettability
is altered, the capillary pressure changes from negative to positive, and counter-current imbibition
mobilizes more oil. Furthermore, relative permeabilities and residual saturations will be changed to provide
a higher oil recovery from the core.
gL
kBN
1
…………………………………….………………………………………………… (7)
Here, φ is the rock porosity, k is rock permeability, σ is interfacial tension between oil and water, ρ is
the density difference, g is the gravitational constant, and l is length of the core. The numerator of Eq.7 is
capillary pressure.
Cases where IFT measurement and calculation were performed are listed in Table 18. Surfactant CDS17-
31C was not investigated for phase behavior.

Final Report, University of North Dakota, 09123-09 Page 25
Table 18 — Surfactant formulations for IFT study
Surfactant Type Molecular structure Concentration Temperature Added reagent Manufacturer
S-2 Anionic Internal olefin sulfonate 0.1% 30~90°C 0.25% NaBO2.4H2O Tiorco
58N Nonionic Alcohols, ethoxylated 0.1% 30~90°C 0.1% NaBO2.4H2O CorsisTech
N 2512 Nonionic Alcohols, ethoxylated 0.1% 30~90°C 0.1% NaBO2.4H2O Tiorco
CDS17-31C Nonionic Alcohols, ethoxylated 0.1% 30~90°C 0.1% NaBO2.4H2O CorsisTech
17A Amphoteric Dimethyl amine oxide 0.1% 30~90°C 0.1% NaBO2.4H2O CorsisTech
TA-15 Cationic Ethoxylated tallow amines 0.1% 30~90°C 0.1% NaBO2.4H2O CorsisTech
4.4 Results Analysis
The average IFT between oil and brine water is generally high: in the range of 9.0~29 mN/m for oil
viscosities of 2.8 to 694 cP, as studied by (Green and Willhite, 1998; Buckley and Fan, 2007). In our study,
optimal salinities were tested at salinities of 3.75 to 22.5 % TDS. At several salinities, the IFT between
brines and Bakken oil was decreased to 10-1
mN/m.
Fig. 34 shows the IFT reduction vs. salinity of surfactants with and without alkaline at 90°C. Results for
anionic surfactant S-2 indicate that IFT reductions to 10-2
mN/m are possible when salinity is about 11.25%
TDS. For nonionic surfactant N2512, amphoteric surfactant 17A, and cationic surfactant TA-15, IFT
reductions to 10-1
mN/m are possible at salinities of 4.38, 28.97, and 15% TDS, respectively. For nonionic
surfactants, optimal salinity was relatively low compared to the other types of surfactants; the optimal
salinity for the IFT of the amphoteric surfactant was very high. This is consistent with phenomena observed
during the phase behavior studies. For surfactant 58N, the IFT measurement was very challenging due to
oil drops attaching to the inside wall of the spinning tube even though the equipment is spinning at high
speed. As indicated previously in the phase behavior study, this surfactant is more hydrophobic. It is
possible that the wet status of the inlet end of tube was altered to oil wet from water wet, therefore the oil
drops are hard to separate from the wall. It should be stressed, that the explanation is not contradictory to
with the wettability modification of the shale rocks by this surfactant.
Compared to the previous phase behavior study previously, the optimal salinities obtained by IFT curves
are basically consistent with the phenomena observed in the pipettes shown in Fig. 31 to Fig. 33 at high
temperatures. As a consequence, the salinities when IFT reached its lowest value can be taken as the
optimal salinities for the corresponding surfactants when the reservoir temperature is near 90°C.
Fig. 35 illustrates an example of IFT reduction at various temperatures. Based on Fig. 35, for nonionic
surfactant N-2512, the lower the temperature, the larger the optimal salinity obtained with the least IFT
reduction. Cationic surfactant TA-15 and amphoteric surfactant 17A show the same trend.
Table 19 shows estimated inverse Bond number NB-1
for five surfactants based on optimal salinity from
IFT curves. According to Table 18, most NB-1
values are less than 1. By reducing the IFT, surfactant
solutions will diffuse into the core and drive the oil out at optimal salinity.

Final Report, University of North Dakota, 09123-09 Page 26
Table 19 — Inverse Bond number NB-1
estimation (90°C)
Surfactant S-2 58N N-2512 17A TA-15
NB-1
0.202 NM 0.474 1.164 0.221
Core 1-65 1-77 1-79 1-78 1-80
Δ ρ, g/cm3 0.286 NM 0.236 0.393 0.314
σ, mN/m 0.056 NM 0.098 0.550 0.44
TDS, % 11.25 NM 4.38 28.92 15.00
φ, fraction 0.062 0.050 0.058 0.039 0.052
k, md 4.070 1.790 1.950 4.14 4.53
l, mm 39.81 38.50 38.00 38.41 38.69
Here, k is the permeability with respect to surfactant. For surfactant 58N that only involved brine water and
0.1% 58N, IFT measurement was very challenging at 90°C using current equipment because the oil drops could
not be separated from the tube wall of the Spinning Drop Tensiometer. NM is not measured.
4.5 Summary
(1) Optimal salinities can be estimated from the curves showing the relationship between the
microemulsion phase and corresponding proportions of oil/water volumes for most selected surfactants at
low temperatures. However, for high temperatures, a relationship was difficult to determine in some
solutions due to the limited volumes recovered.
(2) IFT was reduced with anionic and nonionic surfactants by 10-2
order of magnitude at high temperature.
IFT reductions for other type of surfactants were 10-1
order of magnitude.
(3) The optimal salinities obtained from IFT curves are consistent with phenomena observed in the phase
behavior study for reservoir temperature near 90°C.
(4) For the optimal salinity, the inverse Bond number NB-1
, which dominated the IFT reduction
mechanism, could be decreased to below a value of 1 in cores from the Bakken Middle member in Well #
17450.
(5) For nonionic surfactants, the lower the temperature, the larger the optimal salinity obtained with the
least IFT reduction. Cationic surfactants and amphoteric surfactants show the same trend.
.

Final Report, University of North Dakota, 09123-09 Page 27
Chapter 5. Extensive Imbibition Experiments
This chapter discusses results of studies on the effect of aqueous imbibition over time using a glass
imbibition cell. The imbibition rate of different aqueous liquids including fresh and brine water, as well
initial optimized surfactant formulations, based on phase behavior and IFT studies, were investigated.
In this study, imbibition cells were immersed into a temperature bath with high temperature adjustment.
Core plugs were saturated with Bakken oil and stored for 4 to 8 weeks in order to achieve to oil wet status,
and then were put into Glass Imbibition Cells with precision graduations in 0.1 mL. The cells filled with a
volume of surfactant solution first, and then were immersed into a temperature bath at 120°C for 300 to 500
hours until no more oil was displaced out. The volume of oil expelled was used to calculate the oil rate and
%OOIP of oil recovery. During the spontaneous imbibition process, cores with all faces opened, and cores
with two faces (top face and bottom face) were tested. No confining pressure was added during the process
of Imbibition. We assume there was no gas presented in the cores and oil because they were vacuumed
prior to imbibition.
Core samples were from the Middle member of the Bakken in NDIC Well #17450. Reservoir
temperatures of 23°C to 120°C were simulated. Two groups of surfactant formulations and two groups of
core samples were studied in this section: (1) surfactants with preliminary optimization at 30% TDS
(Wang, et al, 2011b), (2) surfactants at optimal salinity based on phase behavior and IFT study, (3) cores
with all faces opened, and (4) cores with two faces (top face and bottom face) opened. Extensive imbibition
tests were conducted at a reservoir temperature of 120°C. Core samples were from the Middle Member of
Bakken Formation in Well # 17450, at depths of 7347 to 7401 ft. Core sample properties are provided in
Table 20.
5.1 Imbibition rate and oil recovery
The tested aqueous solutions included:
Group 1:
(1) Fresh water
(2) Brine water with 30% TDS;
(3) 0.1% of surfactant formulation N2512 (nonionic) with 30% TDS;
(4) 0.05% of 58N (nonionic) with 30% TDS, 0.1% alkaline content;
(5) 0.2% of TA-15 (cationic) with 30% TDS.
Group 2:
(1) 0.1% of S-2 (nonionic) with 10% TDS; 0.25% alkaline content
(2) 0.1% of 58N (nonionic) with 7.5% TDS, 0.1% alkaline content
(3) 0.1% of N-2512 (nonionic) with 4.38~5.62% TDS, 0.1% alkaline content
(4) 0.1% of 17A (amphoteric) with 29% TDS; 0.1% alkaline content
(5) 0.1% of TA-15 (cationic) with 12.5~15% TDS, 0.1% alkaline content
(6) 2% of S-2 (nonionic) with 10% TDS; 0.25% alkaline content
For the fresh water and Brine water in Group 1, four reservoir temperatures ranging from 23°C to 120°C
were simulated in cores from Well # 17450. Experimental results show that imbibition using fresh water or
brine water resulted in very little imbibition at low temperatures. However, oil was extracted out at higher
temperatures from the tested core. It was noted that some oil drops imbibed out (2 -3 hours) using fresh
water, but imbibition times for fresh water or brine water took much longer to obtain a reading on the
imbibition cell compared to the surfactants. The explanation for these phenomena is that using fresh water
or brine water alone, the wettability cannot be altered, or not obviously with Bakken oil. Even though oil
drops imbibed out at high temperature, the wetness of glass tube was changed into oil wet from water wet
by these waters (especially fresh water).
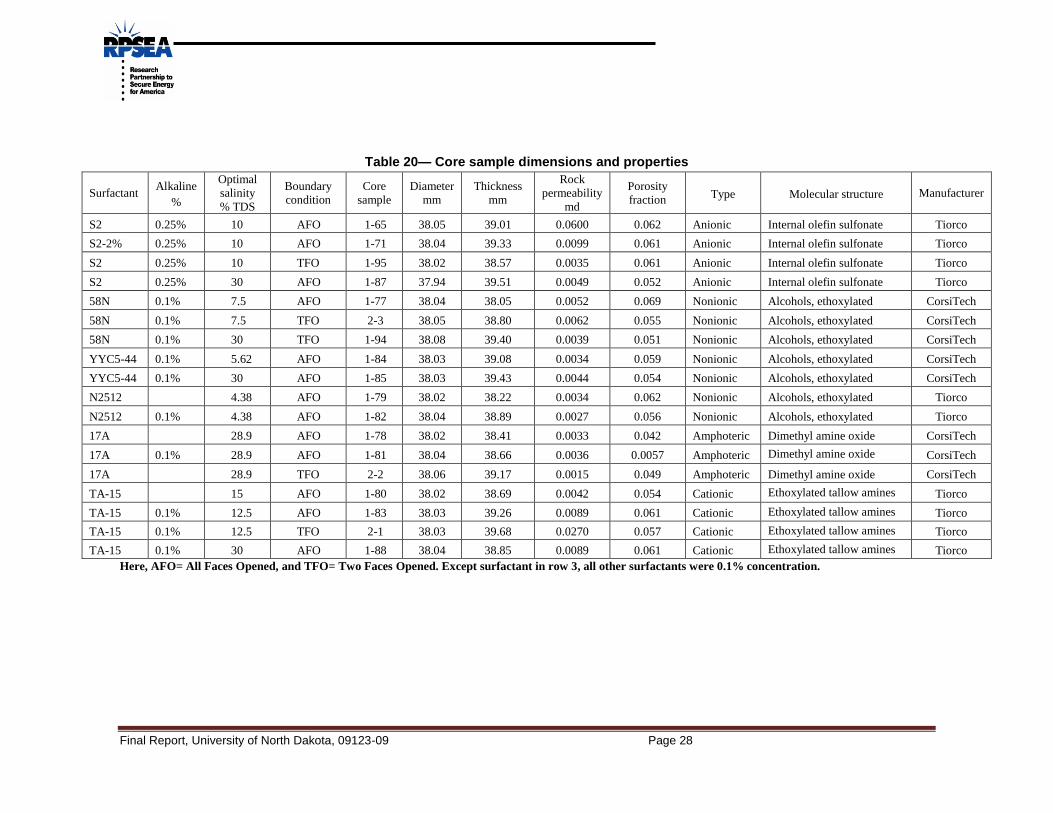
Final Report, University of North Dakota, 09123-09 Page 28
Table 20— Core sample dimensions and properties
Surfactant Alkaline
%
Optimal
salinity
% TDS
Boundary
condition
Core
sample
Diameter
mm
Thickness
mm
Rock
permeability
md
Porosity
fraction Type Molecular structure Manufacturer
S2 0.25% 10 AFO 1-65 38.05 39.01 0.0600 0.062 Anionic Internal olefin sulfonate Tiorco
S2-2% 0.25% 10 AFO 1-71 38.04 39.33 0.0099 0.061 Anionic Internal olefin sulfonate Tiorco
S2 0.25% 10 TFO 1-95 38.02 38.57 0.0035 0.061 Anionic Internal olefin sulfonate Tiorco
S2 0.25% 30 AFO 1-87 37.94 39.51 0.0049 0.052 Anionic Internal olefin sulfonate Tiorco
58N 0.1% 7.5 AFO 1-77 38.04 38.05 0.0052 0.069 Nonionic Alcohols, ethoxylated CorsiTech
58N 0.1% 7.5 TFO 2-3 38.05 38.80 0.0062 0.055 Nonionic Alcohols, ethoxylated CorsiTech
58N 0.1% 30 TFO 1-94 38.08 39.40 0.0039 0.051 Nonionic Alcohols, ethoxylated CorsiTech
YYC5-44 0.1% 5.62 AFO 1-84 38.03 39.08 0.0034 0.059 Nonionic Alcohols, ethoxylated CorsiTech
YYC5-44 0.1% 30 AFO 1-85 38.03 39.43 0.0044 0.054 Nonionic Alcohols, ethoxylated CorsiTech
N2512 4.38 AFO 1-79 38.02 38.22 0.0034 0.062 Nonionic Alcohols, ethoxylated Tiorco
N2512 0.1% 4.38 AFO 1-82 38.04 38.89 0.0027 0.056 Nonionic Alcohols, ethoxylated Tiorco
17A 28.9 AFO 1-78 38.02 38.41 0.0033 0.042 Amphoteric Dimethyl amine oxide CorsiTech
17A 0.1% 28.9 AFO 1-81 38.04 38.66 0.0036 0.0057 Amphoteric Dimethyl amine oxide CorsiTech
17A 28.9 TFO 2-2 38.06 39.17 0.0015 0.049 Amphoteric Dimethyl amine oxide CorsiTech
TA-15 15 AFO 1-80 38.02 38.69 0.0042 0.054 Cationic Ethoxylated tallow amines Tiorco
TA-15 0.1% 12.5 AFO 1-83 38.03 39.26 0.0089 0.061 Cationic Ethoxylated tallow amines Tiorco
TA-15 0.1% 12.5 TFO 2-1 38.03 39.68 0.0270 0.057 Cationic Ethoxylated tallow amines Tiorco
TA-15 0.1% 30 AFO 1-88 38.04 38.85 0.0089 0.061 Cationic Ethoxylated tallow amines Tiorco
Here, AFO= All Faces Opened, and TFO= Two Faces Opened. Except surfactant in row 3, all other surfactants were 0.1% concentration.

Final Report, University of North Dakota, 09123-09 Page 29
For these surfactant formulations, experimental results show that imbibition using optimal salinities
resulted in a higher imbibition rate and faster oil extraction times at high temperature compared to solutions
without salinity optimization, as Table 6 shows. Based on Table 21, at optimal salinity, the average
instantaneous imbibition rate was increased up to 45%. The imbibition time was 380 hours.
Table 21— Imbibition rate vs. time (optimal salinity), 120°C, 0.1% concentration
Core sample Diameter
mm
Thickness
mm
Aqueous liquid Instantaneous imbibition rate, ft/day
1-47A 38.07 50.99 TA-15 0.028 at 30% TDS
1-80 38.03 38.69 TA-15 0.132 , at 15% TDS
1-53A 38.17 51.46 N 2512 0.069 at 30% TDS
1-79 38.02 38.00 N2512 0.101 at 4.38 %
TDS
1-44A 38.07 51.10 58N 0.120 at 30% TDS
1-77 38.04 38.50 58N 0.158 at 7.5% TDS
For surfactant formulations at optimal salinity, we found: (1) at 0.1% concentration, nonionic surfactants
with an ethoxylated alcohol molecular structure exhibited a fast imbibition rate and strong effect on oil
recovery at reservoir temperature (~120°C, N2512 and 58N), (2) at higher concentration (2%), an anionic
surfactant, internal olefin sulfonate, shows a slow imbibition rate compared to the lower concentration
(0.1%) surfactant with same molecular structure (Fig.36(a)), (3) higher oil recovery was seen with
amphoteric surfactant 17A without alkaline. In contrast, when using cationic surfactant TA-15, higher oil
recovery was seen with alkaline compared to 17A. Fig 37 shows the imbibition effect on oil recovery for
times up to 450 hours(a) and the oil recovery for dimensionless time (b), and (4) strong oil recovery using
optimal salinity up to 18% compared to the surfactant with formation water salinity (Fig. 38). In Fig. 38,
cationic surfactant solutions, TA-15 and nonionic surfactant solutions, YYC5-44 was mixed at a similar
salinity range with surfactant 58N (these two surfactants have similar molecular structures) and formation
water salinity, respectively.
In Fig. 14b, dimensionless time tD is defined by Eq. 8, as described by Fischer and Morrow (Fischer and
Morrow, 2008):
2
1
cwo
DL
ktt
……………………………………………………………………………….. (8)
Where, t is the imbibition time; k is the rock permeability, φ is the rock porosity; σ is the
surfactant/brine/oil interfacial tension; μw and μo are water and oil viscosities at 120°C (reservoir
temperature), respectively; and Lc (Fischer and Morrow, 2008) is the characteristic length which depends
on the core sample size, shape and boundary conditions, as Eq. 9 describes. In Eq.9, d is the diameter of
core sample, and l is the thickness of core sample. Here, we assume the core faces were opened with
cylindrical boundary conditions.

Final Report, University of North Dakota, 09123-09 Page 30
22 22 ld
ldLc
…………………………………………………………………………………….. (9)
5.2 Boundary conditions
The tested surfactant formulations included:
Group (3): cores with all faces opened, treated by toluene and methanol before being oil soaked
(1) 0.1% of S-2 (anionic) with 10% TDS; 0.25% alkaline content
(2) 0.1% of 58N (nonionic) with 7.5% TDS, 0.1% alkaline content
(3) 0.1% of TA-15 (cationic) with 15% TDS.
Group (4): cores with two faces opened, without treatment by chemicals before being oil soaked
(1) 0.1% of S-2 (anionic) with 10% TDS; 0.25% alkaline content
(2) 0.1% of 58N (nonionic) with 7.5% TDS, 0.1% alkaline content
(3) 0.1% of TA-15 (cationic) with 15% TDS.
Fig. 39 imbibition experiments show the effect of dimensionless time on oil recovery between cores with
all faces open and only two faces open during the period of imbibition. Based on the experimental results,
oil recovery was not affected by the exposed area or contact area of core sample, but was affected by the oil
extraction rate. With less area contacted, the oil extracted out slowly.
5.3 Discussion
Major surfactant imbibition mechanism. In general, wettability modification and interfacial tension
reduction are the major mechanisms for oil recovery improvement using surfactant imbibition. For most of
the surfactants we tested, optimal salinity obtained by IFT reduction is consistent with phenomena observed
in the phase behavior study. Also, with the optimal salinity, good potential was observed for increasing oil
recovery using surfactant imbibition compared to the solutions using formation water only (30% TDS).
These results demonstrate that IFT reduction can be taken as one mechanism for increasing oil recovery in
the Bakken Formation. However, this conclusion is tempered by two experimental phenomena:
For ethoxylated alcohol nonionic surfactant 58N with a low carbon number, IFT measurement was very
challenging due to oil drops attached to the inside wall of the spinning tube even though the equipment was
spinning at high speed. As indicated previously in phase behavior study, this surfactant was more
hydrophobic. It is possible that the inlet end of the glass tube was altered to oil wet from water wet,
therefore, the oil drops were hard to separate from the wall. However, we cannot ignore our laboratory
finding that this surfactant changed the wettability of the shale rocks from oil wet to water wet (Wang, et
al, 2012 ). As a consequence, we suggest that wettability alteration is an important mechanism when using
ethoxylated alcohol nonionic surfactant to improve oil recovery in the Bakken Formation.
Effect of Alkaline Solutions. In Fig.36, for nonionic surfactant N-2512, the optimal salinity value
increased when alkaline was added to the surfactant solution. For amphoteric surfactant 17A, the result
went the opposite way compared to N-2512. Even though the IFT reduction value was not affected much
by the two optimal salinities, the oil recovered by extensive imbibition in these two cases presented a
different trend (Fig. 37). Based on Fig. 37, surfactant 17A recovered less oil when alkaline was included at
optimal salinity.
Issue of optimal salinity. A fast oil extraction rate and favorable oil recovery was obtained by ethoxylated
alcohol nonionic surfactant N-2512 with a relative large carbon number, using an optimal salinity of 4.38~
5.62% TDS. However, for a field application at very high formation salinity such as that found in the
Bakken (~30 % TDS), this might presented a challenging problem as the displacing front advances and a
Final Report, University of North Dakota, 09123-09 Page 31
mixing zone developed in the reservoir. As a result, the optimal salinity should be adjusted to adapt to
reservoir conditions if this surfactant is applied to the field.
Number of open faces for the cores. Incremental recoveries from the two-face-open cores ranged from
20% to 60% OOIP. This is effectively the same range found in all faces opened cores. Oil recovery was not
affected by the contact area of core sample, but was affected by the oil extraction rate.
5.4 Summary
(1) In most cases, optimal salinities obtained by phase behavior and IFT studies aided surfactant imbibition
into the Bakken Formation.
(2) For the four types of surfactants tested (anionic, cationic, nonionic, and amphoteric with specific
molecular structures), all exhibited favorable imbibition rates and good effect on oil recovery at reservoir
temperature.
(3) At optimal salinity, the incremental oil recovery (during imbibition into Bakken cores at 120°C) can be
up to 18% OOIP higher than seen during comparable experiments using formulations with 15~30% TDS,
and the average instantaneous imbibition rate increased up to 45%.

Final Report, University of North Dakota, 09123-09 Page 32
Chapter 6. Ideal Numerical Simulation Model Building
In this chapter, an ideal numerical model to scale the laboratory results was built using UTCHEM
developed by the University of Texas in Austin. Certain equations that describe different parameters
including IFT, wettability alteration, surfactant concentration, and effect of rock fluid properties on the
amount and rate of oil recovery were utilized by our simulation model. In the ideal model, fractures were
not considered, but will be factored into the actual well model in the next phase of work.
6.1 Mathematical model
According to the experimental observations, the following assumptions are made regarding the distribution
of components among different phases:
Hydrocarbons can exist in the aqueous phase and oil phase.
Water can exist in the aqueous phase and oil phase.
Surfactant can exist in the aqueous and/or oil phases, and it can absorb onto solid surfaces.
Salt can exist in the aqueous phase and can be absorbed onto matrix surface.
Additionally, the capillary pressure, relative permeability, and residual saturations of phases are
considered as a function of IFT and wettability, which are correlated to the surfactant and salt
concentrations in the model. The conceptual model qualitatively captures the typical trends observed in
previous studies of the effects of capillary number and wettability on relative permeabilities. The mass
balance equations are spatially discrete with a finite volume method for all the components.
Based on UTCHEM, equations that describe the mechanisms of phase behavior, interfacial tension,
capillary, and wettability are as follows:
(1) Phase behavior
For both Type II(-) and Type II(+) phase behavior, there are only two phases present.
F
l
l
l
l
C
CE
C
C
1
3
2
3 l=1,2 ……………………………………………………………….(9)
Where, A and B are empirical parameters, klC is concentration of composition k in phase l. F is calculated
by F= —1/B.
For Type III, assuming that the excess oleic and aqueous phases are pure, the microemulsion phase
composition is defined by the coordinates of the invariant point, as Eq. 10 described.
SELSEU
SELSEm
mmm
B
m
m
m
m
CC
CCC
CCC
C
CA
C
C
2
321
1
3
2
3
1
)(
………………………………………………………….(10)
Where, SEC is salinity, SELC and SEUC are the lower and upper limits of effective salinity.
Note: the concept of Type II and Type III was discussed in Chapter 2, Phase behavior study
presented in the Annual report of March, 2013.
Final Report, University of North Dakota, 09123-09 Page 33
(2) IFT
The interfacial tensions between microemulsion and the excess phases (σ13—microemulsion/water and
σ23—microemulsion/oil) are calculated as functions of solubilization.
11
log)1(loglog
11
loglog
3
3
12310310310
3
33
1210310
l
l
lllowlll
l
ll
llll
RG
GGRRF
RRG
GGF
,
,
……………… (11)
Where, 1lG 、 2lG 、 3lG (l=1,2)are the input parameters. 3lR is the solubilization ratio:
33
33
G
GR
ll ………………………………………………………………………………………… (12)
The correlation factor introduced by Hirasaki,
2
1
e
ConeF
ll , l=1,2,
and
3
1
23)(
k
kkll CCCon …………………………………………………………………… (13)
In the absence of surfactant or the surfactant concentration below CMC (Critical Micelle Concentration), the
interfacial tension is combined with Hirasaki’s correlation and Chun-Huh’s equation 233 / ll Rc as:
)1( 33
23
3ll aR
l
laRowl e
R
cFe
for l =1 or 2 ………………………………………………(14)
Where, c = 0.3, σow = water-oil IFT
(2) Capillary pressure for oil-wet or mixed-wet rocks
The capillary pressure for an oil-wet or mixed-wet status is calculated using the modified van Genuchten
function:
n
mw
negcS
PP
/1
/11
)(
11
………………………………………………………….(15)
Where, orwr
wrww
SS
SSS
1, Pneg is the maximum negative capillary pressure at which the water saturation
reaches a maximum value on the main imbibition path, α, m and n are model fitting parameters. Swr is
connate water situation, and Sor is residual oil saturation.
6.2 Ideal simulation model description
As Fig. 39 illustrates, the ideal model is built with a 1-D homogeneous grid block 35×1×1 in x, y, and z
directions based on an average core size of 38 mm thickness and 38 mm diameter. For a single grid block,
dx = 1.086 mm, and dy = dz = 38 mm. Based on the imbibition experimental conditions assuming only the
top-face and the bottom-face are open, one well is located on the top—injector, and one well at the bottom
end—producer (forcible imbibition), or one on top as injector, and another on top end as producer
Final Report, University of North Dakota, 09123-09 Page 34
(spontaneous imbibition) of the model domain. A fixed pressure condition is applied in the model.
Based on the properties of core samples from Middle Bakken, the porosity of the matrix (no fractures
considered) is 5%, and the average permeability is 0.001 md with original oil-wet wetting status. Oil
viscosity is 2 cp at 25°C.
6.3 Oil recovery
Two cases were simulated in this model: imbibition by brine water only, and imbibition by surfactant
solutions. Five main ions constitute the brine: 61.5% chloride ion, 4.39% calcium ion, 0.39% magnesium,
28.4% sodium, and 1.88% potassium. Simulations were performed at the same reservoir condition
(pressure, temperature and imbibition rate) with brine water imbibition, and surfactant imbibition with 0.1%
concentration and 0.1% alkaline added. Fig. 5 shows the oil recovery comparison between the two cases.
Surfactant imbibition shows good oil recovery potential compared to brine water alone. The increased oil
recovery is about 20%. This result is consistent with our laboratory work described in previous reports.
6.4 Surfactant concentration
Five cases were simulated for effect of surfactant concentration on oil recovery at concentrations of 0.05%
to 1%. Based on the simulation model, we found: (1) oil recovery increased as surfactant concentration
increased, although there is not a large difference for small concentration differences. (2)A similar
phenomenon (Fig. 1 (a) was found with surfactant S-2) that the initial oil recovered increased slowly with
within 0.21 to 0.72PV (pore volume) up to 0.4% or higher concentration difference, and then increased
quickly above that. However, for field application, higher surfactant concentrations are not recommended
due to economics. Simulation results are shown in Fig. 41.
6.5 Water salinity
Six cases were simulated to study the effect of water salinity on oil recovery at salinities that ranged from
3.75% to 30% TDS (Fig. 42). Based on the simulation model, we found that there is an optimal salinity for
maximum oil recovery in the simulated surfactant. Using this surfactant at an optimal salinity (22.5% TDS),
the oil recovery achieved their highest value. Also, recovery of oil at both the highest and lowest salinities
(highest salinity- 30 % TDS and lowest salinity- 3.75%) were poorer because no middle phase
(microemulsion phase) forms and there is higher interfacial tension between water and oil. These results are
consistent with the laboratory results on phase behavior and IFT study discussed in the Annual Report of
March 2013.
6.6 Injection rate
Four cases were simulated to examine the effect of surfactant injection rates on oil recovery, varying
injection rates from 0.0052 to 0.1ft3/PV. Based on the simulation model, we found the oil recovery
increased as injection rate increased (Fig. 43). However, for a fractured field case, a moderate injection rate
was suggested, based on the actual reservoir case design where the actual water cut rose quickly in
fractures before the aqueous liquid imbibed into the matrix.
6.7 Summary
The IFT and wettability behavior correlated with surfactant and salt concentrations, following an ideal
model. Simulation was used to scale trends that were observed in the laboratory to a field scale. These
simulations examined how oil recovery depends on surfactant concentration, water salinity, injection rate,
and rock and fluid properties. Further predictions based on actual well production data and fracture
networks will be attempted in the next task.

Final Report, University of North Dakota, 09123-09 Page 35
Chapter 7. Field-Scale Numerical Simulation Prediction
For the field-scale numerical simulation, the well modelled represents an actual well site, and reservoir
dimensions are based on real data. In the simulation, fractures are assumed to be of infinite permeability
and higher conductivity and always filled with surfactant solution. The fracture length is assumed 30 ft.
This would be an ideal case, but is still useful to indicate the potential for scale-up of the laboratory results.
The properties of the reservoir are those from the Bakken formation, with gravity drainage considered.
Fracture dimensions are described in the simulation mode; however fracture geometry distribution,
geomechanical stress and other factors were beyond the scope of this project. The current average spacing
between wells in the target oil field (North Dakota) is relatively large (800-1000 ft). There may be very
good natural fracture connection between wells, but well to well injection in this Chapter is not modeled,
although future well infilling patterns may necessitate changing the model. Another assumption in this
model is that fracture networks have two wings that are directed in opposite vertical directions from the
horizontal well. Since our main objective in this project is to determine whether oil recovery can be
improved by the aqueous imbibition process, other fracture patterns (horizontal way and network
configuration) will not discussed here.
The simulation model was built based on STARS of CMG but not GEM as in other simulation studies.
The reason is: the GEM module is a compositional simulator which can simulate all the mechanisms of a
miscible gas injection process, i.e. vaporization and swelling of oil, condensation of gas, viscosity and
interfacial tension reduction, and the formation of a miscible solvent bank through multiple contacts. Since
our project objective is focus on surfactant imbibition coupled with gravity drainage, STARS should be the
best choice to target our goal.
7.1 Well model
Well AV Wrigley 0607-H1 (#17450) is a Bakken well located in northwest Burke County in the Williston
Basin in North Dakota. The well location is shown in Fig. 44. This well is a hydraulically fractured
horizontal well that started production in October 2008 in a 1280 aces test. By the end of June 2013, the
cumulative oil production was 135,504 bbl. The basic properties used in the simulation model were based
on an actual reservoir model of the matrix (Table 22). Based on laboratory results, the wettability of
reservoir was set to oil-wet with a pressure drop scheme until the end of June 2013. Beginning July 2013,
we assumed use of a surfactant imbibition drive, and wettability was set to water-wet status in the model.
The lowest interfacial tension was set to 10-2
order of magnitude, based on laboratory results. The other
parameters described in the simulation model are succeeded by the ideal model described in section 6.1.
Also, in this model, the gas phase was considered since the current displacement mechanism in Bakken
involves a pressure decline associated with gas expansion.
Fig. 45 (left) shows plan view of the well trajectory from the well survey of the drilling paths (mostly
horizontal). Fig. 45 (right) is the 2D simulation model based on the well trajectory. A 3D simulation model
was built using 10×38×3 = 1140 cell blocks. The grid dimension in the x direction and y direction is: dx
=500ft, dy=500 ft, and dz is variable in the vertical direction from 87.7 to 349.2 ft. The thickness of net pay
was set at 87 ft, based on the drilling record of Well #17450. Considering actual fracture dimensions and
fracturing stages, a Dual-porosity and Dual-permeability model was adopted for the history match, and
imbibition effectiveness predicted using the STARS Module of CMG (Fig. 46). Refined grid blocks were
used for the perforation segments shown in Fig. 46. Fig. 47 and Fig. 48 illustrate the perforation design and
fracture distribution simulated in the model. The imbibition mechanism considers fluid flow imbibed into
fractures, and fluid diffusion into the matrix due to gravity drainage. Oil is extracted through the fractures
after a period of soaking.
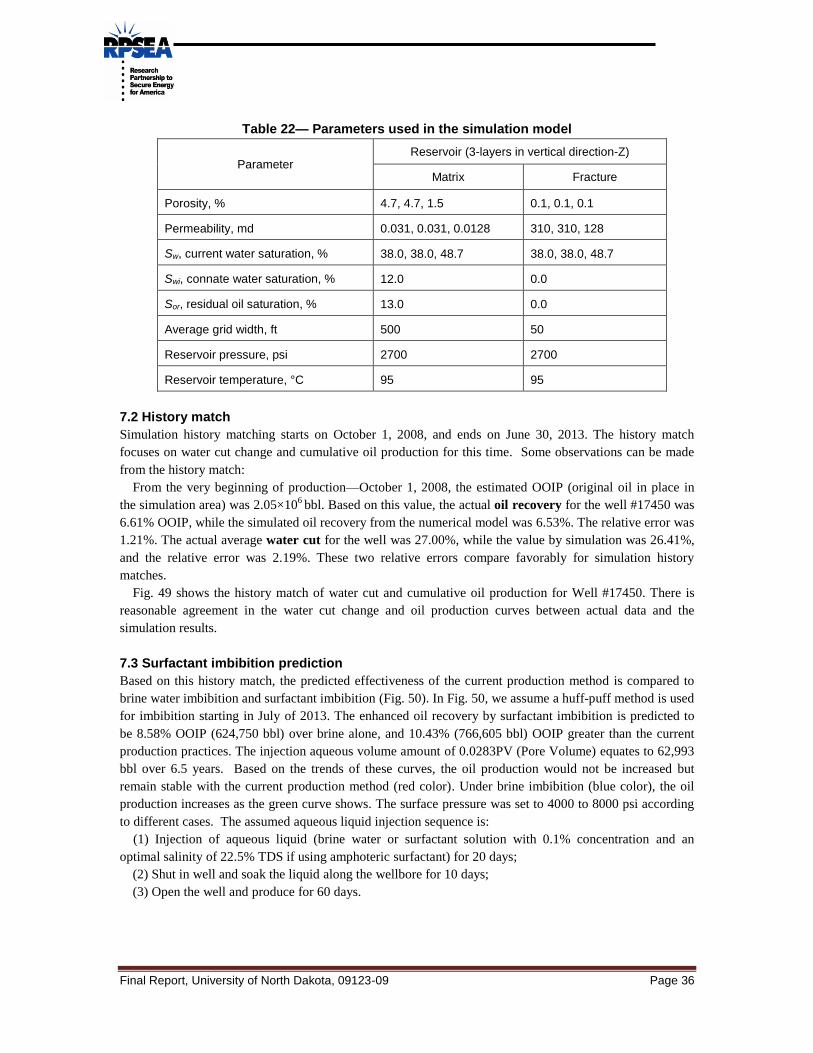
Final Report, University of North Dakota, 09123-09 Page 36
Table 22— Parameters used in the simulation model
Parameter Reservoir (3-layers in vertical direction-Z)
Matrix Fracture
Porosity, % 4.7, 4.7, 1.5 0.1, 0.1, 0.1
Permeability, md 0.031, 0.031, 0.0128 310, 310, 128
Sw, current water saturation, % 38.0, 38.0, 48.7 38.0, 38.0, 48.7
Swi, connate water saturation, % 12.0 0.0
Sor, residual oil saturation, % 13.0 0.0
Average grid width, ft 500 50
Reservoir pressure, psi 2700 2700
Reservoir temperature, °C 95 95
7.2 History match
Simulation history matching starts on October 1, 2008, and ends on June 30, 2013. The history match
focuses on water cut change and cumulative oil production for this time. Some observations can be made
from the history match:
From the very beginning of production—October 1, 2008, the estimated OOIP (original oil in place in
the simulation area) was 2.05×10⁶ bbl. Based on this value, the actual oil recovery for the well #17450 was
6.61% OOIP, while the simulated oil recovery from the numerical model was 6.53%. The relative error was
1.21%. The actual average water cut for the well was 27.00%, while the value by simulation was 26.41%,
and the relative error was 2.19%. These two relative errors compare favorably for simulation history
matches.
Fig. 49 shows the history match of water cut and cumulative oil production for Well #17450. There is
reasonable agreement in the water cut change and oil production curves between actual data and the
simulation results.
7.3 Surfactant imbibition prediction
Based on this history match, the predicted effectiveness of the current production method is compared to
brine water imbibition and surfactant imbibition (Fig. 50). In Fig. 50, we assume a huff-puff method is used
for imbibition starting in July of 2013. The enhanced oil recovery by surfactant imbibition is predicted to
be 8.58% OOIP (624,750 bbl) over brine alone, and 10.43% (766,605 bbl) OOIP greater than the current
production practices. The injection aqueous volume amount of 0.0283PV (Pore Volume) equates to 62,993
bbl over 6.5 years. Based on the trends of these curves, the oil production would not be increased but
remain stable with the current production method (red color). Under brine imbibition (blue color), the oil
production increases as the green curve shows. The surface pressure was set to 4000 to 8000 psi according
to different cases. The assumed aqueous liquid injection sequence is:
(1) Injection of aqueous liquid (brine water or surfactant solution with 0.1% concentration and an
optimal salinity of 22.5% TDS if using amphoteric surfactant) for 20 days;
(2) Shut in well and soak the liquid along the wellbore for 10 days;
(3) Open the well and produce for 60 days.

Final Report, University of North Dakota, 09123-09 Page 37
7.4 Production sequence
Three pumping sequences were simulated based on the history match: SA, SB and SC. The process of each
sequence and its effectiveness are shown in Table 23. Details of different huff-puff trials are shown in
Table 22 and effectiveness are shown in Fig. 51. Based on the simulation prediction, the most favorable
effect on oil recovery could be obtained by sequence MESTW. Considering field site conditions, a well that
is frequently shut-in and re-opened may cause mechanical issues. As the result, an appropriate case design
for a production sequence selection will be depend on the feasibility of actual well operation.
Table 23— Production sequence effect on oil recovery
Sequence Injection
period, days Injection rate,
BWPD
Imbibition (soak) time,
days
Production period, days
Period oil recovery, %
SA 15 242.28 45 60 11.94
SB 20 242.28 10 60 18.36
SC 30 242.28 10 50 23.68
Here: SA= sequence A, SB=sequence B, SC=sequence C
7.5 Injection rate
Three injection rates were simulated based on the production sequence SC. Assuming the injection rate
ranges from 500 BPD to 1500 BWPD (barrels water per day), and the injection pressure ranges from 4000
to 8000 psi, the predicted oil recovery would be 13.43 to 27.27% within 15 months as Fig. 52 shows. The
predicted oil recovery would be 1.38% per month compared to only 0.11% per month before the surfactant
imbibition process. The predicted period oil recovery (include the period from Oct. 2008 to June 2013)
over 15 month period would be 20.57, if the injection rate is 1500 BWPD (Table 24) under the fracture
distribute assumption in the model.
Table 24— Injection rate effect on oil recovery
Injection volume, bbl
Injection rate, BWPD
Imbibition (soak) time, days
Total cycling period, month
Period oil recovery, %
77,000 500 10 per cycle 15 13.43
154,001 1500 10 per cycle 15 20.57
231,000 2000 10 per cycle 15 27.27
7.6 Summary
(1) Compared with current production methods, enhanced oil recovery using the surfactant imbibition
process could yield more than 10% OOIP in a few years for this Bakken Well.
(2) Injection rate and production sequence appear to affect oil recovery. A reasonable injection rate and
production sequence should be considered completely when designing field trial.
(3) The predicted oil recovery factor may be different for a pilot trial due to assumptions used in the
simulation model. Future field development of a field case design needs to consider fracture geometry
distribution and the loss of surfactant solutions used in the imbibition process during transition from
fractures to matrix, among other factors.

Final Report, University of North Dakota, 09123-09 Page 38
Chapter 8. Conclusions
Laboratory studies and numerical simulations were conducted to find surfactant formulations best suited to
imbibe into and enhance oil recovery from the Bakken Formation. Even though our research shows a
tremendous potential to increase oil recovery from Bakken, more extensive research is needed on how to
increase the rate of fluid penetration or expand the contact area with the rock, among other issues to be
explored in the future. Moreover, an appropriate case design is a key factor for a field application in a
future field test. Findings based on our research include:
1. Ethoxylate nonionic surfactant, internal olefin sulfonate anionic surfactants, and amine oxide amphoteric
surfactant were more stable than the other surfactants at temperatures of 105−120°C. All were effective in
imbibing and displacing oil at high temperatures.
2. Sodium carbonate (added to increase alkalinity) precipitated with divalent cations in brines (15-30 %
TDS). Sodium metaborate may help increase alkalinity without precipitation in brines. 3. Ethoxylate nonionic surfactant and an internal olefin sulfonate anionic surfactant were more tolerant of
high salinity than other surfactants and displayed higher oil recoveries at high temperature. For Bakken
cores, surfactants did not imbibe effectively using distilled or low salinity water.
4. For a given surfactant, there is an optimum hardness level. Excess or insufficient divalent cation content
significantly reduces imbibition and oil displacement.
5. Clay flaking of shale was observed when contacting (a) brine without surfactant or (b) an amine oxide
amphoteric surfactant in brine. However, for Case (b), changing the pH of the surfactant solution may
reduce flaking.
6. For a given surfactant, oil recovery can be maximized by identifying an optimal surfactant concentration,
brine salinity, sodium metaborate concentration, and divalent cation content.
7. Proper co-surfactant formulations show potential for increased oil recovery.
8. Bakken shale cores were generally oil-wet or intermediate-wet (before introduction of the surfactant
formulation).
9. The surfactant formulations that we tested consistently altered the wetting state of Bakken cores toward
water-wet.
10. Surfactants we tested consistently imbibed to displace significantly more oil than brine alone displaced.
Four of the surfactant imbibition tests provided EOR values of 6.8% to 25.4% OOIP, incremental over
brine imbibition. For comparison, recovery using existing production methods is typically only a few %
OOIP.
11. Positive imbibition results were generally observed with all surfactants: anionic, cationic, nonionic, and
amphoteric with specific molecular structures. From our work to date, no definitive correlation is evident in
surfactant effectiveness versus (1) temperature, (2) core porosity, (3) whether the core was from the Upper
Shale or the Middle Member and (4) whether the core was preserved (sealed) or cleaned prior to use.
12. Optimal salinities can be estimated from the curves showing the relationship between the
microemulsion phase and corresponding proportions of oil/water volumes for most of the selected
surfactants at low temperatures. However, for high temperatures, this relationship was difficult to
determine in some solutions due to the limited volumes recovered.
13. IFT was reduced with anionic and nonionic surfactants by 10-2
order of magnitude at high temperature.
IFT reductions for other type of surfactants were 10-1
order of magnitude.
14. The optimal salinities obtained from IFT curves are consistent with phenomena observed in phase
behavior studies at reservoir temperatures near 90°C.

Final Report, University of North Dakota, 09123-09 Page 39
15. For the optimal salinity, the inverse Bond number NB-1
, which dominated the IFT reduction mechanism,
could be decreased to below a value of 1 in cores from the Bakken Middle member in Well #17450.
16. For nonionic surfactant, the lower the temperature, the larger the optimal salinity obtained with the least
IFT reduction. Cationic surfactant and amphoteric surfactant show the same trend.
17. In most cases, optimal salinities obtained by phase behavior and IFT study aided surfactant imbibition
into the Bakken Formation.
18. For the four types of surfactants tested (anionic, cationic, nonionic, and amphoteric with specific
molecular structures), all exhibited favorable imbibition rates and good effect on oil recovery at reservoir
temperature.
19. At optimal salinity, the incremental oil recovery (during imbibition into Bakken cores at 120°C) can be
up to 18% OOIP greater than that observed in comparable experiments using formulations of 15~30%
TDS, and the average instantaneous imbibition rate was increased by as much as 45%.
20. IFT and wettability, correlated to the surfactant and salt concentrations in the ideal model were
simulated and scaled to typical trends observed in laboratory studies on the effects of oil recovery of brine
water and surfactant formulations, surfactant concentrations, water salinity and injection rate, and effect of
rock fluid properties on amount and rate of oil recovery.
21. Compared to current production methods, enhanced oil recovery using the surfactant imbibition process
resulted in more than 10% OOIP in Bakken Well #17450, based on numerical simulation prediction.
22. Injection rate and production sequence apparently affect oil recovery. A reasonable injection rate and
production sequence should be considered completely when designing a field trial.
Nomenclature CMC= Critical Micelle Concentration
EOR=enhanced oil recovery vs. brine water imbibition alone
IFT= Interfacial Tension
Mw = molecular weight
OOIP = original oil in place, cm3
PV=pore volume
A = empirical parameter
B = empirical parameter
klC = concentration of composition k in phase l
SEC = salinity
SELC = lower limit of effective salinity
SEUC = upper limit of effective salinity
d = diameter of core sample
dx = grid size in x-direction
dy = grid size in y-direction
dz= grid size in z-direction
Fl= correlation factor
1lG = input parameter
2lG =input parameter
3lG = input parameter
g= gravitational constant
k = rock permeability
l = thickness of core samples
Lc =characteristic length which depends on core sample size, shape and boundary conditions
m =model fitting parameter

Final Report, University of North Dakota, 09123-09 Page 40
n=model fitting parameter
cP = capillary pressure
Pneg = maximum negative capillary pressure
3lR = solubilization ratio
SA= sequence A
SB= sequence B
SC = sequence C
Swr =connate water saturation
Sor = residual oil saturation
t = Imbibition time
tD =dimensionless time
α= model fitting parameter
ρ= density difference between oil and water
φ = rock porosity
σ = surfactant/brine/oil interfacial tension
σ13= microemulsion/water interfacial tension
σ23= microemulsion/oil interfacial tension
σow= water/oil interfacial tension
μw = water viscosity
μo = oil viscosity
References Adibhatla B., Sun X. and Mohanty K.K., 2005: “Numerical Studies of Oil Production from Initially Oil-
Wet Fracture Blocks by Surfactant Brine Imbibition,” SPE paper 97687 presented at the SPE International
Improved Oil Recovery Conference in Asia Pacific, Kuala Lumpur, Malaysia, Dec. 5-6.
Adibhatla, B., and Mohanty, K.K., 2006: “Oil Recovery from Fractured Carbonates by Surfactant-Aided
Gravity Drainage: Laboratory Experiments and Mechanistic Simulations,” SPE paper 99773, presented at
SPE/DOE Symposium on Improvement Oil Recovery held in Tulsa, OK. April. 22-26.
Abdallah, W., Buckley J.S., Carnegie, A., Edwards J., Fordham, E., and Graue, A., 2007: “Fundamentals of
Wettability,” published in Oilfield Review, May: 44-61.
Amott, E., 1959: “Observations relating to the wettability of porous rock”, Trans. AIME 219: 156–162.
Anderson, A.G., 1987: “Wettability Literature Survey-Part 5: The Effects of Wettability on Relative
Permeability,” J. Petroleum Technology. Novemebr. pp. 1453-1468.
Bardon, C., Longeron, D.G.,1980: “Influence of very Low Interfacial Tensions on Relative Permeability,”
SPEJ., October, pp. 391-401.
Barnes, J.R., Johan P. Smit, J.P., Smit, J.R., et al, 2008: “Phase Behavior Methods for the Evaluation of
Surfactants for Chemical Flooding at Higher Temperature Reservoir Conditions,” SPE paper 113314,
presented at SPE/DOE Symposium on Improvement Oil Recovery held in Tulsa, OK. Apr. 20-23.
Buckley, J.S., Liu, Y., and Monsterleet, S., 1998: “Mechanisms of Wetting Alterations by Crude Oil”, SPE
Journal, March, pp. 54-61.

Final Report, University of North Dakota, 09123-09 Page 41
Buckley, J.S. and Fan, T. G., 2007: “Crude Oil/Bine Interfacial Tensions”, Petrophysics, Vol. 48 (3), pp.
175-185.
Chen, J., Tang H., Xu X.C., et al, 2008: “Analysis of the Inhibition displacement Effect Influenced by the
Surface Active Agent in Low Permeability Fractured Sandstone Reservoir,” Offshore Oil, Vol. 28(1), pp.
51-55.
Chen, P. and Mohanty, K.K., 2013: “Temperature Effects on Surfactant-Aided Imbibition into Fractured
Carbonates,” SPE Journal, February, 18(1): pp. 124-133.
Dake, L.P., 1997: “Fundamentals of Reservoir Engineering”, Elsevier Scientific Publishing Company,
Amsterdam.
Elijah, O., Carl, S., and Chandra, R., 2011: “An NMR Study on Shale Wettability”, SPE paper 147371
presented at the Canadian Unconventional Resources Conference, Calgary, Alberta, Canada. Nov. 15 – 17.
Fischer, H. and Morrow, H. R., 2008: “Modeling the Effect of Viscosity Ratio on Spontaneous Imbibition,”
SPE Reservoir Engineering & Evaluation, June, 11(3): pp. 577-589.
FulcherJr, R.A., Ertekin, T. and Stahl, C.D., 1985: “Effect of Capillary Number and its Constituents on
Two-Phase Relative Permeability Curves,” J. Petroleum Technology. February, pp. 245-260.
Glover, P. W.J., 2001: “Formulation Evaluation MSc Course Notes—Wettability”,
http://www2.ggl.ulaval.ca/personnel/paglover/CD%20Contents/Formation%20Evaluation%20English/Cha
pter%207.PDF.
Green, D.W. and Willhite, G.P., 1998: “Enhanced Oil Recovery,” Society of Petroleum Engineers
Textbook: pp. 245-251.
Gupta, R., Mohanty, and K.K., 2007: “Temperature Effects on Surfactant-Aided Imbibition into Fractured
Carbonates,” SPE paper 110204 presented at the SPE Annual Technical Conference and Exhibition held in
Anaheim, CA, Nov. 11-14
Gupta, R., Mohanty, and K.K., 2008: “Wettability Alteration of Fractured Carbonate Reservoirs,” SPE
paper 113470 presented at the SPE/DOE Symposium on Improved Oil Recovery, Tulsa, OK. Apr. 20-23.
Gupta R., Mohan K. and Mohanty K.K., 2009: “Surfactant Screening for Wettability Alteration in Oil-Wet
Fractured Carbonate Reservior”, SPE paper 124822 presented at the SPE Annual Technical Conference and
Exhibition, New Orleans, Louisiana. Oct. 4-7.
Gupta, R. and Mohanty, K.K., 2013: “Surfactant-Mediated Spontaneous Imbibition in Carbonate Rocks at
Harsh Reservoir Conditions,” SPE Journal, September, 15(3), pp. 588-597.
Hamouda, A.A. and Karoussi, O., 2008: “Effect of Temperature, Wettability and Relative Permeability on
oil recovery from oil-wet chalk”, Energies 1:19-34; DOI: 10.3390/en1010019.
Healy, R.N., Reed, R.I., and Stenmark, D.G., 1976: “Multiphase Micro emulsion System,” SPEJ June, pp.
147-60; Trans., AIME, 261.
Hirasaki, G.J., 1991: “Wettability, Fundamentals and Surface Forces”, SPE Formation Evaluation, June:
217-226.

Final Report, University of North Dakota, 09123-09 Page 42
HØgnsen, E.J., Strand, S. and Austad, T., 2005: “Water Flooding of Preferential Oil-Wet Carbonates: Oil
Recovery Related to Reservoir Temperature and Brine Composition,” SPE paper 94166 presented at the
SPE Europe/EAGE Annual Conference, Madrid, Spain, June. 13-16.
Iampen, H.T. and Rostron, B.J., 2000: “Hydro geochemistry of pre-Mississippian brines, Williston Basin,
Canada-USA”, Journal of Geochemical Exploitation. pp. 69-70.
Pitman, Janet K., Price, Leigh C., LeFever, Julie A., 2001: “Diagnosis and Fracture Development in the
Bakken Formation, Williston Basin: Implications for Reservoir Quality in the Middle Member,” U.S.
Geological Survey Professional Paper 1653, pp 3-10.
LeFever, J. and Helms, L. 2010: “Bakken Formation Reserves Estimates”, Report prepared by the North
Dakota Department of Mineral Resources, Bismarck, North Dakota
Pitman, J.K., Price, L.C., and Lefever, J.A., 2001: “Diagenesis and Fracture Development in the Bakken
Formation, Williston Basin: Implications for Reservoir Quality in the Middle Member,” U.S. Geological
Survey Professional Paper 1653. pp. 14-15.
Masalmesh, S.K., 2002: “The Effect of Wettability on Saturation Functions and Impact on Carbonate
Reservoirs in the Middle East,” SPE paper 78515 presented at the SPE 10th International Petroleum
Exhibition and Conference. Abu Dhabi, October 13-16.
Phillips, Z.D., Halverson, R.J., Stranss, S.R. et al, 2007: “A Case Study in the Bakken Formation: Changes
to Hydraulic Fracture Stimulation Treatment Result in Improved Oil Production and Reduced Treatment
Costs,” SPE paper 108045 presented at the SPE Rocky Mountain Oil & Gas Tech. Symp., Denver,
Colorado, USA. April 16-18.
Puerto, M.C., Hirasaki, G.J., Miller, C.A. and Barnes, J.R., 2012: “Surfactant Systems for EOR in High
Temperature, High Salinities Environment,” SPE JOURNAL, March, 17(1), pp. 11-19.
Sharma G. and Mohanty K.K., 2011: “Wettability Alteration in High Temperature and High Salinity
Carbonate”, SPE paper 147306 presented at the SPE Annual Technical Conference and Exhibition, Oct. 31
– Nov.2, Denver, Colorado, USA.
Shuler, P., Tang, H., Lu, Z., and Tang, Y., 2011: “Chemical Process for Improved Oil Recovery from
Bakken Shale,” SPE paper 147531 presented at the Canadian Unconventional Resources Conference,
Calgary, Alberta, Canada. Nov. 15 – 17,
Solairaj, S., Britton, C., Lu, J., Kim, D.H., et al, 2012: “New Correlation to Predict the Optimum Surfactant
Structure for EOR,” SPE paper 154262, presented at SPE/DOE Symposium on Improvement Oil Recovery,
Tulsa, OK. Ap.. 14-18.
Tang, G.Q., Firoozabadi, A., 2002: “Relative Permeability Modification in Gas/Liquid System through
Wettability Alteration to Intermediate Gas Wetting,” SPE Reservoir Eval. & Eng. December. pp: 427-436.
Wade, W.H., Morgan, J.C., Schechter, R.S., Jacobson, J.K., Salager, J.L, 1978: “Interfacial Tension and
Phase behavior of Surfactant System,” SPE JOURNAL, August, 18(4), pp. 242-252.
Wang, D.M., Butler, R., Liu, H. and Ahmed, S., 2011(a): “Flow Rate Behavior and Imbibition in Shale,”
SPE Reservoir Engineering & Evaluation, August, 14(4), pp.505-512.
Wang, D.M., Butler, R., Liu, H. and Ahmed, S., 2011(b):"Surfactant Formulation Study for Bakken Shale
Imbibition," SPE paper 145510 was presented at the 2011 SPE Annual Technical Conference and
Exhibition (ATCE) to be held in in Denver, Colorado, Oct. 30 – Nov. 2.

Final Report, University of North Dakota, 09123-09 Page 43
Wang, D.M., Butler, R., Ahmed, S. and Liu, H., 2012: “Wettability Survey in Bakken Shale Using
Surfactant Imbibition,” SPE 1538583, SPE Reservoir Evaluation & Engineering, December, 15(6), pp.
695-705.
Winsor, P.A., 1954: “Solvent Properties of Amphiphilic Compounds,” Butterworths Scientific Publ. Ltd.,
London. 1. Aufl. IX, 270 S., gebd. 40 s
SI Metric Conversion Factors
cp × 1.0* E-03 = Pas
ft × 3.048* E-01 = m
in. × 2.54* E+00 = cm
md × 9.869 233 E-04 = m2
g/L × 0.1 E+00 = % TDS
mg/L × 0.0001 E+00 = % TDS
* Conversion is exact

Final Report, University of North Dakota, 09123-09 Page 44
Fig. 1 — Part of core photos of well #16433 between 10613 t 10649 ft
Fig. 1 — Partial core slabs of Well #16433
Fig.2 —Clay flake at brine water, 23°C
Fig. 2 — Clay flaking with brine water at 23°C

Final Report, University of North Dakota, 09123-09 Page 45
Fig. 3 — Temperature stability of surfactant samples before and after 105°C aging with
30 %TDS -1
Fig. 4 — Temperature stability of surfactant samples before and after 105°C aging with 30 %TDS -2
Fig. 5 — C-1 alone aging at 23°C Fig. 6 — C-1 after 30% alcohol added aging for 15 days

Final Report, University of North Dakota, 09123-09 Page 46
Fig.7 — 58N with 30% TDS aging at 110°C for 15 days Fig.8 — 17A before and after 0.1% alkaline added aging at 110°C after 7 days
Fig.9 (a) and (b) — Aging at 110°C and 30 %TDS before and after 50 days
Fig. 10 — Temperature vs. oil recovery (30 %TDS, 0.1 % surfactant concentration and 5% divalent cation content)
0
10
20
30
40
50
60
70
80
60 90 105 120
Oil r
ec
ove
ry fa
cto
r, %
Temperature, C
17A, 30 wt%
58N, 30 wt%
S2, 30 wt%

Final Report, University of North Dakota, 09123-09 Page 47
Fig. 11 — Temperature vs. oil recovery (15 %TDS, 0.1 % surfactant concentration and 5% divalent cation content)
Fig. 12— Solution salinity vs. oil recovery (90°C, 0.1% surfactant concentration, and 5% divalent content)
0
10
20
30
40
50
60
60 90 105 120
Oil r
ec
ove
ry fa
cto
r, %
Temperature, C
17A,15 wt%
58N,15 wt%
S2,15 wt%
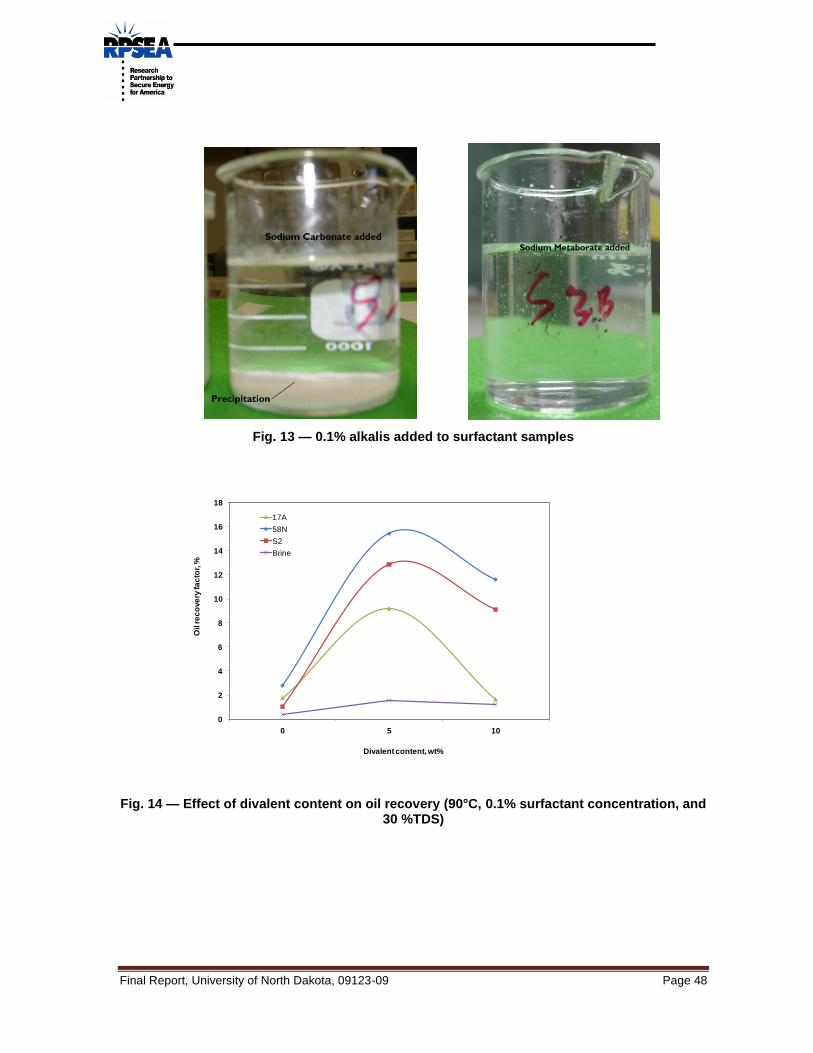
Final Report, University of North Dakota, 09123-09 Page 48
Fig. 13 — 0.1% alkalis added to surfactant samples
Fig. 14 — Effect of divalent content on oil recovery (90°C, 0.1% surfactant concentration, and
30 %TDS)
0
2
4
6
8
10
12
14
16
18
0 5 10
Oil r
ec
ove
ry fa
cto
r, %
Divalent content, wt%
17A
58N
S2
Brine

Final Report, University of North Dakota, 09123-09 Page 49
Fig. 15 — Effect of surfactant concentration on oil recovery Fig. 16 — 0.2% concentration of 17A
Fig. 17 — Co-surfactant aged before and after 50 days and 17 days (right) at 110°C
Fig. 18—Forced injection illustration for Method MB
0
2
4
6
8
10
12
14
16
18
20
0 0.05 0.1 0.15 0.2 0.25
Oil
Reco
very
, %
Surfactant concentration, %
17A
58N
S2

Final Report, University of North Dakota, 09123-09 Page 50
Fig. 19—Scheme for spontaneous imbibition and forced injection by Method MC
Fig. 20—Scheme for spontaneous imbibition and forced injection by Method MD with
Hassler cell
Fig. 21—Core sample location and well log curves for Well #16433

Final Report, University of North Dakota, 09123-09 Page 51
Fig. 22—Core sample location and well log curves for Well #16771
Fig. 23—Core sample location and well log curves for Well #17450

Final Report, University of North Dakota, 09123-09 Page 52
Fig. 24a — Phase behavior of S-2 at 23°C Fig. 24b —Vo/Vs and Vw/Vs of S-2 at 23°C
Fig. 25 — Phase behavior of S-2 at 120°C
0
5
10
15
20
25
30
0 7.5 15
Vo
/VS,
Vw
/Vs
Salinity, % TDS
Vo/VS-23°C
Vw/Vs-23°C
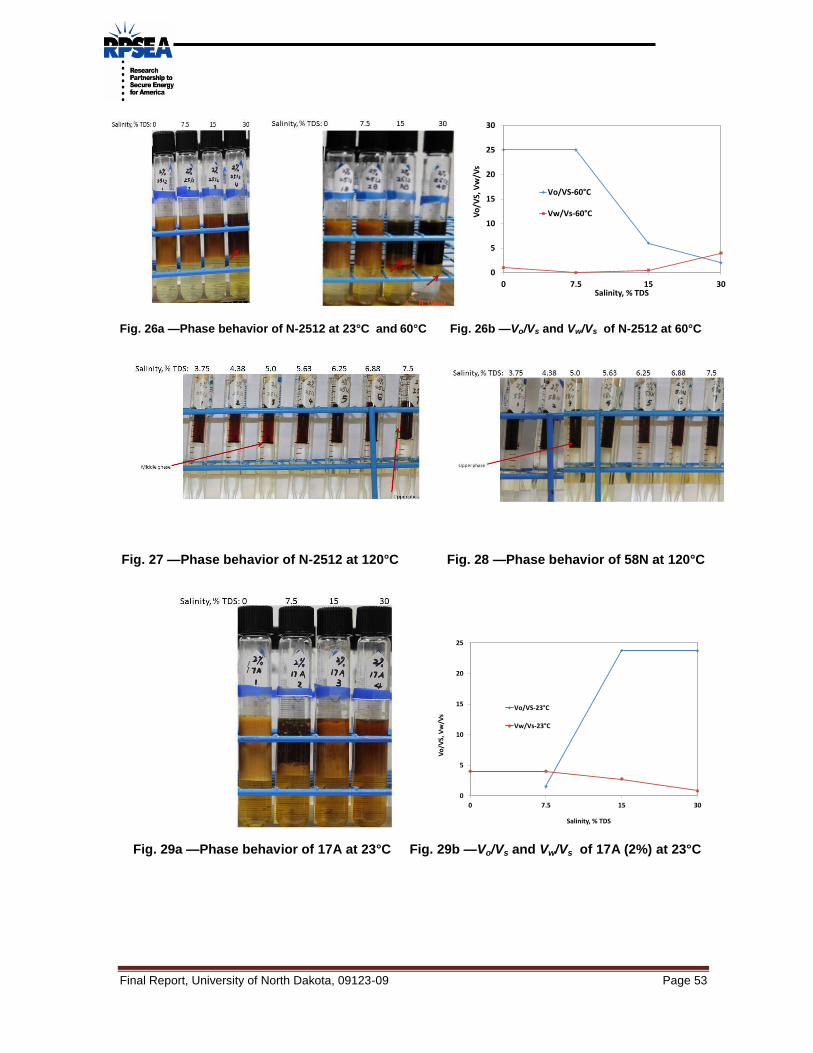
Final Report, University of North Dakota, 09123-09 Page 53
Fig. 26a —Phase behavior of N-2512 at 23°C and 60°C Fig. 26b —Vo/Vs and Vw/Vs of N-2512 at 60°C
Fig. 27 —Phase behavior of N-2512 at 120°C Fig. 28 —Phase behavior of 58N at 120°C
Fig. 29a —Phase behavior of 17A at 23°C Fig. 29b —Vo/Vs and Vw/Vs of 17A (2%) at 23°C
0
5
10
15
20
25
30
0 7.5 15 30
Vo
/VS,
Vw
/Vs
Salinity, % TDS
Vo/VS-60°C
Vw/Vs-60°C
0
5
10
15
20
25
0 7.5 15 30
Vo
/VS,
Vw
/Vs
Salinity, % TDS
Vo/VS-23°C
Vw/Vs-23°C

Final Report, University of North Dakota, 09123-09 Page 54
Fig. 30a (left) and b (right) —Phase behavior of 17A at 90°C (0~30% TDS)
Fig. 31 —Phase behavior of TA-15 at 90°C (0~30% TDS)
Fig. 32 —Phase behavior of TA-15 at 120°C

Final Report, University of North Dakota, 09123-09 Page 55
Fig. 33 —IFT vs. salinity of surfactants at 90°C
Fig. 34(a) — IFT reduction of N-2512 at three temperatures
0.008
0.04
0.2
1
5
0 5 10 15 20 25 30
IFT,
mN
/m
Salinity, % TDS
TA-15 + 0.1% alkaline
S-2
17A
N-2512+ 0.1% alkaline
0.008
0.04
0.2
1
5
0 5 10 15 20 25 30
IFT, m
N/m
Salinity, % TDS
90 C:N-2512+ 0.1% alkaline30 C:N-2512+ 0.1% alkaline60 C:N-2512+ 0.1% alkaline

Final Report, University of North Dakota, 09123-09 Page 56
Fig. 34(b) — IFT reduction of S-2 at three temperatures
Fig. 34(C) — IFT reduction of TA-15 at three temperatures
0.04
0.2
1
5
0 5 10 15 20 25 30
IFT, m
N/m
Salinity, % TDS
90 C:S-2 60 C:S-2 30 C:S-2
0.2
1
5
0 5 10 15 20 25 30
IFT,
mN
/m
Salinity, % TDS
90 C:TA-15 + 0.1% alkaline
60 C:TA-15 + 0.1% alkaline
30 C:TA-15 + 0.1% alkaline
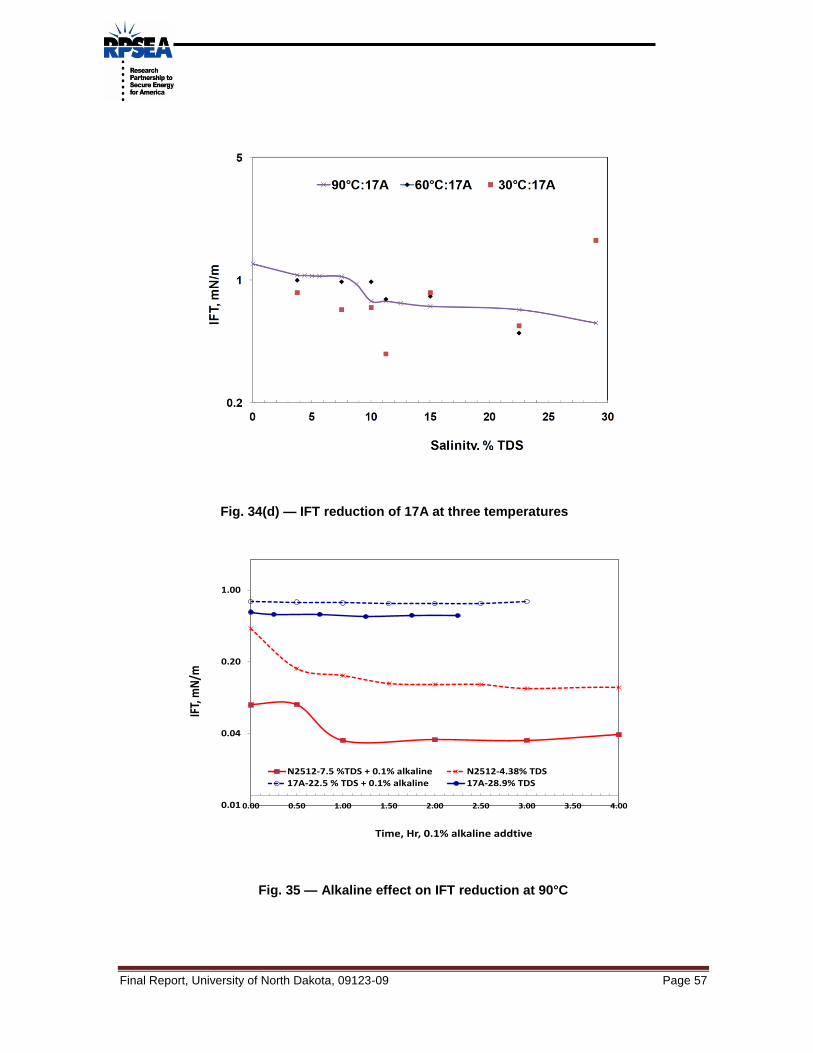
Final Report, University of North Dakota, 09123-09 Page 57
Fig. 34(d) — IFT reduction of 17A at three temperatures
Fig. 35 — Alkaline effect on IFT reduction at 90°C
0.01
0.04
0.20
1.00
0.00 0.50 1.00 1.50 2.00 2.50 3.00 3.50 4.00
IFT,
mN
/m
Time, Hr, 0.1% alkaline addtive
N2512-7.5 %TDS + 0.1% alkaline N2512-4.38% TDS17A-22.5 % TDS + 0.1% alkaline 17A-28.9% TDS

Final Report, University of North Dakota, 09123-09 Page 58
Fig. 36 —Oil recovery at optimal salinity at 120°C vs. (a) time(left) and (b) dimensionless time(right)
Fig. 37 —Oil recovery comparison at optimal salinity and formation water salinity at 120°C
0
10
20
30
40
50
60
70
0 50 100 150 200 250 300 350 400 450 500
Oil
re
co
ve
ry f
acto
r o
f O
OIP
, %
Time, Hr
TA-15-0.1%
17A-0.1%
N-2512-0.1%
17A-0.1%-alkaline
N2512-0.1%-alkaline
TA15-0.1% alkaline- 12.5% TDS-All faces open
58N-0.1%-All faces open
S2-0.1%-All faces open
S2-2%
0
10
20
30
40
50
60
70
1 10 100 1000 10000
Oil
reco
very
facto
r o
f O
OIP
, %
Dimensionless Time
17A-0.1%
N-2512-0.1%
TA15-0.1% alkaline- 12.5% TDS-All faces open
S2-0.1%-All faces open
17A-0.1%-alkaline
58N-0.1%-All faces open
TA-15-0.1%
0
10
20
30
40
50
60
0 50 100 150 200 250 300 350 400 450 500
Oil
reco
very
facto
r o
f O
OIP
, %
Time, Hr
TA15-0.1% alkaline- 12.5% TDS-All faces open
TA15-0.1%-alkaline-30% TDS-All faces open
YYC5-44, 0.1% alkaline-30% TDS-All faces opened
YYC5-44, 0.1% alkaline-5.62% TDS-All faces opened

Final Report, University of North Dakota, 09123-09 Page 59
Fig. 38 —Oil recovery comparison vs. boundary conditions at 120°C
Fig. 39 —Illustration of ideal simulation model
0
10
20
30
40
50
60
1 10 100 1000 10000
Oil
reco
very
facto
r o
f O
OIP
, %
Dimensionless Time
TA15-0.1% alkaline- 12.5% TDS-All faces open
S2-0.1%-All faces open
58N-0.1%-All faces open
S2-0.1%-alkaline-Two faces open
TA15-0.1%-alkaline-12.5 % TDS-Two faces open
58N-0.1%-Alkaline-Two faces open

Final Report, University of North Dakota, 09123-09 Page 60
Fig. 40 —Oil recovery comparison between surfactant formulation imbibition and brine alone
Fig. 41 —Surfactant concentration vs. oil recovery
0
5
10
15
20
25
30
35
40
45
0 0.5 1 1.5 2 2.5 3 3.5 4
CU
M O
IL (
%O
OIP
)
PV
Brine water
Surfactant fomulation
0
10
20
30
40
50
60
0 0.5 1 1.5 2 2.5 3 3.5 4
CU
M O
IL (
%O
OIP
)
PV
0.05%
0.10%
0.20%
0.50%
1%

Final Report, University of North Dakota, 09123-09 Page 61
Fig. 42 —Water salinity vs. oil recovery
Fig. 43 —Injection rate vs. oil recovery
0
10
20
30
40
50
60
0 0.5 1 1.5 2 2.5 3 3.5 4
CU
M O
IL (
%O
OIP
)
PV
30 %TDS
22.5 %TDS
18.74 % TDS
12.5 %TDS
3.75% TDS
5.62 %TDS
0
5
10
15
20
25
30
35
40
45
50
0 0.5 1 1.5 2 2.5 3 3.5 4
CU
M O
IL (
%O
OIP
)
PV
0.0052 ft3/PV
0.0155 ft3 /PV
0.052 ft3 /PV
0.1 ft3 /PV
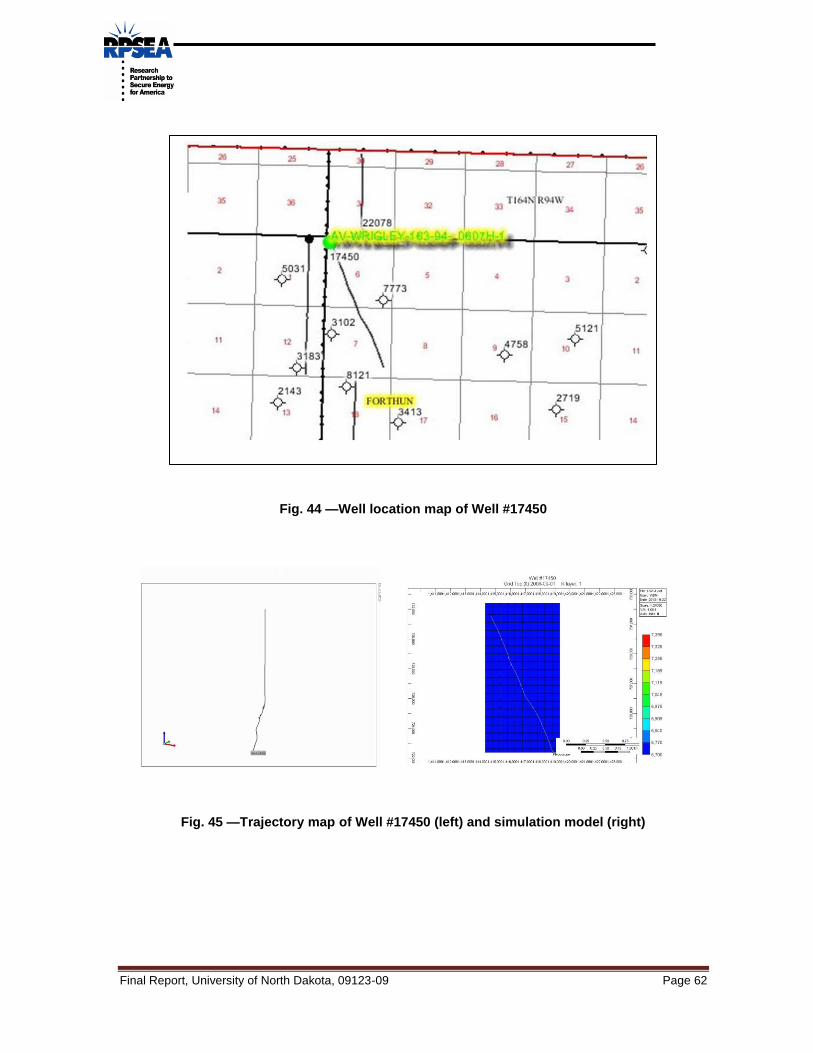
Final Report, University of North Dakota, 09123-09 Page 62
Fig. 44 —Well location map of Well #17450
Fig. 45 —Trajectory map of Well #17450 (left) and simulation model (right)
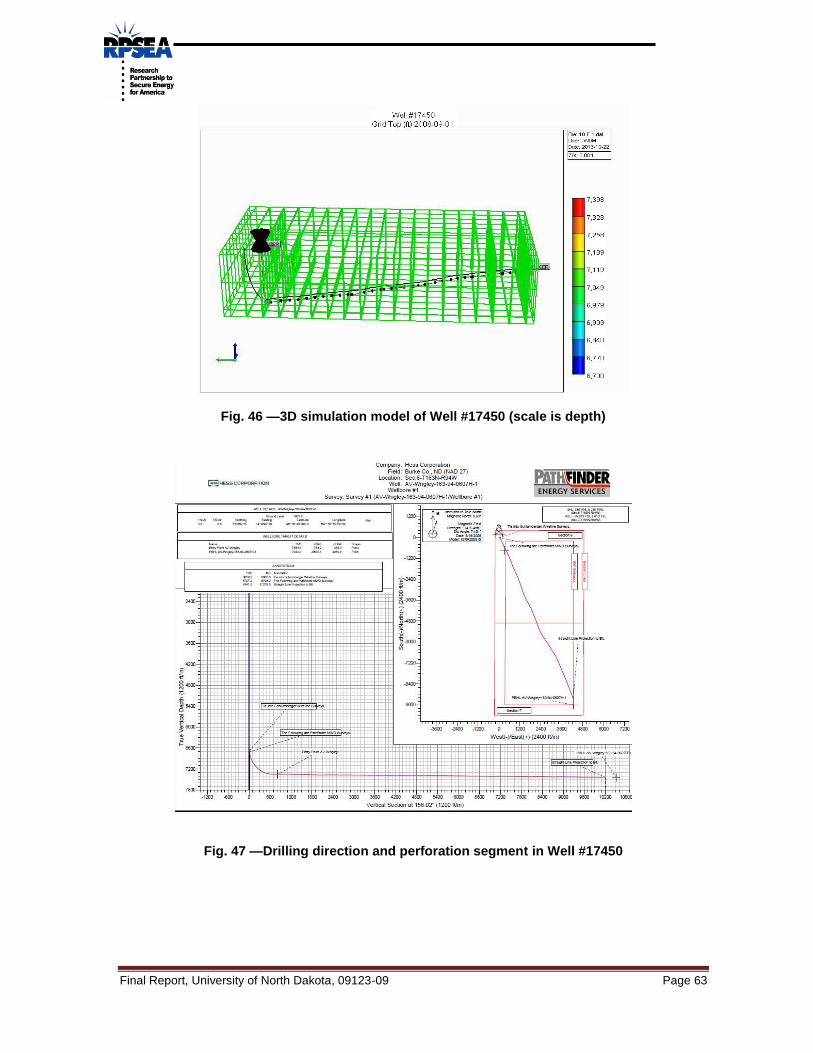
Final Report, University of North Dakota, 09123-09 Page 63
Fig. 46 —3D simulation model of Well #17450 (scale is depth)
Fig. 47 —Drilling direction and perforation segment in Well #17450
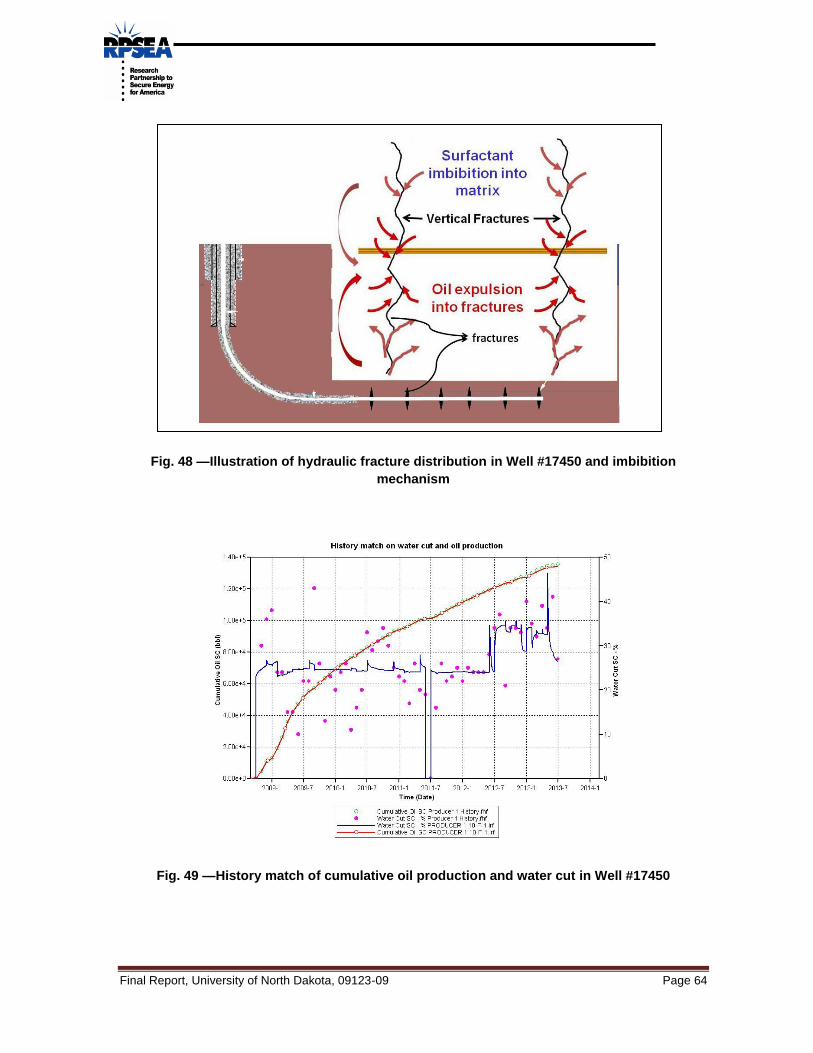
Final Report, University of North Dakota, 09123-09 Page 64
Fig. 48 —Illustration of hydraulic fracture distribution in Well #17450 and imbibition
mechanism
Fig. 49 —History match of cumulative oil production and water cut in Well #17450

Final Report, University of North Dakota, 09123-09 Page 65
Fig. 50 — Oil recovery effectiveness prediction for aqueous liquid imbibition in Well #17450
Fig. 51 —Production sequence effect on oil recovery
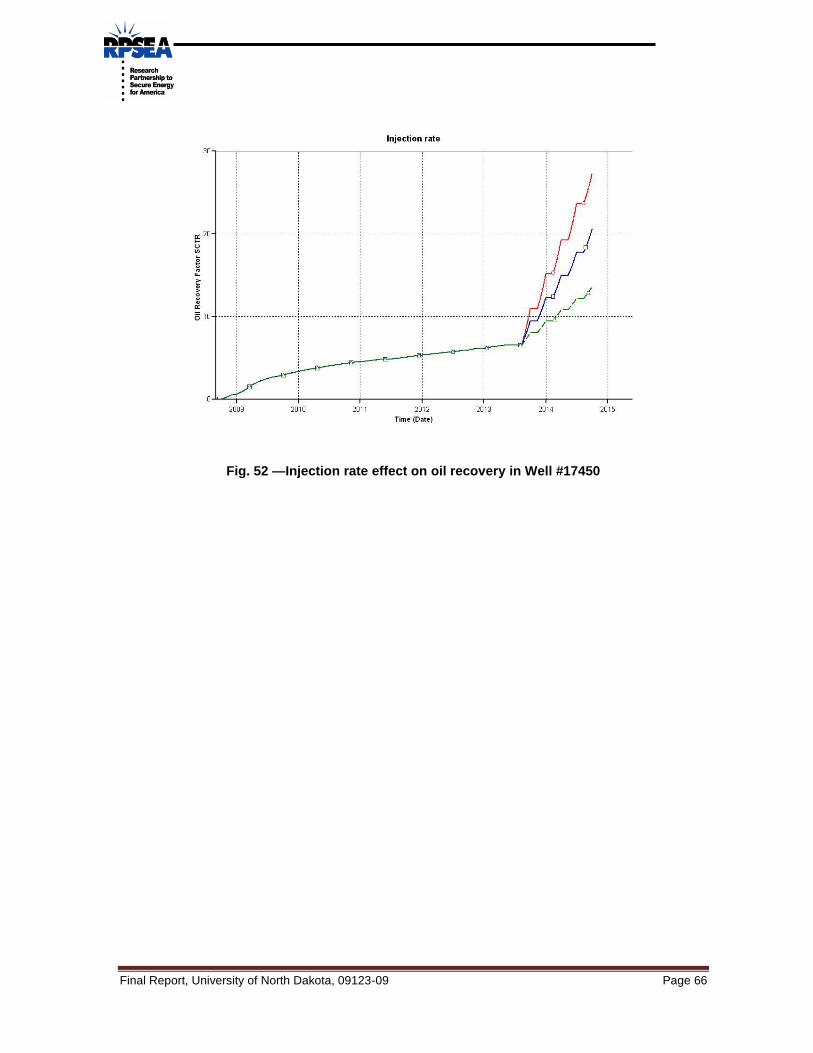
Final Report, University of North Dakota, 09123-09 Page 66
Fig. 52 —Injection rate effect on oil recovery in Well #17450