RPHC4 Population Size
102
THE REPUBLIC OF RWANDA Fourth Population and Housing Census, Rwanda, 2012 Thematic Report Population size, structure and distribution NATIONAL INSTITUTE OF STATISTICS OF RWANDA
-
Upload
bernard-palmer -
Category
Documents
-
view
115 -
download
3
description
Statistics
Transcript of RPHC4 Population Size
i
THE REPUBLIC OF RWANDA
Fo
urt
h P
op
ula
tion
an
d H
ou
sin
g C
en
sus,
Rw
an
da
, 2
012
Thematic Report
Population size,
structure and
distribution
NATIONAL INSTITUTE OF STATISTICS OF RWANDA

ii

iii
Ministry of Finance and Economic Planning
National Institute of Statistics of Rwanda
Fourth Population and Housing Census, Rwanda, 2012
Thematic Report
Population size, structure and distribution
January 2014
THE REPUBLIC OF RWANDA
iv
The Fourth Rwanda Population and Housing Census (2012 RPHC) was implemented by the National
Institute of Statistics of Rwanda (NISR). Field work was conducted from August 16th to 30
th, 2012. The
funding for the RPHC was provided by the Government of Rwanda, World Bank (WB), the UKAID
(Former DFID), European Union (EU), One UN, United Nations Population Fund (UNFPA), United
Nations Development Programme (UNDP), United Nations Children's Fund (UNICEF) and UN Women.
Additional information about the 2012 RPHC may be obtained from the NISR:
P.O. Box 6139, Kigali, Rwanda; Telephone: (250) 252 571 035
E-mail: [email protected]; Website: http://www.statistics.gov.rw.
Recommended citation:
National Institute of Statistics of Rwanda (NISR), Ministry of Finance and Economic Planning
(MINECOFIN) [Rwanda], 2012. Rwanda Fourth Population and Housing Census.
Thematic Report: Population size, structure and distribution
v
Table of contents
Table of contents ..................................................................................................................... v
List of tables ............................................................................................................................vii
List of abbreviations ................................................................................................................ix
Foreword…………………………………………………………………………………………………xi
Acknowledgements…………………………………………………………………………………..xiii
Executive summary .................................................................................................................xi
Chapter 1: Overview of the Fourth Rwanda Population and Housing Census .................... 1
1.1 Context and justification .................................................................................................... 1
1.2 Legal and institutional frameworks .................................................................................... 1
1.3 Census phases ................................................................................................................. 2
Chapter 2: Context and objectives ......................................................................................... 3
2.1 Background ...................................................................................................................... 3
2.2 Objectives ......................................................................................................................... 3
2.3 Definitions and concepts ................................................................................................... 4
Chapter 3: Enumerated and resident population: size, evolution, type of household and
spatial distribution ............................................................................................................ 6
3.1 Enumerated population by residence status ..................................................................... 6
3.2 Enumerated population by type of household and residence status.................................. 6
3.3 Evolution of the resident population, 1978–2012 .............................................................. 7
3.4 Resident population by type of household ........................................................................ 7
3.4.1 Private households and their corresponding population ............................................. 8
3.5 Resident population by sex and area of residence ............................................................ 9
3.6 Resident population by provinces an District ...................................................................11
3.7 Population density ...........................................................................................................14
3.7.1 Physical population density .......................................................................................14
3.7.2 Physiological density .................................................................................................16
Chapter 4: Age-sex structure of the population ...................................................................19
4.1 Resident population by five-year age group .....................................................................19
4.2 Pyramids for the urban and rural populations, 2012 .........................................................20
4.3 Sex ratio ..........................................................................................................................21

vi
4.4 Mean and median age of population ................................................................................23
4.4.1 Mean and median ages by provinces ........................................................................23
4.4.2 Mean and median ages by district .............................................................................24
4.5 Age dependency ratio ......................................................................................................25
4.6 Age groups of specific significance ..................................................................................27
Chapter 5: Nationality of resident population .......................................................................28
Conclusion ..............................................................................................................................30
References ..............................................................................................................................31
Annex A Census objectives, methodology and data quality assessment ..........................32
Annex B Census questionnaire ...........................................................................................38
B.1 Private households: person record ..................................................................................39
B.2 Private households: household record and mortality record ............................................43
B.3 Institutional households: person record ...........................................................................44
Annex C Glossary of key terms and definitions .................................................................48
Annex D Supplementary tables ...........................................................................................56
Annex E Sector-level tables ...................................................................................................69
vii
List of tables
Table 1: De Jure and De Facto populations by sex and province .................................................6
Table 2 : Enumerated population by type of household and residence status by sex .....................7
Table 3: Evolution between 1978 and 2012 of the size of the resident population and annual
growth rates by sex ........................................................................................................7
Table 4: Resident population by type of household, sex and area of residence..............................8
Table 5: Private households and their corresponding population and household size by area of
residence .......................................................................................................................8
Table 6 :Evolution between 1978 and 2012 of the number of private households and Intercensal
annual growth rates by area of residence .......................................................................8
Table 7: Resident population by sex and area of residence ...........................................................9
Table 8 : Size and percentage of the population living in urban and in rural areas by Province and
District .......................................................................................................................... 10
Table 9: Resident Population by sex and Area of residence, by Province .................................... 11
Table 10: Distribution of the resident Population by Province and by District ............................... 12
Table 11: Size and Percentage of the population living in urban and in rural areas by sex,
Province and District .................................................................................................... 13
Table 12: Distribution of sectors by population size interval, and population by sex ..................... 14
Table 13: Population density of Rwanda in 2012 by Province and District .................................... 15
Table 14 : Physiological population density by Province and District ............................................ 17
Table 15: Resident population by sex, age and area of residence ............................................... 19
Table 16 : Sex ratios of the resident population by five-year age group ....................................... 22
Table 17: Mean and median ages of the resident population by sex, province and area of
residence ..................................................................................................................... 23
Table 18:Mean and median ages of the resident population by sex, province and district ............ 24
Table 19: Age dependency ratio (national age limits) by province and area of residence ............. 25
Table 20: Age dependency ratio (international age limits) by province and area of residence ...... 26
Table 21: Number and percentage of population of age groups with a specific significance by sex27
Table 22: Resident population by sex, nationality, and area of residence..................................... 28
Table 23: Foreign population by province, district and area of residence ..................................... 29
viii
List of Figures
Figure 1: Percentage of people living in urban and rural areas by province ...............................11
Figure 2: Trends in population density, 1978-2012 ....................................................................16
Figure 3: Population Density of Rwanda by District in 2012 .....................................................18
Figure 4 : Five-year age/sex distribution of the resident population ...........................................20
Figure 5 : Five-year age/ sex distribution of the resident population in rural and urban areas....21
Figure 6: Sex ratio of the resident population ............................................................................22
Figure 7: Age dependency ratio (national age limits) by sector .................................................26
ix
List of abbreviations
CTC Census Technical Committee
DRC Democratic Republic of Congo
EDPRS Economic Development and Poverty Reduction Strategy
GoR Government of Rwanda
ICPD-PoA International Conference on Population and Development – Programme of Action
ISCO International Standard Classification of Occupations
ISIC International Standard Industrial Classification
MDGs Millennium Development Goals
MINECOFIN Ministry of Finance and Economic Planning
MINALOC Ministry of Local Government
MINAFFET Ministry of Foreign Affairs and Cooperation
MINEDUC Ministry of Education
NEPAD New Partnership for Africa’s Development
NISR National Institute of Statistics of Rwanda
RPHC4 Fourth Rwandan Population and Housing Census
UN United Nations

x
xi

xii
xiii

xiv
xv
Executive summary
The Fourth Rwanda Population and Housing Census (RPHC4) establish that the population of
Rwanda is 10,515,973 residents, of which 52% are women and 48% men. Since the 2002
Census, the population has increased by 2.4 million, which represents an average annual
growth rate of 2.6%. Thus, population growth has recovered its long-term rate following the
decline in the 1990s, which were marked by the war and the genocide against the Tutsi. During
this prior period (i.e. 1991–2002), annual growth fell to 1.2%.
The population of Rwanda is still largely rural, with 83% living in rural areas.
There are some clear differences among the provinces. The Eastern Province is the most
populated with 2,595,703 inhabitants, followed by the Southern Province with 2,589,975
inhabitants. The Northern Province has 1,726,370 residents and the Western Province
2,471,239, while Kigali City has the smallest population with 1,132,686 inhabitants. Gasabo
district is the most populated with more than 500,000 inhabitants and the least populated is
Nyarugenge district, which has less than 300,000 inhabitants.
The majority of the population of Rwanda lives in private households with an average size of 4.3
persons. Households are a bit smaller in urban areas, with 4.0 persons.
The population density in 2012 was 415 inhabitants per square kilometer. Compared to
neighbouring countries: Burundi (333), Uganda (173) or Kenya (73), Rwanda is the highest
densely populated county in the region. It was only 183 persons per sq. km in 1978, and 321 in
2002. In general, urban districts have the highest densities of population, in particular the
districts of Nyarugenge 2,124 inhabitants/ km2, Kicukiro (1,911 inhabitants/ km2), Gasabo (1,234
inhabitants/km2), and Rubavu (1,039 inhabitants/km2 ), and those with the lowest density are
Bugesera (280 inhabitants/ km2), Gatsibo (274 inhabitants/km2 ), Nyagatare (242
inhabitants/km2 ), Kayonza (178 inhabitants/ km2 ).
The population of Rwanda is young, with one in two persons being under 19 years old. People
aged 65 and above account for only 3% of the resident population. This has consequences in
that the demographic dependency ratio, measuring the number of potential dependent persons
per 100 persons of productive age, is 93 at national level. In other words, in Rwanda every 100
persons of an economically active age are theoretically expected to be responsible for 93
persons of inactive age. Urban areas have more young adults than rural ones, and thus the
dependency ratio is only 67 compared to 100 in rural areas. 42% of the population living in rural
areas is under 15 compared to only 35% in urban areas. On the contrary, urban areas attract
more young adults, presumably for studies or work: 34% of the urban population is aged
between 20 and 34, compared to 24% of the population in rural areas.
The mean age of the population of Rwanda is 22.7 years. The mean age of females is higher
than that of males (23.5 vs. 21.9). At the provincial level, the Southern Province and Northern
xvi
Province have the highest mean ages.
The distribution of the resident population by nationality shows that 99% of the populations are
Rwandan. The next most represented nationality in Rwanda is the Democratic Republic of
Congo (DRC) with 61,106 persons, followed by Burundi with 14,205, and Uganda with 4,395
persons. Most of the immigrants live in rural areas (68% of nationals from the DRC and 79% of
nationals from Burundi), although over two-thirds of Ugandan nationals live in urban areas.
1
Chapter 1: Overview of the Fourth Rwanda Population and
Housing Census
1.1 Context and justification
The history of the Population and Housing Census in Rwanda dates back to the 1970s. To date,
four modern censuses have successfully been conducted in Rwanda, in 1978, 1991, 2002 and
2012.
The 2002 Census collected a number of demographic and socio-economic characteristics and
indicated a total population of 8,128,553 people. Following the United Nations Decennial
Census Program, the 2012 Census is the Fourth Rwanda Population and Housing Census
(RPHC4). It indicates that the country now has a total population of 10,515,973 people.
Besides the endorsement of recommendations from major international conferences held under
the auspices of the United Nations, the Government of Rwanda (GoR) has been focusing since
2000 on the long-term Vision 2020 that aims at transforming Rwanda into a middle-income
country. This is being implemented through the medium-term planning framework of the
Economic Development and Poverty Reduction Strategy (EDPRS) for successive five-year
periods. The measurement of progress in implementing the EDPRS and the various UN
recommendations calls for the availability of demographic and socio-economic statistical data to
inform the selected indicators at different levels.
The RPHC4 is a reliable and comprehensive source of data, which compared to other official
statistics data sources (administrative data, surveys, etc.) allows for disaggregation to the
lowest geographical level.
The RPHC4 was undertaken to update the national mapping and demographic databases, to
provide indicators for monitoring poverty reduction strategies and achievement of international
development goals (MDGs, ICPD-PoA, NEPAD, etc.) and to strengthen the technical capacity of
the National Institute of Statistics of Rwanda (NISR).
A more detailed discussion of the long- and short-term objectives of the Census is presented in
Annex A of this report.
1.2 Legal and institutional frameworks
As an essential precondition for Census execution, the legalization of its operations was
secured by a Presidential Decree officially establishing and determining the administrative
organization of the Census. In addition, a Ministerial Order of the Minister of Finance and
Economic Planning has set forth the official and statutory requirements for Census activities.
2
The institutional framework set up for implementing the RPHC4 consists of three main bodies:
the National Census Commission (NCC), the Census Technical Committee (CTC) and the
decentralized branches of the NCC at province and district levels.
In order to ensure focused functioning during the whole period of Census execution, a Census
Unit was created within the NISR, as an executing unit, and benefiting from other financial,
logistical and technical support services from the NISR.
1.3 Census phases
Following the preparatory phase of the Census, which consisted of the production of the project
documents, schedule and Census budget, the following technical activities were undertaken:
Census mapping;
A Pilot Census;
Questionnaire and manual development;
Census publicity and sensitization campaign;
Recruitment and training of field staff;
Census enumeration; and
Post-enumeration activities.
Further details on all Census phases can be found in Annex A of this report.
The success of the RPHC4 is attributable largely to the rigorous pre-Census planning and
robust Census enumeration monitoring undertaken by the NISR as well as the remarkable
support received from the Government and people of Rwanda and the generous technical and
financial assistance given by international development partners.

3
Chapter 2: Context and objectives
2.1 Background
The knowledge of the size of the population and its distribution by age and over the territory are
key elements for decision-making in a country.
Population size and its evolution allow analyse the dynamic of the population and its
components that are fertility and migration. With an annual growth rate of 2.6%, Rwanda is
among the most dynamic countries in the world, and slightly above the average of African
countries. However, the trend of the annual growth rate is decreasing, due to decreasing fertility.
Historically, the population of the territory settled in areas safe and sufficiently irrigated, such as
the region between the Nyabarongo and its tributaries (i.e. the Central Plateau highlands on the
northwest side of Lake Kivu). These regions accounted for three-quarters of the population in
the 1950s and were characterised by high densities, the absence of endemic diseases affecting
humans and livestock (malaria, trypanosomiasis, etc.).
This report presents the distribution of the population throughout the territory in order to identify
disparities in the population on one hand and the differential demographic changes by
administrative entity on the other hand. The comparative study of the evolution of populations
from 1978, 1991, 2002 and 2012 censuses is not possible at province/district level because of
different administrative reforms held in the country over time. Analysis of the age structure of the
population is essential to understand and answer the needs of the population in terms of
education, health, employment and other socio-cultural needs. The population of Rwanda is
young, with one in two persons being under 19 years old.
2.2 Objectives
The objectives of this thematic report are as follows:
• Present the size of the population;
• Describe the evolution of the population between 1978 and 2012;
• Analyse the population distribution according to residence status and type of
household;
• Analyse the population structure by sex and age;
• Analyse the spatial and urban/rural distribution of the population;
• Calculate population density; and
• Describe the distribution of the population by nationality.
4
2.3 Definitions and concepts
In order to enable readers to understand the results presented in this report, along with the
accompanying interpretation, some key concepts used throughout are defined in this section. A
wider glossary of terms and definitions is provided in Annex C.
Census night/reference night
This refers to the night of the 15th leading to 16 August 2012, i.e. the night preceding the
commencement of the Census enumeration. All information collected during the two-week
enumeration period (from 16 to 30 August 2012) refers to this reference night irrespective of the
day the enumerator visited a specific household.
Resident status
Residents: persons who have lived for more than six months in the place where they were
enumerated or who intended to live for more than six months in that place. They represent the
population usually living in a place. Residents could be:
Present residents: present in their place of usual residence on the reference night; or
Absent residents: not present in their place of usual residence on the reference night. The
person must be absent for a period shorter than or equal to six months.
Visitors: persons who were not usual residents of the household. They might be residents in
another place in Rwanda, and thus absent residents in that place, or non-residents of the
country, for example tourists present at the moment of the Census.
Population
De facto population (present residents + visitors): includes all persons physically present in the
country or area at the reference date.
De jure population (present residents + absent residents): includes all usual residents of the
given country or area, whether or not they were physically present in the area at the reference
date. The de jure population is also referred to as the resident population. Most of the analysis
presented here is based on the de jure population.
Population density
Population density is a measurement of population per area unit, such as the number of
inhabitants per such area unit, which may be square kilometre, hectare or acre. In this report,
two definitions of population density have been used: physical density, which considers the
population divided by the total surface of the territory, including inland waters and physiological

5
density, which considers the population divided by the land area excluding inland waters, that is
to say the area actually available for population settlements.
Private household:
In this PHC, a Private Household consists of one or more persons living together and sharing at
least one daily meal. Persons in a private household may or may not be related, or may
constitute a combination of persons both related and unrelated.
Institutional household:
In this PHC, an Institutional Household comprises a group of persons who are being provided
with institutionalized care, and includes educational institutions, health care institutions, military
institutions, religious institutions, or institutions for the elderly or persons with disabilities. In the
RPHC4, persons who were homeless on the night of the Census were also classified as
belonging to an institutional household.
Sex ratio
The number of males per 100 females in the population. A sex ratio of 100 would imply that
there are as many males as females.
Average annual growth rate
The average intercensal annual growth rate of a population represents the average annual rate
of change in that population between two censuses. It is usually calculated using the following
formula, which represents the geometric growth rate:
r = [(Pt/P0)
1/t – 1]*100, where
Pt = Population at the most recent census
P0 = Population at a previous census
t = Interval between the two censuses (in years)
r = Average annual growth rate
6
Chapter 3: Enumerated and resident population: size,
evolution, type of household and spatial
distribution
3.1 Enumerated population by residence status
This section presents the distribution of the population enumerated in the census by residence
status: residents (present or absent at the time of the census), and visitors (persons present at
the time of the census who were not usual residents of the household).
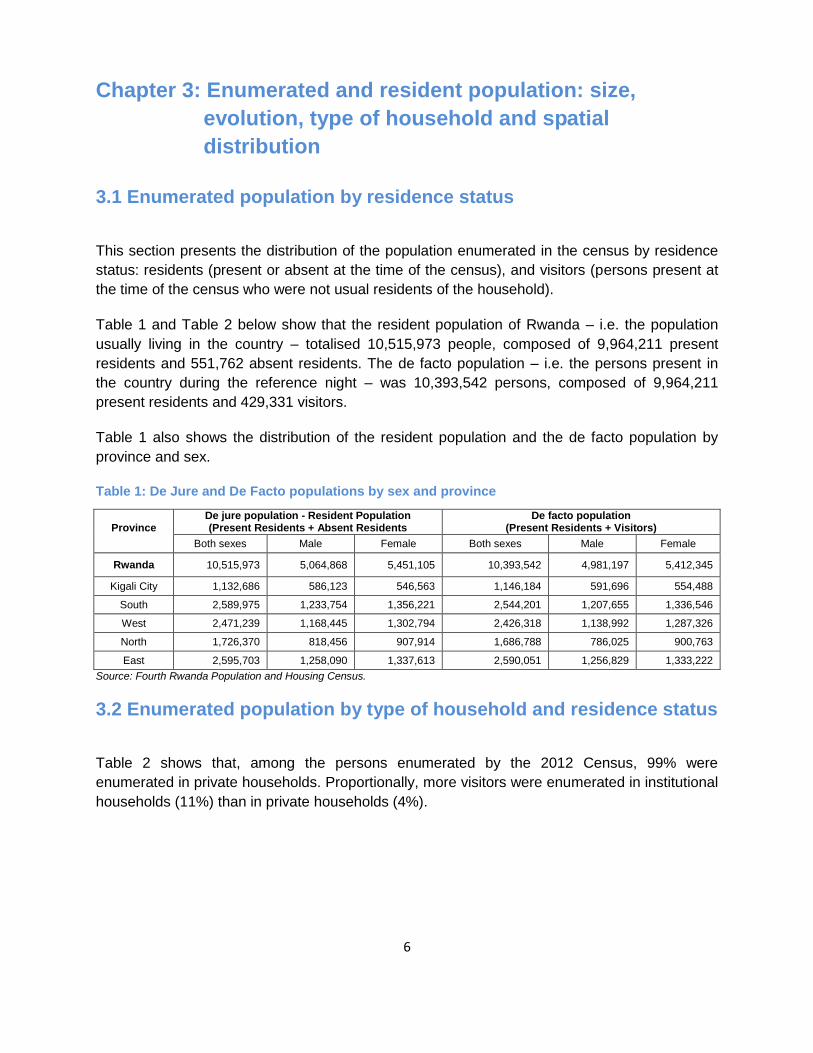
Table 1 and Table 2 below show that the resident population of Rwanda – i.e. the population
usually living in the country – totalised 10,515,973 people, composed of 9,964,211 present
residents and 551,762 absent residents. The de facto population – i.e. the persons present in
the country during the reference night – was 10,393,542 persons, composed of 9,964,211
present residents and 429,331 visitors.
Table 1 also shows the distribution of the resident population and the de facto population by
province and sex.
Table 1: De Jure and De Facto populations by sex and province
Province
De jure population - Resident Population (Present Residents + Absent Residents
De facto population (Present Residents + Visitors)
Both sexes Male Female Both sexes Male Female
Rwanda 10,515,973 5,064,868 5,451,105 10,393,542 4,981,197 5,412,345
Kigali City 1,132,686 586,123 546,563 1,146,184 591,696 554,488
South 2,589,975 1,233,754 1,356,221 2,544,201 1,207,655 1,336,546
West 2,471,239 1,168,445 1,302,794 2,426,318 1,138,992 1,287,326
North 1,726,370 818,456 907,914 1,686,788 786,025 900,763
East 2,595,703 1,258,090 1,337,613 2,590,051 1,256,829 1,333,222
Source: Fourth Rwanda Population and Housing Census.
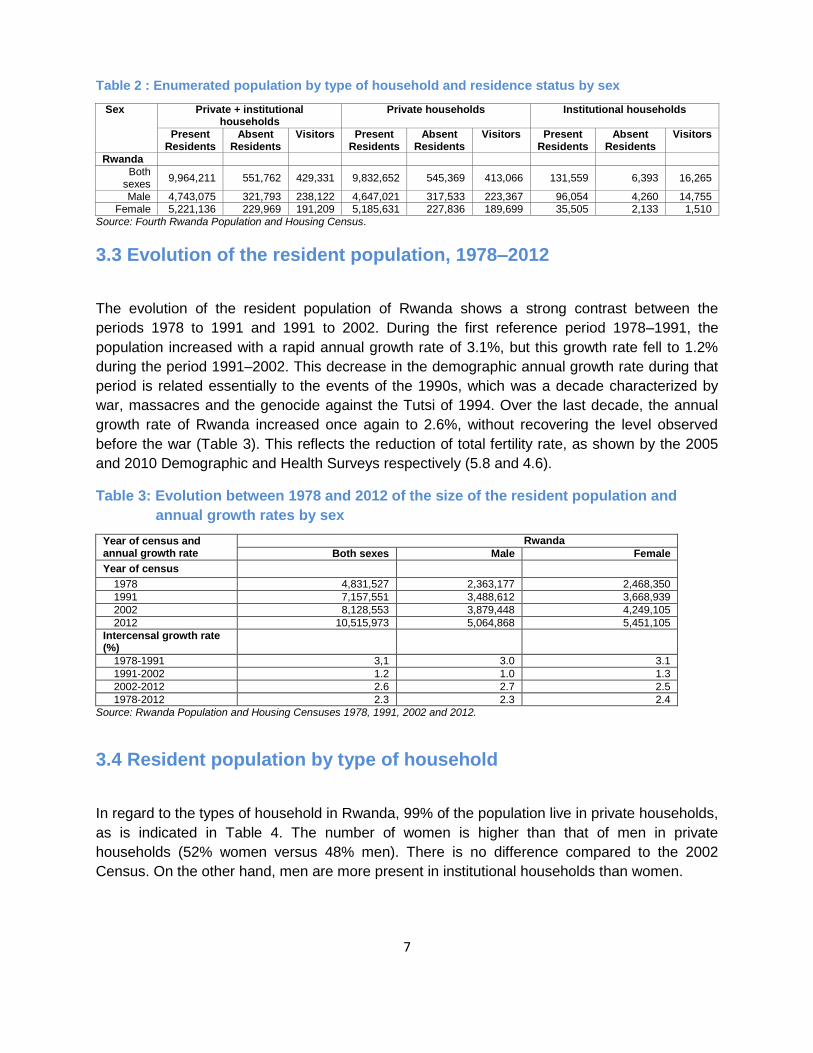
3.2 Enumerated population by type of household and residence status
Table 2 shows that, among the persons enumerated by the 2012 Census, 99% were
enumerated in private households. Proportionally, more visitors were enumerated in institutional
households (11%) than in private households (4%).
7
Table 2 : Enumerated population by type of household and residence status by sex
Sex Private + institutional households
Private households Institutional households
Present Residents
Absent Residents
Visitors Present Residents
Absent Residents
Visitors Present Residents
Absent Residents
Visitors
Rwanda Both
sexes 9,964,211 551,762 429,331 9,832,652 545,369 413,066 131,559 6,393 16,265
Male 4,743,075 321,793 238,122 4,647,021 317,533 223,367 96,054 4,260 14,755 Female 5,221,136 229,969 191,209 5,185,631 227,836 189,699 35,505 2,133 1,510
Source: Fourth Rwanda Population and Housing Census.
3.3 Evolution of the resident population, 1978–2012
The evolution of the resident population of Rwanda shows a strong contrast between the
periods 1978 to 1991 and 1991 to 2002. During the first reference period 1978–1991, the
population increased with a rapid annual growth rate of 3.1%, but this growth rate fell to 1.2%
during the period 1991–2002. This decrease in the demographic annual growth rate during that
period is related essentially to the events of the 1990s, which was a decade characterized by
war, massacres and the genocide against the Tutsi of 1994. Over the last decade, the annual
growth rate of Rwanda increased once again to 2.6%, without recovering the level observed
before the war (Table 3). This reflects the reduction of total fertility rate, as shown by the 2005
and 2010 Demographic and Health Surveys respectively (5.8 and 4.6).
Table 3: Evolution between 1978 and 2012 of the size of the resident population and
annual growth rates by sex
Year of census and annual growth rate
Rwanda Both sexes Male Female
Year of census 1978 4,831,527 2,363,177 2,468,350 1991 7,157,551 3,488,612 3,668,939 2002 8,128,553 3,879,448 4,249,105 2012 10,515,973 5,064,868 5,451,105
Intercensal growth rate (%)
1978-1991 3,1 3.0 3.1 1991-2002 1.2 1.0 1.3 2002-2012 2.6 2.7 2.5 1978-2012 2.3 2.3 2.4
Source: Rwanda Population and Housing Censuses 1978, 1991, 2002 and 2012.
3.4 Resident population by type of household
In regard to the types of household in Rwanda, 99% of the population live in private households,
as is indicated in Table 4. The number of women is higher than that of men in private
households (52% women versus 48% men). There is no difference compared to the 2002
Census. On the other hand, men are more present in institutional households than women.
8
Table 4: Resident population by type of household, sex and area of residence
Area of residence and Sex
Type of household
Private + Institutional households Private households Institutional households
Rwanda
Both sexes 10,515,973 10,378,021 137,952 Male 5,064,868 4,964,554 100,314 Female 5,451,105 5,413,467 37,638
Urban
Both sexes 1,737,684 1,678,786 58,898
Male 891,806 845,177 46,629 Female 845,878 833,609 12,269
Rural
Both sexes 8,778,289 8,699,235 79,054 Male 4,173,062 4,119,377 53,685 Female 4,605,227 4,579,858 25,369
Source: Fourth Rwanda Population and Housing Census.
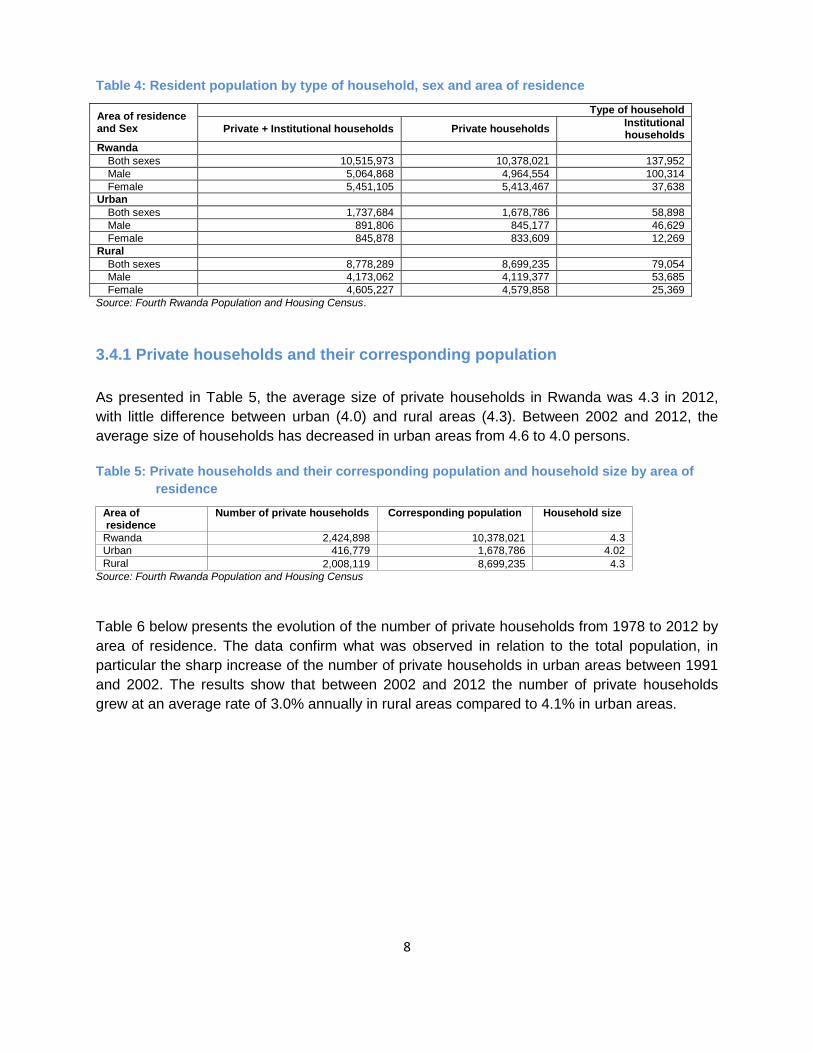
3.4.1 Private households and their corresponding population
As presented in Table 5, the average size of private households in Rwanda was 4.3 in 2012,
with little difference between urban (4.0) and rural areas (4.3). Between 2002 and 2012, the
average size of households has decreased in urban areas from 4.6 to 4.0 persons.
Table 5: Private households and their corresponding population and household size by area of
residence
Area of residence
Number of private households Corresponding population Household size
Rwanda 2,424,898 10,378,021 4.3 Urban 416,779 1,678,786 4.02 Rural 2,008,119 8,699,235 4.3
Source: Fourth Rwanda Population and Housing Census
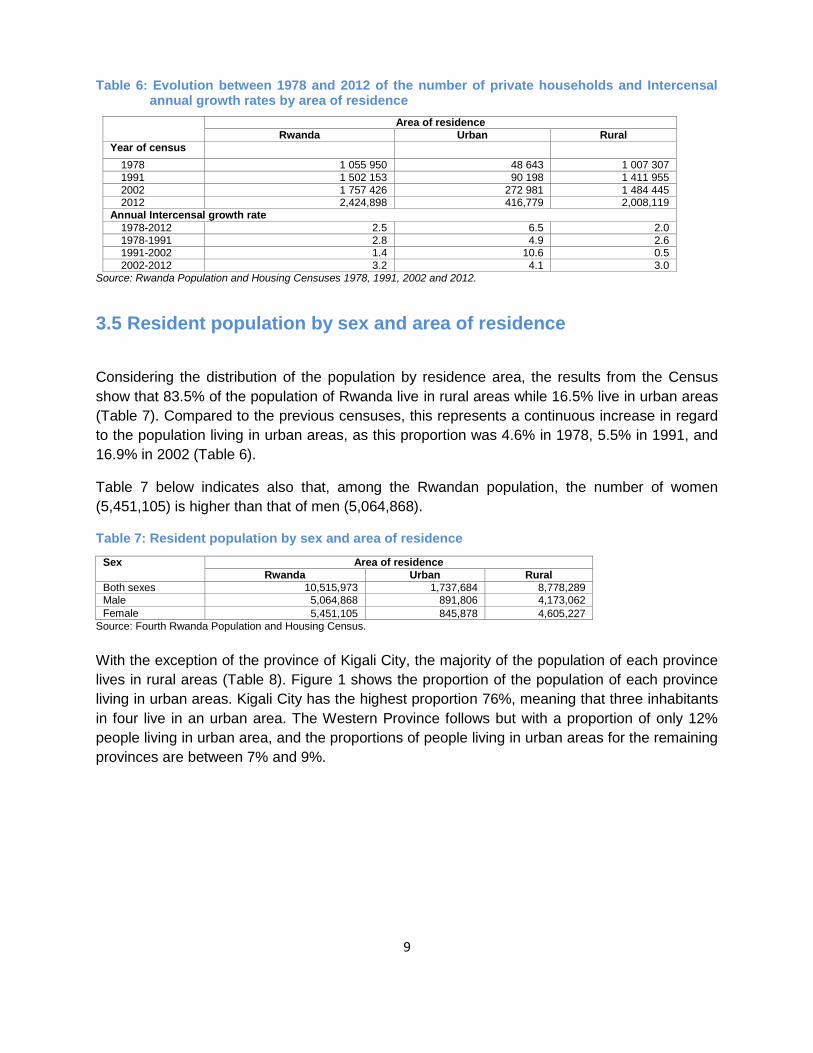
Table 6 below presents the evolution of the number of private households from 1978 to 2012 by
area of residence. The data confirm what was observed in relation to the total population, in
particular the sharp increase of the number of private households in urban areas between 1991
and 2002. The results show that between 2002 and 2012 the number of private households
grew at an average rate of 3.0% annually in rural areas compared to 4.1% in urban areas.
9
Table 6: Evolution between 1978 and 2012 of the number of private households and Intercensal annual growth rates by area of residence
Area of residence Rwanda Urban Rural
Year of census 1978 1 055 950 48 643 1 007 307 1991 1 502 153 90 198 1 411 955 2002 1 757 426 272 981 1 484 445 2012 2,424,898 416,779 2,008,119
Annual Intercensal growth rate 1978-2012 2.5 6.5 2.0 1978-1991 2.8 4.9 2.6 1991-2002 1.4 10.6 0.5 2002-2012 3.2 4.1 3.0
Source: Rwanda Population and Housing Censuses 1978, 1991, 2002 and 2012.
3.5 Resident population by sex and area of residence
Considering the distribution of the population by residence area, the results from the Census
show that 83.5% of the population of Rwanda live in rural areas while 16.5% live in urban areas
(Table 7). Compared to the previous censuses, this represents a continuous increase in regard
to the population living in urban areas, as this proportion was 4.6% in 1978, 5.5% in 1991, and
16.9% in 2002 (Table 6).
Table 7 below indicates also that, among the Rwandan population, the number of women
(5,451,105) is higher than that of men (5,064,868).
Table 7: Resident population by sex and area of residence
Sex Area of residence Rwanda Urban Rural
Both sexes 10,515,973 1,737,684 8,778,289 Male 5,064,868 891,806 4,173,062 Female 5,451,105 845,878 4,605,227
Source: Fourth Rwanda Population and Housing Census.
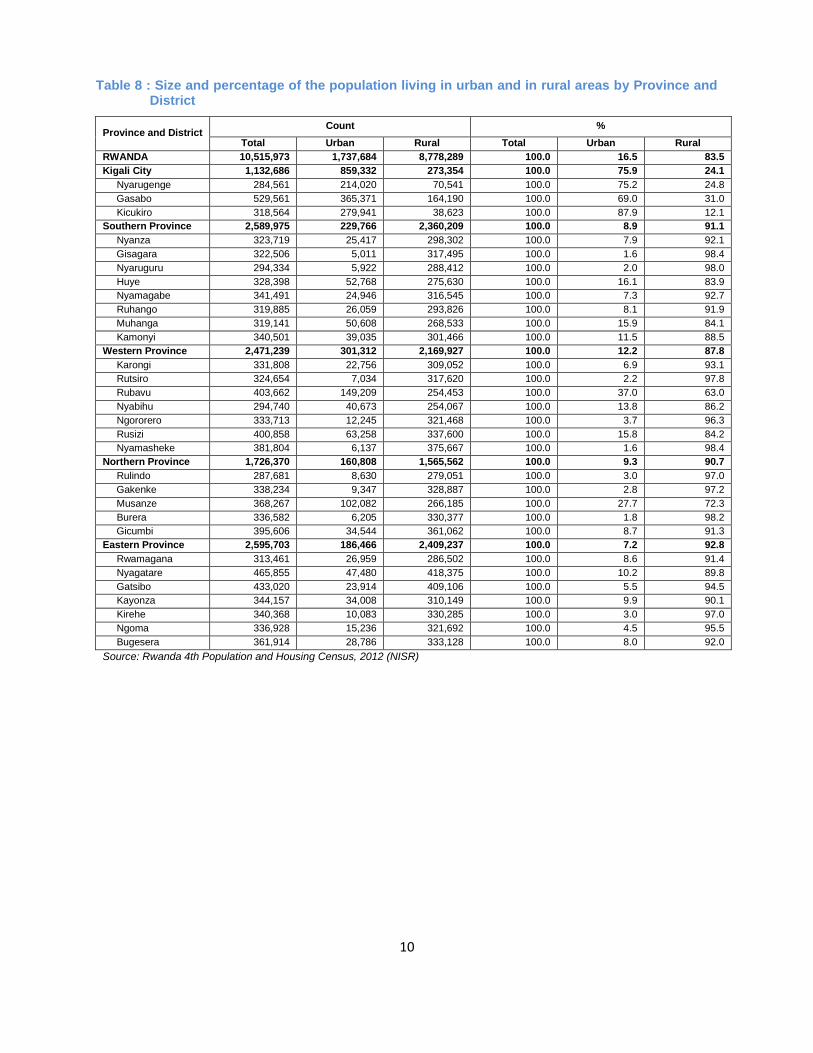
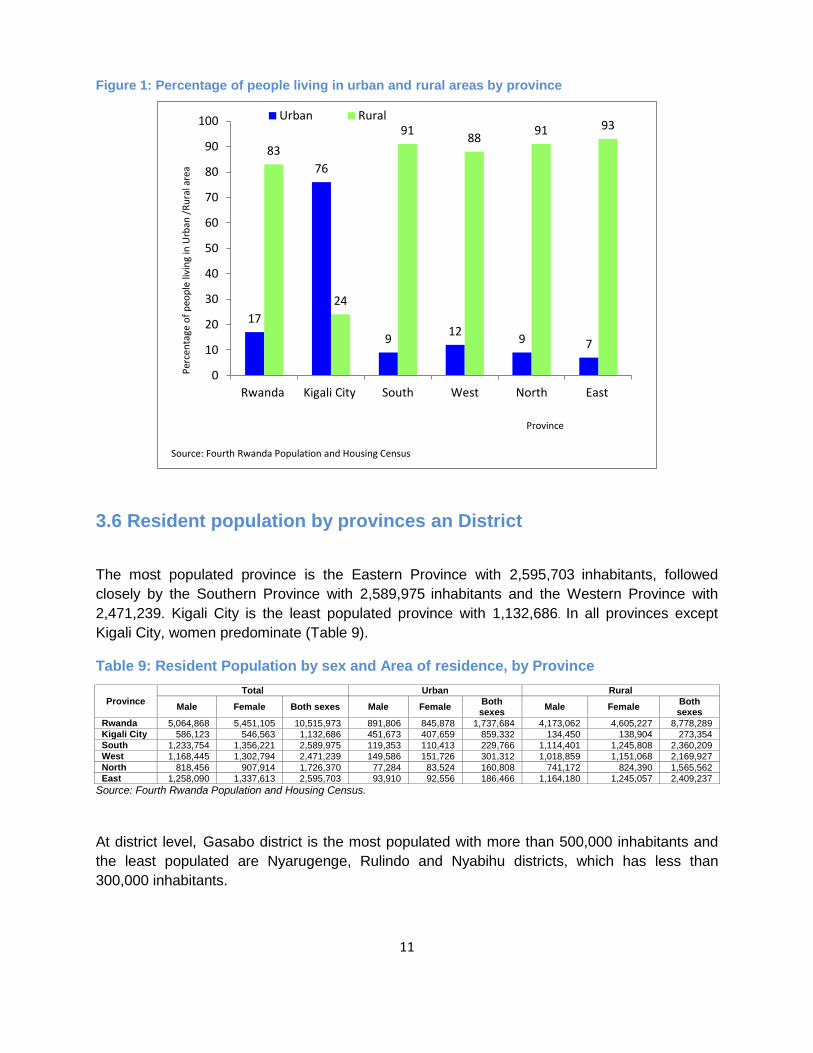
With the exception of the province of Kigali City, the majority of the population of each province
lives in rural areas (Table 8). Figure 1 shows the proportion of the population of each province
living in urban areas. Kigali City has the highest proportion 76%, meaning that three inhabitants
in four live in an urban area. The Western Province follows but with a proportion of only 12%
people living in urban area, and the proportions of people living in urban areas for the remaining
provinces are between 7% and 9%.
10
Table 8 : Size and percentage of the population living in urban and in rural areas by Province and District
Province and District Count %
Total Urban Rural Total Urban Rural
RWANDA 10,515,973 1,737,684 8,778,289 100.0 16.5 83.5
Kigali City 1,132,686 859,332 273,354 100.0 75.9 24.1
Nyarugenge 284,561 214,020 70,541 100.0 75.2 24.8
Gasabo 529,561 365,371 164,190 100.0 69.0 31.0
Kicukiro 318,564 279,941 38,623 100.0 87.9 12.1
Southern Province 2,589,975 229,766 2,360,209 100.0 8.9 91.1
Nyanza 323,719 25,417 298,302 100.0 7.9 92.1
Gisagara 322,506 5,011 317,495 100.0 1.6 98.4
Nyaruguru 294,334 5,922 288,412 100.0 2.0 98.0
Huye 328,398 52,768 275,630 100.0 16.1 83.9
Nyamagabe 341,491 24,946 316,545 100.0 7.3 92.7
Ruhango 319,885 26,059 293,826 100.0 8.1 91.9
Muhanga 319,141 50,608 268,533 100.0 15.9 84.1
Kamonyi 340,501 39,035 301,466 100.0 11.5 88.5
Western Province 2,471,239 301,312 2,169,927 100.0 12.2 87.8
Karongi 331,808 22,756 309,052 100.0 6.9 93.1
Rutsiro 324,654 7,034 317,620 100.0 2.2 97.8
Rubavu 403,662 149,209 254,453 100.0 37.0 63.0
Nyabihu 294,740 40,673 254,067 100.0 13.8 86.2
Ngororero 333,713 12,245 321,468 100.0 3.7 96.3
Rusizi 400,858 63,258 337,600 100.0 15.8 84.2
Nyamasheke 381,804 6,137 375,667 100.0 1.6 98.4
Northern Province 1,726,370 160,808 1,565,562 100.0 9.3 90.7
Rulindo 287,681 8,630 279,051 100.0 3.0 97.0
Gakenke 338,234 9,347 328,887 100.0 2.8 97.2
Musanze 368,267 102,082 266,185 100.0 27.7 72.3
Burera 336,582 6,205 330,377 100.0 1.8 98.2
Gicumbi 395,606 34,544 361,062 100.0 8.7 91.3
Eastern Province 2,595,703 186,466 2,409,237 100.0 7.2 92.8
Rwamagana 313,461 26,959 286,502 100.0 8.6 91.4
Nyagatare 465,855 47,480 418,375 100.0 10.2 89.8
Gatsibo 433,020 23,914 409,106 100.0 5.5 94.5
Kayonza 344,157 34,008 310,149 100.0 9.9 90.1
Kirehe 340,368 10,083 330,285 100.0 3.0 97.0
Ngoma 336,928 15,236 321,692 100.0 4.5 95.5
Bugesera 361,914 28,786 333,128 100.0 8.0 92.0
Source: Rwanda 4th Population and Housing Census, 2012 (NISR)
11
Figure 1: Percentage of people living in urban and rural areas by province
17
76
912
9 7
83
24
9188
91 93
0
10
20
30
40
50
60
70
80
90
100
Rwanda Kigali City South West North East
Urban Rural
Per
cen
tage
of
peo
ple
livin
g in
Urb
an /
Ru
ral a
rea
Province
Source: Fourth Rwanda Population and Housing Census
3.6 Resident population by provinces an District
The most populated province is the Eastern Province with 2,595,703 inhabitants, followed
closely by the Southern Province with 2,589,975 inhabitants and the Western Province with
2,471,239. Kigali City is the least populated province with 1,132,686. In all provinces except
Kigali City, women predominate (Table 9).
Table 9: Resident Population by sex and Area of residence, by Province
Province Total Urban Rural
Male Female Both sexes Male Female Both sexes
Male Female Both sexes
Rwanda 5,064,868 5,451,105 10,515,973 891,806 845,878 1,737,684 4,173,062 4,605,227 8,778,289 Kigali City 586,123 546,563 1,132,686 451,673 407,659 859,332 134,450 138,904 273,354 South 1,233,754 1,356,221 2,589,975 119,353 110,413 229,766 1,114,401 1,245,808 2,360,209 West 1,168,445 1,302,794 2,471,239 149,586 151,726 301,312 1,018,859 1,151,068 2,169,927
North 818,456 907,914 1,726,370 77,284 83,524 160,808 741,172 824,390 1,565,562 East 1,258,090 1,337,613 2,595,703 93,910 92,556 186,466 1,164,180 1,245,057 2,409,237
Source: Fourth Rwanda Population and Housing Census.
At district level, Gasabo district is the most populated with more than 500,000 inhabitants and
the least populated are Nyarugenge, Rulindo and Nyabihu districts, which has less than
300,000 inhabitants.
12
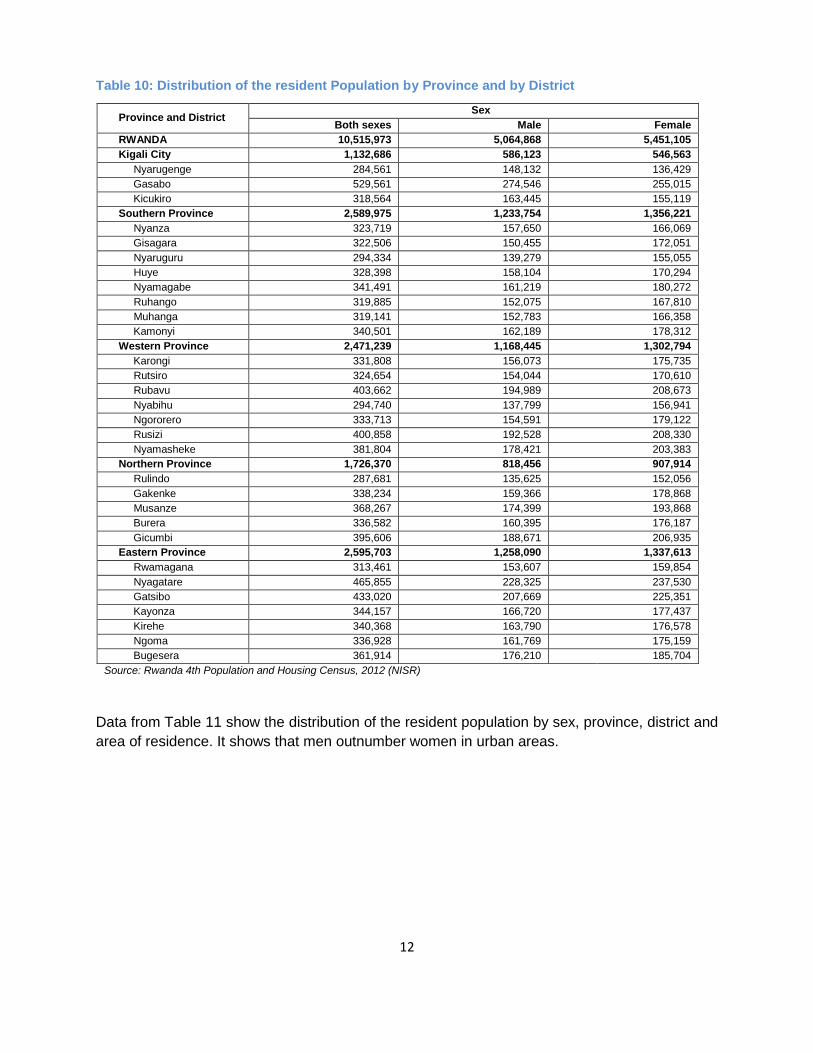
Table 10: Distribution of the resident Population by Province and by District
Province and District Sex
Both sexes Male Female
RWANDA 10,515,973 5,064,868 5,451,105
Kigali City 1,132,686 586,123 546,563
Nyarugenge 284,561 148,132 136,429
Gasabo 529,561 274,546 255,015
Kicukiro 318,564 163,445 155,119
Southern Province 2,589,975 1,233,754 1,356,221
Nyanza 323,719 157,650 166,069
Gisagara 322,506 150,455 172,051
Nyaruguru 294,334 139,279 155,055
Huye 328,398 158,104 170,294
Nyamagabe 341,491 161,219 180,272
Ruhango 319,885 152,075 167,810
Muhanga 319,141 152,783 166,358
Kamonyi 340,501 162,189 178,312
Western Province 2,471,239 1,168,445 1,302,794
Karongi 331,808 156,073 175,735
Rutsiro 324,654 154,044 170,610
Rubavu 403,662 194,989 208,673
Nyabihu 294,740 137,799 156,941
Ngororero 333,713 154,591 179,122
Rusizi 400,858 192,528 208,330
Nyamasheke 381,804 178,421 203,383
Northern Province 1,726,370 818,456 907,914
Rulindo 287,681 135,625 152,056
Gakenke 338,234 159,366 178,868
Musanze 368,267 174,399 193,868
Burera 336,582 160,395 176,187
Gicumbi 395,606 188,671 206,935
Eastern Province 2,595,703 1,258,090 1,337,613
Rwamagana 313,461 153,607 159,854
Nyagatare 465,855 228,325 237,530
Gatsibo 433,020 207,669 225,351
Kayonza 344,157 166,720 177,437
Kirehe 340,368 163,790 176,578
Ngoma 336,928 161,769 175,159
Bugesera 361,914 176,210 185,704
Source: Rwanda 4th Population and Housing Census, 2012 (NISR)
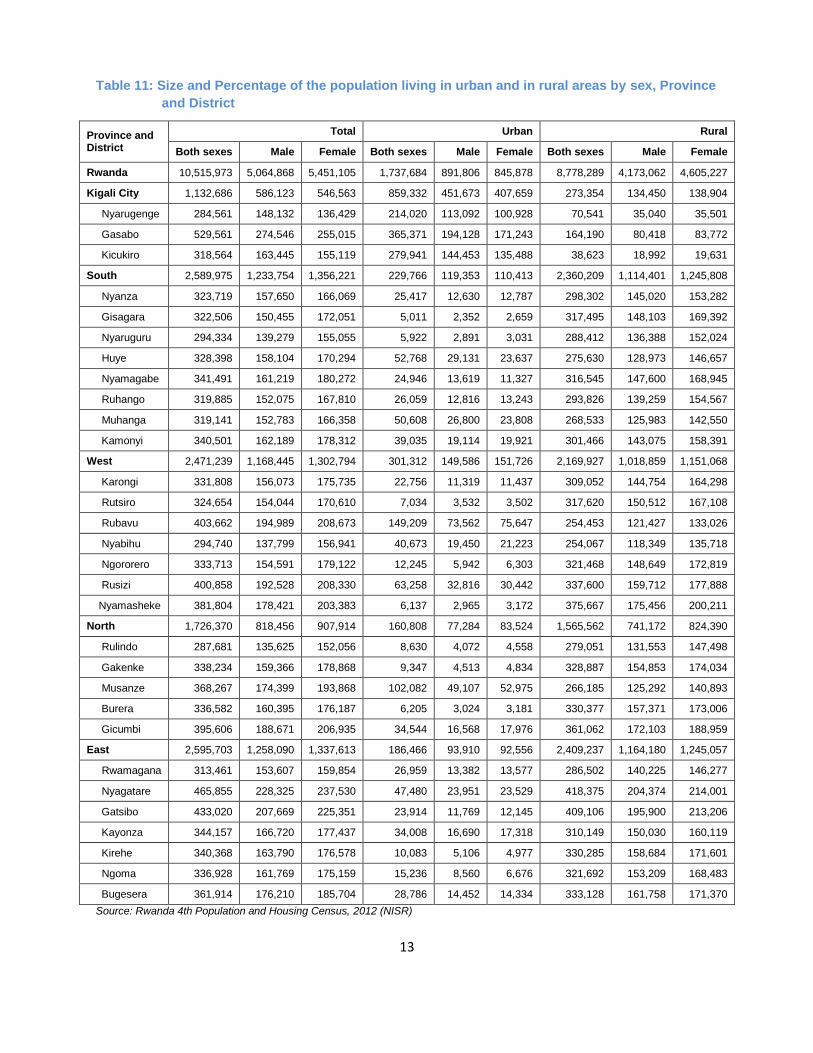
Data from Table 11 show the distribution of the resident population by sex, province, district and
area of residence. It shows that men outnumber women in urban areas.
13
Table 11: Size and Percentage of the population living in urban and in rural areas by sex, Province
and District
Province and District
Total Urban Rural
Both sexes Male Female Both sexes Male Female Both sexes Male Female
Rwanda 10,515,973 5,064,868 5,451,105 1,737,684 891,806 845,878 8,778,289 4,173,062 4,605,227
Kigali City 1,132,686 586,123 546,563 859,332 451,673 407,659 273,354 134,450 138,904
Nyarugenge 284,561 148,132 136,429 214,020 113,092 100,928 70,541 35,040 35,501
Gasabo 529,561 274,546 255,015 365,371 194,128 171,243 164,190 80,418 83,772
Kicukiro 318,564 163,445 155,119 279,941 144,453 135,488 38,623 18,992 19,631
South 2,589,975 1,233,754 1,356,221 229,766 119,353 110,413 2,360,209 1,114,401 1,245,808
Nyanza 323,719 157,650 166,069 25,417 12,630 12,787 298,302 145,020 153,282
Gisagara 322,506 150,455 172,051 5,011 2,352 2,659 317,495 148,103 169,392
Nyaruguru 294,334 139,279 155,055 5,922 2,891 3,031 288,412 136,388 152,024
Huye 328,398 158,104 170,294 52,768 29,131 23,637 275,630 128,973 146,657
Nyamagabe 341,491 161,219 180,272 24,946 13,619 11,327 316,545 147,600 168,945
Ruhango 319,885 152,075 167,810 26,059 12,816 13,243 293,826 139,259 154,567
Muhanga 319,141 152,783 166,358 50,608 26,800 23,808 268,533 125,983 142,550
Kamonyi 340,501 162,189 178,312 39,035 19,114 19,921 301,466 143,075 158,391
West 2,471,239 1,168,445 1,302,794 301,312 149,586 151,726 2,169,927 1,018,859 1,151,068
Karongi 331,808 156,073 175,735 22,756 11,319 11,437 309,052 144,754 164,298
Rutsiro 324,654 154,044 170,610 7,034 3,532 3,502 317,620 150,512 167,108
Rubavu 403,662 194,989 208,673 149,209 73,562 75,647 254,453 121,427 133,026
Nyabihu 294,740 137,799 156,941 40,673 19,450 21,223 254,067 118,349 135,718
Ngororero 333,713 154,591 179,122 12,245 5,942 6,303 321,468 148,649 172,819
Rusizi 400,858 192,528 208,330 63,258 32,816 30,442 337,600 159,712 177,888
Nyamasheke 381,804 178,421 203,383 6,137 2,965 3,172 375,667 175,456 200,211
North 1,726,370 818,456 907,914 160,808 77,284 83,524 1,565,562 741,172 824,390
Rulindo 287,681 135,625 152,056 8,630 4,072 4,558 279,051 131,553 147,498
Gakenke 338,234 159,366 178,868 9,347 4,513 4,834 328,887 154,853 174,034
Musanze 368,267 174,399 193,868 102,082 49,107 52,975 266,185 125,292 140,893
Burera 336,582 160,395 176,187 6,205 3,024 3,181 330,377 157,371 173,006
Gicumbi 395,606 188,671 206,935 34,544 16,568 17,976 361,062 172,103 188,959
East 2,595,703 1,258,090 1,337,613 186,466 93,910 92,556 2,409,237 1,164,180 1,245,057
Rwamagana 313,461 153,607 159,854 26,959 13,382 13,577 286,502 140,225 146,277
Nyagatare 465,855 228,325 237,530 47,480 23,951 23,529 418,375 204,374 214,001
Gatsibo 433,020 207,669 225,351 23,914 11,769 12,145 409,106 195,900 213,206
Kayonza 344,157 166,720 177,437 34,008 16,690 17,318 310,149 150,030 160,119
Kirehe 340,368 163,790 176,578 10,083 5,106 4,977 330,285 158,684 171,601
Ngoma 336,928 161,769 175,159 15,236 8,560 6,676 321,692 153,209 168,483
Bugesera 361,914 176,210 185,704 28,786 14,452 14,334 333,128 161,758 171,370
Source: Rwanda 4th Population and Housing Census, 2012 (NISR)
14
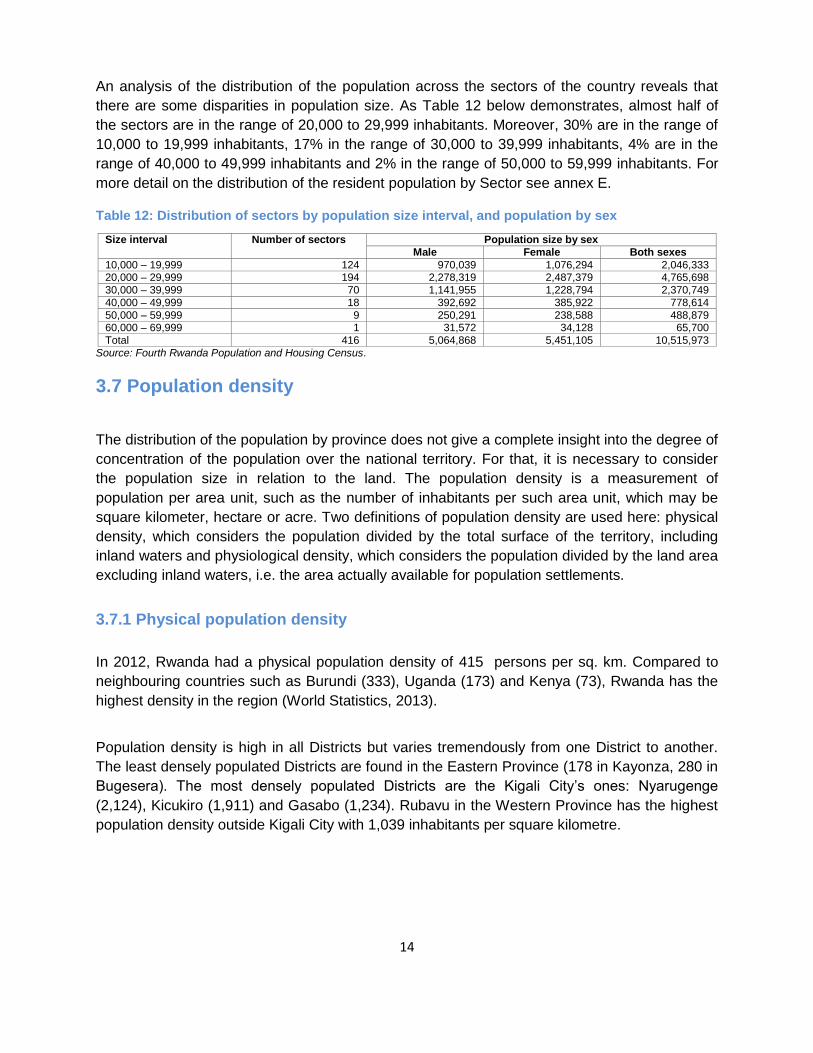
An analysis of the distribution of the population across the sectors of the country reveals that
there are some disparities in population size. As Table 12 below demonstrates, almost half of
the sectors are in the range of 20,000 to 29,999 inhabitants. Moreover, 30% are in the range of
10,000 to 19,999 inhabitants, 17% in the range of 30,000 to 39,999 inhabitants, 4% are in the
range of 40,000 to 49,999 inhabitants and 2% in the range of 50,000 to 59,999 inhabitants. For
more detail on the distribution of the resident population by Sector see annex E.
Table 12: Distribution of sectors by population size interval, and population by sex
Size interval Number of sectors Population size by sex Male Female Both sexes
10,000 – 19,999 124 970,039 1,076,294 2,046,333 20,000 – 29,999 194 2,278,319 2,487,379 4,765,698 30,000 – 39,999 70 1,141,955 1,228,794 2,370,749 40,000 – 49,999 18 392,692 385,922 778,614 50,000 – 59,999 9 250,291 238,588 488,879 60,000 – 69,999 1 31,572 34,128 65,700 Total 416 5,064,868 5,451,105 10,515,973
Source: Fourth Rwanda Population and Housing Census.
3.7 Population density
The distribution of the population by province does not give a complete insight into the degree of
concentration of the population over the national territory. For that, it is necessary to consider
the population size in relation to the land. The population density is a measurement of
population per area unit, such as the number of inhabitants per such area unit, which may be
square kilometer, hectare or acre. Two definitions of population density are used here: physical
density, which considers the population divided by the total surface of the territory, including
inland waters and physiological density, which considers the population divided by the land area
excluding inland waters, i.e. the area actually available for population settlements.
3.7.1 Physical population density
In 2012, Rwanda had a physical population density of 415 persons per sq. km. Compared to
neighbouring countries such as Burundi (333), Uganda (173) and Kenya (73), Rwanda has the
highest density in the region (World Statistics, 2013).
Population density is high in all Districts but varies tremendously from one District to another.
The least densely populated Districts are found in the Eastern Province (178 in Kayonza, 280 in
Bugesera). The most densely populated Districts are the Kigali City’s ones: Nyarugenge
(2,124), Kicukiro (1,911) and Gasabo (1,234). Rubavu in the Western Province has the highest
population density outside Kigali City with 1,039 inhabitants per square kilometre.
15
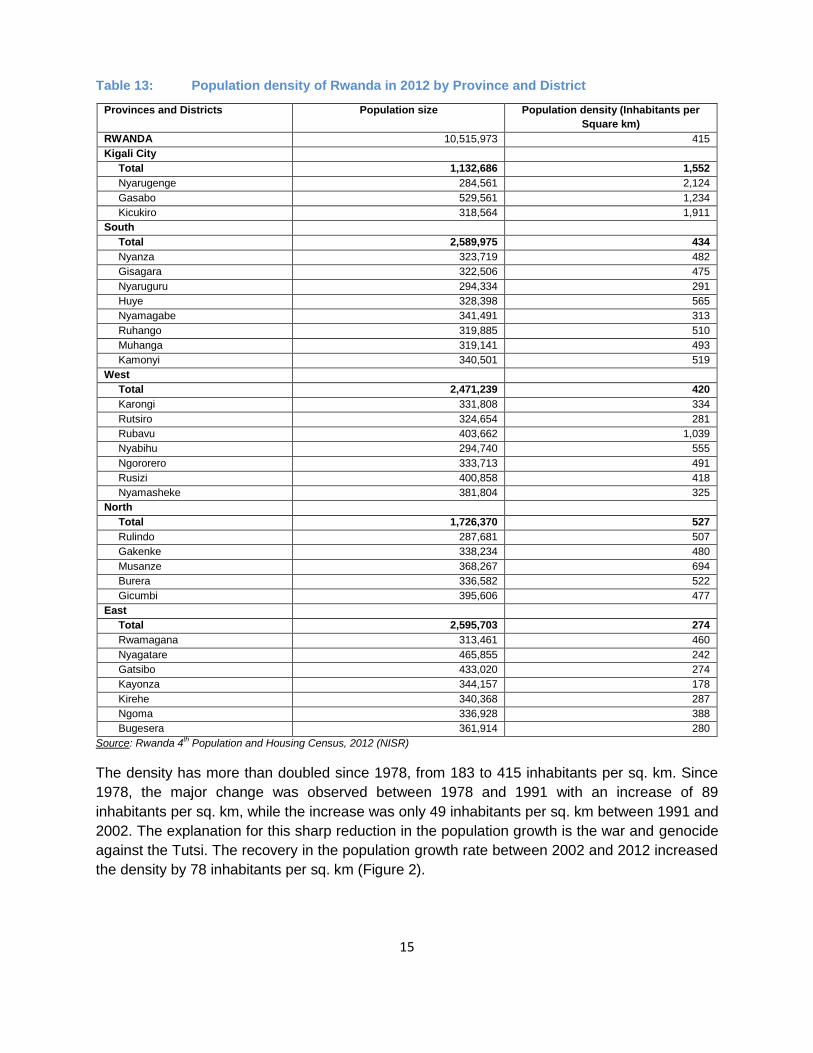
Table 13: Population density of Rwanda in 2012 by Province and District
Provinces and Districts Population size Population density (Inhabitants per
Square km)
RWANDA 10,515,973 415
Kigali City
Total 1,132,686 1,552
Nyarugenge 284,561 2,124
Gasabo 529,561 1,234
Kicukiro 318,564 1,911
South
Total 2,589,975 434
Nyanza 323,719 482
Gisagara 322,506 475
Nyaruguru 294,334 291
Huye 328,398 565
Nyamagabe 341,491 313
Ruhango 319,885 510
Muhanga 319,141 493
Kamonyi 340,501 519
West
Total 2,471,239 420
Karongi 331,808 334
Rutsiro 324,654 281
Rubavu 403,662 1,039
Nyabihu 294,740 555
Ngororero 333,713 491
Rusizi 400,858 418
Nyamasheke 381,804 325
North
Total 1,726,370 527
Rulindo 287,681 507
Gakenke 338,234 480
Musanze 368,267 694
Burera 336,582 522
Gicumbi 395,606 477
East
Total 2,595,703 274
Rwamagana 313,461 460
Nyagatare 465,855 242
Gatsibo 433,020 274
Kayonza 344,157 178
Kirehe 340,368 287
Ngoma 336,928 388
Bugesera 361,914 280
Source: Rwanda 4th Population and Housing Census, 2012 (NISR)
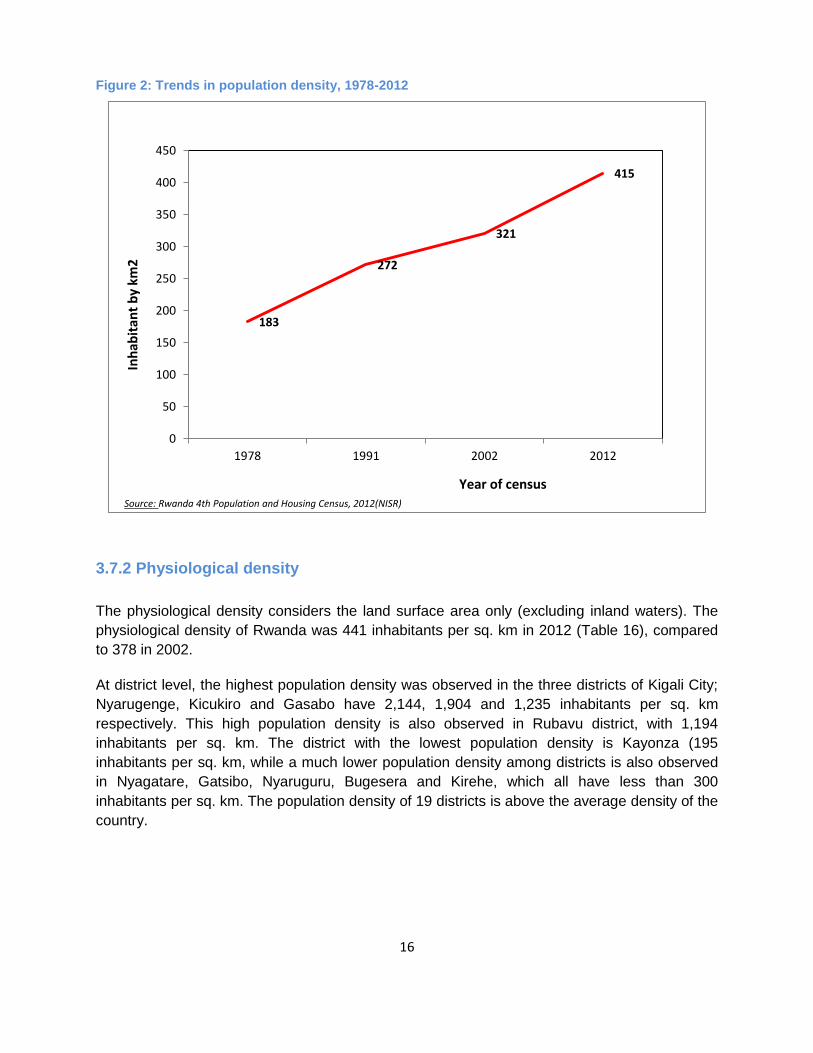
The density has more than doubled since 1978, from 183 to 415 inhabitants per sq. km. Since
1978, the major change was observed between 1978 and 1991 with an increase of 89
inhabitants per sq. km, while the increase was only 49 inhabitants per sq. km between 1991 and
2002. The explanation for this sharp reduction in the population growth is the war and genocide
against the Tutsi. The recovery in the population growth rate between 2002 and 2012 increased
the density by 78 inhabitants per sq. km (Figure 2).
16
Figure 2: Trends in population density, 1978-2012
183
272
321
415
0
50
100
150
200
250
300
350
400
450
1978 1991 2002 2012
Year of census Source: Rwanda 4th Population and Housing Census, 2012(NISR)
Inh
abit
ant
by
km2
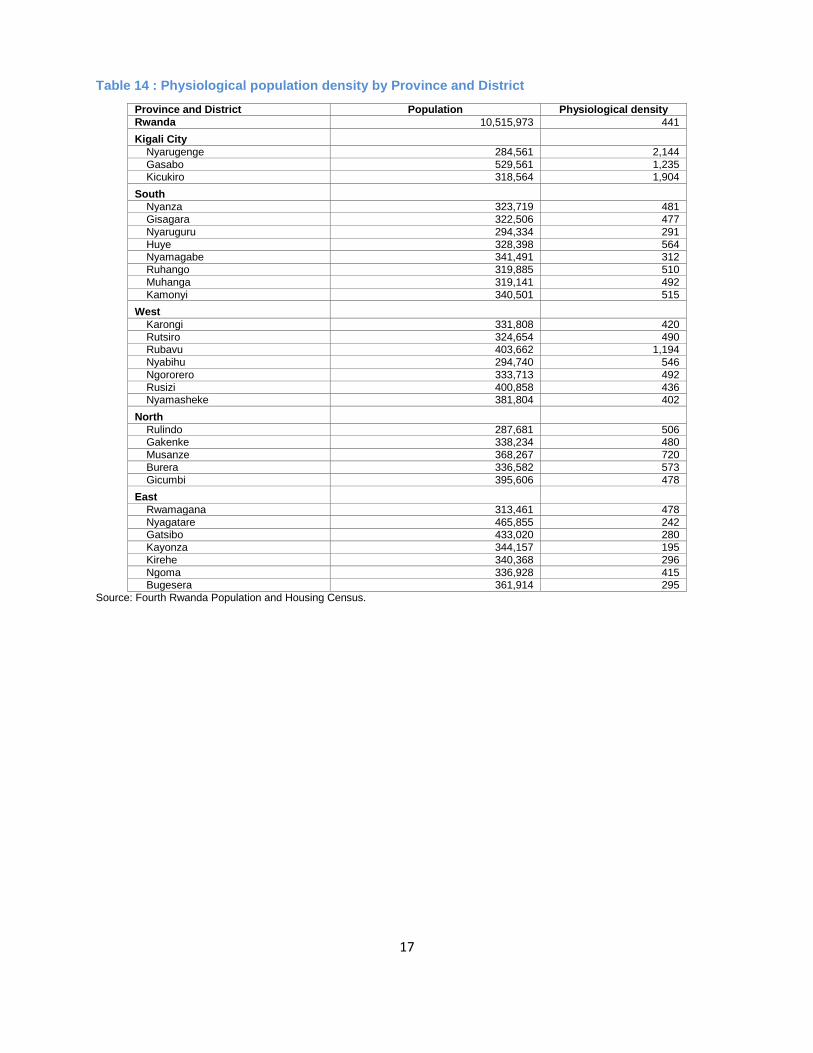
3.7.2 Physiological density
The physiological density considers the land surface area only (excluding inland waters). The
physiological density of Rwanda was 441 inhabitants per sq. km in 2012 (Table 16), compared
to 378 in 2002.
At district level, the highest population density was observed in the three districts of Kigali City;
Nyarugenge, Kicukiro and Gasabo have 2,144, 1,904 and 1,235 inhabitants per sq. km
respectively. This high population density is also observed in Rubavu district, with 1,194
inhabitants per sq. km. The district with the lowest population density is Kayonza (195
inhabitants per sq. km, while a much lower population density among districts is also observed
in Nyagatare, Gatsibo, Nyaruguru, Bugesera and Kirehe, which all have less than 300
inhabitants per sq. km. The population density of 19 districts is above the average density of the
country.
17
Table 14 : Physiological population density by Province and District
Province and District Population Physiological density Rwanda 10,515,973 441 Kigali City
Nyarugenge 284,561 2,144 Gasabo 529,561 1,235 Kicukiro 318,564 1,904
South Nyanza 323,719 481 Gisagara 322,506 477 Nyaruguru 294,334 291 Huye 328,398 564 Nyamagabe 341,491 312 Ruhango 319,885 510 Muhanga 319,141 492 Kamonyi 340,501 515
West Karongi 331,808 420 Rutsiro 324,654 490 Rubavu 403,662 1,194 Nyabihu 294,740 546 Ngororero 333,713 492 Rusizi 400,858 436 Nyamasheke 381,804 402
North Rulindo 287,681 506 Gakenke 338,234 480 Musanze 368,267 720 Burera 336,582 573 Gicumbi 395,606 478
East Rwamagana 313,461 478 Nyagatare 465,855 242 Gatsibo 433,020 280 Kayonza 344,157 195 Kirehe 340,368 296 Ngoma 336,928 415 Bugesera 361,914 295
Source: Fourth Rwanda Population and Housing Census.
18
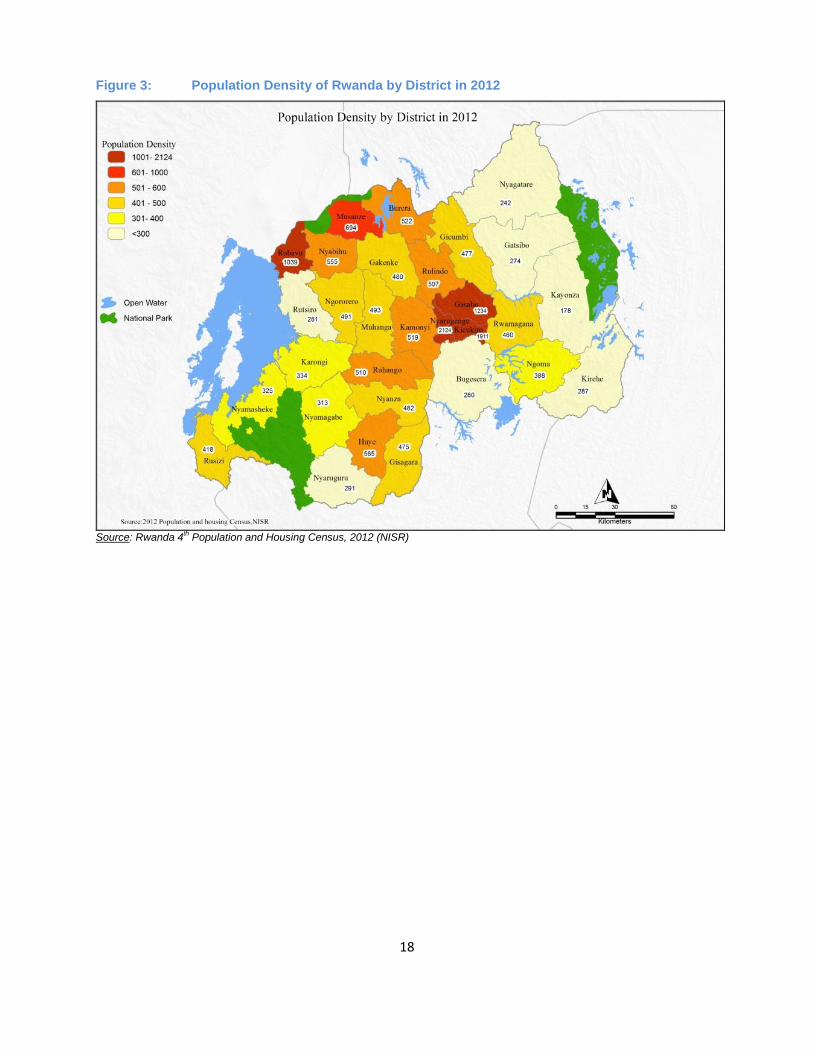
Figure 3: Population Density of Rwanda by District in 2012
Source: Rwanda 4
th Population and Housing Census, 2012 (NISR)
19
Chapter 4: Age-sex structure of the population
Age and sex are the most fundamental characteristics of the population, as many other
individual characteristics are directly linked to them. Many public policies, for example in the
area of education or health, are directed towards certain age groups within the population.
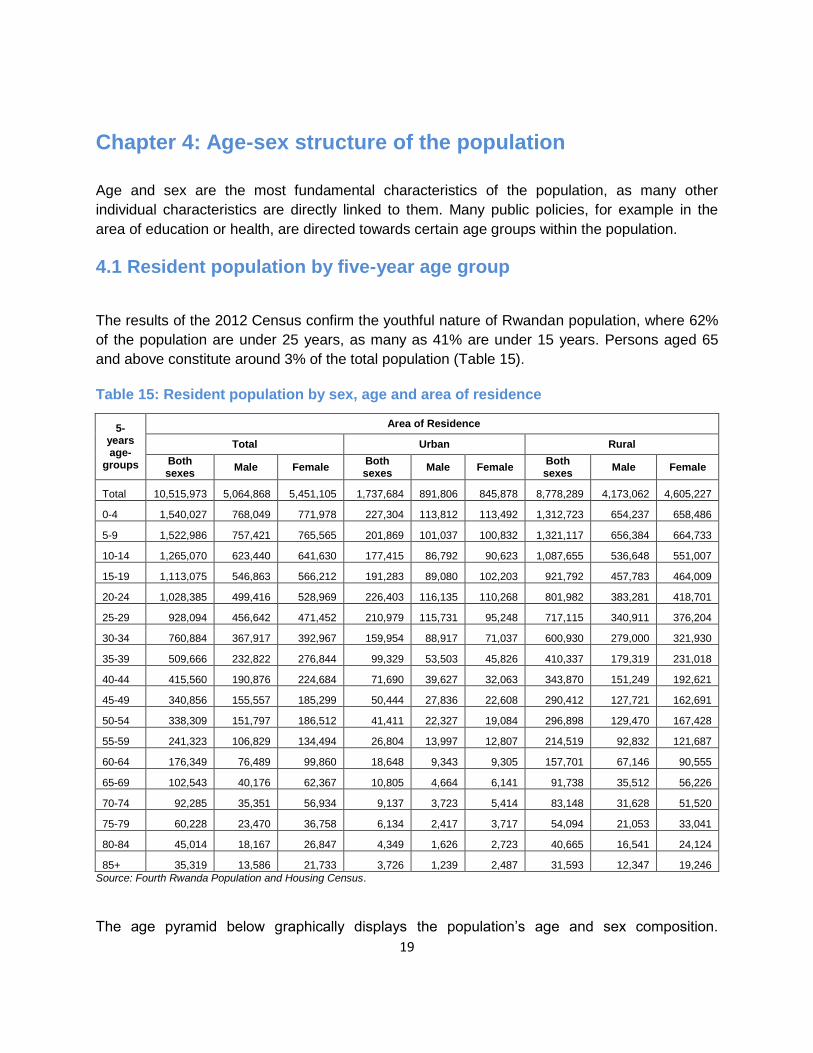
4.1 Resident population by five-year age group
The results of the 2012 Census confirm the youthful nature of Rwandan population, where 62%
of the population are under 25 years, as many as 41% are under 15 years. Persons aged 65
and above constitute around 3% of the total population (Table 15).
Table 15: Resident population by sex, age and area of residence
5-years age-
groups
Area of Residence
Total Urban Rural
Both sexes
Male Female Both sexes
Male Female Both sexes
Male Female
Total 10,515,973 5,064,868 5,451,105 1,737,684 891,806 845,878 8,778,289 4,173,062 4,605,227
0-4 1,540,027 768,049 771,978 227,304 113,812 113,492 1,312,723 654,237 658,486
5-9 1,522,986 757,421 765,565 201,869 101,037 100,832 1,321,117 656,384 664,733
10-14 1,265,070 623,440 641,630 177,415 86,792 90,623 1,087,655 536,648 551,007
15-19 1,113,075 546,863 566,212 191,283 89,080 102,203 921,792 457,783 464,009
20-24 1,028,385 499,416 528,969 226,403 116,135 110,268 801,982 383,281 418,701
25-29 928,094 456,642 471,452 210,979 115,731 95,248 717,115 340,911 376,204
30-34 760,884 367,917 392,967 159,954 88,917 71,037 600,930 279,000 321,930
35-39 509,666 232,822 276,844 99,329 53,503 45,826 410,337 179,319 231,018
40-44 415,560 190,876 224,684 71,690 39,627 32,063 343,870 151,249 192,621
45-49 340,856 155,557 185,299 50,444 27,836 22,608 290,412 127,721 162,691
50-54 338,309 151,797 186,512 41,411 22,327 19,084 296,898 129,470 167,428
55-59 241,323 106,829 134,494 26,804 13,997 12,807 214,519 92,832 121,687
60-64 176,349 76,489 99,860 18,648 9,343 9,305 157,701 67,146 90,555
65-69 102,543 40,176 62,367 10,805 4,664 6,141 91,738 35,512 56,226
70-74 92,285 35,351 56,934 9,137 3,723 5,414 83,148 31,628 51,520
75-79 60,228 23,470 36,758 6,134 2,417 3,717 54,094 21,053 33,041
80-84 45,014 18,167 26,847 4,349 1,626 2,723 40,665 16,541 24,124
85+ 35,319 13,586 21,733 3,726 1,239 2,487 31,593 12,347 19,246
Source: Fourth Rwanda Population and Housing Census.
The age pyramid below graphically displays the population’s age and sex composition.
20
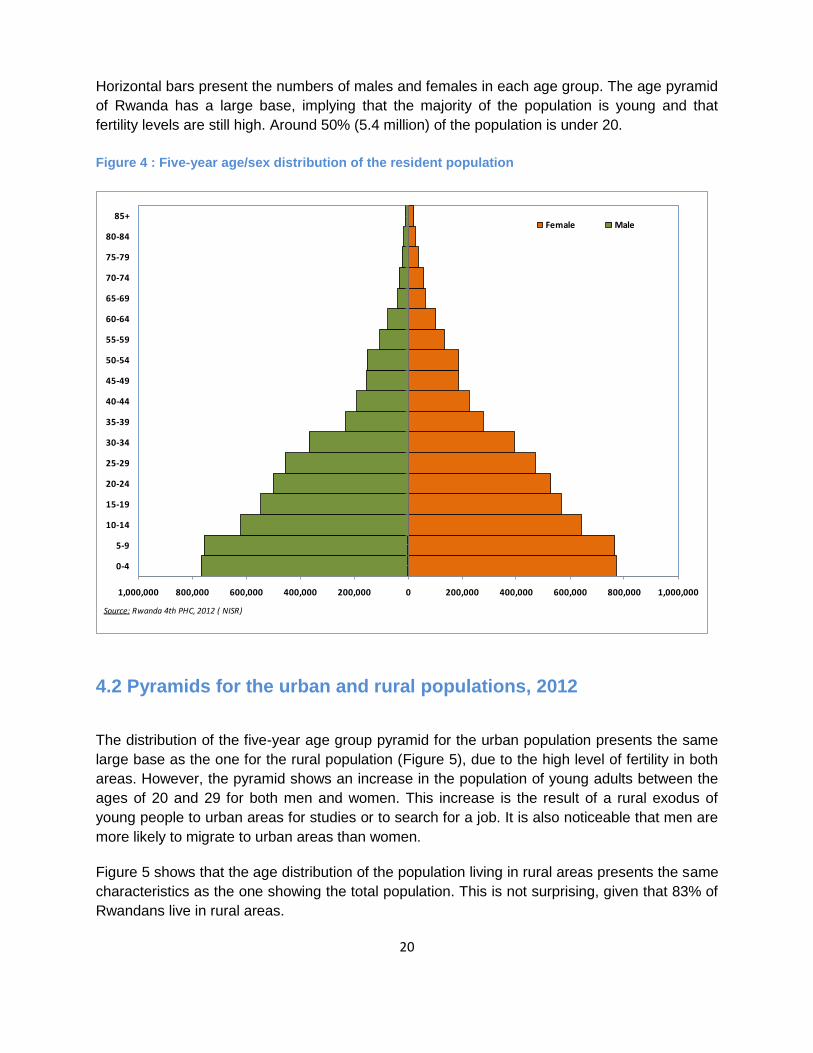
Horizontal bars present the numbers of males and females in each age group. The age pyramid
of Rwanda has a large base, implying that the majority of the population is young and that
fertility levels are still high. Around 50% (5.4 million) of the population is under 20.
Figure 4 : Five-year age/sex distribution of the resident population
1,000,000 800,000 600,000 400,000 200,000 0 200,000 400,000 600,000 800,000 1,000,000
0-4
5-9
10-14
15-19
20-24
25-29
30-34
35-39
40-44
45-49
50-54
55-59
60-64
65-69
70-74
75-79
80-84
85+Female Male
Source: Rwanda 4th PHC, 2012 ( NISR)
4.2 Pyramids for the urban and rural populations, 2012
The distribution of the five-year age group pyramid for the urban population presents the same
large base as the one for the rural population (Figure 5), due to the high level of fertility in both
areas. However, the pyramid shows an increase in the population of young adults between the
ages of 20 and 29 for both men and women. This increase is the result of a rural exodus of
young people to urban areas for studies or to search for a job. It is also noticeable that men are
more likely to migrate to urban areas than women.
Figure 5 shows that the age distribution of the population living in rural areas presents the same
characteristics as the one showing the total population. This is not surprising, given that 83% of
Rwandans live in rural areas.

21
Figure 5 : Five-year age/ sex distribution of the resident population in rural and urban areas
700,000 500,000 300,000 100,000 100,000 300,000 500,000 700,000
0-4
5-9
10-14
15-19
20-24
25-29
30-34
35-39
40-44
45-49
50-54
55-59
60-64
65-69
70-74
75-79
80-84
85+ Rural (Female)
Rural (Male)
Urban (Female)
Urban (Male)
Source: Rwanda 4th Population and Housing Census, 2012 (NISR)
4.3 Sex ratio
Sex ratio is an indicator that shows the balance between sexes within a given population in
relation to a given time period. It is calculated as the number of males divided by the number of
females, thus providing the number of males per 100 females within a given population. Table
19 reveals that the overall sex ratio for the country is 93 males for every 100 females, and thus
there is a clear deficit of males compared to females in the population of Rwanda in 2012. This
is observed at every age.
22
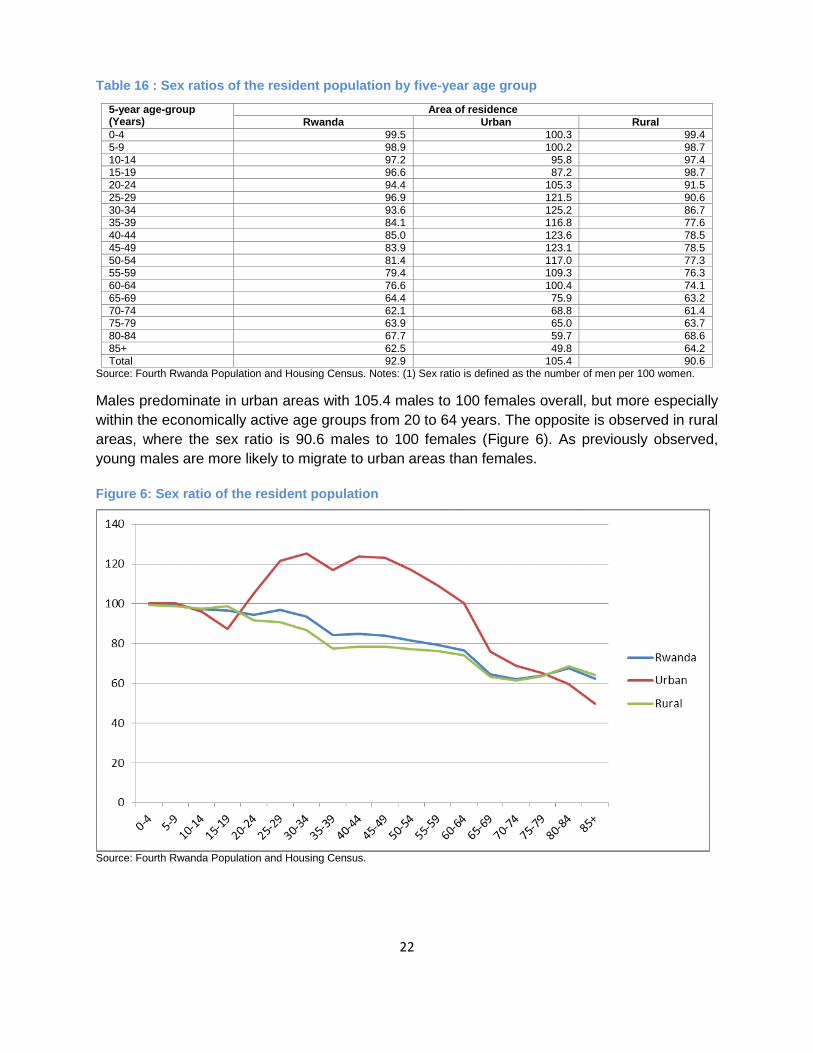
Table 16 : Sex ratios of the resident population by five-year age group
5-year age-group (Years)
Area of residence Rwanda Urban Rural
0-4 99.5 100.3 99.4 5-9 98.9 100.2 98.7 10-14 97.2 95.8 97.4 15-19 96.6 87.2 98.7 20-24 94.4 105.3 91.5 25-29 96.9 121.5 90.6 30-34 93.6 125.2 86.7 35-39 84.1 116.8 77.6 40-44 85.0 123.6 78.5 45-49 83.9 123.1 78.5 50-54 81.4 117.0 77.3 55-59 79.4 109.3 76.3 60-64 76.6 100.4 74.1 65-69 64.4 75.9 63.2 70-74 62.1 68.8 61.4 75-79 63.9 65.0 63.7 80-84 67.7 59.7 68.6 85+ 62.5 49.8 64.2 Total 92.9 105.4 90.6
Source: Fourth Rwanda Population and Housing Census. Notes: (1) Sex ratio is defined as the number of men per 100 women.
Males predominate in urban areas with 105.4 males to 100 females overall, but more especially
within the economically active age groups from 20 to 64 years. The opposite is observed in rural
areas, where the sex ratio is 90.6 males to 100 females (Figure 6). As previously observed,
young males are more likely to migrate to urban areas than females.
Figure 6: Sex ratio of the resident population
Source: Fourth Rwanda Population and Housing Census.
23
4.4 Mean and median age of population
4.4.1 Mean and median ages by provinces
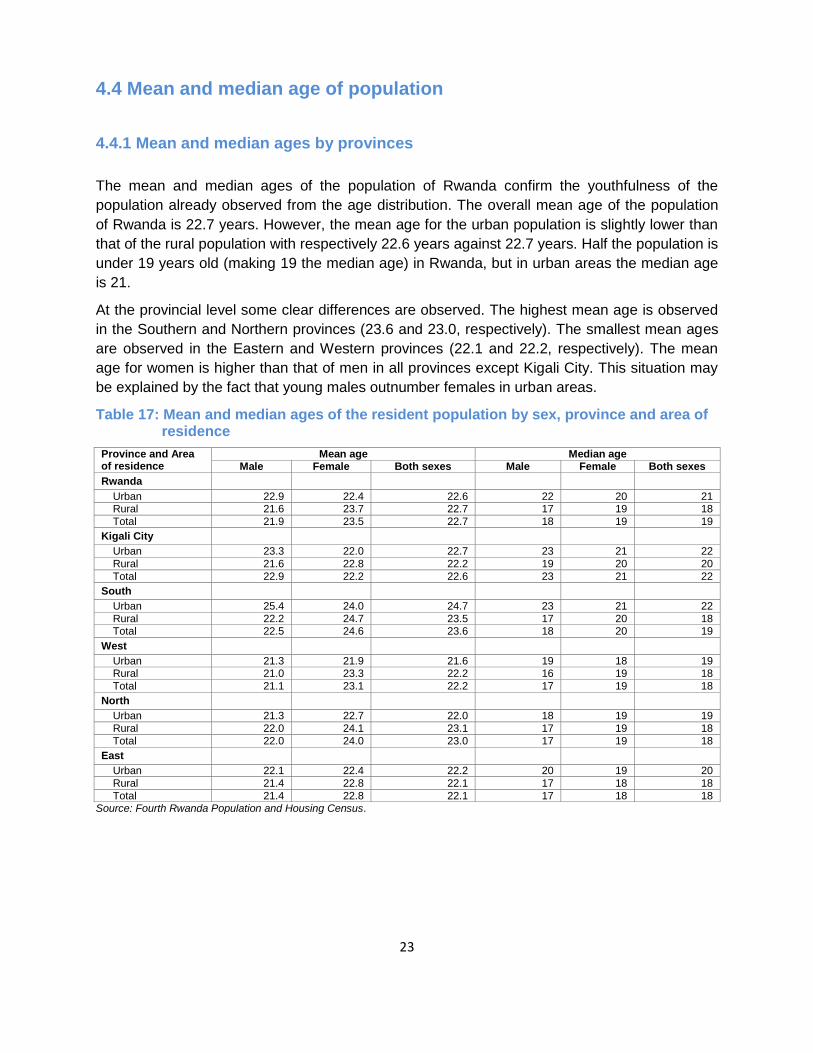
The mean and median ages of the population of Rwanda confirm the youthfulness of the
population already observed from the age distribution. The overall mean age of the population
of Rwanda is 22.7 years. However, the mean age for the urban population is slightly lower than
that of the rural population with respectively 22.6 years against 22.7 years. Half the population is
under 19 years old (making 19 the median age) in Rwanda, but in urban areas the median age
is 21.
At the provincial level some clear differences are observed. The highest mean age is observed
in the Southern and Northern provinces (23.6 and 23.0, respectively). The smallest mean ages
are observed in the Eastern and Western provinces (22.1 and 22.2, respectively). The mean
age for women is higher than that of men in all provinces except Kigali City. This situation may
be explained by the fact that young males outnumber females in urban areas.
Table 17: Mean and median ages of the resident population by sex, province and area of residence
Province and Area of residence
Mean age Median age Male Female Both sexes Male Female Both sexes
Rwanda Urban 22.9 22.4 22.6 22 20 21 Rural 21.6 23.7 22.7 17 19 18 Total 21.9 23.5 22.7 18 19 19
Kigali City Urban 23.3 22.0 22.7 23 21 22 Rural 21.6 22.8 22.2 19 20 20 Total 22.9 22.2 22.6 23 21 22
South Urban 25.4 24.0 24.7 23 21 22 Rural 22.2 24.7 23.5 17 20 18 Total 22.5 24.6 23.6 18 20 19
West Urban 21.3 21.9 21.6 19 18 19 Rural 21.0 23.3 22.2 16 19 18 Total 21.1 23.1 22.2 17 19 18
North Urban 21.3 22.7 22.0 18 19 19 Rural 22.0 24.1 23.1 17 19 18 Total 22.0 24.0 23.0 17 19 18
East Urban 22.1 22.4 22.2 20 19 20 Rural 21.4 22.8 22.1 17 18 18 Total 21.4 22.8 22.1 17 18 18
Source: Fourth Rwanda Population and Housing Census.
24
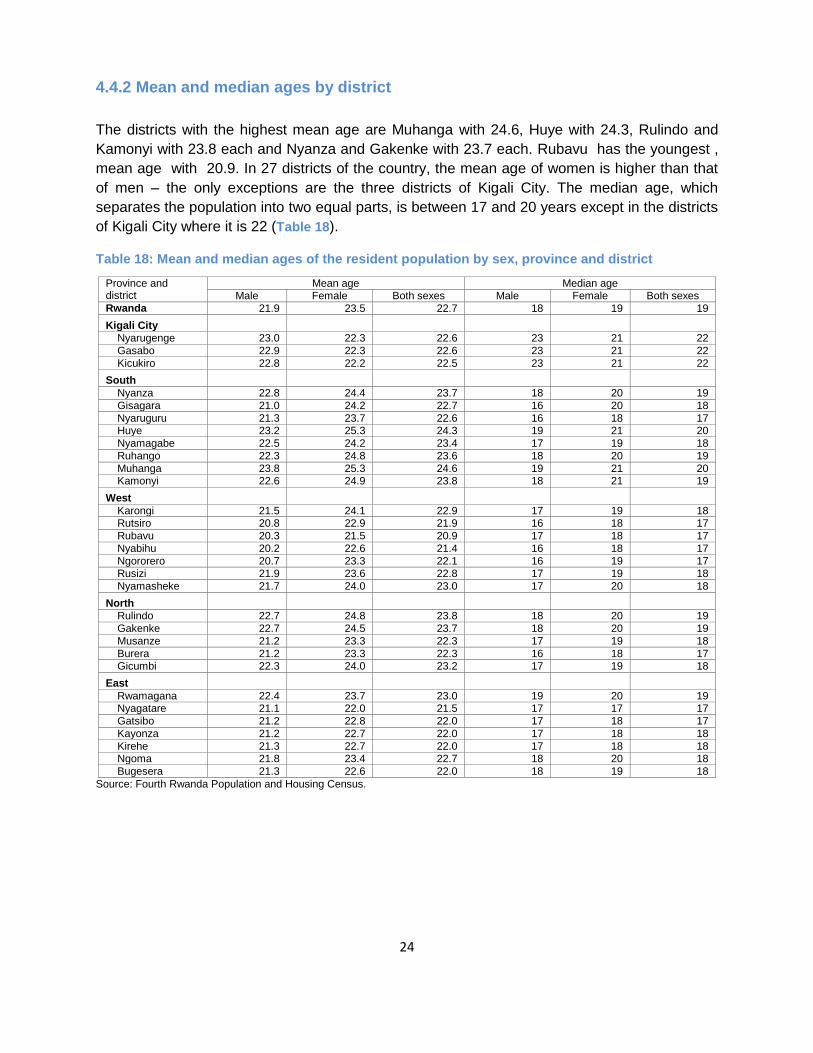
4.4.2 Mean and median ages by district
The districts with the highest mean age are Muhanga with 24.6, Huye with 24.3, Rulindo and
Kamonyi with 23.8 each and Nyanza and Gakenke with 23.7 each. Rubavu has the youngest ,
mean age with 20.9. In 27 districts of the country, the mean age of women is higher than that
of men – the only exceptions are the three districts of Kigali City. The median age, which
separates the population into two equal parts, is between 17 and 20 years except in the districts
of Kigali City where it is 22 (Table 18).
Table 18: Mean and median ages of the resident population by sex, province and district
Province and district
Mean age Median age Male Female Both sexes Male Female Both sexes
Rwanda 21.9 23.5 22.7 18 19 19 Kigali City
Nyarugenge 23.0 22.3 22.6 23 21 22 Gasabo 22.9 22.3 22.6 23 21 22 Kicukiro 22.8 22.2 22.5 23 21 22
South Nyanza 22.8 24.4 23.7 18 20 19 Gisagara 21.0 24.2 22.7 16 20 18 Nyaruguru 21.3 23.7 22.6 16 18 17 Huye 23.2 25.3 24.3 19 21 20 Nyamagabe 22.5 24.2 23.4 17 19 18 Ruhango 22.3 24.8 23.6 18 20 19 Muhanga 23.8 25.3 24.6 19 21 20 Kamonyi 22.6 24.9 23.8 18 21 19
West Karongi 21.5 24.1 22.9 17 19 18 Rutsiro 20.8 22.9 21.9 16 18 17 Rubavu 20.3 21.5 20.9 17 18 17 Nyabihu 20.2 22.6 21.4 16 18 17 Ngororero 20.7 23.3 22.1 16 19 17 Rusizi 21.9 23.6 22.8 17 19 18 Nyamasheke 21.7 24.0 23.0 17 20 18
North Rulindo 22.7 24.8 23.8 18 20 19 Gakenke 22.7 24.5 23.7 18 20 19 Musanze 21.2 23.3 22.3 17 19 18 Burera 21.2 23.3 22.3 16 18 17 Gicumbi 22.3 24.0 23.2 17 19 18
East Rwamagana 22.4 23.7 23.0 19 20 19 Nyagatare 21.1 22.0 21.5 17 17 17 Gatsibo 21.2 22.8 22.0 17 18 17 Kayonza 21.2 22.7 22.0 17 18 18 Kirehe 21.3 22.7 22.0 17 18 18 Ngoma 21.8 23.4 22.7 18 20 18 Bugesera 21.3 22.6 22.0 18 19 18
Source: Fourth Rwanda Population and Housing Census.
25
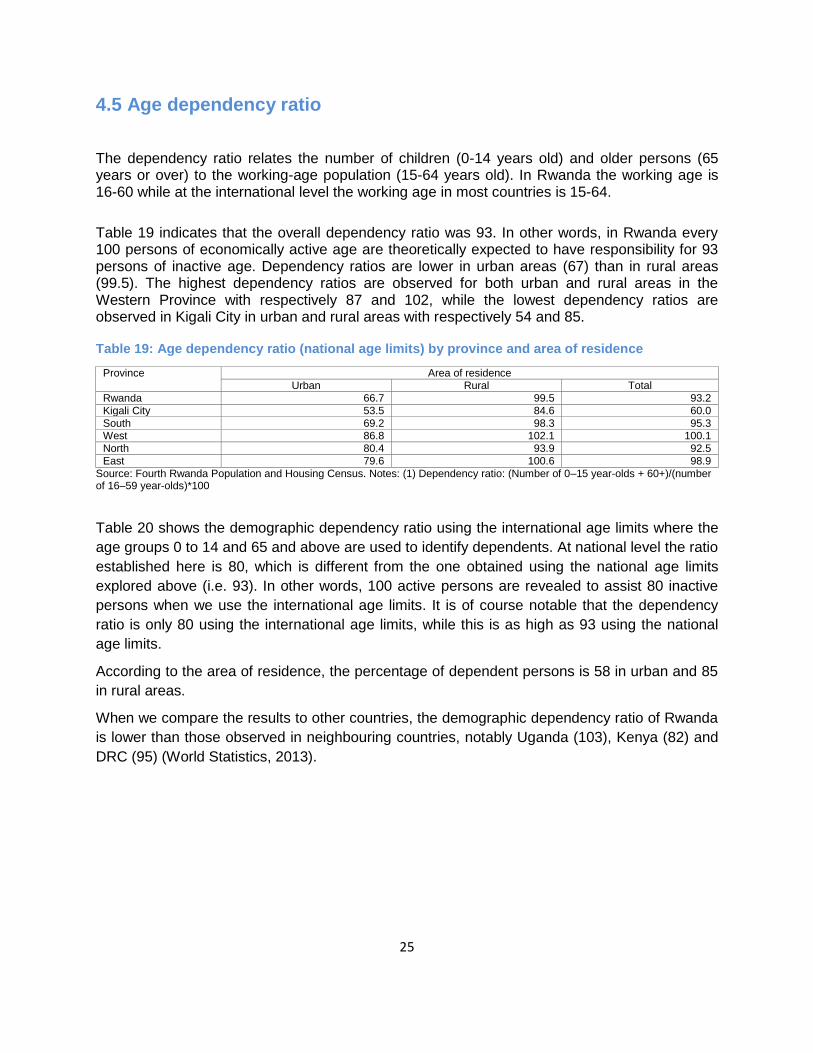
4.5 Age dependency ratio
The dependency ratio relates the number of children (0-14 years old) and older persons (65 years or over) to the working-age population (15-64 years old). In Rwanda the working age is 16-60 while at the international level the working age in most countries is 15-64.
Table 19 indicates that the overall dependency ratio was 93. In other words, in Rwanda every 100 persons of economically active age are theoretically expected to have responsibility for 93 persons of inactive age. Dependency ratios are lower in urban areas (67) than in rural areas (99.5). The highest dependency ratios are observed for both urban and rural areas in the Western Province with respectively 87 and 102, while the lowest dependency ratios are observed in Kigali City in urban and rural areas with respectively 54 and 85.
Table 19: Age dependency ratio (national age limits) by province and area of residence
Province Area of residence Urban Rural Total
Rwanda 66.7 99.5 93.2 Kigali City 53.5 84.6 60.0 South 69.2 98.3 95.3 West 86.8 102.1 100.1 North 80.4 93.9 92.5 East 79.6 100.6 98.9
Source: Fourth Rwanda Population and Housing Census. Notes: (1) Dependency ratio: (Number of 0–15 year-olds + 60+)/(number of 16–59 year-olds)*100
Table 20 shows the demographic dependency ratio using the international age limits where the
age groups 0 to 14 and 65 and above are used to identify dependents. At national level the ratio
established here is 80, which is different from the one obtained using the national age limits
explored above (i.e. 93). In other words, 100 active persons are revealed to assist 80 inactive
persons when we use the international age limits. It is of course notable that the dependency
ratio is only 80 using the international age limits, while this is as high as 93 using the national
age limits.
According to the area of residence, the percentage of dependent persons is 58 in urban and 85
in rural areas.
When we compare the results to other countries, the demographic dependency ratio of Rwanda
is lower than those observed in neighbouring countries, notably Uganda (103), Kenya (82) and
DRC (95) (World Statistics, 2013).
26
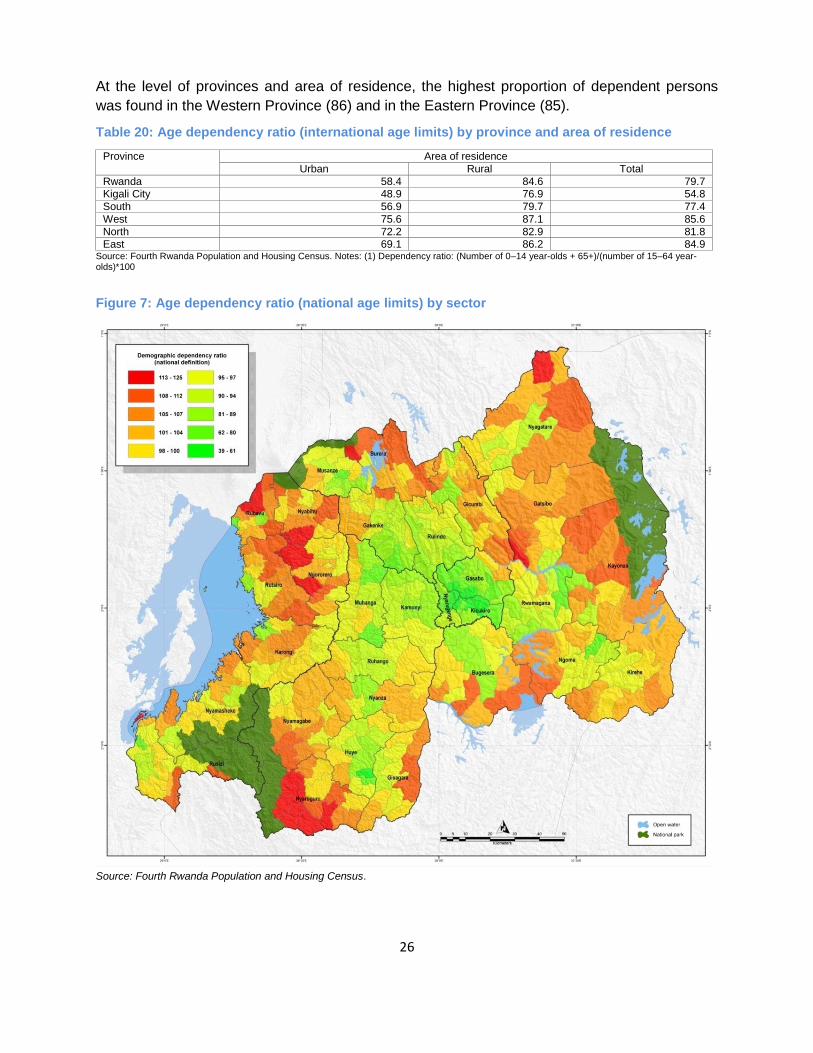
At the level of provinces and area of residence, the highest proportion of dependent persons
was found in the Western Province (86) and in the Eastern Province (85).
Table 20: Age dependency ratio (international age limits) by province and area of residence
Province Area of residence
Urban Rural Total
Rwanda 58.4 84.6 79.7 Kigali City 48.9 76.9 54.8
South 56.9 79.7 77.4
West 75.6 87.1 85.6
North 72.2 82.9 81.8 East 69.1 86.2 84.9
Source: Fourth Rwanda Population and Housing Census. Notes: (1) Dependency ratio: (Number of 0–14 year-olds + 65+)/(number of 15–64 year-olds)*100
Figure 7: Age dependency ratio (national age limits) by sector
Source: Fourth Rwanda Population and Housing Census.
27
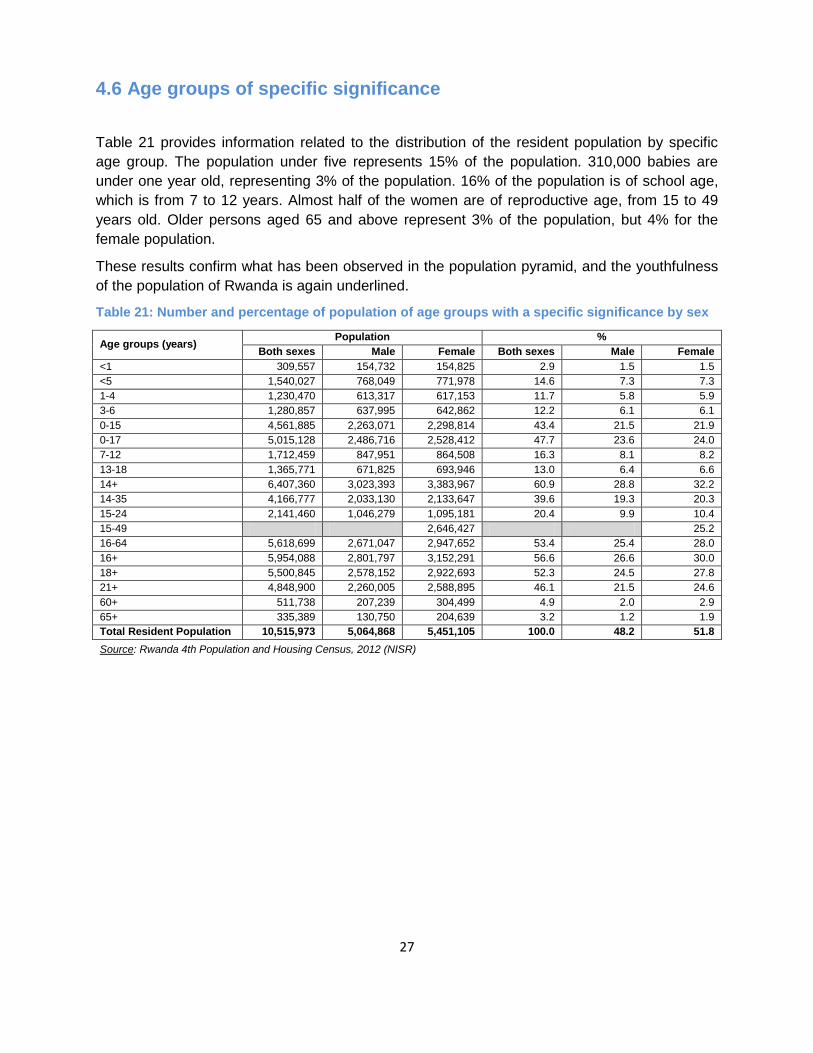
4.6 Age groups of specific significance
Table 21 provides information related to the distribution of the resident population by specific
age group. The population under five represents 15% of the population. 310,000 babies are
under one year old, representing 3% of the population. 16% of the population is of school age,
which is from 7 to 12 years. Almost half of the women are of reproductive age, from 15 to 49
years old. Older persons aged 65 and above represent 3% of the population, but 4% for the
female population.
These results confirm what has been observed in the population pyramid, and the youthfulness
of the population of Rwanda is again underlined.
Table 21: Number and percentage of population of age groups with a specific significance by sex
Age groups (years) Population %
Both sexes Male Female Both sexes Male Female
<1 309,557 154,732 154,825 2.9 1.5 1.5
<5 1,540,027 768,049 771,978 14.6 7.3 7.3
1-4 1,230,470 613,317 617,153 11.7 5.8 5.9
3-6 1,280,857 637,995 642,862 12.2 6.1 6.1
0-15 4,561,885 2,263,071 2,298,814 43.4 21.5 21.9
0-17 5,015,128 2,486,716 2,528,412 47.7 23.6 24.0
7-12 1,712,459 847,951 864,508 16.3 8.1 8.2
13-18 1,365,771 671,825 693,946 13.0 6.4 6.6
14+ 6,407,360 3,023,393 3,383,967 60.9 28.8 32.2
14-35 4,166,777 2,033,130 2,133,647 39.6 19.3 20.3
15-24 2,141,460 1,046,279 1,095,181 20.4 9.9 10.4
15-49 2,646,427 25.2
16-64 5,618,699 2,671,047 2,947,652 53.4 25.4 28.0
16+ 5,954,088 2,801,797 3,152,291 56.6 26.6 30.0
18+ 5,500,845 2,578,152 2,922,693 52.3 24.5 27.8
21+ 4,848,900 2,260,005 2,588,895 46.1 21.5 24.6
60+ 511,738 207,239 304,499 4.9 2.0 2.9
65+ 335,389 130,750 204,639 3.2 1.2 1.9
Total Resident Population 10,515,973 5,064,868 5,451,105 100.0 48.2 51.8
Source: Rwanda 4th Population and Housing Census, 2012 (NISR)
28
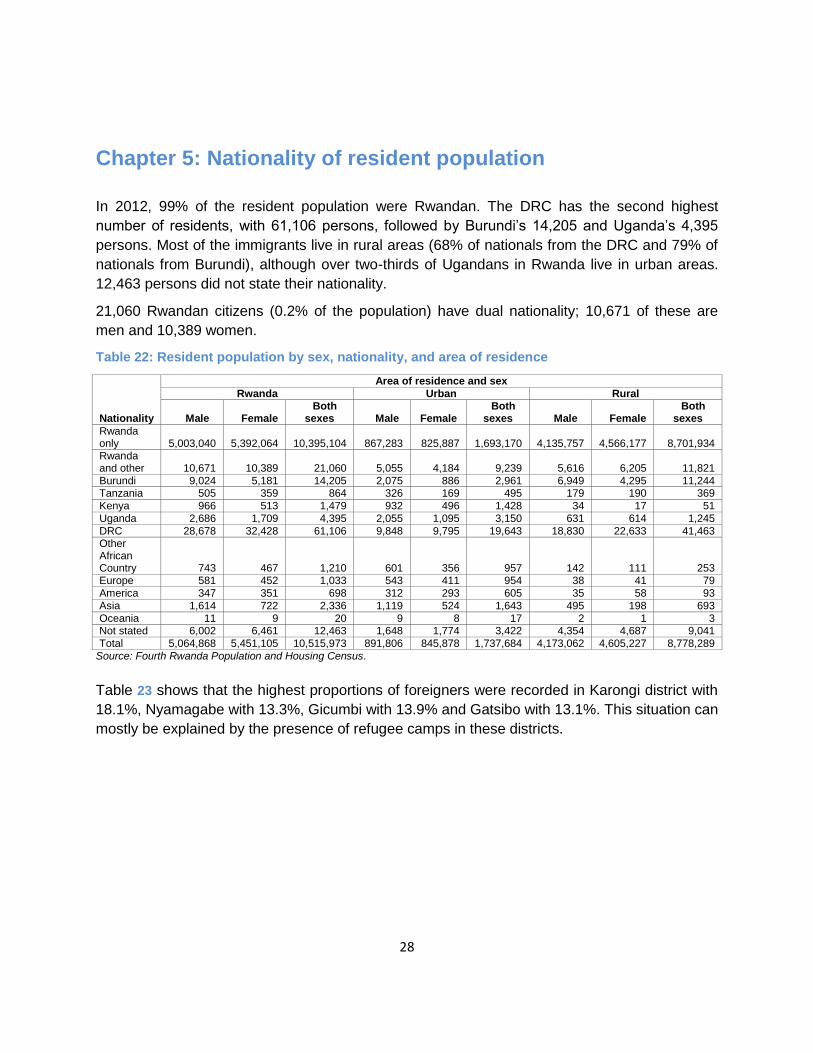
Chapter 5: Nationality of resident population
In 2012, 99% of the resident population were Rwandan. The DRC has the second highest
number of residents, with 61,106 persons, followed by Burundi’s 14,205 and Uganda’s 4,395
persons. Most of the immigrants live in rural areas (68% of nationals from the DRC and 79% of
nationals from Burundi), although over two-thirds of Ugandans in Rwanda live in urban areas.
12,463 persons did not state their nationality.
21,060 Rwandan citizens (0.2% of the population) have dual nationality; 10,671 of these are
men and 10,389 women.
Table 22: Resident population by sex, nationality, and area of residence
Nationality
Area of residence and sex Rwanda Urban Rural
Male Female Both
sexes Male Female Both
sexes Male Female Both
sexes Rwanda only 5,003,040 5,392,064 10,395,104 867,283 825,887 1,693,170 4,135,757 4,566,177 8,701,934 Rwanda and other 10,671 10,389 21,060 5,055 4,184 9,239 5,616 6,205 11,821 Burundi 9,024 5,181 14,205 2,075 886 2,961 6,949 4,295 11,244 Tanzania 505 359 864 326 169 495 179 190 369 Kenya 966 513 1,479 932 496 1,428 34 17 51 Uganda 2,686 1,709 4,395 2,055 1,095 3,150 631 614 1,245 DRC 28,678 32,428 61,106 9,848 9,795 19,643 18,830 22,633 41,463 Other African Country 743 467 1,210 601 356 957 142 111 253 Europe 581 452 1,033 543 411 954 38 41 79 America 347 351 698 312 293 605 35 58 93 Asia 1,614 722 2,336 1,119 524 1,643 495 198 693 Oceania 11 9 20 9 8 17 2 1 3 Not stated 6,002 6,461 12,463 1,648 1,774 3,422 4,354 4,687 9,041 Total 5,064,868 5,451,105 10,515,973 891,806 845,878 1,737,684 4,173,062 4,605,227 8,778,289
Source: Fourth Rwanda Population and Housing Census.
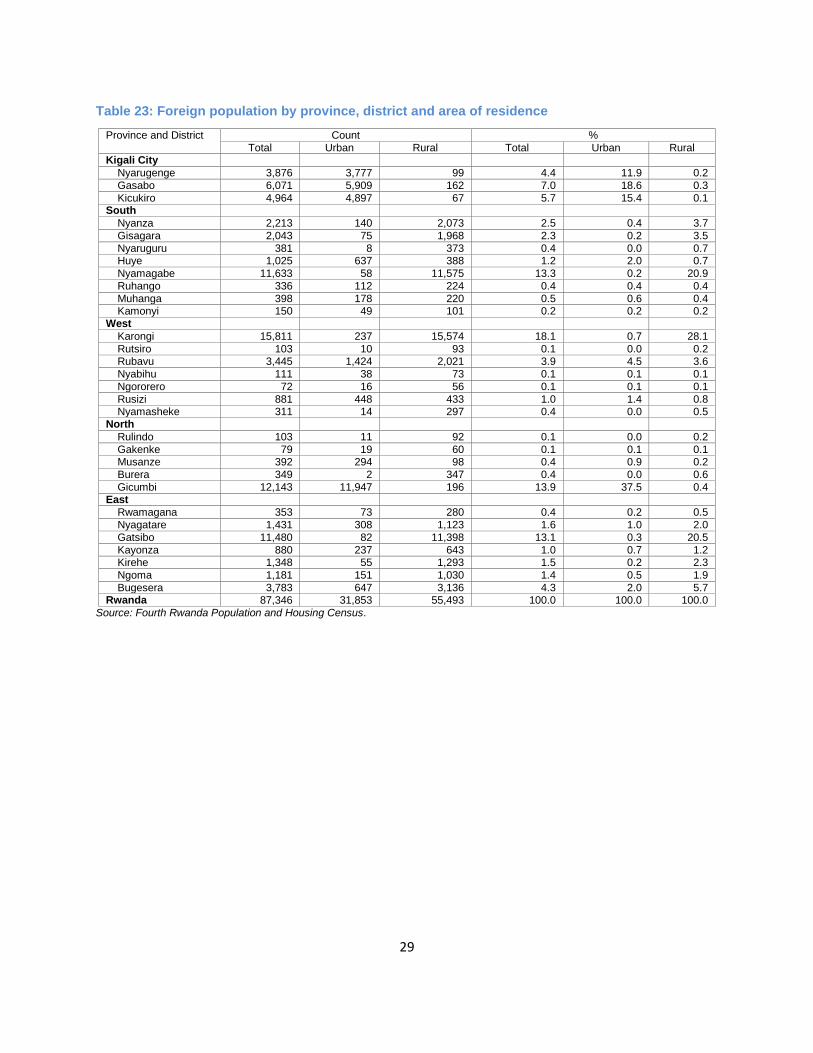
Table 23 shows that the highest proportions of foreigners were recorded in Karongi district with
18.1%, Nyamagabe with 13.3%, Gicumbi with 13.9% and Gatsibo with 13.1%. This situation can
mostly be explained by the presence of refugee camps in these districts.
29
Table 23: Foreign population by province, district and area of residence
Province and District Count %
Total Urban Rural Total Urban Rural Kigali City
Nyarugenge 3,876 3,777 99 4.4 11.9 0.2
Gasabo 6,071 5,909 162 7.0 18.6 0.3
Kicukiro 4,964 4,897 67 5.7 15.4 0.1 South
Nyanza 2,213 140 2,073 2.5 0.4 3.7
Gisagara 2,043 75 1,968 2.3 0.2 3.5
Nyaruguru 381 8 373 0.4 0.0 0.7 Huye 1,025 637 388 1.2 2.0 0.7
Nyamagabe 11,633 58 11,575 13.3 0.2 20.9
Ruhango 336 112 224 0.4 0.4 0.4
Muhanga 398 178 220 0.5 0.6 0.4 Kamonyi 150 49 101 0.2 0.2 0.2
West
Karongi 15,811 237 15,574 18.1 0.7 28.1
Rutsiro 103 10 93 0.1 0.0 0.2 Rubavu 3,445 1,424 2,021 3.9 4.5 3.6
Nyabihu 111 38 73 0.1 0.1 0.1
Ngororero 72 16 56 0.1 0.1 0.1
Rusizi 881 448 433 1.0 1.4 0.8 Nyamasheke 311 14 297 0.4 0.0 0.5
North
Rulindo 103 11 92 0.1 0.0 0.2
Gakenke 79 19 60 0.1 0.1 0.1 Musanze 392 294 98 0.4 0.9 0.2
Burera 349 2 347 0.4 0.0 0.6
Gicumbi 12,143 11,947 196 13.9 37.5 0.4 East
Rwamagana 353 73 280 0.4 0.2 0.5
Nyagatare 1,431 308 1,123 1.6 1.0 2.0
Gatsibo 11,480 82 11,398 13.1 0.3 20.5
Kayonza 880 237 643 1.0 0.7 1.2 Kirehe 1,348 55 1,293 1.5 0.2 2.3
Ngoma 1,181 151 1,030 1.4 0.5 1.9
Bugesera 3,783 647 3,136 4.3 2.0 5.7 Rwanda 87,346 31,853 55,493 100.0 100.0 100.0
Source: Fourth Rwanda Population and Housing Census.
30
Conclusion
The RPHC4 confirms the long-term demographic characteristics of the country. With an average
annual growth rate of 2.6%, the population has increased by 2.4 million in the 10 years since the
last Census in 2002. After the 1990s, which were marked by war and violence, the country’s
growth rate has again increased, although not to levels as high as before the war.
Rwanda has a young population, with half of it aged under 19 and only 3% aged 65 and above.
This poses specific challenges in terms of health and education.
The population density of Rwanda in 2012 was 415 persons per square kilometre. It was only
183 persons per sq. km in 1978, and 321 in 2002. Urban areas have the highest population
densities.
The majority of the population lives in rural areas, but young adults are migrating to urban areas
to study or to find a job; 34% of the population of urban areas is now aged between 20 and 34
years, compared to 24% of the population in rural areas.
The percentage of foreign population is low as 99% of the population are Rwandan. Foreigners
are mostly from neighbouring countries, in particular the Democratic Republic of the Congo.

31
References
1. Bureau National de Recensement (1984) : Recensement Général de la Population et de
l’Habitat. Rwanda 1978, Vol.VI Analyse, Kigali.
2. Ministry of Finance and Economic Planning (2005): Third General Census of Population
and Housing of Rwanda 2002. Kigali, Rwanda: National Census Service.
3. Ministry of Health (2003): National Population Policy for sustainable development, Kigali,
Rwanda.
4. NISR et ORC Macro (2006) : Enquête Démographique et de santé 2005. Calverton,
Maryland, USA: NISR et ORC Macro.
5. NISR (2010): Ministry of Health, Rwanda Demographic and Health Survey 2010.
6. Office National de la Population (ONAPO) et ORC Macro (2001) : Enquête
démographique et de Santé du Rwanda 2000.
7. Roger, G. et al (1995) : Les structures par âge et sexe en Afrique, ORSTOM, Paris
8. Service National de Recensement (1984) : Recensement général de la Population et de
l’Habitat au 15 août 1991, Kigali.
9. United Nations (1994): Programme of Action of the United Nations International
Conference on Population and Development, Cairo.
10. United Nations Publication (2008): Principles and Recommendations for Population and
Housing Censuses. Department of Economic and Social Affairs, Statistics Division,
Statistical Papers, Series M, No. 67/Rev.2, New York.
11. World Statistics (2013): International statistics –
32
Annex A Census objectives, methodology and data quality
assessment
Objectives of the Census
The long-term objective of the Fourth Rwanda Population and Housing Census (RPHC4) is to
contribute to:
Improving the level of knowledge on the social, demographic and economic
characteristics of the population of Rwanda;
Enabling a better understanding of population and development interrelationships; and
Reinforcing the National Institute of Statistics of Rwanda’s (NISR) human and technical
capacity.
In the short term, the objectives of the Census are to:
Determine the current size of the population of Rwanda and its spatial distribution
among provinces, districts, sectors, cells and villages and among rural and urban areas;
Determine the present demographic, social, economic and cultural characteristics of the
population of Rwanda;
Determine the level, structure and trends in regard to fertility, mortality and migration
among the population in order to come up with the natural and overall growth rates of
the population of Rwanda;
Provide indicators to enable advocacy for particular groups of the population such as
women, children, youth, the elderly and disabled persons;
Determine the characteristics of households, housing conditions and household welfare
in Rwanda to further use this information for a more elaborate poverty mapping of the
country;
Produce national population projections using updated demographic data and other
information on population dynamics to enhance future planning;
Update the relevant databases, providing information right down to the smallest
administrative unit in order to enhance the current government policy on ‘village
clusters’;
Provide clear details of the current statutory boundaries of all administrative units of the
country to which appropriate geographical codes can then be assigned;
Constitute an updated sampling frame for Rwanda and produce maps for each
enumeration area for future sample surveys; and
Promote the use of Census data at national and local level in formulating, monitoring
and evaluation of development programmes.
33
Methodology and Census phases
As mentioned in Chapter 1 of this report, following the preparatory phase of the Census which
consisted of the production of the project documents, schedule and Census budget, the
following technical activities were undertaken.
Census mapping
The purpose of the Census mapping is to divide the whole country into well-delineated
enumeration areas that constitute the smallest operational Census units to be assigned to each
enumerator during the enumeration period.
The Census mapping operation lasted for about a year (from February 2011 to March 2012),
which enabled the NISR to better estimate the number of staff to be recruited (e.g. enumerators,
team leaders, supervisors, etc.) and the other Census infrastructure and facilities necessary for
planning robust field activities. The outcomes of the Census mapping include the production of a
new sampling frame for future surveys and an updated administrative area boundary map for
Rwanda. In total, the country was delineated into 16,728 enumeration areas within the current
boundaries of administrative units, consisting of five provinces, 30 districts and 416 sectors.
This allows for the easy compilation of Census results in these administrative entities.
Pilot Census
Prior to the conducting of the RPHC4, a Pilot Census designed for testing the Census
questionnaires, other Census data-collection tools, enumeration time requirements and the
state-of-preparedness of the entire field work organisation was carried out. This test was
conducted on a sample of 75 enumeration areas throughout all the districts of the country, from
16 to 30 August 2011, exactly one year before the actual Census.
The Pilot Census was a dress rehearsal for the actual Census during which the various
methods and procedures for field organisation were tested as well as the Census
publicity/awareness campaign, Census map products and data-coding and data-entry
equipment.
The lessons learnt from the Pilot Census exercise were used to revise some Census
procedures and instruments necessary for a smooth/successful implementation of the actual
Census enumeration work.
Questionnaires and manuals
The first draft of Census questionnaires prepared by the NISR was submitted to the Census
Technical Committee (CTC) for review before its approval by the National Census Commission
(NCC). The CTC-reviewed Census questionnaires and related manuals were tested during the
Pilot Census.
The lessons learnt during the Pilot Census were used by the NISR to improve and finalise the
Census questionnaires, containing 77 variables, as well as to revise the manuals of instructions
34
for all Census functionaries accordingly. The revised Census questionnaires and manuals were
again reviewed and approved by the CTC before final approval was granted by the NCC to use
the Census questionnaire for the RPHC4.
The questionnaires used to collect data are presented in Annex B of this report. Two different
types of questionnaires were administered – one for private households and one for institutional
households. The questionnaire for private households contained a person record, a household
record and a mortality record. The questionnaire for institutional households contained only a
person record.
Census publicity and sensitisation campaign
Prior to the conducting of Census enumeration a national publicity and sensitisation campaign
was implemented in order to inform the public about the importance and relevance of the fourth
Rwanda RPHC4, as well as to seek their active participation and the involvement and
collaboration of administrative authorities during the Census enumeration period. A subtle and
targeted publicity and awareness campaign was conducted before the Pilot Census, which was
later intensified and diversified to cover all of the country as the actual Census enumeration
period approached.
The active collaboration and participation of Census commissions at both provincial and district
levels in campaign activities contributed significantly to the success of the Census enumeration.
The innovative mass-communication mix that was used to inform the public about the Census
and, at the same time, to ask for their full participation in the RPHC4, included the following:
Census Commission meetings;
Articles in local newspapers;
Radio and television programmes;
Outdoor billboards, banners, publicity spots and press releases; and
Monthly village community development meetings (Umuganda).
The Census results published in this report attest to the high level of cooperation of the political
and administrative authorities and the effective participation of the general public in the entire
Census enumeration process.
Recruitment and training of field staff
The RPHC4 was conducted by personnel from various institutions: the NISR (the Census
executing agency), MINECOFIN, MINALOC (districts and sectors), MINAFFET, the Rwanda
Defence Force, the Rwanda National Police, the Rwanda Correctional Services and MINEDUC
(heads of secondary schools and teachers). The recruitment of Census functionaries was done
by each institution according to the needs (i.e. number and categories of staff) of the NISR,
except in the case of teachers whose recruitment was done by the NISR in collaboration with
administrative authorities at the district, sector and cell levels.
35
At each stage of Census implementation, the necessary induction and mandatory training for
NISR staff and Census functionaries took place. For example, the Census mapping phase was
preceded by the training of cartographers, while the Pilot Census and the actual Census
enumeration were preceded by training of enumerators and their supervisors.
About eight weeks prior to the commencement of actual Census enumeration cascading training
was organised for all categories of Census functionaries, namely:
(i) Core master trainers’ dialogue;
(ii) Training for 275 master trainers;
(iii) Training for 1,004 trainers organised in five training centres, one centre per province;
and
(iv) Training for 24,426 enumerators in 68 training centres spread across all districts of
the country.
The Census training sessions focused on the understanding of Census enumeration processes
and the correct completion of Census questionnaires, reading and interpretation of Census
maps, practical role plays, and field practice. All the trainers and trainees were subjected to
mandatory qualifying tests which they had to pass before being appointed.
In order to mitigate the risk of declining quality of training at the various cascading training
levels, the comprehensive enumerator training was voice-over simulated by core master trainers
at a recording studio. The audio recorded training session was mass-recorded on CDs and
distributed to all the training classes as a reference source for the trainers.
Actual Census enumeration
As initially planned, the actual Census enumeration of the population in private and institutional
households was conducted across the country from 16 to 30 August to 2012, immediately after
the Census reference night.
Although data-collection activities were carried out by well-trained enumerators, quality
assurance of the Census enumeration was ensured through close supervision by line managers
at various levels. The Census functionaries deployed for the RPHC4 comprised the following
personnel:
Enumerators and support staff;
Team supervisors, covering an average of five enumeration areas each;
Sector controllers;
Zonal supervisors, covering between two and five administrative sectors;
District coordinators;
Province coordinators; and
National coordinators.
36
In accordance with the instructions contained in the Census Manual, each manager oversaw
and ensured the operations of daily Census activities within his/her area of supervision.
Enumerators were accountable for the work done on a daily basis to their team leaders, who
carried out the verification of completed questionnaires and also resolved to the best of their
ability challenges and/or problems encountered.
The team leaders communicated their daily progress achieved to the innovative Census
Command and Control Centre (CC&CC) established at the NISR using a SMS (i.e. Short
Message Service) system. The CC&CC system was an open source and web-based system
that allowed NISR senior management and authorised staff to continually monitor the progress
of Census enumeration in all the 16,728 enumeration areas via the internet. These officials were
also able to contact each other through a MTN Closed User Group.
Prior to the conducting of Census enumeration, a robust field operations plan with worst case
scenarios and risk analyses was established to facilitate hitch-free data collection and
supervision of the work. Appropriate logistical support was made available to field staff, such as
bicycles, motorcycles, vehicles and other necessary equipment. The mechanism utilised for the
distribution of Census material for data collection as well as the repatriation of questionnaires
and other materials to NISR headquarters was mainly facilitated by Rwanda Defence Force
trucks.
Post-enumeration activities
The logistical arrangement employed for the repatriation, inventory of Census questionnaires
and collating of Census counts was swift and seamless, which enabled the rapid publishing of
the Provisional Census Report within 90 days of Census enumeration being concluded. The
other post-enumeration activities included: the Post-Enumeration Survey (PES); data coding;
data processing; the release of final results; thematic analysis; and the dissemination of Census
results.
The PES was conducted from 19 September to 3 October 2012. The aim of the PES was to
assess the coverage and quality of Census data gathered during the actual Census. A total of
120 enumeration areas was sampled from across all districts of the country.
The data-coding and data-processing activities were done concurrently and completed within six
months. The Census data-cleaning, data-editing and data-stabilisation processes were
completed in two months, after which approximately 1,000 basic Census data tables were
generated. The final results were subjected to an in-depth analysis across 17 generic themes
(one of which is presented in this report) in accordance with the analysis plan developed for
each theme. Census monographs for each of the 30 districts will also be produced.
Data quality assessment
An independent quality review (available as an internal report to NISR) was conducted in
parallel with the thematic analysis. This investigated the work done prior, during, and after
37
enumeration to maximise the data quality. The assessment confirmed the strong planning and
quality assurance throughout the enumeration to maximise representation of the population; but
also found potentially weaker direct quality assurance during the data processing phase. The
overall conclusion of the assessment is that the RPHC4 was implemented with strong quality
control and gives an excellent representation of the population of Rwanda with generally good
measurement of its structure both in terms of spread and demographic and socio-economic
characteristics.
The claim of high quality with respect to representation is confirmed by the Post-Enumeration
Survey (PES), which measured the net-coverage of the household population in the RPHC4 to
be over 99% nationally with little variation across regions and by age and sex. Gross under-
coverage was around 1.5% while gross over-coverage (erroneous inclusions) was around 0.6%.
The conclusion of excellent representation is also consistent with the plausible growth rate for
the population over the inter-censal period implied by the national results.
Analysis of the demographic and socio-economic information contained in the final RPHC4
database and triangulation with other data sources also confirm that for most areas, the RPHC4
gives a reliable and comprehensive representation of the population. However, some issues
were found with respect to measurement of population characteristics: some possible under-
reporting of males (especially at young ages), some age-heaping around the digits 0 and 2 as
well as particular irregularities around the ages 2 and 12. Moreover, despite careful testing of
the questionnaire with explicit enumerator instructions regarding these sections, there is also
evidence of under-reporting of mortality, and to a lesser extent fertility. Indirect estimation may
be appropriate in these two thematic areas. However, apart from these issues the analysis of
the RPHC4 database supports the assertion of good quality with respect to measurement.

38
Annex B Census questionnaire
This annex provides the key pages of the Census questionnaires. The full questionnaires
including all cover sheets can be obtained from the NISR.
As mentioned above, two different types of questionnaires were administered, one for private
households and one for institutional households. The questionnaire for private households
contained a person record, a household record and a mortality record. The questionnaire for
institutional households contained only a person record.
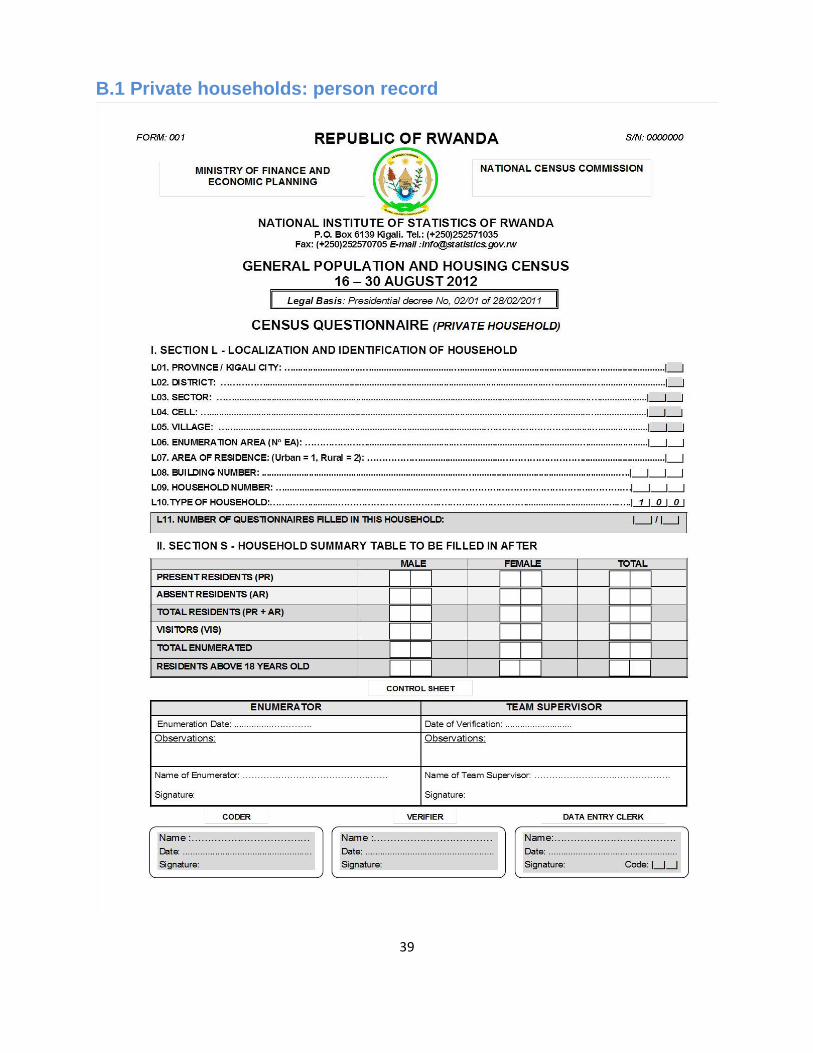
39
B.1 Private households: person record
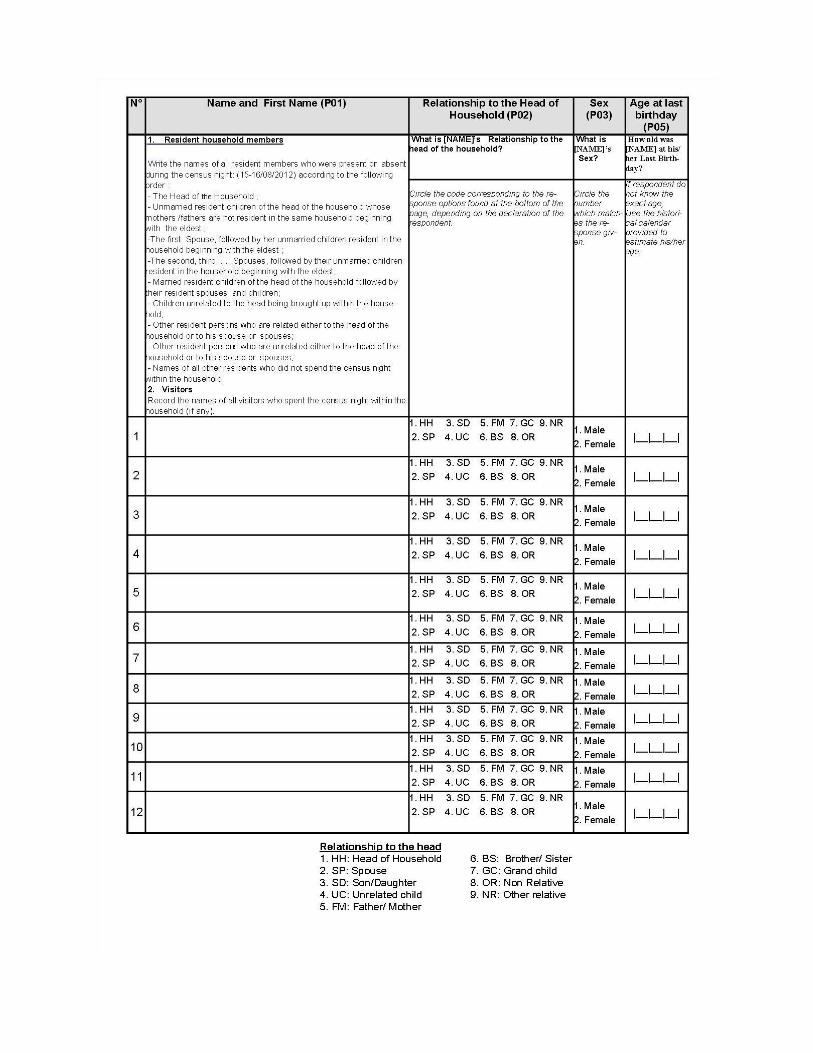
40
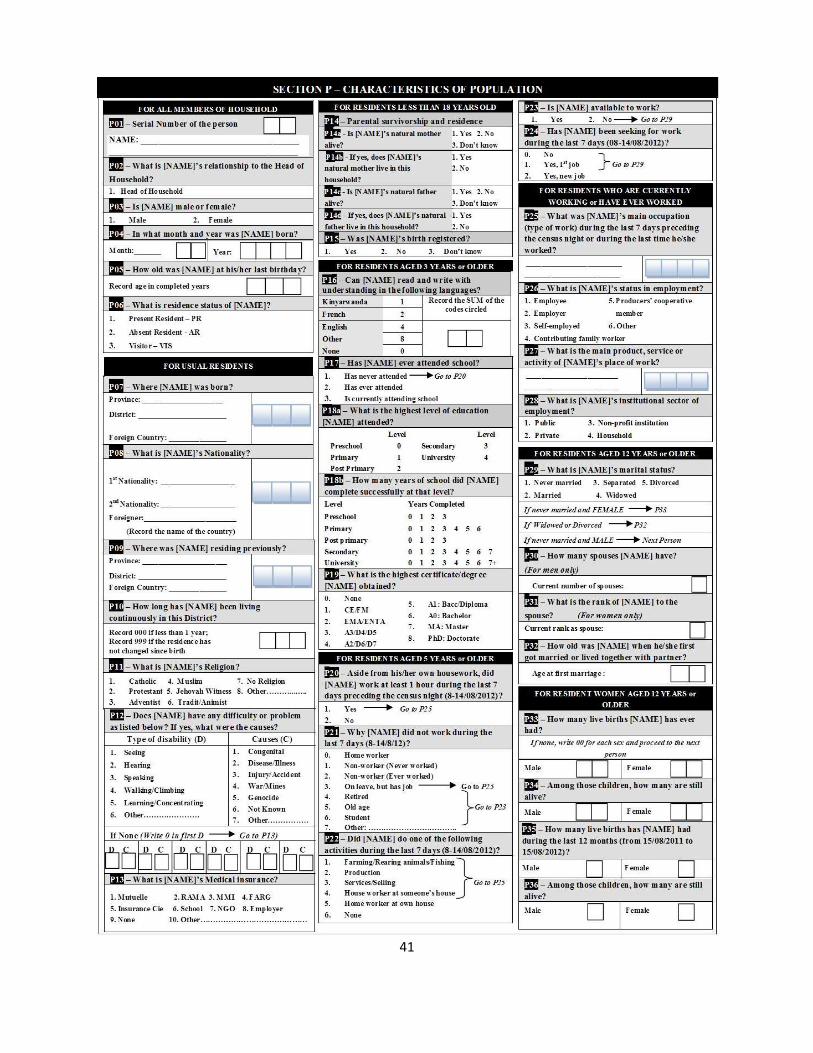
41
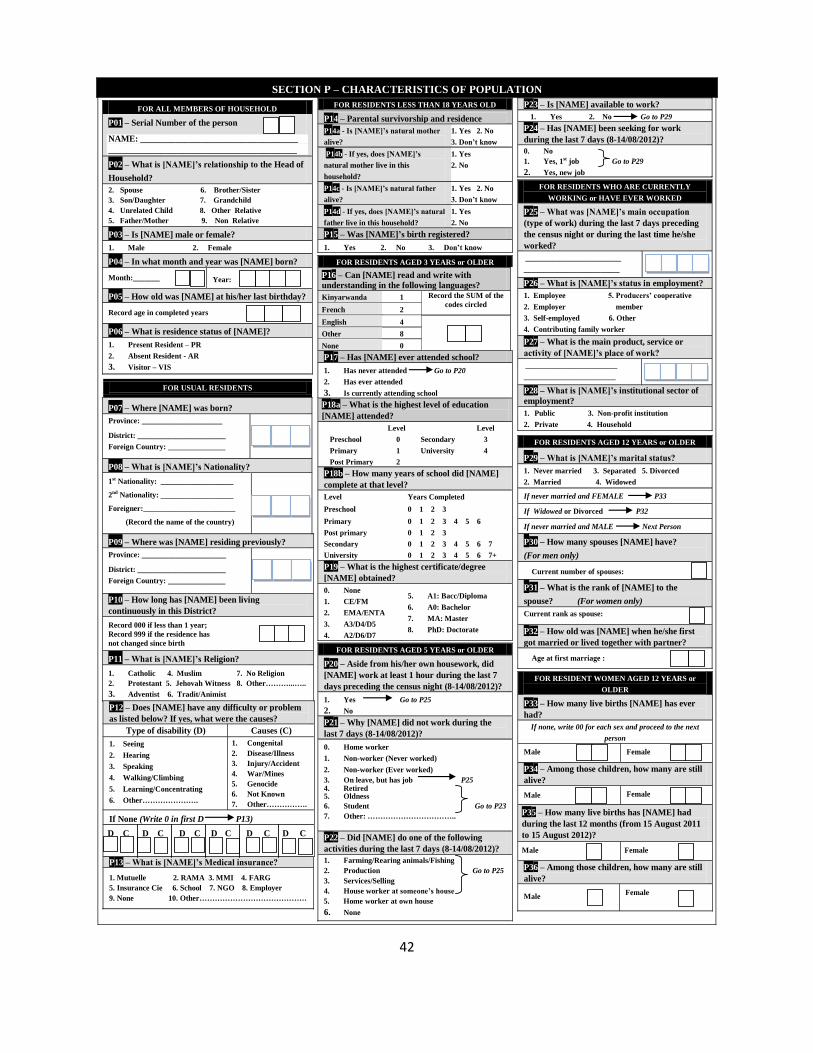
42
SECTION P – CHARACTERISTICS OF POPULATION
FOR ALL MEMBERS OF HOUSEHOLD
P01 – Serial Number of the person
NAME: ____________________________________
___________________________________________
P02 – What is [NAME]’s relationship to the Head of
Household?
2. Spouse 6. Brother/Sister
3. Son/Daughter 7. Grandchild
4. Unrelated Child 8. Other Relative
5. Father/Mother 9. Non Relative
P03 – Is [NAME] male or female?
1. Male 2. Female
P04 – In what month and year was [NAME] born?
Month:_______ Year:
P05 – How old was [NAME] at his/her last birthday?
Record age in completed years
P06 – What is residence status of [NAME]?
1. Present Resident – PR
2. Absent Resident - AR
3. Visitor – VIS
FOR USUAL RESIDENTS
P07 – Where [NAME] was born?
Province: _____________________
District: _______________________
Foreign Country: _______________
P08 – What is [NAME]’s Nationality?
1st Nationality: ___________________
2nd Nationality: ___________________
Foreigner:________________________
(Record the name of the country)
P09 – Where was [NAME] residing previously?
Province: ______________________
District: _______________________
Foreign Country: _______________
P10 – How long has [NAME] been living
continuously in this District?
Record 000 if less than 1 year;
Record 999 if the residence has
not changed since birth
P11 – What is [NAME]’s Religion?
1. Catholic 4. Muslim 7. No Religion
2. Protestant 5. Jehovah Witness 8. Other………...…..
3. Adventist 6. Tradit/Animist
P12 – Does [NAME] have any difficulty or problem
as listed below? If yes, what were the causes?
Type of disability (D) Causes (C)
1. Seeing
2. Hearing
3. Speaking
4. Walking/Climbing
5. Learning/Concentrating
6. Other………………….
1. Congenital
2. Disease/Illness
3. Injury/Accident
4. War/Mines
5. Genocide
6. Not Known
7. Other…………….
If None (Write 0 in first D P13)
D C D C D C D C D C D C
P13 – What is [NAME]’s Medical insurance?
1. Mutuelle 2. RAMA 3. MMI 4. FARG
5. Insurance Cie 6. School 7. NGO 8. Employer
9. None 10. Other……………………………………
FOR RESIDENTS LESS THAN 18 YEARS OLD
P14 – Parental survivorship and residence
P14a - Is [NAME]’s natural mother
alive?
1. Yes 2. No
3. Don’t know
P14b - If yes, does [NAME]’s
natural mother live in this
household?
1. Yes
2. No
P14c - Is [NAME]’s natural father
alive?
1. Yes 2. No
3. Don’t know
P14d - If yes, does [NAME]’s natural
father live in this household?
1. Yes
2. No
P15 – Was [NAME]’s birth registered?
1. Yes 2. No 3. Don’t know
FOR RESIDENTS AGED 3 YEARS or OLDER P16 – Can [NAME] read and write with
understanding in the following languages?
Kinyarwanda 1 Record the SUM of the
codes circled
French 2
English 4
Other 8
None 0
P17 – Has [NAME] ever attended school?
1. Has never attended Go to P20
2. Has ever attended
3. Is currently attending school
P18a – What is the highest level of education
[NAME] attended?
Level Level
Preschool 0 Secondary 3
Primary 1 University 4
Post Primary 2
P18b – How many years of school did [NAME]
complete at that level?
Level Years Completed
Preschool 0 1 2 3
Primary 0 1 2 3 4 5 6
Post primary 0 1 2 3
Secondary 0 1 2 3 4 5 6 7
University 0 1 2 3 4 5 6 7+
P19 – What is the highest certificate/degree
[NAME] obtained?
0. None
1. CE/FM
2. EMA/ENTA
3. A3/D4/D5
4. A2/D6/D7
5. A1: Bacc/Diploma
6. A0: Bachelor
7. MA: Master
8. PhD: Doctorate
FOR RESIDENTS AGED 5 YEARS or OLDER
P20 – Aside from his/her own housework, did
[NAME] work at least 1 hour during the last 7
days preceding the census night (8-14/08/2012)?
1. Yes Go to P25
2. No
P21 – Why [NAME] did not work during the
last 7 days (8-14/08/2012)?
0. Home worker
1. Non-worker (Never worked)
2. Non-worker (Ever worked)
3. On leave, but has job P25 4. Retired 5. Oldness
6. Student Go to P23
7. Other: ……………………………..
P22 – Did [NAME] do one of the following
activities during the last 7 days (8-14/08/2012)?
1. Farming/Rearing animals/Fishing
2. Production Go to P25
3. Services/Selling
4. House worker at someone’s house
5. Home worker at own house
6. None
P23 – Is [NAME] available to work?
1. Yes 2. No Go to P29
P24 – Has [NAME] been seeking for work
during the last 7 days (8-14/08/2012)?
0. No
1. Yes, 1st job Go to P29
2. Yes, new job
FOR RESIDENTS WHO ARE CURRENTLY
WORKING or HAVE EVER WORKED P25 – What was [NAME]’s main occupation
(type of work) during the last 7 days preceding
the census night or during the last time he/she
worked?
_________________________
_________________________
P26 – What is [NAME]’s status in employment?
1. Employee 5. Producers’ cooperative
2. Employer member
3. Self-employed 6. Other
4. Contributing family worker
P27 – What is the main product, service or
activity of [NAME]’s place of work?
________________________
________________________
P28 – What is [NAME]’s institutional sector of
employment?
1. Public 3. Non-profit institution
2. Private 4. Household
FOR RESIDENTS AGED 12 YEARS or OLDER
P29 – What is [NAME]’s marital status?
1. Never married 3. Separated 5. Divorced
2. Married 4. Widowed
If never married and FEMALE P33
If Widowed or Divorced P32
If never married and MALE Next Person
P30 – How many spouses [NAME] have?
(For men only)
Current number of spouses:
P31 – What is the rank of [NAME] to the
spouse? (For women only)
Current rank as spouse:
P32 – How old was [NAME] when he/she first
got married or lived together with partner?
Age at first marriage :
FOR RESIDENT WOMEN AGED 12 YEARS or
OLDER P33 – How many live births [NAME] has ever
had?
If none, write 00 for each sex and proceed to the next
person
Male Female
P34 – Among those children, how many are still
alive?
Male Female
P35 – How many live births has [NAME] had
during the last 12 months (from 15 August 2011
to 15 August 2012)?
Male Female
P36 – Among those children, how many are still
alive?
Male Female
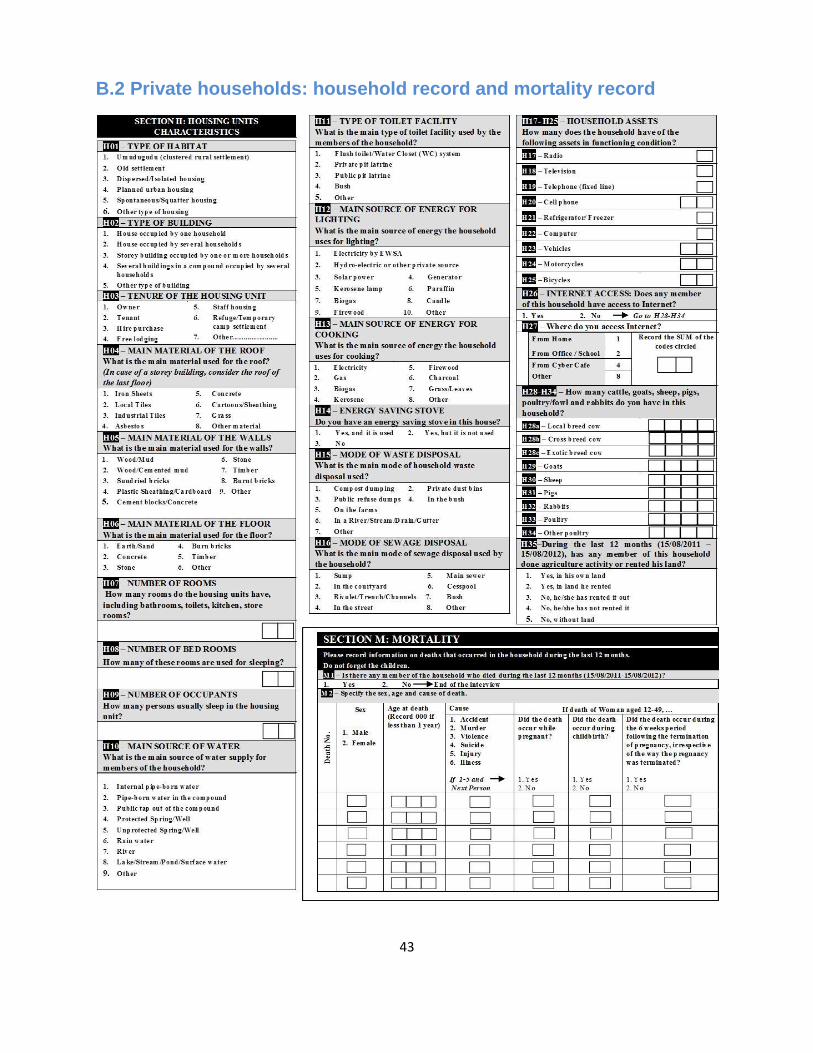
43
B.2 Private households: household record and mortality record
44
B.3 Institutional households: person record

45

46
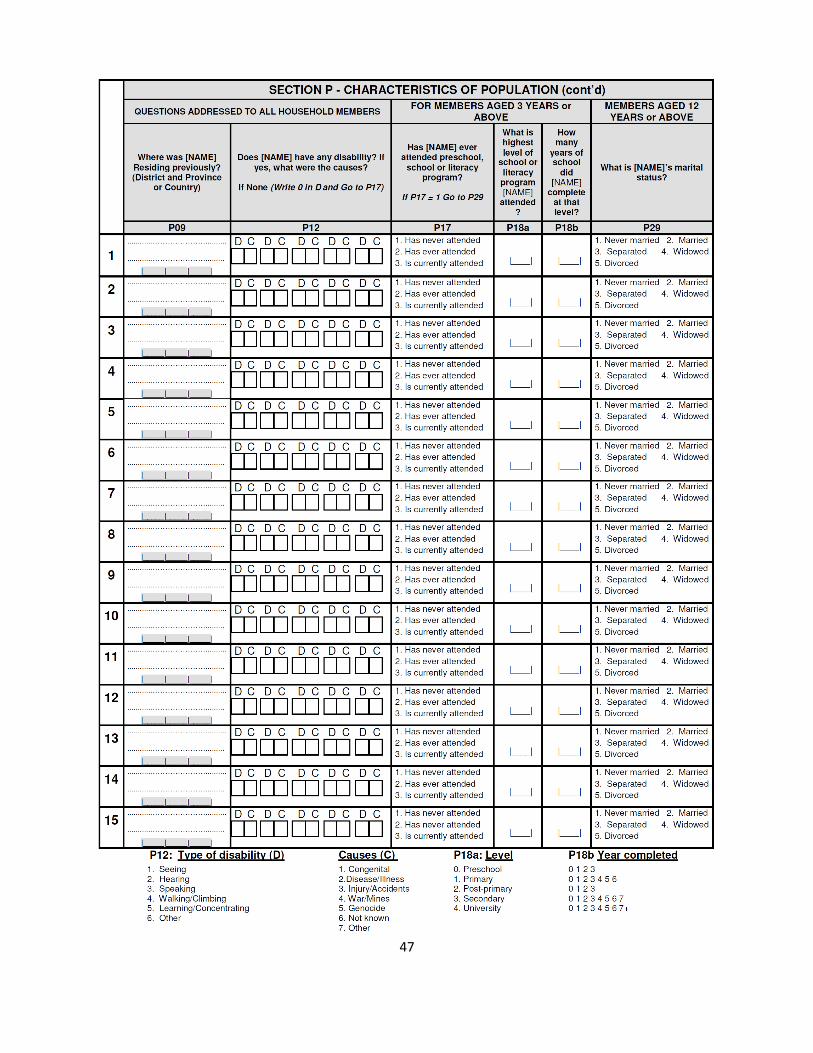
47
48
Annex C Glossary of key terms and definitions
This Glossary provides definitions of key concepts and indicators used in the thematic reports of
the Fourth Rwanda Population and Housing Census (RPHC4). Readers are referred to the
methodological sections of the respective reports for a more detailed technical explanation of
indicators.
Population and demographic characteristics
Residents: persons who have lived for more than six months in the place where they were
enumerated or who intended to live for more than six months in that place. They represent the
population usually living in a place. Residents could be:
Present residents: present in their place of usual residence on the reference night; or
Absent residents: not present in their place of usual residence on the reference night.
The person must be absent for a period shorter than or equal to six months.
Visitors: persons who were not usual residents of the household. They might be
residents in another place in Rwanda, and thus absent residents in that place, or non-
residents of the country, for example tourists present at the moment of the Census.
De facto population (present residents + visitors): includes all persons physically present in the
country or area at the reference date.
De jure population (present residents + absent residents): includes all usual residents of the
given country or area, whether or not they were physically present in the area at the reference
date. The de jure population is also referred to as the (usual) resident population. Most of the
analysis presented in these thematic reports is based on the de jure population.
Demographic dependency ratio: is measured as the ratio between those typically not in the
labour force and the age group typically in the labour force. Using the national definition of
working age, it is defined as the sum of persons aged 0 to 15 and elderly people aged 60 and
above, divided by the population in the 16 to 59 age group, multiplied by 100. For international
comparisons, age groups 0 to 14 and 65 and above are used to identify dependents.
Median age of a population: the median age is the age at which exactly half the population is
older and half is younger.
Population growth rate: the increase (or decrease) in the number of persons in the population
during a certain period of time, expressed as a percentage of the population at the beginning of
the time period. The average annual growth rates for all ages as well as for particular age
groups are calculated on the assumption that growth is continuous.
Population pyramid: graphically displays a population’s age and sex composition. Horizontal
49
bars present the numbers (or percentages) of males and females in each age group or at each
individual age. The sum of all the age/sex groups in the population pyramid equals the total
population.
Sex: refers to the classification of people as male or female, based on biological and
physiological characteristics such as chromosomes, hormones, and reproductive organs.
Gender: a social and cultural construct, which values men’s and women’s (and girls’ and boys’)
attributes differently. Accordingly, it assigns socially acceptable and often stereotypical roles
and responsibilities to men and women. Gender-based roles and other attributes, therefore,
change over time and vary with different cultural contexts. The concept of gender includes the
expectations held about the characteristics, aptitudes and likely behaviours of both women and
men (femininity and masculinity). This concept is also useful in analysing how commonly shared
practices legitimise discrepancies between sexes.
Sex ratio: the number of males per 100 females in the population. A sex ratio of 100 would
imply that there are as many males as females.
Disability status: characterises the population into those with and without a disability. The
‘International Classification of Functioning, Disability and Health’ defines disability as ‘an
umbrella term for impairments, activity limitations and participation restrictions. It denotes the
negative aspects of the interaction between an individual (with a health condition) and that
individual’s contextual factors (environmental and personal factors).’ The following limitations in
activity functioning are considered in the RPHC4: seeing, hearing, speaking, walking/climbing,
learning/concentrating and another type of difficulty/disability.
Total fertility rate (TFR): refers to the average number of children a hypothetical cohort of
women would have at the end of their reproductive period during their lifetime if they were
subject to experiencing the ASFRs of a given period. It is calculated by summing the ASFRs
and multiplying the sum by the width of the age interval.
Age-specific fertility rate (ASFR): refers to the number of births to women in a specific age
group, divided by the number of women in that age group. The ASFR is expressed as number
of births per 1,000 women.
Mean age at childbearing: the mean age of mothers at the time of the birth of their children if
women were subject throughout their lives to the ASFRs observed in a given year.
Parity: the number of children born alive to a woman. Zero parity women are those with no live
births and single parity refers to those women who have one child and so on.
Nuptiality: refers to marriage as a population phenomenon, including the rate at which it
occurs, the characteristics of people united in marriage, and the dissolution of such unions
(through divorce, separation, widowhood, and annulment). The question on marital status was
formulated as follows: ‘what is [name]’s marital status?’ Men in marital union were further asked
the type of union, whether it is a monogamous or a polygamous union, and the age at first
50
union. Women in union were asked about their rank as spouse and their age at first union.
Marital status: personal status of each individual in relation to the marriage laws or customs of
the country and defined in the Census in five categories: Never married: an individual who has
never been in a union; Married: an individual who was in marital union at the moment of the
Census, legally or not; Divorced: an individual who has been separated from his or her spouse
through a court decision, according to legislation; Separated: an individual who has separated
temporarily from his/her spouse and is awaiting the court decision; Widowed: a man or a woman
who has lost his or her spouse by death, not yet remarried. The marital status of all usual
residents aged 12 and above is enquired about in the Census questionnaire.
Monogamous: is defined as having one spouse. This indicator is only calculated for currently
married or separated males aged 12 and above living in private households.
Polygamous: is defined as having more than one spouse. This indicator is only calculated for
currently married or separated males aged 12 and above living in private households.
Housing and household characteristics
Household: the concept of the household is based on the arrangements in regard to food or
other essentials for living. One household occupies a single housing unit.
Private household: consists of one or more persons living together and sharing at least one
daily meal. Persons in a private household may or may not be related, or may constitute a
combination of persons both related and unrelated. In order to facilitate analysis of the de jure
population (usual residents) across thematic reports, private households were further
categorised as follows:
Households where there is at least one usual resident in the household (present or absent resident); and Households consisting only of visitors (e.g. households found during the Census in their holiday homes, etc.) Subsequently, and across all thematic reports, any analysis of the characteristics of ‘private
households’ will refer to the definition in (a) above, whereas analysis of ‘private housing units’
will refer to households under both (a) and (b).
Types of private households:
One-person household: consists only of the head of the household. Nuclear household: refers to a household consisting entirely of a single family nucleus. It may be classified into married couple, family with children or without children or single parent with children only. Extended household: people related to each other and living together but who do not form a nuclear family. Composite household: people not related to each other living together; extended or
51
nuclear family living with non-relatives. Institutional household: comprises a group of persons who are being provided with
institutionalised care, and includes educational institutions, health care institutions, military
institutions, religious institutions, or institutions for the elderly or persons with disabilities. In the
RPHC4, persons who were homeless on the night of the Census were also classified as
belonging to an institutional household.
Head of household: refers to a person recognised as such by the respondent. Every private
household has one and only one household head.
Structure: for Census purposes, a structure constitutes a building used for dwelling purposes. A
structure can contain one or more dwelling units.
Types of habitat: there are five types of habitat for private households: clustered rural
settlement (umudugudu)/old settlement, dispersed/isolated habitat, planned urban housing
(cadastre), and spontaneous or squatter habitat (Akajagari).
Sources of drinking water: have been split into improved and unimproved sources. Improved
sources include internal pipe-borne water, pipe-borne water in the compound, public tap outside
the compound, protected spring/well, and rain water. These categorisations are based on the
definition developed by the World Health Organization (WHO) and the United Nations Children’s
Fund (UNICEF) Joint Monitoring Programme (NISR, n.d.) in 2010. Unimproved sources include
unprotected springs/wells, rivers and lakes/streams/ponds/surface water.
Housing tenure: refers to legal occupation of the dwelling. Usually, occupancy here is defined
as owner, tenant, hire purchase, free lodging, staff housing or refugee/temporary camp
settlement.
Migration and spatial mobility
Lifetime migrant: is a person whose place of residence at birth (district) differs from the place
of current residence (district). The number stated in this case is, however, an underestimation of
the extent of migration that has occurred during the lifetime of the population. People who
moved from their place of birth to a given destination and then returned before the Census date
as well as people who moved but died before the Census date will not be counted. Figures at
the provincial level have been aggregated from the district level, i.e. they do not necessarily
mean that the person has moved between provinces.
International lifetime migrant: is, in the context of the thematic analysis of the RPHC4,
defined as a person whose country of birth is not Rwanda (i.e. foreign born).
Recent migrant: is a person who moved to his/her current district of residence five years or
less prior to the Census.
International recent migrant: is a person who was previously living abroad and has been living
52
in Rwanda for five years or less.
Internal migration: human movement within the borders of a country usually measured across
regional, district or municipality boundaries resulting in a change of usual place of residence.
For the thematic report on migration, the district will be the geographic partition to be
considered.
Net migration: refers to the total number of in-migrants to a geographical area (e.g. district,
province or country) minus the number of out-migrants over a specified period. Net migration is
presented in terms of net lifetime migration as well as net recent migration.
Migration effectiveness: is the ratio of net migration to gross migration. It is meant to display
the magnitude of the effective addition (or loss) through migration to the overall gross
movement.
Education
Education system (Rwanda) and degrees/certificates: the education system in Rwanda is
organised in four levels:
Pre-primary education: is organised in nursery schools for a period of three years for
children between the ages of three and six.
Primary education: lasts for six years and the official age at this level is seven to 12.
Secondary education: lasts for six years and the official age for this level is 13 to 18. It
is composed of lower secondary (the first three years – often referred to as Tronc
Commun) and upper secondary (the second three years). The following certificates
and/or diplomas were or are currently awarded at this level of education:
ENTA: (Ecole Normale Technique Auxiliaire) – a certificate awarded upon
successful completion of five years of secondary school. This type of certificate is
no longer available.
A3/D4/D5: certificates awarded upon successful completion of three, four or five
years of secondary school. This type of certificate is no longer available.
A2/D6/D7: certificates awarded upon successful completion of six or seven years
of secondary school.
Previously, post-primary education constituted an alternative to lower secondary
school that targeted specialised fields of study and allowed students, after successfully
completing three years of study, to either: i) enter upper secondary level or ii) enter the
labour market. Some disaggregations by highest level attended may group post-primary
and secondary education. The following certificates and/or diplomas were awarded at
this level of education:
EMA (Ecole des Moniteurs Auxiliaire): a certificate awarded upon successful
completion of two years of post-primary education, when this level existed in the
education system.
CE/FM (Centre d’Enseignement Rural Artisanal Integré/Certificat d'Etude
53
Familiale): a certificate awarded upon successful completion of three years of
post-primary education.
Tertiary education: the duration of tertiary education varies between three and
six years according to the institution and the field of study. The following
certificates and/or diplomas were or are currently awarded at this level of
education:
Bacc/diploma: a degree previously awarded upon successful completion of two
years of university. It is no longer available.
Bachelor’s: a degree awarded upon successful completion of four years of
university.
Master’s: a degree awarded to a university graduate upon his/her successful
completion of at least one year of post-graduate studies.
PhD: a degree awarded to a university graduate upon his/her successful
completion of a doctoral programme, usually lasting between three and four
years.
Highest level of education attended: current or previous attendance at any regular accredited
educational institution or programme, public or private, for organised learning at pre-school,
primary, post-primary, secondary, university level – or none.
Net Attendance Ratio (NAR): attendance of the official age group for a given level of education
expressed as a percentage of the corresponding school-age population.
Gross Attendance Ratio (GAR): total attendance in a specific level of education, regardless of
age, expressed as a percentage of the corresponding school-age population.
Gender Parity Index (GPI): ratio of number or proportion of female population to male
population for a given indicator. It measures gender equality between girls’ and boys’
performance in school.
School life expectancy (SLE) (primary to tertiary education): total number of years of formal
education that a person of a given age can expect to receive in terms of future education. SLE
is the total number of years of schooling (primary to tertiary) that a child can expect to receive,
assuming that the probability of he or she attending school at any particular future age is equal
to the current attendance ratio at that age.
Literacy: the ability to both read and write with understanding (self-reported). A literate person
is one who can both read and write a short, simple statement on his or her everyday life. An
illiterate person is one who cannot, with understanding, both read and write such a statement.
Hence, a person capable of reading and writing only figures and his or her own name should be
considered illiterate, as should a person who can read but not write as well as one who can read
and write only a ritual phrase that has been memorised. Literacy is recorded in the following
languages: Kinyarwanda, English, French and Other.
54
Employment/economic activity
Working age: even though the minimum working age specified in the labour law of Rwanda is
16, the 2012 RPHC collected data on the economic activities of persons aged five and above.
The official retirement age is 60, but there is no upper limit to the working age in the Rwandan
context. Employment indicators are computed for the resident population aged 16 and above,
except for the analysis of children in employment.
Employed population: refers to persons who worked at least one hour in the seven-day period
before the Census night, or who were temporarily absent from a job, or who were engaged in
productive activities during the reference period, including: farming/rearing animals/fishing;
production; services/selling; and domestic work at someone else’s house.
Unemployed population: refers to persons who, during the seven-day period before the
Census night, were without work but available for work. This constitutes the ‘relaxed’ definition
of unemployment, as the condition of seeking work during the reference period is not taken into
consideration.
Economically active population/labour force: refers to the sum of the employed and
unemployed populations.
Inactive population: refers to persons who during the seven-day period before the Census
night were without work and not available for work. These include persons looking after the
house/family, students, people who have retired and persons who consider themselves too old
to work.
Labour force participation rate (LFPR): defined as the ratio of the active population to the
sum of the active and inactive population, expressed in percentage terms. Persons whose
economic activity status has not been stated are excluded from the calculation of the LFPR.
Unemployment rate: defined as the ratio of unemployed to the labour force, expressed in
percentage terms.
Status in employment: the International Standard Classification of status in employment
identifies the following statuses: employees are persons working in paid (wage/salary, in-kind)
employment; employers are persons on own account or with one or a number of partners in a
self-employed job who engage one or more employees on a continuous basis; the self-
employed are persons on own account or with one or a number of partners in a self-employed
job not engaging any employee on a continuous basis; contributing family workers are persons
working for an establishment operated by a household member who cannot be regarded as a
partner; and members of producers’ cooperatives are persons working in a cooperative
producing goods and services, in a self-employed job, not engaging any employee on a
continuous basis.
Main industry and main occupation: the classifications of the main branch of economic
55
activity are based on the International Standard Industrial Classification (ISIC), version 4 and
the classifications of the main occupation are based on the International Standard Classification
of Occupations (ISCO), version 4.
Economic dependency ratio: is measured as the ratio between economically dependent
persons (sum of unemployed, inactive, and children aged five and under) and employed
persons, multiplied by 100. An economic dependency ratio of 100 would imply that one
employed person has to support one economically dependent person.
Socio-cultural characteristics
Religion: the following nine response options were offered to measure religious affiliation in
Rwanda: Catholic, Protestant, Adventist, Jehovah’s Witness, other Christian religion, Muslim,
traditionalist/animist, other religion and no religious affiliation
Nationality: nationality means the state of being legally a citizen of a particular country or the
legal right of belonging to a particular nation whether by birth or naturalisation. Types of
nationality are identified as single and dual nationality, which refers to the state of being a
citizen of two countries. Article 7 of the Constitution of Rwanda specifies that persons of
Rwandan origin, along with their descendants, have the right to acquire Rwandan nationality on
demand. The same article provides allowance for dual nationality.
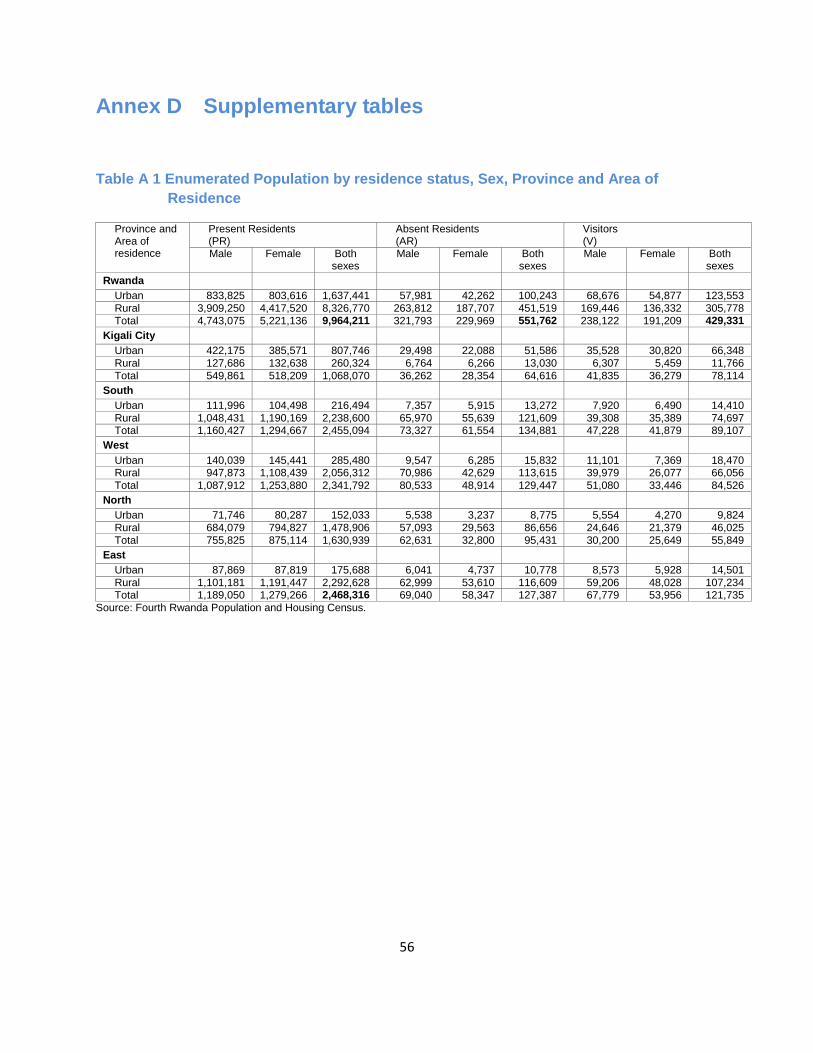
56
Annex D Supplementary tables
Table A 1 Enumerated Population by residence status, Sex, Province and Area of
Residence
Province and Area of residence
Present Residents (PR)
Absent Residents (AR)
Visitors (V)
Male Female Both sexes
Male Female Both sexes
Male Female Both sexes
Rwanda Urban 833,825 803,616 1,637,441 57,981 42,262 100,243 68,676 54,877 123,553 Rural 3,909,250 4,417,520 8,326,770 263,812 187,707 451,519 169,446 136,332 305,778 Total 4,743,075 5,221,136 9,964,211 321,793 229,969 551,762 238,122 191,209 429,331
Kigali City Urban 422,175 385,571 807,746 29,498 22,088 51,586 35,528 30,820 66,348 Rural 127,686 132,638 260,324 6,764 6,266 13,030 6,307 5,459 11,766 Total 549,861 518,209 1,068,070 36,262 28,354 64,616 41,835 36,279 78,114
South Urban 111,996 104,498 216,494 7,357 5,915 13,272 7,920 6,490 14,410 Rural 1,048,431 1,190,169 2,238,600 65,970 55,639 121,609 39,308 35,389 74,697 Total 1,160,427 1,294,667 2,455,094 73,327 61,554 134,881 47,228 41,879 89,107
West Urban 140,039 145,441 285,480 9,547 6,285 15,832 11,101 7,369 18,470 Rural 947,873 1,108,439 2,056,312 70,986 42,629 113,615 39,979 26,077 66,056 Total 1,087,912 1,253,880 2,341,792 80,533 48,914 129,447 51,080 33,446 84,526
North Urban 71,746 80,287 152,033 5,538 3,237 8,775 5,554 4,270 9,824 Rural 684,079 794,827 1,478,906 57,093 29,563 86,656 24,646 21,379 46,025 Total 755,825 875,114 1,630,939 62,631 32,800 95,431 30,200 25,649 55,849
East Urban 87,869 87,819 175,688 6,041 4,737 10,778 8,573 5,928 14,501 Rural 1,101,181 1,191,447 2,292,628 62,999 53,610 116,609 59,206 48,028 107,234 Total 1,189,050 1,279,266 2,468,316 69,040 58,347 127,387 67,779 53,956 121,735
Source: Fourth Rwanda Population and Housing Census.
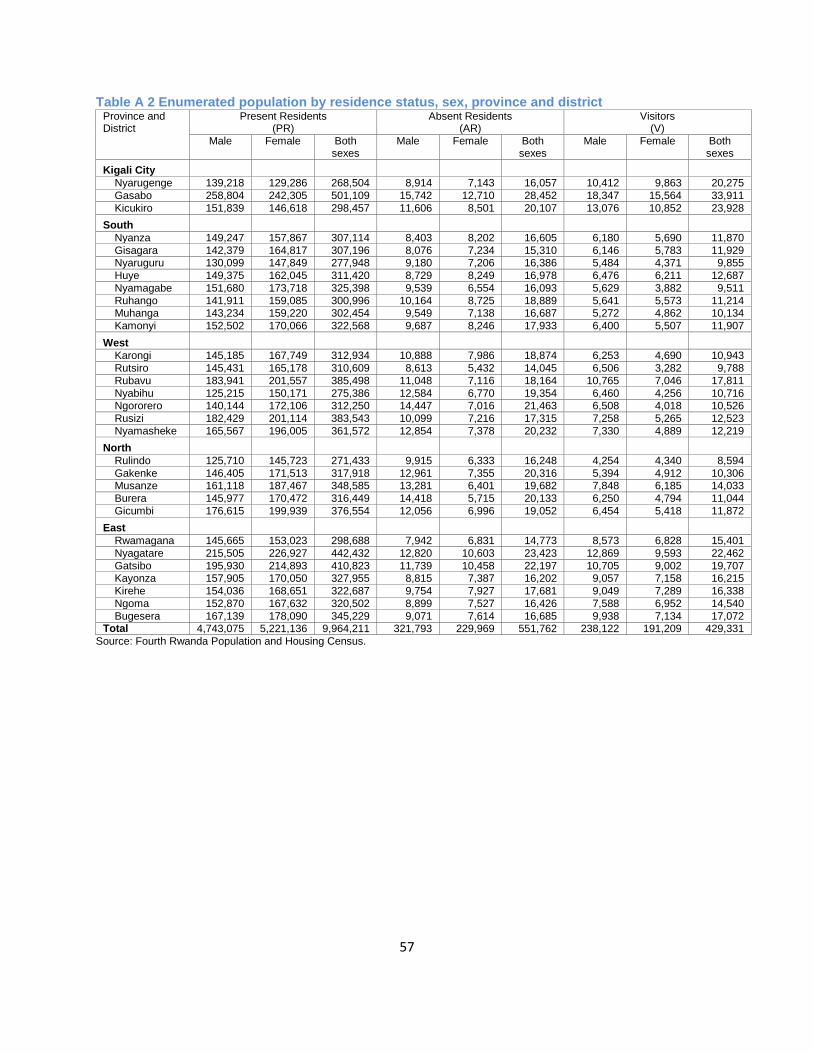
57
Table A 2 Enumerated population by residence status, sex, province and district
Province and District
Present Residents (PR)
Absent Residents (AR)
Visitors (V)
Male Female Both sexes
Male Female Both sexes
Male Female Both sexes
Kigali City Nyarugenge 139,218 129,286 268,504 8,914 7,143 16,057 10,412 9,863 20,275 Gasabo 258,804 242,305 501,109 15,742 12,710 28,452 18,347 15,564 33,911 Kicukiro 151,839 146,618 298,457 11,606 8,501 20,107 13,076 10,852 23,928
South Nyanza 149,247 157,867 307,114 8,403 8,202 16,605 6,180 5,690 11,870 Gisagara 142,379 164,817 307,196 8,076 7,234 15,310 6,146 5,783 11,929 Nyaruguru 130,099 147,849 277,948 9,180 7,206 16,386 5,484 4,371 9,855 Huye 149,375 162,045 311,420 8,729 8,249 16,978 6,476 6,211 12,687 Nyamagabe 151,680 173,718 325,398 9,539 6,554 16,093 5,629 3,882 9,511 Ruhango 141,911 159,085 300,996 10,164 8,725 18,889 5,641 5,573 11,214 Muhanga 143,234 159,220 302,454 9,549 7,138 16,687 5,272 4,862 10,134 Kamonyi 152,502 170,066 322,568 9,687 8,246 17,933 6,400 5,507 11,907
West Karongi 145,185 167,749 312,934 10,888 7,986 18,874 6,253 4,690 10,943 Rutsiro 145,431 165,178 310,609 8,613 5,432 14,045 6,506 3,282 9,788 Rubavu 183,941 201,557 385,498 11,048 7,116 18,164 10,765 7,046 17,811 Nyabihu 125,215 150,171 275,386 12,584 6,770 19,354 6,460 4,256 10,716 Ngororero 140,144 172,106 312,250 14,447 7,016 21,463 6,508 4,018 10,526 Rusizi 182,429 201,114 383,543 10,099 7,216 17,315 7,258 5,265 12,523 Nyamasheke 165,567 196,005 361,572 12,854 7,378 20,232 7,330 4,889 12,219
North Rulindo 125,710 145,723 271,433 9,915 6,333 16,248 4,254 4,340 8,594 Gakenke 146,405 171,513 317,918 12,961 7,355 20,316 5,394 4,912 10,306 Musanze 161,118 187,467 348,585 13,281 6,401 19,682 7,848 6,185 14,033 Burera 145,977 170,472 316,449 14,418 5,715 20,133 6,250 4,794 11,044 Gicumbi 176,615 199,939 376,554 12,056 6,996 19,052 6,454 5,418 11,872
East Rwamagana 145,665 153,023 298,688 7,942 6,831 14,773 8,573 6,828 15,401 Nyagatare 215,505 226,927 442,432 12,820 10,603 23,423 12,869 9,593 22,462 Gatsibo 195,930 214,893 410,823 11,739 10,458 22,197 10,705 9,002 19,707 Kayonza 157,905 170,050 327,955 8,815 7,387 16,202 9,057 7,158 16,215 Kirehe 154,036 168,651 322,687 9,754 7,927 17,681 9,049 7,289 16,338 Ngoma 152,870 167,632 320,502 8,899 7,527 16,426 7,588 6,952 14,540 Bugesera 167,139 178,090 345,229 9,071 7,614 16,685 9,938 7,134 17,072
Total 4,743,075 5,221,136 9,964,211 321,793 229,969 551,762 238,122 191,209 429,331 Source: Fourth Rwanda Population and Housing Census.
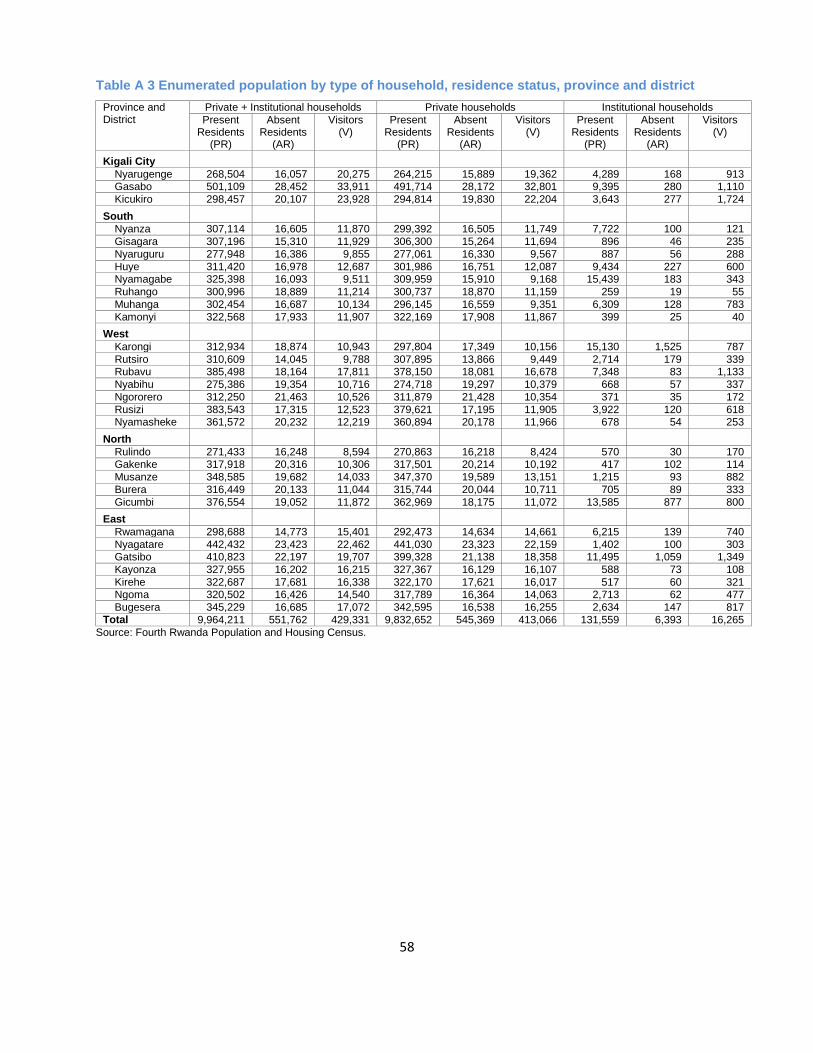
58
Table A 3 Enumerated population by type of household, residence status, province and district
Province and District
Private + Institutional households Private households Institutional households Present
Residents (PR)
Absent Residents
(AR)
Visitors (V)
Present Residents
(PR)
Absent Residents
(AR)
Visitors (V)
Present Residents
(PR)
Absent Residents
(AR)
Visitors (V)
Kigali City Nyarugenge 268,504 16,057 20,275 264,215 15,889 19,362 4,289 168 913 Gasabo 501,109 28,452 33,911 491,714 28,172 32,801 9,395 280 1,110 Kicukiro 298,457 20,107 23,928 294,814 19,830 22,204 3,643 277 1,724
South Nyanza 307,114 16,605 11,870 299,392 16,505 11,749 7,722 100 121 Gisagara 307,196 15,310 11,929 306,300 15,264 11,694 896 46 235 Nyaruguru 277,948 16,386 9,855 277,061 16,330 9,567 887 56 288 Huye 311,420 16,978 12,687 301,986 16,751 12,087 9,434 227 600 Nyamagabe 325,398 16,093 9,511 309,959 15,910 9,168 15,439 183 343 Ruhango 300,996 18,889 11,214 300,737 18,870 11,159 259 19 55 Muhanga 302,454 16,687 10,134 296,145 16,559 9,351 6,309 128 783 Kamonyi 322,568 17,933 11,907 322,169 17,908 11,867 399 25 40
West Karongi 312,934 18,874 10,943 297,804 17,349 10,156 15,130 1,525 787 Rutsiro 310,609 14,045 9,788 307,895 13,866 9,449 2,714 179 339 Rubavu 385,498 18,164 17,811 378,150 18,081 16,678 7,348 83 1,133 Nyabihu 275,386 19,354 10,716 274,718 19,297 10,379 668 57 337 Ngororero 312,250 21,463 10,526 311,879 21,428 10,354 371 35 172 Rusizi 383,543 17,315 12,523 379,621 17,195 11,905 3,922 120 618 Nyamasheke 361,572 20,232 12,219 360,894 20,178 11,966 678 54 253
North Rulindo 271,433 16,248 8,594 270,863 16,218 8,424 570 30 170 Gakenke 317,918 20,316 10,306 317,501 20,214 10,192 417 102 114 Musanze 348,585 19,682 14,033 347,370 19,589 13,151 1,215 93 882 Burera 316,449 20,133 11,044 315,744 20,044 10,711 705 89 333 Gicumbi 376,554 19,052 11,872 362,969 18,175 11,072 13,585 877 800
East Rwamagana 298,688 14,773 15,401 292,473 14,634 14,661 6,215 139 740 Nyagatare 442,432 23,423 22,462 441,030 23,323 22,159 1,402 100 303 Gatsibo 410,823 22,197 19,707 399,328 21,138 18,358 11,495 1,059 1,349 Kayonza 327,955 16,202 16,215 327,367 16,129 16,107 588 73 108 Kirehe 322,687 17,681 16,338 322,170 17,621 16,017 517 60 321 Ngoma 320,502 16,426 14,540 317,789 16,364 14,063 2,713 62 477 Bugesera 345,229 16,685 17,072 342,595 16,538 16,255 2,634 147 817
Total 9,964,211 551,762 429,331 9,832,652 545,369 413,066 131,559 6,393 16,265 Source: Fourth Rwanda Population and Housing Census.

59
Table A 4 Resident population by sex, age and area of residence (counts)
Age (Years) Rwanda Urban Rural
Male Female Both sexes Male Female Both sexes
Male Female Both sexes
0 154,732 154,825 309,557 24,927 24,309 49,236 129,805 130,516 260,321 1 151,726 151,496 303,222 23,107 23,184 46,291 128,619 128,312 256,931 2 141,694 143,190 284,884 21,349 21,461 42,810 120,345 121,729 242,074 3 157,682 159,157 316,839 22,302 22,333 44,635 135,380 136,824 272,204 4 162,215 163,310 325,525 22,127 22,205 44,332 140,088 141,105 281,193 5 155,816 155,765 311,581 21,500 21,070 42,570 134,316 134,695 269,011 6 162,282 164,630 326,912 21,132 21,258 42,390 141,150 143,372 284,522 7 154,912 155,597 310,509 20,245 20,197 40,442 134,667 135,400 270,067 8 143,432 145,925 289,357 19,295 19,287 38,582 124,137 126,638 250,775 9 140,979 143,648 284,627 18,865 19,020 37,885 122,114 124,628 246,742 10 144,237 147,619 291,856 19,083 19,140 38,223 125,154 128,479 253,633 11 110,224 113,202 223,426 15,968 16,329 32,297 94,256 96,873 191,129 12 154,167 158,517 312,684 20,511 21,078 41,589 133,656 137,439 271,095 13 107,377 110,257 217,634 15,458 16,359 31,817 91,919 93,898 185,817 14 107,435 112,035 219,470 15,772 17,717 33,489 91,663 94,318 185,981 15 114,161 119,641 233,802 16,290 19,656 35,946 97,871 99,985 197,856 16 123,415 128,765 252,180 17,988 21,305 39,293 105,427 107,460 212,887 17 100,230 100,833 201,063 16,032 18,214 34,246 84,198 82,619 166,817 18 119,207 122,415 241,622 20,981 24,107 45,088 98,226 98,308 196,534 19 89,850 94,558 184,408 17,789 18,921 36,710 72,061 75,637 147,698 20 109,090 116,825 225,915 22,328 23,081 45,409 86,762 93,744 180,506 21 88,769 96,635 185,404 19,840 19,843 39,683 68,929 76,792 145,721 22 107,427 112,078 219,505 25,237 23,293 48,530 82,190 88,785 170,975 23 93,748 99,191 192,939 23,629 21,851 45,480 70,119 77,340 147,459 24 100,382 104,240 204,622 25,101 22,200 47,301 75,281 82,040 157,321 25 96,723 99,164 195,887 24,489 20,989 45,478 72,234 78,175 150,409 26 90,493 95,381 185,874 23,186 19,620 42,806 67,307 75,761 143,068 27 94,453 96,042 190,495 24,237 19,283 43,520 70,216 76,759 146,975 28 94,645 97,536 192,181 23,653 19,160 42,813 70,992 78,376 149,368 29 80,328 83,329 163,657 20,166 16,196 36,362 60,162 67,133 127,295 30 104,077 107,513 211,590 25,216 19,453 44,669 78,861 88,060 166,921 31 69,376 71,905 141,281 16,432 12,637 29,069 52,944 59,268 112,212 32 81,478 82,443 163,921 19,831 15,346 35,177 61,647 67,097 128,744 33 57,333 63,717 121,050 14,371 11,962 26,333 42,962 51,755 94,717 34 55,653 67,389 123,042 13,067 11,639 24,706 42,586 55,750 98,336 35 54,857 62,012 116,869 12,909 10,559 23,468 41,948 51,453 93,401 36 44,354 53,801 98,155 10,413 9,146 19,559 33,941 44,655 78,596 37 46,510 54,774 101,284 10,828 9,165 19,993 35,682 45,609 81,291 38 45,649 55,751 101,400 10,217 8,928 19,145 35,432 46,823 82,255 39 41,452 50,506 91,958 9,136 8,028 17,164 32,316 42,478 74,794 40 47,274 56,321 103,595 10,222 8,296 18,518 37,052 48,025 85,077 41 32,733 39,184 71,917 6,744 5,485 12,229 25,989 33,699 59,688 42 42,425 48,912 91,337 8,818 6,965 15,783 33,607 41,947 75,554 43 32,383 38,453 70,836 6,739 5,587 12,326 25,644 32,866 58,510 44 36,061 41,814 77,875 7,104 5,730 12,834 28,957 36,084 65,041 45 32,295 38,178 70,473 6,231 4,842 11,073 26,064 33,336 59,400 46 30,091 35,753 65,844 5,615 4,532 10,147 24,476 31,221 55,697 47 29,835 34,371 64,206 5,514 4,525 10,039 24,321 29,846 54,167 48 32,856 39,594 72,450 5,576 4,655 10,231 27,280 34,939 62,219 49 30,480 37,403 67,883 4,900 4,054 8,954 25,580 33,349 58,929 50 38,266 47,922 86,188 5,881 4,917 10,798 32,385 43,005 75,390 51 24,107 29,353 53,460 3,537 2,968 6,505 20,570 26,385 46,955 52 32,685 39,836 72,521 4,912 4,100 9,012 27,773 35,736 63,509 53 29,529 36,949 66,478 4,181 3,837 8,018 25,348 33,112 58,460 54 27,210 32,452 59,662 3,816 3,262 7,078 23,394 29,190 52,584 55 24,624 29,355 53,979 3,326 2,903 6,229 21,298 26,452 47,750 56 23,143 29,997 53,140 3,031 2,911 5,942 20,112 27,086 47,198 57 21,631 26,804 48,435 2,770 2,467 5,237 18,861 24,337 43,198 58 20,328 25,633 45,961 2,656 2,424 5,080 17,672 23,209 40,881 59 17,103 22,705 39,808 2,214 2,102 4,316 14,889 20,603 35,492
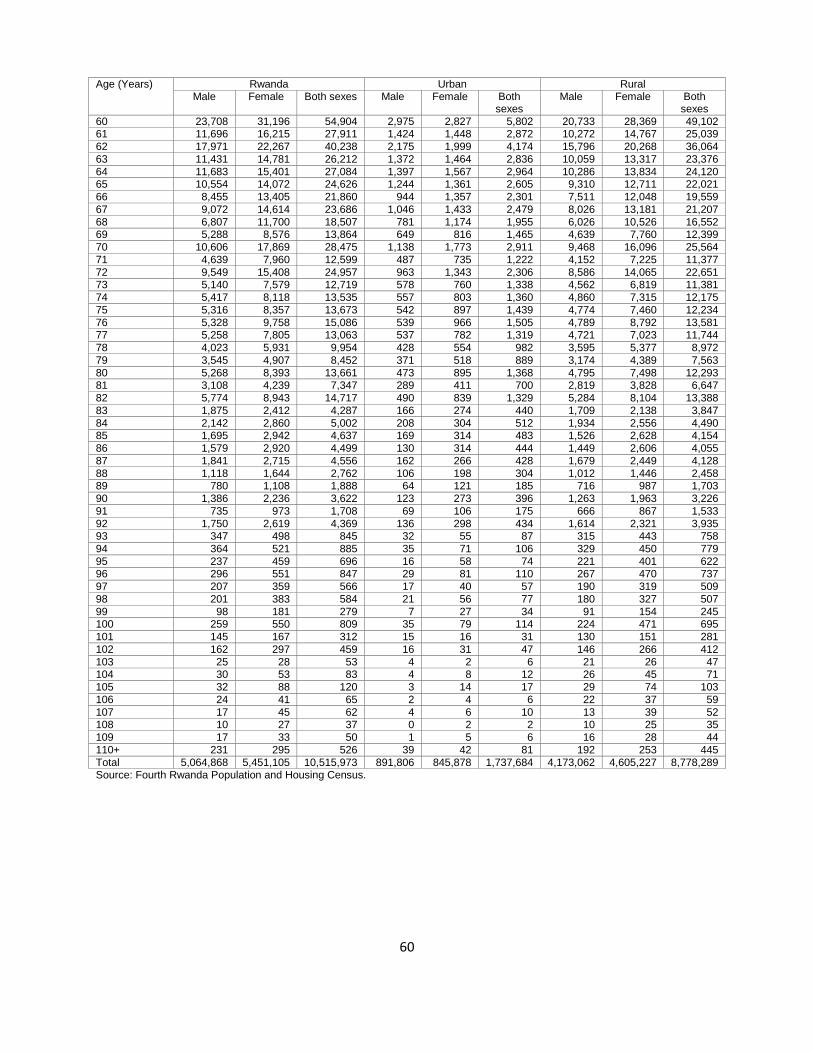
60
Age (Years) Rwanda Urban Rural Male Female Both sexes Male Female Both
sexes Male Female Both
sexes 60 23,708 31,196 54,904 2,975 2,827 5,802 20,733 28,369 49,102 61 11,696 16,215 27,911 1,424 1,448 2,872 10,272 14,767 25,039 62 17,971 22,267 40,238 2,175 1,999 4,174 15,796 20,268 36,064 63 11,431 14,781 26,212 1,372 1,464 2,836 10,059 13,317 23,376 64 11,683 15,401 27,084 1,397 1,567 2,964 10,286 13,834 24,120 65 10,554 14,072 24,626 1,244 1,361 2,605 9,310 12,711 22,021 66 8,455 13,405 21,860 944 1,357 2,301 7,511 12,048 19,559 67 9,072 14,614 23,686 1,046 1,433 2,479 8,026 13,181 21,207 68 6,807 11,700 18,507 781 1,174 1,955 6,026 10,526 16,552 69 5,288 8,576 13,864 649 816 1,465 4,639 7,760 12,399 70 10,606 17,869 28,475 1,138 1,773 2,911 9,468 16,096 25,564 71 4,639 7,960 12,599 487 735 1,222 4,152 7,225 11,377 72 9,549 15,408 24,957 963 1,343 2,306 8,586 14,065 22,651 73 5,140 7,579 12,719 578 760 1,338 4,562 6,819 11,381 74 5,417 8,118 13,535 557 803 1,360 4,860 7,315 12,175 75 5,316 8,357 13,673 542 897 1,439 4,774 7,460 12,234 76 5,328 9,758 15,086 539 966 1,505 4,789 8,792 13,581 77 5,258 7,805 13,063 537 782 1,319 4,721 7,023 11,744 78 4,023 5,931 9,954 428 554 982 3,595 5,377 8,972 79 3,545 4,907 8,452 371 518 889 3,174 4,389 7,563 80 5,268 8,393 13,661 473 895 1,368 4,795 7,498 12,293 81 3,108 4,239 7,347 289 411 700 2,819 3,828 6,647 82 5,774 8,943 14,717 490 839 1,329 5,284 8,104 13,388 83 1,875 2,412 4,287 166 274 440 1,709 2,138 3,847 84 2,142 2,860 5,002 208 304 512 1,934 2,556 4,490 85 1,695 2,942 4,637 169 314 483 1,526 2,628 4,154 86 1,579 2,920 4,499 130 314 444 1,449 2,606 4,055 87 1,841 2,715 4,556 162 266 428 1,679 2,449 4,128 88 1,118 1,644 2,762 106 198 304 1,012 1,446 2,458 89 780 1,108 1,888 64 121 185 716 987 1,703 90 1,386 2,236 3,622 123 273 396 1,263 1,963 3,226 91 735 973 1,708 69 106 175 666 867 1,533 92 1,750 2,619 4,369 136 298 434 1,614 2,321 3,935 93 347 498 845 32 55 87 315 443 758 94 364 521 885 35 71 106 329 450 779 95 237 459 696 16 58 74 221 401 622 96 296 551 847 29 81 110 267 470 737 97 207 359 566 17 40 57 190 319 509 98 201 383 584 21 56 77 180 327 507 99 98 181 279 7 27 34 91 154 245 100 259 550 809 35 79 114 224 471 695 101 145 167 312 15 16 31 130 151 281 102 162 297 459 16 31 47 146 266 412 103 25 28 53 4 2 6 21 26 47 104 30 53 83 4 8 12 26 45 71 105 32 88 120 3 14 17 29 74 103 106 24 41 65 2 4 6 22 37 59 107 17 45 62 4 6 10 13 39 52 108 10 27 37 0 2 2 10 25 35 109 17 33 50 1 5 6 16 28 44 110+ 231 295 526 39 42 81 192 253 445 Total 5,064,868 5,451,105 10,515,973 891,806 845,878 1,737,684 4,173,062 4,605,227 8,778,289 Source: Fourth Rwanda Population and Housing Census.
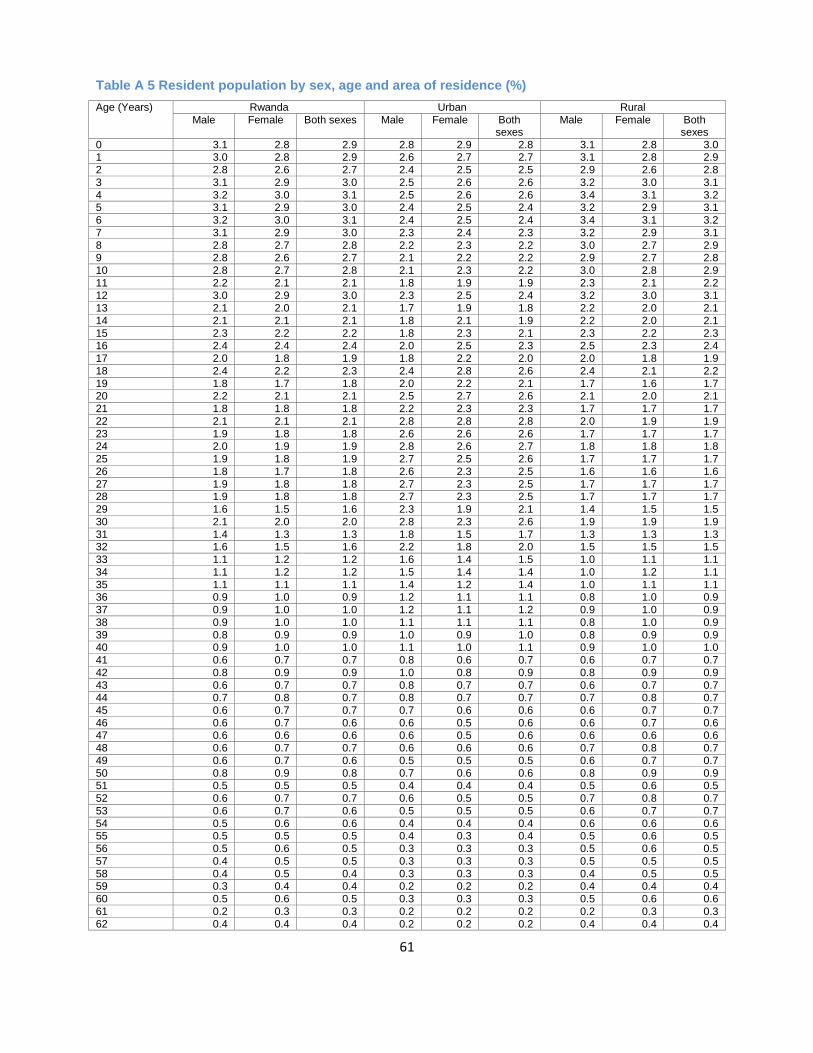
61
Table A 5 Resident population by sex, age and area of residence (%)
Age (Years) Rwanda Urban Rural Male Female Both sexes Male Female Both
sexes Male Female Both
sexes 0 3.1 2.8 2.9 2.8 2.9 2.8 3.1 2.8 3.0 1 3.0 2.8 2.9 2.6 2.7 2.7 3.1 2.8 2.9 2 2.8 2.6 2.7 2.4 2.5 2.5 2.9 2.6 2.8 3 3.1 2.9 3.0 2.5 2.6 2.6 3.2 3.0 3.1 4 3.2 3.0 3.1 2.5 2.6 2.6 3.4 3.1 3.2 5 3.1 2.9 3.0 2.4 2.5 2.4 3.2 2.9 3.1 6 3.2 3.0 3.1 2.4 2.5 2.4 3.4 3.1 3.2 7 3.1 2.9 3.0 2.3 2.4 2.3 3.2 2.9 3.1 8 2.8 2.7 2.8 2.2 2.3 2.2 3.0 2.7 2.9 9 2.8 2.6 2.7 2.1 2.2 2.2 2.9 2.7 2.8 10 2.8 2.7 2.8 2.1 2.3 2.2 3.0 2.8 2.9 11 2.2 2.1 2.1 1.8 1.9 1.9 2.3 2.1 2.2 12 3.0 2.9 3.0 2.3 2.5 2.4 3.2 3.0 3.1 13 2.1 2.0 2.1 1.7 1.9 1.8 2.2 2.0 2.1 14 2.1 2.1 2.1 1.8 2.1 1.9 2.2 2.0 2.1 15 2.3 2.2 2.2 1.8 2.3 2.1 2.3 2.2 2.3 16 2.4 2.4 2.4 2.0 2.5 2.3 2.5 2.3 2.4 17 2.0 1.8 1.9 1.8 2.2 2.0 2.0 1.8 1.9 18 2.4 2.2 2.3 2.4 2.8 2.6 2.4 2.1 2.2 19 1.8 1.7 1.8 2.0 2.2 2.1 1.7 1.6 1.7 20 2.2 2.1 2.1 2.5 2.7 2.6 2.1 2.0 2.1 21 1.8 1.8 1.8 2.2 2.3 2.3 1.7 1.7 1.7 22 2.1 2.1 2.1 2.8 2.8 2.8 2.0 1.9 1.9 23 1.9 1.8 1.8 2.6 2.6 2.6 1.7 1.7 1.7 24 2.0 1.9 1.9 2.8 2.6 2.7 1.8 1.8 1.8 25 1.9 1.8 1.9 2.7 2.5 2.6 1.7 1.7 1.7 26 1.8 1.7 1.8 2.6 2.3 2.5 1.6 1.6 1.6 27 1.9 1.8 1.8 2.7 2.3 2.5 1.7 1.7 1.7 28 1.9 1.8 1.8 2.7 2.3 2.5 1.7 1.7 1.7 29 1.6 1.5 1.6 2.3 1.9 2.1 1.4 1.5 1.5 30 2.1 2.0 2.0 2.8 2.3 2.6 1.9 1.9 1.9 31 1.4 1.3 1.3 1.8 1.5 1.7 1.3 1.3 1.3 32 1.6 1.5 1.6 2.2 1.8 2.0 1.5 1.5 1.5 33 1.1 1.2 1.2 1.6 1.4 1.5 1.0 1.1 1.1 34 1.1 1.2 1.2 1.5 1.4 1.4 1.0 1.2 1.1 35 1.1 1.1 1.1 1.4 1.2 1.4 1.0 1.1 1.1 36 0.9 1.0 0.9 1.2 1.1 1.1 0.8 1.0 0.9 37 0.9 1.0 1.0 1.2 1.1 1.2 0.9 1.0 0.9 38 0.9 1.0 1.0 1.1 1.1 1.1 0.8 1.0 0.9 39 0.8 0.9 0.9 1.0 0.9 1.0 0.8 0.9 0.9 40 0.9 1.0 1.0 1.1 1.0 1.1 0.9 1.0 1.0 41 0.6 0.7 0.7 0.8 0.6 0.7 0.6 0.7 0.7 42 0.8 0.9 0.9 1.0 0.8 0.9 0.8 0.9 0.9 43 0.6 0.7 0.7 0.8 0.7 0.7 0.6 0.7 0.7 44 0.7 0.8 0.7 0.8 0.7 0.7 0.7 0.8 0.7 45 0.6 0.7 0.7 0.7 0.6 0.6 0.6 0.7 0.7 46 0.6 0.7 0.6 0.6 0.5 0.6 0.6 0.7 0.6 47 0.6 0.6 0.6 0.6 0.5 0.6 0.6 0.6 0.6 48 0.6 0.7 0.7 0.6 0.6 0.6 0.7 0.8 0.7 49 0.6 0.7 0.6 0.5 0.5 0.5 0.6 0.7 0.7 50 0.8 0.9 0.8 0.7 0.6 0.6 0.8 0.9 0.9 51 0.5 0.5 0.5 0.4 0.4 0.4 0.5 0.6 0.5 52 0.6 0.7 0.7 0.6 0.5 0.5 0.7 0.8 0.7 53 0.6 0.7 0.6 0.5 0.5 0.5 0.6 0.7 0.7 54 0.5 0.6 0.6 0.4 0.4 0.4 0.6 0.6 0.6 55 0.5 0.5 0.5 0.4 0.3 0.4 0.5 0.6 0.5 56 0.5 0.6 0.5 0.3 0.3 0.3 0.5 0.6 0.5 57 0.4 0.5 0.5 0.3 0.3 0.3 0.5 0.5 0.5 58 0.4 0.5 0.4 0.3 0.3 0.3 0.4 0.5 0.5 59 0.3 0.4 0.4 0.2 0.2 0.2 0.4 0.4 0.4 60 0.5 0.6 0.5 0.3 0.3 0.3 0.5 0.6 0.6 61 0.2 0.3 0.3 0.2 0.2 0.2 0.2 0.3 0.3 62 0.4 0.4 0.4 0.2 0.2 0.2 0.4 0.4 0.4
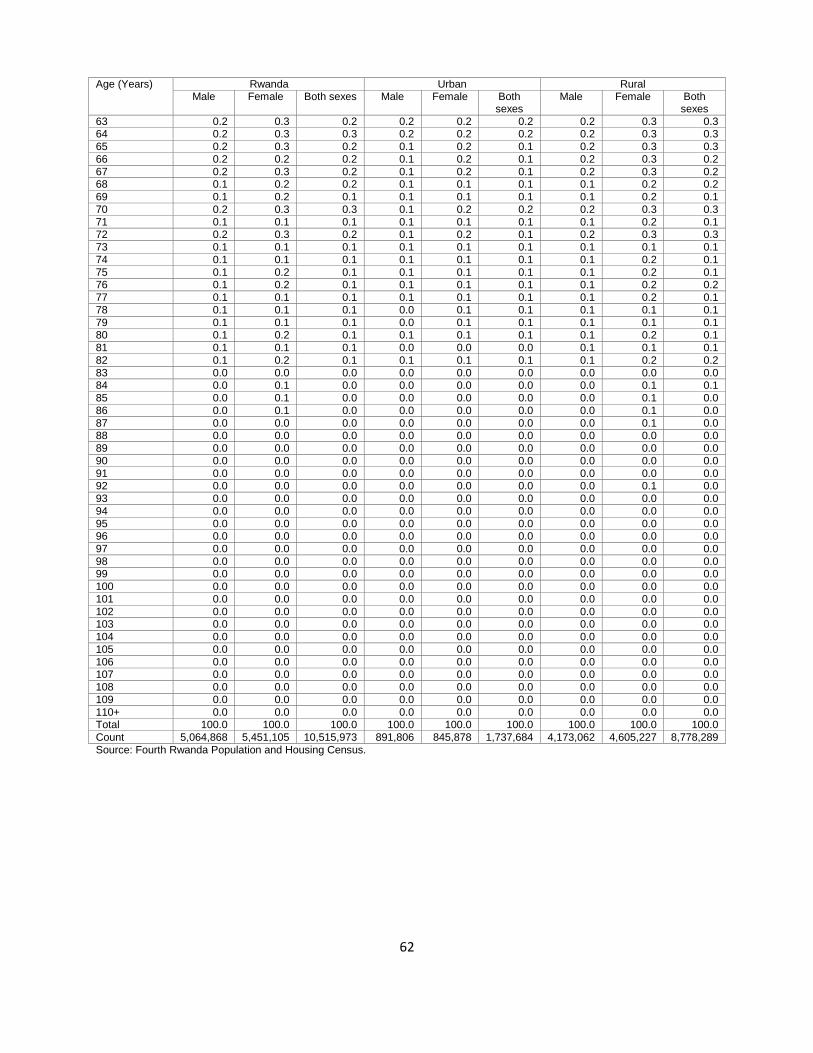
62
Age (Years) Rwanda Urban Rural Male Female Both sexes Male Female Both
sexes Male Female Both
sexes 63 0.2 0.3 0.2 0.2 0.2 0.2 0.2 0.3 0.3 64 0.2 0.3 0.3 0.2 0.2 0.2 0.2 0.3 0.3 65 0.2 0.3 0.2 0.1 0.2 0.1 0.2 0.3 0.3 66 0.2 0.2 0.2 0.1 0.2 0.1 0.2 0.3 0.2 67 0.2 0.3 0.2 0.1 0.2 0.1 0.2 0.3 0.2 68 0.1 0.2 0.2 0.1 0.1 0.1 0.1 0.2 0.2 69 0.1 0.2 0.1 0.1 0.1 0.1 0.1 0.2 0.1 70 0.2 0.3 0.3 0.1 0.2 0.2 0.2 0.3 0.3 71 0.1 0.1 0.1 0.1 0.1 0.1 0.1 0.2 0.1 72 0.2 0.3 0.2 0.1 0.2 0.1 0.2 0.3 0.3 73 0.1 0.1 0.1 0.1 0.1 0.1 0.1 0.1 0.1 74 0.1 0.1 0.1 0.1 0.1 0.1 0.1 0.2 0.1 75 0.1 0.2 0.1 0.1 0.1 0.1 0.1 0.2 0.1 76 0.1 0.2 0.1 0.1 0.1 0.1 0.1 0.2 0.2 77 0.1 0.1 0.1 0.1 0.1 0.1 0.1 0.2 0.1 78 0.1 0.1 0.1 0.0 0.1 0.1 0.1 0.1 0.1 79 0.1 0.1 0.1 0.0 0.1 0.1 0.1 0.1 0.1 80 0.1 0.2 0.1 0.1 0.1 0.1 0.1 0.2 0.1 81 0.1 0.1 0.1 0.0 0.0 0.0 0.1 0.1 0.1 82 0.1 0.2 0.1 0.1 0.1 0.1 0.1 0.2 0.2 83 0.0 0.0 0.0 0.0 0.0 0.0 0.0 0.0 0.0 84 0.0 0.1 0.0 0.0 0.0 0.0 0.0 0.1 0.1 85 0.0 0.1 0.0 0.0 0.0 0.0 0.0 0.1 0.0 86 0.0 0.1 0.0 0.0 0.0 0.0 0.0 0.1 0.0 87 0.0 0.0 0.0 0.0 0.0 0.0 0.0 0.1 0.0 88 0.0 0.0 0.0 0.0 0.0 0.0 0.0 0.0 0.0 89 0.0 0.0 0.0 0.0 0.0 0.0 0.0 0.0 0.0 90 0.0 0.0 0.0 0.0 0.0 0.0 0.0 0.0 0.0 91 0.0 0.0 0.0 0.0 0.0 0.0 0.0 0.0 0.0 92 0.0 0.0 0.0 0.0 0.0 0.0 0.0 0.1 0.0 93 0.0 0.0 0.0 0.0 0.0 0.0 0.0 0.0 0.0 94 0.0 0.0 0.0 0.0 0.0 0.0 0.0 0.0 0.0 95 0.0 0.0 0.0 0.0 0.0 0.0 0.0 0.0 0.0 96 0.0 0.0 0.0 0.0 0.0 0.0 0.0 0.0 0.0 97 0.0 0.0 0.0 0.0 0.0 0.0 0.0 0.0 0.0 98 0.0 0.0 0.0 0.0 0.0 0.0 0.0 0.0 0.0 99 0.0 0.0 0.0 0.0 0.0 0.0 0.0 0.0 0.0 100 0.0 0.0 0.0 0.0 0.0 0.0 0.0 0.0 0.0 101 0.0 0.0 0.0 0.0 0.0 0.0 0.0 0.0 0.0 102 0.0 0.0 0.0 0.0 0.0 0.0 0.0 0.0 0.0 103 0.0 0.0 0.0 0.0 0.0 0.0 0.0 0.0 0.0 104 0.0 0.0 0.0 0.0 0.0 0.0 0.0 0.0 0.0 105 0.0 0.0 0.0 0.0 0.0 0.0 0.0 0.0 0.0 106 0.0 0.0 0.0 0.0 0.0 0.0 0.0 0.0 0.0 107 0.0 0.0 0.0 0.0 0.0 0.0 0.0 0.0 0.0 108 0.0 0.0 0.0 0.0 0.0 0.0 0.0 0.0 0.0 109 0.0 0.0 0.0 0.0 0.0 0.0 0.0 0.0 0.0 110+ 0.0 0.0 0.0 0.0 0.0 0.0 0.0 0.0 0.0 Total 100.0 100.0 100.0 100.0 100.0 100.0 100.0 100.0 100.0 Count 5,064,868 5,451,105 10,515,973 891,806 845,878 1,737,684 4,173,062 4,605,227 8,778,289 Source: Fourth Rwanda Population and Housing Census.
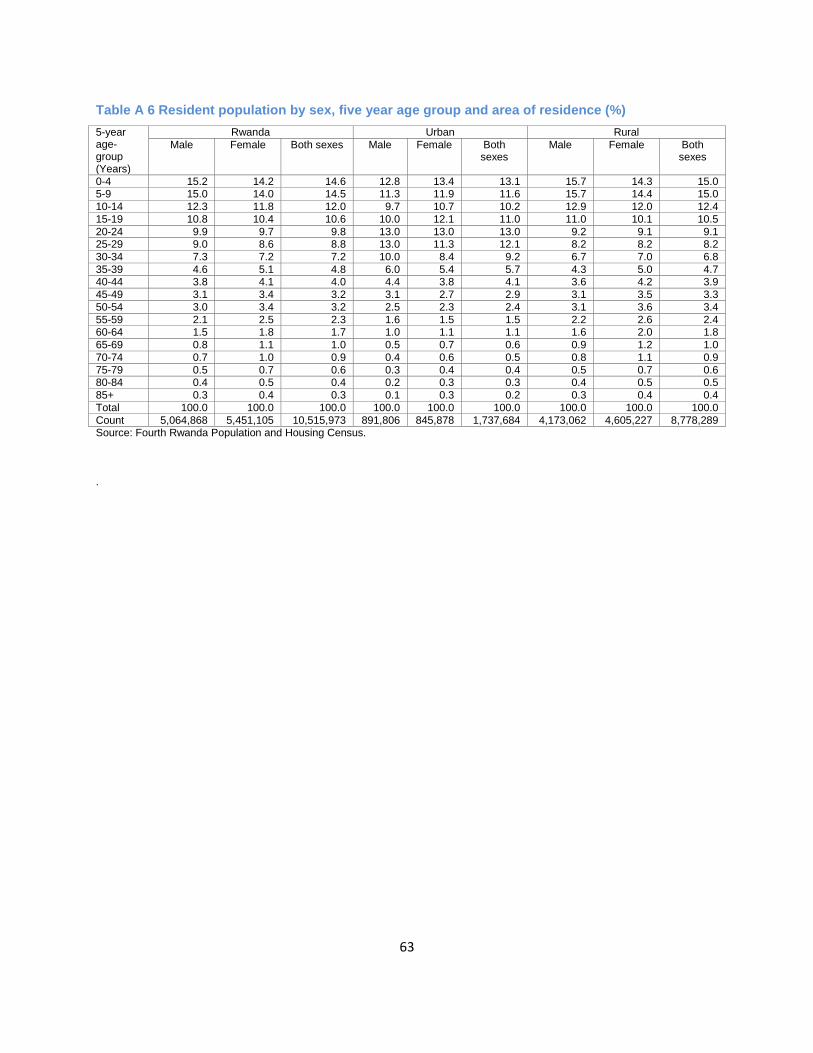
63
Table A 6 Resident population by sex, five year age group and area of residence (%)
5-year age-group (Years)
Rwanda Urban Rural Male Female Both sexes Male Female Both
sexes Male Female Both
sexes
0-4 15.2 14.2 14.6 12.8 13.4 13.1 15.7 14.3 15.0 5-9 15.0 14.0 14.5 11.3 11.9 11.6 15.7 14.4 15.0 10-14 12.3 11.8 12.0 9.7 10.7 10.2 12.9 12.0 12.4 15-19 10.8 10.4 10.6 10.0 12.1 11.0 11.0 10.1 10.5 20-24 9.9 9.7 9.8 13.0 13.0 13.0 9.2 9.1 9.1 25-29 9.0 8.6 8.8 13.0 11.3 12.1 8.2 8.2 8.2 30-34 7.3 7.2 7.2 10.0 8.4 9.2 6.7 7.0 6.8 35-39 4.6 5.1 4.8 6.0 5.4 5.7 4.3 5.0 4.7 40-44 3.8 4.1 4.0 4.4 3.8 4.1 3.6 4.2 3.9 45-49 3.1 3.4 3.2 3.1 2.7 2.9 3.1 3.5 3.3 50-54 3.0 3.4 3.2 2.5 2.3 2.4 3.1 3.6 3.4 55-59 2.1 2.5 2.3 1.6 1.5 1.5 2.2 2.6 2.4 60-64 1.5 1.8 1.7 1.0 1.1 1.1 1.6 2.0 1.8 65-69 0.8 1.1 1.0 0.5 0.7 0.6 0.9 1.2 1.0 70-74 0.7 1.0 0.9 0.4 0.6 0.5 0.8 1.1 0.9 75-79 0.5 0.7 0.6 0.3 0.4 0.4 0.5 0.7 0.6 80-84 0.4 0.5 0.4 0.2 0.3 0.3 0.4 0.5 0.5 85+ 0.3 0.4 0.3 0.1 0.3 0.2 0.3 0.4 0.4 Total 100.0 100.0 100.0 100.0 100.0 100.0 100.0 100.0 100.0 Count 5,064,868 5,451,105 10,515,973 891,806 845,878 1,737,684 4,173,062 4,605,227 8,778,289 Source: Fourth Rwanda Population and Housing Census. .
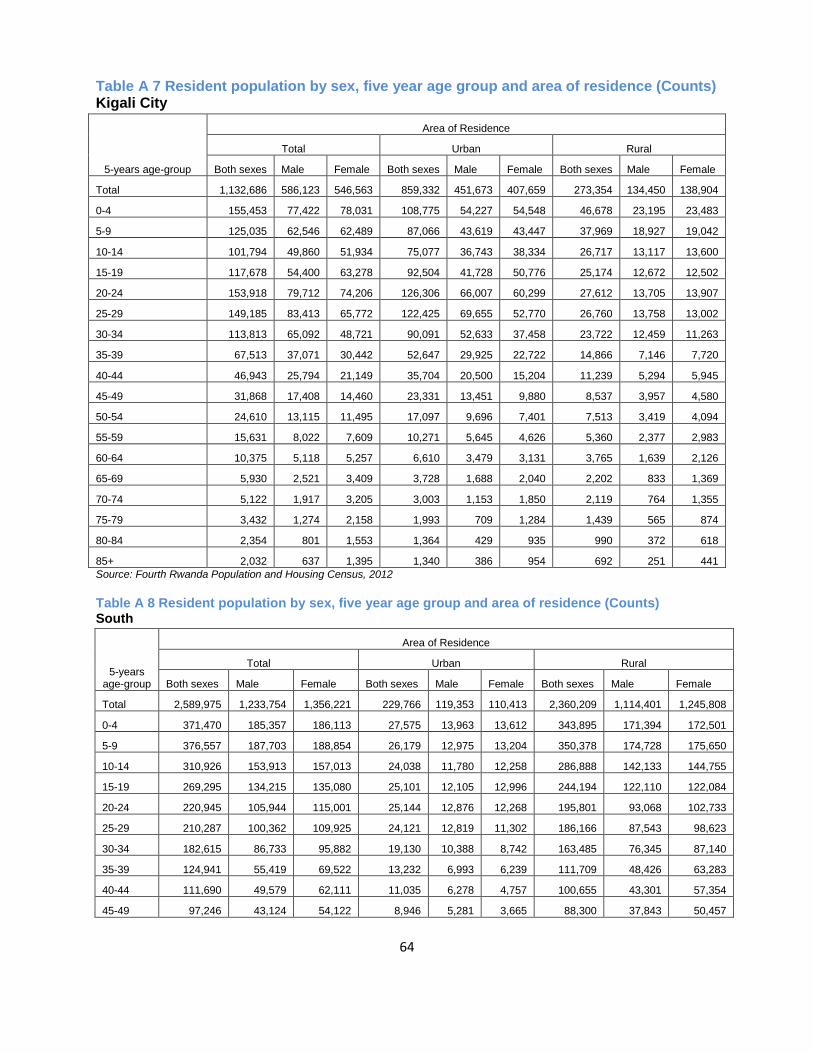
64
Table A 7 Resident population by sex, five year age group and area of residence (Counts) Kigali City
5-years age-group
Area of Residence
Total Urban Rural
Both sexes Male Female Both sexes Male Female Both sexes Male Female
Total 1,132,686 586,123 546,563 859,332 451,673 407,659 273,354 134,450 138,904
0-4 155,453 77,422 78,031 108,775 54,227 54,548 46,678 23,195 23,483
5-9 125,035 62,546 62,489 87,066 43,619 43,447 37,969 18,927 19,042
10-14 101,794 49,860 51,934 75,077 36,743 38,334 26,717 13,117 13,600
15-19 117,678 54,400 63,278 92,504 41,728 50,776 25,174 12,672 12,502
20-24 153,918 79,712 74,206 126,306 66,007 60,299 27,612 13,705 13,907
25-29 149,185 83,413 65,772 122,425 69,655 52,770 26,760 13,758 13,002
30-34 113,813 65,092 48,721 90,091 52,633 37,458 23,722 12,459 11,263
35-39 67,513 37,071 30,442 52,647 29,925 22,722 14,866 7,146 7,720
40-44 46,943 25,794 21,149 35,704 20,500 15,204 11,239 5,294 5,945
45-49 31,868 17,408 14,460 23,331 13,451 9,880 8,537 3,957 4,580
50-54 24,610 13,115 11,495 17,097 9,696 7,401 7,513 3,419 4,094
55-59 15,631 8,022 7,609 10,271 5,645 4,626 5,360 2,377 2,983
60-64 10,375 5,118 5,257 6,610 3,479 3,131 3,765 1,639 2,126
65-69 5,930 2,521 3,409 3,728 1,688 2,040 2,202 833 1,369
70-74 5,122 1,917 3,205 3,003 1,153 1,850 2,119 764 1,355
75-79 3,432 1,274 2,158 1,993 709 1,284 1,439 565 874
80-84 2,354 801 1,553 1,364 429 935 990 372 618
85+ 2,032 637 1,395 1,340 386 954 692 251 441
Source: Fourth Rwanda Population and Housing Census, 2012
Table A 8 Resident population by sex, five year age group and area of residence (Counts) South
5-years age-group
Area of Residence
Total Urban Rural
Both sexes Male Female Both sexes Male Female Both sexes Male Female
Total 2,589,975 1,233,754 1,356,221 229,766 119,353 110,413 2,360,209 1,114,401 1,245,808
0-4 371,470 185,357 186,113 27,575 13,963 13,612 343,895 171,394 172,501
5-9 376,557 187,703 188,854 26,179 12,975 13,204 350,378 174,728 175,650
10-14 310,926 153,913 157,013 24,038 11,780 12,258 286,888 142,133 144,755
15-19 269,295 134,215 135,080 25,101 12,105 12,996 244,194 122,110 122,084
20-24 220,945 105,944 115,001 25,144 12,876 12,268 195,801 93,068 102,733
25-29 210,287 100,362 109,925 24,121 12,819 11,302 186,166 87,543 98,623
30-34 182,615 86,733 95,882 19,130 10,388 8,742 163,485 76,345 87,140
35-39 124,941 55,419 69,522 13,232 6,993 6,239 111,709 48,426 63,283
40-44 111,690 49,579 62,111 11,035 6,278 4,757 100,655 43,301 57,354
45-49 97,246 43,124 54,122 8,946 5,281 3,665 88,300 37,843 50,457
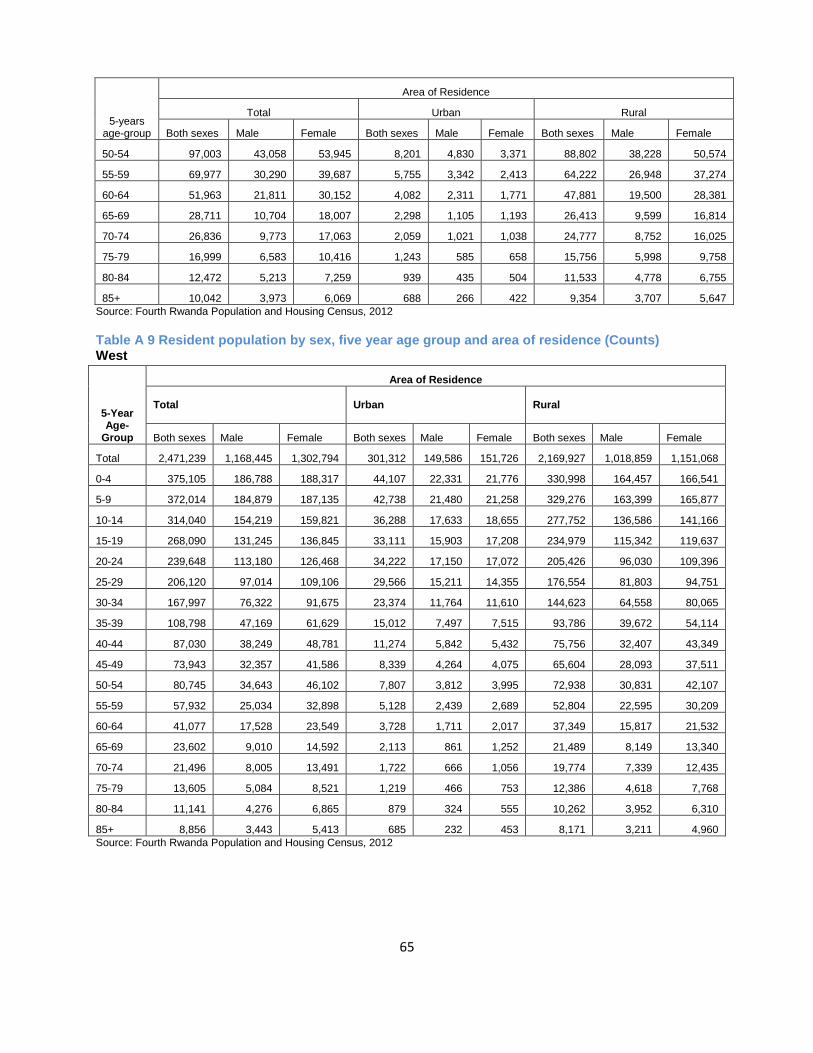
65
5-years age-group
Area of Residence
Total Urban Rural
Both sexes Male Female Both sexes Male Female Both sexes Male Female
50-54 97,003 43,058 53,945 8,201 4,830 3,371 88,802 38,228 50,574
55-59 69,977 30,290 39,687 5,755 3,342 2,413 64,222 26,948 37,274
60-64 51,963 21,811 30,152 4,082 2,311 1,771 47,881 19,500 28,381
65-69 28,711 10,704 18,007 2,298 1,105 1,193 26,413 9,599 16,814
70-74 26,836 9,773 17,063 2,059 1,021 1,038 24,777 8,752 16,025
75-79 16,999 6,583 10,416 1,243 585 658 15,756 5,998 9,758
80-84 12,472 5,213 7,259 939 435 504 11,533 4,778 6,755
85+ 10,042 3,973 6,069 688 266 422 9,354 3,707 5,647
Source: Fourth Rwanda Population and Housing Census, 2012
Table A 9 Resident population by sex, five year age group and area of residence (Counts) West
5-Year Age-
Group
Area of Residence
Total
Urban
Rural
Both sexes Male Female Both sexes Male Female Both sexes Male Female
Total 2,471,239 1,168,445 1,302,794 301,312 149,586 151,726 2,169,927 1,018,859 1,151,068
0-4 375,105 186,788 188,317 44,107 22,331 21,776 330,998 164,457 166,541
5-9 372,014 184,879 187,135 42,738 21,480 21,258 329,276 163,399 165,877
10-14 314,040 154,219 159,821 36,288 17,633 18,655 277,752 136,586 141,166
15-19 268,090 131,245 136,845 33,111 15,903 17,208 234,979 115,342 119,637
20-24 239,648 113,180 126,468 34,222 17,150 17,072 205,426 96,030 109,396
25-29 206,120 97,014 109,106 29,566 15,211 14,355 176,554 81,803 94,751
30-34 167,997 76,322 91,675 23,374 11,764 11,610 144,623 64,558 80,065
35-39 108,798 47,169 61,629 15,012 7,497 7,515 93,786 39,672 54,114
40-44 87,030 38,249 48,781 11,274 5,842 5,432 75,756 32,407 43,349
45-49 73,943 32,357 41,586 8,339 4,264 4,075 65,604 28,093 37,511
50-54 80,745 34,643 46,102 7,807 3,812 3,995 72,938 30,831 42,107
55-59 57,932 25,034 32,898 5,128 2,439 2,689 52,804 22,595 30,209
60-64 41,077 17,528 23,549 3,728 1,711 2,017 37,349 15,817 21,532
65-69 23,602 9,010 14,592 2,113 861 1,252 21,489 8,149 13,340
70-74 21,496 8,005 13,491 1,722 666 1,056 19,774 7,339 12,435
75-79 13,605 5,084 8,521 1,219 466 753 12,386 4,618 7,768
80-84 11,141 4,276 6,865 879 324 555 10,262 3,952 6,310
85+ 8,856 3,443 5,413 685 232 453 8,171 3,211 4,960
Source: Fourth Rwanda Population and Housing Census, 2012
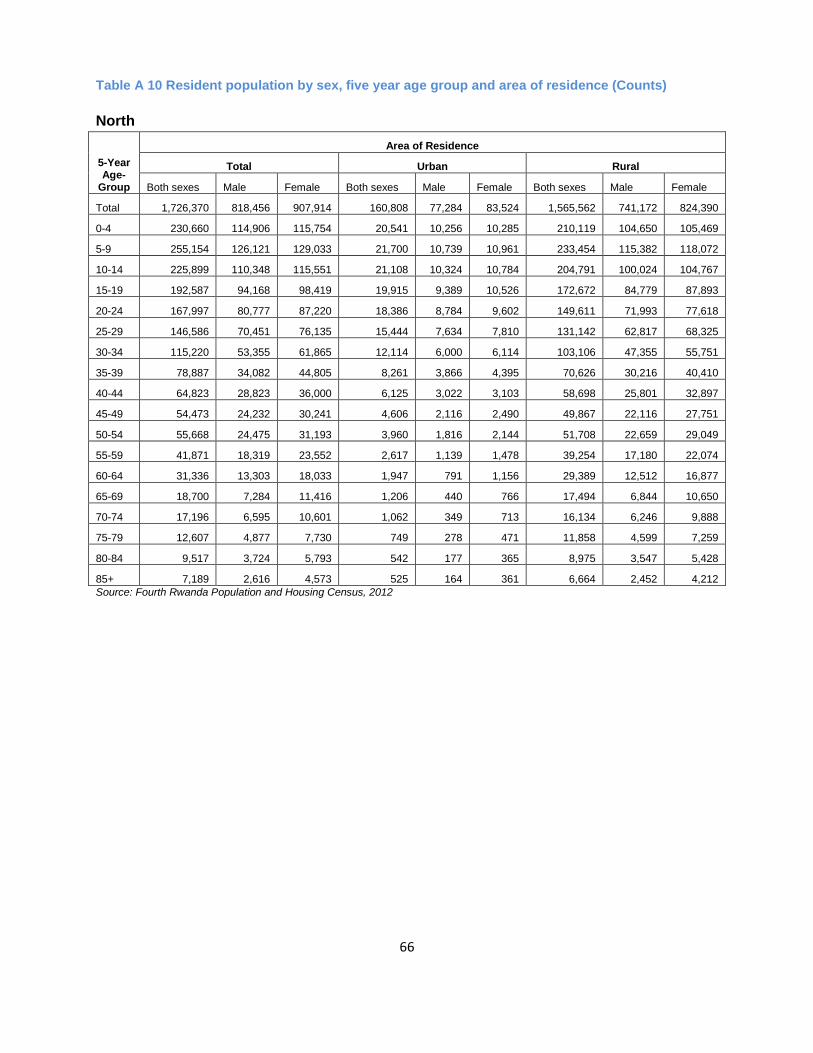
66
Table A 10 Resident population by sex, five year age group and area of residence (Counts)
North
5-Year Age-
Group
Area of Residence
Total Urban Rural
Both sexes Male Female Both sexes Male Female Both sexes Male Female
Total 1,726,370 818,456 907,914 160,808 77,284 83,524 1,565,562 741,172 824,390
0-4 230,660 114,906 115,754 20,541 10,256 10,285 210,119 104,650 105,469
5-9 255,154 126,121 129,033 21,700 10,739 10,961 233,454 115,382 118,072
10-14 225,899 110,348 115,551 21,108 10,324 10,784 204,791 100,024 104,767
15-19 192,587 94,168 98,419 19,915 9,389 10,526 172,672 84,779 87,893
20-24 167,997 80,777 87,220 18,386 8,784 9,602 149,611 71,993 77,618
25-29 146,586 70,451 76,135 15,444 7,634 7,810 131,142 62,817 68,325
30-34 115,220 53,355 61,865 12,114 6,000 6,114 103,106 47,355 55,751
35-39 78,887 34,082 44,805 8,261 3,866 4,395 70,626 30,216 40,410
40-44 64,823 28,823 36,000 6,125 3,022 3,103 58,698 25,801 32,897
45-49 54,473 24,232 30,241 4,606 2,116 2,490 49,867 22,116 27,751
50-54 55,668 24,475 31,193 3,960 1,816 2,144 51,708 22,659 29,049
55-59 41,871 18,319 23,552 2,617 1,139 1,478 39,254 17,180 22,074
60-64 31,336 13,303 18,033 1,947 791 1,156 29,389 12,512 16,877
65-69 18,700 7,284 11,416 1,206 440 766 17,494 6,844 10,650
70-74 17,196 6,595 10,601 1,062 349 713 16,134 6,246 9,888
75-79 12,607 4,877 7,730 749 278 471 11,858 4,599 7,259
80-84 9,517 3,724 5,793 542 177 365 8,975 3,547 5,428
85+ 7,189 2,616 4,573 525 164 361 6,664 2,452 4,212
Source: Fourth Rwanda Population and Housing Census, 2012
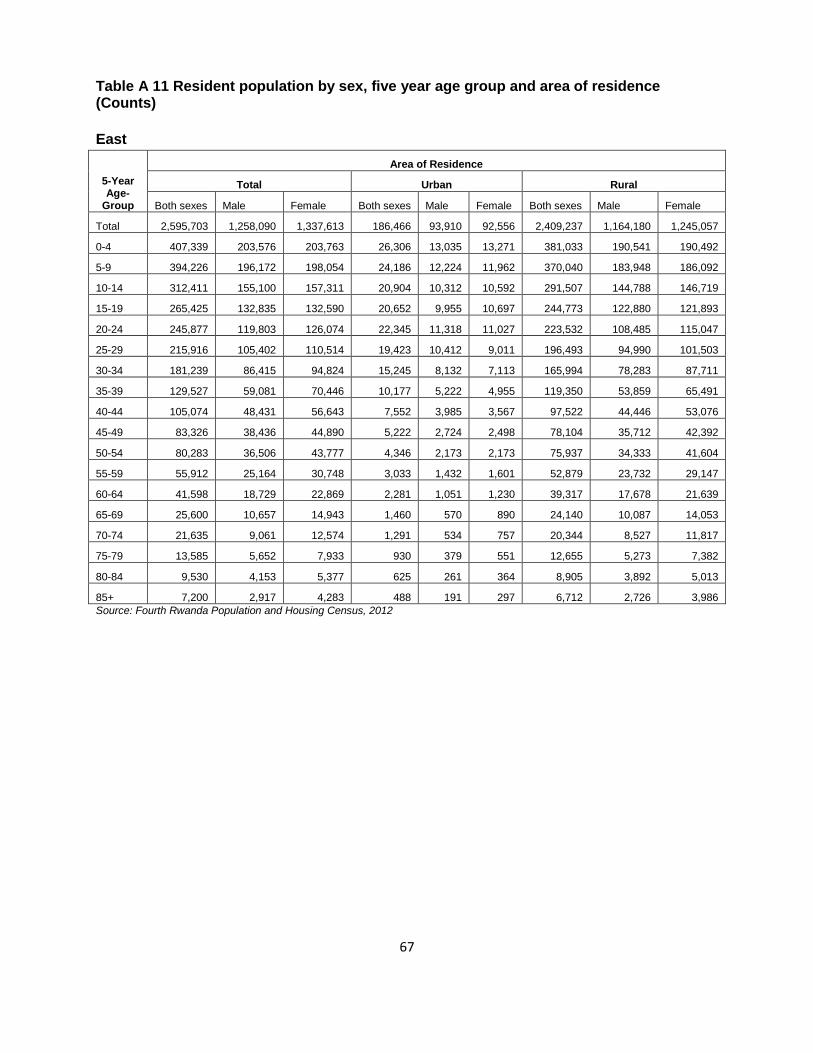
67
Table A 11 Resident population by sex, five year age group and area of residence (Counts)
East
5-Year Age-
Group
Area of Residence
Total Urban Rural
Both sexes Male Female Both sexes Male Female Both sexes Male Female
Total 2,595,703 1,258,090 1,337,613 186,466 93,910 92,556 2,409,237 1,164,180 1,245,057
0-4 407,339 203,576 203,763 26,306 13,035 13,271 381,033 190,541 190,492
5-9 394,226 196,172 198,054 24,186 12,224 11,962 370,040 183,948 186,092
10-14 312,411 155,100 157,311 20,904 10,312 10,592 291,507 144,788 146,719
15-19 265,425 132,835 132,590 20,652 9,955 10,697 244,773 122,880 121,893
20-24 245,877 119,803 126,074 22,345 11,318 11,027 223,532 108,485 115,047
25-29 215,916 105,402 110,514 19,423 10,412 9,011 196,493 94,990 101,503
30-34 181,239 86,415 94,824 15,245 8,132 7,113 165,994 78,283 87,711
35-39 129,527 59,081 70,446 10,177 5,222 4,955 119,350 53,859 65,491
40-44 105,074 48,431 56,643 7,552 3,985 3,567 97,522 44,446 53,076
45-49 83,326 38,436 44,890 5,222 2,724 2,498 78,104 35,712 42,392
50-54 80,283 36,506 43,777 4,346 2,173 2,173 75,937 34,333 41,604
55-59 55,912 25,164 30,748 3,033 1,432 1,601 52,879 23,732 29,147
60-64 41,598 18,729 22,869 2,281 1,051 1,230 39,317 17,678 21,639
65-69 25,600 10,657 14,943 1,460 570 890 24,140 10,087 14,053
70-74 21,635 9,061 12,574 1,291 534 757 20,344 8,527 11,817
75-79 13,585 5,652 7,933 930 379 551 12,655 5,273 7,382
80-84 9,530 4,153 5,377 625 261 364 8,905 3,892 5,013
85+ 7,200 2,917 4,283 488 191 297 6,712 2,726 3,986
Source: Fourth Rwanda Population and Housing Census, 2012
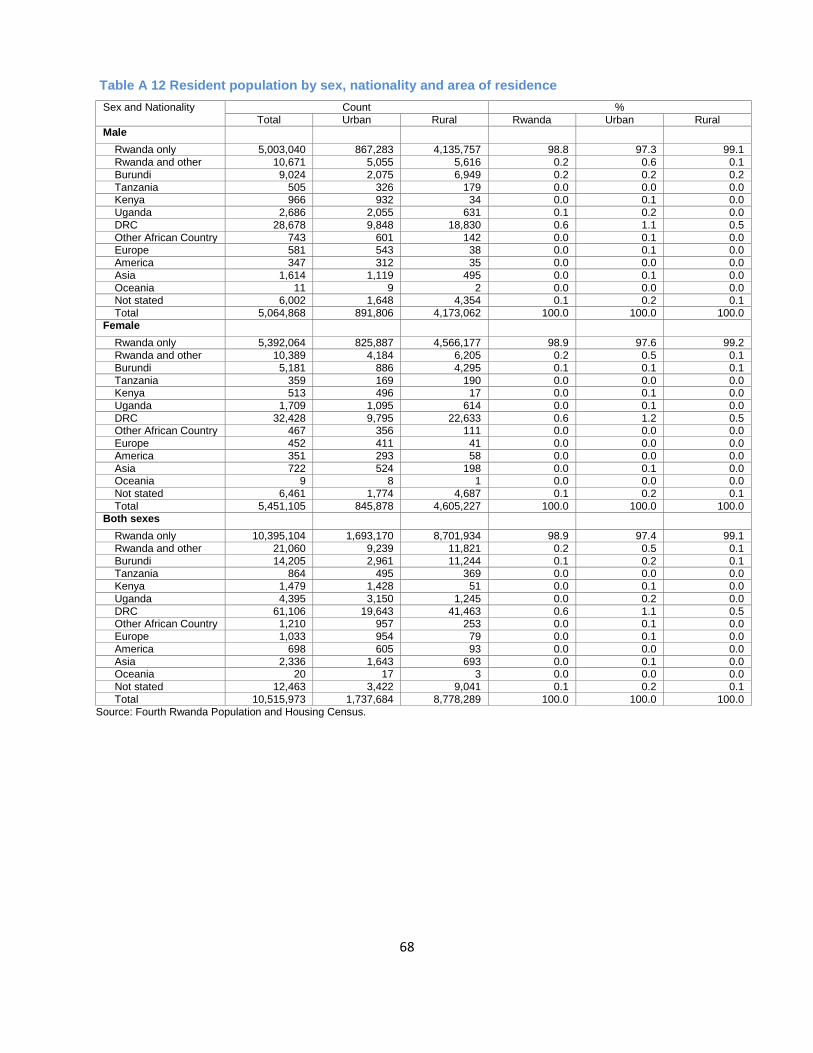
68
Table A 12 Resident population by sex, nationality and area of residence
Sex and Nationality Count % Total Urban Rural Rwanda Urban Rural
Male Rwanda only 5,003,040 867,283 4,135,757 98.8 97.3 99.1 Rwanda and other 10,671 5,055 5,616 0.2 0.6 0.1 Burundi 9,024 2,075 6,949 0.2 0.2 0.2 Tanzania 505 326 179 0.0 0.0 0.0 Kenya 966 932 34 0.0 0.1 0.0 Uganda 2,686 2,055 631 0.1 0.2 0.0 DRC 28,678 9,848 18,830 0.6 1.1 0.5 Other African Country 743 601 142 0.0 0.1 0.0 Europe 581 543 38 0.0 0.1 0.0 America 347 312 35 0.0 0.0 0.0 Asia 1,614 1,119 495 0.0 0.1 0.0 Oceania 11 9 2 0.0 0.0 0.0 Not stated 6,002 1,648 4,354 0.1 0.2 0.1 Total 5,064,868 891,806 4,173,062 100.0 100.0 100.0
Female Rwanda only 5,392,064 825,887 4,566,177 98.9 97.6 99.2 Rwanda and other 10,389 4,184 6,205 0.2 0.5 0.1 Burundi 5,181 886 4,295 0.1 0.1 0.1 Tanzania 359 169 190 0.0 0.0 0.0 Kenya 513 496 17 0.0 0.1 0.0 Uganda 1,709 1,095 614 0.0 0.1 0.0 DRC 32,428 9,795 22,633 0.6 1.2 0.5 Other African Country 467 356 111 0.0 0.0 0.0 Europe 452 411 41 0.0 0.0 0.0 America 351 293 58 0.0 0.0 0.0 Asia 722 524 198 0.0 0.1 0.0 Oceania 9 8 1 0.0 0.0 0.0 Not stated 6,461 1,774 4,687 0.1 0.2 0.1 Total 5,451,105 845,878 4,605,227 100.0 100.0 100.0
Both sexes Rwanda only 10,395,104 1,693,170 8,701,934 98.9 97.4 99.1 Rwanda and other 21,060 9,239 11,821 0.2 0.5 0.1 Burundi 14,205 2,961 11,244 0.1 0.2 0.1 Tanzania 864 495 369 0.0 0.0 0.0 Kenya 1,479 1,428 51 0.0 0.1 0.0 Uganda 4,395 3,150 1,245 0.0 0.2 0.0 DRC 61,106 19,643 41,463 0.6 1.1 0.5 Other African Country 1,210 957 253 0.0 0.1 0.0 Europe 1,033 954 79 0.0 0.1 0.0 America 698 605 93 0.0 0.0 0.0 Asia 2,336 1,643 693 0.0 0.1 0.0 Oceania 20 17 3 0.0 0.0 0.0 Not stated 12,463 3,422 9,041 0.1 0.2 0.1 Total 10,515,973 1,737,684 8,778,289 100.0 100.0 100.0
Source: Fourth Rwanda Population and Housing Census.
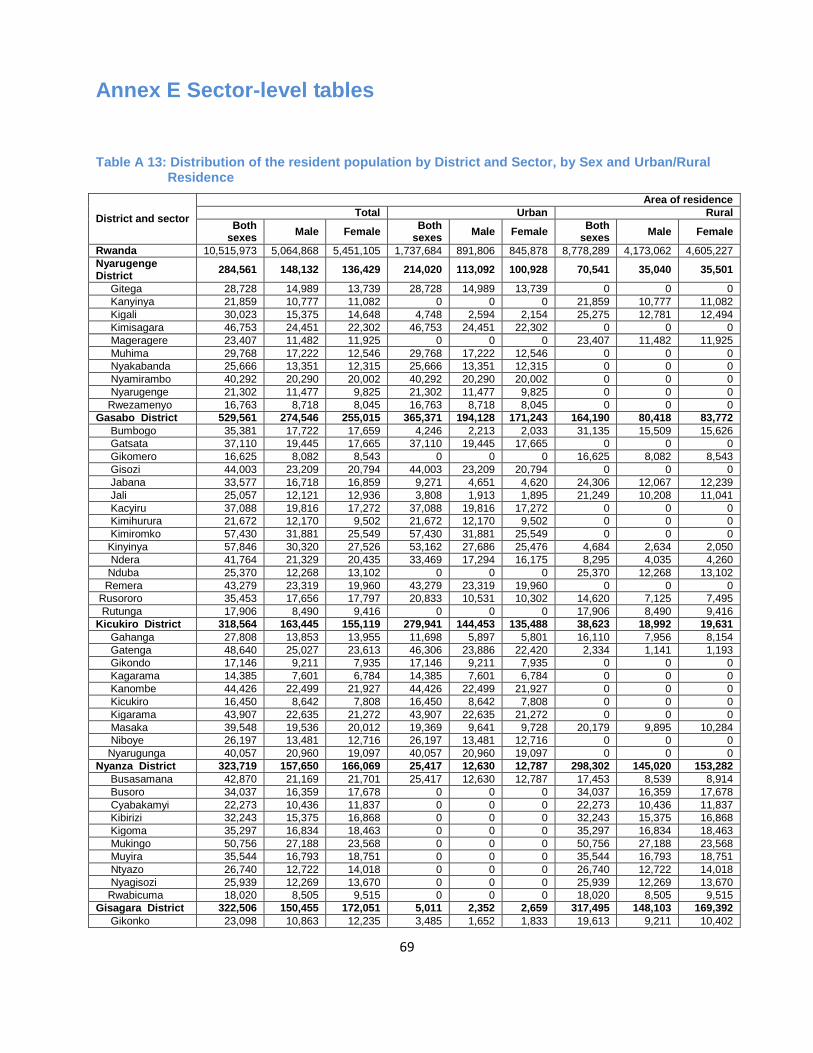
69
Annex E Sector-level tables
Table A 13: Distribution of the resident population by District and Sector, by Sex and Urban/Rural Residence
District and sector
Area of residence
Total Urban Rural
Both sexes
Male Female Both
sexes Male Female
Both sexes
Male Female
Rwanda 10,515,973 5,064,868 5,451,105 1,737,684 891,806 845,878 8,778,289 4,173,062 4,605,227
Nyarugenge District
284,561 148,132 136,429 214,020 113,092 100,928 70,541 35,040 35,501
Gitega 28,728 14,989 13,739 28,728 14,989 13,739 0 0 0
Kanyinya 21,859 10,777 11,082 0 0 0 21,859 10,777 11,082
Kigali 30,023 15,375 14,648 4,748 2,594 2,154 25,275 12,781 12,494
Kimisagara 46,753 24,451 22,302 46,753 24,451 22,302 0 0 0
Mageragere 23,407 11,482 11,925 0 0 0 23,407 11,482 11,925
Muhima 29,768 17,222 12,546 29,768 17,222 12,546 0 0 0
Nyakabanda 25,666 13,351 12,315 25,666 13,351 12,315 0 0 0
Nyamirambo 40,292 20,290 20,002 40,292 20,290 20,002 0 0 0
Nyarugenge 21,302 11,477 9,825 21,302 11,477 9,825 0 0 0
Rwezamenyo 16,763 8,718 8,045 16,763 8,718 8,045 0 0 0
Gasabo District 529,561 274,546 255,015 365,371 194,128 171,243 164,190 80,418 83,772
Bumbogo 35,381 17,722 17,659 4,246 2,213 2,033 31,135 15,509 15,626
Gatsata 37,110 19,445 17,665 37,110 19,445 17,665 0 0 0
Gikomero 16,625 8,082 8,543 0 0 0 16,625 8,082 8,543
Gisozi 44,003 23,209 20,794 44,003 23,209 20,794 0 0 0
Jabana 33,577 16,718 16,859 9,271 4,651 4,620 24,306 12,067 12,239
Jali 25,057 12,121 12,936 3,808 1,913 1,895 21,249 10,208 11,041
Kacyiru 37,088 19,816 17,272 37,088 19,816 17,272 0 0 0
Kimihurura 21,672 12,170 9,502 21,672 12,170 9,502 0 0 0
Kimiromko 57,430 31,881 25,549 57,430 31,881 25,549 0 0 0
Kinyinya 57,846 30,320 27,526 53,162 27,686 25,476 4,684 2,634 2,050
Ndera 41,764 21,329 20,435 33,469 17,294 16,175 8,295 4,035 4,260
Nduba 25,370 12,268 13,102 0 0 0 25,370 12,268 13,102
Remera 43,279 23,319 19,960 43,279 23,319 19,960 0 0 0
Rusororo 35,453 17,656 17,797 20,833 10,531 10,302 14,620 7,125 7,495
Rutunga 17,906 8,490 9,416 0 0 0 17,906 8,490 9,416
Kicukiro District 318,564 163,445 155,119 279,941 144,453 135,488 38,623 18,992 19,631
Gahanga 27,808 13,853 13,955 11,698 5,897 5,801 16,110 7,956 8,154
Gatenga 48,640 25,027 23,613 46,306 23,886 22,420 2,334 1,141 1,193
Gikondo 17,146 9,211 7,935 17,146 9,211 7,935 0 0 0
Kagarama 14,385 7,601 6,784 14,385 7,601 6,784 0 0 0
Kanombe 44,426 22,499 21,927 44,426 22,499 21,927 0 0 0
Kicukiro 16,450 8,642 7,808 16,450 8,642 7,808 0 0 0
Kigarama 43,907 22,635 21,272 43,907 22,635 21,272 0 0 0
Masaka 39,548 19,536 20,012 19,369 9,641 9,728 20,179 9,895 10,284
Niboye 26,197 13,481 12,716 26,197 13,481 12,716 0 0 0
Nyarugunga 40,057 20,960 19,097 40,057 20,960 19,097 0 0 0
Nyanza District 323,719 157,650 166,069 25,417 12,630 12,787 298,302 145,020 153,282
Busasamana 42,870 21,169 21,701 25,417 12,630 12,787 17,453 8,539 8,914
Busoro 34,037 16,359 17,678 0 0 0 34,037 16,359 17,678
Cyabakamyi 22,273 10,436 11,837 0 0 0 22,273 10,436 11,837
Kibirizi 32,243 15,375 16,868 0 0 0 32,243 15,375 16,868
Kigoma 35,297 16,834 18,463 0 0 0 35,297 16,834 18,463
Mukingo 50,756 27,188 23,568 0 0 0 50,756 27,188 23,568
Muyira 35,544 16,793 18,751 0 0 0 35,544 16,793 18,751
Ntyazo 26,740 12,722 14,018 0 0 0 26,740 12,722 14,018
Nyagisozi 25,939 12,269 13,670 0 0 0 25,939 12,269 13,670
Rwabicuma 18,020 8,505 9,515 0 0 0 18,020 8,505 9,515
Gisagara District 322,506 150,455 172,051 5,011 2,352 2,659 317,495 148,103 169,392
Gikonko 23,098 10,863 12,235 3,485 1,652 1,833 19,613 9,211 10,402
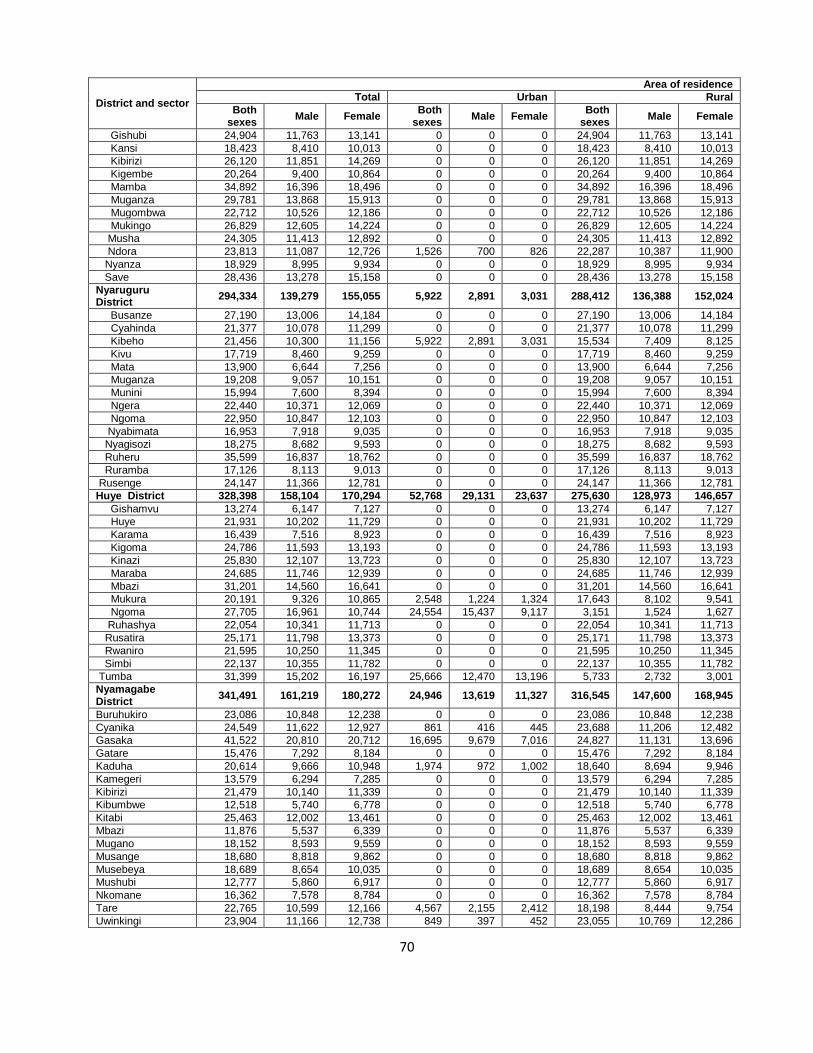
70
District and sector
Area of residence
Total Urban Rural
Both sexes
Male Female Both
sexes Male Female
Both sexes
Male Female
Gishubi 24,904 11,763 13,141 0 0 0 24,904 11,763 13,141
Kansi 18,423 8,410 10,013 0 0 0 18,423 8,410 10,013
Kibirizi 26,120 11,851 14,269 0 0 0 26,120 11,851 14,269
Kigembe 20,264 9,400 10,864 0 0 0 20,264 9,400 10,864
Mamba 34,892 16,396 18,496 0 0 0 34,892 16,396 18,496
Muganza 29,781 13,868 15,913 0 0 0 29,781 13,868 15,913
Mugombwa 22,712 10,526 12,186 0 0 0 22,712 10,526 12,186
Mukingo 26,829 12,605 14,224 0 0 0 26,829 12,605 14,224
Musha 24,305 11,413 12,892 0 0 0 24,305 11,413 12,892
Ndora 23,813 11,087 12,726 1,526 700 826 22,287 10,387 11,900
Nyanza 18,929 8,995 9,934 0 0 0 18,929 8,995 9,934
Save 28,436 13,278 15,158 0 0 0 28,436 13,278 15,158
Nyaruguru District
294,334 139,279 155,055 5,922 2,891 3,031 288,412 136,388 152,024
Busanze 27,190 13,006 14,184 0 0 0 27,190 13,006 14,184
Cyahinda 21,377 10,078 11,299 0 0 0 21,377 10,078 11,299
Kibeho 21,456 10,300 11,156 5,922 2,891 3,031 15,534 7,409 8,125
Kivu 17,719 8,460 9,259 0 0 0 17,719 8,460 9,259
Mata 13,900 6,644 7,256 0 0 0 13,900 6,644 7,256
Muganza 19,208 9,057 10,151 0 0 0 19,208 9,057 10,151
Munini 15,994 7,600 8,394 0 0 0 15,994 7,600 8,394
Ngera 22,440 10,371 12,069 0 0 0 22,440 10,371 12,069
Ngoma 22,950 10,847 12,103 0 0 0 22,950 10,847 12,103
Nyabimata 16,953 7,918 9,035 0 0 0 16,953 7,918 9,035
Nyagisozi 18,275 8,682 9,593 0 0 0 18,275 8,682 9,593
Ruheru 35,599 16,837 18,762 0 0 0 35,599 16,837 18,762
Ruramba 17,126 8,113 9,013 0 0 0 17,126 8,113 9,013
Rusenge 24,147 11,366 12,781 0 0 0 24,147 11,366 12,781
Huye District 328,398 158,104 170,294 52,768 29,131 23,637 275,630 128,973 146,657
Gishamvu 13,274 6,147 7,127 0 0 0 13,274 6,147 7,127
Huye 21,931 10,202 11,729 0 0 0 21,931 10,202 11,729
Karama 16,439 7,516 8,923 0 0 0 16,439 7,516 8,923
Kigoma 24,786 11,593 13,193 0 0 0 24,786 11,593 13,193
Kinazi 25,830 12,107 13,723 0 0 0 25,830 12,107 13,723
Maraba 24,685 11,746 12,939 0 0 0 24,685 11,746 12,939
Mbazi 31,201 14,560 16,641 0 0 0 31,201 14,560 16,641
Mukura 20,191 9,326 10,865 2,548 1,224 1,324 17,643 8,102 9,541
Ngoma 27,705 16,961 10,744 24,554 15,437 9,117 3,151 1,524 1,627
Ruhashya 22,054 10,341 11,713 0 0 0 22,054 10,341 11,713
Rusatira 25,171 11,798 13,373 0 0 0 25,171 11,798 13,373
Rwaniro 21,595 10,250 11,345 0 0 0 21,595 10,250 11,345
Simbi 22,137 10,355 11,782 0 0 0 22,137 10,355 11,782
Tumba 31,399 15,202 16,197 25,666 12,470 13,196 5,733 2,732 3,001
Nyamagabe District
341,491 161,219 180,272 24,946 13,619 11,327 316,545 147,600 168,945
Buruhukiro 23,086 10,848 12,238 0 0 0 23,086 10,848 12,238
Cyanika 24,549 11,622 12,927 861 416 445 23,688 11,206 12,482
Gasaka 41,522 20,810 20,712 16,695 9,679 7,016 24,827 11,131 13,696
Gatare 15,476 7,292 8,184 0 0 0 15,476 7,292 8,184
Kaduha 20,614 9,666 10,948 1,974 972 1,002 18,640 8,694 9,946
Kamegeri 13,579 6,294 7,285 0 0 0 13,579 6,294 7,285
Kibirizi 21,479 10,140 11,339 0 0 0 21,479 10,140 11,339
Kibumbwe 12,518 5,740 6,778 0 0 0 12,518 5,740 6,778
Kitabi 25,463 12,002 13,461 0 0 0 25,463 12,002 13,461
Mbazi 11,876 5,537 6,339 0 0 0 11,876 5,537 6,339
Mugano 18,152 8,593 9,559 0 0 0 18,152 8,593 9,559
Musange 18,680 8,818 9,862 0 0 0 18,680 8,818 9,862
Musebeya 18,689 8,654 10,035 0 0 0 18,689 8,654 10,035
Mushubi 12,777 5,860 6,917 0 0 0 12,777 5,860 6,917
Nkomane 16,362 7,578 8,784 0 0 0 16,362 7,578 8,784
Tare 22,765 10,599 12,166 4,567 2,155 2,412 18,198 8,444 9,754
Uwinkingi 23,904 11,166 12,738 849 397 452 23,055 10,769 12,286
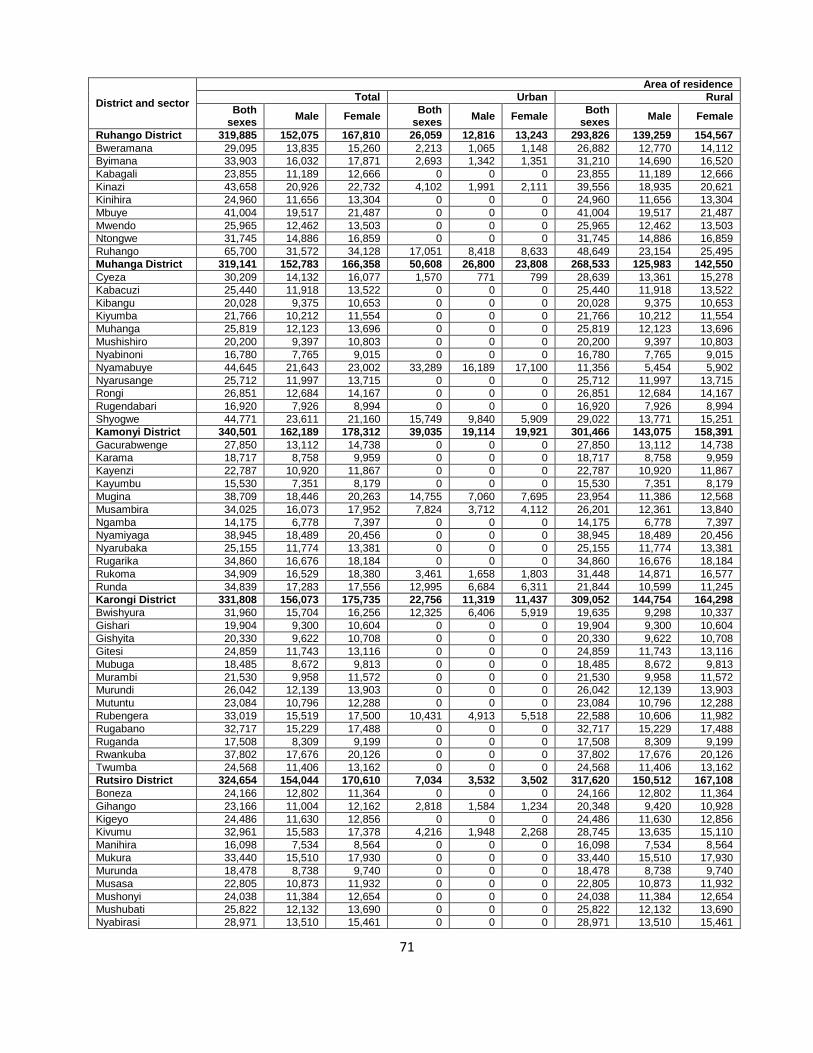
71
District and sector
Area of residence
Total Urban Rural
Both sexes
Male Female Both
sexes Male Female
Both sexes
Male Female
Ruhango District 319,885 152,075 167,810 26,059 12,816 13,243 293,826 139,259 154,567
Bweramana 29,095 13,835 15,260 2,213 1,065 1,148 26,882 12,770 14,112
Byimana 33,903 16,032 17,871 2,693 1,342 1,351 31,210 14,690 16,520
Kabagali 23,855 11,189 12,666 0 0 0 23,855 11,189 12,666
Kinazi 43,658 20,926 22,732 4,102 1,991 2,111 39,556 18,935 20,621
Kinihira 24,960 11,656 13,304 0 0 0 24,960 11,656 13,304
Mbuye 41,004 19,517 21,487 0 0 0 41,004 19,517 21,487
Mwendo 25,965 12,462 13,503 0 0 0 25,965 12,462 13,503
Ntongwe 31,745 14,886 16,859 0 0 0 31,745 14,886 16,859
Ruhango 65,700 31,572 34,128 17,051 8,418 8,633 48,649 23,154 25,495
Muhanga District 319,141 152,783 166,358 50,608 26,800 23,808 268,533 125,983 142,550
Cyeza 30,209 14,132 16,077 1,570 771 799 28,639 13,361 15,278
Kabacuzi 25,440 11,918 13,522 0 0 0 25,440 11,918 13,522
Kibangu 20,028 9,375 10,653 0 0 0 20,028 9,375 10,653
Kiyumba 21,766 10,212 11,554 0 0 0 21,766 10,212 11,554
Muhanga 25,819 12,123 13,696 0 0 0 25,819 12,123 13,696
Mushishiro 20,200 9,397 10,803 0 0 0 20,200 9,397 10,803
Nyabinoni 16,780 7,765 9,015 0 0 0 16,780 7,765 9,015
Nyamabuye 44,645 21,643 23,002 33,289 16,189 17,100 11,356 5,454 5,902
Nyarusange 25,712 11,997 13,715 0 0 0 25,712 11,997 13,715
Rongi 26,851 12,684 14,167 0 0 0 26,851 12,684 14,167
Rugendabari 16,920 7,926 8,994 0 0 0 16,920 7,926 8,994
Shyogwe 44,771 23,611 21,160 15,749 9,840 5,909 29,022 13,771 15,251
Kamonyi District 340,501 162,189 178,312 39,035 19,114 19,921 301,466 143,075 158,391
Gacurabwenge 27,850 13,112 14,738 0 0 0 27,850 13,112 14,738
Karama 18,717 8,758 9,959 0 0 0 18,717 8,758 9,959
Kayenzi 22,787 10,920 11,867 0 0 0 22,787 10,920 11,867
Kayumbu 15,530 7,351 8,179 0 0 0 15,530 7,351 8,179
Mugina 38,709 18,446 20,263 14,755 7,060 7,695 23,954 11,386 12,568
Musambira 34,025 16,073 17,952 7,824 3,712 4,112 26,201 12,361 13,840
Ngamba 14,175 6,778 7,397 0 0 0 14,175 6,778 7,397
Nyamiyaga 38,945 18,489 20,456 0 0 0 38,945 18,489 20,456
Nyarubaka 25,155 11,774 13,381 0 0 0 25,155 11,774 13,381
Rugarika 34,860 16,676 18,184 0 0 0 34,860 16,676 18,184
Rukoma 34,909 16,529 18,380 3,461 1,658 1,803 31,448 14,871 16,577
Runda 34,839 17,283 17,556 12,995 6,684 6,311 21,844 10,599 11,245
Karongi District 331,808 156,073 175,735 22,756 11,319 11,437 309,052 144,754 164,298
Bwishyura 31,960 15,704 16,256 12,325 6,406 5,919 19,635 9,298 10,337
Gishari 19,904 9,300 10,604 0 0 0 19,904 9,300 10,604
Gishyita 20,330 9,622 10,708 0 0 0 20,330 9,622 10,708
Gitesi 24,859 11,743 13,116 0 0 0 24,859 11,743 13,116
Mubuga 18,485 8,672 9,813 0 0 0 18,485 8,672 9,813
Murambi 21,530 9,958 11,572 0 0 0 21,530 9,958 11,572
Murundi 26,042 12,139 13,903 0 0 0 26,042 12,139 13,903
Mutuntu 23,084 10,796 12,288 0 0 0 23,084 10,796 12,288
Rubengera 33,019 15,519 17,500 10,431 4,913 5,518 22,588 10,606 11,982
Rugabano 32,717 15,229 17,488 0 0 0 32,717 15,229 17,488
Ruganda 17,508 8,309 9,199 0 0 0 17,508 8,309 9,199
Rwankuba 37,802 17,676 20,126 0 0 0 37,802 17,676 20,126
Twumba 24,568 11,406 13,162 0 0 0 24,568 11,406 13,162
Rutsiro District 324,654 154,044 170,610 7,034 3,532 3,502 317,620 150,512 167,108
Boneza 24,166 12,802 11,364 0 0 0 24,166 12,802 11,364
Gihango 23,166 11,004 12,162 2,818 1,584 1,234 20,348 9,420 10,928
Kigeyo 24,486 11,630 12,856 0 0 0 24,486 11,630 12,856
Kivumu 32,961 15,583 17,378 4,216 1,948 2,268 28,745 13,635 15,110
Manihira 16,098 7,534 8,564 0 0 0 16,098 7,534 8,564
Mukura 33,440 15,510 17,930 0 0 0 33,440 15,510 17,930
Murunda 18,478 8,738 9,740 0 0 0 18,478 8,738 9,740
Musasa 22,805 10,873 11,932 0 0 0 22,805 10,873 11,932
Mushonyi 24,038 11,384 12,654 0 0 0 24,038 11,384 12,654
Mushubati 25,822 12,132 13,690 0 0 0 25,822 12,132 13,690
Nyabirasi 28,971 13,510 15,461 0 0 0 28,971 13,510 15,461
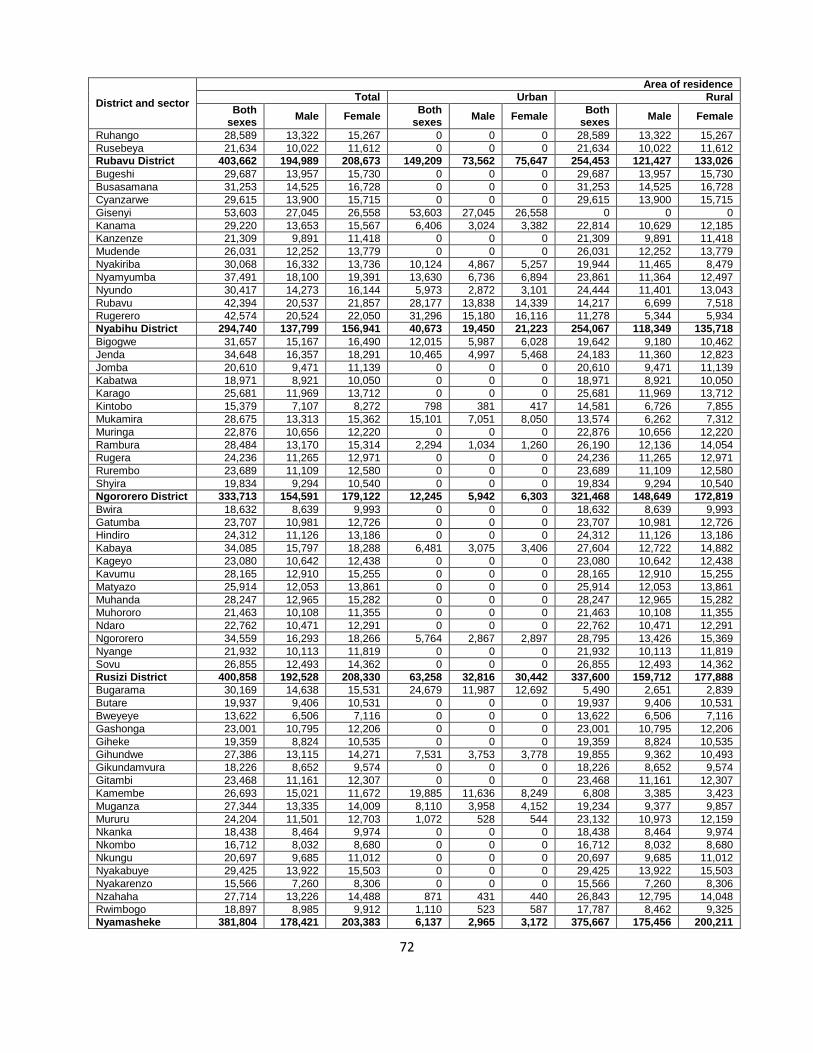
72
District and sector
Area of residence
Total Urban Rural
Both sexes
Male Female Both
sexes Male Female
Both sexes
Male Female
Ruhango 28,589 13,322 15,267 0 0 0 28,589 13,322 15,267
Rusebeya 21,634 10,022 11,612 0 0 0 21,634 10,022 11,612
Rubavu District 403,662 194,989 208,673 149,209 73,562 75,647 254,453 121,427 133,026
Bugeshi 29,687 13,957 15,730 0 0 0 29,687 13,957 15,730
Busasamana 31,253 14,525 16,728 0 0 0 31,253 14,525 16,728
Cyanzarwe 29,615 13,900 15,715 0 0 0 29,615 13,900 15,715
Gisenyi 53,603 27,045 26,558 53,603 27,045 26,558 0 0 0
Kanama 29,220 13,653 15,567 6,406 3,024 3,382 22,814 10,629 12,185
Kanzenze 21,309 9,891 11,418 0 0 0 21,309 9,891 11,418
Mudende 26,031 12,252 13,779 0 0 0 26,031 12,252 13,779
Nyakiriba 30,068 16,332 13,736 10,124 4,867 5,257 19,944 11,465 8,479
Nyamyumba 37,491 18,100 19,391 13,630 6,736 6,894 23,861 11,364 12,497
Nyundo 30,417 14,273 16,144 5,973 2,872 3,101 24,444 11,401 13,043
Rubavu 42,394 20,537 21,857 28,177 13,838 14,339 14,217 6,699 7,518
Rugerero 42,574 20,524 22,050 31,296 15,180 16,116 11,278 5,344 5,934
Nyabihu District 294,740 137,799 156,941 40,673 19,450 21,223 254,067 118,349 135,718
Bigogwe 31,657 15,167 16,490 12,015 5,987 6,028 19,642 9,180 10,462
Jenda 34,648 16,357 18,291 10,465 4,997 5,468 24,183 11,360 12,823
Jomba 20,610 9,471 11,139 0 0 0 20,610 9,471 11,139
Kabatwa 18,971 8,921 10,050 0 0 0 18,971 8,921 10,050
Karago 25,681 11,969 13,712 0 0 0 25,681 11,969 13,712
Kintobo 15,379 7,107 8,272 798 381 417 14,581 6,726 7,855
Mukamira 28,675 13,313 15,362 15,101 7,051 8,050 13,574 6,262 7,312
Muringa 22,876 10,656 12,220 0 0 0 22,876 10,656 12,220
Rambura 28,484 13,170 15,314 2,294 1,034 1,260 26,190 12,136 14,054
Rugera 24,236 11,265 12,971 0 0 0 24,236 11,265 12,971
Rurembo 23,689 11,109 12,580 0 0 0 23,689 11,109 12,580
Shyira 19,834 9,294 10,540 0 0 0 19,834 9,294 10,540
Ngororero District 333,713 154,591 179,122 12,245 5,942 6,303 321,468 148,649 172,819
Bwira 18,632 8,639 9,993 0 0 0 18,632 8,639 9,993
Gatumba 23,707 10,981 12,726 0 0 0 23,707 10,981 12,726
Hindiro 24,312 11,126 13,186 0 0 0 24,312 11,126 13,186
Kabaya 34,085 15,797 18,288 6,481 3,075 3,406 27,604 12,722 14,882
Kageyo 23,080 10,642 12,438 0 0 0 23,080 10,642 12,438
Kavumu 28,165 12,910 15,255 0 0 0 28,165 12,910 15,255
Matyazo 25,914 12,053 13,861 0 0 0 25,914 12,053 13,861
Muhanda 28,247 12,965 15,282 0 0 0 28,247 12,965 15,282
Muhororo 21,463 10,108 11,355 0 0 0 21,463 10,108 11,355
Ndaro 22,762 10,471 12,291 0 0 0 22,762 10,471 12,291
Ngororero 34,559 16,293 18,266 5,764 2,867 2,897 28,795 13,426 15,369
Nyange 21,932 10,113 11,819 0 0 0 21,932 10,113 11,819
Sovu 26,855 12,493 14,362 0 0 0 26,855 12,493 14,362
Rusizi District 400,858 192,528 208,330 63,258 32,816 30,442 337,600 159,712 177,888
Bugarama 30,169 14,638 15,531 24,679 11,987 12,692 5,490 2,651 2,839
Butare 19,937 9,406 10,531 0 0 0 19,937 9,406 10,531
Bweyeye 13,622 6,506 7,116 0 0 0 13,622 6,506 7,116
Gashonga 23,001 10,795 12,206 0 0 0 23,001 10,795 12,206
Giheke 19,359 8,824 10,535 0 0 0 19,359 8,824 10,535
Gihundwe 27,386 13,115 14,271 7,531 3,753 3,778 19,855 9,362 10,493
Gikundamvura 18,226 8,652 9,574 0 0 0 18,226 8,652 9,574
Gitambi 23,468 11,161 12,307 0 0 0 23,468 11,161 12,307
Kamembe 26,693 15,021 11,672 19,885 11,636 8,249 6,808 3,385 3,423
Muganza 27,344 13,335 14,009 8,110 3,958 4,152 19,234 9,377 9,857
Mururu 24,204 11,501 12,703 1,072 528 544 23,132 10,973 12,159
Nkanka 18,438 8,464 9,974 0 0 0 18,438 8,464 9,974
Nkombo 16,712 8,032 8,680 0 0 0 16,712 8,032 8,680
Nkungu 20,697 9,685 11,012 0 0 0 20,697 9,685 11,012
Nyakabuye 29,425 13,922 15,503 0 0 0 29,425 13,922 15,503
Nyakarenzo 15,566 7,260 8,306 0 0 0 15,566 7,260 8,306
Nzahaha 27,714 13,226 14,488 871 431 440 26,843 12,795 14,048
Rwimbogo 18,897 8,985 9,912 1,110 523 587 17,787 8,462 9,325
Nyamasheke 381,804 178,421 203,383 6,137 2,965 3,172 375,667 175,456 200,211
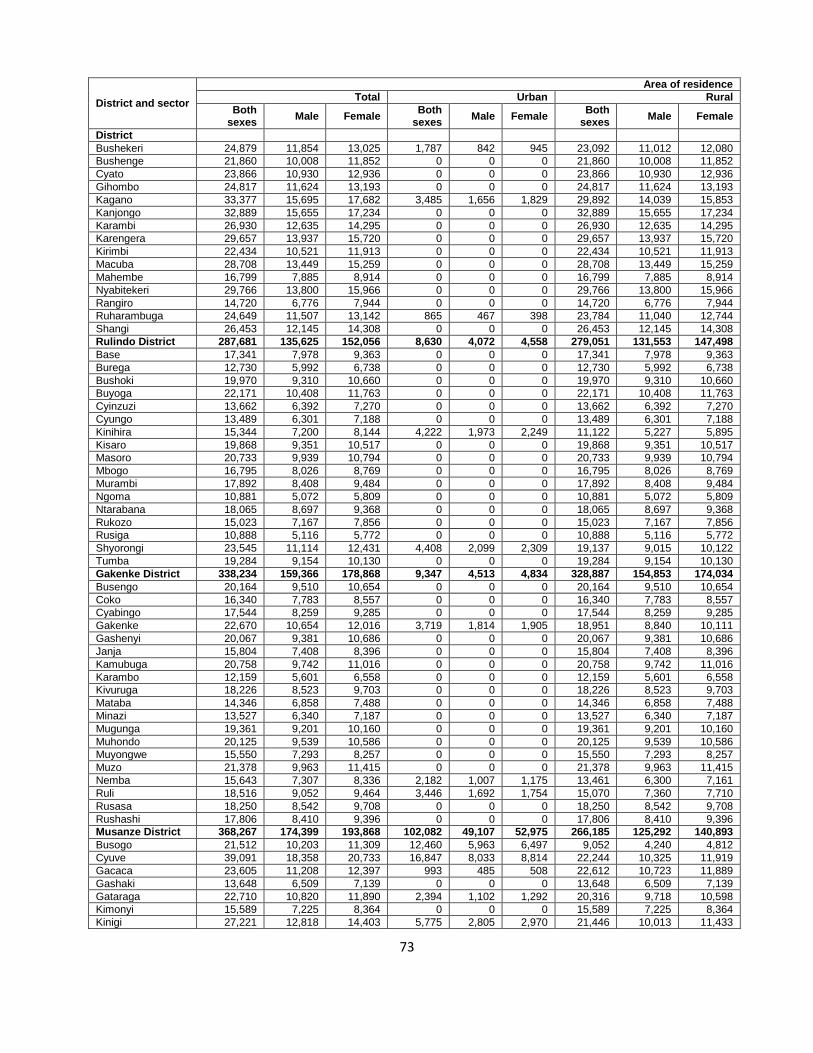
73
District and sector
Area of residence
Total Urban Rural
Both sexes
Male Female Both
sexes Male Female
Both sexes
Male Female
District
Bushekeri 24,879 11,854 13,025 1,787 842 945 23,092 11,012 12,080
Bushenge 21,860 10,008 11,852 0 0 0 21,860 10,008 11,852
Cyato 23,866 10,930 12,936 0 0 0 23,866 10,930 12,936
Gihombo 24,817 11,624 13,193 0 0 0 24,817 11,624 13,193
Kagano 33,377 15,695 17,682 3,485 1,656 1,829 29,892 14,039 15,853
Kanjongo 32,889 15,655 17,234 0 0 0 32,889 15,655 17,234
Karambi 26,930 12,635 14,295 0 0 0 26,930 12,635 14,295
Karengera 29,657 13,937 15,720 0 0 0 29,657 13,937 15,720
Kirimbi 22,434 10,521 11,913 0 0 0 22,434 10,521 11,913
Macuba 28,708 13,449 15,259 0 0 0 28,708 13,449 15,259
Mahembe 16,799 7,885 8,914 0 0 0 16,799 7,885 8,914
Nyabitekeri 29,766 13,800 15,966 0 0 0 29,766 13,800 15,966
Rangiro 14,720 6,776 7,944 0 0 0 14,720 6,776 7,944
Ruharambuga 24,649 11,507 13,142 865 467 398 23,784 11,040 12,744
Shangi 26,453 12,145 14,308 0 0 0 26,453 12,145 14,308
Rulindo District 287,681 135,625 152,056 8,630 4,072 4,558 279,051 131,553 147,498
Base 17,341 7,978 9,363 0 0 0 17,341 7,978 9,363
Burega 12,730 5,992 6,738 0 0 0 12,730 5,992 6,738
Bushoki 19,970 9,310 10,660 0 0 0 19,970 9,310 10,660
Buyoga 22,171 10,408 11,763 0 0 0 22,171 10,408 11,763
Cyinzuzi 13,662 6,392 7,270 0 0 0 13,662 6,392 7,270
Cyungo 13,489 6,301 7,188 0 0 0 13,489 6,301 7,188
Kinihira 15,344 7,200 8,144 4,222 1,973 2,249 11,122 5,227 5,895
Kisaro 19,868 9,351 10,517 0 0 0 19,868 9,351 10,517
Masoro 20,733 9,939 10,794 0 0 0 20,733 9,939 10,794
Mbogo 16,795 8,026 8,769 0 0 0 16,795 8,026 8,769
Murambi 17,892 8,408 9,484 0 0 0 17,892 8,408 9,484
Ngoma 10,881 5,072 5,809 0 0 0 10,881 5,072 5,809
Ntarabana 18,065 8,697 9,368 0 0 0 18,065 8,697 9,368
Rukozo 15,023 7,167 7,856 0 0 0 15,023 7,167 7,856
Rusiga 10,888 5,116 5,772 0 0 0 10,888 5,116 5,772
Shyorongi 23,545 11,114 12,431 4,408 2,099 2,309 19,137 9,015 10,122
Tumba 19,284 9,154 10,130 0 0 0 19,284 9,154 10,130
Gakenke District 338,234 159,366 178,868 9,347 4,513 4,834 328,887 154,853 174,034
Busengo 20,164 9,510 10,654 0 0 0 20,164 9,510 10,654
Coko 16,340 7,783 8,557 0 0 0 16,340 7,783 8,557
Cyabingo 17,544 8,259 9,285 0 0 0 17,544 8,259 9,285
Gakenke 22,670 10,654 12,016 3,719 1,814 1,905 18,951 8,840 10,111
Gashenyi 20,067 9,381 10,686 0 0 0 20,067 9,381 10,686
Janja 15,804 7,408 8,396 0 0 0 15,804 7,408 8,396
Kamubuga 20,758 9,742 11,016 0 0 0 20,758 9,742 11,016
Karambo 12,159 5,601 6,558 0 0 0 12,159 5,601 6,558
Kivuruga 18,226 8,523 9,703 0 0 0 18,226 8,523 9,703
Mataba 14,346 6,858 7,488 0 0 0 14,346 6,858 7,488
Minazi 13,527 6,340 7,187 0 0 0 13,527 6,340 7,187
Mugunga 19,361 9,201 10,160 0 0 0 19,361 9,201 10,160
Muhondo 20,125 9,539 10,586 0 0 0 20,125 9,539 10,586
Muyongwe 15,550 7,293 8,257 0 0 0 15,550 7,293 8,257
Muzo 21,378 9,963 11,415 0 0 0 21,378 9,963 11,415
Nemba 15,643 7,307 8,336 2,182 1,007 1,175 13,461 6,300 7,161
Ruli 18,516 9,052 9,464 3,446 1,692 1,754 15,070 7,360 7,710
Rusasa 18,250 8,542 9,708 0 0 0 18,250 8,542 9,708
Rushashi 17,806 8,410 9,396 0 0 0 17,806 8,410 9,396
Musanze District 368,267 174,399 193,868 102,082 49,107 52,975 266,185 125,292 140,893
Busogo 21,512 10,203 11,309 12,460 5,963 6,497 9,052 4,240 4,812
Cyuve 39,091 18,358 20,733 16,847 8,033 8,814 22,244 10,325 11,919
Gacaca 23,605 11,208 12,397 993 485 508 22,612 10,723 11,889
Gashaki 13,648 6,509 7,139 0 0 0 13,648 6,509 7,139
Gataraga 22,710 10,820 11,890 2,394 1,102 1,292 20,316 9,718 10,598
Kimonyi 15,589 7,225 8,364 0 0 0 15,589 7,225 8,364
Kinigi 27,221 12,818 14,403 5,775 2,805 2,970 21,446 10,013 11,433
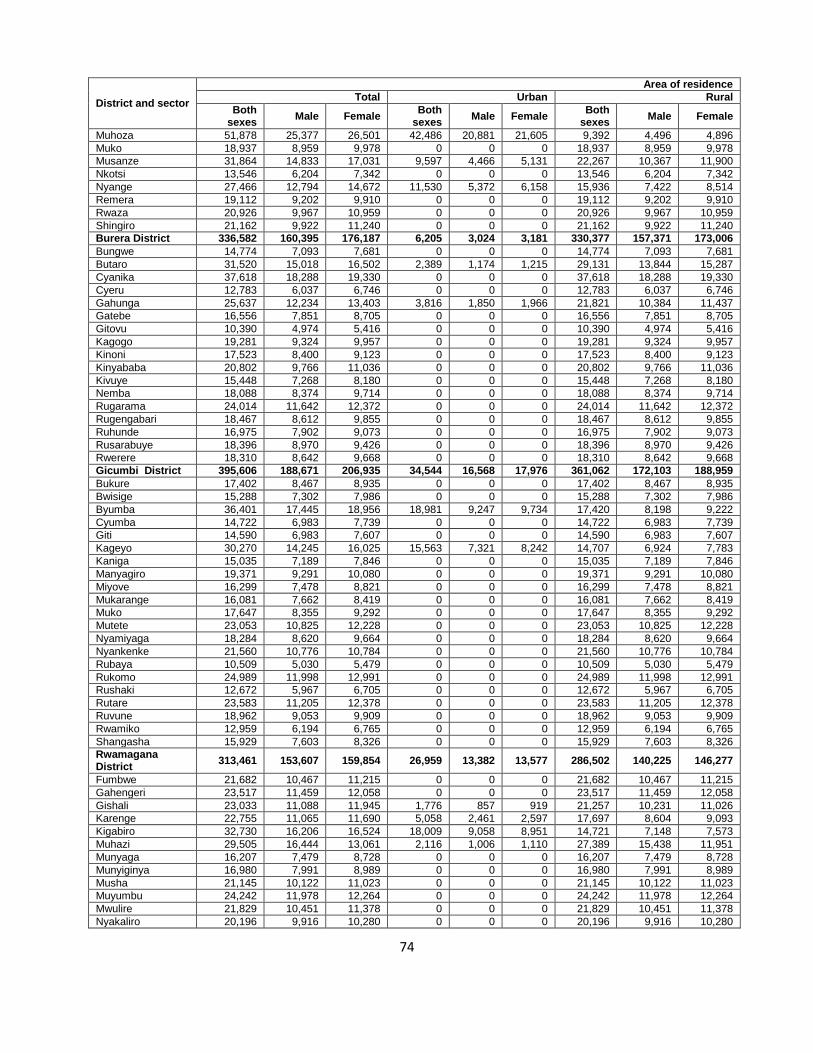
74
District and sector
Area of residence
Total Urban Rural
Both sexes
Male Female Both
sexes Male Female
Both sexes
Male Female
Muhoza 51,878 25,377 26,501 42,486 20,881 21,605 9,392 4,496 4,896
Muko 18,937 8,959 9,978 0 0 0 18,937 8,959 9,978
Musanze 31,864 14,833 17,031 9,597 4,466 5,131 22,267 10,367 11,900
Nkotsi 13,546 6,204 7,342 0 0 0 13,546 6,204 7,342
Nyange 27,466 12,794 14,672 11,530 5,372 6,158 15,936 7,422 8,514
Remera 19,112 9,202 9,910 0 0 0 19,112 9,202 9,910
Rwaza 20,926 9,967 10,959 0 0 0 20,926 9,967 10,959
Shingiro 21,162 9,922 11,240 0 0 0 21,162 9,922 11,240
Burera District 336,582 160,395 176,187 6,205 3,024 3,181 330,377 157,371 173,006
Bungwe 14,774 7,093 7,681 0 0 0 14,774 7,093 7,681
Butaro 31,520 15,018 16,502 2,389 1,174 1,215 29,131 13,844 15,287
Cyanika 37,618 18,288 19,330 0 0 0 37,618 18,288 19,330
Cyeru 12,783 6,037 6,746 0 0 0 12,783 6,037 6,746
Gahunga 25,637 12,234 13,403 3,816 1,850 1,966 21,821 10,384 11,437
Gatebe 16,556 7,851 8,705 0 0 0 16,556 7,851 8,705
Gitovu 10,390 4,974 5,416 0 0 0 10,390 4,974 5,416
Kagogo 19,281 9,324 9,957 0 0 0 19,281 9,324 9,957
Kinoni 17,523 8,400 9,123 0 0 0 17,523 8,400 9,123
Kinyababa 20,802 9,766 11,036 0 0 0 20,802 9,766 11,036
Kivuye 15,448 7,268 8,180 0 0 0 15,448 7,268 8,180
Nemba 18,088 8,374 9,714 0 0 0 18,088 8,374 9,714
Rugarama 24,014 11,642 12,372 0 0 0 24,014 11,642 12,372
Rugengabari 18,467 8,612 9,855 0 0 0 18,467 8,612 9,855
Ruhunde 16,975 7,902 9,073 0 0 0 16,975 7,902 9,073
Rusarabuye 18,396 8,970 9,426 0 0 0 18,396 8,970 9,426
Rwerere 18,310 8,642 9,668 0 0 0 18,310 8,642 9,668
Gicumbi District 395,606 188,671 206,935 34,544 16,568 17,976 361,062 172,103 188,959
Bukure 17,402 8,467 8,935 0 0 0 17,402 8,467 8,935
Bwisige 15,288 7,302 7,986 0 0 0 15,288 7,302 7,986
Byumba 36,401 17,445 18,956 18,981 9,247 9,734 17,420 8,198 9,222
Cyumba 14,722 6,983 7,739 0 0 0 14,722 6,983 7,739
Giti 14,590 6,983 7,607 0 0 0 14,590 6,983 7,607
Kageyo 30,270 14,245 16,025 15,563 7,321 8,242 14,707 6,924 7,783
Kaniga 15,035 7,189 7,846 0 0 0 15,035 7,189 7,846
Manyagiro 19,371 9,291 10,080 0 0 0 19,371 9,291 10,080
Miyove 16,299 7,478 8,821 0 0 0 16,299 7,478 8,821
Mukarange 16,081 7,662 8,419 0 0 0 16,081 7,662 8,419
Muko 17,647 8,355 9,292 0 0 0 17,647 8,355 9,292
Mutete 23,053 10,825 12,228 0 0 0 23,053 10,825 12,228
Nyamiyaga 18,284 8,620 9,664 0 0 0 18,284 8,620 9,664
Nyankenke 21,560 10,776 10,784 0 0 0 21,560 10,776 10,784
Rubaya 10,509 5,030 5,479 0 0 0 10,509 5,030 5,479
Rukomo 24,989 11,998 12,991 0 0 0 24,989 11,998 12,991
Rushaki 12,672 5,967 6,705 0 0 0 12,672 5,967 6,705
Rutare 23,583 11,205 12,378 0 0 0 23,583 11,205 12,378
Ruvune 18,962 9,053 9,909 0 0 0 18,962 9,053 9,909
Rwamiko 12,959 6,194 6,765 0 0 0 12,959 6,194 6,765
Shangasha 15,929 7,603 8,326 0 0 0 15,929 7,603 8,326
Rwamagana District
313,461 153,607 159,854 26,959 13,382 13,577 286,502 140,225 146,277
Fumbwe 21,682 10,467 11,215 0 0 0 21,682 10,467 11,215
Gahengeri 23,517 11,459 12,058 0 0 0 23,517 11,459 12,058
Gishali 23,033 11,088 11,945 1,776 857 919 21,257 10,231 11,026
Karenge 22,755 11,065 11,690 5,058 2,461 2,597 17,697 8,604 9,093
Kigabiro 32,730 16,206 16,524 18,009 9,058 8,951 14,721 7,148 7,573
Muhazi 29,505 16,444 13,061 2,116 1,006 1,110 27,389 15,438 11,951
Munyaga 16,207 7,479 8,728 0 0 0 16,207 7,479 8,728
Munyiginya 16,980 7,991 8,989 0 0 0 16,980 7,991 8,989
Musha 21,145 10,122 11,023 0 0 0 21,145 10,122 11,023
Muyumbu 24,242 11,978 12,264 0 0 0 24,242 11,978 12,264
Mwulire 21,829 10,451 11,378 0 0 0 21,829 10,451 11,378
Nyakaliro 20,196 9,916 10,280 0 0 0 20,196 9,916 10,280
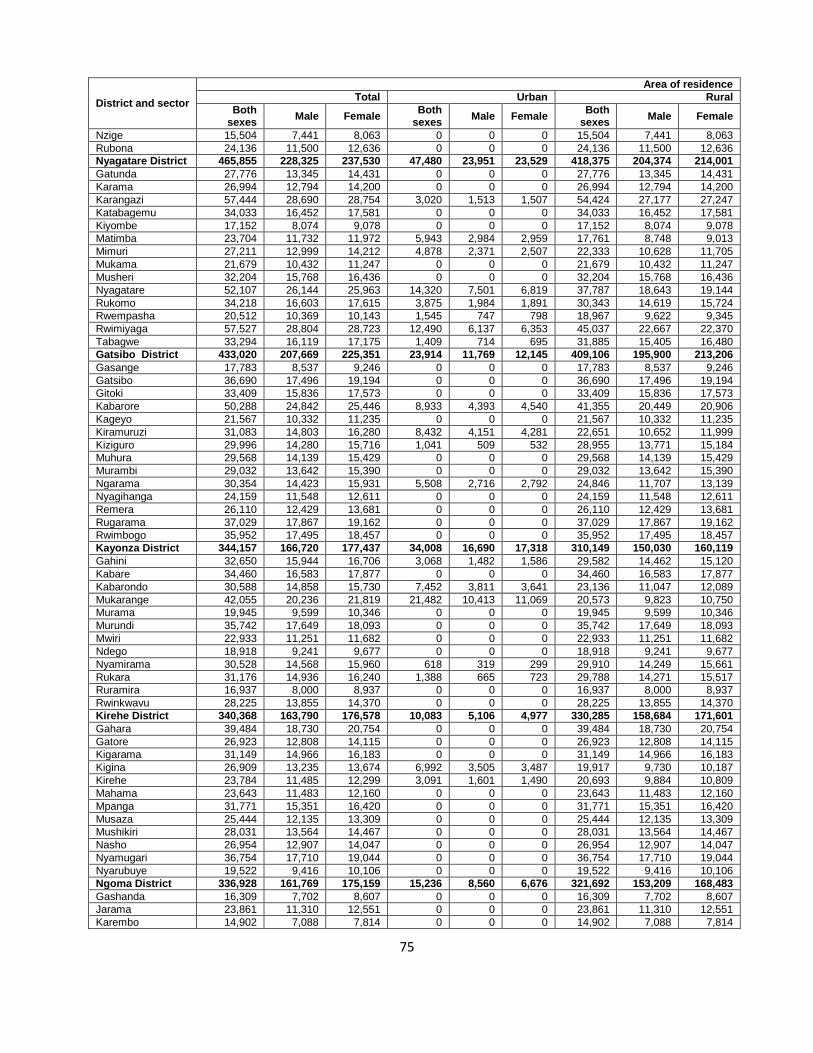
75
District and sector
Area of residence
Total Urban Rural
Both sexes
Male Female Both
sexes Male Female
Both sexes
Male Female
Nzige 15,504 7,441 8,063 0 0 0 15,504 7,441 8,063
Rubona 24,136 11,500 12,636 0 0 0 24,136 11,500 12,636
Nyagatare District 465,855 228,325 237,530 47,480 23,951 23,529 418,375 204,374 214,001
Gatunda 27,776 13,345 14,431 0 0 0 27,776 13,345 14,431
Karama 26,994 12,794 14,200 0 0 0 26,994 12,794 14,200
Karangazi 57,444 28,690 28,754 3,020 1,513 1,507 54,424 27,177 27,247
Katabagemu 34,033 16,452 17,581 0 0 0 34,033 16,452 17,581
Kiyombe 17,152 8,074 9,078 0 0 0 17,152 8,074 9,078
Matimba 23,704 11,732 11,972 5,943 2,984 2,959 17,761 8,748 9,013
Mimuri 27,211 12,999 14,212 4,878 2,371 2,507 22,333 10,628 11,705
Mukama 21,679 10,432 11,247 0 0 0 21,679 10,432 11,247
Musheri 32,204 15,768 16,436 0 0 0 32,204 15,768 16,436
Nyagatare 52,107 26,144 25,963 14,320 7,501 6,819 37,787 18,643 19,144
Rukomo 34,218 16,603 17,615 3,875 1,984 1,891 30,343 14,619 15,724
Rwempasha 20,512 10,369 10,143 1,545 747 798 18,967 9,622 9,345
Rwimiyaga 57,527 28,804 28,723 12,490 6,137 6,353 45,037 22,667 22,370
Tabagwe 33,294 16,119 17,175 1,409 714 695 31,885 15,405 16,480
Gatsibo District 433,020 207,669 225,351 23,914 11,769 12,145 409,106 195,900 213,206
Gasange 17,783 8,537 9,246 0 0 0 17,783 8,537 9,246
Gatsibo 36,690 17,496 19,194 0 0 0 36,690 17,496 19,194
Gitoki 33,409 15,836 17,573 0 0 0 33,409 15,836 17,573
Kabarore 50,288 24,842 25,446 8,933 4,393 4,540 41,355 20,449 20,906
Kageyo 21,567 10,332 11,235 0 0 0 21,567 10,332 11,235
Kiramuruzi 31,083 14,803 16,280 8,432 4,151 4,281 22,651 10,652 11,999
Kiziguro 29,996 14,280 15,716 1,041 509 532 28,955 13,771 15,184
Muhura 29,568 14,139 15,429 0 0 0 29,568 14,139 15,429
Murambi 29,032 13,642 15,390 0 0 0 29,032 13,642 15,390
Ngarama 30,354 14,423 15,931 5,508 2,716 2,792 24,846 11,707 13,139
Nyagihanga 24,159 11,548 12,611 0 0 0 24,159 11,548 12,611
Remera 26,110 12,429 13,681 0 0 0 26,110 12,429 13,681
Rugarama 37,029 17,867 19,162 0 0 0 37,029 17,867 19,162
Rwimbogo 35,952 17,495 18,457 0 0 0 35,952 17,495 18,457
Kayonza District 344,157 166,720 177,437 34,008 16,690 17,318 310,149 150,030 160,119
Gahini 32,650 15,944 16,706 3,068 1,482 1,586 29,582 14,462 15,120
Kabare 34,460 16,583 17,877 0 0 0 34,460 16,583 17,877
Kabarondo 30,588 14,858 15,730 7,452 3,811 3,641 23,136 11,047 12,089
Mukarange 42,055 20,236 21,819 21,482 10,413 11,069 20,573 9,823 10,750
Murama 19,945 9,599 10,346 0 0 0 19,945 9,599 10,346
Murundi 35,742 17,649 18,093 0 0 0 35,742 17,649 18,093
Mwiri 22,933 11,251 11,682 0 0 0 22,933 11,251 11,682
Ndego 18,918 9,241 9,677 0 0 0 18,918 9,241 9,677
Nyamirama 30,528 14,568 15,960 618 319 299 29,910 14,249 15,661
Rukara 31,176 14,936 16,240 1,388 665 723 29,788 14,271 15,517
Ruramira 16,937 8,000 8,937 0 0 0 16,937 8,000 8,937
Rwinkwavu 28,225 13,855 14,370 0 0 0 28,225 13,855 14,370
Kirehe District 340,368 163,790 176,578 10,083 5,106 4,977 330,285 158,684 171,601
Gahara 39,484 18,730 20,754 0 0 0 39,484 18,730 20,754
Gatore 26,923 12,808 14,115 0 0 0 26,923 12,808 14,115
Kigarama 31,149 14,966 16,183 0 0 0 31,149 14,966 16,183
Kigina 26,909 13,235 13,674 6,992 3,505 3,487 19,917 9,730 10,187
Kirehe 23,784 11,485 12,299 3,091 1,601 1,490 20,693 9,884 10,809
Mahama 23,643 11,483 12,160 0 0 0 23,643 11,483 12,160
Mpanga 31,771 15,351 16,420 0 0 0 31,771 15,351 16,420
Musaza 25,444 12,135 13,309 0 0 0 25,444 12,135 13,309
Mushikiri 28,031 13,564 14,467 0 0 0 28,031 13,564 14,467
Nasho 26,954 12,907 14,047 0 0 0 26,954 12,907 14,047
Nyamugari 36,754 17,710 19,044 0 0 0 36,754 17,710 19,044
Nyarubuye 19,522 9,416 10,106 0 0 0 19,522 9,416 10,106
Ngoma District 336,928 161,769 175,159 15,236 8,560 6,676 321,692 153,209 168,483
Gashanda 16,309 7,702 8,607 0 0 0 16,309 7,702 8,607
Jarama 23,861 11,310 12,551 0 0 0 23,861 11,310 12,551
Karembo 14,902 7,088 7,814 0 0 0 14,902 7,088 7,814
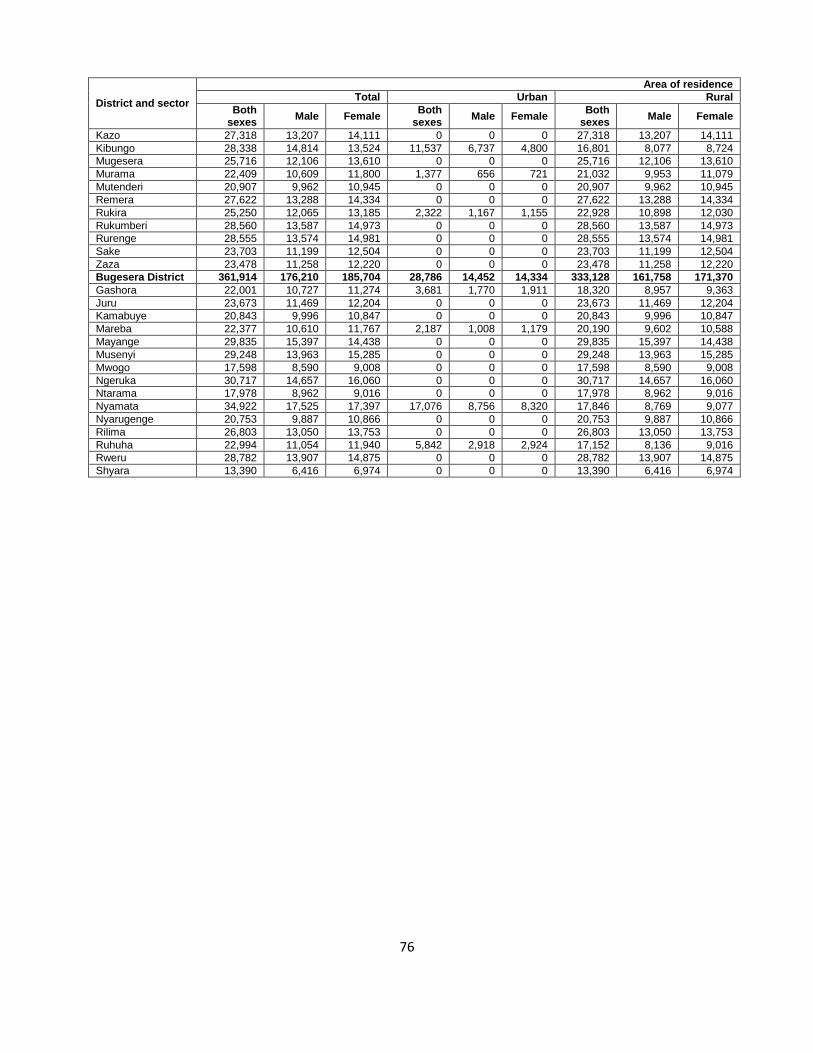
76
District and sector
Area of residence
Total Urban Rural
Both sexes
Male Female Both
sexes Male Female
Both sexes
Male Female
Kazo 27,318 13,207 14,111 0 0 0 27,318 13,207 14,111
Kibungo 28,338 14,814 13,524 11,537 6,737 4,800 16,801 8,077 8,724
Mugesera 25,716 12,106 13,610 0 0 0 25,716 12,106 13,610
Murama 22,409 10,609 11,800 1,377 656 721 21,032 9,953 11,079
Mutenderi 20,907 9,962 10,945 0 0 0 20,907 9,962 10,945
Remera 27,622 13,288 14,334 0 0 0 27,622 13,288 14,334
Rukira 25,250 12,065 13,185 2,322 1,167 1,155 22,928 10,898 12,030
Rukumberi 28,560 13,587 14,973 0 0 0 28,560 13,587 14,973
Rurenge 28,555 13,574 14,981 0 0 0 28,555 13,574 14,981
Sake 23,703 11,199 12,504 0 0 0 23,703 11,199 12,504
Zaza 23,478 11,258 12,220 0 0 0 23,478 11,258 12,220
Bugesera District 361,914 176,210 185,704 28,786 14,452 14,334 333,128 161,758 171,370
Gashora 22,001 10,727 11,274 3,681 1,770 1,911 18,320 8,957 9,363
Juru 23,673 11,469 12,204 0 0 0 23,673 11,469 12,204
Kamabuye 20,843 9,996 10,847 0 0 0 20,843 9,996 10,847
Mareba 22,377 10,610 11,767 2,187 1,008 1,179 20,190 9,602 10,588
Mayange 29,835 15,397 14,438 0 0 0 29,835 15,397 14,438
Musenyi 29,248 13,963 15,285 0 0 0 29,248 13,963 15,285
Mwogo 17,598 8,590 9,008 0 0 0 17,598 8,590 9,008
Ngeruka 30,717 14,657 16,060 0 0 0 30,717 14,657 16,060
Ntarama 17,978 8,962 9,016 0 0 0 17,978 8,962 9,016
Nyamata 34,922 17,525 17,397 17,076 8,756 8,320 17,846 8,769 9,077
Nyarugenge 20,753 9,887 10,866 0 0 0 20,753 9,887 10,866
Rilima 26,803 13,050 13,753 0 0 0 26,803 13,050 13,753
Ruhuha 22,994 11,054 11,940 5,842 2,918 2,924 17,152 8,136 9,016
Rweru 28,782 13,907 14,875 0 0 0 28,782 13,907 14,875
Shyara 13,390 6,416 6,974 0 0 0 13,390 6,416 6,974

77
PERSONS AND INSTITUTIONS THAT CONTRIBUTED TO THE FOURTH RWANDA POPULATION AND HOUSING CENSUS, 2012
National Census Commission
Chairperson: Claver GATETE John RWANGOMBWA Vice Chairperson: James MUSONI Secretary: Yusuf MURANGWA Dr. Diane KARUSISI
Minister of Finance and Economic Planning Former Minister of Finance and Economic Planning Minister of Local Government Director General of NISR Former Acting Director General of NISR
Members of the National Census Commission Venantia TUGIREYEZU Stella Ford MUGABO James KABAREBE Sheikh Mussa HARERIMANA Louise MUSHIKIWABO Dr. Vincent BIRUTA Dr. Mathias HAREBAMUNGU Dr. Agnes BINAGWAHO Odda GASINZIGWA Jean Philbert NSENGIMANA Prof. Silas LWAKABAMBA Albert NSENGIYUMVA Anastase MUREKEZI Stanislas KAMANZI Willy RUKUNDO Arthur ASIIMWE Hannington NAMARA Robert BAYIGAMBA
Minister in the Office of the President Minister of Cabinet Affairs Minister of Defense Minister of Internal Security Minister of Foreign Affairs and Cooperation Minister of Education Minister of State in charge of Primary and Secondary Education Minister of Health Minister in Prime Minister’s Office in charge of Gender and Family Promotion Minister of Youth and ICT Minister of Infrastructure Former Minister of Infrastructure Minister of Public Service and Labour Minister of Natural Resources Former Acting Director General of ORINFOR Director General of RBA CEO of the Private Sector Federation Former CEO of the Private Sector Federation
78
National Technical Committee Chairperson: Leonard MINEGA RUGWABIZA Vice Chairperson: Egide RUGAMBA Secretary: Prosper NKAKA MUTIJIMA
Former Director of National Development Planning and Research in MINECOFIN Director General of Planning in MINALOC Census Coordinator of the RPHC4
Members of the National Technical Committee Dr. Agnes NTIBANYURWA Esther MUTAMBA Anna MUGABO Dr. Erasme RWANAMIZA Innocent MUSABYIMANA Jeanne d’Arc UMULISA Parfait UWARIRAYE Redempter BATETE MUKUNZI Antonio MUTORO
Assistant Representative of UNFPA in charge of Population and Development Director General of Rwanda Housing Authority Director General of Labour and Employment Director General of Education Director of Planning in MINIRENA Director of Planning and M&E in MIGEPROF Director of Planning in MINISANTE Director of Youth Employment and Program Coordination Former Executive Director of IPAR-Rwanda
79
Branches of the National Census Commission
Members of the Branches of the NCC at Province Level (Governors of Provinces)
Kigali City: Fidele NDAYISABA, Mayor
Sothern Province:
Alphonse MUNYENTWARI, Governor
Western Province: Celestin KABAHIZI, Former Governor
Caritas MUKANDASIRA, Governor
Northern Province: Aime BOSENIBAMWE, Governor
Eastern Province:
Odette UWAMARIYA, Governor
80
Members of the Branches of the NCC at District Level (Mayors of Districts) Solange MUKASONGA Willy NDIZEYE Paul Jules NDAMAGE Abdallah MURENZI Leandres KAREKAZI Francois HABITEGEKO Eugene MUZUKA KAYIRANGA Philbert MUGISHA Francois Xavier MBABAZI Yvonne MTAKWASUKU Jacques RUTSINGA Bernard KAYUMBA Gaspard BYUKUSENGE Sheikh Hassan BAHAME Abdoulatif TWAHIRWA
Nyarugenge District Gasabo District Kicukiro District Nyanza District Gisagara District Nyaruguru District Huye District Nyamagabe District Ruhango District Muhanga District Kamonyi District Karongi District Rutsiro District Rubavu District Nyabihu District
Gedeon RUBONEKA Oscar NZEYIMANA Jean Baptiste HABYARIMANA Justus KANGWAGYE Deogratias NZAMWITA Winifrida MPEBYEMUNGU Samuel SEMBAGARE Alexandre MVUYEKURE Nehemie UWIMANA Fred SABITI ATUHE Ambrose RUBONEZA John MUGABO Protais MURAYIRE Aphrodice NAMBAJE Louis RWAGAJU
Ngororero District Rusizi District Nyamasheke District Rulindo District Gakenke District Musanze District Burera District Gicumbi District Rwamagana District Nyagatare District Gatsibo District Kayonza District Kirehe District Ngoma District Bugesera District
81
National Directors Yusuf MURANGWA, Director General of NISR
Dr. Diane KARUSISI, Former Acting Director General of NISR
Census Technical Director Willy MPABUKA GASAFARI
Census National Coordinator
Prosper NKAKA MUTIJIMA
Census Field Operations
Census National Coordinators Prosper NKAKA MUTIJIMA Major-General Jacques MUSEMAKWELI Eric KAYIRANGA Alex MUGISHA
National Institute of Statistics of Rwanda Rwanda Defence Force Rwanda National Police Rwanda Correctional Services
Census Province Coordinators
Juvenal MUNYARUGERERO Baudouin RUTERANA Willy MPABUKA GASAFARI Francois SEKAMONDO Astrid SEGAHWEGE
Kigali City Southern Province Western Province Northern Province Eastern Province
82
Census District Coordinators
Jean Nepo. RWABUKUMBA Franck Mine Jean Paul RUSHAKU Francois ABALIKUMWE Evelyne KANYONGA Etienne KWIZERA Juvenal NTAMBARA Albert KARERA Annonciata MUKABAGIRE Francois KABAYIZA Andre KAJABIKA Jean Baptiste SERUGENDO Jean Marc MUKUNDABANTU Jean MUGABO Immaculee MUKANGENDO Olivier MBANGUTSE Wellars MUDASHIMA
Nyarugenge District Gasabo District Kicukiro District Nyanza District Gisagara District Nyaruguru District Huye District Nyamagabe District Ruhango District Muhanga District Kamonyi District Karongi District Rutsiro District Rubavu District Nyabihu District Ngororero District Rusizi District
Patrick NSHIMIYIMANA Jean BIZIMANA Issa MUSABEMUNGU Clement BIZIMUNGU Beatrice UWAYEZU Esther MAHUKU Vital HABINSHUTI Ephrem RUKUNDO Dominique M. KANOBANA Nicolas MWIZERWA David MASENGEHO Venuste NKURUNZIZA Basile NJAMAHORO Dominique MICOMYIZA Eugene UWIRAGIYE Florence UWIMBABAZI
Rusizi District Nyamasheke District Rulindo District Gakenke District Musanze District Burera District Gicumbi District Rwamagana District Nyagatare District Nyagatare District Gatsibo District Kayonza District Kirehe District Ngoma District Ngoma District Bugesera District
83
Zone and Sector Controllers and Enumerators
Zone Controllers: 127 (mostly Districts Education Officers and Headmasters of some Secondary Schools)
Sector Controllers:
451 (mostly Sector Education Officers)
Enumerators: 24,005 (mostly Primary School Teachers)
Cartography and Data Processing
Programmer: Augustin TWAGIRUMUKIZA, Director of ICT Assistant Programmers: Didier UYIZEYE Donath NKUNDIMANA Massoud HARERIMANA Coders: Number = 308 Data Entry Clerks: Number = 308
Cartography: Florent BIGIRIMANA Olivier MBANGUTSE Clement BIZIMUNGU Albert KARERA James RWAGASANA Archiving: Eric RUSA Pierre Claver KABANDANA
84
Administration and Finance Odette MBABAZI Didier GAKUBA Liberal SEBULIKOKO Jean Pierre UWINEZA Andre GASHUGI Silas MUNYEMANA Jerome UWIBAMBE Alicia INGABIRE Jocelyne UWAMAHORO Esperance UWIMANA Nina RURANGIRWA Maureen TWAHIRWA Yolande KABEGA Antoinette HABINSHUTI Theodore RUGANZU Jean Paul NDISANZE Hassan YAHYA Eric BUGINGO Alphonse SHUMBUSHO Gerald YEMUKAMA Nadine BABYEYI Elias DUSENGE Sita KAZIMBAYA
Deputy Director General in charge of Corporate Services in NISR Former Director of Finance in NISR Former Coordinator of Basket Fund Former Acting Director of Finance in NISR Director of Administration in NISR Director of Finance in NISR Accountant in NISR Accountant in NISR HR Manager of Permanent Staff in NISR Former HR Manager of Temporary Staff in NISR HR Manager of Temporary Staff in NISR Former Public Relations Officer Former Public Relations Officer Planning Officer Former Planning Officer Planning Officer Coordinator of Basket Fund Procurement Officer Procurement Officer Procurement Officer Administrative Assistant Messenger Messenger
85
Census Data Analysis
National Data Analysts
Jean RUGARAMA Dieudonne MUHOZA Beatrice UWAYEZU Willy MPABUKA GASAFARI Dr. Bosco BINENWA Pierre Claver RUTAYISIRE Prof. Emmanuel TWARABAMENYE James BYIRINGIRO Charles RURANGA Annonciata MUKABAGIRE Dominique M.KANOBANA Apolline MUKANYONGA Jules RUBYUTSA Venant HABARUGIRA Michel NDAKIZE Prosper NKAKA MUTIJIMA
Population Size and Spatial Distribution Marital Status and Nuptiality Fertility Mortality Socio-Cultural Characteristics of the Population Migration and Spatial Mobility Characteristics of Housing and Households Labour Force Measurement and Mapping of Non-Monetary Poverty Education Gender Socio-Economic Status of Persons with Disability Socio-Economic Status of Children Socio-Economic Status of Youth Socio-Economic Status of Elderly Population Projections
International Technical Support
National Institute of Statistics of Rwanda (NISR):
Oxford Policy Management (OPM):
Dr. Mohamed ABULATA United Nations Population Fund (UNFPA): Dr, Bolaji TAIWO, Chief Technical Adviser Dr. Mady BIAYE, Regional Technical Adviser Jean Marc HIE, International Data Processing Expert Dr. Macoumba THIAM, International Census Analyst Dr. Ben MWASI, International GIS Expert
Mary STRODE Felix SCHMIEDING Cora MEZGER Jean Michel DURR Gilberto RIBEIRO Philippe N. GAFISHI Prof. Sabu PADMADAS
Ludovico CARRARO Juste NITIEMA Prof. James BROWN Wine LANGERAAR Stephi SPRINGHAM Sophia KAMARUDEEN Paul JASPER Johnson FIFI
86
NISR MANAGEMENT TEAM
Yusuf MURANGWA, Director General
Odette MBABAZI, Deputy Director General/CS
Andre GASHUGI, Director of Administration
Jean Pierre UWINEZA, Director of Finance
Willy GASAFARI, Director of Census
Juvenal MUNYARUGERERO, Census Field Expert
Prosper MUTIJIMA, Census Coordinator
Augustin TWAGIRUMUKIZA, Director of ICT
Sebastien MANZI, Director of Economic Statistics
Dominique HABIMANA, Director of Statistical Methods, Research and Publications
Antoinette HABINSHUTI, Planning Officer
Jean Paul NDISANZE, Planning Officer