Population. Many Ways of Measuring Population: Population Density measure of total population...
38
Population
-
Upload
jemimah-thompson -
Category
Documents
-
view
234 -
download
0
Transcript of Population. Many Ways of Measuring Population: Population Density measure of total population...

Population

Many Ways of Measuring Population:
Population Density measure of total
population relative to land size arithmetic population
density

World Population Density•Where is population the densest?
•What factors might influence population density?

Physiologic Population Density – number of people per unit area of agriculturally productive land

Toronto, Canada5,113,149 people
8.3 per square mile
168 per square mile
Only five percent of Canada’s land is arable
Moving northward, the land is frozen and unfarmable.

Arithmetic Density: 32 per square mile
Physiological Density: 1, 601 per square mile
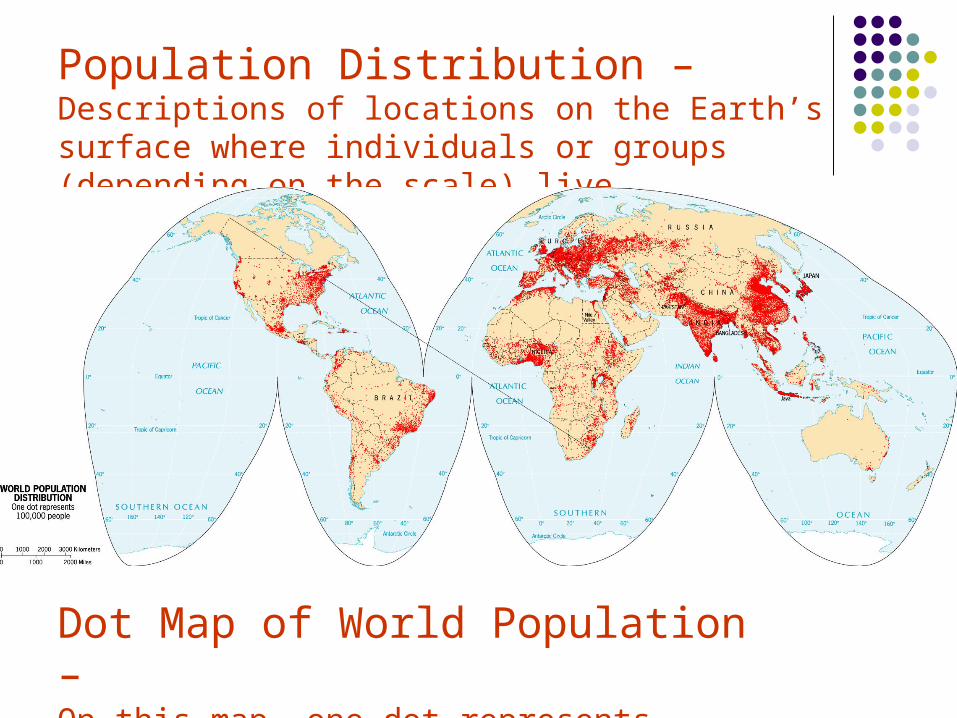
Dot Map of World Population –On this map, one dot represents 100,000 people
Population Distribution – Descriptions of locations on the Earth’s surface where individuals or groups (depending on the scale) live.

World Population Distribution and Density
East Asia- ¼ of world population here
South Asia - bound by the Himalayas and a desert in Pakistan
Europe- population is concentrated in cities
North America- megalopolis

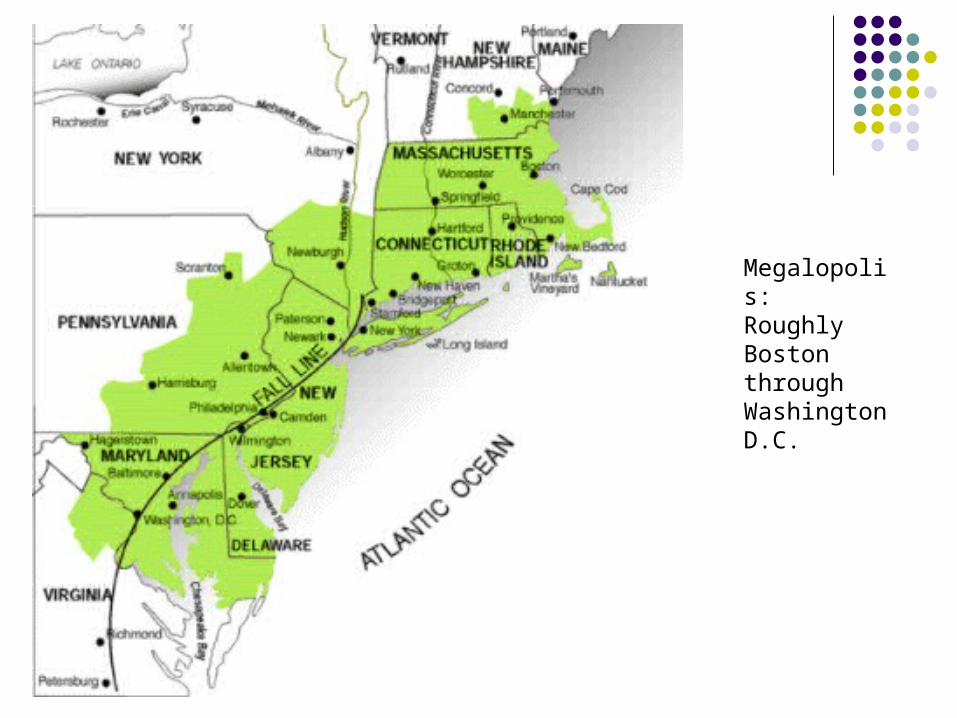
Megalopolis: Roughly Boston through Washington D.C.

Populations are falling in some parts of the world. How will Figure 2.5 look different 50 years from now? If you were updating this lesson in 50 years, where would the largest population clusters in the world be?
A Population Bomb? Malthus (early 1800s)
Food production increased at an arithmetic ratio (1, 2, 3...) while population increased at an exponential ratio (1, 2, 4, 8...).
Man is incapable of controlling his own numbers, so natural calamities such as floods and epidemics serve to control/reduce his numbers.
Ehrlich (1960s) warned of a population bomb because the world’s
population was outpacing food production. radical action is needed to limit the overpopulation.

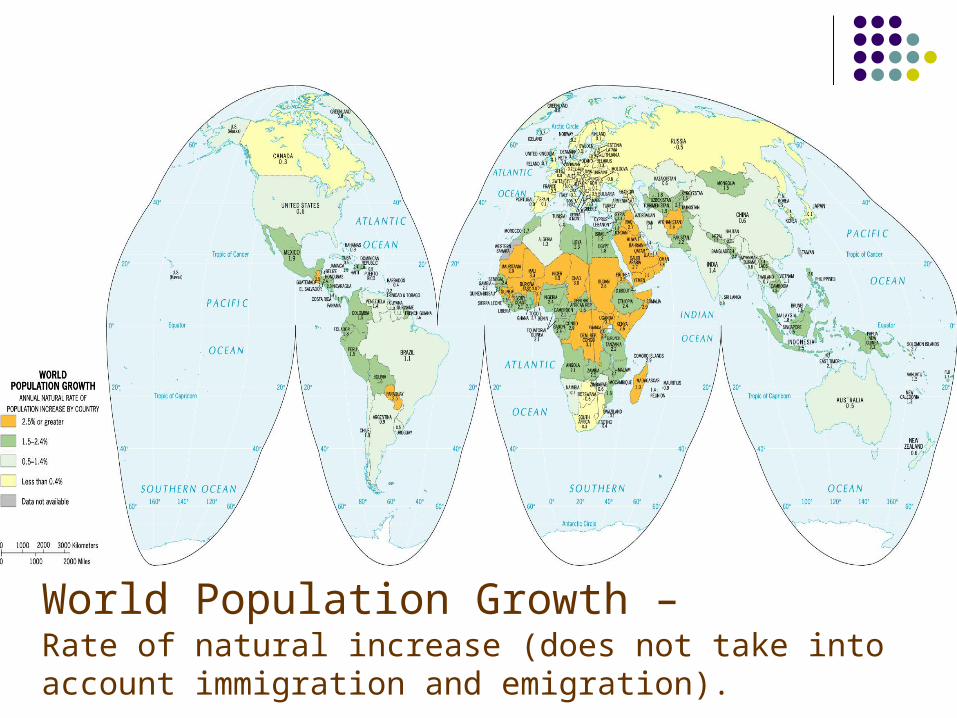
World Population Growth –Rate of natural increase (does not take into account immigration and emigration).

Today, the pace of world population growth is
slowing. Where have Total Fertility Rates (TFRs) fallen below replacement level and why?
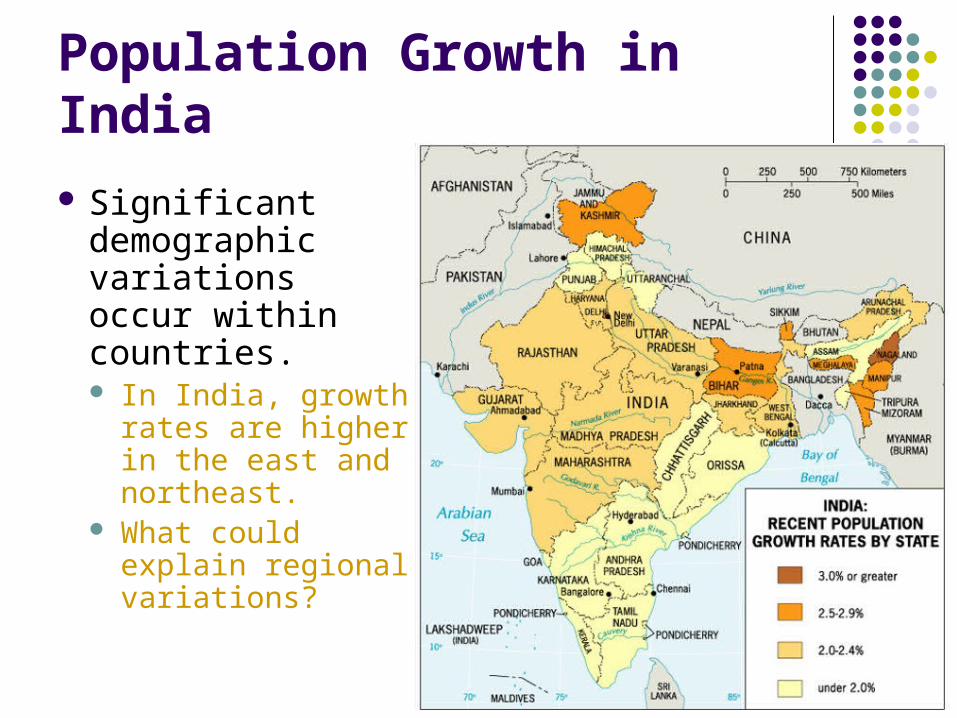
Population Growth in India
Significant demographic variations occur within countries. In India, growth
rates are higher in the east and northeast.
What could explain regional variations?
Why do Growth Rates Vary in India?
1960s population planning program 1970s country began forced
sterilization program for men with 3 or more children. 22.5 million men were sterilized.
2004 state of Uttar Pradesh began guns for sterilization program.
Today, most states use advertising and persuasion to lower birth rates.

Maharashtra, India. A sign reads “free family planning sterlization operation” closed in 1996.
The Demographic Transition in Great Britain
Studied the change in birth rates, death rates, and natural growth rates over the course of British industrialization.
Found a transition occurred when death rates decline and then birth rates decline, resulting in a low or sustained growth rate.
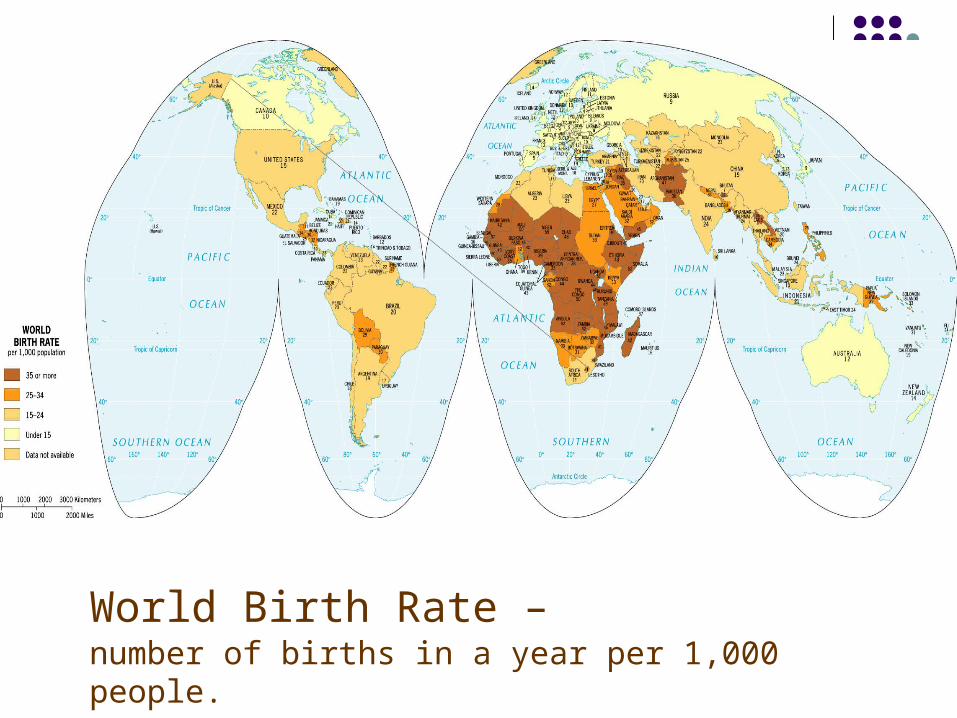
World Birth Rate – number of births in a year per 1,000 people.

World Mortality Rate – number of deaths in a year per 1,000 people.

The Demographic Transition

The Demographic Transition
Stage 1: Low Growth
Stage 2: High Growth
Stage 3: Moderate Growth
Stage 4: Low Growth or Stationary
Stationary population level (SPL)?

Population Composition
Population Composition is concerned with: Gender distribution Age distribution
within a country, region, or place.

Population Pyramids – Charts that show the percentages of each age group in the total population, divided by gender.
For poorer countries, the chart is shaped like a pyramid. Infant mortality rates are high, life expectancy is shorter.
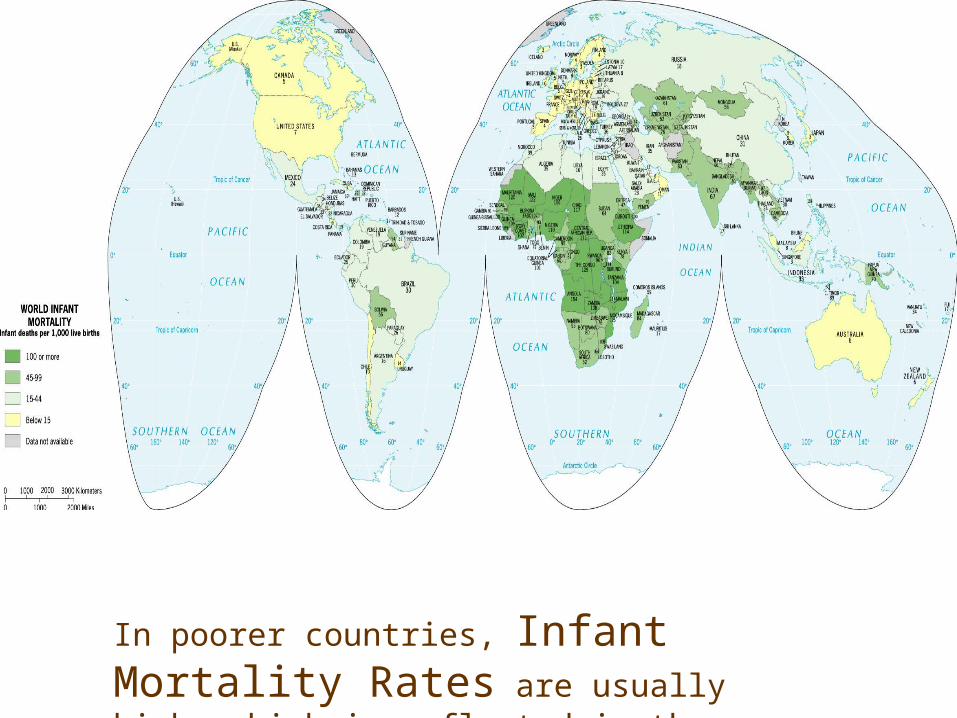
In poorer countries, Infant Mortality Rates are usually high, which is reflected in the pyramid shape.
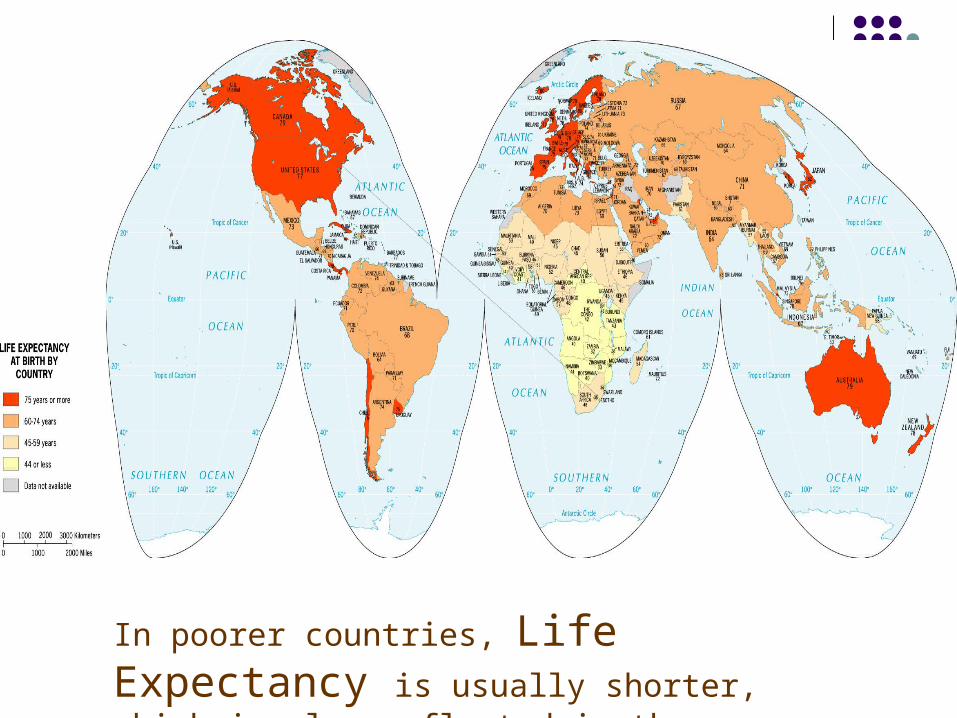
In poorer countries, Life Expectancy is usually shorter, which is also reflected in the pyramid shape.

Affect of AIDS on population pyramid for South Africa.
Predicted population for 2035, without and with AIDS.
With AIDS, looks like a population “chimney.”

AIDS is leaving large numbers of AIDS orphans.

AIDS is creating large numbers of AIDS care-givers.
Drawing by a Pokot boy in Kenya, the drawing shows him working in the fields and taking care of his family cattle in order to assist his sick family members.

Population Pyramids – Charts that show the percentages of each age group in the total population, divided by gender.
For wealthier countries, the chart is shaped like a lopsided vase. Population is aging, TFRs are declining.
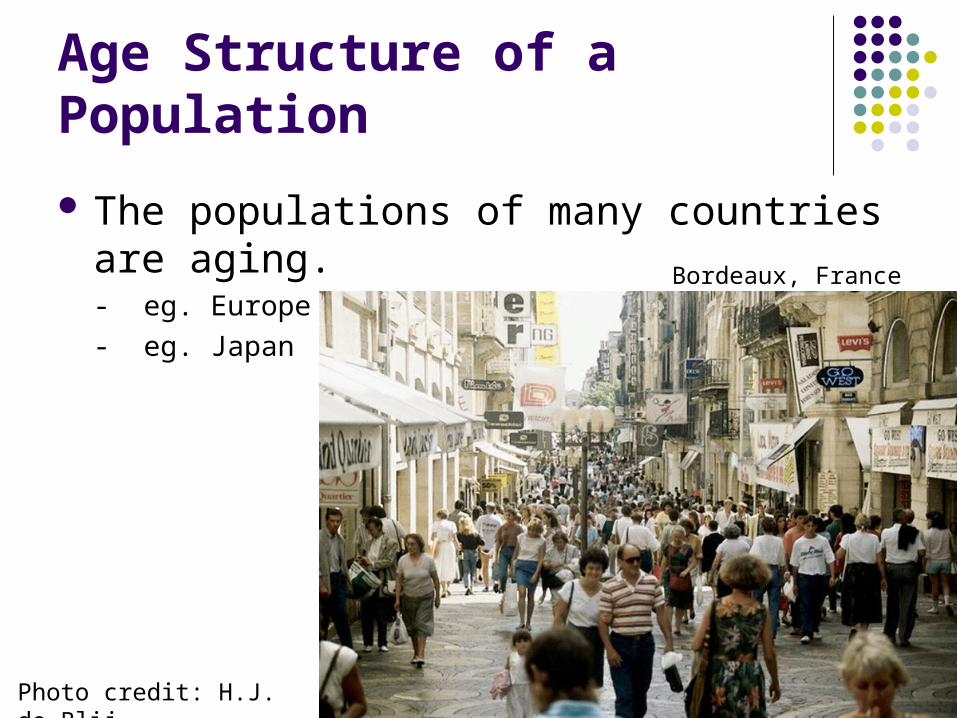
Age Structure of a Population
The populations of many countries are aging. - eg. Europe
- eg. Japan
Photo credit: H.J. de Blij
Bordeaux, France

Aging Populations
To replace the population, TFR must be 2.1.- TFR in Bologna, Italy is 0.8
- Why are women having fewer children?
What are the impacts of an aging population on a country?
What are the “solutions” to an aging population?

Longer Life Expectancies typically mean higher rates of chronic diseases.
In the United States, the national infant mortality rate (IMR) is 7.0. That number represents an average for the country. Think about the differences in IMR in the United States across regions, ethnicities, social classes, and other sectors.

Government Population Policies
Expansive Population Policies- Encourages population growth.
Eugenic Population Policies- Favors one racial or cultural sector over others.
Restrictive Population Policies- range from toleration of unapproved birth control to outright prohibition of large families.
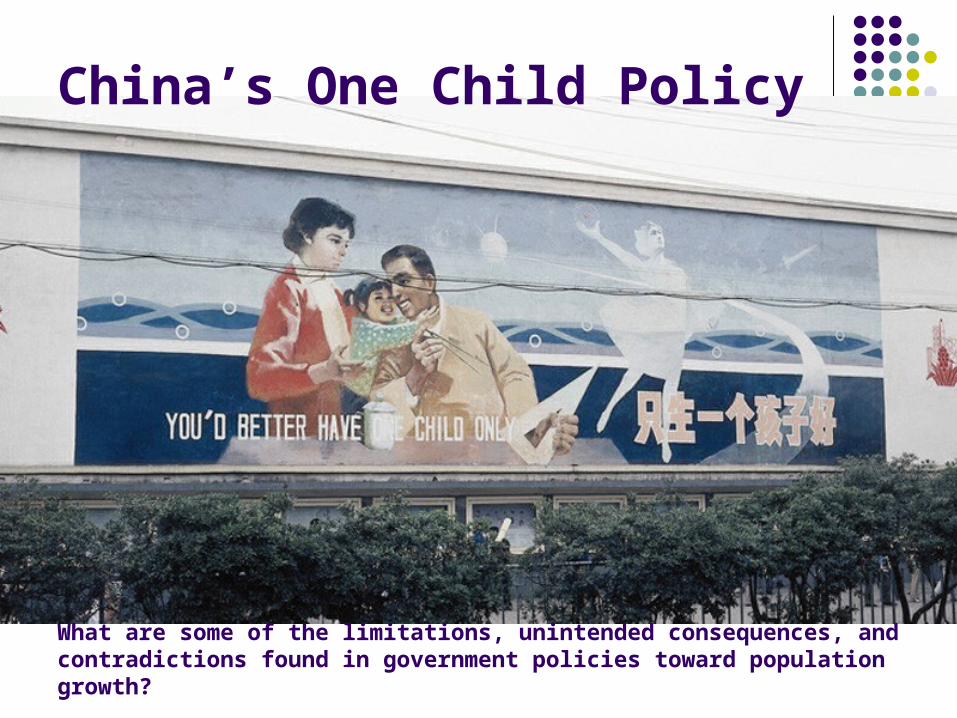
China’s One Child Policy
What are some of the limitations, unintended consequences, and contradictions found in government policies toward population growth?

When studying government policies on population, one of the most important things to remember is unintended consequences. Choose one country in the world where women have little access to education and are disempowered. Consider the previous section of the chapter on age composition, and determine how restrictive population policies in this country will alter the population composition of the country.