Routing Flexible Tra c into Metroplex - Iowa State …pwei/proceedings/gnc11.pdfRouting Flexible Tra...
14
Routing Flexible Traffic into Metroplex Peng Wei * Jit-Tat Chen * Dominick Andrisani * Dengfeng Sun * This research introduces the concepts of metroplex and flexible flight. The dependency metric between the airports in a metroplex is illustrated. Moreover, this paper focuses on metroplex routing algorithm. The authors establish a network model and develop the routing algorithm for flexible flights which fly from their original airports to destination metroplexes based on the model. The routing algorithm is performed under the sector congestion constraint. A metroplex consists of several airports around a metropolitan area instead of one single airport. As a flexible flight follows the metroplex routing instructions and approaches the decision boundary of the metroplex, a scheduler in the Multi-center Traffic Management Advisor (McTMA) will decide which runway of which airport the flight will land in. Together the routing and the scheduling make a complete flexible flight operation. Nomenclature d l Dependency metric of runway length d o Dependency metric of runway orientation d p Dependency metric of runway proximity H Hash table of waypoints for Jetway Network c Central point of all metroplex airports ap i The ith airport in the metroplex w αmax The largest great circle distance weight w 0 αe Normalized great circle distance weight on Edge e γ Penalty strengthen coefficient w 0 βe Sector congestion penalty weight I. Introduction With rapid growth of air traffic, the airports in a metropolitan area can not be considered as separated entities, but rather as subsystems of a larger, interdependent system. We call such a system of airports a metroplex. “Concept of Operations for the Next Generation Air Transportation System” [1] from The Joint Planning and Development Office (JPDO) defines a metroplex as a group of two or more adjacent airports whose arrival and departure operations are highly interdependent. Airborne traffic congestion, airports in close proximity, and limited infrastructure resource lower the efficiency in those busy metroplex airspace. Separation rules and environmental problems also bring down efficiencies. Resource optimization of all the runways and airports and associated separation rules within the same metroplex will improve the overall throughput and also potentially reduce noise and emissions. A metroplex phenomenon is an interaction between two or more airports in close geographically proximity and it has been observed and analysed by some researchers. Atkins and his Mosaic ATM colleagues [2] observed the metroplex phenomena in San Francisco bay area and showed that some metroplex phenomena will affect the total capacity of the metroplex airport system. In [2] the authors also built an initial framework * School of Aeronautics and Astronautics, Purdue University. 1 of 14 American Institute of Aeronautics and Astronautics
Transcript of Routing Flexible Tra c into Metroplex - Iowa State …pwei/proceedings/gnc11.pdfRouting Flexible Tra...

Routing Flexible Traffic into Metroplex
Peng Wei∗ Jit-Tat Chen∗
Dominick Andrisani∗
Dengfeng Sun∗
This research introduces the concepts of metroplex and flexible flight. The dependencymetric between the airports in a metroplex is illustrated. Moreover, this paper focuseson metroplex routing algorithm. The authors establish a network model and develop therouting algorithm for flexible flights which fly from their original airports to destinationmetroplexes based on the model. The routing algorithm is performed under the sectorcongestion constraint. A metroplex consists of several airports around a metropolitan areainstead of one single airport. As a flexible flight follows the metroplex routing instructionsand approaches the decision boundary of the metroplex, a scheduler in the Multi-centerTraffic Management Advisor (McTMA) will decide which runway of which airport theflight will land in. Together the routing and the scheduling make a complete flexible flightoperation.
Nomenclature
dl Dependency metric of runway lengthdo Dependency metric of runway orientationdp Dependency metric of runway proximityH Hash table of waypoints for Jetway Networkc Central point of all metroplex airportsapi The ith airport in the metroplexwαmax
The largest great circle distance weightw′αe
Normalized great circle distance weight on Edge eγ Penalty strengthen coefficientw′βe
Sector congestion penalty weight
I. Introduction
With rapid growth of air traffic, the airports in a metropolitan area can not be considered as separatedentities, but rather as subsystems of a larger, interdependent system. We call such a system of airports ametroplex. “Concept of Operations for the Next Generation Air Transportation System” [1] from The JointPlanning and Development Office (JPDO) defines a metroplex as a group of two or more adjacent airportswhose arrival and departure operations are highly interdependent.
Airborne traffic congestion, airports in close proximity, and limited infrastructure resource lower theefficiency in those busy metroplex airspace. Separation rules and environmental problems also bring downefficiencies. Resource optimization of all the runways and airports and associated separation rules withinthe same metroplex will improve the overall throughput and also potentially reduce noise and emissions.
A metroplex phenomenon is an interaction between two or more airports in close geographically proximityand it has been observed and analysed by some researchers. Atkins and his Mosaic ATM colleagues [2]observed the metroplex phenomena in San Francisco bay area and showed that some metroplex phenomenawill affect the total capacity of the metroplex airport system. In [2] the authors also built an initial framework
∗School of Aeronautics and Astronautics, Purdue University.
1 of 14
American Institute of Aeronautics and Astronautics

to understand the nature of metroplexes by presenting a detailed metroplex definition based on a set ofmeasurable dimensions.
The dependencies and impacts of the three major airports JFK, LGA and EWR in NYNJ metroplex wereanalysed by DeLaurentis and Ayyalasomayajula from Purdue University together with their collaborationpartner George Mason University [3] sponsored by NASA. The dependency metric is developed to formulatepolicies and strategies for metroplex operations.
McClain and Clarke [4] developed the metric for metroplex clustering analysis and Clarke has beenworking on building a theoretical framework for quantifying the interactions between the airports in ametroplex. Donohue studied the airports in NYNJ metroplex early in 2008 [5, 6] and the two papers tookthe first look at the status of each airport in terms of the markets served, seat capacity, delays and otherfeatures. His recent work [7] with Schaar has applied metroplex concept to improve the domestic airlineservices.
For metroplex routing and scheduling, there are very few literature works existing. However, manyweather avoidance reroute generating algorithms have already been developed and they can be borrowed tosolve the routing problem with sector congestion constraint by treating congested sectors as severe weatherareas. [8] adopted a grid network model to generate a reroute for a general aviation aircraft in free flight.Unfortunately, this algorithm can not be extended for commercial flights with Air Traffic Control.
In [9] the authors considered a mix of a grid network and a waypoint network when generating reroutesfor traffic flows approaching the destination. It mainly focused on the arrival traffic weather avoidancerouting and metrics associated with such routes. In [10] the authors developed the weather-specific CodedDeparture Routes (CDRs) for pre-departure flights. The resulted CDRs were generated under currentweather predictions. However, some of the CDRs may not be feasible. [11] studied ground traffic reroutingwith a future congestion prediction along the current route. For ground traffic, any generated reroutes willbe feasible because the network is built on existing roadways.
[12] proposed a dynamic rerouting algorithm which generates flexible and acceptable reroutes. Theresearch in [12] invited the subject matter experts to help define the metrics of reroute acceptability and thenetwork model was built based on acceptable flight routes from historic data.
The only metroplex routing research we can found is [13] which describes a mixed integer linear pro-gramming formulation and solves the routing and scheduling problems at the same time for the flights whosedestinations are metroplexes. The authors also formed the problem to maintain its computational feasibilityand analysed the resulted routes.
The aim of this work is to first introduce the concepts of metroplex and flexible flight and to illustratethe dependency between the airports in the same metroplex. Secondly, we present the Jetway Plus Networkmodel and the metroplex routing algorithm which considers the sector congestion as the constraint. Therouting is followed by a McTMA scheduler solving the runway assignment problem. To our best knowledge,this is the first work that studies the metroplex routing under the sector congestion constraint. In addition,the algorithm implementation is explicitly shown step by step and the simulation for one flexible flight isvisualized by using FACET interfaces [14].
The rest of this paper is organized as follows. The second section introduces the concepts of metroplexand flexible flights. Also the dependency metric of the metroplex airports is illustrated in detail. The thirdsection shows how the network model is established for running our metroplex routing algorithm. In thefourth section, the metroplex routing algorithm under the sector congestion constraint is presented and therunway scheduler following the routing algorithm is also simply introduced. The routing algorithm simulationis performed in Section V and Section VI concludes the paper.
II. Metroplex and Flexible Flight
A. The Concept of Metroplex
A metroplex is a region with several close airports which share traffic resources such as airspace, groundtransportation. More rigorously, a metroplex consists of several close airports with consequential dependen-cies. Each metroplex subsists in a system-of-systems which includes the airports, the flights and groundtraffic between them, the airline companies, Air Traffic Control (ATC) services etc. Fig. 1 illustrates thetypes and layers of networks in National Airspace System (NAS) and how they interact with the metroplexoperations [3]. Studying a composite network combining the service networks of airline companies will pro-vide insights into NAS-wide traffic between the various airports as nodes in this network (δ-level in Fig. 1).
2 of 14
American Institute of Aeronautics and Astronautics

Another level in this network leads to a scenario in which airports in a metroplex can be considered as“modules” which are connected to other metroplex modules and airports (γ-level in Fig. 1). The airportswithin each module are dependent on each other operationally and possibly economically. At the same timethey are connected to the other parts of NAS by all means of airline services. The “external” interactionsbetween a metroplex module and the other parts of the NAS are different from those dependencies “internal”to the metroplex module. In order to understand this difference, metrics are developed to characterize andquantify the dependencies between metroplex airports.
Studying these internal dependencies inside a module is critical for proper implementation of our flex-ible operation concept on metroplexes. Therefore the dependency metrics and related analyses have beendeveloped and the major results are presented as the following.
Figure 1: Interactions of hierarchical networks in NAS.
1. Characterization of Metroplex Dependencies
Figure 2: The major airports in New York and New Jersey.
The premise for quantifying dependencies is to observe how dependencies vary from one metroplex toanother. Fig. 2 is a simplified view of NYNJ metroplex with its three major airports JFK, LGA and EWR.
3 of 14
American Institute of Aeronautics and Astronautics

The solid-black lines represent flights to and from NYNJ to the remaining parts of NAS. The arrows betweenthe three airports are the “internal” interactions within this metroplex which bring dependencies on multipledimensions (Table 1). For example, connecting passengers flying into LGA for their international flight fromJFK require ground transportation, which is an operational dependency. From the perspective of the PortAuthority of New York and New Jersey (PANYNJ), the ownership of all three NYNJ airports provides bettereconomic synergies than the single ownership. However, many other metroplexes have multiple owners e.g.,Northern California metroplex, which create different types of dependencies. Furthermore, policies andregulations at one airport will affect other airports in the same metroplex. For instance, all airports in ametroplex must agree to participate in the flexible arrivals policy and flexible flight operating. In summary,there are various interactions among many dimensions of dependencies as shown in Table 1.
Table 1: Dimensions of metroplex dependencies
Dimension Example Attributes
Physical Airport proximities, runway configurations, airspace geometry
Economic Ownership of airports, landing fees, lease of terminals
Operational Airport operations, airlines, capacities, passenger ground-link
Regulatory Slot-controls, congestion-pricing, noise regulations, carbon credits
2. Dependency Metrics
In [3] the authors introduced two types of dependency analysis: Constructive and Observational. Construc-tive analysis deals with the physical resources of a metroplex airport (e.g., runway configurations) and theirinfluence on operations at the metroplex. Observational analysis describes the study of metroplex opera-tional data by observing how dependencies influence the metroplex operations. In this paper we introducethe development of a constructive coarse grain metric and show how it can be used to implement the flexibleflight (flexible arrival) concept.
3. Constructive Coarse Grain Dependency Metrics
These metrics are based on simple coarse grain definitions developed to qualitatively analyse how runwaysinfluence traffic patterns and cause dependencies (Table 2). The analyse is done by quantifying the relativeimportance of each runway. The runway with the most traffic in a year is chosen as the reference runway(RR) and the metric is developed based on RR (shown in Table 2). The dependency metric of a runway is acomposite of several runway features (e.g., length, orientation and proximity) and the traffic on each runway;a high value of the metric indicates larger dependencies. The metric details are not repeated here but aredescribed explicitly in [3]. We extended these metrics to a metroplex by considering a metroplex as a “superairport” with its runways largely separated from the runways of other airports in the same metroplex. Thereference runway in this case is the runway with the most traffic in the metroplex. Data for runway trafficis obtained from Aviation System Performance Metrics (ASPM) database for each airport.
4. Results of Dependency Characterization Study
In addition to NYNJ, Northern California (NoCal) metroplex is analysed to understand how dependenciesdiffer from one metroplex to another. NoCal contains San Francisco International (SFO), Mineta San JosInternational (SJC) and Oakland International (OAK) airports.
Results from computing coarse grain dependency metrics (from 2002 to 2007) are shown in Table 2. Datain Table 2 indicate that there was no significant difference between NYNJ and NoCal. The minor differencescan be due to the difference in their total traffic or the definition of the metrics. This indicates that similarfactors cause dependencies at these two metroplexes. It is found that the metric values vary with the choice
4 of 14
American Institute of Aeronautics and Astronautics

Table 2: Runway dependency metrics for NYNJ and NoCal
YearMetroplex Traffic Reference Runway RDM-M (dl ∗ do ∗ dp) RDM-M (dl + do + dp)
NYNJ NoCal NYNJ NoCal NYNJ NoCal NYNJ NoCal
2007 1,233,473 697,489 JFK 31L SFO 28R 0.359 0.139 1.927 1.459
2006 1,184,445 678,501 EWR 22R SFO 28L 0.191 0.15 1.495 1.378
2005 1,141,250 666,660 EWR 22L SFO 28R 0.177 0.138 1.421 1.48
2004 1,113,671 673,929 EWR 22R SFO 28R 0.199 0.139 1.476 1.481
2003 1,016,652 619,400 EWR 22L SFO 28R 0.197 0.1 1.442 1.252
2002 913,420 620,531 EWR 22L SFO 28R 0.206 0.001 1.443 0.426
of reference runway (RR). For NYNJ, from 2002 to 2006, RR was located at EWR whereas it was at JFK in2007. This was because of a significant increase in JFK traffic in 2007. Due to the RR location shift, runwayproximity effect plays an critical role in causing a significant change in the dependency metric (Table 2).2002 data is not available to estimate the traffic per runway at OAK and SJC, causing NoCals dependencymetrics for this year to significantly differ from the other years.
Atlanta International (ATL) and Denver International (DEN) airports are analysed to understand howdependencies differ between metroplex and non-metroplex airports. In particular, ATL and DEN had opera-tions comparable in volume to JFK and SFO (NYNJ and NoCal respectively), many airlines operate at eachof them, and both have problems of delays and congestion. They are good candidates for this comparativestudy. In the case of non-metroplex airports, the dependency metrics changed considerably for ATL from2005 to 2006 (Table 3). This is due to operation of runways from 2006. Decrease in dependency metricsshows that physical dependencies are less in 2006 and 2007, causing “decoupling” of runway operations atATL. On the other hand, though a new runway was added to DEN in 2004, our metrics could not detectany significant change in DEN’s dependencies.
Table 3: Runway dependency metrics for ATL and DEN
YearAirport Traffic Reference Runway RDM-A (dl ∗ do ∗ dp) RDM-A (dl + do + dp)
ATL DEN ATL DEN ATL DEN ATL DEN
2007 962,390 594,001 ATL 27R DEN 17R 0.024 0.051 1.032 0.985
2006 945,018 570,757 ATL 27R DEN 8 0.024 0.057 1.034 1.023
2005 945,946 535,267 ATL 27R DEN 8 0.049 0.059 1.315 1.19
2004 936,677 534,661 ATL 27R DEN 17R 0.049 0.066 1.309 1.03
2003 874,647 474,688 ATL 27R DEN 17R 0.049 0.061 1.314 0.983
2002 836,262 397,938 ATL 27R DEN 17R 0.049 0.058 1.326 0.956
5. Summary
From the high dependency metric value in Table 2 and the low dependency metric value in Table 3. We cansee there are more dependencies among airports in a metroplex than non-metroplex airports. The sharedresources of the metroplex airports link them together as a system. Therefore the concept of the metroplexcan be considered as a super destination airport for flexible flights.
B. Flexible Flights
A flexible flight is initially routed towards a metroplex instead of a pre-determined destination airport.Unlike the regular flight having a fixed destination airport, when the flight arrives the decision boundaryof the destination metroplex, it will receive the information of which runway of which airport to land in.
5 of 14
American Institute of Aeronautics and Astronautics

The passengers taking a flexible flight accept arriving at one of several airports in a great metropolitan areawithout caring about the specific destination airport.
1. Benefits of the Flexible Flights
The metroplex and flexible flights concept can bring many benefits to both passengers and traffic controllerswith existed airports and ground traffic infrastructures. Developing and analysing the concept of flexibleoperations at a metroplex and determining whether the alternate, flexible flight plan have significant poten-tial operational and economic value. Some of the potential benefits are: a) Enhancing metroplex airportthroughput without extensive infrastructure investment; b) Increasing robustness to disruptions; c) Providingmaximal flexibility to passengers.
2. How to operate a flexible flight?
To operate a flexible fight from departure to landing includes two parts. The first part is to route the flexibleflight towards its destination metroplex similarly like to route a regular flight to its destination airport. Inthis part we just need to treat a metroplex as a super airport. The second part is when the flexible flightarrives the decision boundary of the metroplex, it will be scheduled to some certain runway at one of themetroplex airports. However, until the runway scheduling decision is made, neither the operator nor theATC system will know the exact destination airport. This paper mainly deals with the first part which isthe metroplex routing algorithm while the second part scheduling will be simply introduced.
In practice the “decision boundary” consists of a series of metering fix points [15] for the ease of operation.In our algorithm, the “decision boundary” is considered as a polygon around the metroplex as shown in Fig. 3,where the blue polygon is the decision boundary of NYNJ metroplex.
Figure 3: Decision boundary of NYNJ metroplex.
6 of 14
American Institute of Aeronautics and Astronautics

III. Jetway Network and Jetway Plus Network
The approach in this paper is based on a weighted shortest path search. A network model is requiredin order to design an efficient and effective metroplex routing algorithm. The waypoint-based network isexploited as the data structure to generate the optimal route for each flexible flight under sector congestionconstraint. The initial network built from waypoints provided by FACET is named as Jetway Network.Another model called Jetway Plus Network is formulated by inserting additional waypoints and all airportsinformation, which is used as the final data structure for running our algorithm.
A. Obtain the Waypoints and Jet Routes Information from FACET
To accurately capture the real flight paths that air traffic follow, a jet route-based waypoint network is built.Firstly, jet route and waypoint information are obtained from FACET. Using the NavigationInterface inFACET, the waypoint identifiers (index) and locations (longitude and latitude) are obtained for all waypoints.Also using the NavigationInterface, the sequence of waypoints that defines a jet route is obtained for alljet routes. To convert a jet route description in terms of waypoint locations to waypoint indices, thecorresponding index is identified for each waypoint on a jet route using the waypoint information fromFACET.
To form the network, we record the connection (edge) between two consecutive waypoints (vertices) foreach jet route. Intersection points on the jet route system are automatically considered as waypoints whenrecording the connection along a jet route because an intersection point will be part of the waypoint sequencefor every jet route sharing that intersection point. Figure 4 illustrates how edges are obtained from a jetroute, along with intersection points. Additional edges were created to connect airports to the jet routesystem. Collectively, the edges and vertices define the graph. The edges are not directed because a jet routecan support traffic in both directions (in different altitudes).
Figure 4: Obtaining graph edges from jet route, including intersection points.
B. Establish the Jetway Network
In order to take advantage of the Boost C++ Graph Library (BGL) [16], we transform the obtained waypointsand the jet routes data into the BGL format. The major contribution of the Boost Graph Library (BGL) is ageneric interface that allows access to a graph’s structure, but hides the details of the implementation. Thisis an “open” interface in the sense that any graph library that implements this interface will be interoperablewith the BGL generic algorithms and with other algorithms that also use this interface. The BGL providessome general purpose graph classes that conform to this interface.
According to the requirement of C++ BGL, we have each waypoint provided by FACET in a C++struct and put all these waypoint structs in an indexed C++ map. Each struct contains the name, latitude,longitude information of the waypoint. The waypoints serve as the nodes in a Jetway Network graph.
Each direct route between two nodes is considered as two directional edges in a Jetway Network graphand each of the two is recorded in a C++ struct which contains the starting point and the ending point. Allthe edges are also stored in an indexed C++ map. At the beginning of the network construction, the greatcircle distance of each edge is calculated and recorded as the non-negative weight in each edge struct.
7 of 14
American Institute of Aeronautics and Astronautics

By using boost::add vertex and boost::add edge functions from BGL, a Jetway Network graph is builtbased on the waypoints and direct routes as nodes and edges respectively. Additionally the weight of eachedge is set into boost::weight map(pmWeigth). Finally the Dijkstra Algorithm boost::dijkstra shortest pathswill take care of the optimizing job and output the distance and predecessor of each node after the input oforigin airport is set. In other words, the Dijkstra Algorithm from BGL provides the results of all the shortestpaths from the origin airport to every other airport except those are disconnected from the origin.
C. Hash Table
In order to insert new waypoints and dynamically maintain the network, the waypoints need to be indexedby a hash table. The similar hash table is built for direct route data. For simplicity, we only show howto build the hash table for waypoints in this section. The hash key in this paper is the rounded positivelatitude-longitude pair of each waypoints, in other words, each waypoint’s latitude and longitude are changedto their absolute values and then rounded into integers. Then the positive integers are stored in a hash keypair <lat, lon>. All of the existed waypoints in Jetway Network are processed to acquire their hash key pair.Initially the hash table H is set to be empty (∅). The hash key pair <lat, lon> is calculated according tothe latitude and longitude of a waypoint WPi and a search is started in the current hash table H based on<lat, lon>. If this hash key pair is not in H, a <lat, lon> is created in H and this waypoint WPi is insertedunder the newly created hash key pair; if it is already in the hash table, compare WPi to all the waypointsunder this existed hash key pair, insert WPi if no same waypoint is found. Repeatedly all the waypointsobtained from FACET have their hash indexes.
After we have all the waypoints in the hash table, it is very fast to insert new waypoints. In anotheraspect, building the hash pair index is in fact to divide the NAS into grids. Each grid is a square withfour corners whose latitude and longitude are integers as shown in Fig. 5, where i and j are integers. Whenwe have a new waypoint to be inserted, we first calculate its hash key pair and decide which grid it isin. As we use floor to obtain <lat, lon> from the absolute latitude and longitude, if the waypoint exists, itshould be in the grid with top-left corner coordinates (i, j)=<lat, lon>. Therefore only the existed waypointsWP1,WP2,WP3 in this grid need to be checked instead of checking all the waypoints existed in the entireJetway Network. This is the mechanism of the hash table and it substantially enhances the speed of insertingnew waypoints.
Figure 5: Hash table indexed grids enhance the search of waypoints.
The grids in hash table are stored with sorted hash key pair as shown in Fig. 6. The grids are saved inascending order of the first integer of the hash key pair, and with the same first integer, the grids are recordedin ascending order of the second integer of the hash key pair. The waypoints in each grid are recorded underthe hash key pair <lat, lon> which is also actually the top-left coordinates (i, j) of the corresponding grid.If there is no waypoint in a grid, that grid will not be stored in the hash table.
Figure 6: Hash table is stored with ordering.
8 of 14
American Institute of Aeronautics and Astronautics

D. Establish the Jetway Plus Network
After we have the Jetway Network, we can optimize the routes for input flight plans of flexible flights. Sincethe waypoints offered by FACET may not be complete, the new waypoints mentioned in the input flightplans need to be imported to the Jetway Network. At the same time, all the airports are imported by treatingthem as waypoints too. The additional edges are obtained from FACET by the historic flight track files.Together all the additional inserted elements with the Jetway Network formulate the Jetway Plus Network,which is the final data structure to apply our routing algorithm.
1. Input Flight Plans
Flight plans are documents filed by pilots or a Flight Dispatcher with the local Civil Aviation Authority(e.g. FAA in the USA) prior to departure. They generally include basic information such as departure andarrival points, the sequence of waypoints of the flight route, estimated time en route, alternate airports incase of bad weather, type of flight (whether instrument flight rules or visual flight rules), pilot’s name andnumber of people on board. The standard FAA flight plan form is shown in Fig. 7.
Figure 7: Standard FAA flight plan form.
2. Obtain and insert new waypoints from the input flight plans
From the input flight plans which need to be optimized, firstly we obtain the sequence of waypoints of theflight route and insert the waypoints into the hashed Jetway Network. The related edges are also added in.Secondly for each flight we obtain its origin-destination pair because our routing algorithm needs them togenerate the optimal reroute.
Note that the name of each waypoint FACET provides is a five-digit integer beginning with a 1 or 2while the standard flight plan contains a sequence of the waypoints which are described by a three-lettercombination. The FACET has a method called getWaypointName inside NavigationInterface to translateone expression to the other.
In detail, for each flight plan we first extract the sequence of the waypoints, then the FACET interface isused to translate these waypoints into five-digit integers. For each waypoint, we obtain its latitude-longitudepair and search it in the existed Jetway Network hash table. If this waypoint exists, continue to process thenext waypoint of the current flight plan; if this waypoint is new, insert it to the hash table and create a newhash key pair by rounding the absolute latitude-longitude pair of this waypoint. After all of the flight plansare processed and all the airports are inserted, the Jetway Plus Network is formulated.
9 of 14
American Institute of Aeronautics and Astronautics

IV. Flexible Flight Routing Algorithms
A. Shortest Path Algorithm without Sector Congestion Constraint
The waypoint-based Jetway Plus Network obtained above is the routing data structure for the entire NAS.When the routing algorithm does not take the sector congestion into account, the weight of each edge isthe great circle distance between two waypoints. The Dijkstra Algorithm [17] is used to find the shortestpath from origin to destination. Since the flexible flights are considered, the destination airport of eachflight is selected from the airports inside its destination metroplex. In this research, the central airport of ametroplex is chosen as the destination of a flexible flight.
1. Metroplex Central Airport
Since we treat the metroplex as a super airport, the geometric center of the metroplex should represent thewhole metroplex when the routing algorithm is operated. Therefore, we calculate the central point c of theairports in the metroplex and set the closest airport to c as the “central” airport of the whole metroplex. Thecentral airport will represent the destination metroplex when the flexible flights are routed to this metroplex.For example, the NYNJ metroplex has three airports, JFK, LGA, EWR. Firstly the geometric center is foundby c = (ap1 + ap2 + ap3)/3, where c and api are both latitude-longitude pair <lat, lon>. Then the closestairport to the central point c is selected as the “central” airport of NYNJ. In this case, LGA is chosen. Thethree NYNJ airports are shown in Fig. 8.
Figure 8: Three major airports in NYNJ metroplex.
2. McTMA Scheduler
In this research our algorithm generates the optimized route for a flexible flight while another team workson the runway scheduling based on McTMA. The airport/runway balancer is designed particularly for themetroplex destination to facilitate McTMA with flexible flights scheduling. The idea of their algorithm isto consider all the runways resource from all the airports in the same metroplex together. Since the regulardestination-fixed flights already take most of the runway time slots, the airport/runway balancer checks theavailable time slots (holes) of all the runways for flexible flights. Once there is a slot available in any one ormore runways of a metroplex airport, the approaching flexible flight will be scheduled to the closest runway.The airport/runway balancer can access McTMA through the interfaces shown in Fig. 9. Fig. 9 also showsthe six steps of a complete metroplex runway scheduling.
10 of 14
American Institute of Aeronautics and Astronautics
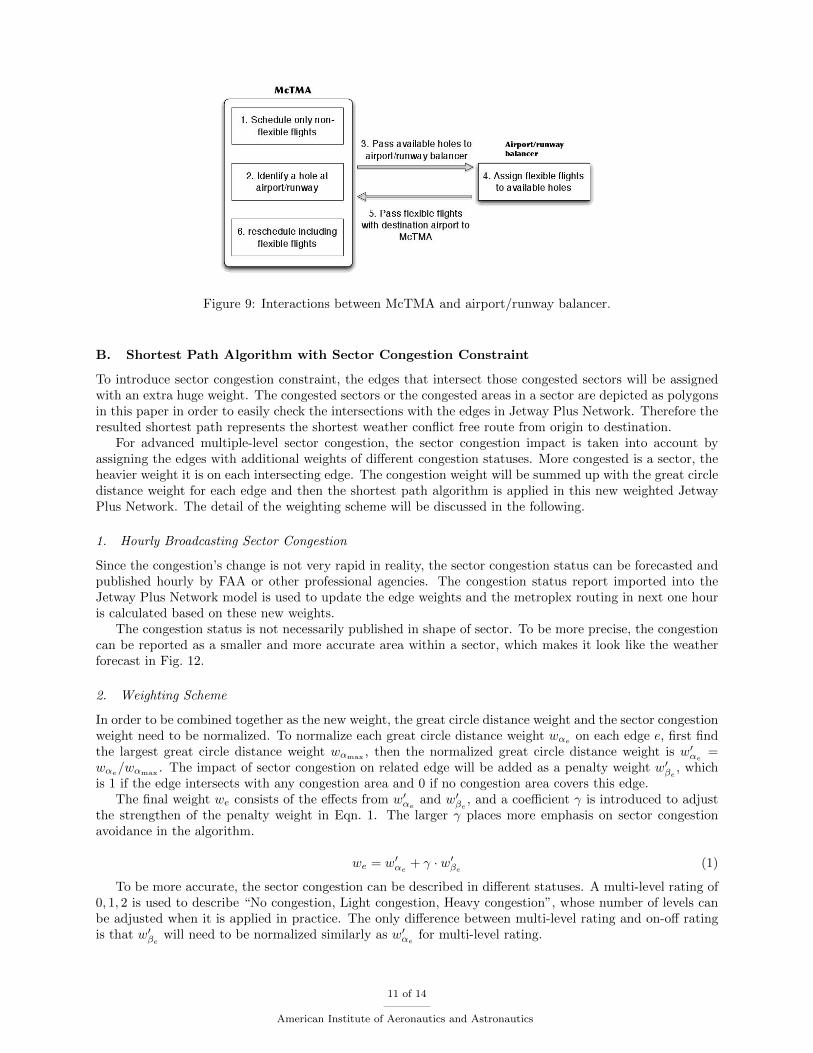
Figure 9: Interactions between McTMA and airport/runway balancer.
B. Shortest Path Algorithm with Sector Congestion Constraint
To introduce sector congestion constraint, the edges that intersect those congested sectors will be assignedwith an extra huge weight. The congested sectors or the congested areas in a sector are depicted as polygonsin this paper in order to easily check the intersections with the edges in Jetway Plus Network. Therefore theresulted shortest path represents the shortest weather conflict free route from origin to destination.
For advanced multiple-level sector congestion, the sector congestion impact is taken into account byassigning the edges with additional weights of different congestion statuses. More congested is a sector, theheavier weight it is on each intersecting edge. The congestion weight will be summed up with the great circledistance weight for each edge and then the shortest path algorithm is applied in this new weighted JetwayPlus Network. The detail of the weighting scheme will be discussed in the following.
1. Hourly Broadcasting Sector Congestion
Since the congestion’s change is not very rapid in reality, the sector congestion status can be forecasted andpublished hourly by FAA or other professional agencies. The congestion status report imported into theJetway Plus Network model is used to update the edge weights and the metroplex routing in next one houris calculated based on these new weights.
The congestion status is not necessarily published in shape of sector. To be more precise, the congestioncan be reported as a smaller and more accurate area within a sector, which makes it look like the weatherforecast in Fig. 12.
2. Weighting Scheme
In order to be combined together as the new weight, the great circle distance weight and the sector congestionweight need to be normalized. To normalize each great circle distance weight wαe on each edge e, first findthe largest great circle distance weight wαmax , then the normalized great circle distance weight is w′
αe=
wαe/wαmax
. The impact of sector congestion on related edge will be added as a penalty weight w′βe
, whichis 1 if the edge intersects with any congestion area and 0 if no congestion area covers this edge.
The final weight we consists of the effects from w′αe
and w′βe
, and a coefficient γ is introduced to adjustthe strengthen of the penalty weight in Eqn. 1. The larger γ places more emphasis on sector congestionavoidance in the algorithm.
we = w′αe
+ γ · w′βe
(1)
To be more accurate, the sector congestion can be described in different statuses. A multi-level rating of0, 1, 2 is used to describe “No congestion, Light congestion, Heavy congestion”, whose number of levels canbe adjusted when it is applied in practice. The only difference between multi-level rating and on-off ratingis that w′
βewill need to be normalized similarly as w′
αefor multi-level rating.
11 of 14
American Institute of Aeronautics and Astronautics

One problem for multi-level rating is that sometimes an edge may intersect several areas with differentcongestion ratings as Fig. 10. In that case, the largest congestion rating on this edge will be picked as wβe .In the case of Fig. 10, the direct route will be assigned 2 (Heavy Congestion) as its penalty weight.
Figure 10: An edge intersects with three different rated congestion areas.
V. Simulation
A. Platform
FACET is a simulation and analysis tool designed by NASA to evaluate future ATM concepts and methods.FACET can be used through a graphical user interface (GUI) or by using the application programminginterfaces (APIs) in the Java programming language. Some of FACET’s functionalities used in this researchinclude playing back recorded trajectories, simulation results and reading, writing and processing variousNAS datasets such as sector capacities, aircraft performance data, jet route information, etc. The FACETAPIs are also used extensively in this research because it allows for greater functionalities compared to theGUI.
The trajectory datasets provided by NASA contain trajectory information such as flight plan, longitude,latitude, altitude and speed, for every flight in the NAS. Using the FACET APIs, the flight plans areextracted from the dataset to be input to our program. In this research, FACET is used to compute theflight trajectories by given the optimized flight plans.
Figure 11: FACET simulated aircraft trajectories.
12 of 14
American Institute of Aeronautics and Astronautics

FACET contains an aircraft performance model database with 66 different aircraft types, along with anequivalent list that maps over 500 aircraft types to these 66 models. FACET also contains various datasetsused to model the NAS, such as center/sector boundaries, sector capacities and jet route system/waypointsinformation. FACET has two routing options [14], the Direct Routing (DR) option and the Flight PlanRouting (FPR) option. The DR option computes a great circle route directly from origin to destination.The FPR option computes a route that connects waypoint to waypoint, from origin to destination. Segmentsconnecting the waypoints are great circle routes. The default simulation time interval, which was used inthis research, is 1 minute.
The FPR option would be the more suitable option for modelling current air traffic patterns since mostof today’s flights do not fly a direct route from origin to destination. The DR option would be more suitablefor studying free flight operations. The FPR option is used in this research.
The FACET APIs along with other user written Java methods are used to simulate flight trajectories. Thisapproach runs faster because the GUI is not invoked to display the trajectories as they are computed. Also,this approach allows the user to compute only the desired parameters instead of computing all parameters(the default GUI option), thus further reducing computing time. Using this approach, the complete trajectory(from origin to destination) for all flights within a 2-hour period (planning time horizon) can be computedin a few minutes on a standard desktop computer. Figure 11 shows the simulated trajectories of all aircraft(n > 5000) above 18000ft, between 2200 and 2300 hours on June 14th, 2007.
B. Optimized Flight Plan
To simulate a flight in FACET, a flight plan has to have more than just the route information (waypointsequence). Other parameters such as commanded altitude, groundspeed and take-off time have to be specifiedas well. Therefore, to generate a flight plan for the optimized route, the original flight plan is modified bysubstituting in the optimized route information. All other parameters remain unchanged.
Figure 12: The original and optimized routes for a flexible flight.
For ease of observation, only one flexible flight is studied in Figure 12. The optimized flight plan isgenerated under the sector congestion constraints and is compared to its original flight plan . The congestedsector is set to be the dark area in Figure 12. The origin airport is LAX and the destination metroplex isNYNJ whose central airport is LGA. The weighting scheme is on-off weighting and gamma = 10. The resultshows that the optimized route successfully avoids the congested area in Figure 12.
VI. Conclusion
This paper first introduces the concept of metroplex and flexible flights and then the analysis shows thatthe airports within the same metroplex have dependency on each other, which makes the metroplex concepta potential solution for improving the throughput of the metroplex airports and increasing the flexibilityfor passengers. Moreover, the routing algorithm for flexible flights is developed under sector congestionconstraint based on weighted shortest path algorithm. The routing algorithm is applied on a data structurecalled Jetway Plus Network which is built from waypoints and jetways. During the implementation process,the FACET from NASA Ames and its interfaces facilitate the data acquisition for establishing the Jetway
13 of 14
American Institute of Aeronautics and Astronautics

Plus Network and the algorithm simulation. The algorithm performance turns out to be efficient and effectivefor the metroplex routing and after the flexible flight arrives the decision boundary of the metroplex, theMcTMA scheduler will assign a runway to it. The routing and scheduling together constitute a completeflexible flight operation.
Acknowledgements
The authors would like to thank NASA for funding under grant NRA NNL10AA15C. The valuablecontributions from Prof. Daniel DeLaurentis, Prof. Steven Landry and their research teams are appreciated.
References
1JPDO, “Concept of Operations for the Next Generation Air Transportation System,” June 13 2007, v2.0.2Atkins, S. and Engelland, S., “Observation and Measurement of Metroplex Phenomena,” Digital Avionics System Con-
ference, October 2008.3DeLaurentis, D. and Ayyalasomayajula, S., “Analysis of Dependencies and Impacts of Metroplex Operations,” October
2010, Purdue University.4McClain, E. and Clarke, J. P., “Traffic Volume Intersection Metric for Metroplex Clustering Analysis,” AIAA Guidance,
Navigation, and Control Conference, Aug 2009.5Wang, L., Donohue, G., Hoffman, K., Sherry, L., and Oseguera-Lohr, R., “Analysis of Air Transportation for the New
York Metroplex: Summer 2007,” Proceedings International Conference on Research in Air Transportation, Fairfax, VA, Febuary2008.
6Donohue, G., Hoffman, K., Wang, L., and DeLaurentis, D., “Metroplex Operations: Case Study of New York MetroplexAir Transportation System,” NASA Airspace Systems Program, Austin, TX, March 2008.
7Schaar, D., Sherry, L., and Donohue, G. L., “Rethinking Airport Improvement: Analysis of Domestic Airline Service toU.S. Metroplex Airports,” CASTR Internal Report CASTR-01-2010 , March 2010.
8Bokadia, S. and Valasek, J., “Sever Weather Avoidance Using Informed Heuristic Search,” AIAA Guidance Navigationand Control Conference and Exhibit , Montreal, CA, August 2001.
9Krozel, J., Penny, S., Prete, J., and Mitchell, J., “Automated Route Generation for Avoiding Deterministic Weather inTransition Airspace,” Journal of Guidance, Control, and Dynamics, Vol. 30, No. 1, January 2007, pp. 144–153.
10Krozel, J., Prete, J., Mitchell, J., Smith, P., and Andre, A., “Designing On-Demand Coded Departure Reroutes,” AIAAGuidance Navigation and Control Conference and Exhibit , Keystone, CO, August 2006.
11Weyns, D., Holvoet, T., and Helleboogh, A., “Anticipatory Vehicle Routing using Delegate Multi-Agent System,” Pro-ceedings of the 2007 IEEE Intelligent Transportation Systems Conference, Seattle, WA, October 2007.
12Taylor, C. and Wanke, C., “Dynamic Generation of Operationally Acceptable Reroutes,” 9th AIAA Aviation Technology,Integration, and Operations Conference (ATIO), Hilton Head, South Carolina, September 2009.
13Capozzi, B. and Atkins, S., “Dynamic Generation of Operationally Acceptable Reroutes,” 9th AIAA Aviation Technology,Integration, and Operations Conference (ATIO), Hilton Head, South Carolina, September 2009.
14Bilimoria, K. and Sridhar, B., “FACET: Future ATM Concepts Evaluation Tool,” 3rd USA/Europe Air Traffic Manage-ment R&D Seminar , Napoli, Italy, 2000.
15Idris, H., Evans, A., and Evans, S., “Single-Year NAS-Wide Benefits Assessment of Multi-Center TMA,” 2004, TitanCorporation Air Traffic Systems Division.
16Boost Graph Library, The User Guide and Reference Manual , Addison-Wesley Professional, 1st ed., Dec 20 2001.17E.W.Dijkstra, “A note on two problems in connexion with graphs,” Numerische Mathematik , Vol. 1, 1959, pp. 269–271.
14 of 14
American Institute of Aeronautics and Astronautics