Roots of Performance - California State University, Stanislaus · A Report Prepared for the Merced...
107
A Report Prepared for the Merced County Board of Supervisors by the Center for Public Policy Studies at California State University, Stanislaus Roots of Performance: An Examination of Merced County’s Economic Base
-
Upload
doannguyet -
Category
Documents
-
view
217 -
download
0
Transcript of Roots of Performance - California State University, Stanislaus · A Report Prepared for the Merced...

A Report Prepared for theMerced County Board
of Supervisors
by the
Center for Public Policy Studiesat
California State University, Stanislaus
Roots of Performance:
An Examinationof
Merced County’sEconomic Base

Contents
Preface .........................................................................................................................................................i
Summary .....................................................................................................................................................1
Introduction .................................................................................................................................................4
Input-Output Models ...................................................................................................................................4
Gross County or Region Product.................................................................................................................7
Industry Structure ........................................................................................................................................8
Employment Change ...................................................................................................................................18
Earnings.......................................................................................................................................................27
Exporting and Importing Sectors.................................................................................................................33
Employment Multipliers..............................................................................................................................39
Location Quotients ......................................................................................................................................46
Employment Concentration Ratio ...............................................................................................................57
Concluding Remarks ...................................................................................................................................60
Appendix A: Jobs Per One Million Dollars in Output, Employment Multipliers, and Net Exports by Sector for Merced County 1996 .............................................................62
Appendix B: 1997 Location Quotients and Employment Levels for Merced Co .......................................67
Appendix C: Employment Concentration Ratios........................................................................................86
Figures
Figure 1: Industry Output as a Percentage of Total Industry Output for Merced, 1996.............................................................................................................................10
Figure 2: Industry Output for Merced County, 1996 ...............................................................................10
Figure 3: Industry Output as a Percentage of Region’s Total Output in 1996.........................................12
Figure 4: Industry Output as a Percentage of Total County Output for Selected Industry Groups, 1996..............................................................................................................13
Figure 5: Industry Employment as a Percentage of Total County Employment In Merced, 1996........................................................................................................................15
Figure 6: Industry Employment for Merced County, 1996......................................................................15
Figure 7: Industry Employment as a Percentage of Total Region Employment for Selected Industry Groups, 1996 ................................................................................................16
Figure 8: Industry Employment as a Percentage of Total County Employment, 1996 ....................................................................................................................18
Figure 9: Employment Change by Industry Group, 1992-1996...............................................................21
Figure 10: Employment Change by Industry for Selected Industry Groups............................................22
Figure 11: Percent of Employment, Merced 1992-1996..........................................................................23
Figure 12: Percent of Employment, California 1992-1996......................................................................24
Figure 13: Percent of Employment, United States 1992-1996.................................................................24
Figure 14: Percent of Employment, Stanislaus 1992-1996......................................................................25
Figure 15: Percent of Employment, Fresno 1992-1996 ...........................................................................25
Figure 16: Percent of Employment, Madera 1992-1996..........................................................................26
Figure 17:Percent of Employment, San Joaquin 1992-1996....................................................................26
Figure 18: Percent of Employment, Santa Clara, 1992-1996...................................................................27
Figure 19: Total Industry Earnings as a Percentage of County Earnings, 1996.......................................29
Figure 20: Wages and Salary Per Worker, 1997 ......................................................................................30
Figure 21: Earnings per Employee, 1996.................................................................................................31
Figure 22: Compensation per Employee for Selected Industry Groups, 1996.........................................32
Figure 23: Net Exports for Merced, 1996 ................................................................................................34

Tables
Table 1: Gross County and Gross Region Product, 1996.........................................................................7
Table 2: GCP as a Percentage of San Joaquin Valley’s GRP, 1996 ........................................................7
Table 3: GCP and CRP per Capita and per Household, 1996..................................................................8
Table 4: Industries in Region, 1996 .........................................................................................................9
Table 5: Industry Output as a Percentage of Total County Output for All Industry Groups, 1996................................................................................................................13
Table 6: Industry Employment as a Percentage of Total Region Employment ....................................... For All Industry Groups, 1996 ...................................................................................................17
Table 7: Total Employment Change, 1992-1996 .....................................................................................19
Table 8: Total Non-government Employment Change, 1992-1996.........................................................19
Table 9: Total Non-government Employment Change, 1992-1997.........................................................20
Table 10: Employment Change by Industry for Industry Groups, 1992-1996.........................................22
Table 11: Overall Average Earning, 1996................................................................................................28
Table 12: Overall Average Earnings, 1996 ..............................................................................................28
Table 13: Earnings by Industry Group, Merced, 1996.............................................................................28
Table 14: Compensation per Employee for All Industry Groups, 1996...................................................32
Table 15: Net Exports for Selected Counties ...........................................................................................35
Table 16: Top 20 Net Exporting Sectors in Merced County, 1996..........................................................36
Table 17: Top Fifteen Exporting Sectors, 1996 .......................................................................................38
Table 18: Jobs per One Million Dollars of Output...................................................................................39
Table 19: Top 25 Jobs Per $1 Million in Output......................................................................................41
Table 20: Lowest Jobs per $1 Million in Output......................................................................................42
Table 21: Employment Multipliers, Merced 1996 ...................................................................................43
Table 22: Top 25 Employment Multipliers, Merced 1996.......................................................................44
Table 23: Lowest 25 Employment Multipliers, Merced 1996 .................................................................45
Table 24: Location Quotients greater than 1.25 for Merced, Employment Of 30+.......................................................................................................................................47
Table 25: High Location Quotient, Fast Growing, High Earnings Sectors, 1997....................................50

Table 26: 20 Highest Location Quotient Sectors in Merced and Fresno, 1997 .......................................54
Table 27: 20 Highest Location Quotient Sectors in Stanislaus and Madera, 1997 ..................................54
Table 28: 20 Highest Location Quotient Sectors San Joaquin and Santa Clara.......................................55
Table 29: Business Services Location Quotients for Merced, 1997 ........................................................56
Table 30: Health Services Location Quotients for Merced, 1997............................................................57
Table 31: Employment Concentration Ratios in Business Services for Merced, 1997............................................................................................................................59

5
Preface
In June 1999, the Merced County Board of Supervisors commissioned the Center for Public Policy Studies at
California State University, Stanislaus to prepare a comprehensive study of critical demographic, labor market,
economic base, and socioeconomic trends in the County. The purpose of the study was to analyze the trends that
would assist the Supervisors in appraising local conditions and crafting public policies to improve economic
conditions. The principal report containing the comprehensive data and analysis is entitled Strategic Choices:
Creating Opportunity in Merced County.
Roots of Performance: An Examination of Merced County’s Economic Base is a companion report that contains the
results of an analysis of a computer generated input-output model of Merced’s economy and of location quotients.
This is a technical report that provides a detailed description of the industrial structure of the county.
I wish to thank the many individuals in Merced County who took time to answer questions and provide information.
I would also like to thank the members of the Board of Supervisors, the County Administrator, and the members of
Worknet for facilitating this study. Finally, I would like to thank those at the Center for Public Policy Studies at
California State University, Stanislaus for their help: Ken Entin and Steve Hughes for their help editing and revising
the report and Julie Smulson for the many things she did to make this project easier.
This report is available at the Center’s website, www.csustan.edu/cpps
6
Summary
Roots of Performance: An Examination of Merced County’s Economic Base presents the results
of an analysis of Merced County’s economic base and is a companion report to Strategic
Choices: Creating Opportunity in Merced County.
The analysis is based on data from two sources: an input-output modeling program called
IMPLAN ProTM and ES202 Employment and Earnings reports from the U.S. Bureau of Labor
Statistics. Inconsistencies between the data sets are the result of different data definitions and
data collection techniques. The significant differences will be explained as the data are
presented.
The focus is on Merced County’s economic structure. To give contextual meaning to the
analysis, the County also is compared to the nation, state, San Joaquin Valley and Fresno,
Madera, Stanislaus, San Joaquin, and Santa Clara Counties.
The input-output model employed in this study traces the flow of goods through the economy.
By connecting industries in terms of supply and demand linkages, it is possible to assess key
features of the region’s economic structure. Among the indicators examined are gross region
product, industry output, employment levels, earnings and compensation levels, net exports, and
a variety of multipliers
The ES202 data are used to calculate location quotients for industries and industry groups in
Merced County. These quotients can be used to identify both employment concentrations and
base sectors. Like the data on employment growth and earnings, location quotients provide
policy-makers with an important information tool.
An important theme in Strategic Choices is divergence, and the economic data presented in this
report validate the theme. While the San Joaquin Valley, as a whole, differs from other parts of
the state and nation, counties within the San Joaquin Valley, while similar, are not identical.

7
The following are some of the key results of the analysis contained in the report.
• The gross county product of Merced County in 1996 was $3.176 billion and the gross countyproduct per capita was $16,515. The per capita figure was the lowest of all the areasexamined.
• Agriculture and manufacturing/food & kindred produced the largest share of total industryoutput in Merced and were the only industry groups with over $1 billion in total output.
• Agriculture (19.7%) and manufacturing/food & kindred (22.3%) accounted for larger sharesof total output in Merced than they did in the San Joaquin Valley (13.1% & 11%), California(2% & 2.8%), and the United States (2% & 3.4%).
• Services (10%) and finance, insurance, and real estate (F.I.R.E.) (9.7%) accounted for muchsmaller shares of industry output in Merced than they did in the San Joaquin Valley (15.3%& 12.7%), California (22.3% & 18.3%), and the United States (18.7% & 15.1%).
• Merced was similar to Madera in terms of the share of output from agriculture (19.7% to23%) and was similar to Stanislaus (22.3% to 21.8%) in terms of the share of output frommanufacturing/food & kindred.
• Services accounted for a smaller share of total industry output in Merced County than it didin any of the reference counties.
• Agriculture was the largest industry group in terms of employment in Merced County. It wasfollowed by services, retail trade, and government.
• The percentage of total employment in agriculture in Merced (20.4%) was similar to that forthe San Joaquin Valley (19.8%). The percentages were much larger than for either California(3.8%) or the United States (2.9%).
• Manufacturing/food & kindred accounted for a larger share of employment in Merced (8.5%)than it did in the San Joaquin Valley (3.4%), California (1%), and the United States (1.1%).
• Agriculture made up a larger share of employment in Madera County (29.1%) than in all ofthe other reference counties. Merced (20.2%) and Fresno (20.4%) were next in terms of theshare of employment in agriculture.
• Manufacturing/food & kindred accounted for a larger share of total employment in Merced(8.5%) and Stanislaus (7.8%) than in any of the other counties.
• Job growth did occur in Merced when government employment was not included in theanalysis. When government employment was included there was little or no job growth from1992 to 1996.

8
• Manufacturing/food & kindred and retail trade were strong growth industry groups forMerced.
• Government’s share of total employment dropped dramatically during the period from 1992to 1996. As a result employment shares in the other industry groups rose during this sameperiod.
• Shares of industry employment were much more stable in all of the reference areas from1992-1996.
• Only Madera ($19,466) had a lower average payroll level than Merced ($21,167).
• Transportation & public utilities had the highest payroll levels and was followed bygovernment, manufacturing/food & kindred, and manufacturing/other.
• Agriculture had the lowest payroll levels; this was followed by retail trade, services, andmining & construction.
• Agriculture and manufacturing/food & kindred combined for over $1 billion in net exports.
• In terms of detailed industry sectors, 14 of the top 20 net exporting sectors were part of theagriculture or manufacturing/food processing industry groups.
• The services group was a net importer as a whole and within the group health services wasnotable as a net importer.
• Retail trade, government, and services employed the largest number of people per level ofoutput. These sectors will add jobs as the population of the county increases.
• The manufacturing sectors and transportation & public utilities had the largest employmentmultipliers. Whenever new jobs are created in these industries in Merced, their impact will begreater than in any other industry sector.
• Industries within manufacturing/food & kindred and manufacturing/other had strong growthrelative to the county and the United States between 1992 and 1997 and paid above averagewages in the county.
• Industries within agriculture had strong growth relative to the county and the United Statesbetween 1992 and 1997 but paid below average wages in the county.

9
Introduction
Roots of Performance is a technical report on the economic structure of Merced County, and
serves as a companion document to Strategic Choices: Creating Opportunity in Merced
County. What distinguishes this report is that it provides more detailed and comprehensive
information on the County’s economic structure. It is intended for those who work most directly
on economic development matters.
This report relies on computer generated input-output models of the Merced County economy
and those of the nation, state, San Joaquin Valley and five reference counties: Fresno, Madera,
San Joaquin, Stanislaus, and Santa Clara. These models highlight important measures of
economic structure, including gross county product, total industry output, employment, earnings,
net exports, and multipliers.
Additionally, ES202 data from administrative surveys of business establishments are used to
calculate location quotients for Merced County. By comparing local and national employment
concentrations at a relatively fine level of industry detail, it is possible to identify both sources of
County strength and the character of the underlying economic structure.
The analysis of the economic base of the county using the computer model and the location
quotients complement each other quite well.
Input-Output Models
Input-output models trace the flow of goods, services, and resources within an economy1.
Businesses in any economy hire labor and combine it with other resources and raw materials to
create and sell goods and services. Other firms use some of the production of these firms in order
to produce other goods and services. Final users of the goods and services, such as households
and governments, may also purchase items directly from businesses within the local economy.
1 For the purposes of I-O modeling the term economy can refer to an area that includes a nation or group of nations.It can also refer to a city or county economy. For this study the term economy usually refers to a county economy.Anything done in the economy takes place in the county while anything outside the economy is outside the county.There is one model of a three county economy, which is referred to as 'Region'.

10
Some of the goods and services may also be sold to consumers outside of the region. These
exports are important because they provide an injection of income into the local economy.
Not all of the goods, services and raw materials used in a region come from that region. Both
business firms and final consumers will make purchases from local vendors, but they also
acquire goods, services, and raw materials outside the region. The latter may be the result of
inadequate local production of the products purchased locally. This importing behavior is
important because it serves as a leakage of income from the local economy.
The logic of an input-output model can be understood by describing the concept using the
manufacturing/food & kindred industry group. Firms within this industry group use labor from
households and buy raw materials and other resources from firms outside and inside the region.
In addition to buying from firms in other industry groups, firms within manufacturing/food &
kindred sell some of their output to firms in other industry groups that will be used to produce
some other good or service. A portion of the output of the manufacturing/food & kindred sector
will go to final consumers within the region. In addition, the manufacturing/food & kindred
sector sells and exports some of its output to producers and consumers in other regions.
In this example, firms that are part of manufacturing/food & kindred purchase raw materials such
as fruit and vegetables from farmers, transportation services from trucking companies, and
containers from can and jar makers. These are just three of the industries from which firms in the
manufacturing/food & kindred sector buy inputs. Firms in this industry group may also buy
supplies from firms outside the region, which are classified as imports.
Firms in manufacturing/food & kindred sell the goods they produce to other firms within the
region. Restaurants and hospitals are two sectors that use the products from firms within
manufacturing/food & kindred. In addition to selling to other firms in the region, this sector also
sells to other firms outside the region. This is represented as exports out of the region.
In addition to sales to other businesses there is a certain level of production for final
consumption. Final consumption is the purchase of goods and services by households,

11
businesses, and governments. These items are purchased and not used in the production of
anything else. Households buy goods and services from local firms, but will also buy goods and
services that were produced outside the region. Items purchased from outside the region by
households are also shown as imports.
The IMPLAN ProTM software
The I-O models used for this study were created by the IMPLAN ProTM input-output modeling
software. The IMPLAN software was originally created by the U.S. Forest Service. The version
used for this study is IMPLAN ProTM and is created and maintained by the Minnesota IMPLAN
Group, as is the data set used in this study.
The data used with the IMPLAN ProTM software divides the economy into 528 industry sectors.
These sectors can be aggregated in any number of ways and a variety of different aggregation
schemes were used for the purposes of this study.
The data set used for this study is created for the IMPLAN ProTM software and comes from a
number of different data sources. They include the ES202 report from the Bureau of Labor
Statistics, County Business Patterns from the Bureau of the Census, and the Regional Economic
Information System Data (REIS) from the Bureau of Economic Analysis in the Commerce
Department. The sectoring plan is an adaptation of a number of government methods including
the Standard Industrial Classification scheme (SIC), the REIS scheme, and the Bureau of Labor
Statistics sectoring system.
Input-output data can be used to create county and regional economic models. In this report,
models were created for Merced, Fresno, Madera, Stanislaus, San Joaquin, and Santa Clara
Counties, the San Joaquin Valley, the state of California, and the United States.
The data sets are available for any county in the United States. The Center for Public Policy
Studies at California State University, Stanislaus currently has 1992, 1994, and 1996 (the most
recent) data for all counties in California. Models of Merced and all of the reference areas were
created for each of these periods.

12
Gross County or Region Product
Gross county product (GCP) and gross region product (GRP) are similar to the idea of gross
domestic product in that they are estimates of the dollar value of goods and services produced for
final consumption. This means that the estimate does not include the dollar value of goods that
have been produced but will undergo further processing. The value of these intermediate goods
will be included in the value of the final product. One way to calculate GCP and GRP is to add
up all consumption, investment, government spending, and net exports while a second method is
to add up income from all sources generated in production.
Table 1 reports the dollar value estimates of GCP for Merced County and the reference counties
for the study. It also reports the estimated GRP for the entire San Joaquin Valley. Gross county
products as a percentage of the GRP of the San Joaquin Valley are presented in Table 2. Not all
of the counties that make up the San Joaquin Valley are listed so the percentages will not sum to
100%.
Table 1: Gross County and Gross Region Product, 1996*Region GCP or GRPMerced County $3,176,043,000Stanislaus County $8,474,153,000Fresno County $16,316,756,000San Joaquin County $10,967,271,000Madera County $1,888,361,000Santa Clara County $84,544,683,000San Joaquin Valley $64,813,178,000
*Source: MIG, IMPLAN ProTM
Table 2: GCP as a Percentage of San Joaquin Valley’s GRP, 1996
Region1996 Percent of TotalValley GRP
Merced County 4.9Stanislaus County 13.0Fresno County 25.1San Joaquin County 16.9Madera County 2.9*Source: MIG, IMPLAN ProTM

13
These tables show that Merced County, while not the smallest county in the group, does have
one of the smaller economies. This is something one should keep in mind when reading the
report. Because Merced County has a smaller economy, it will have a less diverse industry and
employment structure. One result of this will be lower multiplier levels. In effect, the County
will have fewer companies and industries that make up the supply and demand linkages that help
determine the size of the multipliers.
Merced has the lowest per capita and per household GCP of all the reference areas. These values
are calculated by dividing the gross county product by the total county population and total
number of households respectively. The low levels for Merced County are at least partially
explained by the age characteristics of the County relative to the other areas. As illustrated in
Strategic Choices, Merced County has a very young population. This means that GCP is spread
out over a large number of people who are not old enough to be engaged in the production of
goods and services.
Table 3: GCP and GRP per Capita and per Household, 1996*
RegionGCP or GRPper Capita
GCP or GRPper Household
Merced County $16,515 $47,428Stanislaus County $20,381 $58,530Fresno County $21,719 $62,372San Joaquin County $20,561 $59,048Madera County $17,092 $49,085Santa Clara County $52,853 $151,784San Joaquin Valley $20,980 $60,251
*Source: MIG, IMPLAN ProTM
Industry Structure
This section examines the industrial structure of the Merced County economy. The first set of
tables and figures present industry output of Merced County in both dollars and percentages of
total output. This is followed by a series of comparisons to a number of reference areas. Much of
the data presented in this section of the report come from a number of input-output models
developed using the IMPLAN ProTM software. This software uses a database that breaks
industries into 528 separate industry groups. Few, if any, counties have the full complement of

14
528 sectors. The table below lists the various reference areas along with the number of industry
sectors that exist in each county and for the San Joaquin Valley region.
Table 4: Industries in Region, 1996*Region Number of IndustriesMerced County 196Stanislaus County 285Fresno County 320San Joaquin County 291Madera County 171Santa Clara County 386San Joaquin Valley 422
*Source: MIG, IMPLAN ProTM
The starting point for describing the economic structure of Merced County is to look at the
output levels of each industry group. Figure 1 shows just how important agriculture and
manufacturing/food & kindred are to the Merced County economy, accounting for 42% of the
County’s total industry output in 1996. These estimates are based on information generated using
the IMPLAN ProTM input-output modeling program. Industry output includes all production by
an industry including goods and services produced for final and intermediate consumption.
These two sectors were followed by manufacturing/other and services in terms of total industry
output (TIO). Both agriculture and manufacturing/food & kindred each produced more than $1
billion of output (Figure 2). These are just the first of many tables and graphs that will show the
important contributions of these two sectors to the economy of Merced County.

15
Figure 1: Industry Output as a Percentage of Total Industry Output for Merced, 1996Source: MIG, IMPLAN ProTM
Figure 2: Industry Output for Merced County, 1996 Source: MIG, IMPLAN ProTM
Agriculture19.7%
Mining & Construction
3.8%
Mfg/Food & Kindred22.3%
Mfg/Other10.3%
Trans. & Public Utilities
7.9%
Wholesale Trade2.1%
Retail Trade6.9%
F.I.R.E.9.7%
Services10.0%
Government7.4%
$1,333,618,000
$256,153,000
$1,509,702,000
$696,728,000
$532,534,000
$145,024,000
$467,742,000
$654,513,000
$677,496,000
$503,427,000
Agriculture
Mining & Construction
Mfg/Food & Kindred
Mfg/Other
Trans. & Public Utilities
Wholesale Trade
Retail Trade
F.I.R.E.
Services
Government

16
It is apparent from Figure 3 that California and the nation are quite similar to one another and
both are quite different from the San Joaquin Valley. It also shows that Merced County is similar
to the rest of the San Joaquin Valley but not identical to it. In general, the San Joaquin Valley
produces much more agriculture and agriculturally related products. Services and F.I.R.E. are not
as significant in the Valley as they are in California and the nation.
While the San Joaquin Valley is different from the state and nation, there also are some striking
contrasts between Merced County and the San Joaquin Valley taken as a whole, California, and
the United States. Agriculture and manufacturing/food & kindred are much more important to
Merced than the other regions. Industry output in these two sectors accounted for over 40% of
TIO in Merced and about 25% for the San Joaquin Valley in 1996. These two sectors accounted
for less than 10% of TIO for California and the United States.
Other manufacturing comprised a smaller share of total industry output (TIO) in Merced and the
San Joaquin Valley than for California and for the United States. When manufacturing is taken
as a whole (food & kindred plus other) it amounted to almost 45% of TIO in Merced, a little over
20% in the San Joaquin Valley, 23% in California, and about 27% in the United States.
Wholesale trade, F.I.R.E., and services accounted for smaller shares of TIO in Merced County
than in any of the other regions.

17
Figure 3: Industry Output as a Percentage of Region’s Total Output in 1996 Source: MIG,IMPLAN ProTM
As was indicated by the information above, the counties within the San Joaquin Valley are
similar but not identical. In terms of the intra-valley comparisons agricultural production is more
important for Merced and Madera than for the other counties. In 1996, agriculture accounted for
close to 20% of total industry output (TIO) for Merced and about 23% for Madera. Fresno
County is the only other county where agriculture represented over 10% of TIO. Merced and
Stanislaus counties were similar in that manufacturing/food & kindred accounted for over 20%
of TIO. San Joaquin County is the only other county where this sector contributed over 10% of
TIO.
The combination of agriculture and manufacturing/food & kindred accounted for more than 40%
of TIO for Merced. None of the other Valley counties had this concentration of TIO in these two
industry groups. Services made up 10% of TIO in Merced County. This was the smallest share of
TIO of all comparison counties.
0%
5%
10%
15%
20%
25%
30%
Merced 20% 4% 22% 10% 8% 2% 7% 10% 10% 7%
San Joaquin Valley 13% 8% 11% 10% 8% 4% 8% 13% 15% 10%
California 2% 6% 3% 20% 7% 6% 7% 18% 22% 8%
United States 2% 7% 3% 24% 8% 6% 7% 15% 19% 8%
AgricultureMining &
ConstructionMfg/Food &
KindredMfg/Other
Transportation & Public
Utilities
Wholesale Trade
Retail Trade F.I.R.E. Services Government

18
It is also clear from the figure that the counties of the Valley are quite different from Santa Clara
County. Santa Clara relied very little on agriculture and manufacturing/food & kindred in 1996.
Other manufacturing and services accounted for larger shares of TIO in Santa Clara than in the
Valley counties.
Figure 4: Industry Output as a Percentage of Total County Output for Selected IndustryGroups, 1996 Source: MIG, IMPLAN ProTM
Table 5: Industry Output as a Percentage of Total County Output for All Industry Groups1996*
Industry Merced Stanislaus Fresno Madera San JoaquinSantaClara
Agriculture 19.7% 8.9% 13.6% 23% 7.5% 0.3%Mining & Construction 3.8% 6.3% 6.4% 7% 5.8% 3.8%Mfg./Food & Kindred 22.3% 21.8% 8.2% 9% 12.3% 0.6%Mfg./Other 10.3% 12.0% 8.1% 12% 13.2% 43.4%Trans. & Public Utilities 7.9% 5.0% 9.6% 7% 9.1% 3.3%Wholesale Trade 2.1% 3.5% 5.0% 4% 4.8% 6.6%Retail Trade 6.9% 8.0% 7.9% 7% 7.9% 4.8%F.I.R.E. 9.7% 11.7% 14.4% 10% 15.7% 13.5%Services 10.0% 15.2% 17.7% 15% 15.4% 20.0%Government 7.4% 7.6% 9.0% 8% 8.3% 3.5%*Source: MIG, IMPLAN ProTM
0.0%
5.0%
10.0%
15.0%
20.0%
25.0%
Merced 19.7% 22.3% 10.0% 7.4%
Stanislaus 8.9% 21.8% 15.2% 7.6%
Fresno 13.6% 8.2% 17.7% 9.0%
Madera 23% 9% 15% 8%
San Joaquin 7.5% 12.3% 15.4% 8.3%
Santa Clara 0.3% 0.6% 20.0% 3.5%
Agriculture Mfg/Food & Kindred Services Government

19
Since industry groups require labor and materials to meet the demand for their products, it is
useful to explore the impact of industry output on employment in Merced County and in
comparison areas. This discussion sets the stage for the examination of net exports, employment
multipliers, location quotients, and employment concentration ratios.
The data on employment, once again, show the significance of agriculture to Merced’s economy.
Agriculture, which contributes the largest share of the total industry output in the County, also
employs the largest share of people in the County. In terms of employment, services, retail trade,
and government follow agriculture. Services has the fourth highest level of industry output in
Merced. Retail trade and government are eighth and seventh in terms of total industry output.
Manufacturing/food & kindred produces the largest share of total industry output in the county,
but only accounts for 8.5% of total employment. The figures below give the shares and the actual
employment levels for each industry group. Figure 6 does show that the combined employment
of the two manufacturing sectors was close to 11,000 in 1996, which would bring that sector
closer to the level of the other large employment sectors.

20
Figure 5: Industry Employment as a Percentage of Total County Employment in Merced,1996 Source: MIG, IMPLAN ProTM
Figure 6: Industry Employment for Merced County, 1996 Source: MIG, IMPLAN ProTM
Agriculture20.4%
Mining & Construction
4.1%
Mfg/Food & Kindred8.5%
Mfg/Other5.4%
Trans. & Public Utilities
3.3%Retail Trade16.7%
F.I.R.E.5.0%
Services17.5%
Government16.6%
Wholesale Trade2.4%
15,899
3,205
6,642
4,190
2,550
1,886
13,013
3,879
13,643
12,906
Agriculture
Mining & Construction
Mfg/Food & Kindred
Mfg/Other
Trans. & Public Utilities
Wholesale Trade
Retail Trade
F.I.R.E.
Services
Government

21
Like industry output, California and the United States have similar employment structures. They
also are different from the San Joaquin Valley as a whole and Merced County. Agriculture and
manufacturing/food & kindred are more important to Merced than the other regions and
manufacturing/other, F.I.R.E., and services are less important.
It does appear that the differences in employment between Merced and the Valley were not as
pronounced as the differences in industry output in 1996. The percentage of employment in
agriculture was quite similar at about 20%. Merced County was slightly above the average and
the Valley was slightly below. Two sectors that were different were manufacturing/food &
kindred and services. The former was more important to Merced while the latter was less
important.
Figure 7: Industry Employment as a Percentage of Total Region Employment for Selected
Industry Groups, 1996 Source: MIG, IMPLAN ProTM
0.0%
5.0%
10.0%
15.0%
20.0%
25.0%
30.0%
35.0%
40.0%
Merced 20.2% 8.5% 17.4% 16.4%
Stanislaus 12.8% 7.8% 23.9% 12.6%
Fresno 20.4% 2.9% 23.4% 15.1%
Madera 29.1% 2.5% 20.0% 14.1%
San Joaquin 10.3% 3.5% 25.2% 15.0%
Santa Clara 1.1% 0.4% 35.5% 8.8%
Agriculture Mfg/Food & Kindred Services Government

22
Table 6: Industry Employment as a Percentage of Total Region Employment for All
Industry Groups, 1996*
Industry Merced Stanislaus Fresno MaderaSanJoaquin
SantaClara
Agriculture 20.2% 12.8% 20.4% 29.1% 10.3% 1.1%Mining & Construction 4.1% 6.1% 5.2% 5.8% 5.3% 4.8%Mfg./Food & Kindred 8.5% 7.8% 2.9% 2.5% 3.5% 0.4%Mfg./Other 5.3% 6.0% 4.1% 5.5% 7.2% 22.1%Trans. & Public Utilities 3.2% 3.6% 3.7% 3.1% 5.5% 2.6%Wholesale Trade 2.4% 3.3% 3.9% 2.6% 4.2% 5.4%Retail Trade 16.6% 18.2% 14.6% 13.5% 17.0% 13.8%F.I.R.E. 4.9% 4.8% 5.4% 3.8% 6.1% 5.1%Services 17.4% 23.9% 23.4% 20.0% 25.2% 35.5%Government 16.4% 12.6% 15.1% 14.1% 15.0% 8.8%Source: MIG, IMPLAN ProTM
When intra-valley comparisons are made, differences once again become apparent. Agriculture
accounted for the largest share of employment in Merced County. This was followed by services,
retail trade, and government. Madera was the only other county where agriculture represented
the largest share of employment. The service group had the largest share of employment in
Stanislaus, Fresno, San Joaquin, and Santa Clara. Manufacturing/food & kindred accounted for a
larger share of employment in Merced and Stanislaus County than in any of the other counties.
Government accounted for a larger share of employment in Merced than in any of the other
counties. It also was more important for the Valley counties than for Santa Clara.

23
Figure 8: Industry Employment as a Percentage of Total County Employment, 1996 Source:MIG, IMPLAN ProTM
Employment Change
This subsection covers employment change using two different data sets. Tables 7 and 8 were
created from data in the IMPLAN ProTM program. The advantage of this is that it covers the
government sector. The first table shows that when government is included Merced had no
employment growth from 1992-1996. This was due to the drop in government employment that
resulted from the closure of Castle Air Base. Table 8 shows that when government is excluded
from the analysis employment increased in Merced County. While the increase is not as
significant as the other regions, it is respectable. While the base closure is not directly included
in the figures for Table 8, the closure would affect non-government sectors via the multiplier
effects.
0%
5%
10%
15%
20%
25%
30%
35%
40%
Merced 20% 4% 8% 5% 3% 2% 17% 5% 17% 16%
Stanislaus 13% 6% 8% 6% 4% 3% 18% 5% 24% 13%
Fresno 20% 5% 3% 4% 4% 4% 15% 5% 23% 15%
Madera 29% 6% 2% 5% 3% 3% 14% 4% 20% 14%
San Joaquin 10% 5% 3% 7% 6% 4% 17% 6% 25% 15%
Santa Clara 1% 5% 0% 22% 3% 5% 14% 5% 35% 9%
AgricultureMining &
ConstructionMfg/Food &
KindredMfg/Other
Transportation & Public
Utilities
Wholesale Trade
Retail Trade F.I.R.E. Services Government

24
Table 7: Total Employment Change, 1992-1996*Region Percent ChangeMerced 0Fresno 13Madera 18San Joaquin 7Santa Clara 15Stanislaus 6San Joaquin Valley 10California 8United States 9
*Source: MIG, IMPLAN ProTM
Table 8: Total Non-government Employment Change, 1992-1996*Region Percent ChangeMerced 9Fresno 13Madera 18San Joaquin 8Santa Clara 18Stanislaus 6San Joaquin Valley 11California 10United States 11
*Source: MIG, IMPLAN ProTM
Table 9 presents information from the 1997 ES202 data sets, which do not contain government
employment statistics. Again, when government employment is excluded, employment growth
did occur in Merced County. These data suggest that the growth was reasonable when compared
to the reference areas. According to ES202 data, non-government job growth in Merced (12%)
outpaced Fresno, San Joaquin, Stanislaus, and California. Only Madera, Santa Clara, and the
United States had greater percentage job growth.

25
Table 9: Total non-government employment change, 1992-1997*Region Percent ChangeMerced 12Fresno 11Madera 28San Joaquin 11Santa Clara 19Stanislaus 9California 9United States 14
*Source: MIG, ES202
The previous tables show overall employment changes for Merced County and the reference
areas. The following figures show employment change by general industry group. Once again
these data are from the IMPLAN ProTM data set because it includes government employment.
The fastest growing industry group in California and the United States was services. In the
United States, this was followed by retail trade and mining & construction. In California, other
leading industry sectors were transportation & public utilities and retail trade. The fastest
growing industry group in Merced was manufacturing/food & kindred followed by retail trade,
services, and transportation & public utilities. The fastest growing industry groups in the San
Joaquin Valley were agriculture, transportation & public utilities, and services.
Declining industry groups in Merced were wholesale trade and government. Government
accounted for a much larger absolute decline than did wholesale trade. The San Joaquin Valley
also experienced a fall in employment in the wholesale trade industry group.

26
Figure 9: Employment Change by Industry Group, 1992-1996 Source: MIG, IMPLAN ProTM
A comparison to the reference counties reveals that Merced led employment growth in
manufacturing/food & kindred and was followed by Fresno and Stanislaus counties. The three
other counties had negative growth in this sector.
The reduction in government sector employment stands out for Merced County when compared
to the other counties. Santa Clara was the only other county to have lost employment in the
government industry group. This decline was significant for Merced, particularly when viewed in
light of government’s relatively high level of employee compensation.
Merced’s service industry group growth was lower than service industry group growth in any of
the other counties. As will be shown, the service group in Merced County does not appear to be
as well developed as it is in other counties. This is especially true of health and business services.
-40%
-30%
-20%
-10%
0%
10%
20%
30%
Merced 11% 1% 17% -2% 11% -30% 14% 3% 12% -30%
San Joaquin Valle y 18% -4% 2% 2% 17% -9% 12% 1% 17% 3%
California 7% 4% -2% -1% 12% 6% 11% -3% 18% -4%
United States 5% 11% 3% 2% 10% 6% 12% 7% 17% 1%
AgricultureMining &
ConstructionMfg/Food &
KindredMfg/Other
Transportation & Public Utilities
Wholesale Trade
Retail Trade F.I.R.E. Services Government

27
Figure 10: Employment Change by Industry for Selected Industry Groups, 1992-1996Source: MIG, IMPLAN ProTM
Table 10: Employment Change by Industry for Industry Groups, 1992-1996*
Industry Merced Fresno Stanislaus MaderaSanJoaquin
SantaClara
Agriculture 11% 16% 7% 21% 0% -5%Mining & Construction 1% -3% -5% 12% -2% 14%Mfg./Food & Kindred 17% 9% 5% -9% -10% -30%Mfg./Other -2% 4% 6% -5% 7% 3%Transportation & Public Utilities 11% 13% 3% 43% 26% 24%Wholesale Trade -30% -1% -15% 21% -15% 103%Retail Trade 14% 13% 12% 13% 10% 15%F.I.R.E. 3% 7% -10% 29% -5% 0%Services 12% 19% 14% 32% 19% 29%Government -30% 10% 5% 20% 1% -9%Total 0% 13% 6% 18% 7% 15%*Source: MIG, IMPLAN ProTM
-40%
-30%
-20%
-10%
0%
10%
20%
30%
40%
Merced 11% 17% 12% -30%
Fresno 16% 9% 19% 10%
Stanislaus 7% 5% 14% 5%
Madera 21% -9% 32% 20%
San Joaquin 0% -10% 19% 1%
Santa Clara -5% -30% 29% -9%
Agriculture Mfg/Food & Kindred Services Government

28
The following pages contain breakdowns of industry employment for three periods in Merced
and each of the reference regions and counties. This analysis is important because it indicates
that the structure of the economy does not change quickly. It would take a rather significant
event to cause drastic shifts.
With the closure of Castle Air Force Base, Merced County experienced the most dramatic
change of all of the regions during this period. As Figure 11 shows, government’s share of total
employment fell from around 24% to about 16% between 1992 and 1996.
Figure 11: Percent of Employment, Merced 92-96 Source: MIG, IMPLAN ProTM
The rest of California was also hit significantly by cutbacks in military spending at the federal
level. As Figure 12 shows, the government share of employment fell in California, but it was not
as dramatic as it was in Merced.
0%
5%
10%
15%
20%
25%
Agriculture Mining &Construction
Mfg/Food &Kindred
Mfg/Other Transportation& PublicUtilities
WholesaleTrade
Retail Trade F.I.R.E. Services Government
Merced 1992 Merced 1994 Merced 1996

29
Figure 12: Percent of employment, California 92-96 Source: MIG, IMPLAN ProTM
Figure 13: Percent of employment, United States 92-96 Source: MIG, IMPLAN ProTM
0%
5%
10%
15%
20%
25%
30%
35%
Agriculture Mining &Construction
Mfg/Food &Kindred
Mfg/Other Transportation& Public Utilities
WholesaleTrade
Retail Trade F.I.R.E. Services Government
California 1992 California 1994 California 1996
0%
5%
10%
15%
20%
25%
30%
35%
Agriculture Mining &
Construction
Mfg/Food &
Kindred
Mfg/Other Transportation
& Public Utilities
Wholesale
Trade
Retail Trade F.I.R.E. Services Government
United States 1992 United States 1994 United States 1996

30
Figure 14: Percent of employment, Stanislaus 92-96 Source: MIG, IMPLAN ProTM
Figure 15: Percent of employment, Fresno 92-96 Source: MIG, IMPLAN ProTM
0%
5%
10%
15%
20%
25%
30%
Agriculture Mining &Construction
Mfg/Food &Kindred
Mfg/Other Transportation& PublicUtilities
WholesaleTrade
Retail Trade F.I.R.E. Services Government
Stanislaus 1992 Stanislaus 1994 Stanislaus 1996
0%
5%
10%
15%
20%
25%
Agriculture Mining &Construction
Mfg/Food &Kindred
Mfg/Other Transportation& PublicUtilities
WholesaleTrade
Retail Trade F.I.R.E. Services Government
Fresno 1992 Fresno 1994 Fresno 1996

31
Figure 16: Percent of employment, Madera 92-96 Source: MIG, IMPLAN
Figure 17: Percent of employment, San Joaquin 92-96 Source: MIG, IMPLAN ProTM
0%
5%
10%
15%
20%
25%
30%
35%
Agriculture Mining &Construction
Mfg/Food &Kindred
Mfg/Other Transportation& PublicUtilities
WholesaleTrade
Retail Trade F.I.R.E. Services Government
Madera 1992 Madera 1994 Madera 1996
0%
5%
10%
15%
20%
25%
30%
Agriculture Mining &Construction
Mfg/Food &Kindred
Mfg/Other Transportation& Public Utilities
WholesaleTrade
Retail Trade F.I.R.E. Services Government
San Joaquin 1992 San Joaquin 1994 San Joaquin 1996

32
Figure 18: Percent of employment, Santa Clara 1992-96 Source: MIG, IMPLAN ProTM
EarningsThe previous section covered the basic structure of Merced County’s economy and recent
changes in the structure as measured by employment. This section will begin to present
information regarding the quality of jobs within the County. The first measure of quality is
compensation levels.
Tables 11 and 12 present average earnings, which include wages, salary, and benefits, for
workers in Merced County and the other reference areas. These data are from the IMPLAN ProTM
data set, which includes government employment. Only Madera County had an average level of
employee earnings lower than Merced County while Fresno County was only slightly higher.
0%
5%
10%
15%
20%
25%
30%
35%
40%
Agriculture Mining &Construction
Mfg/Food &Kindred
Mfg/Other Transportation &Public Utilities
WholesaleTrade
Retail Trade F.I.R.E. Services Government
Santa Clara 1992 Santa Clara 1994 Santa Clara 1996

33
Table 11: Overall Average Earning, 1996*
Region Average PayrollMerced 21,167Fresno 21,495Madera 19,466San Joaquin 24,361Santa Clara 43,915Stanislaus 23,390
* Source: MIG, IMPLAN ProTM
Table 12: Overall Average Earnings, 1996*Region Average PayrollMerced 21,167San Joaquin Valley 22,337California 30,398United States 28,929
* Source: MIG, IMPLAN ProTM
The data in Table 13 show that six sectors in Merced County had higher earnings per employee
than the overall average employee earnings for the County. Those sectors were transportation &
public utilities, government, manufacturing/food & kindred, manufacturing/other, wholesale
trade, and F.I.R.E.
Table 13: Earnings by Industry Group, Merced 1996*
Industry DescriptionPayroll perEmployee Rank
Agriculture 12,361 10Mining & Construction 17,760 7Mfg./Food & Kindred 31,478 3Mfg./Other 30,786 4Transportation & Public Utilities 33,734 1Wholesale Trade 28,448 5Retail Trade 14,327 9F.I.R.E. 22,731 6Services 17,694 8Government 31,896 2
* Source: MIG, IMPLAN ProTM
The lowest paying sectors in the County were among the top employers. Four sectors had payroll
levels that are below the average for the County. Those sectors were mining & construction,
services, retail trade, and agriculture. Agriculture was the top employer in the County, services
was second, and retail trade was third in terms of total employment.

34
The chart below illustrates the share of total County payroll by industry group. It in part shows
the impact of individual payroll levels together with the number of employees in each sector.
Although agriculture was the top employer (20.4% of total employment) in the County, it ranked
fourth in terms of the contribution to total compensation (11.8%) in 1996. This was the result of
low levels of compensation per employee. Services accounted for 17.5% of County employment
and 14.6% of total County compensation. Retail trade represented 16.7% of the County’s
employment and 11.2% of its total compensation.
Government comprised 16.8% of County employment and 24.8% of total compensation.
Manufacturing/food & kindred accounted for 8.5% of county employment and 12.6% of total
compensation.
Figure 19: Total Industry Earnings as a Percentage of County Earnings, 1996 Source: MIG,IMPLAN ProTM
Agriculture11.8%
Mfg/Other7.8%
Wholesale Trade3.2%
Retail Trade11.2%
F.I.R.E.5.3%
Services14.6%
Government24.8%
Trans. & Pub. Utilities5.2%
Mining & Construction
3.4%
Mfg/Food & Kindred12.6%

35
The following figure presents data on wages and salaries in 1997. Since it is based on ES202
data, it does not cover either benefits or government. The graph below compares Merced County
to California and the United States.
Wages and salaries per worker in every sector was lower in Merced County than California and
the United States. Retail trade and agriculture had the lowest wages and salaries per worker in all
counties and regions. Since Merced County had a large share of its employment in agriculture, it
is not surprising that income levels in Merced County lagged other regions.
Figure 20: Wages and Salary Per Worker, 1997 Source: MIG, ES202
Figure 21 continues to report the earnings levels and compares Merced County to the San
Joaquin Valley, California, and the United States for each sector in 1996. Earnings levels for
California and the nation were quite similar. Wage and salary levels for Merced County and the
Valley were below those of California and the United States in every sector. Furthermore,
earnings levels in Merced were generally lower than that for the Valley as a whole. While
agricultural earnings were higher than the three other regions, they still trailed earnings in other
industry groups.
-
5,000
10,000
15,000
20,000
25,000
30,000
35,000
40,000
45,000
50,000
Merced 15,842 22,128 24,913 26,526 29,775 27,307 14,731 28,105 20,676
United States 17,484 33,489 31,136 39,019 37,658 39,449 15,878 44,884 28,466
California 16,023 35,705 32,695 43,532 40,227 40,886 18,073 47,028 33,384
AgricultureConstruction
& MiningMfg/Food&K
indredMfg/Other
Transportation & Public
Utilities
Wholsale Trade
Retail Trade F.I.R.E. Services

36
Figure 21: Earnings per Employee, 1996 Source: IMPLAN ProTM
As previous figures indicate, there were some differences among the counties within the San
Joaquin Valley. These differences are explored in Figure 22. Overall, Merced, Madera, and
Fresno had the lowest earnings of the five comparison counties. However, earnings in Merced
were not the lowest in all sectors when compared to other counties. The levels in
manufacturing/food & kindred were lower in Merced and Fresno than in other counties.
-
10,000
20,000
30,000
40,000
50,000
60,000
Merced 12,361 17,760 31,478 30,786 33,734 28,448 14,327 22,731 17,694 31,896
San Joaquin Valley 10,238.31 24,445.68 35,568.51 35,550.78 34,140.36 33,930.79 14,911.95 22,295.79 19,274.52 36,405.75
California 12,073.32 28,139.53 38,889.62 47,988.78 41,216.68 43,055.04 17,115.66 29,918.94 26,481.16 41,938.84
United States 7,440.00 27,970.52 36,817.40 44,729.64 39,940.18 42,133.96 15,866.69 31,548.60 24,241.09 37,749.73
AgricultureMining &
ConstructionMfg/Food &
KindredMfg/Other
Transportation & Public
Utilities
Wholesale Trade
Retail Trade F.I.R.E. Services Government

37
Figure 22: Compensation per Employee for Selected Industry groups, 1996 Source: IMPLANProTM
Table 14: Compensation per Employee for All Industry Groups, 1996*
Industry Merced Stanislaus Fresno MaderaSanJoaquin Santa Clara
Agriculture 12,361 10,579.56 9,505.32 10,470.92 12,401.88 14,913.93Mining & Construction 17,760 21,852.20 21,975.88 18,461.43 26,236.68 34,293.88Mfg./Food & Kindred 31,478 39,202.34 29,647.61 33,976.61 39,786.60 38,893.51Mfg./Other 30,786 37,007.72 33,553.61 36,876.47 35,916.33 77,260.00Trans. & Public Utilities 33,734 27,907.26 37,493.73 27,644.31 34,067.56 40,249.20Wholesale Trade 28,448 33,527.79 33,357.18 35,715.52 35,337.86 61,822.86Retail Trade 14,327 15,089.73 15,083.18 13,739.95 15,526.13 18,988.29F.I.R.E. 22,731 21,474.62 23,336.17 15,152.76 21,874.75 23,846.81Services 17,694 19,921.93 19,745.29 18,185.65 19,110.08 36,186.55Government 31,896 37,379.11 35,013.41 32,987.59 37,071.65 43,083.73
*Source: IMPLAN ProTM
-
5,000
10,000
15,000
20,000
25,000
30,000
35,000
40,000
45,000
50,000
Merced 12,361 31,478 17,694 31,896
Stanislaus 10,579.56 39,202.34 19,921.93 37,379.11
Fresno 9,505.32 29,647.61 19,745.29 35,013.41
Madera 10,470.92 33,976.61 18,185.65 32,987.59
San Joaquin 12,401.88 39,786.60 19,110.08 37,071.65
Santa Clara 14,913.93 38,893.51 36,186.55 43,083.73
Agriculture Mfg/Food & Kindred Services Government

38
Exporting and Importing Sectors
Payroll and wages and salary can be thought of as indicators of the quality of jobs to individuals.
Net exports are one dimension of the value of particular industries to a county or region, and
further describe the economic structure of the area being examined. This section reports data
regarding the exporting and importing industry groups of Merced County and compares them to
the reference areas.
Net exports are equal to the dollar value of what an industry exports minus the dollar value of
what that industry imports. With this model, exports are goods or services that are sent from a
county or region to both domestic and foreign destinations. Imports are goods or services that
originate either in the United States or from abroad.
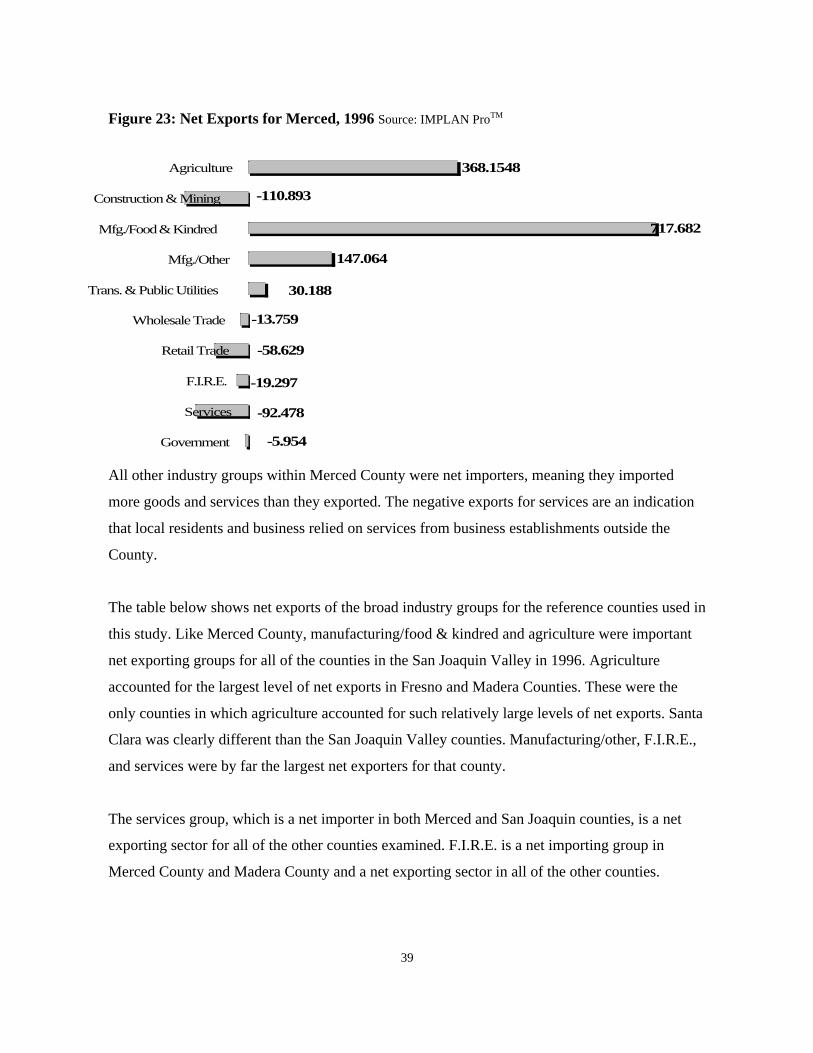
As Figure 23 shows, the net exporting groups within Merced County in 1996 were
manufacturing/food & kindred, agriculture, manufacturing/other, and transportation & public
utilities. The latter two combined for over $1 billion in net exports. This means that these two
sectors brought over $1 billion more into the local economy than they sent out. Exporting
industries are important because they bring dollars into the local economy that can circulate
throughout the economy. Many of these dollars will be spent locally by employees and owners of
firms.
39
Figure 23: Net Exports for Merced, 1996 Source: IMPLAN ProTM
All other industry groups within Merced County were net importers, meaning they imported
more goods and services than they exported. The negative exports for services are an indication
that local residents and business relied on services from business establishments outside the
County.
The table below shows net exports of the broad industry groups for the reference counties used in
this study. Like Merced County, manufacturing/food & kindred and agriculture were important
net exporting groups for all of the counties in the San Joaquin Valley in 1996. Agriculture
accounted for the largest level of net exports in Fresno and Madera Counties. These were the
only counties in which agriculture accounted for such relatively large levels of net exports. Santa
Clara was clearly different than the San Joaquin Valley counties. Manufacturing/other, F.I.R.E.,
and services were by far the largest net exporters for that county.
The services group, which is a net importer in both Merced and San Joaquin counties, is a net
exporting sector for all of the other counties examined. F.I.R.E. is a net importing group in
Merced County and Madera County and a net exporting sector in all of the other counties.
368.1548
717.682
147.064
30.188
-110.893
-5.954
-92.478
-19.297
-58.629
-13.759
Agriculture
Construction & Mining
Mfg./Food & Kindred
Mfg./Other
Trans. & Public Utilities
Wholesale Trade
Retail Trade
F.I.R.E.
Services
Government

40
Table 15: Net Exports for Selected Counties*Industry Merced Stanislaus Fresno Madera San Joaquin Santa ClaraAgriculture 368.154 450.226 2121.989 454.664 782.578 222.172Construction & Mining -110.893 -349.069 -577.19 -77.012 -369.816 -1603.352Mfg./Food & Kindred 717.682 2001.885 1024.255 179.599 1229.431 272.155Mfg./Other 147.064 421.032 541.825 106.364 750.726 21604.546Trans. & Public Utilities 30.188 -27.55 454.518 -0.819 299.984 -201.224Wholesale Trade -13.759 -41.2 -63.293 -7.825 -50.514 357.758Retail Trade -58.629 0.153 -41.684 -34.297 -58.629 -626.747F.I.R.E. -19.297 177.317 639.124 -1.637 616.373 7793.39Services -92.478 81.807 240.262 31.359 -26.638 8980.265Government -5.954 -54.739 -8.871 -1.696 -6.253 -162.729* Source: MIG, IMPLAN ProTM
Data at the more detailed industry level also shows the importance of agriculture and
manufacturing/food & kindred. Of the 196 sectors in Merced County, 82 of them were net
exporters in 1996. Of these, 33 were either in the agriculture or manufacturing/food & kindred
sectors. In fact, the top seven net exporting sectors were in the agriculture or manufacturing/food
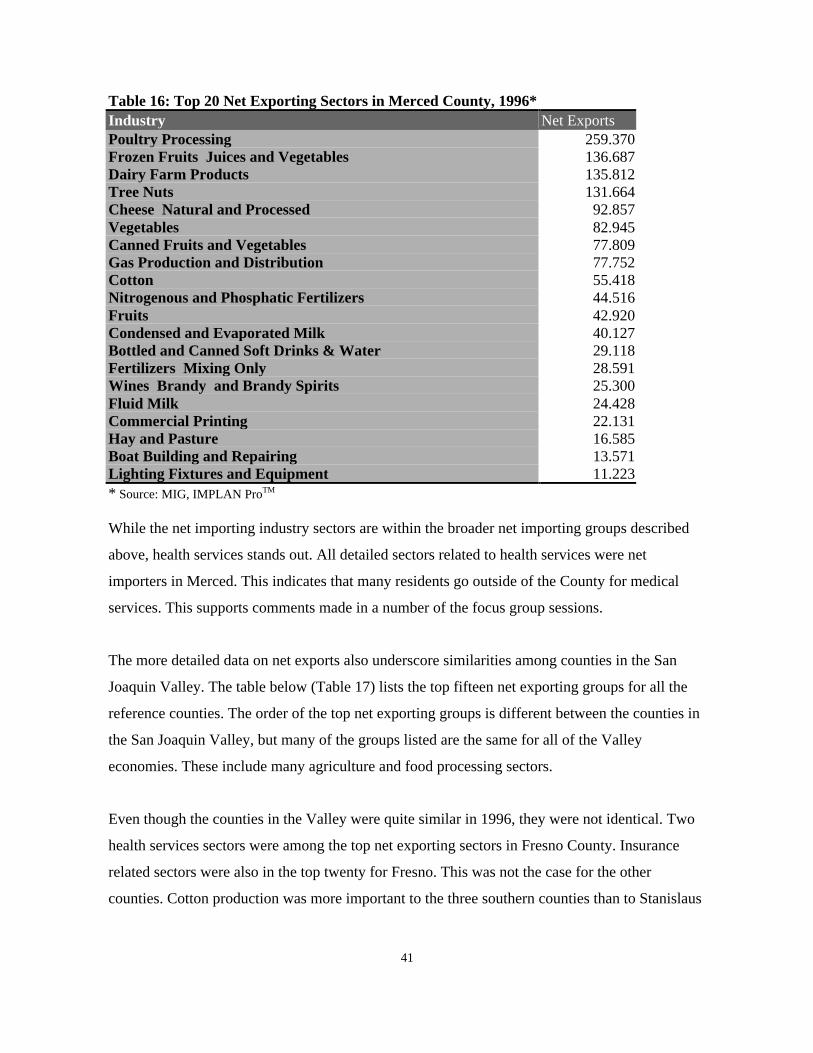
& kindred sectors. Table 16 lists the top 20 net exporting sectors in Merced County along with
the dollar value of exports minus imports measured in millions of dollars. Fertilizer and
commercial printing were other sectors included in this list. Net export levels of all 196 industry
sectors in Merced County are listed in Appendix A.
41
Table 16: Top 20 Net Exporting Sectors in Merced County, 1996*Industry Net ExportsPoultry Processing 259.370Frozen Fruits Juices and Vegetables 136.687Dairy Farm Products 135.812Tree Nuts 131.664Cheese Natural and Processed 92.857Vegetables 82.945Canned Fruits and Vegetables 77.809Gas Production and Distribution 77.752Cotton 55.418Nitrogenous and Phosphatic Fertilizers 44.516Fruits 42.920Condensed and Evaporated Milk 40.127Bottled and Canned Soft Drinks & Water 29.118Fertilizers Mixing Only 28.591Wines Brandy and Brandy Spirits 25.300Fluid Milk 24.428Commercial Printing 22.131Hay and Pasture 16.585Boat Building and Repairing 13.571Lighting Fixtures and Equipment 11.223* Source: MIG, IMPLAN ProTM
While the net importing industry sectors are within the broader net importing groups described
above, health services stands out. All detailed sectors related to health services were net
importers in Merced. This indicates that many residents go outside of the County for medical
services. This supports comments made in a number of the focus group sessions.
The more detailed data on net exports also underscore similarities among counties in the San
Joaquin Valley. The table below (Table 17) lists the top fifteen net exporting groups for all the
reference counties. The order of the top net exporting groups is different between the counties in
the San Joaquin Valley, but many of the groups listed are the same for all of the Valley
economies. These include many agriculture and food processing sectors.
Even though the counties in the Valley were quite similar in 1996, they were not identical. Two
health services sectors were among the top net exporting sectors in Fresno County. Insurance
related sectors were also in the top twenty for Fresno. This was not the case for the other
counties. Cotton production was more important to the three southern counties than to Stanislaus

42
and San Joaquin counties. As was apparent from other data already presented, agricultural
production was more important in the counties of Merced, Fresno, and Madera than in Stanislaus
and San Joaquin.
There were a number of other items that deserve mention that do not show up in the various lists
of net exports. The broad sector of transportation & public utilities was a net exporter but within
that sector motor freight transport and warehousing was a net importer. This same sector was a
net exporter for the other Valley counties examined.
There were substantial differences between Merced County and the other Valley counties in the
services group. Merced had no significant net exporters (net exports over $10 million) in this
broad industry group. The four other Valley counties had at least 2 sectors that had over $10
million in net exports. As mentioned above, Merced was a net importer of health services as
were Madera and San Joaquin. Fresno and Stanislaus were net exporters in the area of health
services.
As one looks at Santa Clara County it becomes quite clear that it has a very different economic
structure than the counties of the San Joaquin Valley. Interestingly, it once had an economy that
was similar.

43
Table 17: Top Fifteen Exporting Sectors, 1996Merced Fresno Madera Stanislaus San Joaquin
Poultry Processing Fruits Fruits Wines Brandy & BrandySpirits
Real Estate
Frozen Fruits Juices& Vegetables
Vegetables Wines Brandy & BrandySpirits
Canned Fruits &Vegetables
Canned Fruits &Vegetables
Dairy Farm Products Agricultural, Forestry,Fishery Services
Tree Nuts Dehydrated FoodProducts
Motor Freight Transport& Warehousing
Tree Nuts Real Estate Cotton Tree Nuts Vegetables
Cheese Natural &Processed
Gas Production &Distribution
Computer & DataProcessing Services
Poultry Processing Wines Brandy & BrandySpirits
Vegetables Cotton Dairy Farm Products Dairy Farm Products Cereal Preparations
Canned Fruits &Vegetables
Poultry Processing Mineral Wool Real Estate Fruits
Gas Production &Distribution
Owner-occupiedDwellings
Agricultural ForestryFishery Services
Sanitary Paper Products Salted & Roasted Nuts& Seeds
Cotton Dehydrated FoodProducts
Canned Fruits &Vegetables
Vegetables Owner-occupiedDwellings
Nitrogenous &Phosphatic Fertilizers
Motor Freight Transport& Warehousing
Glass Containers Potato Chips & SimilarSnacks
Dairy Farm Products
Fruits Canned Fruits &Vegetables
Vegetables Chocolate & CocoaProducts
Miscellaneous PlasticsProducts
Condensed &Evaporated Milk
Frozen Fruits Juices &Vegetables
Refrigeration & HeatingEquipment
Metal Cans Frozen Fruits Juices &Vegetables
Bottled & Canned SoftDrinks & Water
Doctors & Dentists Automobile Repair &Services
Frozen Specialties Religious Organizations
Fertilizers MixingOnly
Dairy Farm Products Poultry & Eggs Frozen Fruits Juices &Vegetables
Wet Corn Milling
Wines Brandy &Brandy Spirits
Hospitals Real Estate Prepared Feeds N.E.C Commercial Fishing
* Source: MIG, IMPLAN ProTM

44
Employment Multipliers
This section reports employment multipliers. In fact, it covers two types of multipliers, both of
which offer insights into the County's economy. One type relates the number of jobs per one
million dollars in output for an industry. This information is interesting because it sheds light on
some of the trends in industry employment growth that are and will be taking place in the
County. The second type of multiplier reports the number of jobs that are associated with each
job created in a particular industry. This is important because it highlights linkages within the
economy.
The table below reports the number of jobs per one million dollars in output in 1996 for each of
the broad industry sectors in Merced County. Multipliers for all 196 sectors in Merced are listed
in Appendix A.
Table 18: Jobs per One Million Dollars of Output*Industry Description JobsAgriculture 16.9Mining & Construction 11.1Mfg./Food & Kindred 3.4Mfg./Other 6.6Trans. & Public Utilities 7.4Wholesale Trade 10.7Retail Trade 26.3F.I.R.E. 4.7Services 20Government 22.2
* Source: MIG, IMPLAN ProTM
The highest values are in retail trade, government, and services. This reflects the fact that these
industries are labor intensive and population-driven – i.e., as demand for their products and
services increase, their employment grows substantially as well. Moreover, these sectors tend to
serve local consumers. The upside to this is that as these sectors expand in response to
population growth residents in Merced can expect to see more choices in retail trade and
services. The downside is that services and retail trade are not high paying sectors.
Agriculture, mining & construction, wholesale trade, and transportation & public utilities fell in
the middle. With all of the major construction that will be occurring in the County in the next 10

45
years, it is likely that there will be growth in this sector. The agriculture sector is an exporting
sector and any increases in demand for that sector will be determined by forces outside the local
economy.
The remaining sectors with lower levels of jobs per one million dollars in output in 1996 were
manufacturing/other, F.I.R.E., and manufacturing/food processing. These numbers reflect the
fact that these sectors rely more on machinery and technology than the others so they require
fewer workers per one million dollars in output. It should be noted that the manufacturing sector
brings billions of dollars into the local economy through exports. It will also become apparent
that the businesses in these sectors are dependent on local firms for supplies, raw materials, and
services. As a result, the impact of these firms multiplies through the economy to a greater
degree than any of the other industry groups.
The next table reports the employment levels and the 25 highest jobs per one million dollars in
output for sectors with at least 80 employees. As expected, this list has many service, retail, and
government related sectors including domestic services, beauty and barber shops, apparel stores,
eating & drinking establishments, and education. It also includes agricultural services and a
couple of other agricultural businesses.

46
Table 19: Top 25 Jobs per $1 Million in Output*
Description EmploymentJobs Per$1 million
Domestic Services 752 124.0Labor and Civic Organizations 655 97.6Detective and Protective Services 176 82.1Residential Care 363 61.2Sheep, Lambs and Goats 132 60.2Agricultural, Forestry, Fishery Services 5,166 50.7Landscape and Horticultural Services 107 48.4Amusement and Recreation Services, N.E.C. 137 45.0Beauty and Barber Shops 630 44.2Personnel Supply Services 408 43.9Federal Government - Military 416 42.3Portrait and Photographic Studios 102 39.3Hay and Pasture 1,650 38.5Automobile Parking and Car Wash 219 38.1Apparel & Accessory Stores 259 37.4Bowling Alleys and Pool Halls 80 37.3State & Local Government - Education 6,514 36.6Miscellaneous Retail 2,008 35.3Services To Buildings 464 34.9General Merchandise Stores 1,781 34.2Child Day Care Services 113 32.0Eating & Drinking 4,480 31.7Laundry, Cleaning and Shoe Repair 374 31.6Social Services, N.E.C. 515 30.9Nursing and Protective Care 1,017 29.9
* Source: MIG, IMPLAN ProTM

47
The next table reports the sectors with the lowest levels of jobs per one million dollars in output.
Not surprisingly, it is made up primarily of manufacturing sectors.
Table 20: Lowest Jobs per $1 Million in Output*
Description EmploymentJobs per $1million
Banking 1,066 6.7Dehydrated Food Products 119 6.6Automobile Rental and Leasing 122 6.5Cotton 538 6.5Paperboard Containers and Boxes 191 6.1Farm Machinery and Equipment 113 5.9Dairy Farm Products 2,516 5.8Real Estate 783 5.7Frozen Fruits, Juices and Vegetables 1,425 5.5Motor Vehicle Parts and Accessories 137 5.2Canned Fruits and Vegetables 674 5.2Communications, Except Radio and TV 170 4.3Fertilizers, Mixing Only 315 4.3Other State and Local Govt. Enterprises 229 4.2Wines, Brandy, and Brandy Spirits 152 3.7Poultry and Eggs 589 3.7Meat Packing Plants 142 3.0Cottonseed Oil Mills 96 3.0Bottled and Canned Soft Drinks & Water 191 2.9Fluid Milk 141 2.5Nitrogenous and Phosphatic Fertilizers 420 2.1Cheese, Natural and Processed 373 2.1Condensed and Evaporated Milk 156 2.0Gas Production and Distribution 376 1.3Soybean Oil Mills 125 0.7
* Source: MIG, IMPLAN ProTM
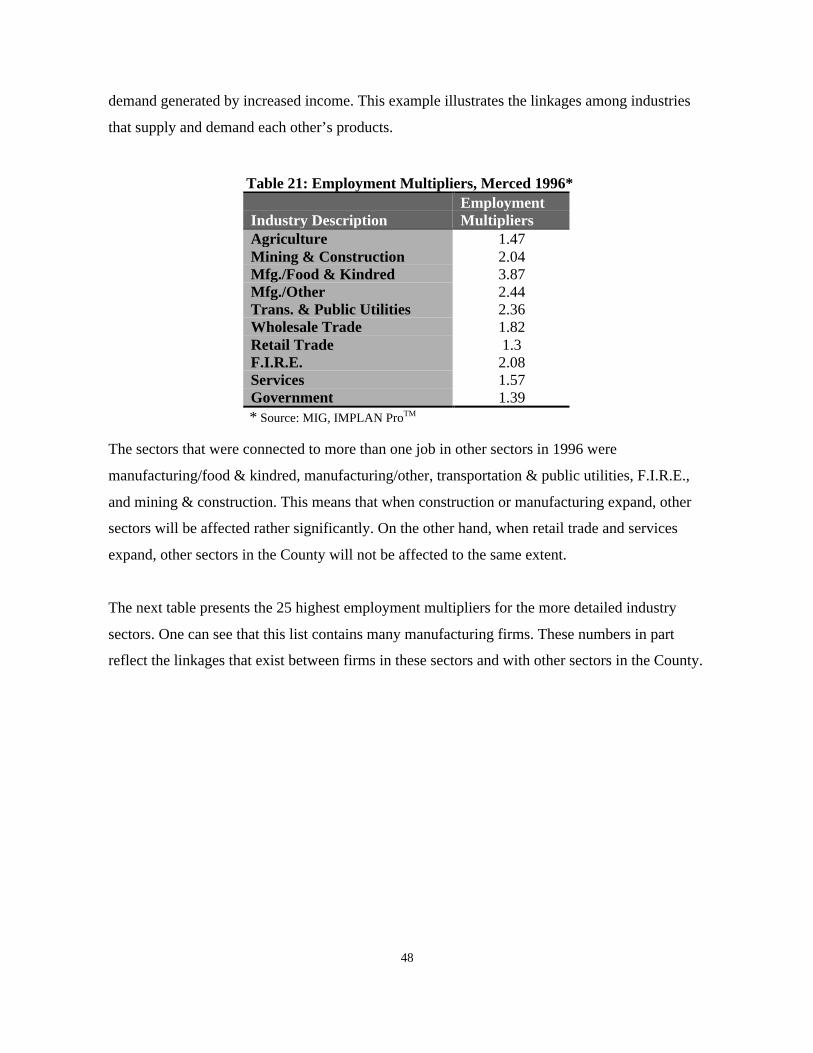
The next table reports the employment multipliers for the general sectors of the economy. These
numbers represent the number of jobs that are actually created when there is a job in a particular
sector. The value for manufacturing/food & kindred is 3.87. This means that every job in that
sector is connected to 3.87 jobs in the County. One of those jobs is in food processing while the
other 2.87 jobs are in businesses that are affected by food processing. These may be businesses
that supply the sector with raw materials and services. Others may hire people to meet the
48
demand generated by increased income. This example illustrates the linkages among industries
that supply and demand each other’s products.
Table 21: Employment Multipliers, Merced 1996*
Industry DescriptionEmploymentMultipliers
Agriculture 1.47Mining & Construction 2.04Mfg./Food & Kindred 3.87Mfg./Other 2.44Trans. & Public Utilities 2.36Wholesale Trade 1.82Retail Trade 1.3F.I.R.E. 2.08Services 1.57Government 1.39
* Source: MIG, IMPLAN ProTM
The sectors that were connected to more than one job in other sectors in 1996 were
manufacturing/food & kindred, manufacturing/other, transportation & public utilities, F.I.R.E.,
and mining & construction. This means that when construction or manufacturing expand, other
sectors will be affected rather significantly. On the other hand, when retail trade and services
expand, other sectors in the County will not be affected to the same extent.
The next table presents the 25 highest employment multipliers for the more detailed industry
sectors. One can see that this list contains many manufacturing firms. These numbers in part
reflect the linkages that exist between firms in these sectors and with other sectors in the County.

49
Table 22: Top 25 Employment Multipliers, Merced 1996*
Description EmploymentEmploymentMultiplier
Soybean Oil Mills 125 5.58Cheese, Natural and Processed 373 4.99Meat Packing Plants 142 4.42Fluid Milk 141 4.27Condensed and Evaporated Milk 156 4.02Poultry and Eggs 589 3.71Nitrogenous and Phosphatic Fertilizers 420 3.25Gas Production and Distribution 376 2.82Other State and Local Govt. Enterprises 229 2.53Bottled and Canned Soft Drinks & Water 191 2.53Cotton 538 2.43Fertilizers, Mixing Only 315 2.42Cottonseed Oil Mills 96 2.39Vegetables 1,293 2.38Dairy Farm Products 2,516 2.37Frozen Fruits, Juices and Vegetables 1,425 2.31Poultry Processing 2,979 2.23Wines, Brandy, and Brandy Spirits 152 2.18Canned Fruits and Vegetables 674 2.14Tree Nuts 1,859 1.99Fruits 999 1.98Communications, Except Radio and TV 170 1.98Insurance Carriers 1,206 1.92Automobile Rental and Leasing 122 1.90Radio and TV Broadcasting 88 1.87
* Source: MIG, IMPLAN ProTM

50
Table 23: Lowest 25 Employment Multipliers, Merced 1996*
Description EmploymentEmploymentMultipliers
Domestic Services 752 1.07Labor and Civic Organizations 655 1.08Detective and Protective Services 176 1.10Federal Government - Military 416 1.12Residential Care 363 1.14Landscape and Horticultural Services 107 1.14Agricultural, Forestry, Fishery Services 5,166 1.14Amusement and Recreation Services, N.E.C. 137 1.15Automobile Parking and Car Wash 219 1.15Apparel & Accessory Stores 259 1.17Miscellaneous Retail 2,008 1.17Hay and Pasture 1,650 1.18General Merchandise Stores 1,781 1.18Personnel Supply Services 408 1.18Bowling Alleys and Pool Halls 80 1.19Eating & Drinking 4,480 1.21Services To Buildings 464 1.21Furniture & Home Furnishings Stores 345 1.22State & Local Government - Education 6,514 1.23Credit Agencies 217 1.23Food Grains 109 1.23Local, Interurban Passenger Transit 231 1.24Portrait and Photographic Studios 102 1.24Building Materials & Gardening 520 1.24Child Day Care Services 113 1.25
* Source: MIG, IMPLAN ProTM

51
Location Quotients
The table below presents industry location quotients that are greater than 1.25 for Merced
County for classifications with employment of 30 or more. These location quotients are
generated using the 1997 data from ES202. This data set does not include any government
employment, but it provides much more detailed information regarding private sector
employment compared to the IMPLAN Pro data.
Location quotients are calculated by dividing the sector’s percent of total regional employment
by that sector’s percent of total national employment. A number that is greater than one means
that the region has a higher concentration of employment in that sector than in the nation. A
value less than one means the opposite. Generally values between .75 and 1.25 are considered to
be close to 1 and are interpreted as such.
One way that location quotients are used is to identify what are called base industries of a region.
The term base industry usually refers to industries that export products out of the region thus
bringing dollars into the region. Sectors with location quotients greater than 1.25 are often
identified as exporting sectors. This is because they have a higher concentration of employment
in the region than nationally. Assuming that the local consumers have consumption patterns that
are similar to those in the rest of the nation, the extra employment in these sectors is assumed to
be supplying outside consumers.
The highest location quotients for Merced County in 1997 were in agriculture or agriculturally-
related sectors. In food production, tree nuts, dairy farms, poultry and eggs, and turkey and
turkey eggs were important exporters. So were processing sectors such as canned fruits and
vegetables, poultry slaughtering and processing, and cheese, natural and processed. These sectors
use the raw materials supplied by agriculture. One thing that this suggests is that while the
agricultural production sector does export to other regions, much of its output is processed in the
County and exported with some value added. Hence, the high values for the agricultural
production sectors do not result in proportionally higher exports.
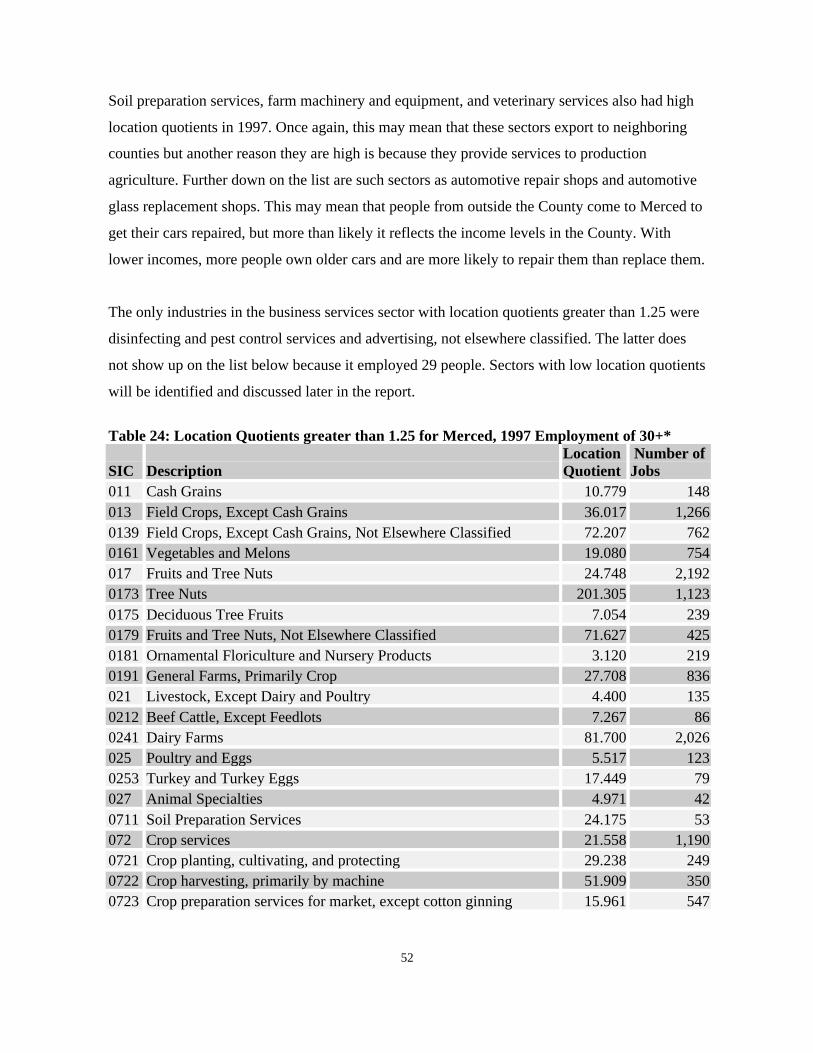
52
Soil preparation services, farm machinery and equipment, and veterinary services also had high
location quotients in 1997. Once again, this may mean that these sectors export to neighboring
counties but another reason they are high is because they provide services to production
agriculture. Further down on the list are such sectors as automotive repair shops and automotive
glass replacement shops. This may mean that people from outside the County come to Merced to
get their cars repaired, but more than likely it reflects the income levels in the County. With
lower incomes, more people own older cars and are more likely to repair them than replace them.
The only industries in the business services sector with location quotients greater than 1.25 were
disinfecting and pest control services and advertising, not elsewhere classified. The latter does
not show up on the list below because it employed 29 people. Sectors with low location quotients
will be identified and discussed later in the report.
Table 24: Location Quotients greater than 1.25 for Merced, 1997 Employment of 30+*
SIC DescriptionLocationQuotient
Number ofJobs
011 Cash Grains 10.779 148013 Field Crops, Except Cash Grains 36.017 1,2660139 Field Crops, Except Cash Grains, Not Elsewhere Classified 72.207 7620161 Vegetables and Melons 19.080 754017 Fruits and Tree Nuts 24.748 2,1920173 Tree Nuts 201.305 1,1230175 Deciduous Tree Fruits 7.054 2390179 Fruits and Tree Nuts, Not Elsewhere Classified 71.627 4250181 Ornamental Floriculture and Nursery Products 3.120 2190191 General Farms, Primarily Crop 27.708 836021 Livestock, Except Dairy and Poultry 4.400 1350212 Beef Cattle, Except Feedlots 7.267 860241 Dairy Farms 81.700 2,026025 Poultry and Eggs 5.517 1230253 Turkey and Turkey Eggs 17.449 79027 Animal Specialties 4.971 420711 Soil Preparation Services 24.175 53072 Crop services 21.558 1,1900721 Crop planting, cultivating, and protecting 29.238 2490722 Crop harvesting, primarily by machine 51.909 3500723 Crop preparation services for market, except cotton ginning 15.961 547

53
SIC DescriptionLocationQuotient
Number ofJobs
0724 Cotton ginning 7.761 440740 Veterinary services 1.688 1520751 Livestock services, except veterinary 8.959 540761 Farm labor contractors 24.284 1,9110762 Farm management services 5.289 481521 General contractors-single-family houses 1.512 4681522 General contractors-residential buildings, other than single-family 1.469 351771 Concrete work 1.832 257201 Meat products 14.223 3,4062011 Meat packing plants 1.949 1432015 Poultry slaughtering and processing 27.278 3,2632022 Cheese, natural and processed 23.106 4522023 Dry, condensed, evaporated products 14.899 1212026 Fluid milk 4.030 1232033 Canned fruits and vegetables 19.350 6632034 Dehydrated fruits, vegetables, soups 23.480 2062037 Frozen fruits and vegetables 86.206 2,0662084 Wines, brandy, and brandy spirits 21.778 2402086 Bottled and canned soft drinks 10.217 4782431 Millwork 4.613 2682448 Wood pallets and skids 5.877 1222653 Corrugated and solid fiber boxes 2.323 1522759 Commercial printing, N.E.C. 11.303 1,0033081 Unsupported plastics film & sheet 7.011 2173273 Ready-mixed concrete 2.598 1373411 Metal cans 2.433 363412 Metal barrels, drums, and pails 23.208 843444 Sheet metalwork 2.389 1413451 Screw machine products 1.662 443499 Fabricated metal products, N.E.C. 3.038 943523 Farm machinery and equipment 4.649 1763648 Lighting equipment, N.E.C. 101.509 6643679 Electronic components, N.E.C. 1.864 1333713 Truck and bus bodies 3.165 633732 Boat building and repairing 8.644 2413792 Travel trailers and campers 4.993 533999 Manufacturing industries, nec 1.372 424151 School buses 1.915 129

54
SIC DescriptionLocationQuotient
Number ofJobs
421 Trucking & courier services, ex. air 1.275 9444212 Local Trucking without Storage 2.324 5474832 Radio broadcasting stations 1.295 724841 Cable and other pay television services 1.977 1704899 Communications services, nec 4.289 47493 Combination utility services 3.719 2955015 Motor vehicle parts, used 1.312 305083 Farm and garden machinery 3.422 204514 Groceries and related products 1.421 6315141 Groceries, general line 1.330 1875145 Confectionery 6.247 1745147 Meats and meat products 2.900 795148 Fresh fruits and vegetables 2.519 126515 Farm-product raw materials 1.844 975154 Livestock 4.421 665172 Petroleum products, nec 1.340 615231 Paint, glass, and wallpaper stores 1.445 475251 Hardware stores 1.476 1195531 Auto and home supply stores 1.630 3135541 Gasoline service stations 1.589 5215722 Household appliance stores 1.549 545943 Stationery stores 2.109 905949 Sewing, needlework, and piece goods 1.475 366061 Credit unions, Federally chartered 1.848 956062 Credit unions, not Federally chartered 1.708 566331 Fire, marine, and casualty insurance 2.412 6346361 Title insurance 2.215 786515 Operators of residential mobile home sites 3.321 526552 Subdividers and developers, nec 1.897 677342 Disinfecting & pest control services 1.600 697532 Top & body repair & paint shops 1.444 1437536 Automotive glass replacement shops 2.342 357539 Automotive repair shops, nec 1.715 467542 Carwashes 1.721 1057549 Automotive services, nec 1.813 957933 Bowling centers 1.682 678042 Offices and clinics of optometrists 1.688 648059 Nursing and personal care facilities, nec 1.379 146

55
SIC DescriptionLocationQuotient
Number ofJobs
8092 Kidney dialysis centers 2.969 668099 Health and allied services, nec 1.523 59* Source: MIG, ES202
Table 25 once again lists the sectors with high location quotients and identifies the sectors that
grew more than the sector did nationally, grew more than the County growth rate, and with
average earnings above the overall average for the County.
While base sectors showed strong employment gains, few of them could be considered well-
paying. Many of the agriculture production sectors had strong growth rates but poor earnings
when compared to the County average. Of the 16 agriculture sectors at the 4-digit SIC level
listed, 11 had strong growth, but only 2 of these had earnings above the County average.
Many of the food processing sectors that show strong growth also had higher earnings. Of the 10
food processing industries at the 4-digit SIC level listed, 7 had strong growth ; 5 of these had
earnings above the county average.
Other manufacturing sectors also exhibited strong growth and solid earnings levels. This does
not hold up for the service sectors that make the list. While many service sectors had strong
growth, they did not have strong earnings when compared to the County as a whole.
Table 25: High Location Quotient, Fast Growing, High Earnings Sectors, 1997*
SIC Description
Grewmore than
ind.nationally
Morethan
countyaverage
Earningsabove
averagefor county
011 Cash Grains X013 Field Crops, Except Cash Grains X X0139 Field Crops, Except Cash Grains, Not Elsewhere Classified X X0161 Vegetables and Melons X X017 Fruits and Tree Nuts0173 Tree Nuts0175 Deciduous Tree Fruits X X0179 Fruits and Tree Nuts, Not Elsewhere Classified0181 Ornamental Floriculture and Nursery Products X X0191 General Farms, Primarily Crop

56
SIC Description
Grewmore than
ind.nationally
Morethan
countyaverage
Earningsabove
averagefor county
021 Livestock, Except Dairy and Poultry0212 Beef Cattle, Except Feedlots X0241 Dairy Farms X X025 Poultry and Eggs X0253 Turkey and Turkey Eggs X X027 Animal Specialties X X0711 Soil Preparation Services X072 Crop services X X0721 Crop planting, cultivating, and protecting X X0722 Crop harvesting, primarily by machine X X0723 Crop preparation services for market, except cotton ginning0724 Cotton ginning X X X0740 Veterinary services X X0751 Livestock services, except veterinary X0761 Farm labor contractors0762 Farm management services X X1521 General contractors-single-family houses X X X1522 General contractors-residential buildings, not single-family X X X1771 Concrete work201 Meat products X2011 Meat packing plants X X2015 Poultry slaughtering and processing X2022 Cheese, natural and processed X X X2023 Dry, condensed, evaporated products X X X2026 Fluid milk X2033 Canned fruits and vegetables X X X2034 Dehydrated fruits, vegetables, soups X2037 Frozen fruits and vegetables X X2084 Wines, brandy, and brandy spirits X X X2086 Bottled and canned soft drinks X X X2431 Millwork X X2448 Wood pallets and skids X X2653 Corrugated and solid fiber boxes X X X2759 Commercial printing, nec X X X3081 Unsupported plastics film & sheet X X X3273 Ready-mixed concrete X X X3411 Metal cans X X X3412 Metal barrels, drums, and pails X3444 Sheet metalwork X X X

57
SIC Description
Grewmore than
ind.nationally
Morethan
countyaverage
Earningsabove
averagefor county
3451 Screw machine products X3499 Fabricated metal products, nec X3523 Farm machinery and equipment X X X3648 Lighting equipment, nec X X X3679 Electronic components, nec X3713 Truck and bus bodies X X X3732 Boat building and repairing X X X3792 Travel trailers and campers X X3999 Manufacturing industries, nec X X4151 School buses421 Trucking & courier services, ex. air X X4212 Local Trucking without Storage X X X4832 Radio broadcasting stations4841 Cable and other pay television services X X4899 Communications services, nec X X X493 Combination utility services X X5015 Motor vehicle parts, used X X5083 Farm and garden machinery X X X514 Groceries and related products X5141 Groceries, general line X5145 Confectionery X X X5147 Meats and meat products X5148 Fresh fruits and vegetables515 Farm-product raw materials5154 Livestock5172 Petroleum products, nec X5231 Paint, glass, and wallpaper stores X X X5251 Hardware stores X X5531 Auto and home supply stores X X5541 Gasoline service stations X X5722 Household appliance stores X X5943 Stationery stores X X5949 Sewing, needlework, and piece goods6061 Credit unions, Federally chartered X X6062 Credit unions, not Federally chartered X X6331 Fire, marine, and casualty insurance X6361 Title insurance X6515 Operators of residential mobile home sites X X6552 Subdividers and developers, nec X X

58
SIC Description
Grewmore than
ind.nationally
Morethan
countyaverage
Earningsabove
averagefor county
7342 Disinfecting & pest control services X X X7532 Top & body repair & paint shops X X X7536 Automotive glass replacement shops X X X7539 Automotive repair shops, nec X X7542 Carwashes X X7549 Automotive services, nec X X7933 Bowling centers8042 Offices and clinics of optometrists8059 Nursing and personal care facilities, nec8092 Kidney dialysis centers X X X8099 Health and allied services, nec X X X* Source: MIG, ES202
The next three tables provide comparisons of the top 20 sectors in terms of location quotients for
Merced County and the five reference counties. These sectors are all at the 4-digit SIC level of
detail and are listed in order of SIC number and not in order of the size of the location quotient.
This makes it a little easier to make comparisons of the types of industries that have high
employment concentrations. These lists once again show the importance of agriculture to all of
the counties within the San Joaquin Valley. Many of the highest location quotients are in
agriculture and related sectors. This is clearly not the case for Santa Clara. The tables once again
show that while the counties within the Valley are similar they are not identical.

59
Table 26: 20 Highest Location Quotient Sectors in Merced and Fresno, 1997*
SIC Merced SIC Fresno0139 Field Crops, Except Cash Grains, NEC 0131 Cotton0161 Vegetables and Melons 0172 Grapes0173 Tree Nuts 0173 Tree Nuts0179 Fruits and Tree Nuts, NEC 0174 Citrus Fruits0191 General Farms, Primarily Crop 0175 Deciduous Tree Fruits0214 Sheep and Goats 0179 Fruits & Tree Nuts, NEC0241 Dairy Farms 0191 General Farms, Primarily Crop0711 Soil Preparation Services 0214 Sheep and Goats0721 Crop planting, cultivating, and protecting 0721 Crop planting, cultivating, and protecting0722 Crop harvesting, primarily by machine 0722 Crop harvesting, primarily by machine0761 Farm labor contractors 0723 Crop prep. services for market, except cotton ginning2015 Poultry slaughtering and processing 0761 Farm labor contractors2022 Cheese, natural and processed 0762 Farm management services2033 Canned fruits and vegetables 1499 Miscellaneous nonmetallic minerals2034 Dehydrated fruits, vegetables, soups 2034 Dehydrated fruits, vegetables, soups2037 Frozen fruits and vegetables 2037 Frozen fruits and vegetables2084 Wines, brandy, and brandy spirits 2296 Tire cord and fabrics3412 Metal barrels, drums, and pails 2429 Special product sawmills, nec3648 Lighting equipment, nec 3211 Flat glass4619 Pipelines, nec 3581 Automatic vending machines*Source: MIG, ES202
Table 27: 20 Highest Location Quotient Sectors in Stanislaus and Madera, 1997*SIC Stanislaus SIC Madera0173 Tree Nuts 0172 Tree Nuts0175 Deciduous Tree Fruits 0173 Citrus Fruits0241 Dairy Farms 0179 Horticultural Specialties0251 Broiler, Fryer, and Roaster Chickens 0741 Veterinary services for Animal specialties0252 Chicken Eggs 0742 Animal services, except veterinary0253 Turkey and Turkey Eggs 0761 Farm management services0722 Crop harvesting, primarily by machine 0762 Landscape and horticultural services0761 Farm labor contractors 0781 Lawn and garden services2033 Canned fruits and vegetables 0782 Ornamental shrub and tree services2034 Dehydrated fruits, vegetables, soups 0783 Forestry2037 Frozen fruits and vegetables 1520 General contractors-single-family houses2066 Chocolate and cocoa products 1540 General contractors-industrial buildings & warehouses2068 Salted and roasted nuts and seeds 2074 Soybean oil mills2077 Animal and marine fats and oils 4210 Local Trucking without Storage2084 Wines, brandy, and brandy spirits 4932 Combination utilities, nec2096 Potato chips and similar snacks 4939 Water supply2441 Nailed wood boxes and shook 5812 Drinking places3221 Glass containers 5813 Miscellaneous retail3411 Metal cans 6510 Operators of nonresidential buildings3596 Scales and balances, exc. laboratory 7210 Power laundries, family & commercial*Source: MIG, ES202
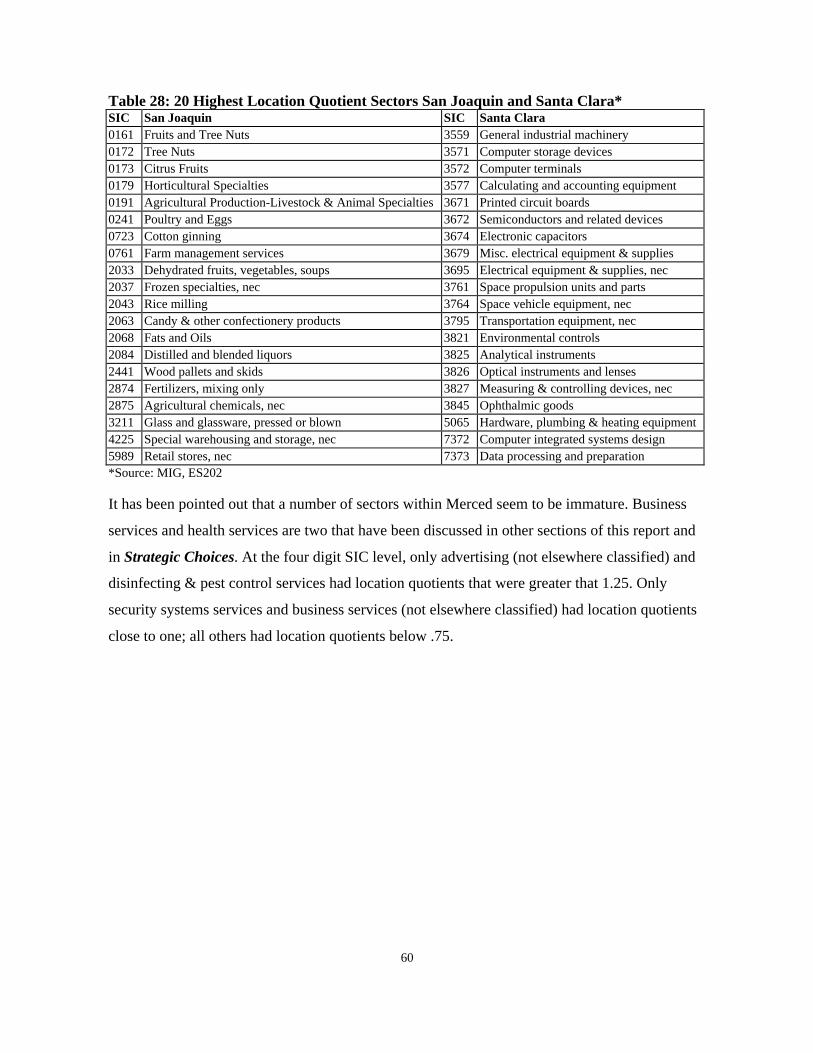
60
Table 28: 20 Highest Location Quotient Sectors San Joaquin and Santa Clara*SIC San Joaquin SIC Santa Clara0161 Fruits and Tree Nuts 3559 General industrial machinery0172 Tree Nuts 3571 Computer storage devices0173 Citrus Fruits 3572 Computer terminals0179 Horticultural Specialties 3577 Calculating and accounting equipment0191 Agricultural Production-Livestock & Animal Specialties 3671 Printed circuit boards0241 Poultry and Eggs 3672 Semiconductors and related devices0723 Cotton ginning 3674 Electronic capacitors0761 Farm management services 3679 Misc. electrical equipment & supplies2033 Dehydrated fruits, vegetables, soups 3695 Electrical equipment & supplies, nec2037 Frozen specialties, nec 3761 Space propulsion units and parts2043 Rice milling 3764 Space vehicle equipment, nec2063 Candy & other confectionery products 3795 Transportation equipment, nec2068 Fats and Oils 3821 Environmental controls2084 Distilled and blended liquors 3825 Analytical instruments2441 Wood pallets and skids 3826 Optical instruments and lenses2874 Fertilizers, mixing only 3827 Measuring & controlling devices, nec2875 Agricultural chemicals, nec 3845 Ophthalmic goods3211 Glass and glassware, pressed or blown 5065 Hardware, plumbing & heating equipment4225 Special warehousing and storage, nec 7372 Computer integrated systems design5989 Retail stores, nec 7373 Data processing and preparation*Source: MIG, ES202
It has been pointed out that a number of sectors within Merced seem to be immature. Business
services and health services are two that have been discussed in other sections of this report and
in Strategic Choices. At the four digit SIC level, only advertising (not elsewhere classified) and
disinfecting & pest control services had location quotients that were greater that 1.25. Only
security systems services and business services (not elsewhere classified) had location quotients
close to one; all others had location quotients below .75.

61
Table 29: Business Services Location Quotients for Merced, 1997*SIC Description LQ7311 Advertising agencies 0.077319 Advertising, nec 1.357322 Adjustment & collection services 0.137334 Photocopying & duplicating services 0.117338 Secretarial & court reporting 0.187342 Disinfecting & pest control services 1.607349 Building maintenance services, nec 0.687352 Medical equipment rental 0.517359 Equipment rental & leasing, nec 0.657361 Employment agencies 0.317363 Help supply services 0.177371 Computer programming services 0.057374 Data processing and preparation 0.027375 Information retrieval services 0.057378 Computer maintenance & repair 0.437379 Computer related services, nec 0.017381 Detective & armored car services 0.507382 Security systems services 0.947384 Photofinishing laboratories 0.087389 Business services, nec 0.78*Source: MIG, ES202
The location quotients in health services were not as low. There are a few categories within the
health services group with location quotients greater than 1.25 and many of them were very close
to one. The location quotients for areas such as lodging, local trucking with storage, refrigerated
warehousing and storage, and many retail categories were quite low.
Although Merced is a “Gateway to Yosemite,” the lodging numbers suggest it is principally a
stopover rather than a destination. The trucking and storage sectors are part of the agriculture and
food processing cluster and the low location quotients may indicate that there is room for
development. The low retail numbers indicate that the County is still relatively small. As it
grows, the County can expect to see a growth in employment levels.

62
Table 30: Health Services Location Quotients for Merced, 1997*SIC Description LQ
8011 Offices and clinics of doctors of medicine 0.778021 Offices and clinics of dentists 1.098031 Offices of osteopathic physicians 0.678041 Offices and clinics of chiropractors 1.128042 Offices and clinics of optometrists 1.698043 Offices and clinics of podiatrists 1.088049 Offices of health practitioners, nec 0.538051 Skilled Nursing care facilities 1.078059 Nursing and personal care facilities, nec 1.388062 General medical and surgical hospitals 0.808071 Medical laboratories 0.258072 Dental laboratories 1.278082 Home health care services 0.348092 Kidney dialysis centers 2.978093 Specialty outpatient facilities, nec 1.218099 Health and allied services, nec 1.52*Source: MIG, ES202
Employment Concentration Ratio
One final way to examine Merced’s economic base relative to the reference counties is to use
something that will be referred to as the employment concentration ratio (ECR). ECRs are
similar to location quotients but use a different county, rather than the United States, as the
reference area. A location quotient for tree nuts is the ratio of the percentage of employment in
tree nuts in Merced County to the percentage of employment in tree nuts in the United States.
The ECR is the ratio of the percentage of employment in tree nuts in Merced County to the
percentage of employment in tree nuts in some other county such as Fresno. When the ECR is
greater than 1, Merced has a higher concentration of employment in that particular industry than
does the comparison county. An ECR below 1 means that Merced has a lower concentration of
employment in that particular industry than does the comparison county. As with location
quotients, ECRs between .75 and 1.25 will be considered close enough to one to be interpreted as
similar employment concentrations.

63
ECRs were calculated with each of the reference counties. This section will illustrate some of the
results of this process. One can turn to Appendix C to see all of the ratios and a more detailed
discussion of the results.
When examining the ECR, one once again sees the importance of agriculture in Merced relative
to the counties of Stanislaus and San Joaquin as many of the ECRs in this industry group are
greater than 1.25. The importance of food processing to Merced County is also apparent in these
data.
Overall, the ECR for Merced in business services in 1997 was less than one. Not only did the
County have a relatively low concentration of employment in business services relative to the
United States, but it also had a relatively low concentration of employment in business services
compared to the surrounding counties and Santa Clara County. Once again this is consistent with
all of the information presented so far. The ECRs for health services were a little different. For
the most part, ECRs in health services for Merced were lower than one when compared to Fresno
and Stanislaus. They were close to one when comparing Merced to San Joaquin, and generally
greater than one when comparing Merced to Madera.

64
Table 31: Employment Concentration Ratios in Business Services for Merced, 1997*
SIC DescriptionECR-Fresno
ECR-SanJoaquin
ECR-Madera
ECR-Stanislaus
ECR-SantaClara
7311 Advertising agencies 0.134 0.109 NA 0.287 0.097319 Advertising, nec 2.371 6.688 8.570 1.946 3.277322 Adjustment & collection services 0.274 0.237 0.253 0.166 0.307334 Photocopying & duplicating services 0.108 0.162 1.182 0.101 0.057338 Secretarial & court reporting 0.236 0.255 1.182 0.153 0.267342 Disinfecting & pest control services 0.935 1.089 2.266 0.888 1.307349 Building maintenance services, nec 1.154 1.481 3.239 2.081 0.537352 Medical equipment rental 1.584 0.207 0.985 0.497 1.177359 Equipment rental & leasing, nec 0.475 0.783 2.794 0.489 0.787361 Employment agencies 0.274 0.160 NA 0.338 0.197363 Help supply services 0.437 0.254 1.023 0.537 0.127371 Computer programming services 0.240 0.338 0.206 0.310 0.017374 Data processing and preparation 0.069 0.067 NA 1.490 0.047375 Information retrieval services 0.563 0.182 0.296 NA 0.017378 Computer maintenance & repair 1.448 2.998 NA 2.292 0.147379 Computer related services, nec 0.099 0.143 NA 0.134 0.007381 Detective & armored car services 0.438 0.355 3.137 0.846 0.377382 Security systems services 0.671 0.686 NA 1.559 1.907384 Photofinishing laboratories 0.220 0.031 0.089 2.483 0.117389 Business services, nec 1.170 1.233 2.824 1.304 0.86
*Source: MIG, ES202
65
Conclusion
While Merced County is similar to many of the counties within the San Joaquin Valley it is
clearly not identical. Overall, earnings tend to be lower, and the County is less diverse
economically. Given the county’s size, one would expect Merced County to be economically less
diverse.
Agriculture is the foundation of the County to a greater extent than some of the others in the San
Joaquin Valley. This is evident in the output levels, employment levels, and the net export
values. In addition, there is strong growth in this sector when compared to the state and the
nation. These are all positive aspects of this industry group. It employs a large number of people
and brings millions of dollars into the County. One of the drawbacks of the sector is that jobs in
the groups are predominately low paying.
Food processing businesses also serve as an important base for the County. The sector as a whole
does not employ as many people as some of the other broad industry groups, but it has strong
growth numbers and generally pays well. This group produces a great deal of output and is the
County’s most important net exporter. Another benefit of this sector is that it boasts high
employment multipliers. This is the existing industry area that should be targeted for expansion
and retention efforts. A conclusion supported by other studies.
While agriculture and food processing are by far the most important industry groups in the
County, there are other specific sectors that are vibrant. These include communication services,
commercial printing, and sectors related to fertilizer production and distribution. All three show
up in the different statistics including the location quotients and net exports. The latter makes
sense because it services agriculture. The first two make sense because of a number of significant
employers in the County. These industries need to continue to be supported and encouraged to
expand.
Merced County’s service sector, which includes business and health services, is not as well
developed as in some of the other reference areas in the region. This suggests that the County is
losing dollars to neighboring counties. Both the health services and business services sectors are

66
net exporting sectors. Advertising and disinfecting & pest control services are the only detailed
sectors out of the broad business services group that have location quotients that are greater than
one. Industries within the health services group are net importers.
Trying to add businesses in this group will be more difficult although there are changes
occurring in the health services group that can be expected to improve the numbers for that
group. Expansion in business services will in part depend on the development of a business
community that can support it.
Retail trade and other services are areas of the economy where the County should anticipate
growth. The population growth that the county will be experiencing will result in more activity in
these industry groups. This is good news in that residents will have more choice for shopping,
but the jobs that will be created in these groups are generally low paying.

67
Appendix A
Jobs per one million dollars in output, employment multipliers, and net exports by sector forMerced County, 1996. *Source, MIG, IMPLAN Pro
IndustryJobs per $1 miloutput
EmploymentMultiplier
Net Exports(millions)
1 Dairy Farm Products 5.79 2.37 135.8122 Poultry and Eggs 3.65 3.71 -90.3593 Ranch Fed Cattle 12.41 1.69 0.0624 Range Fed Cattle 13.96 1.80 2.4945 Cattle Feedlots 4.30 2.45 -2.8776 Sheep Lambs and Goats 60.25 1.29 0.4287 Hogs Pigs and Swine 10.41 1.60 -1.8828 Other Meat Animal Products 13.52 1.65 -0.0139 Miscellaneous Livestock 25.55 1.24 -0.247
10 Cotton 6.51 2.43 55.41811 Food Grains 20.71 1.23 3.27312 Feed Grains 13.73 1.51 2.33413 Hay and Pasture 38.53 1.18 16.58516 Fruits 11.05 1.98 42.92117 Tree Nuts 10.27 1.99 131.66418 Vegetables 8.39 2.38 82.94519 Sugar Crops 16.45 1.35 4.30320 Miscellaneous Crops 29.60 1.65 0.00521 Oil Bearing Crops 16.71 1.34 0.35522 Forest Products 7.28 1.99 0.09823 Greenhouse and Nursery Products 11.80 1.55 0.02524 Forestry Products 4.93 4.37 0.51625 Commercial Fishing 11.83 1.41 0.26126 Agricultural Forestry Fishery Services 50.70 1.14 -15.85227 Landscape and Horticultural Services 48.40 1.14 -0.11441 Sand and Gravel 12.12 1.37 0.73548 New Residential Structures 12.08 1.58 -36.96649 New Industrial and Commercial Buildings 10.29 1.61 -25.34950 New Utility Structures 12.08 1.54 -4.58451 New Highways and Streets 9.77 1.55 -5.83753 New Mineral Extraction Facilities 31.60 1.24 -0.10054 New Government Facilities 9.35 1.70 -12.92455 Maintenance and Repair Residential 13.05 1.58 -10.08256 Maintenance and Repair Other Facilities 16.90 1.42 -16.46357 Maintenance and Repair Oil and Gas Wells 6.06 1.69 0.67758 Meat Packing Plants 3.02 4.42 3.98659 Sausages and Other Prepared Meats 4.92 2.93 -0.166

68
IndustryJobs per $1 miloutput
EmploymentMultiplier
Net Exports(millions)
60 Poultry Processing 7.46 2.23 259.37162 Cheese Natural and Processed 2.08 4.99 92.85763 Condensed and Evaporated Milk 1.96 4.02 40.12765 Fluid Milk 2.52 4.27 24.42967 Canned Fruits and Vegetables 5.16 2.14 77.81068 Dehydrated Food Products 6.61 1.79 9.85970 Frozen Fruits Juices and Vegetables 5.46 2.31 136.68774 Rice Milling 2.16 2.78 0.15578 Prepared Feeds N.E.C 2.34 2.96 3.62379 Bread Cake and Related Products 7.30 1.74 -0.15585 Salted and Roasted Nuts & Seeds 2.59 4.13 0.57586 Cottonseed Oil Mills 3.01 2.39 3.46387 Soybean Oil Mills 0.68 5.58 11.03793 Wines Brandy and Brandy Spirits 3.71 2.18 25.30095 Bottled and Canned Soft Drinks & Water 2.92 2.53 29.119
103 Food Preparations N.E.C 6.61 1.75 -0.395108 Broadwoven Fabric Mills and Finishing 10.01 1.39 0.080124 Apparel Made From Purchased Materials 14.27 1.33 -0.065125 Curtains and Draperies 20.16 1.31 -0.163128 Canvas Products 15.86 1.30 -0.023129 Pleating and Stitching 39.89 1.13 -0.001133 Logging Camps and Logging Contractors 8.37 1.38 -0.011137 Millwork 14.11 1.31 0.500138 Wood Kitchen Cabinets 16.99 1.28 -0.403140 Structural Wood Members N.E.C 11.28 1.34 -0.258142 Wood Pallets and Skids 17.46 1.30 0.058144 Prefabricated Wood Buildings 10.57 1.40 0.037147 Wood Products N.E.C 16.61 1.29 -0.183148 Wood Household Furniture 12.59 1.39 -1.112150 Metal Household Furniture 10.49 1.44 -0.029156 Public Building Furniture 6.63 1.61 -0.359157 Wood Partitions and Fixtures 13.29 1.43 -0.470164 Paperboard Containers and Boxes 6.12 1.59 -18.266167 Bags Plastic 6.73 1.54 0.616170 Sanitary Paper Products 2.21 2.37 1.488174 Newspapers 18.60 1.35 0.706179 Commercial Printing 9.04 1.56 22.131195 Drugs 6.24 1.78 -0.371200 Paints and Allied Products 3.55 1.97 0.859202 Nitrogenous and Phosphatic Fertilizers 2.15 3.25 44.516203 Fertilizers Mixing Only 4.25 2.42 28.592

69
IndustryJobs per $1 miloutput
EmploymentMultiplier
Net Exports(millions)
207 Printing Ink 4.99 1.70 -1.098220 Miscellaneous Plastics Products 5.89 1.78 5.130228 Personal Leather Goods 40.66 1.14 -0.002243 Concrete Products N.E.C 8.87 1.56 0.261244 Ready-mixed Concrete 6.86 1.71 9.069273 Metal Cans 2.74 1.99 -1.804274 Metal Barrels Drums and Pails 6.91 1.53 8.705286 Architectural Metal Work 11.16 1.36 9.151289 Screw Machine Products and Bolts Etc. 10.86 1.46 4.023295 Plating and Polishing 19.08 1.26 0.167304 Miscellaneous Fabricated Wire Products 11.51 1.40 0.083306 Fabricated Metal Products N.E.C. 7.63 1.61 7.780309 Farm Machinery and Equipment 5.92 1.73 -1.588315 Conveyors and Conveying Equipment 6.95 1.70 0.635321 Special Dies and Tools and Accessories 11.83 1.53 -0.057326 Textile Machinery 9.27 1.46 0.047330 Food Products Machinery 8.78 1.59 -0.004354 Industrial Machines N.E.C. 7.76 1.69 0.418369 Lighting Fixtures and Equipment 7.34 1.59 11.223378 Electronic Components N.E.C. 5.12 1.97 1.369385 Truck and Bus Bodies 4.74 1.88 -0.753386 Motor Vehicle Parts and Accessories 5.25 1.80 0.859389 Aircraft 5.76 1.74 0.207392 Ship Building and Repairing 9.74 1.52 0.244393 Boat Building and Repairing 8.54 1.55 13.571397 Travel Trailers and Camper 9.94 1.34 1.068399 Transportation Equipment N.E.C 4.88 1.77 0.205400 Search & Navigation Equipment 5.88 1.95 0.291408 Surgical Appliances and Supplies 6.55 1.88 -0.213420 Games Toys and Children’s Vehicles 10.34 1.51 -0.049429 Signs and Advertising Displays 13.52 1.36 0.079432 Manufacturing Industries N.E.C. 11.35 1.48 0.179433 Railroads and Related Services 5.69 1.90 -0.675434 Local Interurban Passenger Transit 28.10 1.24 -1.800435 Motor Freight Transport and Warehousing 10.12 1.80 -32.467436 Water Transportation 4.97 1.95 -0.345437 Air Transportation 9.93 1.56 -0.828438 Pipe Lines Except Natural Gas 5.20 1.64 -0.157439 Arrangement Of Passenger Transportation 27.70 1.21 -0.143440 Transportation Services 14.09 1.47 -0.266441 Communications Except Radio and TV 4.28 1.98 -8.623

70
IndustryJobs per $1 miloutput
EmploymentMultiplier
Net Exports(millions)
442 Radio and TV Broadcasting 9.31 1.87 -1.593443 Electric Services 1.88 2.16 -0.625444 Gas Production and Distribution 1.28 2.82 77.752445 Water Supply and Sewerage Systems 4.62 2.19 0.963446 Sanitary Services and Steam Supply 7.31 1.71 -1.005447 Wholesale Trade 13.01 1.44 -13.759448 Building Materials & Gardening 24.49 1.24 -1.204449 General Merchandise Stores 34.22 1.18 -6.273450 Food Stores 22.37 1.27 -6.269451 Automotive Dealers & Service Stations 18.38 1.33 -9.896452 Apparel & Accessory Stores 37.39 1.17 -0.997453 Furniture & Home Furnishings Stores 27.40 1.22 -1.252454 Eating & Drinking 31.74 1.21 -28.351455 Miscellaneous Retail 35.34 1.17 -4.387456 Banking 6.68 1.63 4.426457 Credit Agencies 24.48 1.23 -0.275458 Security and Commodity Brokers 8.18 1.87 -2.645459 Insurance Carriers 10.42 1.92 7.743460 Insurance Agents and Brokers 24.38 1.33 -4.354461 Owner-occupied Dwellings 5.71 1.72 -10.883462 Real Estate 24.22 1.30 -13.310463 Hotels and Lodging Places 31.58 1.29 -3.450464 Laundry Cleaning and Shoe Repair 39.30 1.24 -1.872465 Portrait and Photographic Studios 44.22 1.35 -0.655466 Beauty and Barber Shops 24.58 1.27 -0.011467 Funeral Service and Crematories 20.26 1.50 0.690468 Miscellaneous Personal Services 13.91 1.56 -1.942469 Advertising 16.59 1.43 -0.058470 Other Business Services 20.00 1.46 1.893471 Photofinishing Commercial Photography 34.95 1.21 -0.167472 Services To Buildings 11.47 1.56 1.317473 Equipment Rental and Leasing 43.87 1.18 -2.080474 Personnel Supply Services 15.78 1.39 -0.348475 Computer and Data Processing Services 82.09 1.10 -0.638476 Detective and Protective Services 6.54 1.90 -0.241477 Automobile Rental and Leasing 38.05 1.15 -4.492478 Automobile Parking and Car Wash 12.70 1.44 2.000479 Automobile Repair and Services 13.89 1.35 8.030480 Electrical Repair Service 14.60 1.36 -2.310481 Watch Clock Jewelry and Furniture Repair 16.05 1.37 0.033482 Miscellaneous Repair Shops 14.31 1.75 -3.595
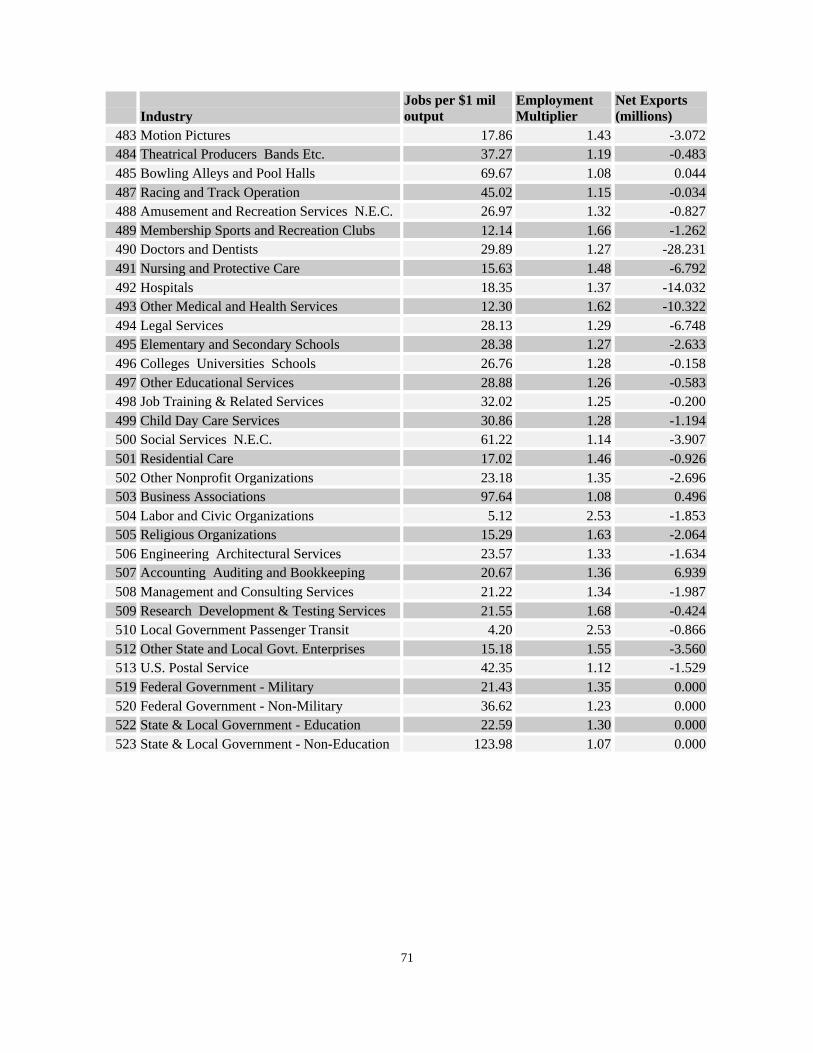
71
IndustryJobs per $1 miloutput
EmploymentMultiplier
Net Exports(millions)
483 Motion Pictures 17.86 1.43 -3.072484 Theatrical Producers Bands Etc. 37.27 1.19 -0.483485 Bowling Alleys and Pool Halls 69.67 1.08 0.044487 Racing and Track Operation 45.02 1.15 -0.034488 Amusement and Recreation Services N.E.C. 26.97 1.32 -0.827489 Membership Sports and Recreation Clubs 12.14 1.66 -1.262490 Doctors and Dentists 29.89 1.27 -28.231491 Nursing and Protective Care 15.63 1.48 -6.792492 Hospitals 18.35 1.37 -14.032493 Other Medical and Health Services 12.30 1.62 -10.322494 Legal Services 28.13 1.29 -6.748495 Elementary and Secondary Schools 28.38 1.27 -2.633496 Colleges Universities Schools 26.76 1.28 -0.158497 Other Educational Services 28.88 1.26 -0.583498 Job Training & Related Services 32.02 1.25 -0.200499 Child Day Care Services 30.86 1.28 -1.194500 Social Services N.E.C. 61.22 1.14 -3.907501 Residential Care 17.02 1.46 -0.926502 Other Nonprofit Organizations 23.18 1.35 -2.696503 Business Associations 97.64 1.08 0.496504 Labor and Civic Organizations 5.12 2.53 -1.853505 Religious Organizations 15.29 1.63 -2.064506 Engineering Architectural Services 23.57 1.33 -1.634507 Accounting Auditing and Bookkeeping 20.67 1.36 6.939508 Management and Consulting Services 21.22 1.34 -1.987509 Research Development & Testing Services 21.55 1.68 -0.424510 Local Government Passenger Transit 4.20 2.53 -0.866512 Other State and Local Govt. Enterprises 15.18 1.55 -3.560513 U.S. Postal Service 42.35 1.12 -1.529519 Federal Government - Military 21.43 1.35 0.000520 Federal Government - Non-Military 36.62 1.23 0.000522 State & Local Government - Education 22.59 1.30 0.000523 State & Local Government - Non-Education 123.98 1.07 0.000

72
Appendix B: 1997 Location Quotients and Employment Levels for MercedCounty.
SIC Industry Description LQ EmploymentAGRICULTURAL 13.02 11,290
01 Agricultural production-crops 18.88 5,416011 Cash Grains 10.78 148
0115 Corn 5.24 25013 Field Crops, Except Cash Grains 36.02 1,266
0139 Field Crops, Except Cash Grains, N. E. C. 72.21 762016 Vegetables 19.08 754
0161 Vegetables and Melons 19.08 754017 Fruits and Tree Nuts 24.75 2,192
0173 Tree Nuts 201.30 1,1230175 Deciduous Tree Fruits 7.05 2390179 Fruits and Tree Nuts, Not Elsewhere Classified 71.63 425
018 Horticultural Specialties 2.75 2190181 Ornamental Floriculture and Nursery Products 3.12 219
019 General Farms, Primarily Crop 27.71 8360191 General Farms, Primarily Crop 27.71 836
02 Agricultural Production-Livestock and Animal Specialties 26.44 2,343021 Livestock, Except Dairy and Poultry 4.40 135
0211 Beef Cattle Feedlots 2.92 210212 Beef Cattle, Except Feedlots 7.27 860214 Sheep and Goats 19.61 15
024 Dairy Farms 81.70 2,0260241 Dairy Farms 81.70 2,026
025 Poultry and Eggs 5.52 1230251 Broiler, Fryer, and Roaster Chickens 1.61 70253 Turkey and Turkey Eggs 17.45 79
027 Animal Specialties 4.97 420279 Animal Specialties, Not Elsewhere Classified 9.21 26
029 General Farms, Primarily Livestock and Animal Specialties 7.47 180291 General Farms, Primarily Livestock and Animal Specialties 7.47 18
07 Agricultural services 7.45 3,523071 Soil preparation services 24.17 53
0711 Soil Preparation Services 24.17 53072 Crop services 21.56 1,190
0721 Crop planting, cultivating, and protecting 29.24 2490722 Crop harvesting, primarily by machine 51.91 350

73
SIC Industry Description LQ Employment0723 Crop preparation services for market, except cotton ginning 15.96 5470724 Cotton ginning 7.76 44
074 Veterinary services 1.69 1520740 Veterinary services 1.69 152
075 Animal services, except veterinary 2.36 590751 Livestock services, except veterinary 8.96 540752 Animal specialty services, except veterinary 0.26 5
076 Farm labor and management services 22.32 1,9590761 Farm labor contractors 24.28 1,9110762 Farm management services 5.29 48
078 Landscape and horticultural services 0.52 1100780 Landscape and horticultural services unallocated 0.52 110
08 Forestry 0.23 3081 Timber tracts 0.60 3
0811 Timber tracts 0.60 309 Fishing, hunting, and trapping 0.84 5
091 Commercial fishing 1.07 50912 Finfish 1.89 5
MINING 0.01 313 Oil and gas extraction 0.01 1
138 Oil and gas field services 0.01 11382 Oil and gas exploration services 0.09 1
14 Nonmetallic minerals, except fuels 0.04 2144 Sand and gravel 0.11 2
1442 Construction sand and gravel 0.12 2CONSTRUCTION 0.63 1,731
15 General contractors and operative builder 0.93 598152 General building contractors 1.51 503
1521 General contractors-single-family houses 1.51 4681522 General contractors-residential buildings, other than single-
family1.47 35
154 General building contractors-nonresidential buildings 0.32 941541 General contractors-industrial buildings and warehouses 0.18 151542 General contractors-nonresidential buildings, other than
industrial buildings and warehouses0.37 79
16 Heavy construction, ex. building 0.47 182161 Highway and street construction, except elevated highways 0.07 8
1611 Highway and street construction, except elevated highways 0.07 8162 Heavy construction, except highway 0.64 174

74
SIC Industry Description LQ Employment1623 Water, sewer, pipeline, & communications & power line const. 0.72 851629 Heavy construction, not elsewhere classified 0.68 89
17 Special trade contractors 0.55 951171 Plumbing, heating, air-conditioning 0.54 212
1711 Plumbing, heating, and air-conditioning 0.54 212172 Painting and paper hanging 0.62 60
1721 Painting and paper hanging 0.62 60173 Electrical work 0.26 86
1731 Electrical work 0.26 86174 Masonry, stonework, and plastering 0.51 116
1741 Masonry and other stonework 0.12 101742 Plastering, drywall, and insulation 0.74 931743 Terrazzo, tile, marble, mosaic work 0.68 13
175 Carpentry and floor work 0.21 261751 Carpentry work 0.24 231752 Floor laying and floor work, N. E. C. 0.10 3
176 Roofing, siding, and sheet metal work 0.40 451761 Roofing, siding, and sheet metal work 0.40 45
177 Concrete work 1.83 2571771 Concrete work 1.83 257
178 Water well drilling 0.91 101781 Water well drilling 0.91 10
179 Misc. special trade contractors 0.46 1391791 Structural steel erection 0.11 41793 Glass and glazing work 0.95 191794 Excavation work 0.79 561795 Wrecking and demolition work 0.51 41796 Installing building equipment, N. E. C. 0.45 171799 Special trade contractors, N. E. C. 0.30 38
MANUFACTURING 1.32 12,11320 Food and kindred products 9.46 7,841
201 Meat products 14.22 3,4062011 Meat packing plants 1.95 1432015 Poultry slaughtering and processing 27.28 3,263
202 Dairy products 9.93 6962022 Cheese, natural and processed 23.11 4522023 Dry, condensed, evaporated products 14.90 1212026 Fluid milk 4.03 123
203 Preserved fruits and vegetables 26.19 2,935

75
SIC Industry Description LQ Employment2033 Canned fruits and vegetables 19.35 6632034 Dehydrated fruits, vegetables, soups 23.48 2062037 Frozen fruits and vegetables 86.21 2,066
204 Grain mill products 0.49 302044 Rice milling 0.40 12048 Prepared feeds, N. E. C. 1.47 29
205 Bakery products 0.03 32051 Bread, cake, and related products 0.04 3
207 Fats and Oils 0.88 142074 Cottonseed oil mills 5.53 72075 Soybean oil mills 1.43 7
208 Beverages 8.03 7182084 Wines, brandy, and brandy spirits 21.78 2402086 Bottled and canned soft drinks 10.22 478
209 Misc. food and kindred products 0.44 392099 Food preparations, N. E. C. 1.11 39
21 Tobacco products 0.69 14214 Tobacco stemming and redrying 4.10 14
2141 Tobacco stemming and redrying 4.10 1422 Textile mill products 0.05 14
226 Textile finishing, except wool 0.42 142261 Finishing plants, cotton 0.91 14
23 Apparel and other textile products 0.04 16233 Women's and misses' outerwear 0.03 4
2339 Women's and misses' outerwear, N. E. C. 0.05 4239 Misc. fabricated textile products 0.11 12
2391 Curtains and draperies 0.41 42394 Canvas and related products 0.82 8
24 Lumber and wood products 1.14 444241 Logging 0.63 25
2411 Logging 0.63 25243 Millwork, plywood & structural members 2.00 290
2431 Millwork 4.61 2682434 Wood kitchen cabinets 0.48 192439 Structural wood members, N. E. C. 0.16 3
244 Wood Containers 4.61 1222448 Wood pallets and skids 5.88 122
245 Wood buildings and mobile homes 0.17 82452 Prefabricated wood buildings 0.73 8

76
SIC Industry Description LQ Employment25 Furniture and fixtures 0.14 36
251 Household furniture 0.07 92511 Wood household furniture 0.15 9
253 Public building & related furniture 0.09 22531 Public building and related furniture 0.09 2
254 Partitions and fixtures 0.58 252541 Wood partitions and fixtures 1.01 25
26 Paper and allied products 0.51 172265 Paperboard containers and boxes 1.50 162
2653 Corrugated and solid fiber boxes 2.32 1522655 Fiber cans, drums & similar products 1.38 10
267 Misc. converted paper products 0.08 102673 Bags: plastics, laminated, & coated 0.51 10
27 Printing and publishing 1.41 1,069271 Newspapers 0.21 45
2711 Newspapers: publishing, or publishing and printing 0.21 45275 Commercial Printing 3.65 1,024
2752 Commercial printing, lithographic 0.12 212759 Commercial printing, N. E. C. 11.30 1,003
28 Chemicals and allied products 0.12 63283 Drugs 0.05 7
2836 Biological products exc. diagnostic 0.85 7284 Soap, cleaners, and toilet goods 0.18 14
2841 Soap and other detergents 0.68 14287 Agricultural chemicals 1.08 28
2873 Nitrogenous fertilizers 3.14 142875 Fertilizers, mixing only 2.91 14
289 Miscellaneous chemical products 0.31 142893 Printing ink 1.73 14
30 Rubber and misc. plastics products 0.47 231308 Miscellaneous plastics products, N. E. C. 0.64 231
3081 Unsupported plastics film & sheet 7.01 2173089 Plastics products, N. E. C. 0.06 14
31 Leather and leather products 0.47 21317 Handbags and personal leather goods 4.41 21
3172 Personal leather goods, N. E. C. 6.78 2132 Stone, clay, and glass products 0.52 140
327 Concrete, gypsum, and plaster products 1.31 1403272 Concrete products, N. E. C. 0.08 3

77
SIC Industry Description LQ Employment3273 Ready-mixed concrete 2.60 137
34 Fabricated metal products 0.58 422341 Metal cans and shipping containers 6.52 120
3411 Metal cans 2.43 363412 Metal barrels, drums, and pails 23.21 84
344 Fabricated structural metal products 0.70 1573444 Sheet metalwork 2.39 1413446 Architectural metal work 1.05 16
345 Screw machine products, bolts, etc. 0.86 443451 Screw machine products 1.66 44
347 Metal services, N. E. C. 0.06 43471 Plating and polishing 0.10 4
349 Misc. fabricated metal products 0.76 983496 Misc. fabricated wire products 0.14 43499 Fabricated metal products, N. E. C. 3.04 94
35 Industrial machinery and equipment 0.20 209352 Farm and garden machinery 3.43 176
3523 Farm machinery and equipment 4.65 176353 Construction and related machinery 0.10 12
3535 Conveyors and conveying equipment 0.60 12354 Metalworking machinery 0.02 3
3545 Machine tool accessories 0.11 3355 Special industry machinery 0.06 5
3552 Textile machinery 0.42 33556 Food products machinery 0.16 2
359 Industrial machinery, N. E. C. 0.07 133599 Industrial machinery, N. E. C. 0.09 13
36 Electronic & other electric equipment 0.96 797364 Electric lighting and wiring equipment 7.45 664
3648 Lighting equipment, N. E. C. 101.51 664367 Electronic components and accessories 0.42 133
3679 Electronic components, N. E. C. 1.86 13337 Transportation equipment 0.59 533
371 Motor vehicles and equipment 0.47 2273713 Truck and bus bodies 3.17 633714 Motor vehicle parts and accessories 0.52 1373715 Truck trailers 1.63 27
372 Aircraft and parts 0.02 53721 Aircraft 0.04 5

78
SIC Industry Description LQ Employment373 Ship and boat building and repairing 3.15 245
3731 Ship building and repairing 0.08 43732 Boat building and repairing 8.64 241
379 Miscellaneous transportation equipment 2.12 563792 Travel trailers and campers 4.99 533799 Transportation equipment, N. E. C. 0.24 3
38 Instruments and related products 0.08 35381 Search and navigation equipment 0.27 21
3812 Search and navigation equipment 0.27 21385 Ophthalmic goods 0.81 14
3851 Ophthalmic goods 0.81 1439 Miscellaneous manufacturing industries 0.29 56
399 Miscellaneous manufactures 0.71 563993 Signs and advertising specialties 0.42 143999 Manufacturing industries, N. E. C. 1.37 42
TRANSPORTATION AND PUBLIC UTILITIES 0.72 2,17441 Local and interurban passenger transit 1.01 214
411 Local and suburban transportation 0.54 554119 Local passenger transportation, N. E. C. 0.69 55
412 Taxicabs 0.27 44121 Taxicabs 0.27 4
414 Bus charter service 1.64 264141 Local bus charter service 4.54 26
415 School buses 1.91 1294151 School buses 1.91 129
42 Trucking and warehousing 1.19 973421 Trucking & courier services, ex. air 1.27 944
4212 Local Trucking without Storage 2.32 5474213 Trucking, except local 0.91 3784214 Local Trucking with Storage 0.19 74215 Courier Services, except Air 0.22 12
422 Public warehousing and storage 0.36 284221 Farm product warehousing and storage 1.58 64222 Refrigerated warehousing and storage 0.49 64225 General warehousing and storage 0.36 17
44 Water transportation 0.04 4441 Deep sea foreign trans. of freight 0.55 4
4412 Deep sea foreign transportation of freight 0.55 445 Transportation by air 0.16 88

79
SIC Industry Description LQ Employment451 Air transportation, scheduled 0.13 64
4512 Air transportation, scheduled 0.14 354513 Air courier services 0.12 28
458 Airports, flying fields, & services 0.41 244581 Airports, flying fields, and airport terminal services 0.41 24
46 Pipelines, except natural gas 0.57 4461 Pipelines, except natural gas 0.57 4
4619 Pipelines, N. E. C. 24.25 447 Transportation services 0.21 45
472 Passenger transportation arrangement 0.18 194724 Travel agencies 0.23 19
478 Miscellaneous transportation services 1.23 264783 Packing and crating 3.19 224785 Fixed facilities and inspection and weighing services for motor
vehicle transpiration1.21 3
48 Communication 0.71 493481 Telephone communication 0.43 204
4812 Radiotelephone communications 0.95 704813 Telephone communications, exc. radio 0.33 134
483 Radio and television broadcasting 0.61 724832 Radio broadcasting stations 1.30 72
484 Cable and other pay TV services 1.98 1704841 Cable and other pay television services 1.98 170
489 Communication services, N. E. C. 4.29 474899 Communications services, N. E. C. 4.29 47
49 Electric, gas, and sanitary services 0.83 353491 Electric services 0.06 11
4911 Electric services 0.06 11492 Gas production and distribution 0.03 2
4922 Natural gas transmission 0.14 2493 Combination utility services 3.72 295494 Water supply 0.14 2
4941 Water supply 0.14 2495 Sanitary services 0.48 38
4953 Refuse systems 0.51 324959 Sanitary services, N. E. C. 0.35 5
497 Irrigation systems 5.32 54971 Irrigation systems 5.32 5
WHOLESALE TRADE 0.53 1,735

80
SIC Industry Description LQ Employment50 Wholesale trade - durable goods 0.34 665
501 Motor vehicles, parts, and supplies 0.50 1265012 Automobiles and other motor vehicles 0.18 135013 Motor vehicle supplies and new parts 0.50 715014 Tires and tubes 0.85 135015 Motor vehicle parts, used 1.31 30
502 Furniture and homefurnishings 0.09 75023 Homefurnishings 0.17 7
503 Lumber and construction materials 0.13 165031 Lumber, plywood, and millwork 0.11 75032 Brick, stone, & related materials 0.35 9
504 Professional & commercial equipment 0.34 1455044 Office equipment 0.84 815045 Computers, peripherals & software 0.23 395046 Commercial equipment, N. E. C. 0.47 135047 Medical and hospital equipment 0.15 13
505 Metals and minerals, except petroleum 0.05 45051 Metals service centers and offices 0.06 4
506 Electrical goods 0.09 235063 Electrical apparatus and equipment 0.16 175065 Electronic parts and equipment 0.05 7
507 Hardware, plumbing & heating equipment 0.27 405072 Hardware 0.26 145074 Plumbing & hydronic heating supplies 0.43 255075 Warm air heating & air-conditioning 0.03 1
508 Machinery, equipment, and supplies 0.71 2845083 Farm and garden machinery 3.42 2045084 Industrial machinery and equipment 0.23 385085 Industrial supplies 0.42 325087 Service establishment equipment 0.24 10
509 Miscellaneous durable goods 0.12 205091 Sporting & recreational goods 0.08 25092 Toys and hobby goods and supplies 0.21 35093 Scrap and waste materials 0.24 15
51 Wholesale trade - nondurable goods 0.80 1,070511 Paper and paper products 0.21 28
5112 Stationery and office supplies 0.35 275113 Industrial & personal service paper 0.02 1
512 Drugs, proprietaries, and sundries 0.02 2

81
SIC Industry Description LQ Employment5122 Drugs, proprietaries, and sundries 0.02 2
513 Apparel, piece goods, and notions 0.34 375131 Piece goods & notions 0.43 115136 Men's and boys' clothing 0.55 145137 Women's and children's clothing 0.25 11
514 Groceries and related products 1.42 6315141 Groceries, general line 1.33 1875143 Dairy products, exc. dried or canned 0.84 185145 Confectionery 6.25 1745147 Meats and meat products 2.90 795148 Fresh fruits and vegetables 2.52 1265149 Groceries and related products, N. E. C. 0.35 47
515 Farm-product raw materials 1.84 975153 Grain and field beans 0.17 55154 Livestock 4.42 665159 Farm-product raw materials, N. E. C. 3.31 26
516 Chemicals and allied products 0.05 45169 Chemicals & allied products, N. E. C. 0.07 4
517 Petroleum and petroleum products 1.16 895171 Petroleum bulk stations & terminals 0.90 285172 Petroleum products, N. E. C. 1.34 61
518 Beer, wine, and distilled beverages 0.26 205181 Beer and ale 0.41 20
519 Misc. nondurable goods 0.61 1625191 Farm supplies 1.18 965192 Books, periodicals, & newspapers 0.07 35193 Flowers & florists' supplies 0.21 65198 Paints, varnishes, and supplies 0.20 35199 Nondurable goods, N. E. C. 0.68 55
RETAIL TRADE 0.92 9,95252 Building materials & garden supplies 0.84 380
521 Lumber and other building materials 0.64 1735211 Lumber and other building materials 0.64 173
523 Paint, glass, and wallpaper stores 1.44 475231 Paint, glass, and wallpaper stores 1.44 47
525 Hardware stores 1.48 1195251 Hardware stores 1.48 119
526 Retail nurseries and garden stores 0.90 415261 Retail nurseries and garden stores 0.90 41

82
SIC Industry Description LQ Employment53 General merchandise stores 1.19 1,567
531 Department stores 1.24 1,4375311 Department stores 1.24 1,437
533 Variety stores 0.46 305331 Variety stores 0.46 30
539 Misc. general merchandise stores 1.08 1005399 Misc. general merchandise stores 1.08 100
54 Food stores 0.91 1,555541 Grocery stores 0.95 1,432
5411 Grocery stores 0.95 1,432542 Meat and fish markets 0.74 17
5421 Meat and fish markets 0.74 17543 Fruit and vegetable markets 0.70 10
5431 Fruit and vegetable markets 0.70 10544 Candy, nut, and confectionery stores 0.33 5
5441 Candy, nut, and confectionery stores 0.33 5546 Retail bakeries 0.60 60
5461 Retail bakeries 0.60 60549 Miscellaneous food stores 0.74 31
5499 Miscellaneous food stores 0.74 3155 Automotive dealers & service stations 1.35 1,530
551 New and used car dealers 1.22 6295511 New and used car dealers 1.22 629
552 Used car dealers 0.84 385521 Used car dealers 0.84 38
553 Auto and home supply stores 1.63 3135531 Auto and home supply stores 1.63 313
554 Gasoline service stations 1.59 5215541 Gasoline service stations 1.59 521
555 Boat dealers 0.16 35551 Boat dealers 0.16 3
556 Recreational vehicle dealers 0.46 65561 Recreational vehicle dealers 0.46 6
557 Motorcycle dealers 1.12 185571 Motorcycle dealers 1.12 18
559 Automotive dealers, N. E. C. 0.65 35599 Automotive dealers, N. E. C. 0.65 3
56 Apparel and accessory stores 0.34 184561 Men's & boys' clothing stores 0.02 1

83
SIC Industry Description LQ Employment5611 Men's and boys' clothing stores 0.02 1
562 Women's clothing stores 0.23 325621 Women's clothing stores 0.23 32
563 Women's accessory & specialty stores 0.75 205632 Women's accessory and specialty stores 0.75 20
564 Children's and infants' wear stores 0.05 15641 Children's and infants' wear stores 0.05 1
565 Family clothing stores 0.30 535651 Family clothing stores 0.30 53
566 Shoe stores 0.44 455661 Shoe stores 0.44 45
569 Misc. apparel & accessory stores 0.69 325699 Misc. apparel and accessory stores 0.69 32
57 Furniture and homefurnishings stores 0.69 335571 Furniture and homefurnishings stores 0.61 154
5712 Furniture stores 0.87 1275713 Floor covering stores 0.43 185714 Drapery and upholstery stores 0.34 25719 Misc. homefurnishings stores 0.12 7
572 Household appliance stores 1.55 545722 Household appliance stores 1.55 54
573 Radio, television, & computer stores 0.63 1275731 Radio, TV, & electronic stores 0.94 845734 Computer and software stores 0.29 175735 Record & prerecorded tape stores 0.53 205736 Musical instrument stores 0.38 6
58 Eating and drinking places 0.92 3,466581 Eating and drinking places 0.92 3,466
5810 Eating and drinking places unallocated 0.92 3,46659 Miscellaneous retail 0.68 936
591 Drug stores and proprietary stores 1.15 3545912 Drug stores and proprietary stores 1.15 354
592 Liquor stores 0.82 455921 Liquor stores 0.82 45
593 Used merchandise stores 1.00 565932 Used merchandise stores 1.00 56
594 Miscellaneous shopping goods stores 0.65 3155941 Sporting goods and bicycle shops 0.63 585942 Book stores 0.20 13

84
SIC Industry Description LQ Employment5943 Stationery stores 2.11 905944 Jewelry stores 0.73 515945 Hobby, toy, and game shops 0.73 435946 Camera & photographic supply stores 0.27 35947 Gift, novelty, and souvenir shops 0.19 215949 Sewing, needlework, and piece goods 1.47 36
596 Nonstore retailers 0.17 285962 Merchandising machine operators 0.38 135963 Direct selling establishments 0.57 15
598 Fuel dealers 0.61 295983 Fuel oil dealers 0.08 25984 Liquefied petroleum gas dealers 1.12 255989 Fuel dealers, N. E. C. 3.50 2
599 Retail stores, N. E. C. 0.43 1105992 Florists 0.52 325993 Tobacco stores and stands 0.30 25995 Optical goods stores 0.43 145999 Miscellaneous retail stores, N. E. C. 0.42 62
FINANCE, INSURANCE, AND REAL ESTATE 0.67 2,28160 Depository institutions 0.76 755
602 Commercial banks 0.72 5196021 National commercial banks 0.39 1666022 State commercial banks 1.24 353
603 Savings institutions 0.61 796035 Savings institutions, Federally chartered 0.56 406036 Savings institutions, not Federally chartered 0.68 39
606 Credit unions 1.79 1516061 Credit unions, Federally chartered 1.85 956062 Credit unions, not Federally chartered 1.71 56
609 Functions closely related to banking 0.16 66099 Functions related to depository banking, N. E. C. 0.18 6
61 Nondepository institutions 0.26 74611 Federal & Fed.-sponsored credit 0.49 5
6111 Federal and Fed.-sponsored credit 0.49 5614 Personal credit institutions 0.34 30
6141 Personal credit institutions 0.34 30615 Business credit institutions 0.05 3
6159 Misc. business credit institutions 0.14 3616 Mortgage bankers and brokers 0.28 36
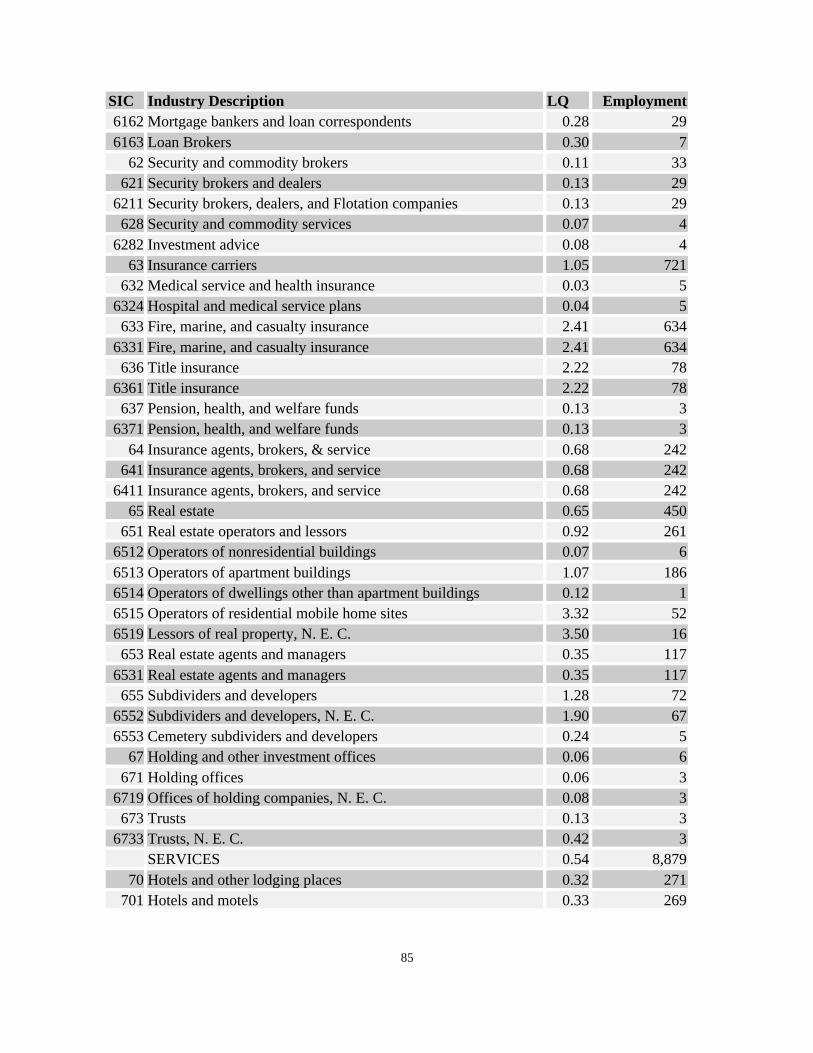
85
SIC Industry Description LQ Employment6162 Mortgage bankers and loan correspondents 0.28 296163 Loan Brokers 0.30 7
62 Security and commodity brokers 0.11 33621 Security brokers and dealers 0.13 29
6211 Security brokers, dealers, and Flotation companies 0.13 29628 Security and commodity services 0.07 4
6282 Investment advice 0.08 463 Insurance carriers 1.05 721
632 Medical service and health insurance 0.03 56324 Hospital and medical service plans 0.04 5
633 Fire, marine, and casualty insurance 2.41 6346331 Fire, marine, and casualty insurance 2.41 634
636 Title insurance 2.22 786361 Title insurance 2.22 78
637 Pension, health, and welfare funds 0.13 36371 Pension, health, and welfare funds 0.13 3
64 Insurance agents, brokers, & service 0.68 242641 Insurance agents, brokers, and service 0.68 242
6411 Insurance agents, brokers, and service 0.68 24265 Real estate 0.65 450
651 Real estate operators and lessors 0.92 2616512 Operators of nonresidential buildings 0.07 66513 Operators of apartment buildings 1.07 1866514 Operators of dwellings other than apartment buildings 0.12 16515 Operators of residential mobile home sites 3.32 526519 Lessors of real property, N. E. C. 3.50 16
653 Real estate agents and managers 0.35 1176531 Real estate agents and managers 0.35 117
655 Subdividers and developers 1.28 726552 Subdividers and developers, N. E. C. 1.90 676553 Cemetery subdividers and developers 0.24 5
67 Holding and other investment offices 0.06 6671 Holding offices 0.06 3
6719 Offices of holding companies, N. E. C. 0.08 3673 Trusts 0.13 3
6733 Trusts, N. E. C. 0.42 3SERVICES 0.54 8,879
70 Hotels and other lodging places 0.32 271701 Hotels and motels 0.33 269

86
SIC Industry Description LQ Employment7011 Hotels and motels 0.33 269
702 Rooming and boarding houses 0.59 27021 Rooming and boarding houses 0.59 2
703 Camps and recreational vehicle parks 0.05 17032 Sporting and recreational camps 0.10 1
72 Personal services 0.55 320721 Laundry, cleaning, & garment services 0.40 87
7211 Power laundries, family & commercial 0.20 37212 Garment pressing & cleaners' agents 0.21 27215 Coin-operated laundries and cleaning 0.66 147216 Drycleaning plants, except rug 0.24 207217 Carpet and upholstery cleaning 1.10 237218 Industrial launderers 0.93 257219 Laundry and garment services, N. E. C. 0.37 2
722 Photographic studios, portrait 0.78 277221 Photographic studios, portrait 0.78 27
723 Beauty shops 0.63 1247231 Beauty shops 0.63 124
724 Barber shops 0.92 57241 Barber shops 0.92 5
726 Funeral service and crematories 1.03 497261 Funeral service and crematories 1.03 49
729 Miscellaneous personal services 0.35 287291 Tax return preparation services 0.84 237299 Miscellaneous personal services, N. E. C. 0.09 5
73 Business services 0.34 1,323731 Advertising 0.28 35
7311 Advertising agencies 0.07 67319 Advertising, N. E. C. 1.35 29
732 Credit reporting and collection 0.09 67322 Adjustment & collection services 0.13 6
733 Mailing, reproduction, stenographic 0.05 87334 Photocopying & duplicating services 0.11 47338 Secretarial & court reporting 0.18 4
734 Services to buildings 0.77 3547342 Disinfecting & pest control services 1.60 697349 Building maintenance services, N. E. C. 0.68 285
735 Misc. equipment rental & leasing 0.51 627352 Medical equipment rental 0.51 10
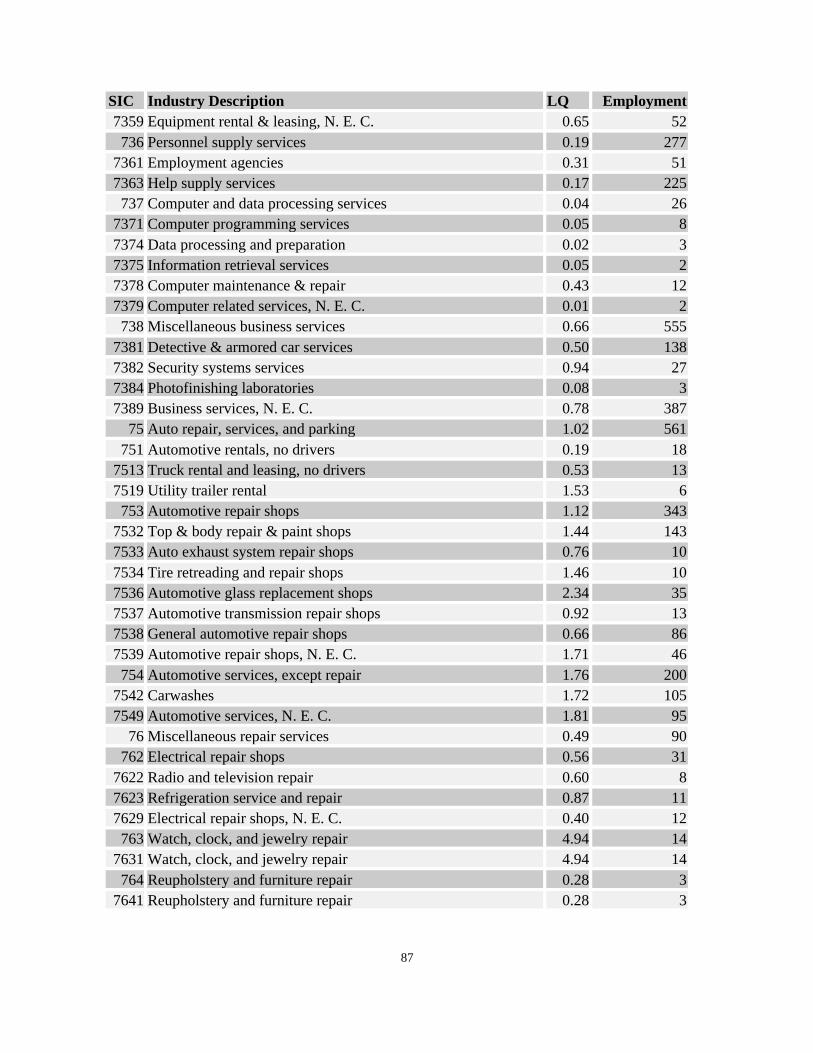
87
SIC Industry Description LQ Employment7359 Equipment rental & leasing, N. E. C. 0.65 52
736 Personnel supply services 0.19 2777361 Employment agencies 0.31 517363 Help supply services 0.17 225
737 Computer and data processing services 0.04 267371 Computer programming services 0.05 87374 Data processing and preparation 0.02 37375 Information retrieval services 0.05 27378 Computer maintenance & repair 0.43 127379 Computer related services, N. E. C. 0.01 2
738 Miscellaneous business services 0.66 5557381 Detective & armored car services 0.50 1387382 Security systems services 0.94 277384 Photofinishing laboratories 0.08 37389 Business services, N. E. C. 0.78 387
75 Auto repair, services, and parking 1.02 561751 Automotive rentals, no drivers 0.19 18
7513 Truck rental and leasing, no drivers 0.53 137519 Utility trailer rental 1.53 6
753 Automotive repair shops 1.12 3437532 Top & body repair & paint shops 1.44 1437533 Auto exhaust system repair shops 0.76 107534 Tire retreading and repair shops 1.46 107536 Automotive glass replacement shops 2.34 357537 Automotive transmission repair shops 0.92 137538 General automotive repair shops 0.66 867539 Automotive repair shops, N. E. C. 1.71 46
754 Automotive services, except repair 1.76 2007542 Carwashes 1.72 1057549 Automotive services, N. E. C. 1.81 95
76 Miscellaneous repair services 0.49 90762 Electrical repair shops 0.56 31
7622 Radio and television repair 0.60 87623 Refrigeration service and repair 0.87 117629 Electrical repair shops, N. E. C. 0.40 12
763 Watch, clock, and jewelry repair 4.94 147631 Watch, clock, and jewelry repair 4.94 14
764 Reupholstery and furniture repair 0.28 37641 Reupholstery and furniture repair 0.28 3

88
SIC Industry Description LQ Employment769 Miscellaneous repair shops 0.37 42
7692 Welding repair 0.98 157694 Armature rewinding shops 0.78 87699 Repair services, N. E. C. 0.21 19
78 Motion pictures 0.41 109783 Motion picture theaters 0.95 61
7832 Motion picture theaters, ex drive-in 0.98 61784 Video tape rental 0.61 48
7841 Video tape rental 0.61 4879 Amusement & recreation services 0.37 294
792 Producers, orchestras, entertainers 0.15 127929 Entertainers & entertainment groups 0.42 12
793 Bowling centers 1.68 677933 Bowling centers 1.68 67
794 Commercial sports 0.19 127948 Racing, including track operation 0.37 12
799 Misc. amusement, recreation services 0.34 2037991 Physical fitness facilities 0.47 387992 Public golf courses 1.12 527993 Coin-operated amusement devices 0.05 27997 Membership sports & recreation clubs 0.40 627999 Amusement and recreation, N. E. C. 0.25 50
80 Health services 0.81 3,836801 Offices & clinics of medical doctors 0.77 657
8011 Offices and clinics of doctors of medicine 0.77 657802 Offices and clinics of dentists 1.09 339
8021 Offices and clinics of dentists 1.09 339803 Offices of osteopathic physicians 0.67 16
8031 Offices of osteopathic physicians 0.67 16804 Offices of other health practitioners 0.89 190
8041 Offices and clinics of chiropractors 1.12 478042 Offices and clinics of optometrists 1.69 648043 Offices and clinics of podiatrists 1.08 158049 Offices of health practitioners, N. E. C. 0.53 64
805 Nursing and personal care facilities 0.98 8448051 Skilled Nursing care facilities 1.07 6988059 Nursing and personal care facilities, N. E. C. 1.38 146
806 Hospitals 0.74 1,3818062 General medical and surgical hospitals 0.80 1,381

89
SIC Industry Description LQ Employment807 Medical and dental laboratories 0.48 46
8071 Medical laboratories 0.25 198072 Dental laboratories 1.27 27
808 Home health care services 0.34 1178082 Home health care services 0.34 117
809 Health and allied services, N. E. C. 1.53 2468092 Kidney dialysis centers 2.97 668093 Specialty outpatient facilities, N. E. C. 1.21 1218099 Health and allied services, N. E. C. 1.52 59
81 Legal services 0.41 190811 Legal service 0.41 190
8111 Legal service 0.41 19082 Educational services 0.05 35
821 Elementary and secondary schools 0.02 58211 Elementary and secondary schools 0.02 5
829 Schools & educational services, N. E. C. 0.38 298299 Schools and educational services, N. E. C. 0.38 29
83 Social services 0.82 981832 Individual and family services 1.15 384
8322 Individual and family social services 1.15 384833 Job training and related services 1.07 145
8331 Job training and Vocational rehabilitation services 1.07 145835 Child day care services 0.31 88
8351 Child day care services 0.31 88836 Residential care 0.95 332
8361 Residential care 0.95 332839 Social services, N. E. C. 0.32 32
8399 Social services, N. E. C. 0.32 3284 Museums, botanical, zoological gardens 0.27 12
841 Museums and art galleries 0.27 98412 Museums and art galleries 0.27 9
842 Botanical and zoological gardens 0.28 38422 Arboreta and botanical or zoological gardens 0.28 3
86 Membership organizations 0.18 87861 Business associations 0.28 15
8611 Business associations 0.28 15864 Civic and social associations 0.24 57
8641 Civic, social and fraternal associations 0.24 57866 Religious organizations 0.22 14

90
SIC Industry Description LQ Employment8661 Religious organizations 0.22 14
869 Membership organizations, N. E. C. 0.03 18699 Membership organizations, N. E. C. 0.03 1
87 Engineering & management services 0.23 337871 Engineering & architectural services 0.14 59
8711 Engineering services 0.16 548712 Architectural services 0.04 38713 Surveying services 0.07 2
872 Accounting, auditing, & bookkeeping 0.44 1298721 Accounting, auditing, and bookkeeping services 0.44 129
873 Research and testing services 0.28 828731 Commercial physical research 0.28 318733 Noncommercial research organizations 0.46 318734 Testing laboratories 0.44 20
874 Management and public relations 0.14 668741 Management services 0.20 328742 Management consulting services 0.02 48743 Public relations services 0.32 68744 Facilities support services 0.14 68748 Business consulting, N. E. C. 0.21 18
88 Services, N. E. C. 2.32 433881 Private households 2.32 433
8811 Private households 2.32 433

91
Appendix C: Employment Concentration Ratios
ECRs are similar to location quotients but use a different county as the reference area instead ofusing the United States. A location quotient for tree nuts is the ratio of the percentage ofemployment in tree nuts in Merced County to the percentage of employment in tree nuts in theUnited States. The ECR is the ratio of the percentage of employment in tree nuts in MercedCounty to the percentage of employment in tree nuts in some other county such as Fresno. Whenthe ECR is greater than 1 means Merced has a higher concentration of employment in thatparticular industry than does the comparison county. An ECR below 1 means that Merced has alower concentration of employment in that particular industry than does the comparison county.As with location quotients, ECRs between .75 and 1.25 will be considered close enough to one tobe interpreted as similar employment concentrations.
SIC DescriptionECR-Fresno
ECR-SanJoaquin
ECR-Madera
ECR-Stanislaus
ECR-SantaClara
AGRICULTURAL 0.936 1.819 0.572 1.633 19.4601 Agricultural production-crops 1.171 1.589 0.533 2.124 28.04011 Cash Grains 14.708 3.060 NA NA NA0115 Corn NA 2.498 NA NA NA013 Field Crops, Except Cash Grains 2.505 10.661 2.422 NA NA0139 Field Crops, Except Cash Grains, Not Elsewhere Classified NA 10.576 7.506 NA NA016 Vegetables 1.912 1.667 NA 1.629 15.530161 Vegetables and Melons 1.912 1.667 NA 1.629 15.53017 Fruits and Tree Nuts 0.728 1.552 0.260 1.368 68.450173 Tree Nuts 8.085 3.892 1.738 1.949 252.970175 Deciduous Tree Fruits 0.236 1.132 NA 0.355 25.080179 Fruits and Tree Nuts, Not Elsewhere Classified 2.589 1.896 0.668 4.711 82.53018 Horticultural Specialties 3.700 0.515 NA 1.366 2.450181 Ornamental Floriculture and Nursery Products 5.068 NA 1.991 NA 3.98019 General Farms, Primarily Crop 1.295 0.879 0.829 3.747 44.410191 General Farms, Primarily Crop 1.295 0.879 0.829 3.747 44.4102 Agricultural Production-Livestock and Animal Specialties 6.059 4.919 2.638 2.062 124.87021 Livestock, Except Dairy and Poultry NA 3.519 1.023 1.873 18.100211 Beef Cattle Feedlots NA NA NA 10.429 NA0212 Beef Cattle, Except Feedlots NA 2.604 0.959 1.504 11.910214 Sheep and Goats 1.552 NA NA NA NA024 Dairy Farms 8.992 6.249 3.326 3.051 1,369.130241 Dairy Farms 8.992 6.249 3.326 3.051 1,369.13025 Poultry and Eggs 5.719 1.221 1.010 0.337 20.170251 Broiler, Fryer, and Roaster Chickens 1.365 NA NA 0.083 NA0253 Turkey and Turkey Eggs 6.160 NA NA 0.639 NA027 Animal Specialties NA NA NA NA NA0279 Animal Specialties, Not Elsewhere Classified 8.785 NA 2.561 0.949 NA029 General Farms, Primarily Livestock and Animal Specialties 1.496 NA NA NA NA0291 General Farms, Primarily Livestock and Animal Specialties 1.496 NA NA NA NA07 Agricultural services 0.500 1.517 0.406 1.092 9.68071 Soil preparation services 2.713 2.889 1.958 1.687 63.960711 Soil Preparation Services 2.713 2.889 1.958 1.687 63.96

92
SIC DescriptionECR-Fresno
ECR-SanJoaquin
ECR-Madera
ECR-Stanislaus
ECR-SantaClara
072 Crop services 0.836 1.873 1.776 3.513 42.870721 Crop planting, cultivating, and protecting 0.751 3.868 1.429 4.480 70.110722 Crop harvesting, primarily by machine 3.316 5.409 1.642 2.986 81.000723 Crop preparation services for market, except cotton ginning 0.589 1.080 2.170 3.289 27.500724 Cotton ginning 0.766 NA 1.445 NA NA074 Veterinary services 2.694 1.956 1.797 1.306 3.010740 Veterinary services 2.694 1.956 1.797 1.306 3.01075 Animal services, except veterinary 1.159 2.081 3.875 0.910 1.310751 Livestock services, except veterinary 10.137 17.987 NA 1.889 11.260752 Animal specialty services, except veterinary 0.110 0.197 0.328 0.138 0.12076 Farm labor and management services 0.375 1.419 0.253 0.794 580.640761 Farm labor contractors 0.403 1.405 0.293 0.811 1,113.290762 Farm management services 0.100 2.321 0.039 0.437 27.96078 Landscape and horticultural services 0.407 0.602 0.823 0.530 0.470780 Landscape and horticultural services unallocated 0.407 0.602 0.823 0.530 0.4708 Forestry 0.724 NA 0.355 3.725 0.82081 Timber tracts 2.172 NA 0.887 7.449 2.410811 Timber tracts 2.172 NA 0.887 7.449 2.4109 Fishing, hunting, and trapping 3.620 NA 0.269 6.208 6.50091 Commercial fishing NA NA NA NA 7.040912 Finfish NA NA NA NA 9.39
MINING 0.034 0.074 0.041 1.490 0.3413 Oil and gas extraction 0.021 0.083 NA NA 0.68138 Oil and gas field services 0.021 0.167 NA NA 1.131382 Oil and gas exploration services NA NA NA NA 1.4114 Nonmetallic minerals, except fuels 0.052 0.072 0.027 0.993 0.32144 Sand and gravel NA 0.084 0.059 0.993 NA1442 Construction sand and gravel NA 0.084 0.059 0.993 NA
CONSTRUCTION 0.726 0.688 0.909 0.625 0.7815 General contractors and operative builder 0.985 0.899 1.081 1.190 1.34152 General building contractors 1.303 1.174 1.175 1.591 1.931521 General contractors-single-family houses 1.238 1.238 1.172 1.581 1.941522 General contractors-residential buildings, other than single-
family 4.549 0.695 1.217 1.704 1.80
154 General building contractors-nonresidental buildings 0.640 0.449 0.751 0.564 0.521541 General contractors-industrial buildings and warehouses 1.689 0.789 0.739 1.379 0.301542 General contractors-nonresidental buildings, other than
industrial buildings and warehouses 0.573 0.415 0.753 0.507 0.60
16 Heavy construction, ex. building 0.910 0.460 0.969 0.769 1.66161 Highway and street construction, except elevated highways 0.114 0.060 0.182 0.145 0.221611 Highway and street construction, except elevated highways 0.114 0.060 0.182 0.145 0.22162 Heavy construction, except highway 1.342 0.667 1.210 0.958 2.391623 Water, sewer, pipeline, and communications and power line
construction 1.841 0.601 1.932 0.938 2.05
1629 Heavy construction, not elsewhere classified 1.307 1.235 0.892 1.285 3.7617 Special trade contractors 0.604 0.653 0.818 0.469 0.57171 Plumbing, heating, air-conditioning 0.755 0.765 1.062 0.625 0.61

93
SIC DescriptionECR-Fresno
ECR-SanJoaquin
ECR-Madera
ECR-Stanislaus
ECR-SantaClara
1711 Plumbing, heating, and air-conditioning 0.755 0.765 1.062 0.625 0.61172 Painting and paper hanging 0.605 0.844 1.223 0.434 0.521721 Painting and paper hanging 0.605 0.844 1.223 0.434 0.52173 Electrical work 0.434 0.347 0.643 0.346 0.231731 Electrical work 0.434 0.347 0.643 0.346 0.23174 Masonry, stonework, and plastering 0.372 0.618 0.516 0.252 0.391741 Masonry and other stonework 0.186 0.384 0.455 0.196 0.551742 Plastering, drywall, and insulation 0.456 0.774 0.687 0.244 0.401743 Terrazzo, tile, marble, mosaic work 0.238 0.312 0.192 0.482 0.28175 Carpentry and floor work 0.215 0.208 0.279 0.116 0.221751 Carpentry work 0.257 0.340 0.400 0.122 0.371752 Floor laying and floor work, N. E. C. 0.095 0.053 0.084 0.086 0.05176 Roofing, siding, and sheet metal work 0.465 0.309 0.309 0.326 0.521761 Roofing, siding, and sheet metal work 0.465 0.309 0.309 0.326 0.52177 Concrete work 1.518 1.839 3.997 1.934 1.701771 Concrete work 1.518 1.839 3.997 1.934 1.70178 Water well drilling 0.396 1.874 0.236 0.360 1.311781 Water well drilling 0.396 1.874 0.236 0.360 1.31179 Misc. special trade contractors 0.509 0.539 0.663 0.433 0.821791 Structural steel erection 0.083 0.036 0.263 0.094 0.231793 Glass and glazing work 0.983 0.949 0.488 0.874 1.021794 Excavation work 1.314 2.469 1.947 2.726 4.011795 Wrecking and demolition work 1.267 1.499 NA 1.104 0.471796 Installing building equipment, N. E. C. 1.539 12.741 0.529 0.431 1.211799 Special trade contractors, N. E. C. 0.255 0.376 0.401 0.197 0.39
MANUFACTURING 2.314 1.537 2.021 1.157 0.7920 Food and kindred products 3.602 2.943 3.833 1.314 29.95201 Meat products 5.640 19.904 NA 2.987 124.822011 Meat packing plants 1.759 2.112 NA 5.001 69.032015 Poultry slaughtering and processing 6.267 611.386 NA 2.954 NA202 Dairy products 6.719 5.139 NA 1.810 52.262022 Cheese, natural and processed NA 3.492 NA 4.966 39.572023 Dry, condensed, evaporated products NA NA NA 3.196 NA2026 Fluid milk 1.194 92.186 NA 0.490 NA203 Preserved fruits and vegetables 3.676 2.195 4.294 1.254 26.492033 Canned fruits and vegetables 7.385 0.674 1.042 0.484 17.452034 Dehydrated fruits, vegetables, soups 0.479 123.514 4.348 0.502 4.092037 Frozen fruits and vegetables 7.448 7.418 NA 3.701 NA204 Grain mill products 0.864 0.089 0.265 0.137 5.572044 Rice milling NA 0.749 NA NA NA2048 Prepared feeds, N. E. C. 2.070 0.906 0.519 0.145 14.85205 Bakery products 0.028 0.046 0.443 1.862 0.112051 Bread, cake, and related products 0.043 0.050 0.443 1.862 0.17207 Fats and Oils 0.390 NA 0.113 0.174 7.632074 Cottonseed oil mills 8.870 NA 0.057 NA NA2075 Soybean oil mills NA NA NA NA 19.71208 Beverages 2.959 1.989 0.774 0.625 11.69

94
SIC DescriptionECR-Fresno
ECR-SanJoaquin
ECR-Madera
ECR-Stanislaus
ECR-SantaClara
2084 Wines, brandy, and brandy spirits 3.314 0.774 0.283 0.234 16.822086 Bottled and canned soft drinks 3.785 28.098 NA 3.956 14.19209 Misc. food and kindred products 0.217 1.093 0.699 0.125 2.862099 Food preparations, N. E. C. 0.285 1.257 0.699 0.757 4.6121 Tobacco products NA NA NA NA NA214 Tobacco stemming and redrying NA NA NA NA NA2141 Tobacco stemming and redrying NA NA NA NA NA22 Textile mill products 0.208 0.477 NA 1.242 3.53226 Textile finishing, except wool 3.942 NA NA 5.794 10.752261 Finishing plants, cotton 3.942 NA NA 5.794 13.9123 Apparel and other textile products 0.676 0.084 0.270 1.045 0.49233 Women's and misses' outerwear 2.027 1.713 0.131 2.483 0.622339 Women's and misses' outerwear, N. E. C. 6.758 1.713 0.131 2.483 0.67239 Misc. fabricated textile products 0.568 0.063 NA 0.876 0.532391 Curtains and draperies 3.379 0.343 NA 4.966 1.112394 Canvas and related products 1.193 1.713 NA 0.993 1.8524 Lumber and wood products 1.923 0.641 6.561 0.830 7.69241 Logging 3.425 NA 3.694 NA 24.842411 Logging 3.425 NA 3.694 NA 24.84243 Millwork, plywood & structural members 2.773 1.342 24.486 1.622 10.772431 Millwork 8.183 1.691 NA 9.644 37.422434 Wood kitchen cabinets 0.448 0.445 1.604 0.184 1.132439 Structural wood members, N. E. C. 0.102 0.200 NA 0.063 1.01244 Wood Containers 2.463 0.905 36.054 1.170 7.612448 Wood pallets and skids 3.964 1.279 NA 1.858 147.22245 Wood buildings and mobile homes 8.109 7.994 NA 0.035 33.792452 Prefabricated wood buildings NA NA NA 0.064 45.0525 Furniture and fixtures 0.452 0.114 10.639 0.278 0.71251 Household furniture 0.158 0.066 NA 0.182 0.712511 Wood household furniture 0.302 0.116 NA 0.198 1.63253 Public building & related furniture 5.068 NA NA 0.037 NA2531 Public building and related furniture 5.068 NA NA 0.037 NA254 Partitions and fixtures 1.545 0.155 7.388 1.052 1.602541 Wood partitions and fixtures 1.736 1.071 7.388 1.052 1.8326 Paper and allied products 1.014 0.405 0.529 0.297 1.89265 Paperboard containers and boxes 1.718 0.729 0.499 0.423 2.462653 Corrugated and solid fiber boxes 2.998 1.707 0.468 0.480 3.052655 Fiber cans, drums & similar products 3.899 NA NA NA 4.45267 Misc. converted paper products 0.178 0.180 NA 0.051 1.292673 Bags: plastics, laminated, & coated NA NA NA 8.277 NA27 Printing and publishing 2.664 2.732 2.078 2.284 2.09271 Newspapers 0.207 0.212 0.416 0.163 0.312711 Newspapers: publishing, or publishing and printing 0.207 0.212 0.416 0.163 0.31275 Commercial Printing 6.847 8.100 3.439 11.994 4.742752 Commercial printing, lithographic 0.196 0.366 0.155 0.457 0.182759 Commercial printing, N. E. C. 23.535 14.526 6.175 25.413 19.3028 Chemicals and allied products 0.777 0.292 18.618 1.125 0.21

95
SIC DescriptionECR-Fresno
ECR-SanJoaquin
ECR-Madera
ECR-Stanislaus
ECR-SantaClara
283 Drugs 2.957 NA NA 0.259 0.032836 Biological products exc. diagnostic 17.739 NA NA 2.483 0.45284 Soap, cleaners, and toilet goods 0.651 0.304 NA 1.053 0.382841 Soap and other detergents 70.957 0.591 NA NA 0.45287 Agricultural chemicals 1.067 0.232 8.275 4.966 5.772873 Nitrogenous fertilizers 1.203 NA 4.137 4.966 29.572875 Fertilizers, mixing only 70.957 0.291 NA 4.966 3.58289 Miscellaneous chemical products NA NA NA 3.160 0.892893 Printing ink NA NA NA NA 26.2830 Rubber and misc. plastics products 1.812 0.524 1.177 0.979 1.04308 Miscellaneous plastics products, N. E. C. 2.121 0.665 1.198 1.502 1.193081 Unsupported plastics film & sheet 33.328 NA NA NA 83.323089 Plastics products, N. E. C. 0.206 0.076 0.296 0.206 0.0931 Leather and leather products 1.132 8.994 NA 5.794 14.78317 Handbags and personal leather goods NA NA NA NA 44.353172 Personal leather goods, N. E. C. NA NA NA NA 70.9632 Stone, clay, and glass products 0.604 0.297 0.127 0.293 0.85327 Concrete, gypsum, and plaster products 1.494 0.678 1.217 2.431 2.863272 Concrete products, N. E. C. 0.185 0.022 NA 0.438 0.143273 Ready-mixed concrete 2.018 2.347 1.191 2.743 5.5534 Fabricated metal products 1.099 0.620 2.422 0.481 0.86341 Metal cans and shipping containers 25.342 3.362 NA 0.412 2,027.343411 Metal cans 7.603 1.009 NA 0.123 608.203412 Metal barrels, drums, and pails NA NA NA NA NA344 Fabricated structural metal products 0.587 0.382 1.289 0.436 1.443444 Sheet metalwork 2.836 4.104 13.890 1.542 2.163446 Architectural metal work 0.649 2.180 0.315 3.973 1.61345 Screw machine products, bolts, etc. NA NA NA 3.524 3.443451 Screw machine products NA NA NA 3.524 4.06347 Metal services, N. E. C. 0.094 0.052 0.088 0.552 0.033471 Plating and polishing 0.107 0.176 NA 1.104 0.04349 Misc. fabricated metal products 9.934 1.180 NA 2.863 3.653496 Misc. fabricated wire products 5.068 1.713 NA 0.764 0.783499 Fabricated metal products, N. E. C. 10.357 7.045 NA 6.865 23.3535 Industrial machinery and equipment 0.335 0.613 0.179 0.333 0.05352 Farm and garden machinery 4.575 4.059 1.825 2.241 NA3523 Farm machinery and equipment 4.670 4.059 1.825 2.241 NA353 Construction and related machinery 0.126 0.185 0.158 0.805 0.733535 Conveyors and conveying equipment NA 0.418 NA 0.903 0.89354 Metalworking machinery 1.014 0.127 0.887 0.088 0.083545 Machine tool accessories NA NA 0.887 1.064 0.30355 Special industry machinery 0.091 0.078 0.019 0.170 0.013552 Textile machinery NA NA NA NA 50.683556 Food products machinery 0.044 0.031 0.008 0.068 0.65359 Industrial machinery, N. E. C. 0.163 0.123 0.854 0.039 0.033599 Industrial machinery, N. E. C. 0.237 0.125 0.854 0.094 0.0336 Electronic & other electroc equipment 4.396 1.930 157.023 7.582 0.15

96
SIC DescriptionECR-Fresno
ECR-SanJoaquin
ECR-Madera
ECR-Stanislaus
ECR-SantaClara
364 Electric lighting and wiring equipment 373.931 995.305 NA NA 73.803648 Lighting equipment, N. E. C. 373.931 NA NA NA 172.58367 Electronic components and accessories 96.299 0.380 26.203 4.403 0.033679 Electronic components, N. E. C. 224.697 4.480 NA 4.651 0.1737 Transportation equipment 4.480 1.704 4.145 5.110 0.67371 Motor vehicles and equipment 2.996 0.782 1.765 2.349 13.413713 Truck and bus bodies 3.757 3.564 NA 4.601 56.023714 Motor vehicle parts and accessories 2.734 0.614 1.065 6.300 9.723715 Truck trailers 3.421 0.547 NA 0.459 NA372 Aircraft and parts 3.620 0.999 NA NA 1.383721 Aircraft 25.342 NA NA NA 9.39373 Ship and boat building and repairing 12.543 26.232 NA 101.391 188.143731 Ship building and repairing 20.273 NA NA 1.655 22.533732 Boat building and repairing 12.464 25.803 NA NA 214.29379 Miscellaneous transportation equipment 2.512 6.995 NA 10.696 0.523792 Travel trailers and campers 268.622 13.241 NA NA 42.643799 Transportation equipment, N. E. C. 0.136 NA NA 0.573 0.6738 Instruments and related products 0.273 0.413 NA 0.316 0.01381 Search and navigation equipment 10.644 NA NA 17.381 0.043812 Search and navigation equipment 10.644 NA NA 17.381 0.04385 Ophthalmic goods 0.788 NA NA 0.319 1.733851 Ophthalmic goods 0.788 NA NA 0.319 1.7339 Miscellaneous manufacturing industries 0.507 0.464 1.182 1.324 0.99399 Miscellaneous manufactures 2.426 0.517 16.549 2.075 1.633993 Signs and advertising specialties 0.898 0.208 NA 0.621 0.973999 Manufacturing industries, N. E. C. 11.204 2.469 24.824 8.691 2.18
TRANSPORTATION AND PUBLIC UTILITIES 0.880 0.575 1.120 1.022 1.3141 Local and interurban passenger transit 1.454 1.451 1.581 1.121 2.02411 Local and suburban transportation 0.680 1.012 0.580 0.632 0.864119 Local passenger transportation, N. E. C. 0.685 1.288 0.580 0.746 1.03412 Taxicabs 0.278 0.999 0.158 0.187 0.594121 Taxicabs 0.278 0.999 0.158 0.187 0.59414 Bus charter service 3.765 1.344 NA 1.218 1.744141 Local bus charter service 8.785 NA NA 1.218 2.57415 School buses 3.070 2.004 NA 2.256 6.584151 School buses 3.070 2.004 NA 2.256 6.5842 Trucking and warehousing 1.041 0.410 1.121 0.916 2.24421 Trucking & courier services, ex. air 1.159 0.522 1.092 1.065 2.334212 Local Trucking without Storage 1.247 0.601 1.202 1.148 4.334213 Trucking, except local 1.171 0.515 1.117 1.021 2.054214 Local Trucking with Storage 0.386 0.112 0.099 0.424 0.174215 Courier Services, except Air 0.346 0.116 NA 0.514 0.23422 Public warehousing and storage 0.265 0.052 8.275 0.159 1.004221 Farm product warehousing and storage 0.380 0.281 NA 0.596 NA4222 Refrigerated warehousing and storage 0.207 0.273 1.773 0.057 2.534225 General warehousing and storage 0.292 0.036 NA 0.330 0.7644 Water transportation 0.845 0.042 NA 0.828 8.45

97
SIC DescriptionECR-Fresno
ECR-SanJoaquin
ECR-Madera
ECR-Stanislaus
ECR-SantaClara
441 Deep sea foreign trans. of freight NA NA NA NA NA4412 Deep sea foreign transportation of freight NA NA NA NA NA45 Transportation by air 0.325 0.612 6.502 0.700 0.33451 Air transportation, scheduled 0.292 0.513 NA 0.614 0.264512 Air transportation, scheduled 0.287 0.504 NA 0.604 0.384513 Air courier services 0.287 0.506 NA 0.605 0.18458 Airports, flying fields, & services 0.760 1.308 3.546 4.257 1.244581 Airports, flying fields, and airport terminal services 0.760 1.308 3.546 4.257 1.2446 Pipelines, except natural gas 0.845 0.857 NA NA 11.26461 Pipelines, except natural gas 0.845 0.857 NA NA 11.264619 Pipelines, N. E. C. NA NA NA NA NA47 Transportation services 0.281 0.293 1.108 0.369 0.27472 Passenger transportation arrangement 0.357 0.370 0.802 0.445 0.154724 Travel agencies 0.396 0.398 0.802 0.507 0.20478 Miscellaneous transportation services 0.794 0.506 3.842 0.609 5.944783 Packing and crating 1.448 0.929 NA 1.188 15.494785 Fixed facilities and inspection and weighing services for
motor vehicle transpirationNA NA NA 1.064 8.45
48 Communication 0.853 1.089 0.952 1.202 1.05481 Telephone communication 0.659 0.683 0.431 0.872 0.684812 Radiotelephone communications 1.163 0.950 2.299 1.369 1.114813 Telephone communications, exc. radio 0.538 0.594 0.302 0.733 0.57483 Radio and television broadcasting 0.356 1.429 2.503 0.553 1.574832 Radio broadcasting stations 0.931 1.429 2.503 1.090 2.97484 Cable and other pay TV services 4.683 1.853 11.164 3.703 1.734841 Cable and other pay television services 4.683 1.853 11.164 3.703 1.73489 Communication services, N. E. C. 1.578 4.026 NA NA 2.314899 Communications services, N. E. C. 1.578 4.026 NA NA 2.3149 Electric, gas, and sanitary services 0.953 0.853 0.966 1.676 1.67491 Electric services 0.416 0.647 0.722 3.902 1.824911 Electric services 0.416 0.647 0.722 3.902 1.82492 Gas production and distribution NA 0.500 NA NA NA4922 Natural gas transmission NA NA NA NA NA493 Combination utility services 1.242 2.091 3.353 3.157 3.554932 Gas and other services combined 1.397 35.375 3.353 104.642 622.98494 Water supply 0.375 0.016 0.045 0.993 0.064941 Water supply 0.375 0.016 0.045 0.993 0.06495 Sanitary services 0.400 0.312 0.175 0.337 0.434953 Refuse systems 0.391 0.305 0.149 0.328 0.444959 Sanitary services, N. E. C. 0.384 0.300 NA 0.327 0.32497 Irrigation systems 0.817 1.666 2.955 NA 16.894971 Irrigation systems 0.817 1.666 2.955 NA 16.89
WHOLESALE TRADE 0.630 0.603 1.027 0.712 0.5350 Wholesale trade - durable goods 0.470 0.508 0.658 0.627 0.25501 Motor vehicles, parts, and supplies 0.373 0.563 5.319 0.677 1.075012 Automobiles and other motor vehicles 0.130 0.121 2.561 0.566 1.475013 Motor vehicle supplies and new parts 0.518 0.929 10.491 0.549 0.76

98
SIC DescriptionECR-Fresno
ECR-SanJoaquin
ECR-Madera
ECR-Stanislaus
ECR-SantaClara
5014 Tires and tubes 0.370 1.344 NA 1.076 3.145015 Motor vehicle parts, used 0.457 0.988 2.533 1.433 2.61502 Furniture and homefurnishings 0.296 0.617 0.591 0.316 0.085023 Homefurnishings 0.696 1.049 NA 1.580 0.22503 Lumber and construction materials 0.178 0.103 0.086 0.239 0.245031 Lumber, plywood, and millwork 0.150 0.143 0.414 0.348 0.175032 Brick, stone, & related materials 0.616 0.509 0.069 0.447 1.27504 Professional & commercial equipment 0.762 1.087 1.158 1.139 0.155044 Office equipment 1.515 2.228 NA 2.186 0.805045 Computers, peripherals & software 0.856 1.982 0.659 1.467 0.065046 Commercial equipment, N. E. C. 0.749 0.847 NA 2.306 0.725047 Medical and hospital equipment 0.186 0.232 0.384 0.234 0.20505 Metals and minerals, except petroleum 0.057 0.038 0.050 0.120 0.135051 Metals service centers and offices 0.057 0.038 0.050 0.120 0.13506 Electrical goods 0.308 0.233 1.046 0.279 0.025063 Electrical apparatus and equipment 0.431 0.225 1.435 0.364 0.145065 Electronic parts and equipment 0.358 0.382 0.591 0.217 0.01507 Hardware, plumbing & heating equipment 0.406 0.641 0.876 0.424 0.535072 Hardware 0.470 0.488 NA 1.337 0.395074 Plumbing & hydronic heating supplies 0.741 0.882 1.137 0.369 1.185075 Warm air heating & air-conditioning 0.030 0.273 0.045 0.083 0.06508 Machinery, equipment, and supplies 0.682 0.679 0.898 0.792 1.635083 Farm and garden machinery 1.523 1.381 0.843 1.747 74.925084 Industrial machinery and equipment 0.378 0.465 1.248 0.362 0.425085 Industrial supplies 0.502 0.295 1.182 0.399 0.815087 Service establishment equipment 0.201 0.316 0.657 0.243 0.34509 Miscellaneous durable goods 0.174 0.196 0.100 0.222 0.155091 Sporting & recreational goods 0.317 0.666 NA 0.709 0.095092 Toys and hobby goods and supplies 2.534 0.346 NA 0.213 0.285093 Scrap and waste materials 0.151 0.286 0.084 0.284 0.2751 Wholesale trade - nondurable goods 0.801 0.683 1.573 0.778 1.61511 Paper and paper products 0.686 0.666 0.637 0.589 0.515112 Stationery and office supplies 2.042 2.998 1.228 0.753 2.615113 Industrial & personal service paper 0.038 0.032 0.045 0.083 0.03512 Drugs, proprietaries, and sundries 0.118 0.130 0.169 0.552 0.055122 Drugs, proprietaries, and sundries 0.118 0.130 0.169 0.552 0.05513 Apparel, piece goods, and notions 1.359 0.948 1.682 0.753 1.175131 Piece goods & notions 1.798 10.992 0.500 NA 1.745136 Men's and boys' clothing 0.724 0.375 NA NA 1.785137 Women's and children's clothing 6.195 10.992 NA 0.683 0.79514 Groceries and related products 0.959 0.711 5.328 1.081 2.575141 Groceries, general line 3.884 0.506 7.895 1.067 4.495143 Dairy products, exc. dried or canned 1.448 1.285 5.319 0.115 7.805145 Confectionery 4.666 3.161 3.546 5.611 20.705147 Meats and meat products 0.942 2.213 NA 1.140 3.445148 Fresh fruits and vegetables 0.450 1.234 5.319 34.762 2.655149 Groceries and related products, N. E. C. 0.349 0.241 4.630 0.567 0.48

99
SIC DescriptionECR-Fresno
ECR-SanJoaquin
ECR-Madera
ECR-Stanislaus
ECR-SantaClara
515 Farm-product raw materials 2.235 1.711 0.896 0.792 63.035153 Grain and field beans 0.275 0.136 0.090 0.226 3.525154 Livestock 11.150 15.220 1.345 1.251 NA5159 Farm-product raw materials, N. E. C. 1.345 1.658 7.684 0.547 219.63516 Chemicals and allied products 0.144 0.255 NA 0.248 0.055169 Chemicals & allied products, N. E. C. 0.169 0.307 NA 0.382 0.07517 Petroleum and petroleum products 1.652 2.135 1.384 0.825 3.925171 Petroleum bulk stations & terminals 1.183 1.332 NA 0.638 2.775172 Petroleum products, N. E. C. 2.008 2.950 0.949 0.953 4.84518 Beer, wine, and distilled beverages 0.218 0.112 0.909 0.294 0.605181 Beer and ale 0.314 0.201 NA 0.464 0.73519 Misc. nondurable goods 0.431 0.556 0.560 0.430 1.035191 Farm supplies 0.362 0.685 0.692 0.433 5.945192 Books, periodicals, & newspapers 0.634 2.248 NA 0.092 0.175193 Flowers & florists' supplies 0.434 0.108 0.154 1.242 0.345198 Paints, varnishes, and supplies 0.245 0.184 NA 0.287 0.405199 Nondurable goods, N. E. C. 0.702 0.705 0.493 0.910 0.56
RETAIL TRADE 1.059 0.950 1.268 0.896 1.3252 Building materials & garden supplies 0.954 0.620 1.090 0.665 1.38521 Lumber and other building materials 0.694 0.429 0.852 0.438 0.825211 Lumber and other building materials 0.694 0.429 0.852 0.438 0.82523 Paint, glass, and wallpaper stores 1.151 1.204 1.852 1.269 2.705231 Paint, glass, and wallpaper stores 1.151 1.204 1.852 1.269 2.70525 Hardware stores 1.579 1.316 1.303 1.580 5.295251 Hardware stores 1.579 1.316 1.303 1.580 5.29526 Retail nurseries and garden stores 1.517 0.574 2.203 0.697 1.655261 Retail nurseries and garden stores 1.517 0.574 2.203 0.697 1.6553 General merchandise stores 1.285 1.061 1.384 1.038 2.27531 Department stores 1.245 1.085 1.311 1.037 2.225311 Department stores 1.245 1.085 1.311 1.037 2.22533 Variety stores 1.118 0.511 4.433 0.548 2.005331 Variety stores 1.118 0.511 4.433 0.548 2.00539 Misc. general merchandise stores 2.613 1.071 3.477 1.444 3.545399 Misc. general merchandise stores 2.613 1.071 3.477 1.444 3.5454 Food stores 1.201 1.066 0.960 0.870 1.64541 Grocery stores 1.292 1.099 0.965 1.023 1.865411 Grocery stores 1.292 1.099 0.965 1.023 1.86542 Meat and fish markets 0.406 0.375 0.558 0.741 1.275421 Meat and fish markets 0.406 0.375 0.558 0.741 1.27543 Fruit and vegetable markets 4.608 1.249 NA 1.129 0.795431 Fruit and vegetable markets 4.608 1.249 NA 1.129 0.79544 Candy, nut, and confectionery stores 0.342 0.500 0.084 0.089 0.375441 Candy, nut, and confectionery stores 0.342 0.500 0.084 0.089 0.37546 Retail bakeries 0.658 1.117 2.533 0.322 0.655461 Retail bakeries 0.658 1.117 2.533 0.322 0.65549 Miscellaneous food stores 1.001 1.347 1.409 0.531 0.725499 Miscellaneous food stores 1.001 1.347 1.409 0.531 0.72

100
SIC DescriptionECR-Fresno
ECR-SanJoaquin
ECR-Madera
ECR-Stanislaus
ECR-SantaClara
55 Automotive dealers & service stations 1.312 1.171 1.470 1.203 2.15551 New and used car dealers 1.303 1.149 1.745 1.096 1.605511 New and used car dealers 1.303 1.149 1.745 1.096 1.60552 Used car dealers 1.107 1.055 1.321 1.085 5.065521 Used car dealers 1.107 1.055 1.321 1.085 5.06553 Auto and home supply stores 1.126 1.001 1.285 1.032 2.585531 Auto and home supply stores 1.126 1.001 1.285 1.032 2.58554 Gasoline service stations 1.886 1.542 1.351 1.934 3.265541 Gasoline service stations 1.886 1.542 1.351 1.934 3.26555 Boat dealers 0.422 0.147 0.177 0.138 0.635551 Boat dealers 0.422 0.147 0.177 0.138 0.63556 Recreational vehicle dealers 0.110 0.185 NA 0.164 0.685561 Recreational vehicle dealers 0.110 0.185 NA 0.164 0.68557 Motorcycle dealers 3.801 1.101 3.546 0.638 1.505571 Motorcycle dealers 3.801 1.101 3.546 0.638 1.50559 Automotive dealers, N. E. C. 0.106 0.749 NA 0.828 1.155599 Automotive dealers, N. E. C. 0.106 0.749 NA 0.828 1.1556 Apparel and accessory stores 0.538 0.547 1.576 0.542 0.41561 Men's & boys' clothing stores 0.056 0.030 0.148 0.028 0.045611 Men's and boys' clothing stores 0.056 0.030 0.148 0.028 0.04562 Women's clothing stores 0.403 0.400 0.946 0.441 0.345621 Women's clothing stores 0.403 0.400 0.946 0.441 0.34563 Women's accessory & specialty stores 0.600 1.620 NA 1.155 1.275632 Women's accessory and specialty stores 0.600 1.620 NA 1.155 1.27564 Children's and infants' wear stores 0.069 0.071 NA 0.055 0.095641 Children's and infants' wear stores 0.069 0.071 NA 0.055 0.09565 Family clothing stores 0.521 0.582 1.119 0.612 0.265651 Family clothing stores 0.521 0.582 1.119 0.612 0.26566 Shoe stores 0.683 0.619 1.565 0.579 0.705661 Shoe stores 0.683 0.619 1.565 0.579 0.70569 Misc. apparel & accessory stores 1.096 0.979 NA 0.993 0.925699 Misc. apparel and accessory stores 1.096 0.979 NA 0.993 0.9257 Furniture and homefurnishings stores 0.798 0.808 1.414 0.799 0.59571 Furniture and homefurnishings stores 0.748 0.804 1.282 0.683 0.985712 Furniture stores 1.048 1.421 2.085 0.874 1.575713 Floor covering stores 0.456 0.245 0.626 0.302 1.005714 Drapery and upholstery stores 0.169 0.300 0.591 0.261 0.435719 Misc. homefurnishings stores 0.210 0.318 0.259 0.543 0.13572 Household appliance stores 1.555 1.173 2.280 1.176 1.785722 Household appliance stores 1.555 1.173 2.280 1.176 1.78573 Radio, television, & computer stores 0.710 0.716 1.365 0.857 0.335731 Radio, TV, & electronic stores 0.920 1.291 1.056 1.027 0.625734 Computer and software stores 0.375 0.296 2.512 0.879 0.095735 Record & prerecorded tape stores 0.680 0.540 5.911 0.662 0.495736 Musical instrument stores 0.461 0.333 1.773 0.355 0.3458 Eating and drinking places 1.017 0.964 1.308 0.902 1.21581 Eating and drinking places 1.017 0.964 1.308 0.902 1.21

101
SIC DescriptionECR-Fresno
ECR-SanJoaquin
ECR-Madera
ECR-Stanislaus
ECR-SantaClara
5810 Eating and drinking places unallocated 1.017 0.964 1.308 0.902 1.2159 Miscellaneous retail 0.813 0.733 1.320 0.683 0.91591 Drug stores and proprietary stores 0.968 0.909 1.162 0.768 1.625912 Drug stores and proprietary stores 0.968 0.909 1.162 0.768 1.62592 Liquor stores 0.909 0.999 0.985 1.315 1.495921 Liquor stores 0.909 0.999 0.985 1.315 1.49593 Used merchandise stores 1.213 0.803 NA 0.621 1.565932 Used merchandise stores 1.213 0.803 NA 0.621 1.56594 Miscellaneous shopping goods stores 0.799 0.646 1.919 0.695 0.665941 Sporting goods and bicycle shops 0.702 0.619 1.371 0.571 0.545942 Book stores 0.503 0.639 3.842 0.286 0.175943 Stationery stores 0.916 1.336 7.599 2.352 1.205944 Jewelry stores 0.917 0.869 1.507 0.513 1.585945 Hobby, toy, and game shops 0.991 0.331 NA 0.676 0.735946 Camera & photographic supply stores 0.380 0.243 0.887 0.298 0.175947 Gift, novelty, and souvenir shops 0.397 0.307 0.365 0.470 0.265949 Sewing, needlework, and piece goods 1.738 1.300 10.639 0.894 2.05596 Nonstore retailers 0.438 0.736 5.516 0.470 0.395962 Merchandising machine operators 0.784 2.051 NA 0.497 1.345963 Direct selling establishments 0.402 0.517 NA 0.846 0.45598 Fuel dealers 1.065 0.813 0.323 1.895 18.155983 Fuel oil dealers 3.379 NA NA NA NA5984 Liquefied petroleum gas dealers 0.946 1.071 0.279 2.299 15.645989 Fuel dealers, N. E. C. 10.137 0.162 NA 0.451 NA599 Retail stores, N. E. C. 0.537 0.516 1.102 0.428 0.585992 Florists 0.617 0.657 0.556 0.516 1.015993 Tobacco stores and stands 0.350 0.461 1.182 0.138 0.805995 Optical goods stores 1.163 1.076 1.655 0.610 0.855999 Miscellaneous retail stores, N. E. C. 0.463 0.450 1.929 0.424 0.45
FINANCE, INSURANCE, AND REAL ESTATE 0.877 0.787 2.192 1.270 1.2660 Depository institutions 1.217 0.744 2.242 1.188 1.49602 Commercial banks 1.236 0.920 1.966 1.134 1.546021 National commercial banks 0.570 0.816 0.943 0.661 0.626022 State commercial banks 2.744 0.980 4.012 1.712 5.20603 Savings institutions 0.843 0.209 1.334 0.716 1.056035 Savings institutions, Federally chartered 0.845 0.209 1.313 0.629 1.076036 Savings institutions, not Federally chartered 0.841 0.208 1.356 0.835 1.04606 Credit unions 1.704 2.275 NA 2.819 2.166061 Credit unions, Federally chartered 6.978 5.696 NA 2.359 2.276062 Credit unions, not Federally chartered 0.747 1.127 NA 4.214 1.99609 Functions closely related to banking 0.331 0.999 0.443 0.426 0.316099 Functions related to depository banking, N. E. C. 0.331 0.999 0.443 0.426 0.3661 Nondepository institutions 0.472 0.621 2.734 0.476 0.65611 Federal & Fed.-sponsored credit 0.384 0.319 NA 0.376 7.046111 Federal and Fed.-sponsored credit 0.384 0.319 NA 0.376 7.04614 Personal credit institutions 0.626 0.908 1.970 1.049 1.276141 Personal credit institutions 0.626 0.908 1.970 1.049 1.27
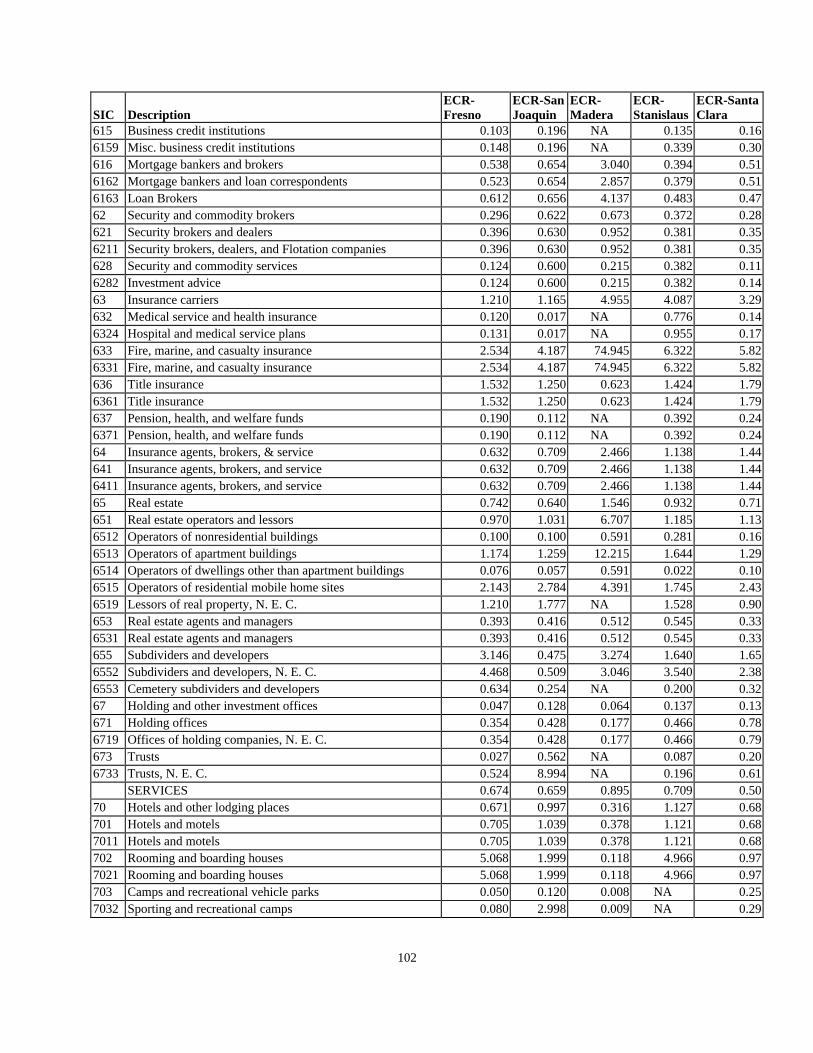
102
SIC DescriptionECR-Fresno
ECR-SanJoaquin
ECR-Madera
ECR-Stanislaus
ECR-SantaClara
615 Business credit institutions 0.103 0.196 NA 0.135 0.166159 Misc. business credit institutions 0.148 0.196 NA 0.339 0.30616 Mortgage bankers and brokers 0.538 0.654 3.040 0.394 0.516162 Mortgage bankers and loan correspondents 0.523 0.654 2.857 0.379 0.516163 Loan Brokers 0.612 0.656 4.137 0.483 0.4762 Security and commodity brokers 0.296 0.622 0.673 0.372 0.28621 Security brokers and dealers 0.396 0.630 0.952 0.381 0.356211 Security brokers, dealers, and Flotation companies 0.396 0.630 0.952 0.381 0.35628 Security and commodity services 0.124 0.600 0.215 0.382 0.116282 Investment advice 0.124 0.600 0.215 0.382 0.1463 Insurance carriers 1.210 1.165 4.955 4.087 3.29632 Medical service and health insurance 0.120 0.017 NA 0.776 0.146324 Hospital and medical service plans 0.131 0.017 NA 0.955 0.17633 Fire, marine, and casualty insurance 2.534 4.187 74.945 6.322 5.826331 Fire, marine, and casualty insurance 2.534 4.187 74.945 6.322 5.82636 Title insurance 1.532 1.250 0.623 1.424 1.796361 Title insurance 1.532 1.250 0.623 1.424 1.79637 Pension, health, and welfare funds 0.190 0.112 NA 0.392 0.246371 Pension, health, and welfare funds 0.190 0.112 NA 0.392 0.2464 Insurance agents, brokers, & service 0.632 0.709 2.466 1.138 1.44641 Insurance agents, brokers, and service 0.632 0.709 2.466 1.138 1.446411 Insurance agents, brokers, and service 0.632 0.709 2.466 1.138 1.4465 Real estate 0.742 0.640 1.546 0.932 0.71651 Real estate operators and lessors 0.970 1.031 6.707 1.185 1.136512 Operators of nonresidential buildings 0.100 0.100 0.591 0.281 0.166513 Operators of apartment buildings 1.174 1.259 12.215 1.644 1.296514 Operators of dwellings other than apartment buildings 0.076 0.057 0.591 0.022 0.106515 Operators of residential mobile home sites 2.143 2.784 4.391 1.745 2.436519 Lessors of real property, N. E. C. 1.210 1.777 NA 1.528 0.90653 Real estate agents and managers 0.393 0.416 0.512 0.545 0.336531 Real estate agents and managers 0.393 0.416 0.512 0.545 0.33655 Subdividers and developers 3.146 0.475 3.274 1.640 1.656552 Subdividers and developers, N. E. C. 4.468 0.509 3.046 3.540 2.386553 Cemetery subdividers and developers 0.634 0.254 NA 0.200 0.3267 Holding and other investment offices 0.047 0.128 0.064 0.137 0.13671 Holding offices 0.354 0.428 0.177 0.466 0.786719 Offices of holding companies, N. E. C. 0.354 0.428 0.177 0.466 0.79673 Trusts 0.027 0.562 NA 0.087 0.206733 Trusts, N. E. C. 0.524 8.994 NA 0.196 0.61
SERVICES 0.674 0.659 0.895 0.709 0.5070 Hotels and other lodging places 0.671 0.997 0.316 1.127 0.68701 Hotels and motels 0.705 1.039 0.378 1.121 0.687011 Hotels and motels 0.705 1.039 0.378 1.121 0.68702 Rooming and boarding houses 5.068 1.999 0.118 4.966 0.977021 Rooming and boarding houses 5.068 1.999 0.118 4.966 0.97703 Camps and recreational vehicle parks 0.050 0.120 0.008 NA 0.257032 Sporting and recreational camps 0.080 2.998 0.009 NA 0.29
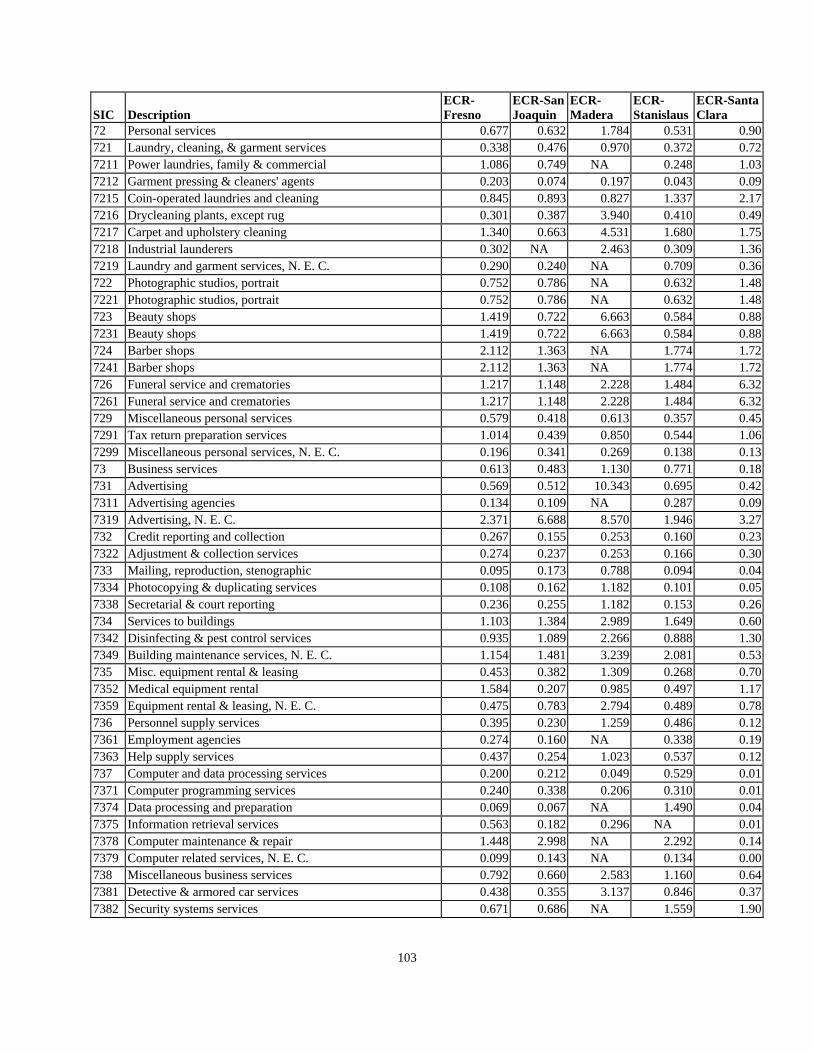
103
SIC DescriptionECR-Fresno
ECR-SanJoaquin
ECR-Madera
ECR-Stanislaus
ECR-SantaClara
72 Personal services 0.677 0.632 1.784 0.531 0.90721 Laundry, cleaning, & garment services 0.338 0.476 0.970 0.372 0.727211 Power laundries, family & commercial 1.086 0.749 NA 0.248 1.037212 Garment pressing & cleaners' agents 0.203 0.074 0.197 0.043 0.097215 Coin-operated laundries and cleaning 0.845 0.893 0.827 1.337 2.177216 Drycleaning plants, except rug 0.301 0.387 3.940 0.410 0.497217 Carpet and upholstery cleaning 1.340 0.663 4.531 1.680 1.757218 Industrial launderers 0.302 NA 2.463 0.309 1.367219 Laundry and garment services, N. E. C. 0.290 0.240 NA 0.709 0.36722 Photographic studios, portrait 0.752 0.786 NA 0.632 1.487221 Photographic studios, portrait 0.752 0.786 NA 0.632 1.48723 Beauty shops 1.419 0.722 6.663 0.584 0.887231 Beauty shops 1.419 0.722 6.663 0.584 0.88724 Barber shops 2.112 1.363 NA 1.774 1.727241 Barber shops 2.112 1.363 NA 1.774 1.72726 Funeral service and crematories 1.217 1.148 2.228 1.484 6.327261 Funeral service and crematories 1.217 1.148 2.228 1.484 6.32729 Miscellaneous personal services 0.579 0.418 0.613 0.357 0.457291 Tax return preparation services 1.014 0.439 0.850 0.544 1.067299 Miscellaneous personal services, N. E. C. 0.196 0.341 0.269 0.138 0.1373 Business services 0.613 0.483 1.130 0.771 0.18731 Advertising 0.569 0.512 10.343 0.695 0.427311 Advertising agencies 0.134 0.109 NA 0.287 0.097319 Advertising, N. E. C. 2.371 6.688 8.570 1.946 3.27732 Credit reporting and collection 0.267 0.155 0.253 0.160 0.237322 Adjustment & collection services 0.274 0.237 0.253 0.166 0.30733 Mailing, reproduction, stenographic 0.095 0.173 0.788 0.094 0.047334 Photocopying & duplicating services 0.108 0.162 1.182 0.101 0.057338 Secretarial & court reporting 0.236 0.255 1.182 0.153 0.26734 Services to buildings 1.103 1.384 2.989 1.649 0.607342 Disinfecting & pest control services 0.935 1.089 2.266 0.888 1.307349 Building maintenance services, N. E. C. 1.154 1.481 3.239 2.081 0.53735 Misc. equipment rental & leasing 0.453 0.382 1.309 0.268 0.707352 Medical equipment rental 1.584 0.207 0.985 0.497 1.177359 Equipment rental & leasing, N. E. C. 0.475 0.783 2.794 0.489 0.78736 Personnel supply services 0.395 0.230 1.259 0.486 0.127361 Employment agencies 0.274 0.160 NA 0.338 0.197363 Help supply services 0.437 0.254 1.023 0.537 0.12737 Computer and data processing services 0.200 0.212 0.049 0.529 0.017371 Computer programming services 0.240 0.338 0.206 0.310 0.017374 Data processing and preparation 0.069 0.067 NA 1.490 0.047375 Information retrieval services 0.563 0.182 0.296 NA 0.017378 Computer maintenance & repair 1.448 2.998 NA 2.292 0.147379 Computer related services, N. E. C. 0.099 0.143 NA 0.134 0.00738 Miscellaneous business services 0.792 0.660 2.583 1.160 0.647381 Detective & armored car services 0.438 0.355 3.137 0.846 0.377382 Security systems services 0.671 0.686 NA 1.559 1.90

104
SIC DescriptionECR-Fresno
ECR-SanJoaquin
ECR-Madera
ECR-Stanislaus
ECR-SantaClara
7384 Photofinishing laboratories 0.220 0.031 0.089 2.483 0.117389 Business services, N. E. C. 1.170 1.233 2.824 1.304 0.8675 Auto repair, services, and parking 1.009 0.896 1.602 0.981 1.24751 Automotive rentals, no drivers 0.214 0.613 0.626 0.771 0.237513 Truck rental and leasing, no drivers 1.734 0.886 NA 0.807 1.417519 Utility trailer rental 0.441 1.799 NA 2.483 1.69753 Automotive repair shops 1.078 0.839 1.207 0.916 1.427532 Top & body repair & paint shops 1.243 1.099 1.300 1.268 1.467533 Auto exhaust system repair shops 2.204 1.666 1.970 2.069 2.567534 Tire retreading and repair shops 12.671 0.908 NA 0.497 8.897536 Automotive glass replacement shops 5.544 2.018 3.448 2.483 8.457537 Automotive transmission repair shops 0.757 1.257 0.404 0.367 1.577538 General automotive repair shops 0.654 0.456 0.770 0.595 0.817539 Automotive repair shops, N. E. C. 1.074 1.014 3.021 1.078 2.35754 Automotive services, except repair 1.482 1.063 5.373 1.160 1.817542 Carwashes 1.185 0.902 6.896 0.899 1.727549 Automotive services, N. E. C. 2.049 1.325 4.319 1.709 1.9176 Miscellaneous repair services 0.334 0.345 0.794 0.319 0.62762 Electrical repair shops 0.352 0.958 3.665 0.658 0.587622 Radio and television repair 0.541 1.845 NA 0.903 0.887623 Refrigeration service and repair 0.885 0.999 3.251 0.546 4.047629 Electrical repair shops, N. E. C. 0.197 0.719 3.546 0.662 0.29763 Watch, clock, and jewelry repair 5.913 6.995 NA NA 7.637631 Watch, clock, and jewelry repair 5.913 6.995 NA NA 7.63764 Reupholstery and furniture repair 0.245 0.473 0.253 0.621 0.367641 Reupholstery and furniture repair 0.245 0.473 0.253 0.621 0.36769 Miscellaneous repair shops 0.252 0.191 0.451 0.182 0.517692 Welding repair 1.334 0.405 0.269 0.642 1.227694 Armature rewinding shops 1.193 0.774 4.728 0.355 4.227699 Repair services, N. E. C. 0.128 0.110 0.535 0.103 0.2878 Motion pictures 0.863 0.836 0.524 0.884 0.77783 Motion picture theaters 1.108 1.288 0.555 1.377 1.007832 Motion picture theaters, ex drive-in 1.108 1.288 1.093 2.524 1.20784 Video tape rental 0.770 0.648 0.604 0.637 0.797841 Video tape rental 0.770 0.648 0.604 0.637 0.7979 Amusement & recreation services 0.422 0.484 0.900 0.506 0.46792 Producers, orchestras, entertainers 0.441 0.255 0.887 0.432 0.217929 Entertainers & entertainment groups 1.170 0.330 0.887 0.784 0.59793 Bowling centers 2.021 1.366 NA 1.270 2.947933 Bowling centers 2.021 1.366 NA 1.270 2.94794 Commercial sports 0.197 0.428 3.546 2.292 0.507948 Racing, including track operation 0.258 1.058 3.546 5.959 13.52799 Misc. amusement, recreation services 0.365 0.427 0.656 0.425 0.397991 Physical fitness facilities 0.615 0.285 0.387 0.232 0.527992 Public golf courses 1.187 1.559 3.842 16.140 2.047993 Coin-operated amusement devices 0.247 0.240 0.148 0.060 0.247997 Membership sports & recreation clubs 0.724 0.466 0.748 0.461 0.61

105
SIC DescriptionECR-Fresno
ECR-SanJoaquin
ECR-Madera
ECR-Stanislaus
ECR-SantaClara
7999 Amusement and recreation, N. E. C. 0.145 0.299 0.484 0.350 0.2780 Health services 0.859 0.868 1.397 0.740 1.33801 Offices & clinics of medical doctors 0.677 0.667 1.339 0.553 1.028011 Offices and clinics of doctors of medicine 0.677 0.667 1.339 0.553 1.02802 Offices and clinics of dentists 1.028 0.826 0.945 0.727 0.888021 Offices and clinics of dentists 1.028 0.826 0.945 0.727 0.88803 Offices of osteopathic physicians 1.287 3.426 NA NA 11.268031 Offices of osteopathic physicians 1.287 3.426 NA NA 11.26804 Offices of other health practitioners 1.107 1.026 2.160 0.717 1.008041 Offices and clinics of chiropractors 0.873 0.927 1.736 0.523 1.388042 Offices and clinics of optometrists 1.843 1.487 2.102 0.736 1.748043 Offices and clinics of podiatrists 1.086 1.249 8.866 1.960 2.248049 Offices of health practitioners, N. E. C. 0.922 0.806 2.225 0.795 0.57805 Nursing and personal care facilities 1.212 1.015 1.564 1.012 2.548051 Skilled Nursing care facilities 1.246 1.020 1.563 1.057 2.388059 Nursing and personal care facilities, N. E. C. 1.197 0.988 1.569 0.837 3.74806 Hospitals 0.735 0.797 1.360 0.656 1.258062 General medical and surgical hospitals 0.931 0.797 1.360 0.689 1.36807 Medical and dental laboratories 0.824 0.793 3.399 0.580 0.458071 Medical laboratories 0.504 1.238 2.807 0.330 0.248072 Dental laboratories 1.487 0.632 3.990 1.242 1.17808 Home health care services 0.608 1.083 4.068 0.888 1.878082 Home health care services 0.608 1.083 4.068 0.888 1.87809 Health and allied services, N. E. C. 1.576 2.379 1.163 2.106 3.428092 Kidney dialysis centers 3.636 4.711 1.258 2.875 4.988093 Specialty outpatient facilities, N. E. C. 1.097 2.812 0.761 2.044 3.148099 Health and allied services, N. E. C. 2.136 1.272 NA 1.703 2.9381 Legal services 0.481 0.737 1.134 0.709 0.43811 Legal service 0.481 0.737 1.134 0.709 0.438111 Legal service 0.481 0.737 1.134 0.709 0.4382 Educational services 0.097 0.038 0.827 0.157 0.03821 Elementary and secondary schools 0.116 0.018 0.134 0.049 0.038211 Elementary and secondary schools 0.116 0.018 0.134 0.049 0.03829 Schools & educational services, N. E. C. 0.394 1.242 5.714 0.343 0.298299 Schools and educational services, N. E. C. 0.394 1.242 5.714 0.343 0.2983 Social services 0.948 0.758 0.376 1.130 1.26832 Individual and family services 2.011 1.120 0.618 1.841 1.958322 Individual and family social services 2.011 1.120 0.618 1.841 1.95833 Job training and related services 3.037 0.990 0.104 1.354 1.188331 Job training and Vocational rehabilitation services 3.037 0.990 0.104 1.354 1.18835 Child day care services 0.555 0.308 0.981 0.546 0.418351 Child day care services 0.555 0.308 0.981 0.546 0.41836 Residential care 0.842 0.671 0.677 0.954 1.848361 Residential care 0.842 0.671 0.677 0.954 1.84839 Social services, N. E. C. 0.131 1.296 3.152 0.743 0.518399 Social services, N. E. C. 0.131 1.296 3.152 0.743 0.5184 Museums, botanical, zoological gardens 0.742 1.090 0.047 NA 0.38

106
SIC DescriptionECR-Fresno
ECR-SanJoaquin
ECR-Madera
ECR-Stanislaus
ECR-SantaClara
841 Museums and art galleries 0.556 0.818 0.035 NA 0.328412 Museums and art galleries 0.556 0.818 0.035 NA 0.32842 Botanical and zoological gardens NA NA NA NA 1.018422 Arboreta and botanical or zoological gardens NA NA NA NA 1.0186 Membership organizations 0.235 0.297 0.418 0.162 0.25861 Business associations 0.445 0.378 0.739 0.376 0.528611 Business associations 0.445 0.378 0.739 0.376 0.52864 Civic and social associations 0.287 0.583 0.340 0.858 0.438641 Civic, social and fraternal associations 0.287 0.583 0.340 0.858 0.43866 Religious organizations 0.201 0.145 1.655 0.125 0.118661 Religious organizations 0.201 0.145 1.655 0.125 0.11869 Membership organizations, N. E. C. 0.052 0.187 0.197 0.004 0.088699 Membership organizations, N. E. C. 0.052 0.187 0.197 0.004 0.0887 Engineering & management services 0.360 0.432 0.787 0.433 0.14871 Engineering & architectural services 0.286 0.665 0.684 0.476 0.088711 Engineering services 0.378 0.797 1.030 0.635 0.088712 Architectural services 0.059 0.161 0.591 0.084 0.058713 Surveying services 0.161 0.857 0.070 0.621 0.37872 Accounting, auditing, & bookkeeping 0.340 0.528 1.733 0.425 0.418721 Accounting, auditing, and bookkeeping services 0.340 0.528 1.733 0.425 0.41873 Research and testing services 0.784 1.481 2.203 0.630 0.098731 Commercial physical research 2.311 1.859 1.666 2.749 0.058733 Noncommercial research organizations 2.345 30.978 1.666 1.924 0.248734 Testing laboratories 0.618 0.821 NA 0.284 0.14874 Management and public relations 0.270 0.169 0.287 0.298 0.158741 Management services 0.217 0.104 0.249 0.198 0.218742 Management consulting services 0.086 0.072 0.045 0.134 0.048743 Public relations services 0.950 1.999 NA 0.828 0.168744 Facilities support services 3.801 NA 0.591 NA 0.318748 Business consulting, N. E. C. 0.426 0.701 3.546 0.813 0.1488 Services, N. E. C. 0.478 1.200 1.684 0.784 2.68881 Private households 0.478 1.200 1.684 0.784 2.688811 Private households 0.478 1.200 1.684 0.784 2.68