ROMANIAN ECONOMIC AND BUSINESS REVIEW · Cosmin Marinescu, Academy of Economic Studies Ovidiu...
98
ROMANIAN ECONOMIC AND BUSINESS REVIEW
Transcript of ROMANIAN ECONOMIC AND BUSINESS REVIEW · Cosmin Marinescu, Academy of Economic Studies Ovidiu...

ROMANIAN ECONOMIC AND BUSINESS REVIEW
EDITOR Bogdan Glăvan
Romanian American University
ASSOCIATE EDITORS Lucian Botea Flavia Anghel
Luminiţa Tuleaşcă Iuliu Ivănescu
Romanian American University
EDITORIAL BOARD Moisă Altăr, Romanian American University
Florin Bonciu, Romanian American University Mohamed Latib, DeSales University
Galen Godbey, DeSales University Anthony Evans, European Business School
Andras Inotai, Institute of World Economy, Hungary Academy of Science
Gheorghe Lepădatu, Dimitrie Cantemir University Mihai Aristotel Ungureanu, Romanian American
University Ion Stancu, Academy of Economic Studies
Constantin Floricel, Romanian American University George Ionescu, Romanian American University
Nikolay Gertchev, European Commission Marcel Moldoveanu, Institute of World Economy,
Romanian Academy of Sciences Alex Sharland, Barry University
Ion Pohoaţă, Alexandru Ioan Cuza University Theodor Purcărea, Romanian American University
Nicolae Idu, European Institute of Romania Cosmin Marinescu, Academy of Economic Studies
Ovidiu Folcuţ, Romanian American University Josef Sima, University of Prague
Laurenţiu Anghel, Academy of Economic Studies Ilie Vasile, Academy of Economic Studies
Klodiana Gorica, University of Tirana Pacha Malyadri, Osmania University
Andreea Budacia, Romanian American University
Statement of Purpose The Romanian Economic and Business Review (ISSN 1842-2497) intends to provide a forum for academic analysis of the economic phenomena and institutions affecting the world economy in general, and Romania, in particular. REBE examines a wide variety of phenomena related to economic growth and business development and attempts to publish high quality research focusing on the role of institutions and public policy, within both a national and international context. REBE encourages cross-disciplinary research work of Romanian and foreign scholars.
Indexed and/or Abstracted in: EBSCO; EconLit; ProQuest; DOAJ; Index Copernicus;
RePec
Author Information
The ROMANIAN ECONOMIC AND BUSINESS REVIEW (REBE) is a refereed journal published four times annually by the Romanian-American University. The editors invite submissions of articles that deal with important issues in economy and business. Papers that focus on specific phenomena and events affecting Romanian economy are particularly encouraged. Because REBE seeks a broad audience, papers should be comprehensible beyond narrow disciplinary bounds. Manuscripts should not exceed 8,000 words and must conform to the REBE’s style requirements, which are guided by The Chicago Manual of Style (14th edition). All submissions must include a cover sheet explaining the scope of the article, and including the authors’ names and affiliations, telephone and e-mail address. The text should be single-spaced. References are cited with parentheses using the author/date/page style. Example: (Marcus, 2005, p. 74). Authors should use footnotes, not endnotes to add only short comments. Bibliography should include only references cited in the text, in the alphabetical order of authors. An abstract of no more than 200 words should be included. Submission of a paper implies that the paper will not be submitted for publication to another journal unless rejected by the REBE editor or withdrawn by the author, and that it is an original work. All submissions should be sent to the journal Editor:
Dr. Bogdan Glăvan Romanian-American University
Bulevardul Expoziţiei nr. 1B Bucureşti
E-mail: [email protected]
Subscription rates: Institutions - $100/year Individuals - $30/year
ROMANIAN ECONOMIC AND BUSINESS REVIEW
SPRING 2017 VOLUME 12 NUMBER 1

4
ISSN 1842 – 2497

ROMANIAN
ECONOMIC AND
BUSINESS REVIEW
CONTENTS
AGNES GHIBUŢIU EU AND THE CHALLENGES
OF RISING GLOBAL PROTECTIONISM 7
SION BEATRICE, DODU PATRICIA, MANOLIU ANDREEA ROZALIA
THE IMPACT OF TECHNOLOGY ON PROMOTING TRAVEL AND LEISURE
SERVICES IN THE 21ST CENTURY
28
SARMIZA PENCEA, ANACRISTINA BÂLGĂR
CHINA’S URBAN DEVELOPMENT. ITS SPECTACULAR ASCENT,
DOWNSIDE AND STRATEGICAL RETHINKING
35
FLORIN BONCIU WORLD ECONOMY BETWEEN YESTERDAY AND TOMORROW: THE
TRANSITION TOWARDS A NEW INTERNATIONAL ECONOMIC
ORDER
50
GÜLFEN TUNA TIME VARYING CAUSALITY BETWEEN GOLD AND OIL PRICES
59
SOVANJEET MISHRA, PAVAN KUMAR
EXPLORING THE NEXUS BETWEEN PSYCHOLOGICAL CONTRACT AND
TURNOVER INTENTION: CONCEPTUAL FRAMEWORK
68
MAJID ESMAEILPOUR, MOHAMMAD RANJBAR
INVESTIGATING THE IMPACT OF COMMITMENT, SATISFACTION, AND
LOYALTY OF EMPLOYEES ON PROVIDING HIGH-QUALITY
SERVICE TO CUSTOMER
82


EU AND THE CHALLENGES OF RISING
GLOBAL PROTECTIONISM
Agnes Ghibuțiu
Abstract The slowdown in global trade growth over the post-crisis period was accompanied by
steadily rising protectionist tendencies and prevalence of economic nationalism, alongside increasing public sentiment against globalization and free trade. Moreover, the last years have seen an upswing in trade protectionism, with the EU and its Member States turning into outright targets of trade restrictive measures applied by countries worldwide.
Against this backdrop, our paper reviews recent trade policy developments that bear upon EU’s external trade relations, and aims at discussing: (1) dynamics and characteristics of the new protectionist measures implemented by EU's trading partners; (2) the importance of accessing external markets, and the European strategy and related trade policy kit to cope with the protectionist phenomenon; and (3) the challenges facing the EU in the changing global environment. The paper concludes that the upsurge in new protectionist measures and limited rollback of the existing ones since 2008 call for strengthening the multilateral trade framework and resuming WTO negotiations, as the most effective means to address crisis-related protectionism. Hence, EU’s efforts to tackle protectionism should be backed up by similar endeavours globally. Since the multilateral trade agenda remains at the heart of EU's trade policy, the Union should act more convincingly toward relaunching global trade cooperation.
Keywords: EU, G20, trade policy, trade protectionism, World Trade Organization (WTO),
trade agreements JEL Classification: F10, F13, F15
1. Introduction Weakening global growth and dramatic slowdown in global trade growth in the
post-crisis years coupled with a whole array of challenges to global economic recovery provided a fertile ground for countries' propensity to resort to protectionist trade policy measures.
It is well known that deviation from free trade is enticing for governments in times of economic downturn and heightened instability given that trade protectionism is commonly perceived as a quick and easy way to save jobs and replace imports with domestic production, and also a less painful remedy than fiscal austerity or cuts in budgetary spending.
Agnes Ghibuțiu PhD is senior research fellow at the Institute for World Economy of the Romanian Academy, Bucharest. E-mail address: [email protected]. This article is an extended and updated version of the author's paper presented at the 4th International Conference on Economic Scientific Research – Theoretical, Empirical and Practical Approaches – ESPERA 2016”, December 15-16, 2016, Bucharest, Romania.
8 Romanian Economic and Business Review – Vol. 12, number 1
Despite widespread fears of the international community that the 2008/2009 crisis might trigger a protectionist spiral of a magnitude comparable with the Great Depression, and with equally devastating effects, this did not come true. Nevertheless, the crisis has been accompanied by a steady increase in the number of trade-restrictive measures introduced by countries from all over the world as policy responses to the crisis-related difficulties. But even though the world has not seen a return to the across-the-board tariff increases of the early 1930s, governments worldwide have not refrained from using the full toolkit of protectionist trade policies, ranging from massive stimulus packages, bailouts, and subsidies, to various discriminatory trade measures affecting their trading partners.
Mindful of the 1930s experience and the contribution of trade to macroeconomic stability and performance, and wishing to prevent the escalation of protectionist pressures likely to affect global economic recovery, leaders of the Group of 20 (G20) economies pledged already in November 2008 at the first crisis-related summit in Washington to refrain from introducing new barriers to trade and investment and abolish the existing ones. They also requested the WTO, in collaboration with the OECD and UNCTAD, to monitor G20 countries' trade and investment policy measures and periodically report on their findings.
Yet, for the last eight year in a row, the global institutions monitoring the protectionist phenomenon in the G20, along with alternative monitoring entities, have pointed to the steady accumulation of new trade-restrictions and few efforts to liberalize international trade. Moreover, according to the latest monitoring reports, trade protectionism has seen an alarming upswing since 2015, both in G20 countries and on a global scale. Given that G20 economies are responsible for the bulk of global protectionism, accounting for about 80% of all protectionist measures introduced worldwide since the start of the crisis [Evenett and Fritz (2016)], it is quite clear that G20 leaders' commitment in 2008 to contend trade protectionism – renewed each year since then – has been systematically violated.
The current developments in the area of trade policy are all the more worrying as trade openness would be needed to keep recovery going, especially in the present global economic and political context, marked by instability and uncertainty. On the contrary, global efforts toward market opening continue to be in impasse, with the multilateral trade talks in the WTO hardly progressing in the absence of political will. Besides, we are witnessing an upsetting rise in negative perceptions on open trade and globalization in numerous countries and areas of the world, coupled with obvious signs of exacerbated economic nationalism and populism. And alongside the growth in anti-trade and anti-globalization rhetoric in the public discourse, the idea that trade has plateaud and globalization has peaked, and inherently economic integration of the world has come to an end, seems to gain more and more support.
Serious concerns about the recent upward trend in protectionist developments worldwide are coming from the EU, too. The European Commission's last monitoring report confirms that the propensity to impose new trade-restrictive measures remains strong among EU's trading partners, which goes clearly against the G20 commitment to abstain from imposing trade restrictions and remove existing ones. Given the EU's high weight in global trade and investment flows, these trends are fueling uncertainty in the world economy and hinder thus the revival of global trade and investment, badly needed to keep global recovery on track.

EU and the Challenges of Rising Global Protectionism 9
Against the backdrop of growing protectionist pressures worldwide, this paper aims to give an overview of the main trends shaping crisis-related protectionism at the European level and highlight the Union's policy response to this phenomenon as well as the challenges ahead. In doing so, it relies on data provided by the last monitoring reports released by the European Commission and WTO, as well the Global Trade Alert (an independent monitoring body), and draws on insights from the current literature on protectionism. The paper is structured as follows: Section 2 reviews the main protectionist developments at the European level, based on the Commission’s latest report, to evidence the dynamics and patterns of protectionist measures targeting EU trade. Section 3 discusses EU-related protectionism in a broader context. Section 4 examines the EU's strategy and related trade policy kit designed to ensure European companies' access to external markets and address protectionist impulses by its trading partners. Section 5 concludes, along with some reflections on the challenges facing the EU in its efforts to counter trade protectionism in the changing global landscape.
2. EU – a primary target of crisis-related protectionist measures From a trade policy perspective, developments and trends in the EU's commercial
policy may be discussed from a double angle, i.e. as both source and target of policy measures aimed at restricting trade. Seen from the first angle, the EU and its four Member States that are part of G20 (i.e. France, Germany, Italy, and the UK) are subject to WTO's trade policy monitoring exercises since the outbreak of the crisis in 2008, in accordance with the anti-crisis G20 commitment to “refrain from raising new barriers to trade in goods and services and investment or imposing new export restrictions, or implementing WTO inconsistent measures to stimulate exports” [G-20 (2008)]. Since G20 as a group accounts for about 85% of world GDP and 80% of global trade, its member countries bear a special responsibility for keeping the world trading system open and preserving fair competition conditions in domestic and global markets. Hence, the EU as a G20 member is equally responsible for the escalating protectionist trends globally, which are attributed in proportion of about 80% to the G20 group, as mentioned above. However, this dimension of EU's trade policy lies outside the scope of our paper, which focuses exclusively on the second dimension, namely the EU as a target of protectionist trade policies promoted globally.
As a G20 member, the Union monitors itself the evolution of protectionist tendencies worldwide and publishes regularly reports on the results of its monitoring exercises, both in the framework of the G20 commitment to resist protectionist pressures and in the context of its own efforts to phase out trade barriers raised by its trade partners. In this regard, EU's monitoring exercises complement those carried out by the WTO, but in addition these focus on the markets of EU's main trading partners with the aim to identify and, respectively, address trade barriers affecting its trade.
The last monitoring report1 released by the European Commission in June 2016 takes stock of protectionist tendencies in 31 EU trade partners2 from 1 July 2014 to 31 December 2015 [European Commission (2016a)]. What are the main findings of the report?
1 Unlike earlier reports, the June 2016 report (entitled “Report on trade and investment barriers and protectionist trends”) combines the information previously contained in two separate reports,
10 Romanian Economic and Business Review – Vol. 12, number 1
2.1 Dynamics of new protectionist measures targeting the EU The Commission's report reveals that crisis-related trade protectionism continues to
be on the rise around the world, with many countries still resorting to trade-restrictive measures.
While trade-restrictive measures that are targeting the European economy continue to grow at roughly the same pace as identified in earlier monitoring reports, only few barriers to trade have been removed so far. Moreover, numerous new ones have been introduced between July 2014 and December 2015, which are adding to the continually growing stock of protectionist measures in place since the start of the crisis. Accordingly, the rate of removal of trade-restrictive measures by third countries, including G20 countries, remains far too low to reduce the overall stock of trade-restrictive measures adopted by EU's trading partners since 2008.
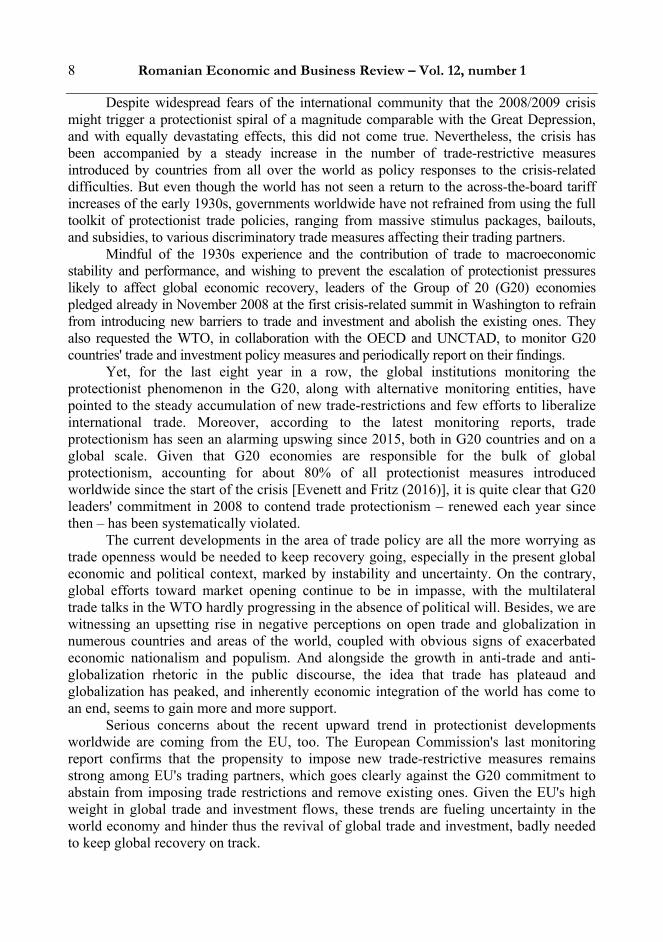
More specifically, during the 18-month period under review, 201 new potentially trade-restrictive measures have been implemented by EU's trading partners, while only 16 previously imposed such measures were withdrawn. As a result, the stockpile of protectionist measures identified by the EU since 2008 has continued to increase, amounting to 1059 by the end of 2015 (figure 1). As only 17% of the total has been removed since 2008, the rate by which trade-restrictive measures are being eliminated remains insufficient to significantly counteract the growing number of new measures.
Figure 1: Evolution of the stock of trade-restrictive measures since 2008
Source: Author's compilation based on data from the European Commission
[European Commission (2014, 2016a)].
namely the Report on potentially trade restrictive measures (”Protectionism report”), published annually since 2008, and the Trade and investment barriers report, published annually since 2011 and focused on the progress achieved in dismantling barriers to the markets of EU's six strategic economic partners – China, India, Japan, Brazil, Argentina, Russia, and the US. 2 Algeria, Argentina, Australia, Belarus, Brazil, Canada, China, Ecuador, Egypt, India, Indonesia, Japan, Kazakhstan, Malaysia, Mexico, Nigeria, Pakistan, Paraguay, the Philippines, Russia, Saudi Arabia, South Africa, South Korea, Switzerland, Taiwan, Thailand, Tunisia, Turkey, Ukraine, the US, and Vietnam. These countries account together for the bulk of EU's trade with third parties.

EU and the Challenges of Rising Global Protectionism 11
Equally relevant for assessing the dynamics of protectionist measures applied by EU's trading partners and the state of their market opening is the ratio between newly introduced protectionist measures and trade liberalization measures. Therefore, in addition to the new protectionist measures, the Commission also monitors the trade-facilitating measures adopted by its trading partners to improve trade or investment conditions, such as reducing import/export duties, facilitating import procedures or relaxing foreign ownership limitations. Though the last monitoring report suggests that the number of such trade liberalization measures is on a slight upward trend between July 2014 and December 2015 as compared to previous reports, these initiatives are still outpaced by protectionist trade policy initiatives in a ratio of 1:3, which says a lot.
2.2 Main offending nations and patterns of EU-related trade protectionism The main offending nations identified by the European Commission in its last
monitoring report are emerging economies. These countries together account for the bulk of all new trade-restrictive measures applied by EU's trading partners between July 2014 and December 2015.
Interestingly, the same emerging economies as in previous years – namely, China, Russia, Indonesia and India taken together – were responsible for nearly half of all new protectionist measures detected by the Commission in the reporting period. These countries were followed by South Africa, Argentina, Turkey, Ecuador, Algeria, Brazil, and Mexico. But developed countries, including some G20 members (e.g. the US and Japan) continue to adopt protectionist measures, too, in spite of repeated promises to refrain therefrom. In EU’s trade with Japan and the US, for instance, numerous longstanding hurdles to market access persist, including tariffs, non-tariff measures (e.g. sanitary and phytosanitary measures, and technical barriers), as well as public procurement restrictions.
Regarding protectionist trends in specific sectors, among the products most severely hit by protectionist measures are raw materials and energy goods, which are restricted mainly by export restrictions and discriminatory provisions (e.g. local content requirements), respectively. The ICT sector ranks also among the domains increasingly hurt by new protectionist measures (imposed particularly by China, India, and Russia), with market access limiting measures ranging from duty increases to local content requirements, mandatory certification or intrusive testing requirements. And not least, the worsening of global overcapacity in the steel sector3 during the period under review has triggered an increase in protectionist measures by third countries against the European steel sector, which represents 1.3% of EU GDP and provides over 328,000 jobs [European Commission (2016b)]. These measures took especially the form of disproportionate restrictions on imports, including large increases in customs duties (e.g. India), but also import licensing procedures and quotas imposed on European steel
3 Especially since 2015, overcapacity in the steel industry has become a serious problem for many G20 countries amid slowing global demand, which led to closing steel mills and layoffs. In particular, China – which accounts for over half of world steel production – has been accused of artificially maintaining an excessive number of steel mills through subsidies and other government support, thus fueling overproduction, distorting market and affecting global trade.

12 Romanian Economic and Business Review – Vol. 12, number 1
products (e.g. in Algeria, the second largest export destination for EU steel), along with the imposition of export restrictions, and not least a notable surge in the use of trade defense instruments, including safeguards.
In terms of typology of the trade policy measures, border measures directly affecting EU imports and exports (e.g. tariff increases, quantitative restrictions, import licensing or even outright trade bans) continue to account for the largest share of newly introduced trade restrictions, with India, Indonesia and Russia applying the highest number of new border measures restricting imports between July 2014 and December 2015.
A significant rise occurred over the reporting period in the number of new behind-the-border measures. This suggests an increasing resort of third countries to internal measures affecting foreign competition, which are in general more difficult to identify than border barriers. Among these are mainly new measures that restrict access to public procurement, and trade in services and investment, but also discriminatory tax measures or other discriminatory provisions favouring local companies or requiring local content, registration procedures and other standards and technical requirements. China once again applied the highest number of such behind-the-border measures, followed by Russia. While China accounts for the highest number of restrictive measures introduced in the area of services and investment, followed by Indonesia, Russia has adopted the largest number of measures restricting access to government procurement, followed by the US.
In addition to the protectionist measures mentioned above, numerous EU trade partners increasingly support their companies through subsidies (e.g. the US), incentives and other measures, particularly stimulus measures aimed at boosting exports, with potentially distorting effects on competition.
Finally, the resort of third countries to trade defence instruments (i.e. anti-dumping, anti-subsidy and safeguard measures) against EU and individual Member States is on a clear upward trend since 2010. The use of trade defence instruments (or trade remedies) is aimed at providing temporary protection to domestic industries and is subject to WTO rules and disciplines. However, unlike WTO reports, trade defence measures are not included as potentially protectionist measures in the Commission's monitoring reports on the ground that these are designed to correct anticompetitive behaviour of trade partners or to react to sudden increases in imports that may cause injury. However, since unwarranted trade defence measures may adversely impact EU exports, the Commission monitors distinctly the development of trade defence investigations initiated by non-EU countries against European companies to ensure that these measures are applied in accordance with WTO rules.
According to the Commission's latest report on trade defence measures, the total number of such measures in force affecting EU exports increased to 151 at the end of 2015 as compared to the 140 measures in place in 2014 [European Commission (2016c)]. This total included 108 anti-dumping measures, 5 anti-subsidy measures, and 38 safeguard measures. Of particular concern to the EU is the increased imposition of safeguard measures, which apply against all countries of origin, whether or not causing any injury to the domestic industry. Among the most active countries imposing trade defence measures against EU exports are India and China (each with 19 measures in force, mostly anti-dumping), followed by the United States (with 18 measures in force, mostly anti-dumping), Brazil (with 16, only anti-dumping measures and a remarkable increase relative to 2014), and Turkey (12).

EU and the Challenges of Rising Global Protectionism 13
3. Discussing EU-related protectionism in a broader context From the overview of recent protectionist developments in the EU, based on data
provided by the European Commission’s latest monitoring exercise, we may conclude that almost a decade after the outbreak of the financial crisis, the protectionist phenomenon is far from giving any sign of retreat. On the contrary, it is on the rise. Many countries still continue to consider protectionist measures a valid trade policy tool for overcoming post-crisis economic difficulties, though it is quite clear that resort to protectionism and inward looking economic policies would not solve the challenges currently facing the world economy. In fact, it would make them even worse.
Nevertheless, the Commission’s findings on EU-related protectionist trends are worth to be looked at in a broader context to get a more comprehensive picture of the dynamics and patterns of crisis-related protectionism. Such an approach brings us to some additional comments.
A first point to be made is that the real extent of protectionist measures targeting the EU economy is presumably much larger than that suggested by the Commission’s last report, given that monitoring exercises, even if very useful, cannot capture but part of the vast universe of protectionist measures imposed by third countries. Nowadays, these measures are frequently adopted in a non-transparent way and therefore may not be detected. In tough economic times governments have strong incentives to resort to new, often hidden and subtle, ways to favour domestic commercial interests over foreign competitors. This is why numerous contributions point to the “murky” and “creeping” nature of contemporary trade protectionism [(e.g. Evenett (2014), Evenett and Fritz (2016), Hufbauer and Jung (2016)].
A second point is that the Commission’s report tracks the evolution of the protectionist phenomenon at the European level just till October 2015. Since EU’s monitoring reports are in general consistent with similar WTO reports4, and do also complement the findings thereof (even though the date of their release does not usually overlap), we may get some insights into the evolution of protectionist trends thereafter from two subsequent WTO monitoring reports, which together cover the period October 2015 to October 2016 [WTO (2016a, 2016b)]. Both reports contain alarming signals about continually escalating protectionist pressures. According to these reports, the number of new trade-restrictive measures introduced by G20 economies remained worryingly high after October 2015 too, with the overall stock of such measures (including trade remedies) recorded since 2008 increasing further, and with less than a quarter of these measures being removed. This reinforces the notion that the rate of removal of such measures by G20 members remains far too low to reduce the existing stock of restrictive measures. Furthermore, the policy mix used by governments appears to have been shifting since 2015. Apart from the large number of border measures and the alarming rise in trade defence instruments, which point to increasingly tensed relations between trading nations worldwide, G20 economies more frequently resort to a large
4 The methodology of WTO's monitoring reports differs in several respects from the Commission's reports, as it takes into account a smaller group of countries (G20) over a shorter (6-months) period and also covers trade defence instruments, which are excluded from the Commission's reports.
14 Romanian Economic and Business Review – Vol. 12, number 1
variety and more focused forms of government intervention, i.e. sector-specific and export-oriented support measures, including export credits, export rebates and refunds and other export incentives [WTO (2016b)].
But even more disturbing are the data provided by the last report published by Global Trade Alert (GTA) – an independent monitoring body co-ordinated by the London-based Centre for Economic Policy Research. The GTA report5 goes far beyond the WTO and EU monitoring initiatives in that it covers a much wider range of protectionist policy instruments than those tracked by the WTO or EU, and also identifies the main offending nations, as well as the trading partners likely to be harmed by protectionist measures. Its findings for the whole year 2015 and the first quarter of 2016 show that resort to protectionism worldwide was roughly 50% higher than in 2014, with G20 members accounting for the lion’s share of global protectionism (over 80%) [Evenett and Fritz (2016)]. The 10 most protectionist nations in 2015 were all G20 members, with the US and Russia on the top of the list, followed by India, Brazil, Indonesia, Argentina, Japan, Canada, the UK, and Italy. While European trade policy seems to have become less protectionist since the onset of the crisis, the EU ranks as the second largest target of protectionist measures among G20 countries, after China. Especially the commercial interests of its larger exporters, namely, France, Italy, Germany and the UK tend to be harmed most often.
Another point relates to the potential trade impact of protectionist measures. Although the analysis of this issue is beyond the scope of our paper, there is no doubt that the stock of such measures in place since 2008 and the continuous addition of new trade barriers are bearing upon EU’s external trade relations. 6 However, due to scarce information and complex nature of trade barriers, the exact economic impact of barriers targeting the EU is difficult to quantify. Depending on the complexity, product scope, and duration of the protectionist measures implemented by third countries, their effect on trade can vary with more or less far-reaching consequences for EU’s trade.
Nevertheless, we may get a very rough notion of EU’s trade volumes potentially covered by protectionist measures if we relate the extra-EU merchandise import share in world total (of about 14% in 2015) to WTO figures on the share of G20 and world imports covered by import-restrictive measures.7 According to WTO estimates, the trade
5 GTA maintains a comprehensive database of trade-restrictive measures since 2009 and monitors a much greater variety of trade policy instruments than the WTO (or EU). Its figures on the extent of global trade protectionism are much higher than those published by the WTO. According to GTA estimates, the WTO data on protectionism represent only about 1/3 of all protectionist measures really introduced on a global scale during the crisis and post-crisis period [Evenett (2014)]. 6 The Commission’s last report on protectionist tendencies does not offer any estimates on the share of EU trade covered by protectionist measures. According to an earlier report, already in 2009 European exports potentially affected by trade-restrictive measures were in the range of €96 to 130 billion (9 to 12% of EU's total exports in 2009) and EU imports of raw materials worth around €6 billion [European Commission (2011)]. 7 The WTO periodically calculates for “import-restrictive” measures (i.e. trade remedy actions and other import-restrictive measures) the share of G20 and world imports covered by such protectionist measures. However, these percentages are only a crude indicator for the trade effects of protectionism since these depend on the type and the size of the measures, and also on different other variables including import demand elasticities [Ollivaud and Schwellnus (2015)]. Besides,

EU and the Challenges of Rising Global Protectionism 15
coverage of such import-restrictive measures identified by the organization since October 2008 was around 6.5% of G20 merchandise imports or 5.0% of world imports in October 2016 [WTO (2016b)]. In value terms, this amounted to US$817 billion (based on 2015 import data), reflecting – in the view of WTO economists – the significant decrease in the value of world trade between 2014 and 2015. From here we may infer that the volume of EU trade potentially covered by protectionist measures (of US$114,4 billion, according to our calculation) is not at all negligible. And it is quite possible that trade barriers erected by third countries against EU trade flows may have largely contributed to the decline in the value of extra-EU goods exports and imports between 2014 and 2015 (by 12% and respectively 15%), according to WTO data [WTO (2016c)].
Whether the crisis-related protectionist phenomenon has contributed or not to the dramatic slowdown in global trade growth over the recent years continues to be a strongly debated issue. The arguments put forward so far to explain the factors behind the sluggishness of trade growth, both in absolute terms and relative to world GDP growth, are still highly divergent. Despite a large consensus among trade experts that both cyclical and structural factors are responsible for the weakness in trade, the opinions continue to be controversial on the specific role of each of these factors. The dominant view [e.g. Constantinescu et al. (2015), Boz, Bussière and Marsilli (2015), Ollivaud and Schwellnus (2015), Freund (2016), Haugh, Kopoin, Rusticelli et al. (2016)] is that trade protectionism weights negligibly in the respective equation as increases in this phenomenon would have played at best a marginal role in the slowdown of global trade after the crisis. But even though these contributions do not assign a major role to protectionism in the current trade slowdown, most of them do not rule out the possibility that the absence of trade liberalization after the 2000s, in conjunction with some protectionist developments since the crisis, including major state intervention in certain industries, could have contributed to the strong deceleration of global trade growth. On the opposite side, an increasing amount of research [e.g. Evenett (2014), Evenett and Fritz (2015), Evenett and Fritz (2016), Hufbauer and Jung (2016)] points to the unequivocal growth in the number of protectionist measures (including subsidies to domestic industries, anti-dumping actions or discriminatory regulations), but also to the rise in “micro-protectionism” due to G20 governments intervention during the post-crisis period. These contributions also underscore the “creeping” or “murky” feature of crisis-related trade protectionism and provide data to demonstrate that slowdown in trade liberalization and soaring trade protectionism are taking their toll on trade flows.
4. The European response to the challenges of rising trade protectionism As the world's largest market for goods and services and the most important source
and destination of foreign direct investment, the EU has a major interest in fighting trade protectionism and ensuring an open and fair global trading system.
International trade in goods and services plays an essential role for the EU economy, with extra-EU trade accounting for about a third of EU-28 GDP [Eurostat (2016)]. The EU
this WTO indicator relates to import-restrictive measures only; hence it is not able to capture the protectionist policy instruments in their totality.

16 Romanian Economic and Business Review – Vol. 12, number 1
is the world’s largest exporter and importer of goods and services taken together. Based on WTO data, the value of EU-28 exports of goods to the rest of the world amounted to US$1,985 billion in 2015, equivalent to 15.2% of world exports, while imports stood at US$1,914 billion or 14.3% of the world total [WTO (2016c)]. In the world hierarchy of goods exporters, the EU ranks second (in 2015), being outpaced by China (with a 17.4% share of world exports), but surpasses the US (11.5%). On the import side, the EU ranks also second, but after the US (17.3%) and before China (12.6%).
When excluding intra-EU trade from the world total, the EU-28 becomes the largest exporter and importer of services in the world. Its services exports to third countries are valued at US$890 billion and services imports at US$728 billion (in 2015), representing almost 25% and respectively 20% of world total [WTO (2016c)]. The EU ranks first in the world as undisputed leader in services exports, being followed at a great distance by the US (with a 19.1% share of world services exports) and China (6.4%). Similarly, among the top services importers, it ranks first, followed at a large distance by the US (13.1% share of world services imports) and China (12.2%).
However, it is important to note, that EU's share in global trade in goods has witnessed a downward trend over the last decade, as illustrated in figure 2. A similar picture arises when considering the evolution of EU's share in world trade in services, albeit the decline in this case is less pronounced. Nevertheless, the EU remains a major trading power.
Figure 2: Evolution of EU's share in world merchandise trade1 relative to the United States, Japan and China, in 2006-2015 (percent
share)
Note: 1 Average of world exports and imports. Source: Author's calculation based on Eurostat data for 2006-2013 and WTO data for 2014-2015 [European Commission (2016d), WTO (2015a), WTO (2016c)].

EU and the Challenges of Rising Global Protectionism 17
Since the EU is facing the challenge of boosting growth, investment and jobs following a difficult and protracted downturn, trade is seen by the European Commission as one of the few tools available to revive the European economy without the risk of burdening state budgets. Accessing goods and services markets outside the EU and removing barriers to EU exports in the markets of third countries is an essential prerequisite for spurring growth and creating new jobs. It is also the main tool of improving the competitive potential of the European economy, particularly as its leading trade partners are less open than the EU, and in certain cases significantly so. Furthermore, as trade is expected to become an even more important source of growth in the future – given that about 90% of global economic growth in the next 10 to 15 years is estimated to be generated outside Europe – economic recovery in the EU needs to be consolidated through stronger trade links with the new centres of global growth, especially in Asia [European Commission (2015)].
Hence, supporting European companies gain access to third country markets and ensuring that international trade and investment flows are reaching unhindered the European market continue to be an essential component of EU's trade policy. This, however, requires an open and fair international trading system. It is well established that today's main trade policy challenges do not primarily lay in cutting tariffs for goods, but in overcoming regulatory barriers, gaining better market access for services and investment, opening public procurement markets, better protecting and enforcing intellectual property rights, and tackling unjustified barriers hampering the supply of raw materials. Yet, it is also well known that the rules and disciplines of the GATT/WTO system have not kept pace with the trade realities of the 21th century, including the rapidly expanding range of barriers in the global economy. Notwithstanding the remarkable progress in removing tariff barriers to trade and in tackling some of the non-tariff barriers to trade (e.g. sanitary and phytosanitary measures, and technical barriers to trade), there are still many areas where multilateral rules and disciplines need to be upgraded and developed.
In its endeavours to keep external markets open and explore new markets for European exporters worldwide, the European Commission acts in accordance with the EU Market Access Strategy and through promoting a number of sectoral trade policies. The EU Market Access Strategy aims at enforcing the Union's multilateral, plurilateral and bilateral trade agreements and ensuring that third country markets were open to EU exports and trade opportunities created by these agreements translate into real trade benefits for European exporters. Since its launch in 1996, this strategy and the associated sectoral trade policies (box 1) have been continuously improved and adjusted too keep pace with the changes in the global economy, both in terms of markets and barriers that prevent market access.
Box 1: Objectives of EU sectoral trade policies to access external markets
removing/reducing individual barriers erected to the flow of goods and services in EU's
key export markets, including tariff barriers (e.g. import tariffs) and non-tariff barriers (such as technical barriers to trade and sanitary and phytosanitary measures), as well as “behind the border barriers”, i.e. specific domestic regulations or discrimination against European suppliers;
making certain that European companies have access to government procurement

18 Romanian Economic and Business Review – Vol. 12, number 1
markets around the world on fair terms and EU suppliers are provided a level playing field when tendering abroad;
ensuring protection and enforcement of intellectual property rights, which is crucial for the EU's ability to stimulate creativity and innovation and to compete in the global economy;
preserving EU's rules on investment, which is a critical prerequisite for European companies' ability to access and operate effectively in foreign markets;
defending the functioning of the EU market against unfair competition and trade distorsions, such as dumping or subsidies;
taking action whenever international trade rules are infringed either through bilateral dispute settlement provisions, WTO-specific dispute settlement procedures or through specific investment dispute provisions.
Source: European Commission (2016d).
In line with its trade strategy and policies geared toward open markets and rules-
based trade, the EU tackles the problem of removing trade barriers implemented by its trading partners and of opening their markets in two ways simultaneously, i.e. within the multilateral framework of the WTO and by promoting a broad agenda of bilateral and regional trade agreements
4.1 EU's engagement in multilateral and plurilateral trade talks Acknowledging the key role of the rules-based multilateral trading system in ensuring
a stable and predictable framework for world trade and the need to further strengthen and improve it is an enduring dimension of EU's trade strategy and policies. Hence, supporting the multilateral trade agenda and the dispute settlement system anchored in the WTO remains the cornerstone of EU trade policy, as often stressed by the Commission.
The growing propensity of EU's trade partners to resort to new protectionist measures following the global financial crisis and the slow pace of removing the restrictions in place highlight even more the need to strengthen an upgrade the multilateral trading system built around the WTO. However, the Doha Round negotiations under the WTO, that could effectively address trade protectionism around the world are stalled since July 2008 and the multilateral trade talks have hardly advanced since then due to major and persisting divergences between developed and developing countries. The last couple of years has seen, nevertheless, some progress in multilateral cooperation, as reflected by the successful conclusion of several sectoral trade deals designed to further open global trade. Doubtless, strong European leadership in the WTO has been crucial in achieving these still modest, but significant results. The following brief review may highlight the EU's contribution to these achievements.
The EU has substantially contributed to the negotiated outcomes that have been delivered at the 9th and 10th WTO Ministerial Conferences in Bali (2013) and Nairobi (2015) respectively. On 5 October 2015, the EU ratified the multilateral Trade Facilitation Agreement (TFA), which is a major result of the Bali package. The TFA entered into force in February 2017, meaning that it is able to start delivering its benefits [WTO (2017)]. Seen as the most important multilateral trade deal since the 1990s, the

EU and the Challenges of Rising Global Protectionism 19
agreement will simplify and modernize customs procedures around the world and create new export opportunities, especially for small businesses. According to WTO projections, full implementation of the TFA is likely to reduce trade costs by an average of 14.3%, and has the potential to increase global merchandise exports by up to US$1 trillion per annum [WTO (2015b)].
Noteworthy is also EU's decisive role in agreeing the “Nairobi package” at the 10th WTO Ministerial Conference in 2015, which provides, inter alia, for the elimination of subsidies and other support schemes granted to agricultural exports with distortionary market effects, as well as other measures that are expected to contribute to a fairer global trade [WTO (2015c)]. Besides, in Nairobi the EU has contributed to the formal conclusion of the new Information Technology Agreement (ITA 2) – a plurilateral agreement which extends the scope of the earlier ITA agreement signed under the WTO in 1996. Under ITA 2 import duties will be eliminated on 201 new generation IT products, whose annual trade is estimated at over US$1.3 trillion, or about 10% of world trade in goods. Negotiations were conducted by 24 participants, representing 53 WTO members, which together account for approximately 90% of world trade in these products [Ghibuțiu (2016)].
Given that plurilateral trade agreements are an important means to further the market-opening and rule-making agenda and may play an important role in complementing multilateral trade liberalization initiatives, the EU is a fervent advocate of this type of trade deals, provided that these are consistent with WTO rules and have the widest possible coverage in terms of participants. The following examples are illustrative for EU’s active participation in such deals.
At the plurilateral level (but outside the WTO) the EU is negotiating the Trade in Services Agreement (TISA). Launched in 2013, this agreement is currently negotiated by 23 WTO members (including the EU), which together account for 70% of world trade in services and aims at liberalizing services trade beyond the GATS in areas such as licensing, financial services, telecommunications, e-commerce, maritime transport, and services provided by individuals abroad. As services represent about 70% of EU GDP and employment and account for an increasing share of extra-UE trade (e.g. 31% in 2015), TISA has a large potential to support European services exporters [Ghibuțiu (2016)].
Since July 2014, the EU and 16 other WTO members are negotiating a deal to liberalize global trade in environmental goods – the Environmental Goods Agreement (EGA). EGA aims at removing barriers to trade and investment in goods, services and technologies that can contribute to protecting or improving the environment. At present, the talks focus on phasing out tariffs on a broad range of environmental goods, but the EU strives to also include related services and address non-tariff barriers, such as local content requirements or restrictions on investment. Since EU is a world leader in trading environmental goods, European companies would derive large benefits from EGA. And, not least, the EU has the ambition to multilateralize both the EGA and TISA agreements in the future, that is to bring them under the WTO umbrella after reaching a critical mass of participants [Ghibuţiu (2016)].
The EU is also a strong supporter of the revised plurilateral Government Procurement Agreement (GPA), which entered into force in April 2014 following the renegotiation of the former GPA concluded in 1994. 43 WTO members, including the EU

20 Romanian Economic and Business Review – Vol. 12, number 1
and its member states, are parties to this revised plurilateral agreement, which extends commitments on market access in the area of public procurement. While the ratification process is under way, discussions continue on upcoming accessions to GPA, especially those of China and Australia. The EU actively takes part in these discussions, pursuing the objective of ensuring the widest possible coverage of the GPA in terms of participants [European Commission (2016a)].
4.2 The EU's bilateral and regional trade agenda Bilateral and regional negotiations are very important in terms of removing trade
barriers and opening markets worldwide. While multilateral trade talks are in general slow and cumbersome, negotiations at the bilateral and regional level advance much faster and can deliver more efficient results. In addition, these allow for addressing the full range of trade barriers, including non-tariff barriers and behind-the-border-barriers, which prevail among present-day trade policy instruments but are not – or are only in part – covered by multilateral rules and disciplines.
To boost the EU’s capacity to benefit from trade and investment by addressing the elimination of protectionist measures implemented by its trading partners, the European Commission has developed over time an extensive bilateral and regional trade agenda, that complements the Union’s engagement at the WTO. As stated by the Commission, the EU has the most ambitious bilateral trade agenda in the world, with preferential trade agreements in place with 52 countries and negotiations for FTAs and Economic Partnership Agreements ongoing with 80 countries, including with some of its key economic partners (e.g. the US, Japan, Mercosur and India – although negotiations with the latter are stalled for the time being) [European Commission (2016a)].8 FTAs in force are estimated to cover more than a third of EU trade and their share is expected to increase to two thirds in the future. And as pointed out in January 2017 by EU Trade Commissioner Cecilia Malmström, the EU has a long list of numerous countries willing to deal with the EU, and about 20 more trade deals are already in the pipeline [European Commission (2017)].
To give just a few examples, apart from EU’s ongoing trade talks (since 2013) with the US and Japan – in the context of the Transatlantic Trade and Investment Partnership (TTIP) and the EU-Japan Free Trade Agreement, respectively9 – the EU concluded the negotiations of the EU-Canada FTA (CETA) in September 2014 and the EU-Singapore FTA in October 2014, as well as the FTA negotiations with Vietnam in December 2015. More recently, the EU launched negotiations with the Philippines (December 2015), Mexico (June 2016), and Indonesia (July 2016). After a long pause, in 2016 it restarted trade talks with the Mercosur countries in South America, with preparations being under
8 For an overview of FTAs and other trade negotiations, cf.: European Commission (2016e). 9 While the on-going trade talks with Japan are making good progress, the EU-US negotiations are frozen following the election of the new US president Donald Trump [European Commission (2017)]. The initial idea behind the TTIP deal was to create a comprehensive framework for furthering the US-EU economic relationship, with trade as one of its strategic pillars. However, due to the controversial trade policy options of the new US administration the dynamics of these negotiations is likely to be reversed, with possible tensions over many trade and investment issues.

EU and the Challenges of Rising Global Protectionism 21
way for starting negotiations with Australia, New Zealand, and Chile, and is also considering to resume the dormant talks with Malaysia [European Commission (2017)].
All new generation FTAs concluded by the EU so far, or under negotiation, cover a very broad range of issues, from customs duties and regulatory barriers to trade in services, public procurement, competition rules, intellectual property rights, investment and rules on sustainable development. The recent FTAs concluded with Vietnam and Canada, for instance, are seen as ground-breaking agreements, given that these are highly ambitious not only on traditional trade barriers, but also behind-the-border measures. While the deal with Vietnam provides a new model for Europe's engagement with developing countries, CETA is one of the most comprehensive ever agreed between developed countries. Both FTAs go far beyond the traditional trade issues into areas like services, procurement, product standard, labour rights and environmental protection, and also break new ground in respect of investment protection provisions. Therefore, the European Commission wants these two agreements to pave the way for a multilateral investment court in the future [European Commission (2016f)].
5. Concluding remarks and some reflections on the challenges ahead It is quite obvious that G20 countries’ commitment in the context of the 2008
global economic downturn to refrain from adopting new trade-restrictive measures and roll-back those in place to avoid undermining the fragile global recovery has not been honoured. On the contrary, protectionist pressures by G20 economies, which together account for 85% of world GDP and 80% of global trade, have not ceased rising over the post-crisis period, as reflected by the increasing accumulation of new trade-restrictions and few efforts to liberalize trade. Moreover, the latest monitoring reports released by the European Commission and the WTO, as well as private entities, such as the GTA, provide alarming signals of escalating trade protectionism worldwide, especially since 2015 when trade growth seems to have plateaud. The available data suggests that new trade restrictions reached already a post-crisis high in 2016.
While protectionist measures imposed by the EU and its Member States appear to have been diminishing since the outbreak of the crisis 2008, there is plenty of evidence that the Union is now the second largest target of protectionist measures among G20, after China. Furthermore, trade protectionism has changed over the last few years not only in size, but also in terms of geography and patterns. On the one hand, trade restrictions have clearly shifted toward emerging countries (including China, Russia, Indonesia, and India), which account for the highest number of new trade-restrictions erected against the EU and are also the main offenders. Such a protectionist drift derives from their deteriorating economic performance, but also from their increasingly assertive role in global economic governance. On the other hand, the traditionally prevailing forms of trade-restrictions (i.e. border measures, typically tariffs and quotas) are increasingly being replaced by a large variety of behind-the-border measures (e.g. restricting access to public procurement or trade in services and investment, as well local content requirements, discriminatory taxation, registration procedures, standards and technical requirements), which are not – or are only partially – within the purview of multilateral rules and disciplines, and hence are less transparent and more difficult to be identified. And not least, the recent surge in the number

22 Romanian Economic and Business Review – Vol. 12, number 1
of trade defence investigations and subsequent trade remedy measures is indicative of the intensified trade tensions among nations. Besides, the growing number of trade litigations jeopardizes the already overburdened technical capabilities of the WTO’s dispute settlement system.
In face of continually growing trade barriers erected by third countries since the outburst of the financial crisis, the Union’s policy response to crisis-related protectionism has been shaped in line with its trade strategy traditionally geared towards open markets and rules-based trade. Accordingly, the objective of removing protectionist trade measures and opening the market of its trade partners has been pursued in two ways simultaneously, i.e.: (1) in the multilateral framework of the WTO; (2) and through the EU’s broad agenda of bilateral and regional trade agreements.
Notwithstanding the Union’s own efforts to fight protectionism so far, which may have helped mitigating temporarily and in certain cases the protectionist impulses from its trade partners, these efforts alone are by far not sufficient to reverse the protectionist tendencies at the European level, given that protectionism has turned into a severe global phenomenon in the post-crisis years. Hence, as in the case of other global issues, countering protectionism would require global efforts and global solutions.
The most effective way to combat protectionism worldwide would be, indeed, strengthening the multilateral trading system built around the WTO and resuming multilateral trade cooperation, including through relaunch of the Doha Round talks. There are numerous examples to illustrate the recent commitments to further these goals, which have been assumed by both WTO members (e.g. at the last Ministerial Conferences) and by G20 countries. To take just the example of the last annual summit in Hangzhou (China) in September 2016, G20 leaders once again reconfirmed their opposition to protectionism on trade and investment in all its forms and extended their commitments to standstill and rollback of protectionist measures till the end of 2018 [G20 (2016)]. They also pledged to take effective steps to tackle the global overcapacity in steel, which has caused a tide of protectionist measures worldwide and whose root causes touch upon trade policy matters (e.g. subsidies and other types of government support). It remains to be seen if G20 leaders responsible for global economic governance will be able this time to comply with their commitments.
As regards EU’s action on the multilateral front to preserve open markets and rules-based trade, the Union has largely contributed to the important negotiated outcomes aiming at further market opening, that have been delivered at the 9th and 10th WTO Ministerial Conferences in Bali (2013) and Nairobi (2015). Given that 2017 will be another important year for the WTO as it prepares for its 11th WTO Ministerial Conference to be hosted in December in Buenos Aires, the Union’s determination to pursue its engagement and political support throughout 2017 and beyond will be essential to keep strengthening the multilateral trading system anchored in the WTO.
Hence, further progress in EU’s multilateral and bilateral trade agenda alongside increased focus on effective implementation and enforcement of the existing trade agreements continue to be crucial. However, the Union’s actions in terms of trade policy are facing at present unprecedented challenges due to a plethora of external and internal factors, which relate both to the current global economic and geopolitical environment and the internal developments which are under way in the Union. Regardless of the
EU and the Challenges of Rising Global Protectionism 23
perspective from which we look at these new challenges, it is quite evident that both lines of action – i.e. multilaterally and bilaterally – that have been traditionally pursued by the EU to address trade protectionism are now facing strong headwinds.
To begin with, the global macroeconomic picture and the global economic trends continue to be marked by a slow recovery of the world economy, along with persisting economic difficulties and increased uncertainties. In fact, the global economic outlook is set to remain gloomy, particularly for international trade. If the WTO’s revised trade forecast of last September comes true, 2016 would mark the slowest pace of trade and output growth since the financial crisis. What is more, this upsetting prediction appears to be already confirmed by forecasts released by the World Bank and the United Nations in January 2017, showing that both global GDP and world trade volumes have recorded in 2016 their weakest performance since the global financial crisis.10 Besides, the economic outlook is expected to remain sluggish, especially as substantial uncertainty persists around the global growth projections for 2017, and the balance of risks remains tilted to the downside, amid unclear prospects for policy direction in major economies [World Bank (2017)]. Hence, there is lot of uncertainty ahead of the international trading community in general and the EU in particular.
Furthermore, alongside the dramatic slowdown in global trade growth, the last few years have witnessed a growing backlash against globalization and free trade in many regions of the world, with a number of formerly open countries turning protectionist and inward-looking. More recently, free trade has become relatively unpopular even in the EU, as reflected by the rising public concerns about the impact of trade agreements and trade policy in general. The EU-Canada Comprehensive Economic and Trade Agreement (CETA), for example, took seven years to be finalized and was just about of being blown up in 2016 by the parliament of Belgium’s Wallonia region. The opposition to the CETA deal, but as well to the EU-US Transatlantic Trade and Investment Partnership (TTIP), another flagship project of the EU, showed that what used to be one of the most effective instruments of EU trade policy has become increasingly subject to public opposition. Actually, trade is now more debated than ever before in the Union as people are questioning both the fundamental benefits of open trade and the fairness and effectiveness of the means to achieve it.
In addition, the EU has now to cope with several major challenges arising from its internal agenda. These range from the need to stabilize the eurozone and manage in a rational and coherent manner the coming Brexit negotiations with the United Kingdom to
10 In September 2016, the WTO revised downward its trade forecast to 1.7% for world merchandise trade volume growth in 2016, from its earlier forecast of 2.8%, based on an expected global GDP growth of only 2.2%. The forecast for 2017 has been revised, too, with trade projected to grow between 1.8% and 3.1%, down from 3.6% previously [WTO (2016d)]. The World Bank estimates that global growth has fallen to a post-crisis low of 2.3%, in 2016, with a projected rise to 2.7% in 2017, while global trade growth slowed further to 2.5%, to its weakest pace since the global financial crisis; for 2017 a rise to 3.6% is expected [World Bank (2017)]. According to United Nations estimates, both world output and trade growth has decelerated in 2016, to just 2.2% and 1.2% respectively, which equates to the slowest rate of growth since the Great Recession of 2009. The world economy and world trade volumes are projected to grow by 2.7% each in 2017 [UN/DESA (2017)].

24 Romanian Economic and Business Review – Vol. 12, number 1
the need to weather the threats posed by the growing wave of populism, nationalism and euroskepticism that took hold of major EU member countries, such as Germany and particularly France. There are widespread fears that a victory of the nationalist tendencies, especially in France, could severely damage the European construction and even prompt the eurozone and the EU to fall apart. Therefore, the Union’s answer to its current challenges in terms of domestic politics and the outcome of the upcoming elections in France and Germany in particular are likely to set the very direction for the further development of the Union, including its trade agenda and the associated trade policies.
And last but not least, the EU will have to manage the risks posed by the radical change of gear in the new US administration’s vision on trade policy. The signals the new US administration under president Donald Trump has sent out so far suggest a comprehensive paradigm shift in American trade policy, from globalization towards protectionism and isolationism. Such a shift in trade policy orientation could be tantamount to a significant disruption of the liberal world order – established through US-European partnership following WWII – involving severe threats to the built-in multilateral institutions, alliances, agreements and commitments. Moreover, the new trade policy vision, with its underlying transactional approach to international trade agreements and skepticism about trade liberalization could even herald the United States’s disengagement from its pivotal role in shaping the liberal world order. Pursuing the “America first” strategy of isolationism and exacerbated protectionism would inevitably lead to trade retaliation by America’s trading partners, thereby increasing significantly the likelihood of trade wars. This might diminish both the dynamics and volume of trade, hindering thus global growth and ultimately damaging all economies in the world. Besides, such a conflictual approach to trade could even undermine the global trading system based on the WTO and cause its architecture to fall apart under the pressure of the unavoidable surge in new litigations submitted to its already overloaded dispute settlement system.
If this new course of trade policy is set to continue, it is likely to have far-reaching but yet unforeseeable economic and geopolitical consequences for the entire world.11 And while the full implications of such a shift are largely unpredictable, one thing is nevertheless certain: the cost to the EU would be tremendous, as much of its prosperity is based on liberal values and an open trade regime for both goods and services, and investment. Hence, it has huge stakes in preserving a rules-based global system. A relapse to a world dominated by protectionism, power politics, and competing nationalisms would undermine the EU’s very foundation as a transnational union that seeks collective solutions to its members’ problems [Lehne and Grabbe (2017)].
In face of these new challenges, the EU will need to increase its own engagement and international efforts even further and provide increased leadership as well as adopt a far more focused and ambitious approach to trade if it is to fare well under the new global circumstances.
While pursuing with enhanced determination its own trade agenda for advanced bilateral and regional free-trade agreements and pushing for the resumption of the
11 It is worth recalling the traumatic experience of the 1930s, when the world’s leading powers turned inward in a similar way, with America’s Smoot-Hawley Tariff Act (1930) unleashing global trade wars that compounded the Great Depression.

EU and the Challenges of Rising Global Protectionism 25
multilateral trade talks under the WTO still remain core objectives for EU trade policy, the Union will have to forge a strong international alliance to resist protectionism and defend the open and fair trading system centered on the WTO. As many countries still share a similar vision and wish to preserve the liberal world order and defend liberal values and promote an open trading system, the EU should rely on alliances of like-minded partners from both the developed and emerging world (e.g. Canada, Australia, New Zealand, China and India). Particularly emerging countries that have derived important benefits from globalization over the last decades, have now a major interest in keeping globalization going and withstanding protectionism. Against this background, the Chinese president Xi Jinping’s speech delivered at this year’s World Economic Forum annual meeting in Davos should be seen as an unequivocal statement in defense of globalization and a call for leadership of the open global economy [World Economic Forum (2017)].
As regards specifically the Union’s multilateral trade agenda, the EU should do much more to restore the centrality of the WTO as a negotiation forum for global trade rules and to revitalize its trade agenda. Except for some slight improvements, the WTO rulebook as the foundation of the world trading order, has remained largely unchanged since the Uruguay Round (1986-1994), due to the failure to conclude the Doha Round negotiations launched in 2001, but also the shift in the focus of WTO members’ interests and efforts toward the bilateral and regional agenda. Regardless of whether the Doha Round is considered dead or alive, the EU could build on the Bali and Nairobi momentum for reinvigorating the WTO agenda so as to ensure the delivery of further incremental, yet substantive results at the forthcoming 11th WTO Ministerial Conference and beyond this event. This means, first of all, dealing with some of the outstanding issues of the Doha Round, like agricultural domestic support or industrial subsidies, that only in the WTO can be tackled. Secondly, the EU should engage with a stronger determination in updating the WTO agenda, by addressing several urgent issues that are required by the 21th century global trade landscape, but are not yet subject to multilateral trade rules (such as e-commerce, SMEs, non-tariff barriers, regulatory practices, export restrictions, to name just a few). And last but not least, reviving the WTO and strengthening its capabilities to deliver multilaterally negotiated outcomes will require addressing the root cause of the current impasse in multilateral trade talks, which resides in the very lack of WTO members’ political will to compromise. This, in turn, relates to a highly sensitive political issue – namely, the growing imbalance between the relative contribution of developed countries and large emerging countries to the multilateral trading system and the benefits derived from it. While among the WTO membership there was no drive until now to discuss this sensitive problem in earnest, the EU may, nevertheless, prompt such a discussion and help finding the badly needed compromise, given both its economic weight in the global economy and traditional leadership within the WTO and the new challenges arising from the global trade scene.
Hence, taking over strong European leadership in multilateral trade cooperation will be decisive not only for preserving the multilateral trading system anchored in the WTO, but also for strengthening and improving the functions of the WTO, including on negotiation, dispute settlement and monitoring. And this, in turn, would support the Union’s own efforts to hold up trade protectionism.

26 Romanian Economic and Business Review – Vol. 12, number 1
References
Boz, Emine, Bussière, Matthieu and Marsilli, Clément. 2015. “Recent slowdown in global trade: Cyclical or structural?”. In: Hoekman, Bernard (Ed.). 2015. The Global Trade Slowdown: A New Normal, Vox.EU.org Ebook, pp. 55-70.
Constantinescu, Cristina, Aaditya, Mattoo and Ruta, Michele. 2015. “The Global Trade Slowdown: Cyclical or Structural?”. IMF Working Paper, 15/6, January, Washington D.C.
European Commission. 2011. Report from the Commission to the European Council. Trade and Investment Barriers Report 2011. Engaging our strategic economic partners on improved market access: Priorities for action on breaking down barriers to trade, COM(2011) 114, Brussels.
European Commission. 2014. Directorate-General for Trade. 11th Report on Potentially Trade-Restrictive Measures Identified in the Context of the Financial and Economic Crisis 1 June 2013 – 30 June 2014, Brussels.
European Commission. 2015. Trade for All. Towards a more responsible trade and investment policy.
European Commission. 2016a. Report from the Commission to the Council and the European Parliament on Trade and Investment Barriers and Protectionist Trends 1 July 2014 - 31 December 2015, Brussels, 20.6.2016 COM(2016) 406 final.
European Commission. 2016b. Press release. Steel industry: Commission takes action to preserve sustainable jobs and growth in Europe. Brussels, 16 March.
European Commission. 2016c. Report from the Commission to the Council and the European Parliament. 13th Report. Overview of third country trade defence actions against the European Union for the year 2015, Brussels, 15.6.2016 COM(2016) 392 final.
European Commission. 2016d. Trade. Accessing Markets. Accessed on 25 February 2017, at: http://ec.europa.eu/trade/policy/accessing-markets/index_en.htm.
European Commission. 2016e. Overview of FTA and Other Trade Negotiations. Updated January 2016. Available at: http://trade.ec.europa.eu/doclib/docs/2006/december/ tradoc_118238.pdf
European Commission. 2016f. Speech. Cecilia Malmström, Commissioner for Trade. “EU Trade Priorities in 2016”, 10 March, Peterson Institute, Washington D.C. Avaialble at: http://trade.ec.europa.eu/doclib/docs/2016/march/tradoc_154345.pdf
European Commission. 2017. Policy. EU Trade Commissioner Cecilia Malmström Bruegel Lunch Talk. “The future of EU trade policy”, Brussels, 24 January. Available at: http://trade.ec.europa.eu/doclib/docs/2017/january/tradoc_155261.pdf
Eurostat. 2016. Statistics explained. The EU in the world - international trade. Accesed on 20 January 2017, at: http://ec.europa.eu/eurostat/statistics-explained/index.php/ The_EU_in_the_world_
Evenett, Simon J. 2014. The Global Trade Disorder. The 16th GTA Report, Centre for Economic Policy Research. CEPR press. London.
Evenett, Simon J. and Fritz, Johannes. 2015. “Crisis-era trade distortions cut LDC export growth by 5.5% per annum”. In: Hoekman, Bernard (Ed.). 2015. The Global Trade Slowdown: A New Normal, Vox.EU.org Ebook, Centre for Economic Policy Research. London, pp. 267-278.
Evenett, Simon J. and Fritz, Johannes. 2016. “Global Trade Plateaus”, The 19th Global Trade Alert Report, Centre for Economic Policy Research. CEPR press. London.
Freund, Caroline. 2016. “Global Trade Growth: Slow But Steady”. In: Olivier Blanchard and Adam S. Posen (Eds.). Reality Check for the Global Economy. March. PIIE Briefing 16-3, pp. 19-22.

EU and the Challenges of Rising Global Protectionism 27
G20. 2008. Declaration of the Summit on Financial Markets and the World Economy. November 15. Washington D.C. Available at: http://www.g20.utoronto.ca/2008/ 2008declaration1115.html.
G20. 2016. G20 Leaders’ Communique Hangzhou Summit, Hangzhou, 5 September. In: European Commission (2016). Press Release Database. Statement. Available at: http://europa.eu/rapid/press-release_STATEMENT-16-2967_en.htm.
Ghibuțiu, Agnes. 2016. “Evoluţia comerţului internaţional în 2015 şi perspectivele pentru 2016-2017. Tendințe recente în sistemul comercial internațional” (The Evolution of World Trade in 2015 and the Prospects for 2016-2017. Recent Trends in the Global Trading System). In: Poladian, S., Pop, N., Albu, C. and Cartas, M. (Coords), Conjunctura Economiei Mondiale – 2016, Institute for World Economy. Bucharest, pp. 17-46.
Haugh, David, Kopoin, Alexandre, Rusticelli, Elena et al. 2016. “Cardiac Arrest or Dizzy Spell: Why is World Trade So Weak and What Can Policy Do about It?”. OECD Economic Policy Paper No.18, September, OECD, Paris.
Hoekman, Bernard. 2015. (Ed.). The Global Trade Slowdown: A New Normal? A VoxEU.org eBook, Centre for Economic Policy Research, London.
Hufbauer, Gary and Jung, Euijin. 2016. “Why Has Trade Stopped Growing?: Not Much Liberalization and Lots of Micro-Protection, Peterson Institute for International Economics, March, Washington D.C.
Lehne, Stefan and Grabbe, Heather. 2017. “How Donald Trump Could Save EU Foreign Policy”. Carnegie Endowment for International Peace, January 12.
Ollivaud, Patrice and Schwellnus, Cyrille. 2015. “Does the Post-Crisis Weakness of Global Trade Solely Reflect Weak Demand?”. OECD Economics Department Working Papers, No. 1216, OECD Publishing, Paris.
UN/DESA, UNCTAD and the five UN regional commissions. 2017. World Economic Situation and Prospects 2017. January. United Nations, New York.
World Bank. 2017. Global Economic Prospects. Weak Investment in Uncertain Times. A World Bank Group Flagship Report. January. Washington D.C.
World Economic Forum. 2017. President Xi's speech to Davos in full. WTO. 2015a. PRESS RELEASE. Modest trade recovery to continue in 2015 and 2016
following three years of weak expansion. PRESS/739. 14 April, Geneva. WTO. 2015b. World Trade Report 2015, Speeding up trade: benefits and challenges of
implementing the WTO Trade Facilitation Agreement. Geneva. WTO. 2015c. NEWS ITEMS. MINISTERIAL CONFERENCE, 10TH, NAIROBI. WTO
members secure “historic” Nairobi Package for Africa and the world. 19 December. WTO. 2016a. Report on G20 Trade Measures (mid-October 2015 to mid-May 2016). 21
June. Geneva. WTO. 2016b. Report on G20 Trade Measures (mid-May 2016 to mid-October 2016). 10
November, Geneva. WTO. 2016c. PRESS RELEASE, TRADE STATISTICS AND OUTLOOK. Trade growth
to remain subdued in 2016 as uncertainties weigh on global demand. PRESS/768. 7 April. Geneva.
WTO. 2016d. PRESS RELEASE, TRADE STATISTICS AND OUTLOOK. Trade in 2016 to grow at slowest pace since the financial crisis. PRESS/779. 27 September. Geneva.
WTO. 2017. NEWS ITEMS, TRADE FACILITATION. WTO’s Trade Facilitation Agreement enters into force. 22 February. Geneva.

THE IMPACT OF TECHNOLOGY ON PROMOTING TRAVEL AND LEISURE SERVICES IN THE 21ST CENTURY
Beatrice Sion, Patricia Dodu, Andreea Rozalia Manoliu
Abstract The direct interaction of the consumer with the travel products and services, combined with the way in which the smartphones and the internet are redesigning the tourism & travel industry led to a re-evaluation of the industry's products and services and their adaptation to meet the consumers' needs. Technological advances resulted in a much easier and faster access to all travel-related services: online check-in, virtual boarding passes, virtual hotel check-ins, real-time news and updates, maps, GPS guidance, instant messaging and photo services, all are now tied to the same mobile device, the smartphone. Smartphones not only impacted a single aspect of the travel experience, they actually improved all of them.
Keywords: technology, online marketing, social media, CRM, GDS, travel, vacations JEL Classification: M30, L83.
1. Introduction New technologies have altered the power balance between business and customers,
offering the latter valuable information used for travel planning. The World Travel & Tourism Council research studies show that 92% of the consumers trust the recommendations from others, while 33% use social media to research and plan their vacations.
In 2015, the global online market for tourism services is far from being mature, continuing the constant growth trends across all categories and geographical regions, led by the emerging markets and followed by the developed ones. In 2013, North America was the top region for online travel sales, but the expected growth rate for the next 5 years is ranked last among the world's regions at 7%. It is anticipated that the Western Europe will catch up with North America by 2017, while the Asia-Pacific region is expected to have the highest growth rate over the same 5-year period, reaching $155 billion in online travel sales in 2017, double the $78 billion from 2012. This growth is driven by the investments in new technologies that will allow more sophisticated targeting and access to personalized services.
Beatrice Sion and Patricia Dodu are at the Romanian American University in Bucharest. Andreea Rozalia Manoliu is Ph.D student at the Academy of Economic Studies in Bucharest. E-mail: [email protected], dodu.patricia@ professor.rau.ro, [email protected]

The Impact of Technology on Promoting Travel and Leisure Services in the 21st Century 29
2. The Impact of Technology on the Modern Travel By definition, the travel industry requires access to a wide range of information
and, therefore, is positioned to greatly benefit from the new communication technologies, multimedia applications and information systems.
Technological advances and the travel industry moved forward together throughout the years, and this partnership contributed directly to the globalization of tourism. The first Computer Reservation Systems (CRS), the Global Distribution System (GDS), combined with the expansion of the Internet led to a radical change in the operational and strategic practices in the industry.
In the last 20 years, we've been witnessing a wave of technological transformations across all areas of human activity that further led to the development of new tools for global communications and interactions that the large players from the travel industry have been quick to adopt and use.
Andrew J. Frew's research estimated that only 665 refereed articles on tourism-related topics were published in the 20 years period between 1980 and 19991. At the same time, today's statistics paint a completely different image, considering the sole example of TripAdvisor, with its more than 60 million members and over 170 million reviews and opinions about hotels, restaurants and attractions throughout the world2. The technological advances give consumers reliable access to detailed information and easy access to real-time reservations without the additional costs and inconveniences specific to the conventional channels.
Currently, the most critical step in the booking process is the information search, both in terms of the travel services and destinations, thus reducing consumers' uncertainty and improving the quality of services rendered.
The Internet is the most important and impactful IT tool, one that significantly altered tourists' behaviors and allowed them to interact directly with the suppliers, thus by-passing any middlemen.
The technological advances available in today's society pushed the barriers of the human interactions in different ways. Mobile devices became ubiquitous and their impact is felt globally; they are becoming more and more popular in the travel industry, mainly due to their limited size. While still offering limited capabilities compared to a traditional computer, smartphones have been improving rapidly, offering capabilities and features unimaginable just a few years ago. Modern smartphones allow the download of various apps, including travel ones. Virtually all online travel agencies offer their own apps that can be used for mobile bookings, price quotes and research of travel destinations and attractions.
Apple, one of the most innovative and successful companies in the world, manufacturer of (among other products) the iPhone and iPad, launched a new app called iTravel. For now, this app is tied to Apple Wallet, Apple's payment/ electronic wallet app. Using the 2 apps together, users can store boarding passes, travel reservations, coupons or gift cards. It is expected that Apple will continue expand iTravel's features and will enter the online travel market in the near future.
1Frew, A J. (2000). A Critical Analysis of Tourism Information Technology Research. 2TripAdvisor, www.tripadvisor.com

30 Romanian Economic and Business Review – Vol. 12, number 1
Expedia Media Solutions (Expedia's advertising sales division) published the results of a study profiling the U.S. users of mobile devices (smartphones and tablets) who use them to gather information and purchase various services. The results show that, in the U.S., more than 172 million people use smartphones, up 22% compared to the previous year, and more than 93 million tablet users. 29% of the tablet users and 21% of the smartphone users made at least one booking using their mobile device, for a total of more than $8 billion in online travel sales. Currently, the number of consumers who engage with online travel content using their mobile devices exceeds that of those using traditional PCs. Even though only 6% of the bookings are made using mobile devices, more than 70% of the travelers use their smartphones or tablets to research their travel options and itineraries3.
This study shows the upward trend of the new technology, either through the new mobile devices, but also through the traditional ones, such as laptops and desktop computers. All these advances are driven by the Internet, which became the key technology of the today's society.
Table 1 shows an analysis of the worldwide number of Internet users as percentage of the total population. We can also observe the annual growth in the number of Internet users compared to the annual population growth.
Table1. Worldwide Internet Users
Year Number of Internet Users
(World)
Percentage Growth in
the Number of Internet
Users (World)
Population (World)
Percentage Growth in Population
(World)
Percentage of
Population with Internet
Access (World)
2014 2,925,249,355 7.9% 7,243,784,121 1.14% 40.4%
2013 2,712,239,573 8.0% 7,162,119,430 1.16% 37.9%
2010 2,034,259,368 16.1% 6,916,183,480 1.19% 29.4%
2005 1,029,717,906 13.1% 6,514,094,610 1.22% 15.8%
2000 413,425,190 47.2% 6,127,700,430 1.26% 6.7%
Source:www.internetlivestats.com
Compared to the year 2000, when the Internet access was still in its infancy, more than 40% of the world's population now has access to it, with forecasts showing a 50% penetration in the near future. As the penetration rates grow, so do users' familiarity with this new medium and their level of confidence in making online purchases of goods and services.
3. New Promotion Strategies in the Travel & Leisure Industry
The Internet is recognized as an extremely valuable marketing tool, offering substantial benefits compared to the traditional communication channels: lower
3Expedia Media Solutions, www.advertising.expedia.com/insights/research

The Impact of Technology on Promoting Travel and Leisure Services in the 21st Century 31
communication costs, quick transfer of information, higher levels of consumer involvement, good control and monitoring of transactions and significant flexibility in designing the marketing mix. Its main functions in the business world include communications, product development, market research, customer service, direct marketing and advertising.
Online marketing, also called online advertising or Internet advertising, is a form of marketing and advertising which uses the Internet to deliver promotional marketing messages to consumers. It includes email marketing, search engine marketing (SEM), social media marketing, many types of display advertising (including web banner advertising), and mobile advertising.4
Fig. 1 - Advertising revenue market share by media - 2014 ($ billions)
Source: PricewaterhouseCoopers, IAB Internet Ad Revenue Report 2014
PricewaterhouseCoopers 2014's “IAB Internet Advertising Revenue” report shows Internet advertising as having the largest advertising revenue market share. The same report also places the travel/ leisure industry in the 5th spot in terms of Internet ad revenues by major industry category, behind industries such as auto or telecom, but ahead of pharma & healthcare or computing products.
Online advertising includes a newly developed field that promises to become one of the key areas of tomorrow's advertising: mobile advertising (or advertising delivered through smartphones and tablets), an area with a spectacular YOY (2014-13) growth of 76%.
The Internet is unique in its ability to transform the traditional one-to-many communication into one-to-one messaging. Traditional mass-media (such as radio, TV, newspapers or magazines) follow a passive, one-to-many communication model, through which a company uses the same message to reach its current and loyal customers as well
4Wikipedia.org, Online advertising, http://en.wikipedia.org
$0.8
$1.0
$8.4
$12.8
$16.7
$17.2
$25.2
$40.5
$49.5
Cinema
Video game
Out of home
Magazine
Newspaper
Radio
Cable TV
Broadcast TV
Internet
32 Romanian Economic and Business Review – Vol. 12, number 1
as prospects. The Internet, though, allows the company to send customized, even at the individual level, messages to a single consumer or to a small group of consumers. Email, direct sales or phone sales are similar to the Internet in the sense that they all allow targeted communications and contacts, but the Internet is still unique in its ability to offer extremely low costs, combined with the instant transfer of information.
A well-designed Internet communication campaign (through email and websites) can match the results of direct sales, but with a significantly higher flexibility and much lower costs.
Printing paper catalogs and brochures that include information on travel destinations, their availability and prices is a common practice in the travel and leisure industry. However, this process is lengthy and expensive, not to mention the fact that pricing and availability change frequently. The Internet replaces these traditional catalogs with virtual ones, which can be distributed (and updated whenever needed) without any additional costs.
Online marketing allows companies to improve the quality of the customer interactions before, during and after the sale. Customer satisfaction depends heavily on the accuracy and relevance of the travel info and on the prompt answers to any questions they might have. The quick and improved access to information allowed marketers to offer personalized services, usually at lower prices compared to those of the standardized travel packages.
4. Social Media and Its Impact on Travel
The large scale use of the Internet in the search of travel information and the new Web 2.0 technologies, such as blogs, Facebook, Instagram, Twitter or Google+ allowed the individuals interested in travel to get the information needed in a very efficient way and to communicate with the suppliers of travel services in real time.
The Web culture revolutionized the travel industry and we can now easily distribute large amounts to a large number of individuals.5
Social networks, such as Facebook, Instagram and Twitter continue to grow their user base and to expand the roles they play in the communication process; such networks can be used to share breaking news, pictures, videos, offering innovative way of interaction between businesses and consumers.6
Instagram is one of the social networks with the largest impact in the travel area. Since its launch in 2010, this service has seen an unprecedented success with over 300 million users, 70 million photos uploaded every day and over 2.5 billion likes a day.7
According to a research study completed in France by Kindai, a local company specialized in social media communications, the most attractive activities on Instagram are travel-related (for 45% of the users), while 58% of French Instagram users have wanted to buy a product their Instagram “friends” have posted in their profile and 47% have visited a place based on a photo published by one of their friends.8 5Richemond, E. (2013) ECSP – Socially Performing 6World Trade Organization (WTO), www.unwto.org 7Instagram website, www.instagram.com 8Kindai website, http://kindai.fr/etude-instagram-les-nouveaux-influenceurs

The Impact of Technology on Promoting Travel and Leisure Services in the 21st Century 33
Social media has a large impact on all industries, and travel is no exception; social media's role is most evident in researching the travel destinations and options, buying the travel services and sharing the own experiences during and after the trip. Travel & leisure industry relies heavily on people sharing those experiences and opinions and social media offers the perfect platform for this. The online environment is a powerful travel planning tool and ignoring it can cause significant damage to a company.
Fig. 2 – Engaging customers through social media
Source: Euromonitor International (2014), The new online travel consumer
A Hotel Marketing study reveals that 64% of the tourist use social media while on their trip, while 22% of those blog about their travel experiences and 55% of the Facebook users liked at least one page connected to the travel and leisure area.9
Social media is a very engaging tool for building customer loyalty, but a less efficient one for generating bookings in the short-term.
According to World Travel Market London, social media is one of the three critical evolutions that contributed to the growth of online travel. Social media led to new business models, the so-called “peer-to-peer” travel10, where various individuals can share resources among themselves without the need to use a centralized system. As a result, the WTM experts expect to see more and more peer-to-peer travel websites specialized in sharing accommodations, cars, trips and other travel activities.
Conclusions By definition, the travel industry requires access to a wide range of information
and, therefore, is positioned to greatly benefit from the new communication technologies, multimedia applications and information systems. The large scale use of the Internet in the search of travel information and the new Web 2.0 technologies allowed the individuals interested in travel to get the information needed in a very efficient way and to communicate with the suppliers of travel services in real time. The Web culture
9Hotel Marketing website, www.hotelmarketing.com 10WTM website, www.wtmlondon.com
Tourism Boards
Airlines
Travel Retailers
Hotels
Brand awareness
Customer Service
Loyalty
Promotion Social Media

34 Romanian Economic and Business Review – Vol. 12, number 1
revolutionized the travel industry and we can now easily distribute large amounts of information to a large number of individuals.
The significant growth in online travel impacts not only the Online Travel Agencies (OTAs), but also the traditional tour-operators, who are forced to adapt their market strategies and adjust to the new consumer demands.
The number of consumers of online travel services keeps rising, as a result of the extensive use of technology and mobile devices. The modern traveler expects to try new experiences, to step outside his comfort zone and to feel new sensations.
Regardless of the factors impacting tourism, we have to remain hopeful that the future of this industry is sustainable, the travelers will become more responsible will preserve the identities and cultures of the places they visit and will develop stronger and more meaningful ties with them. In the end, all these might influence travel agencies' behavior and approach as well: instead of asking a prospective client “Where would you like to go?”, they might ask “What do you really expect and want from your vacation?”
References
1. Buhalis D, Tourism Distribution Channels: Practices, Issues and Transformations, 2001 2. Buhalis D., Law R., Progress in information technology and tourism management: 20
years on and 10 years after the Internet, 2008 3. Buhalis D, Fotis J, Rossides N, Social media use and impact during the holiday travel
planning process, 2012 4. Buhalis D., Chung Y, Information Needs in Online Social Networks, 2008 5. Dodu P., Tehnici operaţionale în agenţia de turism, Ediția a II-a, Editura Pro
Universitaria, Bucureşti, 2008 6. Beatrice Sion, Cezar Mihălcescu, Alexandra Mărginean, Blogs–an instrument of the
social media and its Google indexation in view of improving the quality of Romanian tourism services, Supplement of “Quality - Access to Success: “Globalization and competitiveness in the knowledge-based economy”, 3th edition of International Conference, Bucharest- Romania, vol. 14, S2, pp. 430-437, 2013, ISSN 1582-2559
7. Daniela Firoiu, Beatrice Sion, Cezar Mihălcescu, Strategic Implications of eTourism for the consumer of the future, Recent Advanced in Mathematics and Computers in Business and Economics, Proceedings of the 10th WSEAS International Conference on Mathematics and Computers in Business and Economics (MCBE’09), Prague, Cech Republic, no. 10, pp. 76-81, march 2009, ISSN 11790-5109, ISBN: 978-960-474-063-5
8. Cezar Mihălcescu, Beatrice Sion, Modeling and optimizing the business processes using Microsoft Office Excel, Journal of Information Systems & Operations Management (JSOM), vol. 7, no. 2, Bucharest, Romania, pp. 414-421, december 2013, ISSN: 1843-4711
9. Patrichi I., Turism internațional. Evoluție, particularități, tendințe, Editura Universitară, București, 2013
10. Amadeus, Future Traveller Tribes 2030 - Building a more rewarding journey, http://www.amadeus.com/documents/future-traveller-tribes-2030/amadeus-traveller-tribes-2030-airline-it.pdf
11. PhoCusWright , European Online Travel Briefing 2015, http://www.itb-kongress.de/media/itbk/itbk_dl_de/itbk_dl_de_itbkongress/archiv_2015/phocuswright/Phocuswright_Research_-_European_Online_Travel_Briefing_2015.pdfs
CHINA’S URBAN DEVELOPMENT. ITS SPECTACULAR ASCENT, DOWNSIDE
AND STRATEGICAL RETHINKING
Sarmiza Pencea, Ana‐Cristina Bâlgăr
Abstract Since 2007, when for the first time in history the world urban population exceeded the number of rural inhabitants, humankind has become predominantly urban. Today, over 54% of Terra’s inhabitants are city dwellers and the world’s urbanization trend advances resolutely, with China among its main and most powerful drivers. As China’s urbanization is considered one of the two great, long-term processes that will crucially influence the development of mankind in the 21st century, along with the technological revolution led by the US, this paper aims at scrutinizing the peculiarities of this all-important process, focusing on its current weaknesses, imperfections and trends. It also looks at the planned urban development reform projects, identifying the challenges that are to be faced and the most probable prospects for China’s urbanization process.
Key words: China, urbanization, urban model, urban planning, urban reform, rural
migrants JEL Classification: O18, O53, P25, R58, J21
1. Introduction Mankind has become predominantly urban only since 2007. In the early ’60s only
one third of the world population lived in towns, while at present city dwellers account for 54% (World Bank, 2016). As the global trend of urbanization advances steadily, it is forecasted that by 2050 two thirds of the world population will live in cities, while only one third will remain rural (United Nations, 2014) and therefore, by that time, the urban/rural balance of the ’60s will be completely reversed.
An extraordinary urbanization process has also taken place in China over the recent more than three decades of reform, paving the way for an outstanding socio-economic development (Chart1). This has already contributed greatly to the global urbanization trend and is surely going to continue to do so in the future.
Sarmiza Pencea, Phd., Senior Researcher, Institute for World Economy, Romanian Academy, e-mail: [email protected]. Ana-Cristina Bâlgăr, Phd (c), Senior Researcher, Institute for World Economy, Romanian Academy, e-mail: [email protected].

36 Romanian Economic and Business Review – Vol. 12, number 1
Chart 1: Urbanization rates (1960-2015) – World average and China (%)
Note: Urban population as percentage of total. Urban population refers to people living in urban areas as defined by national statistical offices. Source: The authors, using World Bank (2016) data. The data are collected and smoothed by United Nations Population Division.
If, in the early ’60s, only little over 16% of China’s population was urban – twice
less than the world average, which was quite low itself (33.6%) at the time – the country’s urbanization rate has continually and substantially improved during the following years and, as a result, in 2011 it exceeded for the first time in history the 50% threshold, in 2013 it bettered the world average (53.2% vs. 52.5%) and, at present, it has already got beyond 56%1. According to the Economist Intelligence Unit (EIU), the urbanization rate in China is going to reach 61% in 2020, 67% in 2030 and 80% in 2080, matching by then the average level of today’s OECD countries (EIU, 2014). China’s own leading planning think-tank, the NDRC2, aims at turning the urbanization process into a future powerful economic growth engine and, to that end, it establishes ambitious tasks and targets for the next decades. As such, China will undoubtedly remain one of the underlying propellers of global urbanization and against the background of its impressive demographic and economic magnitude, as well as of its advanced integration into the world economy, it will also increasingly influence all the other actors on the world stage, their mutual relations, the global markets and the entire international business environment.
Considering all the above, this paper aims at scrutinizing the peculiarities of this all-important process, laying stress on its current weaknesses, imperfections and trends. It also looks at the planned urban development reform projects, aiming at identifying the
1While the World Bank levels 53.9% (2015), the official data of China’s National Bureau of Statistics is 56.1% (http://data.stats.gov.cn/english/easyquery.htm?cn=C01,retrieved on20.01.2016); 2National Development and Reform Commission.
1960 1980 1990 2000 2010 2011 2012 2013 2014 2015
China 16.2 19.4 24.4 35.9 42.2 50.6 51.9 53.2 54.4 55.6
World average 33.6 39.3 42.9 46.5 51.4 52 52.5 52.3 53.4 53.9
0
10
20
30
40
50
60
China World average
Linear (China) Linear (World average)
China’s Urban Developement. 37 Its Spectacular Ascent, Downside and Strategical Rethinking
challenges that are going to be faced, the most probable prospects for China’s urbanization process and their implications.
2. Chinese urbanization: telltale facts and figures Without doubt, China’s urbanization progress is impressive in terms of both speed
and of scale and quantitative accomplishments. For instance, the fact that China only needed 30 years to achieve the leap from 20% to over 50% urbanization rate, while the same progress had required over 60 years in the US and about 100 years in Europe (EIU, 2014), is spectacular and indicative of the country’s huge catching up effort and remarkable transformation. On the other hand, it also speaks about very different economic and historical settings: Europe and the US seem to have inched on their urbanization path as compared to China because they were, at the time, development path-finders, having to innovate all along the way, while in the recent decades, China has been able to tap into the advantages of globalization, with its development having been accelerated through knowledge and capital transfer, in various ways, including massive industry relocations from the Western world. Yet, from now on, in a changing global and domestic environment, China’s ambitious plan of taking the next leap, from a rate of urbanization of 51%, to 70%, in only 19 years (2011-2030) –as compared to the similar accomplishment of the US, which took 50 years (1920-1970)(Stratfor, 2014) –will have to rely substantially more on nurturing its local innovation and creativity as drivers of the economic development needed to foster and speed up both its growth and its urbanization.
According to recent accounts by the World Bank and NDRC (2014), following Deng Xiaoping’s reforms, the number of city dwellers with permanent residence has grown over four times in China –from roughly 170 million in 1978, to about 750 million in 2014–and, consequently, the country came to concentrate the largest urban population in the world. This ranking will be undoubtedly preserved and reinforced once the plan for the relocation of another 100 million people from villages into towns by 2020 is completed, all the more so if some 230 million people are added to the country’s urban population by 2030, as forecasted by Stratfor (2014). Such an increase would equate with the addition to China’s current urban dwellers of the whole population of ten of the most populous cities in the world3and would entail building new towns, enlarging some of the existing ones and, more importantly, devising proper policies and systems to better manage both the rural-to-city migration and the very functioning of these growing human agglomerations. As it has already determined the rural-to-city relocation of about half a billion people and it will continue to move some other hundreds of million inhabitants from villages to towns, China’s urbanization process has generated the largest human migration in history. Managing this is, obviously, no easy task.
With the advancement of the urbanization process, both the number and the scale of Chinese towns have kept growing. Between1978 and 2014, their number grew more than three times, from 193 to 653 (Hairong, 2016) and, consequently, China has become the country with the largest number of towns, globally (Meissner, 2014). In terms of scale, it is relevant that out of the total of 653 towns, 140 accommodate over 1 million inhabitants each, and that among these 140 towns, there are, currently, ten big cities of 5
3Tokyo (37.2 million inhabitants), Jakarta (26.7), Seoul (22.8), Delhi (22.8), Shanghai (21.8), Manila (21.2), Karachi (20.9), New York (20.7), Sao Paulo (20.5) and Mexico City (20.0).

38 Romanian Economic and Business Review – Vol. 12, number 1
to 10 million citizens, and six megacities of over 10 million people, as compared to the 1978 situation, when there were only five big cities in China and no megacity. Further on, by 2030 China will add one more megacity and six more big cities of 5 to 10 million inhabitants to its respective totals.
Chinese towns are some of the most rapidly growing in the world. It is notable that in the global hierarchy of the first ten most rapidly growing megacities (Table 1), only China is represented by four cities and that the population of these cities grew by 40% to 56% in just a decade. Nevertheless, in the future, Chinese megacities are expected to refrain from growing as they did, and the most rapid urban population growth will take place in the small and average-sized towns which accommodate over half a million inhabitants(UN, 2014).
Table 1: Top 10 most rapidly growing megacities in the world
Rank Megacity Country Total population
(million inhabitants 2010, est.)
Population growth
2000-2010 (%)
1. Karachi Pakistan 20.88 80.5 2. Shenzhen China 12.51 56.1 3. Lagos Nigeria 12.09 48.2 4. Beijing China 18.24 47.6 5. Bangkok Thailand 14.54 45.2 6. Dhaka Bangladesh 14.34 45.2
7. Guangzhou-
Foshan China 17.69 43.0
8. Shanghai China 21.77 40.1 9. Delhi India 22.83 39.2
10. Jakarta Indonesia 26.75 34.6 Source: The authors based on Demographia (2016); Kotkin&Cox (2013).
Many other parameters may also illustrate the amplitude and impact of the Chinese
recent urban development. For instance, we find it very significant that Chinese towns have come to cover now about 49000 square km –seven times more than in 1978, at the onset of the urbanization process (Xinhua, 2016)–and that their unimpeded expansion has led to the requisitioning of large surfaces of agricultural land, a very scarce resource in this country, and to the forced relocation of about 64 million families. At the same time, urban development has implied the building of over 129 million new apartments and an ample process of infrastructure development (Meissner, 2014).
Sky-scrapers have become symbols of Chinese modern towns. Although it started erecting them much later than other countries, China has soon managed to rank first as regards the total number, the height and, sometimes, even the speed of sky-scraper raising. In the global top ten cities with the largest number of sky-scrapers, China currently has five representatives4, accounting together for 50% of the total. Also, out of the 20
4Hong Kong (the 1st, with 303 sky-scrapers), Shanghai (4th, 126), Chongqing (7th, 94), Guangzhou (8th, 93) and Shenzhen (9th, 81), cumulate together 697 sky-scrapers, accounting for 49.9% of the

China’s Urban Developement. 39 Its Spectacular Ascent, Downside and Strategical Rethinking
highest buildings completed worldwide in 2015, 12 were built in China, which managed for the eighth year in a row to erect the largest number of buildings exceeding a height of 200 m (62, accounting for 58% of the world total number) (WSJ, 2016). On the other hand, in terms of infrastructure development, China has built the longest high-speed train network in the world (13000 km), which has outstripped the cumulative length of all the other similar networks elsewhere. It has also built over 60000 km of highways and more than 100 airports (Meissner, 2014). Haplessly, all this outstanding building activity has also involved a huge and sometimes irrational consumption of resources5, high corruption, high pollution and the inflation of debt and real estate bubbles6.
3. Salient features and weaknesses of the current Chinese model of urban
development Its fast and extensive urban development, the associated huge, unprecedented scale
of rural-to-urban human relocations, as well as the complexity of managing such an ample change, singles out China’s urbanization process in the world history. Humankind has never undergone a shift so ample in such a short time span. That is why, besides the undisputable positive impact of the urbanization process on people’s living standards, and besides China managing comparatively better the risks of such a broad shift as opposed to other developing countries undergoing similar mutations, it would have been very unrealistic to imagine that the urban policies, measures or decisions made could have been completely devoid of weaknesses or mistakes, that they could have never failed, or could have not generated any unexpected negative consequences. When high urban sprawl, pollution, traffic jams, water or electricity failures, poor public services, other various inefficiencies become endemic, multiply and worsen, they normally signal both a problematic urban development model and significant management weaknesses asking for adjustment.
China’s current urban development model bears the marks of the country’s geography and history, as well as those of its economic development model and of the ambitions of its political class. Geography has significantly influenced the spatial sequencing of China’s economic development effort. It is because of the geographic features and natural endowment of the eastern regions – which enjoyed better land, water supplies and weather conditions, as well as easier access to the rest of the world through their ports - that the towns and villages on the eastern coast were the first to develop and grow, in time, into flourishing megacities. The landlocked, more central regions, with their large surfaces of land, natural resources of the subsoil and large pools of available labour, ready to develop various industrial activities in and around growing cities, followed somewhat later. Nowadays, belatedly because of their harsh landforms and weather conditions, poor water supplies and scarce population, the western regions’ turn to develop has finally come. As such, it is geography, local natural endowment and the economic
total top 10. Available at: http://themysteriousworld.com/10-cities-with-most-skyscrapers/, retrieved on 20.09.2016 5For instance, China’s cement consumption between 2011-2013, outstripped the whole US cement consumption during the entire 20thcentury (Swanson, 2015). 6A racing growth in sky-scraper numbers is often a symptom of a developing real estate bubble.
40 Romanian Economic and Business Review – Vol. 12, number 1
policy decisions made against their backdrop that are responsible, to a great extent, for the present development gaps among the eastern and western parts of China, as well as for human settlements clustering and developing predominantly in the eastern and central regions, where urbanization has benefited from an earlier start and a faster advancement.
History has certainly left its mark on China’s urbanization process, too. Alongside valuable historical districts and traditional architecture monuments which have only partially endured beyond the modernization upsurge of the recent decades, modern Chinese cities still mirror the features and style of the soviet urbanism: they are usually crisscrossed by large, four-to-eight-lane avenues, bordered by rows of huge, aligned, monolithic super-blocks with extremely long facades. These buildings make it impossible to have sufficient lateral streets for traffic dispersal and therefore contribute to the chronic traffic jams and high air pollution that severely affect Chinese big cities nowadays. At the same time, they are very expensive to build and operate, they dehumanize architecture and create an unfriendly environment for citizens.
The ambitions of the political class and the rules it has devised have also visibly influenced urban development in China. Eager to signal that their country is in step with modern times and the equal of Western developed nations, Chinese leaders have encouraged the “import” of Western architecture, urbanization principles and style, but unfortunately, according to experts, in practice, the most anachronistic architecture and design principles, long abandoned in the rest of the world, have been internalized (Shepard, 2016). Lots of sky-scrapers, huge office buildings, large malls and especially some veritable collections of “architectural trophies” authored by the world’s most famous architects, were meant to convey this message around the globe. This was one of China’s ways of announcing its entrance as a powerful player on the global scene (Bosker, 2016). The construction frenzy, which was often preceded by the demolition of old, traditional neighbourhoods and by forced relocations of households, led to an extensive depersonalization of cities, which came to look almost identical. In extreme cases, it has even materialized into the exact replication of famous, symbolic Western buildings.
Moreover, the huge buildings that populate Chinese towns, either dating back to the soviet influence era, or to the more recent times when the influence of the Occident has been stronger, bear the imprint of China’s economic development model, in which the state still owns an important part of the economy and actively interferes in economic activities. Many of the suppliers, builders and beneficiaries of these buildings are often state companies or agencies which, on the one hand benefit from generous public subsidies and, on the other hand, are not kept liable for the way in which they make their investments, or for how necessary, adequate or effective the existence of these buildings and their operation are. As such, both the construction and the operation of these buildings (their decay due to idleness included) often involve huge costs, excessive building material consumptions and waste. At the same time, Chinese cities are short of hospitals, schools, parks, landfills, underground pipe networks and many other utilities, so that, with all their modern (but common) aspect, they are rather “unfriendly” toward their citizens.
Additionally, many of China’s towns still mirror the central-planning mindset. Being built to serve a development model in which industrial production and export are the main engines of growth, rather than being focused on domestic trade and consumption, or on services for the welfare and comfort of communities, Chinese towns

China’s Urban Developement. 41 Its Spectacular Ascent, Downside and Strategical Rethinking
are primarily industry-oriented. Due to this approach, the largest number of jobs in Chinese cities is concentrated downtown, which is another underlying cause of the traffic jams and high air pollution in these areas.
The investment - and export - led development model has successfully generated steep economic growth for over three decades and, in its turn, economic growth has nurtured the rise of China’s middle class. Currently, many of the rich and middle-class representatives live in gated communities, which are residential green areas protected by fences and watchmen, in which a small number of affluent families have their houses. These small “forbidden cities” cannot be crossed by other people, both common pedestrians and public transport vehicles having to take long detour routes. As such, these enclosed communities – which are another important salient feature of Chinese towns -also contribute to the increased traffic jams and air pollution of big cities, as well as to their low density, high urban sprawl, excessive overall fuel consumption and high overall transport costs. Similar outcomes are also generated by the development of satellite towns linked through concentric highway rings to the downtown of the larger central city, where they bring a great number of vehicles in a very short time, aggravating the very traffic congestions they had been supposed to solve.
Rule-making is another source of weaknesses for China’s urban development. For instance, the system of incentivizing and promoting local leaders relies on rules which connect the professional future of these people to the economic results obtained by the communities they manage. Chasing after larger and faster-growing local GDPs, these leaders would force investments in infrastructure development and city expansion, using funds from the two main financing sources they have at their disposition: (i) bank loans, driving indebtedness to alarming levels and raising the legitimate question of whether urbanization is truly supporting economic growth or, rather, it generates dangerous time bombs of overinvestment and high debt, and (ii) agricultural land requisition for the purpose of leasing land to real-estate developers, a method that has also triggered multiple negative outcomes: (a) an incontrollable urban expansion, coupled with a drastic reduction in agricultural land area, already insufficient in China; (b) the development of low density towns with high urban sprawl, which have boosted the need for additional transport infrastructure building, have prolonged the daily commuting time for millions of inhabitants and have raised the number of personal cars, traffic congestions, air pollution and the overall fuel consumption in cities; (c) the advent of ghost districts and cities; (d) the surge of corruption and illegal enrichment among local government officials; (e) the abuse against farmers, who had been deprived of land on the strength of inconsistent land ownership laws.
Under these circumstances, high rural-to-urban land conversion has kept contributing to the inequitable redistribution of wealth among the members of the Chinese society and to the deepening of the income and wealth gaps between the urban and rural populations. According to The Economist (2015), urban land has doubled in China since the year 2000 and 40% of the new urbanites originate in villages having been engulfed by the near-by cities. As to the income and living standard gaps, it is well documented that the disposable income of the rural population is, on the average, about three times smaller than that of urban inhabitants, while their other benefits, in terms of local access to quality public services, pension schemes, various goods through local
42 Romanian Economic and Business Review – Vol. 12, number 1
distribution networks etc., as well as their opportunities to improve locally their incomes, or standard of living, are substantially reduced, or absent.
All the above illustrate the existence of a major fault line of economic nature in the very structure of the present Chinese urban development model, doubled by a major social polarization. Currently, the Chinese urban population is made up of two social categories, separated by a widening gap: the middle class- people who own properties, enjoy growing incomes, consume increasingly more and better quality goods and services, travel and invest abroad – and the migrant workers coming from the rural areas – who toil in factories and accept the most humiliating jobs without having access to public services (especially healthcare and education) because they continue to be registered as residents of their villages and are denied the urban residence permit (hukou) which would give them access to these services, as well as to social housing and other benefits. This floating population is not at all negligible, counting between 250 and 300 million people and, as such, its inclusion with full rights among city dwellers would obviously exert a huge, probably unbearable pressure upon the existing public services systems.
The hukou system of household registration was, and it still is, the main mechanism of control over the rural-to-urban migration and, at the same time, the main cause of the low urbanization rate in China. Although this rate outruns 56% now, the real weight of the people who have an urban hukou is still under 40%. On the other hand, if, beyond the undisputed discrimination of migrants, one would try to recognize a positive facet of the hukou system, that would be embodied into the fact that it has permitted a better management of larger towns, as compared to the situation in other emerging economies with huge urban concentrations. Still, irrespective of this positive facet, the hukou registration system remains deeply unfair to a very large population, people who have contributed heavily, for decades - with their toil, savings, frugal consumption and modest demands – to China’s successful catching up effort. This is why this system must be entirely reformed, placing all urban residents on an equal footing and, at the same time, at the heart of the entire urbanization endeavour.
However, assimilating migrants and increasing urban population in a short time-frame is extremely challenging, considering that, on the one hand, megacities and big towns are already overcrowded and unable to grow further and, on the other hand, small towns don’t have industries strong enough to provide stable jobs for a substantially enlarged and growing population. It is only the average-sized cities, of 1.5 to 6.5 million inhabitants, that could be able to better integrate the migrants’ inflows (The Economist, 2015), but problems persist here too, especially as regards the availability of affordable housing for workers and young graduates with low financial means who might try to settle in these cities (Box 1). Therefore, adequate new public policies must be devised to encourage a larger supply of affordable, decent housing for these categories of new city dwellers. Until now, the trend has been unfavorable from this point of view, as total housing starts7 have skyrocketed from over 200 million square meters in 2000, to about 1 300 million square meters in 2010, while the weight of affordable housing starts in this total has plunged during the same time-span, from 21.8%, to 2.8% (Riva&Henaut, 2016).
7By “housing starts we understand the number of new residential construction projects that have begun during a particular year”.

China’s Urban Developement. 43 Its Spectacular Ascent, Downside and Strategical Rethinking
Box 1: Ants and mice – the forgotten populations of China’s megacities
For about five decades, Chinese city dwellers have lived in houses which had been cheaply rented either directly from the state, or from the state owned companies (SOEs) where they had been working. About two decades ago, in the aftermath of the urban housing privatization program and due to the massive rural population migration into cities following the investment boom, the situation has changed radically. In spite of a huge number of apartments having been built, housing prices have skyrocketed due to the upsurge in demand and to the proliferation of speculative real estate operations. For instance, only between 2000-2010, the average prices of Chinese urban houses have grown by 250%, becoming “severely unaffordable” to a large part of the population. Moreover, as developers had primarily targeted high and luxury market segments, a structural mismatch between the housing demand and supply has arisen, so that people in the lower income categories could neither buy, nor rent a home in the larger towns or in megacities. As such, the main concern of the low-to-average-income urbanites has been and has remained related to housing. This issue is even more dramatic for the migrants without an urban registration certificate (hukou) as, due to lacking this permit, they have no access to public services, social houses or to any kind of social benefits. These people usually agglomerate in the cheapest, most shabby, insanitary places, either in the cities’ outskirts, in their suburban villages, or in the cities’ underground, in basements, cellars, warehouses, parking lots, or even in bomb shelters. In these migrants’ enclaves jostle both unskilled workers, coming from poor villages, and young graduates from universities, who cannot afford other accommodation and are, therefore, forced to live in small, crowded rooms in the outskirts and to spend long commuting hours to and fro their working places. These educated young people from the so-called “ant tribe” (yizu), while the migrant workers who live in the cities’ undergrounds are called the “mice tribe” (shuzu). It is estimated that only in the capital city there are about 2 million “shuzu” people, almost giving rise, together, to another, underground, Beijing. Therefore, the shortage of decent, affordable housing is one of the most critical problems of Chinese urban agglomerations and a pressing issue on the central and local governments’ agenda, all the more so now that urban population is expected to continue to grow very swiftly in this country. Source: Adapted after Huang (2013).
4. A new urban development model for China Although concise, the above facts and figures converge to one clear conclusion:
China’s urbanization model of the last decades is unsustainable, far-flung from the local urban traditions and from the daily needs of the citizens. Its negative side-effects have become increasingly visible and difficult to accept further on, and, as such, a thorough redesign of the country’s urbanization strategy was obviously needed.

44 Romanian Economic and Business Review – Vol. 12, number 1
Considering this strong need of reform, as well as the significant potential of the urbanization process to assert itself as a development driver, in March 2014, after three years of research and planning, the State Council launched the New-type Urbanization Plan (2014-2020). Drawing considerably upon the joint report of the World Bank and NDRC titled Urban China: Toward Efficient, Inclusive and Sustainable Urbanization (2014) and from other valuable inputs from various national think tanks and research bodies, the new plan provides for five reform directions:
(1) Reforming population management, primarily the hukou house hold registration system;
(2) Deepening land management and institutional reform; (3) Securing sustainable financing for urbanization (the creation of public-private
partnership mechanisms coupled with tax reform), as well as improving local governance, primarily by strengthening the discipline and responsibility of local administrations;
(4) Reforming urban planning and design, including the optimization of housing supply for different income categories;
(5) Improving environmental management and strengthening environmental protection – so that the new model of urban development may (i) better allocate land, capital and labour resources, (ii) become more inclusive, enabling more people benefit from urbanization, and, at the same time, (iii) protect the country’s environment and food security.
A better allocation of resources is expected to materialize in faster industrial relocations to smaller towns, increased job opportunities in these places and the abatement of the migration pressure on larger cities. Once urbanization progresses sufficiently, labour excess is expected to abate, wages are expected to grow and urban-to-rural gaps to gradually fade away. Such developments normally entail a substantial expansion of the middle-class, which will be able to generate significant consumption growth of both goods and, increasingly more, of services. Therefore, in this view, if well managed, urbanization could become not only an economic growth engine, but also a mechanism for economic rebalancing and for the speeding up of the transition to the new services-and-consumption led development model in China.
An inclusive urban development and a more equitable income distribution could also foster a more definite shift to services within the country’s economic structure, as well as to consumption, as a topmost driver of economic growth. Additionally, improved local governance, as a reflection of the changed role played by local administrations –that of complements and catalysts, and not substitutes of market forces –could allow Chinese towns to grow in a more efficient and organic manner, responding to market triggers in the framework of the strategic plan devised by the government (World Bank&NDRC, 2014).
On the whole, the New-type Urbanization Plan (2014-2020) focuses on achieving a people - centered urbanization. It targets an urbanization rate of 60% by 2020, with the government commitment to grant 100 million more residence permits to migrants, to rebuild shanty districts for some other 100 million people and to build 100 million new, affordable homes.
To accomplish such ambitious plans by 2020, the fiscal, land and urban planning policies must be redesigned. As far as the fiscal reform is concerned, the most important improvement will be to grant to the local governments the right to introduce taxes,

China’s Urban Developement. 45 Its Spectacular Ascent, Downside and Strategical Rethinking
primarily the tax on property, which, besides generating funds to finance the extension of public services, could also lead to an improved use of urban land and to higher urban density. On the other hand, land reform will mainly have to look at the system of land ownership/land use rights and to find ways to stop the abusive rural-to-urban land conversion, to smooth the change of rural hukous into urban ones and to stimulate the building of affordable houses. Finally, as regards urban planning reform, the new strategy aims at improving the management and the control of urban design and development, as well as at expelling industries from cities, controlling pollution in all its forms, developing “green cities”, giving up superb lock building and having more lateral streets to reduce traffic congestion, surrounding cities with green belts which help purify the air, redirect drafts and stop excessive urban expansion.
As China’s towns had become “…too large, too fast and without quality planning…” (Shepard, 2016) and the urgency of finding viable solutions was high and growing, in December 2015, 37 years from its previous session, the Central Urban Working Conference assembled to look at all these issues. Following its recommendations, the government issued a new urbanization road map, structured into a set of 30 guidelines (Box 2), which match both the more general economic policy objective of accomplishing the shift from quantity to quality, and some of the latest Western, mainly European, principles of urbanism: to create open cities, to upgrade the existing urban areas while preserving their specific local features, to attach special attention and increase focus on the quality of life issues and on what citizens wish for etc. This seems as if Chinese decision-makers”…left their former blueprinted inspirations, from Russia’s communist planning, to America’s neoliberalism, at the scrap yard of history”(Joost van de Hoek, in Shepard, 2016), trying to capitalize on the successful urban design solutions devised in Stockholm, London, Copenhagen, but also in Portland, or New York.
Box 2: The new urban guidelines in a nutshell
As epitomized by the British professor of architecture Austin Williams, the 30 guidelines delivered by the State Council aim at: Restricting what level of government and what departments can engage in urbanization initiatives; Creating denser street networks, breaking up “superblocks,” and phasing out gated communities; Enforcing urban growth boundaries, to restrict cities from expanding endlessly; Increasing the prevalence of mixed-use neighbourhoods; Preserving historical buildings and enhancing the “city character”; Expanding public transportation networks; Increasing green areas for public use;

46 Romanian Economic and Business Review – Vol. 12, number 1
Improving architectural quality and construction methods; Creating cities which are less resource-intensive, accommodate more energy-efficient buildings, process waste water better, even turn into „sponge cities”8and re-use more the solid waste. Source: Adapted after Shepard (2016).
While most of the technical matters raised by the 30 guidelines did not cause
polemics, some sensitive issues have nevertheless emerged, and, among them, the provision regarding the gradual elimination of gated communities is one that has created considerable excitement. Besides the daily embarrassment the seen closed residential compounds create in terms of urban traffic fluency, they also make very visible the living standard gaps between different social categories and this is a matter of concern for Chinese leaders, who pay great attention to everything that might spark social unrest. The opening of the enclosed communities, would solve many of the troubles these protected areas have created and, at the same time, the measure would match the official campaign of recent years against luxury, inefficiency and waste. On the other hand, the people living in the gated communities – who are, at least some of them, not only affluent, but also influential - will not easily give up their comfort and safety, and, by way of proof, the measure has already been amended to some extent by further announcements that a case-by-case approach will be adopted in its gradual implementation.
Another issue tackled by the governmental guidelines which has received special attention both internationally and at home, was the rejection of eccentrically, bizarre architecture– which is neither functional, nor rational, visually pleasant or in harmony with the local values– and the return to the valorisation of national history, culture and traditions. If, until very recently, China used to be the place where the most daring or extravagant architecture projects could be implemented no matter how costly they were because their purpose was to attract the world’s attention to China, at present, the government’s new, more rational approach of to urban development mirrors, on the one hand, the fact that Chinese leaders have learnt from their previous mistakes and, on the other hand, that China has now a different image about itself which it wants to convey to the international community: the image of a powerful, modern and ambitious nation, with rich history, unique culture and great aspirations for the future and, most of all, a country committed to be a leader, not a follower. From now on, architecture projects of interest to China will be only the ones that offer technical and esthetical solutions which are simultaneously in harmony with the local culture and landscape, energy-efficient, environmentally - friendly, rational in terms of resource consumption and capable of making the most of the urban land. At the same time, this directive on urban development shows, if not an outright rejection, at least a substantially more cautious attitude towards Western ideas and a more visible nationalistic stance. Besides its rational and practical motivations, the new guideline on “weird architecture” coming from the West is not just a simple change of accent in China’s approach, but it seems to express a kind of newly
8“Sponge cities” collect and turn to good account every drop of water. Rather than disposing of the rain water from urban areas through drainage systems, a sponge city will absorb this vital resource like a sponge and reuse it locally either for drinking, or for agriculture or other purposes.

China’s Urban Developement. 47 Its Spectacular Ascent, Downside and Strategical Rethinking
regained economic nationalism and a shift in the way in which this country envisions its relations with other nations and its positioning among global powers.
5. Final remarks Although China’s urban development during the recent few decades was
impressive, its urbanization rate is still low for its stage of industrialization and as compared to that of other economies. For this reason and because it is a process able to provide fresh impetus to both China’s economic growth and its economic rebalancing, urbanization is going to be firmly fostered through public policies and therefore will keep progressing for at least two or three decades from now on. However, its setting for the next time-frame will be entirely changed, as a consequence of both the government’s more general endeavour of switching focus from quantitative to qualitative achievements, and in response to the specific requirements formulated into its recent directives on sustainable architecture and urban development.
Chinese urban development has progressed gradually from the eastern coast to the west and, as such, many cities in the east, having enjoyed an earlier and more alert development in a more favourable environment, have turned into flourishing megacities or conurbations, which meet different challenges at present and expect a different kind of progress in the future, as compared to the towns located in the central or Western regions of the country. Although they will not continue to grow as much as they did, megacities will still become larger and will primarily have to solve problems specific to large human agglomerations (high air pollution, traffic congestions, various supply shortages, water management, green development, garbage management and recycling etc.). The priority here will be urban densification and intensive development (as opposed to the former extensive pattern). As such, eastern cities are expected to foster the tertiary sector more intensively, relying more on an increasingly diverse range of higher value-added services, on innovation and new technologies to boost local economic growth. Additionally, they will continue to play an increasingly significant role as China’s “doors to the wide world”.
The second-tier, inland big cities and metropolitan areas, which have already specialized in certain industrial activities and have developed good market contacts, will further attract and develop manufacturing industries, especially land and natural resources-intensive activities, but some of them could also engage in high value-added services, innovation and high-tech industries, becoming powerful competitors of the eastern coast megacities, in this respect. For these cities, urban densification is also a very important issue, as it is their intensive future development.
In the country’s central and western regions, which are just now urbanizing, small and middle-sized,3-to-6-tier towns will develop both intensively and extensively, mainly by capitalizing on the industrial relocation of the activities that have lost their competitiveness in the east and on the labour inflows coming from the countryside. These towns are also planned to benefit from the development projects launched under the One Belt, One Road (OBOR) strategy and from the implementation of other governmental measures, such as, for instance, that of establishing new university centers in order to attract young people to study and then settle in these newly-built towns. Urban density, efficiency and respect for the natural environment –including the preservation of agricultural land and the protection

48 Romanian Economic and Business Review – Vol. 12, number 1
of the country’s food security – will prevail from the very beginning of the urbanization process in these areas, avoiding the recurrence of past mistakes.
Stimulating urbanization may benefit China in many respects: it may induce new impetus to the industries suffering from severe overcapacity (steel, cement, glass, aluminium, coal etc.) and help them recover and reform; it may encourage east-to-west industrial relocations; it may generate multiplying effects in the economy, stimulating economic growth as a consequence; it may foster economic rebalancing (from manufacturing to services, from foreign to domestic demand, from low to high tech, from quantity to quality etc.) and the transition to a new, consumption-led development model, more adequate to China’s present stage of industrialization and to the current global market conditions; also, the new city-dwellers may benefit from better education and professional opportunities, higher incomes, better living standards, growing consumption of higher quality goods and services. Hence, urbanization will help nurture Chinese middle class, which is the backbone of a healthy, advanced economy and a sine qua non precondition of a successful transition to a consumption-driven development model. Additionally, urban development may, on the one hand, capitalize on the complex, intertwined reforms initiated at present in China and, on the other hand, it may encourage and potentiate reforms and become an economic growth engine for both China and the world economy, provided that, in the process, labour is transferred from lower, to higher productivity jobs, and that further over-investment (which has already led to the advent of ghost cities, idle infrastructure and a host of negative spill over effects) and over-indebtedness (which is already dangerously high) are avoided.
References: Bosker, B. 2016. China’s ban on “weird” architecture is a global power play, New
Republic, February, 29, available online at: https://newrepublic.com/article/130589/ chinas-ban-weird-architecture-global-power-play;
Demographia. 2016. Demographia World Urban Areas (Built up urban areas or world agglomerations) 12th Annual Edition: 2016.04, April, available online at: http://demographia.com/db-worldua.pdf;
EIU. 2014. China’s urban dreams and the regional reality, available online at: http://www.eiu.com/public/topical_report.aspx?campaignid=ChinaUrbanDreams;
Hairong, W. 2016. Blueprint for Urbanization – Beijing Review, no.11, March 17, 2016, http://www.bjreview.com/Nation/201603/t20160314_800051985.html;
Huang, Y. 2013. China s urban dream denied, The Diplomat, May, 14, 2013, http://thediplomat. com /2013/05/chinas-urban-dream-denied/.
Kotkin, J., Cox, W. 2013. The world’s fastest growing megacities, Forbes, April, 8, http://www.forbes.com/sites/joelkotkin/2013/04/08/the-worlds-fastest-growing-megacities/#5e6ff74e24cd;
Meissner, M. 2014. Urbanization as part of China’s reform strategy, MERICS, October, 2016, http://www.merics.org/programme/wirtschaft-und-technologie/urbanisation-as-part-of-chinas-reform-strategy/;
Riva, G., Henaut, A. 2016. Urban Policies in China, Part I, February 2016, figure 17, https://www.researchgate.net/publication/304800454_Urban_Policies_in_China_Part_I;

China’s Urban Developement. 49 Its Spectacular Ascent, Downside and Strategical Rethinking
Roberts, D. 2014. China wants its people in the cities, Bloomberg, March, 20, http://www.bloomberg.com/news/articles/2014-03-20/chinas-urbanization-plan-sees-60-percent-of-people-in-cities-by-2020;
Shepard, W. 2016. The impact of China’s new urbanization plan could be huge, Forbes, March, 14, 2016, http://www.forbes.com/forbes/welcome/?toURL=http://www.forbes. com/sites/wadeshepard/2016/03/14/the-impact-of-chinas-new-urbanization-plan-could-be-huge/&refURL=https://www.google.ro/&referrer=https://www.google.ro/.
Shuyi, P.2016. Cities enter new stage, Beijing Review, March, 19, 2016, http://www.bjreview.com/Nation/201603/t20160314_800051990.html;
Stratfor. 2014. Urbanization and demographics could skew China’s economic rebalancing, Analysis, September, 3, https://www.stratfor.com/analysis/urbanization-and-demographics-could-skew-chinas-economic-rebalancing;
Swanson, A.. 2015. How China used more cement in 3 years than the U.S. did in the entire 20th Century, Washington Post, March, 24,2015; https://www.washingtonpost.com/ news/wonk/wp/2015/03/24/how-china-used-more-cement-in-3-years-than-the-u-s-did-in-the-entire-20th-century/;
The Economist. 2015. The great sprawl of China, January, 24, 2015, http://www.economist. com/news/china/21640396-how-fix-chinese-cities-great-sprawl-china;UnitedNations, Department of Economic and Social Affairs, Population Division (2014) - World Urbanization Prospects: The 2014 Revision, Highlights (ST/ESA/SER.A/352), U.N., New York, http://www.compassion.com/multimedia/world-urbanization-prospects.pdf , retrieved on 4.10.2016;
Xinhua. 2016. China's urbanization rate at 56.1 pct– 19.04.2016, http://news.xinhuanet.com/ english/2016-04/19/c_135294134.htm;
Wall Street Journal/WSJ. 2016. China’s love for sky-scrapers defies growth slowdown, January, 21, http://blogs.wsj.com/chinarealtime/2016/01/21/chinas-love-for-skyscrapers- defies-growth-slowdown/ ;
World Bank. 2016. World Bank Data, http://data.worldbank.org/indicator/SP.URB.TOTL. IN.ZS, retrieved on 4.10.2016;
World Bank & NDRC. 2014. World Bank; Development Research Center of the State Council, the People’s Republic of China. 2014. Urban China: Toward Efficient, Inclusive, and Sustainable Urbanization. Washington, DC: World Bank. © World Bank. https://openknowledge.worldbank.org/handle/10986/18865 License: CC BY 3.0 IGO.

WORLD ECONOMY BETWEEN YESTERDAY AND TOMORROW:
THE TRANSITION TOWARDS A NEW INTERNATIONAL ECONOMIC ORDER
Florin Bonciu
Abstract: The paper has in view to address the transition that the world economy is confronted with nowadays from the perspective of the participants and forces that shaped the world economic order of the post World War II period until now. The world economy is moving from a globalist perspective of convergence to a perspective of confrontation and transaction once with the return of the nation states, of bilateralism and multilateralism and of the approaches based on national interest. Starting from the analysis carried out by this research the conclusions contemplate a new world economic order that should make a better use of the lessons of history while taking more into account the human nature. The perspective on the future remains positive, provided that the answers to a number of fundamental questions are moderate and rational enough.
Key words: world economy, world economic order, political realism, globalization,
capitalism crisis JEL classification: F02, F50, F53, F60
2016 as a milestone of transition towards a new international economic order In case of systems as large as the world economy there is a lot of inertia and one
cannot expect changes, especially substantial ones, to take place in a short period of time. As in case of all large phenomena there is a process of quantitative accumulation of different changes that leads to the prefiguration of a new stage of becoming and, at a given moment, that accumulation changes entirely the older system into a new state of existence. Such changes took place during the Renaissance times, then during the first Industrial Revolution, as well as during the period after World War II. These changes may refer to scientific and technological discoveries, to significant increases in productivity, to better means of transport and communication, to changes in the economic and military balance of power or even to changes in the perception of the world by the majority of people. The complex interaction of all these dimensions and of their gradual change determines, among other things, the international economic order which is, intrinsically, specific to a historical period and therefore ever changing.
The international economic order established after World War II has been characterized by the existence of states as prime actors together with a number of
Florin Bonciu is Professor of World Economy at the Romanian American University in Bucharest. E-mail: [email protected]

World Economy Between Yesterday and Tomorrow: 51 The Transition Towards a New International Economic Order
international organizations (United Nations, World Bank, International Monetary Fund, GATT) which had at that moment a rather auxiliary role; these actors had been joined approximately two decades later in the intricate process of global governance by organizations of economic integration (represented especially the European Economic Community which was of a particular importance due to its incipient supra-national character) and even later, during the 1980s and 1990s, by some transnational corporations big enough (an influent enough) to compare from an economic point of view with many countries.
This international economic order had after World War II, superimposed on its architecture, a bipolar structure of power with two main centers represented by the United States of America and the Union of the Soviet Socialist Republics (USSR). The bipolar structure gave to this system a certain stability which ended once with the demise of the USSR in 1990.
On the surface, the new situation, the unipolar world, made a lot of Western analysts believe that humankind arrived at an “end of history” and from that moment on it was just a matter of time before market economy and liberal democracy would be disseminated everywhere on the basis of a natural process, even if the pace of this dissemination would be unequal (Fukuyama, F., 1992). The reality of the coming decade proved that this vision had been both superficial and wrong while the reality of the next decade after year 2000 brought us a rather unstable, unequal and conflicting world (Milne, S., 2012; Badiou, A., 2012).
According to the linear vision of history the expectation has been that presumably after year 2000 the states will gradually diminish their importance and a shift would take place from the post World War II world economic order based on states to a new world economic order based on globalism and universalism (including a global governance system). We mention year 2000 as a sort of milestone because it was after 2000 that a number of idea or processes took place. Among them we can mention: the idea of a possible state entity called the United States of Europe (which was supposed to be a sort of federal state that would have succeeded the European Union) or the negotiations had almost been finished in 2016 regarding new multilateral treaties (such as the Transatlantic Trade and Investment Partnership – TTIP or the Transpacific Partnership – TPP) that would have increased the bargaining power of transnational corporations in relation to states (in particular by means of the provisions of the Investor State Dispute Settlement mechanisms – ISDS).
In the post World War II and especially in the post-1990 world economy of yesterday the production and consumption have been globalized, the problems seemed to be global (such as the climate change, pollution of environment or the envisioned exhaustion of the resources of traditional raw materials and energy) and therefore it appeared perfectly logical that solutions had to be found also in a global manner. And a global manner of finding solutions meant an ever increasing level of global governance, global scale institutions and global rules of the game. This approach is not wrong in itself, the only problem with it is that it can function only if the world economy is relatively homogeneous from cultural, economic and political points of view. If the world economy is characterized first and foremost by diversity (as it is the case), then the rules, institutions and mechanisms have to cope with diversity and therefore they cannot be standardized beyond a certain level.

52 Romanian Economic and Business Review – Vol. 12, number 1
According to the linear approach mentioned above, the key word seemed to be that of “convergence”, as mentioned in 2013 by a reputed analyst who considered that due to globalization concepts as “North” and “South” or “developed” and “developing” have become irrelevant (Mahbubani, K., 2013). In our view this concept of convergence that was proposed by the mainstream literature could be identified at least at three levels: a) the status of developing countries will eventually converge with that of the developed ones; b) Central and Eastern European Countries will converge with their Western European partners within the European Union; c) different social, cultural and political systems will converge with the Western style democracy and liberal market economy.
Specific for this approach of convergence was the fact history has been perceived as a linear and mechanical process by which different discoveries, institutions and mechanisms, as well as the spiritual values were disseminated from the Western world to the rest and the achievement of a uniform distribution was only a matter of time. It was very much like expecting that one day all humankind will adhere to the metric system just because it was logical, possible and so many people already used it.
In relation to this Western perspective of convergence Robert Kagan made a profound remark in his book “The Return of History and the End of Dreams”: “The great fallacy of our era has been the belief that a liberal international order rests on the triumph of ideas and on the natural unfolding of human progress” (Kagan, R., 2008). In retrospect this paradigm of autonomous convergence appears rather mechanistic and seems to leave outside exactly the subjective and non-linear behavior which is specific to human beings.
To further argue against this paradigm of autonomous convergence we can put things even into a much greater perspective, that of the evolutionist or Darwinian approach: in order to maximize the chances of survival of species, nature favors diversity, flexibility and change. The more standardized and uniform the population of different species would be, the more they would be at risk in case of external shocks because they would be all affected in the same directions and with the same consequences. Diversity within limits increases the chances of survival because in case of external shocks the individuals within populations would react differently and some of them would have better chances to adapt and survive. If we transpose this evolutionist approach to the world economy, then diversity would be the natural way to be and this comparison is not too farfetched because societies and economies are made of people/human beings that belong and originate from nature.
One observation regarding the above linear understanding of history is that it belonged almost in its entirety to commentators from the Western world which constitutes a minority as percentage of the world population- just as an example, the population of the European Union represented as of 2016 about 7% of world population while the population of the United States represented in the same year about 4.34% - (www.worldometers.info, 2017). The rest of the world had not been consulted and its voice had been less present in the global arena, at least as compared to its proportion of the global population. At this point one aspect is to be highlighted: the above statement is not referring to ethics or human rights. It is intended just as a pragmatic approach: when a minority leaves out of the debate a vast majority, a less than efficient outcome is to be expected. And this is a very diplomatic way of formulating this statement.

World Economy Between Yesterday and Tomorrow: 53 The Transition Towards a New International Economic Order
After the onset of the financial and then economic crisis in 2008 a lot of things have changed, not directly because of the crisis (which was more of a catalyst), but rather because the crisis determined the maturity of several decade long processes that were well underway. Therefore after 2008 a lot of changes took place in the time span of about 7-8 years and effectively eliminated the autonomous convergence perception as well as the hope for a continuous improvement of the global governance based on a universalist approach.
As result, in the world economy of today the major states are again competing for spheres of influence (besides the United States now there are also China, Germany or the Russian Federation) and even some less prominent states are expressing loudly their national interests in the international arena (such as Poland or Hungary). In the world economy of today the global architecture is still unipolar but major decisions cannot be taken and implemented by the USA alone. On different subjects there is a competition in influencing the decision making process among the USA, the Russian Federation, China and India, Japan and Germany (rather than the European Union).
At the same time, in the ideological arena of contemporary world there are, in our opinion, at least three confrontations:
a) a first confrontation is between the supranational approaches (like those of the European Union) and the national ones (as those expressed by the British vote for exiting the European Union but also those expressed by countries like Poland, Czech Republic or Hungary);
b) a second, more complex, ideological confrontation is that between Western style liberalism and Western style democratic institutions an mechanisms and more centralized (even authoritarian) approaches like those from the Russian Federation and China;
c) a third confrontation, from a spiritual point of view, is that between the Western representation of the world, marked by political correctness and multiculturalism, and the Islam world which is characterized by different values. One can include in this third confrontation based on a spiritual point of view even a confrontation within the Western world, namely that between a sort of universal political correctness heavily supported by a majority of mass-media, and more traditional values related to Christianity, traditional family, regional and national folklore.
The world economy of today as a moment of returning In our view the world economy of today which has as a sort of milestone the year
2016 (to be considered in a rather symbolic manner) is characterized by a number of returnings, none of them being interpreted in a mechanistic way (that is as a repetition of an already manifested action, status or system). These returnings are not brought back by some conservative forces but rather by a dysfunctional state of the existing institutions and mechanisms which determine the less fortunate part of the population in many countries to seek protection with the components of the establishment that once used to function properly (hence the appeal to state, the military or the church). These returnings express at the same time an unsubstantiated hope that a return to a point in time in the past when things were better for a majority of population could allow for a reset of the course of history that would result in an improvement of the quality of life (similar to the
54 Romanian Economic and Business Review – Vol. 12, number 1 case of a computer game where if you fail you can go in some instances to a saved previous status in order to try a different approach, hopefully with a better outcome due to avoiding previous mistakes).
The main returnings we have in view here are: - the return to the prominence of the nation states; - the return to bilateralism and plurilateralism; - the return to a transactional approach; - the return to the normality of pursuing the national interest, with due observance
of the interests of the others. Many observers have the tendency to associate these returnings to two obvious
events of 2016: the Brexit decision taken in the British referendum of 23 June and the result of the US elections of 8 November. But a more profound analysis reveals that the two mentioned events have been the results rather the causes of these returns.
The convergence hypothesis and the globalist approach left outside too many countries (at the global level), too many people (in the developed countries) and too many local communities and became a sort of wishful thinking feed by the forceful presence of mass-media in Western societies. The repetition of certain messages, arguments and conclusions made their authors and some of the Western audience believe that this is the only reality and the only truth.
From an objective point of view the convergence of all countries and regions to a globalist economy and society is not entirely impossible, even the idea of one world government is not completely out of reach. It is just that not now and not in this way.
In our opinion the key factor for such a major shift to happen is that a substantial majority of people within the countries and within the world economy are really better off and not only are told that they are or maybe will be, sometime in the future, better off. Reality remains the ultimate argument and test for any belief or theory. And this fact might be the starting point for a re-launch of the globalist project.
Two challenges for the world economy of today The world economy of today is in transition to a new world order (which includes
the economic, political and military components) but this process of transition is not a smooth one. There are numerous challenges and threats which manifest during this transition but in the following section we are going to analyze two of them, namely the challenges to globalization and the challenges to capitalism as a system.
Challenges to globalization In recent times (after 2008 and particularly after 2014-2015) there are a lot of
debates regarding the direction of economic phenomena at a global level. If before 2008 most if not all of the commentators were speaking about globalization, nowadays there are also references to de-globalization (perceived as a process contrary to globalization, that is contrary to the increase of the interaction, interdependence and connectivity of all economic actors) or, more adequate in our opinion, to re-globalization (pointing to a rethinking and/or re-launching on different bases of the globalization process).

World Economy Between Yesterday and Tomorrow: 55 The Transition Towards a New International Economic Order
At this point it is interesting to mention that Dani Rodrik evoked in 1987 two dangers facing globalization, both of them resulting from the obsessive focus on the improvement of economic indicators at a global, cumulative level, while neglecting the social implications of the globalization process and the percentage of the population affected by it (Rodrik, D., 1987). The two dangers mentioned in 2008 were an attack on free trade (with reference at that time to the position of the contender in the Republican primaries of 1996, Patrick Buchanan) and an even more severe danger, that of social disintegration “along the lines of economic status, mobility, region or social norms”. With a well chosen game of words Rodrik formulated a interesting question: is the cost of economic integration that of social disintegration?
With reference to these two dangers we can say that it is difficult to formulate a better description for the current situation of 2016 – 2017. And if one looks at the splitting of votes in the British referendum and in the US elections of 2016 the social disintegration is quite obvious when actually the different and apparently irreconcilable positions are linked to differences of “economic status, mobility, region or social norms”. What can better describe the difference between the votes of people in London as compared to the rest of England (in case of the British referendum) or the rift between the supporters of Hillary Clinton and those people she referred to as “a basket of the deplorable” (Chozick, A., 2016).
At the same time globalization made possible the emergence of very large transnational corporations while, in turn, these economic giants supported the further enhancement and deepening of globalization. But transnational corporations generate two issues. First of all they have a lot of economic power. And if one admits that politics represent a concentrated expression of the economy, then it is just a matter of time before very large economic actors would influence the political process. It is logical for them to do so and they can do it. The second issue is that the transnational corporations are mobile, they can relocate in some other part of the world when conditions are no longer profitable as expected. And because of that possibility to go away they just might be less interested to contribute as “good corporate citizens” to the solving of problems and tensions within the societies they operate in.
Challenges to capitalism In the past 150 years capitalism has been criticized for many reasons. But almost
every time capitalism has been flexible enough to incorporate changes and diffuse challenges. Once with the demise of the ideological alternative of socialism and communism the challenges to capitalism are more direct, people against the system and not political parties fighting with each other for power.
The most obvious challenge to contemporary capitalism is that of inequality which manifests mostly in the developed countries. While for decades the clashes were between developed and developing countries nowadays the developing countries are to a large extent supporters of globalization while numerous social categories in the developed countries are against globalization, transnational corporations and the global financial and banking sector. This new situation reminds somehow of Marx who thought that, according to his interpretation of history, the social tensions and the search for a new economic mode of production would emerge in the most advanced capitalist countries.

56
is vdevspapeowh
froowpeo
or obvheras concanthaWhme
proOnto twethe
Rom
The inequavery fast and sveloped countran of some yeaople that conhatsoever, from
In order to m Oxfarm Inte
wn wealth whicople). This figu
Table
S The data in
ethical interprvious is such are the idea of atheir intellectu
ncentration of wnnot be supportat such a concehat is the alterechanism that d
From this poblem is not w
ne approach is tthe temptation aalth to control
eir favor (Standi
manian Econom
ality issue is reaimply amazingries protested aars the protestsncentrated the
m any conceivaboffer an examp
ernational whicch is equal to ures manifested
1. Number of ppopu
ource: Oxfarm I
n Table 1 can bretation and loa situation refl
an egalitarian soual, physical awealth increaseted by tradition
entration of wearnative? We hodelivers this typpoint of view twwith capitalismthat of Guy Staand possibility and corrupt th
ing, G., 2016).
mic and Busin
al and what is ag as phenomenagainst the “1% changed againvast majority
ble point of vieple of this procch are presentethat of half o
d a very steep d
people that ownulation (that is 3
International, 20
e analyzed in mook at it only lects a dysfuncociety and we and entreprenees the chances nal spiritual vaalth will translonestly do notpe of outcome iwo very differen
m but with the anding that speaof the individu
he political pow
ness Review –
a challenge is thon. If in 2008 %” (the most wnst the “0.1%”y of wealth) w, with “the fo
cess of concentrd in Table 1 sh
of the world podecline between
n wealth equal to3.6 billion peopl
017
many ways. Bufrom a pragm
ctional mechanfully accept theurial abilities of mistakes, a
alues. At the salate sooner or lt know. But wis not sustainabnt authors are pdistortion and
aks about “the uals and corporawer in order to
Vol. 12, numb
hat the polarizathe dissatisfiedwealthy people
” (the very limithat have n
orgotten”. ration of wealthow the numbeopulation (thatn 2010 – 2016.
o half of the wole)
ut if we leave amatic point of nism. We are n
hat people are nare concerned
affects aggregatame time, it is later into the p
what we know ble. pointing to the sd deviation frocorruption of cations that concissue laws and
ber 1
ation of wealthd people in thee), in the timeited number of
not connection
th some figureser of those thatt is 3.6 billion
orld
side any moralview, what isnot supporting
not equal as fard. But such ate demand andto be expectedolitical sphere.is that such a
same issue: theom capitalism.capitalism” duecentrate a lot ofd regulations in
h e e f n
s t n
l s g r a d d . a
e . e f n

World Economy Between Yesterday and Tomorrow: 57 The Transition Towards a New International Economic Order
This approach is in line with the interpretation that says that it is the ultimate fantasy of any capitalist to desire to be a monopolist because such a position allows for the maximum profit possible. Of course, in a market economy that functions normally such a thing is not possible because there are many suppliers and many consumers and because the state (through its institutions dedicated to the monitoring the competition) may intervene to correct any deviation from the existence of a reasonable level of competition. Anyway, in case the economic power is concentrated to a few individuals or corporations, then it is possible that those few corrupt and distort the political power and by this intervention they can corrupt the rules of the market/capitalist game.
A second approach which leads to almost the same conclusion has been formulated by Samir Amin, who studied for quite a long time the world order, the capitalist system and different models of development. In his book “The Implosion of Contemporary Capitalism” Samir Amin contends that due to the predominance and generalization of the monopoly capitalism in the developed countries and with implications for the whole world economy the system will implode as it lacks more and more the flexibility and the capacity to adapt specific to native capitalism (Amin, S., 2013).
What is to be mentioned is that nowadays capitalism as a system is not put under a question mark, rather the challenges and tensions existing in contemporary societies are explained by deviations and distortions of capitalism. While we share this idea, what is not clear at all is who and how will redress capitalism and bring it back to its fundamental characteristics.
Conclusions While we know rather well how the world economy of yesterday looks like, and
while we perceive with fear and dissatisfaction the dysfunctions and challenges manifested in the transition world economy of today, we can hardly imagine how the world economy of tomorrow will look like.
We know for sure that the world economy of tomorrow will be shaped to a great extent by the 4th industrial revolution that brings with it robots and artificial intelligence, the revolution of genetic editing, new materials and new sources of energy. And we also know for sure that the world economy of tomorrow will not be just an updated version of the interwar period or of the post World War II period.
What can be of help is to reflect on some statements made by wise people many decades ago. Hans Morgenthau warned against imagining that at some point in time “the final curtain would fall and the game of power politics would no longer be played.” (Morgenthau, H., 1948).
Maybe more than ever political realism would ask for a return to human nature and to its characteristics however imperfect they may be in comparison to our ideals. The problems and challenges in the world economy are generated by people and they cannot be solved without people. And in this context history can be the ultimate source of “best practices”, while the smaller evil can be way better than absolute principles that are unfortunately illusory.
One interesting argument against designing visions, strategies and plans only on the basis of absolute principles, be they however noble and humanistic, can be found with Robert D. Kaplan in his book “The Revenge of Geography” where he states that the

58 Romanian Economic and Business Review – Vol. 12, number 1 heritage and characteristics given by geography, history and culture influence to a large extent the direction, options and achievements of any state entity (Kaplan, R.D., 2012).
This is why, in a political realist approach one can say that the world economy of tomorrow will be shaped by those willing and able to do so. What is even more important is that in a true multipolar world it is no longer automatic that the world economy of tomorrow and the new world economic order that will characterize it will be shaped by the Western civilization alone, interacting with others or at all.
The best way to conclude such a comprehensive picture is to ask some questions. And then to strive for finding positive answers to them. The questions would be: How the states will change and particularly the great powers? How the international institutions will change and which will be the new ones? Which will be the new values, principles and rules of the game?
The world economy is in transition towards a new world economic order. Transition means change and in times of change the management of change is essential. Further final questions: What change? And what managers?
References Amir, S., 2013: The Implosion of Contemporary Capitalism, Monthly Review Press, p.149 Badiou, A., 2012: The Rebirth of History – Times of Riots and Uprisings, Verso, p.7 Chozick, A., 2016: Hillary Clinton Calls Many Trump Backers ‘Deplorables,’ and G.O.P.
Pounces, The New York Times, 10, September 2016, at page https://www.nytimes.com/2016/09/11/us/politics/hillary-clinton-basket-of-deplorables.html?_r=0, retrieved at March 21, 2017
Fukuyama, F., 1992: The end of history and the last of man, The Free Press, Macmillan Inc., New York.
Kaplan. R.D., 2012: The Revenge of Geography, Random House Publishing Group, p.41 Mahbubani, K., 2013: The great convergence: Asia, the West, and the logic of one world,
Public Affairs, pp.6-17 Milne, S., 2012: The Revenge of History – The Battle for the 21st Century, Verso, p.20;
p.196 Morgenthau, H., 1948: Politics Among Nations: The Struggle for Power and Peace, Alfred
A. Knopf, p. 33 Rodrik, D., 2008: Has Globalization Gone Too Far?, Institute for International Economics,
p.71 Standing, G., 2016: The Corruption of Capitalism – Why Rentiers Thrive And Work Does
Not Pay, Biteback Publishing Ltd., p.302 World population: past, present and future, at page www.worldometers.info, retrieved at
March 21, 2017 Oxfarm International, 2017: An Economy for the 99%, Briefing Paper, January 2017

TIME VARYING CAUSALITY BETWEEN GOLD AND OIL PRICES
Gülfen TUNA
Abstract The causality relationship between gold and oil prices is analyzed in this research. For that purpose time-varying Hatemi-J (2012) Asymmetric Causality Analysis was used. Used data set was monthly gold and oil prices from May 2005 to March 2016. According to research results, the causality relationship from gold to oil is the concern in both positive and negative shocks and the periods of important economic, social or political events. However, the causality relationship from oil to gold is only valid for positive shocks, but it is not valid for negative shocks.
Key Words: Gold Prices, Oil Prices, Asymmetric Causality, Positive Shocks, Negative Shocks. JEL Codes: C58, G11, Q43. 1. Introduction Gold is one the precious metals used as a safe investment tool with high trading
volume in financial markets. However, oil is one the raw materials with high trading volume as gold. Precious metals such as gold and oil are significant components affecting the financial markets. So both economic variables of them and the fact of affecting each prices are the interest of theoreticians and practitioners. Because these data are very important for the investors in order to develop a suitable portfolio management strategy through effective diversification and provide profit maximization by making price predictions with low estimation errors. Therefore, the studies analyzing whether precious metals affect the prices of each other form one of the significant issues of economic researches. Melvin and Sultan (1990) are one the first researchers analyzing the relationship between gold and oil prices. Melvin and Sultan (1990) remark that oil exporting countries have substantial gold reserve in their international portfolio investments. They state that these countries increase the share of gold in their total portfolio with the increase in world oil prices.
A general view is dominant in financial markets accepting that “gold prices follow oil prices”. Many studies in current literature also support that the changes in oil prices cause changes in gold prices (Sari et al 2010). It is also stated in Soytaş et al(2009)’s study that there is an asymmetric and weak relationship between gold revenues and oil revenues. According to Sari et al (2010)’s research results that they analyzed the effect of oil price shocks on precious metal revenues and US dollar/ EURO Exchange rate, precious metal market gives a positive and statistically significant reaction to the changes in oil prices.
Gülfen TUNA is Associate Prof. of Finance at the Sakarya University, Turkey. E-mail: [email protected]

60 Romanian Economic and Business Review – Vol. 12, number 1
However, according to Baffes (2007)’s research result that he analyzed the relationship between brent oil prices and the price changes of 35 goods trading in international markets, gold, one of the precious metals, gives the strongest reaction against the oil price changes. There are different approaches which try to explain this relationship between gold and oil prices in current literature. According to the first approach, the relationship between gold and oil prices is tried to be explained with inflation. According to this approach, the increase in oil prices affects general level of prices (Hunt, 2006). In such a case the investors who would like to prevent from inflation prefer gold as a safe investment tool. As a result of this fact it is stated that gold prices will increase (Jaffe, 1989). It is stated in Narayan at all (2010)’s research results in which he analyzed the long term relationship between gold and oil prices in both spot and futures markets that gold is effectively used by all investors in order to prevent from inflation. Also it is stated that gold and oil prices will be used in price estimation for each other. According to the first approach explaining the relationship between gold and oil prices through inflation, this situation supports that these two metals move in the same direction. However, according to the second approach, the energy used for extracting and processing gold is a significant cost element. Oil and its derivatives are the energy resources used commonly in products. Therefore, as we think that oil is an energy resource, high oil prices may cause high energy costs and also high gold prices. According to the third approach, high oil prices affect the economic growth negatively. This negative influence of economic growth reduces stock prices. Investors tend to gold from alternative investment tools in order to reduce the risk that they have due to their investments in stock exchange markets (Reboredo, 2010). Also the demand to gold used commonly in financial markets as a safe investment tool causes this the price of precious metal to increase. Reboredo (2013) in his study analyzed whether gold is a protection from risk or a safe investment tool against oil price movements. In practice results with weekly data set in 2000-2011 periods it is stated that gold is not a protection tool against oil price movements.
Financial markets are affected from oil and gold price changes directly or indirectly. Therefore, not only knowing the long term relationship between precious metals but also knowing which metal is effective on which price change of the metal is also important for an effective portfolio diversification. There are different studies analyzing this situation in current literature. From these studies Soytaş et al. (2009) analyzed the long and short term relationship between world oil, gold silver Turkish Lira/Dollars foreign exchange rate and Turkish Bond Rate. In research results it is stated that world oil prices do not affect the gold prices in Turkey. However, Zhang and Wei (2010) analyzed the cointegration and causality relationship between brent oil and gold market prices for 2000-20008 period. According to research results there is a coherent trend between gold and oil prices and correlation coefficient about this relationship in analyzed period is positive and statistically significant. Lee et al. (2012) also analyzed the long term relationship between gold and oil prices. According to the reseach results, there is a long term relationship between oil and gold prices and there is a one-way causality relationship from oil prices to gold prices. Tiwari and Sahadudheen (2015) analyzed the relationship between gold and oil prices in 1990-2013 periods through GARCH models. According to the research results, positive and negative shocks in oil prices have different effects on gold prices in terms of size.

Time Varying Causality Between Gold and Oil Prices 61
Also in this study the causality relationship between oil prices and gold prices is analyzed. Whether these two precious metals stably provide the useful data for each other or not is also analyzed in price estimation of them. For that purpose, time-varying asymmetric causality relationship is used to identify the causality relationship. The most important reason why asymmetric causality analysis is preferred is the different reactions of investors to positive and negative shocks. Through this analysis the effect of positive and negative shocks in both gold and oil prices can be analyzed separately. At the same time whether the concerned relationships are stable or not is analyzed with the practice of its time-varying form. In accordance with these targets, the most important contribution of this study to literature is to identify whether there is stable causality relationship or not by decomposing the change in gold and oil prices to positive and negative shocks. So whether positive and negative values in gold prices provides useful data in the generation of positive and negative values in oil prices is analyzed. This relationship is also analyzed from oil prices to gold prices. Therefore, the overall view that “ gold prices follow the oil prices” can be analyzed for the positive and negative shocks. Accordingly, this study consists of five parts. In introduction part the related literature and general information, in the second part methodology and in the third part data set are included. In the fourth part the obtained findings are included and in last part an overall evaluation is made according to the obtained findings.
2. Econometric Metodology In order to analyze the causality relationship between oil and gold prices, initially
whether the series are stable or not is analyzed. Fort his analysis Carrion-i Silvestre unit root test was used in the research. Carrion-i Silvestre (2009) allows for five structural fractions at most. Also, this test intrinsically determines fractions points. The test obtains fractions points by using Bai and Perron (2003) algorithm and with the help of Quasi-GLS (Generalized Least Squares), dynamic program process and minimizing total of fault remnants. In this test technique, effective results can be obtained with small sampling (Carrion-i Silvestre, 2009). Stochastic data production process used in the test is in the following:
y d u 1 u au v , t 0, …………………… . T 2
Carrion-i Silvestre (2009) developed five different test statistics to test stable
nature of the sets:
PT λ S α, λ α S 1, λ / s λ 3
MPT λ c T y 1 c T yT
T
/s λ 4
MZ λ T yT s λ 2T y
T
5

62 Romanian Economic and Business Review – Vol. 12, number 1
MSB λ s λ T y
T
6
MZ λ T yT s λ 4s λ T y
T
7
Hypotheses of the test: H0: There is a unit root under structural fractions. H1: There isn’t unit root under structural fractions. Asymptotic values necessary for testing these hypotheses are produced by
bootstrap. When the calculated test statistic is less than the critical value, HO hypothesis is rejected. When there is a structural fraction in the set, it is found that the new set is stable and there isn’t any unit root (Göçer and Peker, 2014).
Main purpose of this research is to identify whether there is a stable causality relationship between gold and oil prices. For that purpose, after the unit root test Hatemi-J (2012) Asymmetric causality test was applied as time-varying.
However, Hatemi-J (2012) developed Granger and Yoon (2002) approach for the causality test. In this asymmetric causality test it is aimed to find the hidden structures to help understand the structure of the analyzed series and enable to make estimations for the future. Accordingly, suppose that the causality relationship between two integrated series such as y1t and y2t is tested:
(8)
(9)
Here y1,0 and y2,0 indicate the initial values. Positive and negative shocks can be
indicated as the following:
(10)
(11)
can be stated as.
1 1 1 1 1 , 0 11
t
t t t ii
y y y
2 2 1 2 2 , 0 21
t
t t t ii
y y y
2 2 2 2maks ,0 , min ,0i i i i
1 1 1i i i 2 2 2i i i
1 1 1 1maks ,0 , min ,0 ,i i i i

Time Varying Causality Between Gold and Oil Prices 63
According to this data it is possible to indicate the numbered (1) and (2) equalities again as the following by editing.
(12)
(13) However, the positive and negative shocks in each variable are stated as the
following in accumulated form:
(14) In time varying asymmetrical causality test, firstly Hatemi (2012) causality test is
applied for the space between 1st and 20th observations. At the second step, the first observation is disregarded, and this test is applied to (20+1) observation range with second observation; and at every new step of the test, the first observation is disregarded and continued till the last observation existing in data range, by adding a new observation to the last one at each step. The values are shown in a graph in order to comment obtained Wald test statistics. In the graph, the values above “1” line shows the necessity of rejecting the main hypothesis that shows there is not asymmetric Granger causality (Yılancı and Bozoklu, 2014).
3. Data The time-varying causality relationship between oil and gold prices was analyzed
with monthly data set for the periods from 2005 May and 2016 March. For gold prices London Fix Prices obtained from www.kitco.com and for oil prices Europe Brent Spot Price FOB (Dollars per Barrel) obtained from www.eia.gov.tr were used in the research. All analyses were made after natural logarithms of all data used in the research were taken.
4. Results 4.1. Results of Carrion-i Silvestre Unit Root Test Carrion-i Silvestre which allows five structural breaks unit root test was applied to
the gold and oil prices whose natural logartihms were taken. The obtained findings are as in Table 1.
1 1 1 1 1,0 1 11 1
2 2 1 2 2 ,0 2 21 1
t t
t t t i ii i
t t
t t t i ii i
y y y
y y y
1 1 1 11 1
, ,t t
i i i ii i
y y
2 2 2 21 1
,t t
i i i ii i
y y
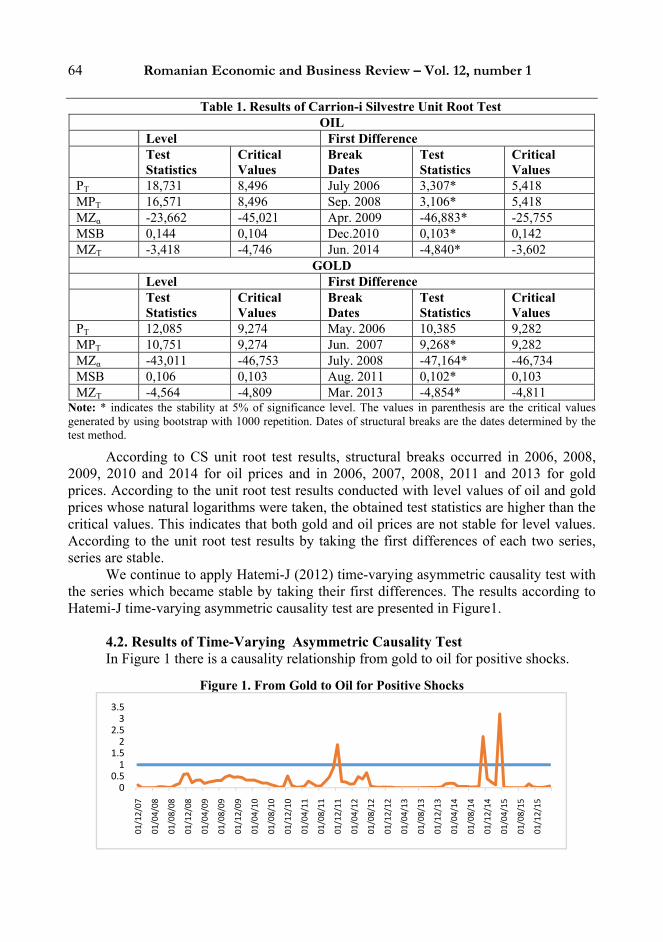
64 Romanian Economic and Business Review – Vol. 12, number 1
Table 1. Results of Carrion-i Silvestre Unit Root Test OIL
Level First Difference Test
Statistics Critical Values
Break Dates
Test Statistics
Critical Values
PT 18,731 8,496 July 2006 3,307* 5,418 MPT 16,571 8,496 Sep. 2008 3,106* 5,418 MZα -23,662 -45,021 Apr. 2009 -46,883* -25,755 MSB 0,144 0,104 Dec.2010 0,103* 0,142 MZT -3,418 -4,746 Jun. 2014 -4,840* -3,602
GOLD Level First Difference Test
Statistics Critical Values
Break Dates
Test Statistics
Critical Values
PT 12,085 9,274 May. 2006 10,385 9,282 MPT 10,751 9,274 Jun. 2007 9,268* 9,282 MZα -43,011 -46,753 July. 2008 -47,164* -46,734 MSB 0,106 0,103 Aug. 2011 0,102* 0,103 MZT -4,564 -4,809 Mar. 2013 -4,854* -4,811
Note: * indicates the stability at 5% of significance level. The values in parenthesis are the critical values generated by using bootstrap with 1000 repetition. Dates of structural breaks are the dates determined by the test method.
According to CS unit root test results, structural breaks occurred in 2006, 2008, 2009, 2010 and 2014 for oil prices and in 2006, 2007, 2008, 2011 and 2013 for gold prices. According to the unit root test results conducted with level values of oil and gold prices whose natural logarithms were taken, the obtained test statistics are higher than the critical values. This indicates that both gold and oil prices are not stable for level values. According to the unit root test results by taking the first differences of each two series, series are stable.
We continue to apply Hatemi-J (2012) time-varying asymmetric causality test with the series which became stable by taking their first differences. The results according to Hatemi-J time-varying asymmetric causality test are presented in Figure1.
4.2. Results of Time-Varying Asymmetric Causality Test In Figure 1 there is a causality relationship from gold to oil for positive shocks.
Figure 1. From Gold to Oil for Positive Shocks
00.51
1.52
2.53
3.5
01/12/07
01/04/08
01/08/08
01/12/08
01/04/09
01/08/09
01/12/09
01/04/10
01/08/10
01/12/10
01/04/11
01/08/11
01/12/11
01/04/12
01/08/12
01/12/12
01/04/13
01/08/13
01/12/13
01/04/14
01/08/14
01/12/14
01/04/15
01/08/15
01/12/15

Time Varying Causality Between Gold and Oil Prices 65
As can be seen in Figure 1, the causality relationship from gold prices to oil prices in positive shocks emerges obviously in December 2011, November 2014 and March 2014 periods. There is no causality from gold prices to oil prices in other periods. In 2011 when the first causality relationship was observed gold prices increased at record high. Also the effects of economic crisis affecting USA and Europe coincide with this period again. In December 2014 and March 2015 periods again one of the economic events that could be the source of the causality relationship from gold prices to oil prices may be Russia’s cancellation of South Stream Project that Russia would provide natural gas to Europe.
Figure 2. From Gold To Oil For Negative Shocks
However, according to Figure 2, there is causality relationship from gold prices to oil prices for negative shocks in especially last period of 2009 and 2014. When the events happened in this period are analyzed in detail, cancelation of South Stream Project draws attention. This project was cancelled since Russia and Bulgaria could not come to an agreement. Also in this period the agreements about nuclear energy and oil searching between India and Russia are the important events affecting gold and oil prices.
Figure 3. From OilTo Gold For Pozitive Shocks
According to Figure 3 there is a stable causality relationship from oil prices to gold prices between 2009 and 2011 for the positive shocks. When this period is analyzed, the mortgage crisis in 2008 and then the economic crisis affecting both USA and Europe in 2011 draw attention. Also cancelation of South Stream Project occurred at the end of 2014 and the agreements between Russia and India in energy sector can be indicated as the source of causality relationship happened in this period.
0
0.5
1
1.5
2
2.5
3
01/12/07
01/04/08
01/08/08
01/12/08
01/04/09
01/08/09
01/12/09
01/04/10
01/08/10
01/12/10
01/04/11
01/08/11
01/12/11
01/04/12
01/08/12
01/12/12
01/04/13
01/08/13
01/12/13
01/04/14
01/08/14
01/12/14
01/04/15
01/08/15
01/12/15
0
1
2
3
4
5
Tarih
29.02.08
30.05.08
29.08.08
28.11.08
27.02.09
29.05.09
31.08.09
30.11.09
26.02.10
31.05.10
31.08.10
30.11.10
28.02.11
31.05.11
31.08.11
30.11.11
29.02.12
31.05.12
31.08.12
30.11.12
28.02.13
31.05.13
30.08.13
29.11.13
28.02.14
30.05.14
29.08.14
28.11.14
27.02.15
29.05.15
31.08.15
30.11.15
29.02.16
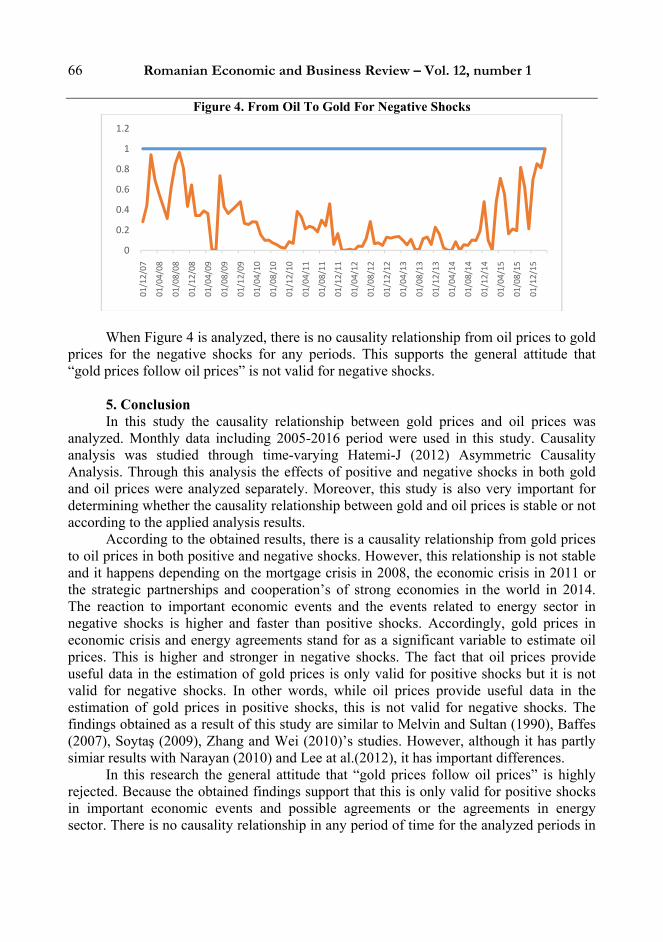
66 Romanian Economic and Business Review – Vol. 12, number 1
Figure 4. From Oil To Gold For Negative Shocks
When Figure 4 is analyzed, there is no causality relationship from oil prices to gold prices for the negative shocks for any periods. This supports the general attitude that “gold prices follow oil prices” is not valid for negative shocks.
5. Conclusion In this study the causality relationship between gold prices and oil prices was
analyzed. Monthly data including 2005-2016 period were used in this study. Causality analysis was studied through time-varying Hatemi-J (2012) Asymmetric Causality Analysis. Through this analysis the effects of positive and negative shocks in both gold and oil prices were analyzed separately. Moreover, this study is also very important for determining whether the causality relationship between gold and oil prices is stable or not according to the applied analysis results.
According to the obtained results, there is a causality relationship from gold prices to oil prices in both positive and negative shocks. However, this relationship is not stable and it happens depending on the mortgage crisis in 2008, the economic crisis in 2011 or the strategic partnerships and cooperation’s of strong economies in the world in 2014. The reaction to important economic events and the events related to energy sector in negative shocks is higher and faster than positive shocks. Accordingly, gold prices in economic crisis and energy agreements stand for as a significant variable to estimate oil prices. This is higher and stronger in negative shocks. The fact that oil prices provide useful data in the estimation of gold prices is only valid for positive shocks but it is not valid for negative shocks. In other words, while oil prices provide useful data in the estimation of gold prices in positive shocks, this is not valid for negative shocks. The findings obtained as a result of this study are similar to Melvin and Sultan (1990), Baffes (2007), Soytaş (2009), Zhang and Wei (2010)’s studies. However, although it has partly simiar results with Narayan (2010) and Lee at al.(2012), it has important differences.
In this research the general attitude that “gold prices follow oil prices” is highly rejected. Because the obtained findings support that this is only valid for positive shocks in important economic events and possible agreements or the agreements in energy sector. There is no causality relationship in any period of time for the analyzed periods in
0
0.2
0.4
0.6
0.8
1
1.2
01/12/07
01/04/08
01/08/08
01/12/08
01/04/09
01/08/09
01/12/09
01/04/10
01/08/10
01/12/10
01/04/11
01/08/11
01/12/11
01/04/12
01/08/12
01/12/12
01/04/13
01/08/13
01/12/13
01/04/14
01/08/14
01/12/14
01/04/15
01/08/15
01/12/15

Time Varying Causality Between Gold and Oil Prices 67
negative shocks. However, oil prices follow gold prices in important economic events and in the issues about energy sector in both positive and negative shocks.
In studies in the future more comprehensive studies can be carried out by associating oil prices with different macroeconomic variables such as national gold prices, foreign exchange rate, stock exchange index.
References Baffes, J. (2007). Oil Spills on Other Commodities. Resources Policy, 32(3), 126-134. Bai, J., and Perron, P. (2003). Computation and Analysis of Multiple Structural Change
Models. Journal of Applied Econometrics, 18(1), pp.1-22. Carrıon-ı-Sılvestre, Lluís, J. Kım D. and Perron P. (2009). GLS-Based Unit Root Tests
with Multiple Structural Breaks Under Both the Null and the Alternative Hypotheses. Econometric Theory, 25, pp.1754-1792.
Göçer, İ. ve Peker, O. (2014). Yabancı Doğrudan Yatırımların İstihdam Üzerindeki Etkisi: Türkiye, Çin ve Hindistan Örneğinde Çoklu Yapısal Kırılmalı Eşbütünleşme Analizi. Yönetim ve Ekonomi, Cilt:21, Sayı:1, ss.107-123.
Granger, C. W., and G. Yoon (2002), 'Hidden Cointegration', Department of Economics Working Paper, University of California, San Diego.
Hatemi-J, A. (2012), Asymmetric Causality Tests with an Application. Empirical Economics, 43(1): 447-456.
Hunt, B. (2006). Oil Price Shocks And the US Stagflation of the 1970s: Some Insights from GEM. The Energy Journal, 61-80.
Jaffe, J., F. (1989), Gold and Gold Stocks as Investments for Institutional Portfolios. Financial Analysts Journal, March-April, 1989, 4,2, 53-59.
Lee, Y. H., Huang, Y. L., & Yang, H. J. (2012). The Asymmetric Long-Run Relationship Between Crude Oil And Gold Futures. Global Journal of Business Research, 6(1), 9-15.
Melvin, M., & Sultan, J. (1990). South African Political Unrest, Oil Prices, And The Time Varying Risk Premium In The Gold Futures Market. Journal of Futures Markets, 10(2), 103-111.
Narayan, P. K., Narayan, S., & Zheng, X. (2010). Gold and Oil Futures Markets: Are Markets Efficient?. Applied Energy, 87(10), 3299-3303.
Reboredo, J. C. (2010). Nonlinear Effects of Oil Shocks On Stock Returns: a Markov-switching approach. Applied Economics, 42(29), 3735-3744.
Reboredo, J. C. (2013). Is Gold a Safe Haven or a Hedge for the US Dollar? Implications for Risk Management. Journal of Banking & Finance, 37(8), 2665-2676.
Sari, R., Hammoudeh, S., & Soytas, U. (2010). Dynamics of Oil Price, Precious Metal Prices, And Exchange Rate. Energy Economics, 32(2), 351-362.
Soytas, U., Sari, R., Hammoudeh, S., & Hacihasanoglu, E. (2009). World Oil Prices, Precious Metal Prices And Macroeconomy in Turkey. Energy Policy,37(12), 5557-5566.
Tiwari, A. K., & Sahadudheen, I. (2015). Understanding The Nexus Between Oil And Gold. Resources Policy, 46, 85-91.
Yılancı, V. and Bozoklu, Ş.(2014), Türk Sermaye Piyasasında Fiyat ve İşlem Hacmi İlişkisi: Zamanla Değişen Asimetrik Nedensellik Analizi, Ege Academic Review, 14(2): 211-220.
Zhang, Y. J., & Wei, Y. M. (2010). The Crude Oil Market and the Gold Market: Evidence for Cointegration, Causality And Price Discovery. Resources Policy,35(3), 168-177.

EXPLORING THE NEXUS BETWEEN PSYCHOLOGICAL CONTRACT AND TURNOVER INTENTION: CONCEPTUAL
FRAMEWORK
Sovanjeet Mishra, Pavan Kumar
Abstract The present study investigates the impact of psychological contract on turnover intention in the insurance sector of India which is heavily affected by high employee or agent turnover. This research clarifies the paucity of literature related to psychological contract in Indian insurance industry. Psychological contract, work culture, workforce diversity is considered as the independent variable and turnover intention, work engagement, trust and job satisfaction as dependent variable. A model is proposed which explores the relationship between psychological contract, turnover intention, and work engagement and it is mediated by job satisfaction. Further, relationship between work culture and job satisfaction; workforce diversity and job satisfaction has been studied. The methodology adopted for this study is literature search. On the basis of the literature search and proposed model it is concluded that a fulfilled psychological contract would result in reducing employee turnover. Limitations and Implications are discussed in detail.
Keywords: Psychological contract, work culture, workforce diversity, turnover intention,
work engagement, trust and job satisfaction JEL Classification: M51,D23,J63,O15 Introduction In the era of globalization and technology driven economy, fulfillment of
obligations by both employee and employer stands crucial. Psychological contract is one of the important predictor to understand the employee-employer relationship (Rousseau, de Rosario, Jardat, & Pesqueux, 2014). So an understanding and effective management of psychological contract would help the organizations to flourish (Rousseau, 2004).
India’s insurance sector is the biggest in the world which consists of 53 insurance companies with about 360 million policies and compounded annual growth rate of 12 to 15 percent growth over the next five years. Currently the general insurance business in India is at Rs 78,000crorepremiums per annum industry and is growing at a healthy rate of 17 percent, but still the threat to manage talent exists. Huge attrition of insurance Sovanjeet Mishra is Research Scholar, School of Management (SoM), National Institute of Technology (NIT) Karnataka, Surathkal. E-mail: [email protected] Pavan Kumar is Asst. Prof., School of Management (SoM), National Institute of Technology (NIT) Karnataka, Surathkal

Exploring the Nexus between Psychological Contract and Turnover Intention: Conceptual Framework 69
agents and workforce had weakened the talent pipeline of insurance sector in India. One of the major challenging human resource issues for the Indian insurance industry is to check the turnover rate which has been on high for many years.
This paper is organized as following: First drawing upon a literature review is Psychological contract, Work culture, Workforce Diversity, Job Satisfaction, Trust, Turnover Intention and Employee Engagement. Next, by combining these research variables we suggest a model and testable propositions for future research. Further, methodology adopted for the research has been described. Finally, it ends with conclusion followed by limitation and implications for future research.
Literature Review Psychological Contract Subjectivity of contract refers to olden times which occurs either in written or oral
agreement form between two parties. When an individual perceives that contribution he or she makes obligate the organization to reciprocity or vice-versa then a psychological contract emerges (Rousseau, 1989). Psychological contract are differentiated into two types such as relational which is open-ended, foster relationship where as transactional involve monetizable exchanges (Rousseau, 1990). Over the time shift has occurred from old bureaucratic psychological contract to new adhocracy psychological contract (Kissler, 1994). In the recent past, Cullinane & Dundon (2006) argued that current literature and theorization has missed sources of influences that impact psychological contract. In the era of 21st century, organizations are finding it difficult to fulfill certain component of psychological contract which employee value much such as open and honest communication and it leads to repercussions on job satisfaction, turnover intention, performance (Lester & Kickul, 2001). Application of psychological contract theory extends from industrial or organizational psychology to distributor-supplier relation, information system outsourcing, online marketing, law (Rousseau, 2011). Though psychological contract research has been around for more than fifty years but still some unresolved issues exist in conceptualization such as what belief constitute psychological contract and defining implicit belief (Conway & Briner, 2009).
Turnover Intention Employee’s turnover results in a serious issue that weakens the talent pipeline of
the organization incurring heavy organizational cost. Turnover intention is conceived to be a conscious and deliberate wilfulness to leave the organization (Tett & Meyer, 1993). A study found out the relationship of healthcare workers turnover intent with individual characteristic, work environment variables and organizational factors (Beecroft, Dorey & Wenten, 2008). Job satisfaction has been found to have inverse relationship with turnover intention (Trevor, 2001).
Work Engagement Engagement is defined as a positive and fulfilling state at work that is defined by
vigour, dedication and absorption (Schaufeli et al., 2002). Engagement significantly predicted turnover intention and job satisfaction in employed college students (Alarcon et al.,

70 Romanian Economic and Business Review – Vol. 12, number 1
2010). Engagement is distinguished from constructs such as commitment, job involvement (Hallberg et al., 2006). Engagement and embeddedness are unique construct and share unique variance with in-role performance and intention to leave (Halbesleben & Wheeler, 2008). In recent literature employee engagement has been identified with four sub-concepts which are stated as, Need-Satisfying approach, Satisfaction-Engagement approach, Burnout Atithesis approach and Multidimensional approach (Shuck & Wollard, 2011).
Organizational Trust Trust is defined as the willingness of a party to be vulnerable to the actions of
another party based on the expectation that the other will perform a particular action important to the trust or, irrespective of the ability to control other party (Mayer, Davis & Schoorman, 1995). A study which involved furloughed workers found that in case of psychological contract breach with previous employer the employee might have difficulty in building trust towards new employer (Kim & Choi, 2010). Trust and work satisfaction are the important ingredient for the functioning of the organization (Lee & Teo, 2005). High level of employee engagement reflects a greater trust and a loyal relationship between organization and individual (Biswas & Bhatnagar, 2013).
Job Satisfaction Job satisfaction has been defined in a different way by researchers which include
involvement of an employee with his/her job and its facets (Spector, 1997). Job satisfaction defined as “a positive emotional state resulting from appraisal of one’s job or job experience” (Locke, 1976).Most of the research work has linked job satisfaction to turnover intentions but still then it suffers from few limitations (Chen, Ployhart, Thomas, Anderson & Bliese, 2011). Individuals experiencing certain level of engagement find their work motivating and results in job satisfaction (Biswas & Bhatnagar, 2013).
Work Culture There has been ample of research concerning the field of organizational culture
which plays a vital role. Organizational culture is defined as set of key values, assumptions, understandings and norms that is shared by member of an organization and taught to new member as correct (Daft, 2005, p. 422). A study found significant positive relationship between organizational culture and job satisfaction scores (Sempane et al., 2002). Organizational learning culture positively influences job satisfaction among university employees (Ebrahim, Obaid, Durrishah & Raheleh, 2013).
Workforce Diversity Diversity is often viewed as differences in race, ethnicity, gender, and sexual
orientation (Tropman, 1998). More the demographic diversity in groups, lesser is the social cohesion (Williams & O’Reilly, 1998). Elvira & Cohen’s (2001) while investigating records of employees at a fortune 500 company found that diversity in groups leads to turnover. Panel data analysis suggests that diversity has no statistical significance on overall job satisfaction and wages (Longhi, 2011). Organizational diversity, supervisor support, inclusion/exclusion has impact on social worker job satisfaction (Acquavita et al., 2009)
Exploring the Nexus between Psychological Contract and Turnover Intention: Conceptual Framework 71
Research gap Psychological contract literature is abundantly dominated with unfulfilled
psychological contract issues leading to psychological contract breach. There has been, not much of research discussing the fulfilled psychological contract and their impact on Indian insurance sector. Hence a research regarding a properly implemented and fulfilled psychological contract would be the need of the hour. Psychological contract can be one of such tool which would help the Indian insurance industry in reducing the turnover intention.
Propositions Psychological Contract and Job Satisfaction Relationship exists between psychological contract and facets of job satisfaction (pay,
work & people) in a non-profit context. Employees whose psychological contract is breached, experience less job satisfaction as compared to high fulfilled and low fulfilled employees and pay as a facet brought less job satisfaction in low fulfilled employees as compared to high fulfilled employees (Beynon, Haffernan & Mcdermott, 2012). A study in a social enterprise sector found that ideological psychological contract has indirect effect on workers job satisfaction through organizational respect. Hence, ideological psychological contract have a positive influence on job satisfaction and perception of respect (Roman, Battistelli & Odoardi, 2014). Employees response to transactional (psychological) contract is monetary as compare to relational (psychological) contract which is more emotional, socially attached and these relational contract give rise to affect-related outcomes which are commitment and job satisfaction (Walker, 2013). A contradicting research result came in the relation between psychological contract and job satisfaction in case of casual workers as compared to full-time workers. Though transactional (psychological) contract are fulfilled for casual workers but the relational (psychological) contract remains unfulfilled as compared to full time workers and hence casual workers exhibit less job satisfaction (Nelson, Tonks & Waymouth, 2006). A longitudinal study stated that employee work behavior and job satisfaction is positively correlated with organizational contract compliance (Portwood & Miller, 1976). A significant relationship exists between psychological contract, job satisfaction and organizational commitment with expectancy from organization (Mohsen & Zahra, 2011). Thus the following hypothesis has been proposed:
H1(a): Psychological contract will be positively related to Job satisfaction Psychological Contract and Work Engagement Perceived organizational support and psychological contract mediates the
relationship between distributive justice and engagement which further explains the existence of a positive relation between psychological contract and engagement (Biswas, Varma & Ramaswami, 2013). Psychological (relational) contract mediates the relationship between developmental HRM and engagement. Developmental HRM provide long term support from organization perspective which in turn helps in building the relationship among employee-employer strengthening the psychological(relational) contract and thus it induces employees to reciprocate by becoming more engaged (Bal, Kooij & Jong, 2013). Psychological contract is a predictor of employee engagement (Bhatnagar & Biswas, 2010). Psychological contract and engagement are important

72 Romanian Economic and Business Review – Vol. 12, number 1
physiological construct which are closely related but not the same (Aggarwal, Datta & Bhargava, 2007). This led to the development of following hypothesis:
H1(b): Psychological (relational) contract will be positively related to Work Engagement
Psychological Contract and Turnover Intention Blomme, Rheede & Tromp (2010) found out that a relationship exists between
psychological contract and turnover intention of employees working in hospitality industry with a purpose to research the differences in psychological contract and its relation to turnover intention between highly educated male and female employees. The contextual factors affecting turnover intention in knowledge workers was examined and concluded by a study which states that psychological contract, reward and recognition were strong mediators between perceived supervisors support, innovation and turnover intention (Bhatnagar, 2014).Research stated that there is a strong relation between psychological contract and turnover intention for those with low tenure as compared to high tenure employees (Bal, Cooman & Mol, 2013). Thus the following hypothesis has been proposed:
H1(c): Psychological contract will be negatively related to Turnover intention
Psychological Contract and Trust A study indicated that employees reacted differently to varying level of fulfilment
of their transactional and relational contract and the research concluded that trust is centrally related to relational as opposed to transactional (Montes & Gregory, 2008). Relationship between trust and attitude towards change is mediated by psychological contract fulfilment and perceived need for change (Sjoerd et al., 2015). Psychological contract fulfilment has been found to be positively related with trust (Agarwal, 2014). Hence the following hypothesis is projected as:
H1(d): Psychological (relational) contract will be positively related to trust
Trust and Job Satisfaction Organizational trust is positively related to job satisfaction but high trust organization
results in high job satisfaction as compared to low trust organization (Perry & Mankin, 2007). A study on interpersonal trust (trust in management and trust in peer) and employee job satisfaction reveals that interpersonal trust significantly influence job satisfaction and it is further found out that trust in peers has a stronger impact on job satisfaction than trust in management (Matzler & Renzl, 2006). Study in hospital sector identified that all dimensions of job satisfaction has a significant relationship with organizational commitment and trust and hence the regression analyses mentioned that organizational trust and two dimensions (reward & communication) of job satisfaction were significant predictor of commitment (M. Top et al., 2013). Organizational restructuring create a negative relation between trust and job satisfaction immediate after post restructuring and in the similar study result also found out that after a span of restructuring positive relation exists between trust and job satisfaction and trust contributed to job satisfaction (Lee & Teo, 2005). There is a significant difference between the dimension of job satisfaction and organizational trust in case of public and private sector (Mehmet, Mesut & Menderes, 2015). Thus the following hypothesis has been proposed:
H2(a): Trust will be positively related to Job satisfaction

Exploring the Nexus between Psychological Contract and Turnover Intention: Conceptual Framework 73
Trust and Turnover Intention A study concluded that trust in top management and CEO is more highly associated
with turnover intention than trust in supervisor but group collectivism does not moderate relation between trust and turnover intention (Costigan, Insinga, Berman, Kranas & Kureshov, 2011). Negative linear relationship exists between affect-based trust and turnover intention (Costigan et al., 2012). Turnover intention, trust and affective commitment were more impacted by psychological contract violation in public sector than in private sector (Shahnawaz & Goswami, 2011). Alper Erturk (2014) investigated and found that organizational trust helps in reducing turnover intention of IT employees working in Turkish public sector organization and it was also reported that trust in organization moderates relationship between turnover intention and perceived organizational support where as trust in supervisor moderate relationship between turnover intention and leader-member exchange. Thus the following hypothesis has been proposed:
H2(b): Trust will be negatively related to Turnover Intention Trust and Work Engagement Trust in organization is a driver for engagement. If employees trust their
organization then they put full effort and commitment to their work which further refers to the output of the study that signifies a positive association between trust and work engagement (Agarwal, 2014). Another study by Wang & Hsieh (2013) found employee trust as a partial mediating effect on authentic leadership and employee engagement and further engagement started showing a positive relation with employee trust. Research mentioned that organizational trust refers to individual expectation and confidence about the action of their organization whereas work engagement refers to involvement and zeal about their work, which implies influence of the former on latter and hence it is concluded that organizational trust is positively related to work engagement and it acts as a partial mediator between work engagement and its antecedent (Lin, 2010). So the following hypothesis came into existence:
H2(c): Trust will be positively related to Work Engagement Work Engagement and Job Satisfaction Work engagement has three constructs such as dedication, vigor and absorption.
Engagement and job satisfaction are two separate constructs but related one (Alarcon & Lyons, 2011). Increased engagement results in enhanced job satisfaction and the finding of the same study further suggest that engagement partially mediates the relation between authentic leadership and job satisfaction (Giallonardo et al., 2010). Job satisfaction predicts engagement and hence the study established a positive relationship between job satisfaction and employee engagement (Brunetto, Teo, Shacklock & Wharton, 2012). Workplace spirituality and creative process engagement are required to create job satisfaction (Fachrunnisa, Adhiatma & Mutamimah, 2014). When work objectives are achieved individuals may develop a feel of inherent well being and gratified which may lead engagement to have a positive influence on job satisfaction (Biswas & Bhatnagar, 2013). A study in Indian IT industry demonstrated that demographic factor such as age, sex, tenure in company did not affect job satisfaction and has little influence on the

74 Romanian Economic and Business Review – Vol. 12, number 1
relationship between engagement and job satisfaction (Kamalanabhan, Sai & Duggirala, 2009). Employee engagement and its dimensions (vigor, dedication & absorption) mediated relationship between job satisfaction and organizational identification (Karanika, Duncan, Ponthes & Griffth, 2015). A study in a hotel industry identified that work engagement partially mediates the relationship between tourism involvement and job satisfaction and work engagement is positively related to job satisfaction (Yeh, 2013). Hence the following hypothesis is projected:
H3(a): Work Engagement will be positively related to Job satisfaction Work Engagement and Turnover Intention With respect to little research that exist related to predictive validity of
engagement, it was found that engagement is an effective predictor of turnover intention controlling for traditional predictor such as burnout (Alarcon & Edwards, 2010). Highly engaged employee would find it difficult to detach away from the work of that organization as he has contributed so much to that and it ultimately builds his own identity (Halbeselben & Wheeler, 2008). Negative relationship exists between engagement and turnover intention and affective commitment mediates this relationship (Burnetto et al., 2012). Thus the following hypothesis is proposed:
H3(b): Work Engagement will be negatively related to Turnover intention Job Satisfaction and Turnover Intention A descriptive cross-sectional multicentre study on Iraqi doctors revealed a
significant relationship between job satisfaction and turnover intention and found that job satisfaction is negatively related to turnover intention (Jadoo et al., 2015). A study found that job satisfaction change negatively correlates with turnover intention change considering average level of job satisfaction as constant which further clarifies that decline (increase) in job satisfaction is associated with increase(decline) in turnover intention(Chen et al., 2011). Flexi work arrangements make employees more enriched from work to home which results in enhanced job satisfaction and reduced turnover intention (McNall, Masuda & Nicklin, 2010). Greater an individual is intrinsically, extrinsically and socially satisfied with his/her job greater will be his commitment and such an attitude will make individual to continue within the organization and restrain turnover intention (Biswas, Varma & Ramaswami, 2013). Turnover Intention was found to be negatively influenced by job satisfaction and organization learning culture (Egan, Yang & Bartlett, 2004). Hence the following hypothesis is projected:
H4:Job satisfaction is negatively related to turnover intention Work Culture and Job Satisfaction Effect of Organizational culture and individual values and a fit between two
contribute to explain variance in job satisfaction, intent to quit and willingness to recommend organization (Tepeci & Bartlett, 2002). Research study by Sempane, Rieger & Roodt (2002) stated that a significant positive correlation was found between organizational culture and job satisfaction and job satisfaction is not determined by biographical variables but culture is. Positive moderate relationship exists between

Exploring the Nexus between Psychological Contract and Turnover Intention: Conceptual Framework 75
learning organization culture and job satisfaction (Dirani, 2009). Organization with hierarchical culture exhibit low job satisfaction of employees as compared to organization with autocratic and clan culture exhibit high job satisfaction. So more efficient and stronger the culture higher is the level of job satisfaction (Zavyalova & Kucherov, 2010). Researcher compared office and field employee and found that it has no impact on job satisfaction but has an impact on different dimensions of organizational culture (Rosenfeld, Richman & May, 2004). A flexible oriented culture positively relates to employee’s job satisfaction and it was further found out that authentic leadership partially mediates the relationship between flexible organizational culture and job satisfaction (Azanza, Moriano & Molero, 2013). Thus the following hypothesis is proposed:
H5: Work Culture which is flexible will be positively related to Job satisfaction Workforce Diversity and Job Satisfaction A study found out that hotel manager who perceived a positive diversity climate
exhibit more job satisfaction and less role ambiguity and role conflict (Madera, Dawson & Neal, 2013). Research by Campbell, (2011) resulted in a conflicting finding which suggest that in United states gender, race and ethnicity is not a reliable predictor of job satisfaction but in certain situation(specific workplace or organization) legitimate correlation between diversity and job satisfaction. A study in England found out that diversity has no statistical significant impact on wages and job satisfaction but in case of cross-section data diversity has shown impact on wages but not on job satisfaction. Further evidence during study found out that employee who never changed districts, benefit from diversity in term of wages but not job satisfaction but employee who moves did not gain from diversity (Longhi & Simonetta, 2011). Diversity correlates job satisfaction and inclusion seems to be best predictor of job satisfaction but individuals who feel as excluded (such as women’s and members of racial ethnic group) experience lower job satisfaction (Barak & Levin, 2002). Diversity correlates negatively with job satisfaction (Long, 1998). This led to the formulation of following hypothesis:
H6: Workforce Diversity will be negatively related to job satisfaction. Job Satisfaction as a Mediator Earlier researchers have found out that there is a significant relationship between
psychological contract, organizational commitment or job satisfaction and turnover intention. Affective commitment is a mediating variable for relationship between psychological contract and turnover intention in hospitality industry (Blomme et al., 2010). Job attitude such as job satisfaction and organizational commitment mediate the impact of psychological contract breach and turnover intention (Harttman & Rutherford, 2015). Though there is not much empirical evidence to state the mediation but the researcher has proposed the following hypothesis:
H7(a): Job satisfaction will mediate the relationship between Psychological contract and Turnover intention
A study found out that psychological contract that are unfulfilled decreases job satisfaction of employees and a dissatisfied employee results in becoming more

76 Romanian Economic and Business Review – Vol. 12, number 1
disengaged and less committed and the study concluded by stating that job satisfaction mediate the relationship between psychological contract breach and work engagement (Bruce, Rayton & Zeynep, 2014). So work engagement will occur when employee feels that psychological contract is in place and employees are satisfied with their jobs. Hence the following hypothesis is proposed:
H7(b): Job satisfaction will mediate the relationship between Psychological contract and Work Engagement
Research study mentioned job satisfaction as a mediating variable between work
environment and turnover intent (Lambert, Hogan & Barton, 2001). Job satisfaction predicts work engagement and commitment which further mention that this organizational commitment partially mediates the relationship between engagement and turnover intention (Brunetto, Teo, Shacklock & Wharton, 2012). So it can be inferred that as job satisfaction predicts commitment and commitment mediates the relationship between engagement and turnover intention hence job satisfaction can be considered as a mediator in the relationship between engagement and turnover intention. These argument help in proposing the following hypothesis:
H7(c): Job satisfaction will mediate the relationship between Employee engagement and Turnover intention
Figure 1: Proposed Model
Method Literature Search This paper is conceptual in nature which is based on review of literature and
developing a theoretical framework. Research article were searched during the period of January 2016 and March 2016. Researcher followed several steps to conduct such search. At first online resource such as google scholar, scopus, ebscohost was adopted as the
Psychological Contract
Work Culture
Turnover Intention
Work Engagement Workforce
Diversity
Job Satisfaction
Trust

Exploring the Nexus between Psychological Contract and Turnover Intention: Conceptual Framework 77
medium. Secondly, in order to make the search efficient relevant keywords such as psychological contract, job satisfaction, turnover intention, trust, work engagement, work culture and workforce diversity etc., were searched. Thirdly, on the basis of relevancy we either accepted or rejected an article for our study. A thumb rule was used in which psychological contract, work culture, workforce diversity were selected as independent variable and turnover intention, job satisfaction, trust, employee engagement as dependent variable. We selected 61 peer reviewed article for our study which excludes dissertations.
Discussion On the basis of the review of the literature and formulated hypothesis, it was found
that a positive relationship exists between psychological contract and job satisfaction; psychological contract and trust; psychological contract and work engagement. But a negative relationship exists between psychological contract and turnover intention. Similarly, it was found out that a positive relationship exist between trust and job satisfaction; trust and work engagement & a negative relationship exists between trust and turnover intention. It was also found out that a positive relationship exist between work engagement and job satisfaction whereas, a negative relationship exists between work engagement and turnover intention. Negative relationship exists between job satisfaction and turnover intention. Further, it was found that work culture is positively related to job satisfaction whereas, work diversity is negatively related to job satisfaction. Finally, it was found that job satisfaction act as a mediator for relationship between psychological contract and turnover intention; psychological contract and work engagement; work engagement and turnover intention.
Conclusion On the basis of the literature search and proposed model, it is concluded that a
fulfilled psychological contract would result in reducing employee turnover and thus help in managing the talent across organization.
Limitations There is dearth in the availability of literature related to fulfilment of psychological
contract in insurance organization. So research has considered allied industry which is categorized as service sector. The findings of the study are the propositions which need to be tested empirically in Indian insurance sector to arrive at the valid results.
Implications for future research This research has some implications for future research. The phenomenon of
outcomes can be approached by researcher in the field of psychology, organizational behavior and human resource management. This study can be extended in finding out other variables as mediator such as trust. Similar study can be taken up in other organization as well to observe the impact of psychological contract.

78 Romanian Economic and Business Review – Vol. 12, number 1
References Acquavita, S. P., Pittman, J., Gibbons, M., & Brown, K.C. (2009). Personal and
Organizational Diversity Factors' Impact on Social Workers' Job Satisfaction: Results from a National Internet-Based Survey. Administration in Social Work, 33(2), 151-166.
Agarwall, U., Datta, S. & Bhargava, S. (2007). The relationship between human resource practices, psychological contract and employee engagement- implications for managing talent. IIMB Management Review, 313-325.
Agarwal, U. A.(2014).Linking justice, trust and innovative work behavior to work engagement. Personnel Review, 43(1), 41-73.
Alarcon,G. M. & Edwards, J.M.(2010).The relationship of engagement, job satisfaction and turnover intentions. Stress and Health, 27,294-298.
Bal, P. M., Dorien, T. A. M. K., & Simon B. D. J. (2013). How Do Developmental and Accommodative HRM Enhance Employee Engagement and Commitment? The Role of Psychological Contract and SOC Strategies. Journal of Management Studies 50(4), 545-572.
Bal, P. M., Cooman, R. D., & Stefan, T. M. (2013). Dynamics of psychological contracts with work engagement and turnover intention: The influence of organizational tenure. European Journal of Work and Organizational Psychology, 22(1), 107-122.
Barak, M., & Levin, A. (2002). Outside of the corporate mainstream and excluded from the work community: A study of diversity, job satisfaction and well-being. Community, Work & Family, 5(2), 133-157.
Beecroft, P.C., Dorey, F. & Wenten, M. (2008). Turnover intention in new graduate nurses: a multivariate analysis. Journal of Advance Nursing, 62(1), 41-52.
Beynon, M. J., Heffernan, M. & Mcdermott, A.M. (2012). Psychological Contracts and job satisfaction: Clustering analysis using evidential c-means and comparison with other techniques. Intelligent Systems in Accounting, Finance and Management,19, 247-273.
Bhatnagar, J., & Biswas, S.(2010). Predictors & outcomes of employee engagement: implications for the resource-based view perspective. The Indian Journal of Industrial Relations, 46(2), 273-288.
Bhatnagar, J.(2014). Mediator analysis in the management of innovation in Indian knowledge workers: the role of perceived supervisor support, psychological contract, reward and recognition and turnover intention. The International Journal of Human Resource Management, 25(10), 1395–1416.
Biswas, S., Varma, A. & Ramaswami, A.(2013). Linking distributive and procedural justice to employee engagement through social exchange: a field study in India. The International Journal of Human Resource Management, 24(8), 1570–158.
Blomme, R.J., Rheedeb A., & Trompb, D.M. (2010). The use of the psychological contract to explain turnover intentions in the hospitality industry: a research study on the impact of gender on the turnover intentions of highly educated employees. The International Journal of Human Resource Management, 21(1), 144–162.
Brunetto, Y., Teo, S., Shacklock, K., & Wharton, R.(2012). Emotional intelligence, job satisfaction, well-being and engagement: explaining organisational commitment and turnover intentions in policing. Human Resource Management Journal, 22(4), 428-441.
Campbell, D.G. (2011). Diversity and job satisfaction: Reconciling conflicting theories and finding. International Journal of Applied Management Technology, 10(1), 1-15.
Chen, G., Ployhart, R.E., Thomas, H.C., Anderson, N., Bliese, P.D.(2011). The power of momentum: a new model of dynamic relationship between job satisfactions change and turnover intentions. Academy of Management Journal, 54(1), 159–181.

Exploring the Nexus between Psychological Contract and Turnover Intention: Conceptual Framework 79
Costigan, R.D., Insinga, R.C., Berman, J.J., & Kranas, G. (2011). Revisting the relationship of supervisor trust and CEO trust to turnover intention: a three country comparative study. Journal of World Business, 46, 74-83.
Conway, N., & Briner, R.B. (2009). Fifty years of psychological contract research: what do we know and what are the main challenges? Industrial Review of Industrial and Organizational Psychology, 24, 71-89, New Jersey, U.S: John Wiley & Sons.
Cullinane, N. & Dundon, T. (2006). The psychological contract: a critical review. International Journal of Management Reviews, 8(2), 113-129.
Daft, R. L. (2005). The leadership experience. Mason, OH: Thompson. Dirani, K.M. (2009). Measuring the learning organization culture, organizational
commitment and job satisfaction in the Lebanese banking sector. Human Resource Development International, 12(2), 189-208.
Ebrahim, M., Obaid, A., Durrishah, I., & Raheleh, E. (2013). The influence of organizational learning culture on job satisfaction among academic staff. Journal of Global Management, 5(1), 56-66
Egan, T.M., Yang, B., Bartlett, K.R. (2004).The Effects of Organizational Learning Culture and Job Satisfaction on Motivation to Transfer Learning and Turnover Intention. Human Resource Development Quarterly, 15(3), 279-301.
Elvira, M., & Cohen, L. (2001). Location matters: A cross-level analysis of the effects of organizational sex composition on turnover. Academy of Management Journal, 44, 591–605.
Erturk, A. (2014). Influences of HR Practices, social exchange and trust on turnover intentions of public I.T professionals. Public Personnel Management, 43(1), 140-175.
Fachrunnisa, O., Adhiatma, A. & Mutamimah. (2014). The Role of Work Place Spirituality and employee engagement to enhance job satisfaction and performance. The International Journal of Organizational Innovation, 7(1), 15-34.
Harttman, N., & Rutherford, B.(2015). Psychological breach antecedents and outcomes in sales people: the role of psychological climate, job attitude and turnover intention. Industrial Marketing Management, 51, 158-170.
Halbesleben, J.R.B. & Wheeler, A.R.(2008).The relative roles of engagement and embeddedness in predicting job performance and intention to leave. Work and Stress,22(3), 242-256.
Hallberg, U.E. & Schaufeli, W.B. (2006). “Same same” but different? Can work engagement be discriminated from job involvement and organizational commitment? European Psychologist, 11, 119-127.
IBEF. (2016). Insurance sector in India. Retrieved from websitehttp://www.ibef.org/ industryinsurance-sector-india.aspx
IRDAI. (2014). Indian Insurance Market. Retrieved from websitehttp://www.policyholder. gov.in/indian_insurance_market.aspx
Jadoo, S., Aljunid, S., Dastan, I., Tawfeeq, R.S., Mustafa, M., Ganasegeran, K., & AlDubai, S. (2015). Job satisfaction and turnover intention among Iraqi doctors - a descriptive cross-sectional multicentre study. Human Resources for Health, 13(21), 2-11.
Karanika, M., Duncan, N., Ponthes, H., & Griffth, M.(2015). Organizational identification, work engagement and job satisfaction. Journal of Managerial Psychology, 30(8), 1019-1033.
Kamalanabhan, T. J., Sai, L., & Duggirala, M.(2009). Employee engagement and job satisfaction in the information technology industry. Psychological reports, 105(3), 750-770
Kim, M.S. & Choi, J. N. (2010). Layoff victim’s employment relationship with a new employer in Korea: effects of unmet tenure expectations on trust and psychological contract. The International Journal of Human Resource Management, 21(5), 781–798.
Kissler, G. D. (1994). The new employment contract. Human Resource Management, 33(3), 335-352.

80 Romanian Economic and Business Review – Vol. 12, number 1
Lester, Scott. W. & Kickul, J. (2001). Psychological contracts in the 21st century. Human Resource Planning, 10-15.
Lee, G. & Teo, A. (2005). Organizational Restructuring: Impact on Trust and Work Satisfaction. Asia Pacific Journal of Management, 22, 23–39.
Lin, C.(2010). Modeling Corporate Citizenship, Organizational Trust, and Work Engagement Based on Attachment Theory. Journal of Business Ethics, 94, 517–531.
Locke, E. A. (1976). The Nature and Causes of Job Satisfaction. Handbook of Industrial and Organizational Psychology, 1297-1349, Rand McNally, Chicago.
Longhi, S. (2011). Impact of cultural diversity on wages and job satisfaction in England. ISER Working Paper Series, No. 2011-19.
Madera, J. M., Dawson, M. & Neal, J. A. (2013). Hotel managers perceived diversity climate and job satisfaction: the mediating effects of role ambiguity and conflict. International Journal of Hospitality Management, 35, 28-34.
Matzler, K., & Renzl, B. (2006).The Relationship between Interpersonal Trust, Employee Satisfaction, and Employee Loyalty. Total Quality Management, 17(10), 1261–1271.
Mayer, R. C., Davis, J.H., & Schoorman, F. (1995). An integrative model of organizational trust. Academy of Management Review, 20(3), 709-734.
Mehmet, T., Mesut, A., & Menderes, T.(2015).Examining transformational leadership, job satisfaction, organizational commitment and organizational trust in Turkish hospitals: public servant v/s private sector employees. International Journal of Human Resource Management, 26(9), 1259-1282.
McNall, L.A., Masuda, A.D., & Nicklin, J. M.(2010). Flexible Work Arrangements, Job Satisfaction, and Turnover Intentions: The Mediating Role of Work-to-Family Enrichment. The Journal of Psychology, 144(1), 61–81.
Mohsen, G. & Zahara, J. (2011).The model relation between psychological contract, commitment and satisfaction with expectancy from organization and unethical behaviors with considering the role of protest opportunity. Journal of Psychological Model and Methods, 2(5), 45-62.
Montes, S. D., & Irving, P. G. (2008). Disentangling the effects of promised and delivered inducements: Relational and transactional contract elements and the mediating role of trust. Journal of Applied Psychology, 93(6), 1367-1381.
Nelson, L., Tonks, G. & Wayemouth, J. (2006). The psychological contract and job satisfaction: experiences of a group of casual workers. Research and Practice in Human Resource Management, 14(2), 18-33.
Perry, R. W., & Mankin, L. D. ( 2007). Organizational Trust, Trust in the Chief Executive and Work Satisfaction. Public Personnel Management Volume 36(2), 165-179.
Portwood, J.D., Miller, E. L. (1976).Evaluating the psychological contract: Its implication for employee job satisfaction and work behavior. Academy of Management (proceedings), 76, 109-113.
Rayton, B.A., & Yalabik, Z. Y. (2014). Work engagement, psychological contract breach and job satisfaction. The International Journal of Human Resource Management, 25(17), 2382-2400.
Roman, J. P., Battistelli, A., & Odoardi, C. (2014). Organizational respect as mediator between the ideological psychological contract and workers’ job satisfaction: empirical findings from the social enterprise sector. Journal of Social Entrepreneurship, 5(1), 107–122.
Rosenfeld, L. B., Richman, J.M., & May, S.M. (2004). Information adequacy, job satisfaction and organizational culture in a dispersed‐network organization. Journal of Applied Communication Research, 32(1), 28-54.
Exploring the Nexus between Psychological Contract and Turnover Intention: Conceptual Framework 81
Rousseau, D.M. (1989).Psychological and implied contracts in organization. Employee Responsibilities and Rights Journal, 2(2), 121-139.
Rousseau, D.M. (2004).Psychological contracts in the workplace: Understanding the ties that motivates. Academy of Management Executives, 18, 120-127.
Rousseau, D.M. (2011).The individual-organizational relationship: the psychological contract. APA Handbook Of Industrial and Organizational Psychology, 3, 191-220.
Rousseau, D.M., de Rosario, P., Jardat, R., & Pesqueux, Y. (2014). Contract psychologique et organisations, Pearson Educations.
Schaufeli, W.B., Salanova, M., Gonzalez-Roma, V., & Bakker, A.B. (2002). The measurement of engagement and burnout: A two sample confirmatory factor analytic approach. Journal of Happiness Studies, 3, 71–92.
Sempane, M., Rieger, HS.,& Roodt, G. (2002). Job satisfaction in relation to organizational culture. SA Journal of Industrial Psychology, 28(2), 23-30.
Shahnawaz, M.G., & Goswami, K. (2011).Effect of Psychological Contract Violation on Organizational Commitment, Trust and Turnover Intention in Private and Public Sector Indian Organizations. Vision, 15(3), 209–217.
Spector, P.E. (1997). Job Satisfaction: Application, Assessment, Causes and Consequences: Advanced Topics in Organizational Behavior, Sage, London.
Sjoerd, H., Rene, S. & Marcel A.L.M., A. (2015). Does a well informed employee have more positive attitude towards change? The mediating role of psychological contract fulfilment, trust and perceived need for change. Journal of Applied Behavioral Science, 51(3), 401-422.
Tepecia, M., & Bartlett, A.L.B. (2002). The hospitality industry culture profile: a measure of individual values, organizational culture, and person–organization fit as predictors of job satisfaction and behavioral intentions. Hospitality Management, 21, 151–170.
Tett, R.P. & Meyer, J.P. (1993). Job satisfaction, organizational commitment, turnover intention and turnover: path analyses based on meta-analytic finding. Personnel Psychology, 46, 259-293.
Trevor, C.O. (2001). Interactions among actual ease-of-movements determinants and job satisfaction in the prediction of voluntary turnover. Academy of Management Journal, 44(4), 621-638.
Tropman, J. E. (1998). Social issues, social policy, and workplace diversity. Workplace diversity issues and perspectives, 88–102, Washington, DC: NASW Press.
Walker, W. J. (2013). The new work contract: mitigating the negative effects of work attitudes. Journal of Organizational Culture, Communications and Conflict, 17(2), 121-136.
Wang, D., & Hsieh, C. (2013).The effect of authentic leadership on employee trust and employee engagement. Social Behaviour and Personality: an International Journal, 41(4), 613-624.
Williams, K. Y., & O’Reilly, C. A., III (1998). Demography and diversity in organizations: A review of 40 years of research. Research in organizational behavior, 20, 77–140, Greenwich, CT: JAI Press
Wollard, K.K., & Shuck, B. (2011). Antecedents to employee engagement: a structured review of literature. Advances in Developing Human Resources, 3, 25-36.
Yeh, C. M.(2013). Tourism involvement, work engagement and job satisfaction among frontline hotel employees.Annals of Tourism Research, 42, 214-239.
Zavyalova, E., & Kucherov, D.(2010). Relationship between organizational culture and job satisfaction in Russian business enterprises. Human Resource Development International, 13(2), 225-235.

INVESTIGATING THE IMPACT OF COMMITMENT, SATISFACTION, AND LOYALTY OF EMPLOYEES ON PROVIDING
HIGHQUALITY SERVICE TO CUSTOMER
Majid ESMAEILPOUR, Mohammad RANJBAR1
Abstract In recent years, the services sector has been grown dramatically in the national economy of the countries. This had lead organizations to pay more attention to needs of the customers considering the quality level of the services. Human factor plays an important role in providing high-quality service to the customer. In light of the ability of the organization employees, service quality improves. The aim of the research was to examine the effects of satisfaction and commitment of employees on the employees’ loyalty and to investigate the effect of employees’ loyalty on quality of services provided for customers. This research is applied in terms of objective and correlational type of descriptive-survey in terms of data collection. Population of the research includes two groups. The first group included employees providing service to customers of Ports and Maritime Organization of Bushehr (Iran) and the second group included customers receiving the services of the organization. From both groups, 250 people were selected using available sampling method to respond to questions of the research. To test the research conceptual model and research hypotheses, structural equation modelling was used. The results showed that job satisfaction of employees have significant positive effect on organizational commitment of employees. Also, job satisfaction and organizational commitment of employees have significant positive effect on their loyalty to organization. In addition, organizational loyalty of employees has positive and significant impact on improving the quality of customer service. Therefore, organizations should make their effort to recruit employees who are suitable for their activities.
Key words: Job satisfaction, Organizational commitment, Organizational loyalty, Quality
of service, Ports and Maritime Organization in Bushehr province JEL Classification: D12, D23, J28, M31 1. Introduction The service sector has been grown substantially in recent years, so that its share in
GDP is more than other sectors. The service sector status in the economy of Iran is improving increasingly, although it is more common in developed countries than other countries. In other words, the central role of services in developed countries is considered as
*Majid Esmaeilpour is Assistant Professor, Business Management, Persian Gulf University, Bushehr, Iran, Email: [email protected]., Mohammad Ranjbaris Expert in charge of Ports & Maritime Organization, Bushehr province and Graduate student of Business Management, Persian Gulf University, Iran, [email protected]

Investigating the Impact of Commitment, Satisfaction, and Loyalty of Employees on Providing 83 High-Quality Service to Customer
the main cause of the increasing importance of providing high-quality service (Zanjani et al., 2011).According to the latest report by the Statistical Center of Iran, most Iranians are involved in service providing sector. Due to the increasing share of the services sector, increasing the quality of services is an essential for organizations seeking to improve financial performance and attract customers in a competitive environment. Quality of the services is one of the marketing issues that have become the subject of academic research in more than three decades (Izogo, 2015). In recent years, much attention has been paid to customer requirements in terms of quality of services. Providing high quality service for customers is used as a tool to achieve competitive advantage (Yee et al., 2010). Human factor plays an important role in providing high-quality service to the customer. When equipment and machinery, technology and even products of an organization are appropriate, the performance of humans creating success in the organization increases. In light of capability of employees in the organization, activities of the organization improve, and customer experience is shaped and loyalty is created (Dadkhah, 2010). Defect in services quality causes customer disappointment in several ways.
Lavlak and Right (2003) argue that there is obvious relationship between customer satisfaction of the service and employee satisfaction with their jobs. In service organization, the role of workforce, especially employees who are in direct contact with the customers is very important in order to provide high-quality service in comparison with manufacturing companies, since employees have interaction with customers to provide service for them and the quality of this interaction distinguishes the superior organizations from other organizations (Nuri, 2004). Accordingly, it can be expressed that loyal employees make much effort in providing services to help organization achieve its goals. In contrast, employees who have no loyalty towards to their organization will have no commitment to customers, the organization's tasks, goals, and visions, and therefore providing services to such employees does not satisfy the customers. As a result, customer will disconnect its relationship with organization (Lavlak& Right, 2003).
In countries that have maritime border, ports have key role. The Ports and Maritime Organization (PMO) plays very important and key role in the development of foreign commerce and trade as well as the transit of goods in these countries. Therefore, creation and expansion of logistic activities of ports enhance economic performance of the port and increase the benefits obtained from it. In addition, it creates attractiveness required for maintaining the current customers and attracting potentially new customers for port (Jafari et al., 2013). On the other hand, the role of employees in providing of services and performing Ports and Maritime Organization tasks is very important. Iran's Ports and Maritime Organization during the recent years has tried to introduce its services by recruiting specialized and efficient forces to earn money while trying to attract customers and to develop their markets. For managers of the organization, providing high-quality service to customers to create satisfaction in them is very important. They want to know how they can improve the quality of services provided to customers. Managers of this organization want to know organizational commitment of employees could lead to increased providing of high- quality service to its customers? They also want to know job satisfaction of employees can improve the quality of services provided by organization from the customer perspective? Is organizational loyalty of employees

84 Romanian Economic and Business Review – Vol. 12, number 1
can improve providing high-quality service to its customers? Therefore, the aim of this research was to evaluate the impact of organizational commitment and job satisfaction on the loyalty status of Ports and Maritime Organization employee in Bushehr province and to examine the effect of employees’ loyalty status of this organization on improvement of the quality of the services provided for customers.
2. Review of Research Literature 2.1. Service, Service quality, and Measurement of the service quality The word service has several meanings and it includes a wide range of personal
services to service as a product. Kotler and Armstrong (2016) defined it as an activity or benefit that one side supplies to other side and it is essentially intangible and it does not involve the ownership of something. Grönroos (2004) defines services as a process occurring in the interaction between customers and employees, physical resources, products, or systems providing service to be solution for issues of the customers. Service has features that make them to be different from goods. These features include intangibility, degradability, high mental involvement of customers, and simultaneous production and consumption, and heterogeneity.
Precisely description of the term quality is difficult, because quality is a multidimensional phenomenon. From marketing management view, quality is all features, which fulfill customer needs. Therefore, any product that has features providing customer needs is high-quality product (Jalali et al, 2014). According to Parasuraman et al. (1988), quality of service is the difference between customer expectations of service and his actual perception of service performance. Quality of service is considered as an organizational asset and important financial performance and marketing factor of the company (Kassim & Abdullah, 2010). The quality of services is emphasized in many service organizations. Improving the level of service quality can help an organization differentiate itself from other organizations and achieve sustainable competitive advantage (Ganguli & Roy, 2011). By increasing efficiency and effectiveness in service providing, the profitability of the organization increases (Lee et al., 2005). Behavior and performance of employees are effective in providing the services (Tirado et al., 2016). If satisfaction of employees is met, service is provided with better quality for customer; leading to customers’ satisfaction (Moreira & Silva, 2015).
The question is always that how quality of services can be provided. Experts have provided different methods and models to assess the quality of services provided in the organizations. The most known scale to measure service quality is SERVQUAL model. SERVQUAL model was introduced by Parasuraman et al. (1991). In this model, service quality has standardized components used to measure people's expectations and perceptions about the quality of public services (Esmaeilpour et al., 2016). This model introduces five dimensions for evaluating the quality of services. These five dimensions include physical dimensions or tangibility, reliability, responsiveness, and assurance, and empathy.
2.2. Job satisfaction of employees Job satisfaction is a set of feelings, beliefs and attitudes that people have about
their current jobs (Ma et al., 2003). Job satisfaction involves sense of happiness that one

Investigating the Impact of Commitment, Satisfaction, and Loyalty of Employees on Providing 85 High-Quality Service to Customer
has of his job and pleasure that he takes of it, leading to job dependency (Lambert et al., 2015). Job satisfaction is the feeling of employees of their jobs (Naderi, 2012). Many studies have shown that job satisfaction is a multidimensional phenomenon that is often influenced by various internal and external factors, such as values and personal principles, organizational climate, and the nature of the job (Belias et al., 2015). From the 1920s until now, job satisfaction has been studied extensively and several theories have been proposed about it (Al Maqbali, 2015). The diversity of approaches and theories of job satisfaction can be derived from three perspectives or basic movements (the movement of human relations, labor unions and growth perspective or nature of the work), formed in the 1920s and 1930s, and it affected the concept of job satisfaction more than anything (Khodayarifard, 2010):
2.3. Organizational commitment of employees Commitment is a type of emotional attachment and prejudice to the values and
goals of an organization (Bazvand et al., 2014). Organizational commitment is a mental attitude and state, which reflects the desire, needs, and requirements in order to continue working in an organization (Dehghanian et al., 2014). Organizational commitment in relation with employees is defined when employees and organization have great interest in maintaining their work relationships (Zayas-Ortiz et al., 2015). Mowday et al. (1979) also defines organizational commitment as the power or ability to individual realization and being engaged or involved in specific organization. They also define organizational commitment as having three major features:
Strong belief in the organization and accepting the values and goals of the organization, Tendency to show considerable efforts in organization, Strong desire to maintain membership in the organization. Nowadays, one of the superior indicators of organization over other organization is
having committed workforce (Utami et al., 2014). Commitment is the obligation that is related to interaction between the employees and the organization. This type of commitment is based on the costs that employee incur as result of leaving his organization. This type of commitment has high correlation with citizenship behavior and it means conviction to serve the organization with a high degree of loyalty. They feel this commitment is their duty (Zayas-Ortiz et al., 2015).
2.4. Organizational loyalty of employees Becker (1960) has described loyalty as a process. He believes that a person has
loyalty to the organization when he has knowledge of better conditions of employment and higher wages, but he refuses to accept that job in order to maintain his current job. From the perspective of Allen and Meyer (1997), organizational loyalty is a subset of the organizational culture. Organizational culture is a set of values and principles governing the organization. For example, when loyalty to the organization is one of the accepted values for employees, it will be as the culture of the organization. The most important capital of organizations is loyal and committed employees who have complete understanding on their activities in the organization. However, this understanding and

86 Romanian Economic and Business Review – Vol. 12, number 1
skill in specialized affairs do not obtain in one day, but it is obtained through continuous activity and the ongoing contact with work conditions of the considered organization. As a result, it is necessary that employees to have loyalty for the organization so that they can higher mastery over their working area (Nuri, 2004). Employees’ loyalty to the organization and their long-term survival in the organization strengthen the workforce sector in the organization and it will provide a source of experiences for the organization. Employees who have loyalty to the organization and operate for the organization over the years know the policies, strategies and the mission of the organization well, and they know how to take step in line with their organization’s advantage. As a result, they have no need to be educated and to be trained. In contrast, continuous change of the employees and lack of loyalty of them to organization impose much costs for organization, leading to loss of organization resources (Makizadeh et al., 2010).
A feeling of loyalty to the organization makes employees to work with higher motivation and interest, so their output will be higher and the productivity of workforce will be greater. The motivation in the employees causes loyalty to organization, commitment, attachment, and job satisfaction. Employees who are loyal to the organization adapt him immediately with the changes since such a person sees himself as part of it and he understands the policies of the organization (Nuri, 2004).Researchers believe that there is clear relationship between customer satisfaction of the service and jobs satisfaction of employees. Service employees enjoy their jobs and see themselves that employer have good behavior and relation with them, and instead of changing their jobs constantly, they remain loyal for organization for the long time. Loyal employees have greater tendency to productivity compared to new employees, because they know their customers well and they can provide high-quality services for them (Lavlak & Right, 2003).
2.5. Experimental literature of research Kashif et al. (2016) examined the job satisfaction and loyalty of employees on the
quality of the services. Research results showed that job satisfaction has impact employees’ loyalty and employees’ loyalty affects service quality and the customers’ satisfaction. Gholampoor and Zaree (2016) investigated the relationship between job satisfaction and employee loyalty and productivity in Shiraz Petrochemical Industries. Their findings showed that job satisfaction has positive and significant impact on employee loyalty and employee loyalty has positive and significant impact on productivity. Godarzvandet al. (2016) examined the relationship between management commitment to service quality and customer satisfaction, employee job satisfaction and customer satisfaction of service performance. Results revealed a significant positive relationship between management commitment to service quality and the effective participation of the employees. In addition, results show that the effective participation of employees has significant and positive relationship with job satisfaction of employees and customer satisfaction of service performance.
Ardeshiri et al. (2015) examined the relationship between organizational commitment and job satisfaction and quality of service provided by Saderat Bank of Kerman. The results showed that there is a significant positive relationship between the variables of job satisfaction and organizational commitment and variable of quality of service provided in the Saderat Bank in Kerman. By increasing job satisfaction and
Investigating the Impact of Commitment, Satisfaction, and Loyalty of Employees on Providing 87 High-Quality Service to Customer
organizational commitment, all dimensions of quality of service increase. Ibrahim and Al Falasi (2014) examined the relationship between employee loyalty and commitment. The results of their research indicate a significant relationship between organizational commitment and loyalty of employees. Roozbehani and Nemati (2013) investigated the effect of job satisfaction on employee loyalty. The results showed that job satisfaction and its components have impact on employee loyalty. Saatchian et al. (2012) studied the relationship between job satisfaction, organizational commitment and the quality of internal services. The results showed that job satisfaction has significant and positive relationship with quality of internal services of employees and normative organizational commitment. However, no significant relationship was found between affective organizational commitment and continuous organizational commitment and quality of internal services.
Yee et al. (2010) examined the relationship between employee loyalty, service quality, customer satisfaction and customer loyalty, and ultimately profitability of the organization. The results of this research showed that employee loyalty affects quality of service, service quality has impact on customer satisfaction, customer satisfaction has impact on customer loyalty, and customer loyalty will affect the profitability of the organization. Martensen and Grønholdt (2009) investigated the relationship between employee loyalty, customer loyalty, and profitability of the organizations. The results showed a positive relationship between employee loyalty and customer loyalty and between customer loyalty and profitability of the organization. Testa (2001) examined the relationship between organizational commitment, job satisfaction, and an effort to provide services. They concluded that organizational commitment moderates job satisfaction and strive to provide better service.
2.6. Hypotheses and research conceptual model Based on the theoretical and applied literature of research, the hypotheses of this
research have been developed. As can be seen in the model, there is relationship between components of job satisfaction, organizational commitment, and loyalty of employees. This relationship is based on the results of Ibrahim and Al Falasi (2014); Roozbehani and Nemati (2013). The hypothesis related to the effect of employee loyalty on the quality of services is based on the researches of Moreira and Silva (2015), Yee et al. (2010), Makizadehet al. (2010).
H1: Job satisfaction of employees has significant and positive effect on organizational commitment of employees.
H2: Job satisfaction of employeeshas significant and positive effect on organizational loyalty of employees.
H3: Organizational commitment of employees has a significant positive impact on organizational loyalty of employees.
H4: Organizational loyalty of employees has a significant and positive impact on the quality of services provided to customers.
By identifying the variables of the research and finding the relationship between
them through theoretical and empirical support, research conceptual model was

88 Romanian Economic and Business Review – Vol. 12, number 1
developed according to Figure (1). In this model, job satisfaction was adopted from Sun Jung and Yoonmodel (2015); organizational commitment was adopted from Mowday and Steers model (1979); organizational loyalty was adopted from Ibrahim and Al Falasi (2014); and quality of services provided to customers was adopted from Parasuraman et al. model (1991).
Figure 1: Conceptual model of research 3. Methodology
This research is an applied research in terms of objective, and it is correlational
type of survey-descriptive research in terms of nature of data collection. In addition, it is considered among the cross-sectional studies in terms of time and duration of the research. Population of the research included two groups. The first group included all employees providing service for Ports and Maritime Organization employees in Bushehr province (Iran) and the second group included customers receiving services from the organization. Due to the large population of the research in both groups, available sampling method was used. From each group, 250 people were asked to cooperate with researcher and complete the questionnaire of the research.
In this research, to write the literature of research, the review of documents (books and journal articles and conferences) method was used, and for collecting data, questionnaire was used. In this research, two independent questionnaires were used. The first questionnaire was used to collect primary data for the variables of employee loyalty, satisfaction and commitment (question 21), and the second questionnaire was used to collect primary data to evaluate the variable of quality of services provided to customers (22 questions). The measurement scale of data in the research questionnaires was in the form of five-option Likert scale (from completely agree to completely disagree).
As questionnaires for this research were developed from questionnaires of other researchers that their validity has already been assessed, it can be said that the research questionnaires have required validity. However, to determine the validity of the questionnaire, content validity was used. For this purpose, developed questionnaires were provided for a number of university professors and administrators, employees and customers of Ports and Maritime Organization in Bushehr province, and they were asked to express their ideas and views about questionnaire validity. After collecting the views, the

Investigating the Impact of Commitment, Satisfaction, and Loyalty of Employees on Providing 89 High-Quality Service to Customer
final questionnaire was developed. To assess the reliability of the questionnaire of the research, the most common method of evaluating the reliability of the questionnaire that is Cronbach's alpha coefficient was used. Cronbach's alpha coefficient for the entire questionnaire and for all the variables of the research was higher than 0.7 that is good coefficient and it suggests that the reliability of the research tools is at the appropriate level. In addition, in order to assess the validity of the questionnaire questions, Average Variance Extracted (AVE) was used and in order to assess the reliability of the questionnaire, composite reliability (CR) was used. Table (1) shows the information regarding development of questions of the questionnaire and the results of the questionnaire reliability and validity Indicators.
Table 1: Research variables and questions extraction resources and the
results of the reliability of the data collection instrument (questionnaire)
CR AVE Cronbach’s
alpha coefficient
Questions extraction resource
Number of
questions
Variable
0.841 0.541 0.769 Reynolds & Harris(2009);
Lambert et al.(2015); Sun Jung & Yoon (2015)
7 Job satisfaction of
employees
0.877 0.588 0.800 Mowday & Steers (1979) 5 Organizational commitment of
employees
0.845 0.579 0.847 Linz et al.(2015);
Ibrahim and Al Falasi (2014)
9 Organizational
loyalty of employees
0.967 0.933 0.965 Parasuraman et al. (1991) 22 Quality of services
provided to customers Source: Provided by authors. As Table (1) shows, given that the value of Cronbach's alpha coefficient and
composite reliability coefficient for all research variables is more than 0.7 and the Average Variance Extracted (AVE) index was more than 0.5 for all variables, it could be stated that reliability of validity of all questions of the variables in the questionnaire have acceptable level of validity and reliability (Hair et al., 2011).To test the hypotheses and the conceptual model research, structural equations modelling method (the method of partial least squares) was used by using Smart PLS software. The reason to use smart PLS software is that the number of samples was low, Amos and LISREL software cannot be used to examine the conceptual model of research.
4. Data Analysis and Results In this section, demographic variables of research were analyzed using descriptive
method and normal distribution of data was examined. Finally, the variables of the conceptual model of research were analyzed.

90 Romanian Economic and Business Review – Vol. 12, number 1
4.1. Descriptive results of the data of the research Descriptive statistics was used to analyze demographic variables and research variables.
Table (2) is related to demographic variables of the research that were analyzed through the collection of 250 questionnaires.
Table 2: Demographic characteristics of respondents
Demographic
variable Levels
Frequency of employees
Percentage of frequency
Frequency of customers
Percentage of frequency
Gender Male
Female 219 31
87.6 12.4
227 23
90.8 9.2
Marital status
Married Single
212 38
84.8 15.2
196 54
78.4 21.6
Age
18 to 25 years 26 to 35 years 36 to 45 years 46 to 55 years Over 55 years
17 51
112 43 27
6.8 20.4 44.8 17.2 10.8
29 64 73 46 38
11.6 25.6 29.2 18.4 15.2
Education
Diploma and lower Associate Degree
Undergraduate Graduate and higher
14 46
166 24
5.6 17.4 66.4 9.6
21 27
155 47
8.4 10.8 62
18.8 Source: Provided by authors. As Table (2) shows, most of the respondents were male and married. In addition,
most of them were middle-aged in terms of age (36 to 45) and in terms of education, most of them had academic (bachelor) level of education.
Before carrying out causal analyses on the data and testing the hypotheses, the descriptive state of the variables should be ensured. For this purpose, this research tried to examine the mean and dispersion Indicators of the research descriptively. The results of these analyses are shown in Table (3).
Table 3: Descriptive information of research variables
Variable Mean Standard deviation
Job satisfaction of employees 3.933 0.739 Organizational commitment of employees 3.723 0.778 Organizational loyalty of employees 4.013 0.716 Qualityof services provided to customers 3.729 1.253
Source: Provided by authors. As Table (3) shows, the mean of all the variables is higher than moderate level (3).
This indicates that the job satisfaction, organizational commitment, and organizational loyalty of Ports and Maritime Organization employees of Bushehr province (Iran) are at the appropriate level. In addition, the mean of the variable of providing high-quality services to customers is higher than the middle level (3).This shows that customer satisfaction of the services provided by Bushehr Ports and Maritime Organization is at an appropriate level. The highest mean (4.013 out of 5) and the lowest standard deviation

Investigating the Impact of Commitment, Satisfaction, and Loyalty of Employees on Providing 91 High-Quality Service to Customer
(0.716) related to organizational loyalty of employees and lowest mean (3.723 out of 5) and the highest standard deviation (0.778) related to the organizational loyalty of employees.
4.2. Testing the Conceptual model of research Conceptual model and research hypotheses were tested using structural equation
modeling and smart PLS software. Structural equation modeling method is multivariate analysis analyzing the causal relationship between a set of variables. Using structural equation modeling, the consistency of theoretical model with experimental data can be examined. Structural Equation Modeling helps the researcher test and examine theoretical model that consists of different components. Figure (2) shows the results of the structural equation modeling test along with standardized coefficients (path coefficients) and significance coefficients (t-value).
Figure 2: Implementation of structural equation model, along with standardized coefficients (path
coefficients) and significance coefficients (t-value) Indicators of model fit are one of the most important steps in structural equation
modeling analysis. These Indicators answer this question whether represented model confirms the conceptual model of research by the data (Hair et al., 2011). To investigate the measurement model fit and internal consistency of items, Cronbach's alpha coefficients, composite reliability, and average variance extracted should be used, that the relevant data are shown in Table (1). The data in Table (1) show that the model is has desired fit. In examining overall fit of the structural model, the general evaluation status of the structural model, that is GOF should be considered. GOF criterion is acceptable when it is greater than 0.1 (Hair et al., 2011). Fit index calculated (GOF) of the research model is equal to 0.355. Therefore, it can be stated that the structural model of the research is at desired level.
After reviewing the appropriateness of model in terms of fit, we can examine the variables in terms of significance model and the significance of each variable to and assess their impact on each other. It was found that fit Indicators of measurement and structural models have desired fit. However, the general approval of the conceptual model does not

92 Romanian Economic and Business Review – Vol. 12, number 1
mean that all relations are approved in the model. After general for of the model, the model relationships should be also tested to find that whether the relationships are confirmed or not. After extracting data of the structural equation model, we can test the hypotheses of research. The results of the main research hypothesis test are shown in Table (4).
Table 4: The results of testing the main hypotheses of research
Hypotheses Standardized
path coefficient Calculated
t-value P-value Result
Hypothesis 1:Job satisfaction of employees has significant and positive effect on organizational commitment of employees.
0.547 6.285 0.000 Accepted
Hypothesis 2: Job satisfaction of employees has significant and positive effect on organizational loyalty of employees.
0.437 4.155 0.000 Accepted
Hypothesis 3: Organizational commitment of employees has a significant positive impact on organizational loyalty of employees.
0.331 2.779 0.000 Accepted
Hypothesis 4: organizational loyalty of employees has a significant and positive impact on the quality of services provided to customers.
0.346 6.833 0.000 Accepted
Source: Provided by authors. Implementation of structural equation modeling test shows that there is a significant
positive relationship between the elements of the conceptual model of research. According to the results obtained from the path coefficients and significant coefficients or statistics t (Figure 2), and what has been shown in Table (4).In the other words, Job satisfaction of employees has significant and positive effect on organizational commitment of employees. Alsoit can be said that job satisfaction and organizational commitment of employees have positive and significant on organizational loyalty. In addition, the variable of organizational loyalty of employees has positive and significant on the quality of services provided to customers.
5. Conclusion and Recommendations The aim of this research is to measure the impact of job satisfaction, organizational
commitment and organizational loyalty of employees on the quality of services provided to customers. After theoretical and experimental literature review of the research, hypotheses and conceptual model were developed. The questionnaire was used to collect research data. In total, 250 questionnaires were collected and distributed among the

Investigating the Impact of Commitment, Satisfaction, and Loyalty of Employees on Providing 93 High-Quality Service to Customer
subjects of the research. Then, the conceptual model and hypotheses were tested using structural equation modeling whit smart PLS software. Results revealed that the conceptual model is confirmed according to model fir Indicators.
As data in table (4) shows, the job satisfaction of employees has positive impact on organizational commitment and their loyalty to the organization. In addition, the direction of this impact is positive and they change in same direction. This means that as the job satisfaction of employees in the organization increases, their loyalty to the organization will increase. The result of testing this hypothesis is in line with findings of studies conducted by Moreira & Silva (2015), and Roozbehani&Nemati (2013). They concluded that the rewards and benefits, collaboration and teamwork, working conditions, training and promotion that lead to job satisfaction of employees affect the employees’ loyalty. The positive impact of job satisfaction of employees on their loyalty to the organization shows that employees like to perform their tasks better than the usual performance, since they believe that their expectations in the organization is met. Considering that their job satisfaction can lead to their loyalty to the organization and causes those employees to be reluctant to leave the organization. It is recommended for managers of Ports and Maritime Organization in Bushehr province to encourage the employees to perform their tasks and duties in the best way by establishment of the rewards systems and proper evaluation procedures. The existence of fair evaluation procedures will generate job satisfaction among the employees, leading to organizational loyalty.Fair reward systems in the organization would be possible by identifying the needs of employees and performing their duties and the proper planning to determine the way to pay reward for them, and it will provide the areas for creation of job satisfaction. It is the recommended for managers of the organization to give priority for satisfaction of their employees’ satisfaction over customers’ satisfaction, since satisfaction of employees leads to providing high-quality service to customers, leading to their satisfaction.
Accordance with data in Table (4), the findings of this research shows that the employees’ organizational commitment has positive impact on employee loyalty to the organization. The research findings show that as commitment of employees to the organization increases and their relation with organization is strengthened, their loyalty to organization also increases and they will show fewer tendencies to leave the organization. The findings of the research conducted by Moreira & Silva (2015), and Ibrahim & Al Falasi (2014) confirm the findings of this research. The results of their research suggest positive impact of organizational commitment of employees on their loyalty to the organization. The positive impact of employee commitment and their loyalty showed that if the employees of the organization feel that they work as efficient person in the organization and their relation with organization is very important. They would be more pleased and interested in working with others in such an organization. These people see the problems of the organization as their problems and it would be very hard to them to leave the organization. Considering that the commitment of the employees can lead to their loyalty, it is suggested for Ports and Maritime Organization employees in Bushehr province to recruit capable people with appropriate knowledge and expertise to pave the way for commitment of the employees. These people will feel that they are valuable for

94 Romanian Economic and Business Review – Vol. 12, number 1
organization and by considering their views and suggestions by managers and managers of the organization, their commitment, and loyalty to the organization will increase.
Data of Table (4) indicate that the employees’ loyalty to organization has impact on the quality of services provided to customers. In addition, the value of their impact to each other was positive and they change in same direction. In fact, these findings indicate that as employees' loyalty to the organization increases, they will be more committed to perform their duties, and customers will evaluate the quality of the services provided them high. The findings of this research were in line with the results of research conducted by Moreira & Silva (2015), Yee et al. (2010), and Makizadehet al. (2010). The results of their research showed that the loyalty of employees to the organization affects the quality of services provided to customers. Their findings showed that the quality of services affects customer satisfaction, customer satisfaction affects customer loyalty, and ultimately customer loyalty affects organization profitability. Positive impact of employees’ loyalty on the quality of services provided to employees shows that as employees are more committed to the organization, as they become more responsible for their duties and their job becomes important for them, they will provide high-quality services for the customers, and their dealing with customer will improve, and they will guide the customers highly. In addition, it will lead to intimate relation with customers, and more cooperation with them. Therefore, the managers of Ports and Maritime Organization in Bushehr province are recommended to meet the needs of customers by identifying and meeting the needs of employees. It is recommended to managers and the heads of the organization to provide educational and training classes and courses for loyal employees to provide high-quality service to the customers. These courses help employees become familiar with needs of the customers. Holding educational workshops for employees in order to make them familiar with the new training methods to communicate effectively with customers provides the conditions for services appropriate with needs of the customers.
5.1. Applied recommendations Employees as the most important factor of the organization play very important
role in providing the quality of the service. Organizations should make their effort to recruit employees appropriate with their goals and take necessary actions to strengthen the loyalty of the employees to perform their tasks well. Applied recommendations are presented based on research findings.
Courteous behaviour and dealing of employees and giving value to the customer's ideas and suggestions are expectations of the customers. These expectations are met only by training and promoting the technical and communicative knowledge of employees.
It is recommended for managers of the organizations to encourage employees to perform their duties and tasks recommended with the establishment of the reward system and proper evaluation procedures. The existence of a fair evaluation procedure creates satisfaction and loyalty in employees and thus high-quality services are provided for them.
It is recommended for managers of organizations to pay attention to views and suggestions of employees to increase their commitment, and to give value for them and to use policies to encourage them.

Investigating the Impact of Commitment, Satisfaction, and Loyalty of Employees on Providing 95 High-Quality Service to Customer
It is recommended to the managers of the organizations to develop training and motivational programs to increase the awareness of the employees of their role in the qualification process and promoting their working skills. This will create satisfaction in them, leading to providing high-quality services.
To determine the quality of services d in any period, and to determine the effectiveness of the program to improve the quality of service, it is recommended for managers of the organization to investigate annually the quality of the services provided to customers using SERVQUAL evaluation model.
Increasing the emotional bond in employees and increasing their involvement with organization goals through providing the conditions for forming informal groups in the organization and creating loyalty in employees.
Establishment the network of exchange of views of customers among customers (such as customers club) and continuous evaluation of customers’ views on their satisfaction of service quality provided and effort to use critical and constructive views of customers can pave the way for satisfaction and loyalty of customers to organization.
5.2. Limitations of the research and recommendation for future research Despite the effort for full implementation of this research, it has some limitations
that they should be considered in future studies. Due to using questionnaire, we should treat with caution in generalizing the findings of the research, since using questionnaire in order to analyze the cognitive-social processes might cause bias in responding the questions, leading to reduced accuracy of the results. Literature of conducted research shows that other factors could affect the quality of the services provided to customers, but the time limitation prevents the review of all of these factors. It is recommended that the trust of the employees to organization, the atmosphere, and the culture of the organization to be considered as independent variable and their impact on employment loyalty to be investigated in future studies. In this regard, the value of explained variance shows that they are many other factors that affect the quality of service and loyalty.
References
Al Maqbali, M. (2015). Factors that influence nurses' job satisfaction: a literature review. NursManag (Harrow), 22(2): 7-30.
Allen, N.J., & Meyer, J.P. (1997). Commitment in the workplace: Theory, research, and application. Sage Publications, Inc.
Ardeshiri, P.; Pour Rashidi, R., &Bavarsad, B. (2015). Investigating the relationship between job satisfaction and organizational commitment and quality of service provided for employees of Saderat Bank of Kerman.International Management Conference, Tehran, Mobin Cultural Institute. (In Persian)
Bazvand, K.; Kashef, M.; Esmaeili, M. (2014). The relationship between emotional intelligence, organizational commitment, and job satisfaction in Physical Education Department of Lorestan province. Sports Management, 5(4): 125-143. (In Persian)
Becker, H.S. (1960). Notes on the concept of commitment. The American Journal of Sociology, 66(1), 32-40.

96 Romanian Economic and Business Review – Vol. 12, number 1
Belias, D.; Koustelios, A.; Vairaktarakis, G., & Sdrolias, L. (2015). Organizational Culture and Job Satisfaction of Greek Banking Institutions. Procedia - Social and Behavioral Sciences,175: 314-323.
Dadkhah, M. (2010). Customer-orientation. Shahr-e Ashub Publications, Sixth Edition, Tehran. (In Persian)
Dehghanian, H.; Sabour, A., & Hojjati, A. (2014). The relationship between components of organizational justice and organizational commitment in an insurance company. Journal of Insurance, 23(2): 153-180.(In Persian)
Esmaeilpour, M.; Mohamadi, M., &Rajabi, A. (2016). Effect of Dimensions of Service Quality on the Brand Equity in the Fast Food Industry. Studies in Business and Economics, 11(3), pp. 30-46.
Ganguli, S., & Roy, S. (2011). Generic technology-based service quality dimensions in banking. International Journal of Bank Mark, 29(2): 168-189.
Gholampoor, F., & Zaree, R. (2016). The relationship between job satisfaction and employee loyalty and productivity in the construction and Installation Company in Shiraz Petrochemical Industries. The second International Symposium of management sciences based on Sustainable Development, Tehran, Mehrvand higher education institution. (In Persian)
Godarzvand, M.; Yousefi, S., & Delshad, M. (2016). The relationship between management commitment to service quality and organizational output according to mediating role of the effective participation of employees in the banks of Gilan province. Journal of Development and Transformation Management, 24(2): 39-50. (In Persian)
Grönroos, C. (2004). The Relationship Marketing Process: Communication, Interaction, Dialogue, Value. Journal of Business & Industrial Marketing, 19(2): 99-113.
Hair, F., Ringle, M., & Sarstedt, M. (2011). PLS-SEM: Indeed a Silver Bullet. Journal of Marketing Theory and Practice,19(2):139–152.
Ibrahim, M., & Al Falasi, S. (2014). Employee loyalty and engagement in UAE public sector. Employee Relations, 36(5): 562-582.
Izogo, E. (2015). Customers’ service quality perception in automotive repair. African Journal of Economic and Management Studies, 6(3): 272 - 288.
Jafari, H.; Saeedi, S., & Jafari, H. (2013). Development of ports as strategy to develop marine-oriented development of the country. The first national conference on the development of Makran coast, International Management Conference, Tehran, Mobin Cultural Institute. (In Persian)
Jalali, M .; Gholizdeh, M., & Taleghani, M. (2014). Investigating the quality of services in the insurance industry and its relationship with customer loyalty. International Management Conference, Tehran: Institute of Cultural Ambassadors, pp. 382-400. (In Persian)
Kashif, M. Abdur Rehman, M. & Pilelienė, L. (2016). Customer perceived service quality and loyalty in Islamic banks a collectivist cultural perspective. The TQM Journal, 28(1): 62-78.
Kassim, N., & Abdullah, N. (2010). The effect of perceived service quality dimensions on customer satisfaction, trust, and loyalty in e-commerce settings. Asia Pacific Journal of Marketing and Logistics, 22(3): 351-371.
Khodayarifard, M. (2010). Assessment of job satisfaction and customer satisfaction and Saderat Bank of Iran and providing the psychological intervention model to promote it. Research Project, Faculty of Psychology and Educational Sciences, Saderat Bank, Iran, pp. 1-126.(In Persian)
Kotler, P., Armstrong, G. (2016). Principles of Marketing. Pearson; Student Value Edition, 16th Edition.
Investigating the Impact of Commitment, Satisfaction, and Loyalty of Employees on Providing 97 High-Quality Service to Customer
Lambert, E.; Minor, K.; Wells, J., & Hogan, N. (2015). Social support’s relationship to correctional staff job stress, job involvement, job satisfaction, and organizational commitment. The Social Science Journal, 53(1): 22-32.
Lavlak, C., & Right, L. (2003). Marketing principles and services. Translated by Abolfazl Tajzadeh. Semat press.
Lee, C., & Chen, W. J. (2005). The Effects of Internal Marketing and Organization Culture on Knowledge Management in the Information Technology Industry. Intrnational Journal of Management, 22(4): 661-672.
Linz, S.; Good, L., & Busch, M. (2015). Promoting worker loyalty: an empirical analysis. International Journal of Manpower, 36(2): 169-191.
Ma, C.; Samuels, M., & Alexander, J. (2003). Factors that influence nurse`s job satisfaction. Journal Nurse Adm, 35(5): 293-299.
Makizadeh, V.; Haj Karimi, A., Jamalieh, B. (2010). Relationship between quality of service and customer loyalty in business services organizations. Journal of Management Perspective, 9(1): 27-49. (In Persian)
Martensen, A., & Grønholdt, L. (2009). Improving library users’ perceived quality satisfaction and Loyalty: An integrated measurement and management system. The Journal of Academic Librarianship, 29(3): 140-147.
Moreira, A., & Silva, P. (2015). The trust-commitment challenge in service quality-loyalty relationships. International Journal of Health Care Quality Assurance, 28(3): 253 - 266.
Mowday, R., & Steers, R. (1979). The Measurement ofOrganizational Commitment. Journal of Vocational Behavior, 14(2): 224–247.
Nuri, R., (2004). Investigating the effect of internal services on quality of providing the service to customers (Case study: the Mobile Telecommunication Company of Iran in Tehran). MSc thesis, Faculty of Management, Shahid Beheshti University, Tehran. (In Persian)
Naderi, N. (2012). Teachers: emotional intelligence, job satisfaction, and organizational commitment. Journal of Workplace Learning, 24(4): 256 - 269.
Parasuraman, A., Zeithaml, V., & Berry, L. (1988). SERVQUAL: a multiple-item scale for measuring consumer perceptions of service quality. Journal of Retailing, 64(1): 12-40.
Parasuraman, A., Zeithaml, V., & Berry, L. (1991). Refinement and reassessment of the SERVQUAL scale. Journal of Retailing, 67(4): 420-450.
Reynolds, K., & Harris, L. (2009). Dysfunctional Customer Behavior Severity: An Empirical Examination. Journal of Retailing, 85(3): 321-335.
Roozbehani, M., &Nemati, M. (2013). Investigating the effect of job satisfaction on employee loyalty. Journal of work and community, 154: 33-38.(In Persian)
Saatchian, V.; Ghanbarpour, A.; Rasouli, S., &Poursoltani, H. (2012). The relationship between job satisfaction, organizational commitment, and internal service quality. Journal of Research in Sport and Behavior Management, 9(2): 137-147.(In Persian)
Sun Jung, H., & Yoon, H. (2015). The impact of employees’ positive psychological capital on job satisfaction and organizational citizenship behaviors in the hotel. International Journal of Contemporary Hospitality Management, 27(6): 1135-1156.
Testa, M. R. (2001). Organizational commitment, job satisfaction, and effort in the service environment. The Journal of Psychology, 135(2): 226-236.
Tirado, M.; Guillén, S.; Roig, F.; Tena, M., & García, S. (2016). Service quality in bank during an economic crisis, International Journal of Bank Marketing, 34(2), 235-259.
Utami, A.; Bangun, Y., & Lantu, D. (2014). Understanding the Role of Emotional Intelligence and Trust to the Relationship between Organizational Politics and Organizational Commitment. Procedia - Social and Behavioral Sciences, 115(1): 378-386.

98 Romanian Economic and Business Review – Vol. 12, number 1
Yee, R., Yeng, A., & Cheng, E. (2010). An Empirical study of employee loyalty, service quality and firm performance in the service industry. International journal production economics. 124(1): 109-120.
Zanjani, H.; Motameni, A., &Mousavi, H. (2011). Measuring customer satisfaction of marketing mix elements of after-sales service in the heavy cars industry (road transport). Journal of Commerce, 40(2): 78-92. (In Persian)
Zayas-Ortiz, M., Rosario, E., Marquez, E., & Colón Gruñeiro, P. (2015). Relationship between organizational commitments and organizational citizenship behaviour in a sample of private banking employees. International Journal of Sociology and Social Policy, 35(1): 91-106.