
Role of diagonal tension crack in size effect of shear ...framcos.org/FraMCoS-7/01-29.pdfRole of...
9
Fracture Mechanics of Concrete and Concrete Structures - Recent Advances in Fracture Mechanics of Concrete - B. H. Oh, et al.(eds) ⓒ 2010 Korea Concrete Institute, Seoul, ISBN 978-89-5708-180-8
Transcript of Role of diagonal tension crack in size effect of shear ...framcos.org/FraMCoS-7/01-29.pdfRole of...
Role of diagonal tension crack in size effect of shear strength of deep beams
Y. Tanaka & T. Shimomura
Nagaoka University of Technology, Niigata, Japan
M. Watanabe
Uchiyama Advance Co. Ltd., Chiba, Japan
ABSTRACT: To clarify the effect of cracking propagation behavior especially on the size effect of deep reinforced concrete beams, 17 deep beams were tested in this study. Experimental factors are specimen size, depth, shear span to effective height ratio (a/d) and bonding of longitudinal bars. 6 beams were un-bonded not to induce diagonal tension crack. As a result, these un-bonded beams had small size effect regardless of a/d while bonded beams showed relatively strong size effect in case of 1.5 of a/d. Because the cracking pattern of diagonal crack influences on the strength of com-pressive concrete strut, we developed simplified truss model which can deal with the effect of diagonal cracking path on the strength of deep beams and short beams. Proposed model is verified with past researches. As a result, it is clalified that proposed model tends to overestimate the shear strength when bearing failure occurs.
1 INTRODUCTION
The shear strength of reinforced concrete members de-pends on the compressive strength of concrete, rein-forcement ratio, effective depth and span to effective depth ratio (a/d). There exist other factors which influ-ence on the shear capacity especially in deep beams. When deep beams are loaded, the stress around the loading point and the anchorage zone reaches high level compared with slender beams. Therefore, bearing fail-ure or anchorage failure easily occurs prior to shear fail-ure. This premature failure leads to the reduction of load carrying capacity. As to the size effect of deep beams, some researches report that deep beam has strong size effect, while the other researches come to the opposite conclusion. This discrepancy may be caused from the difference in failure mode or unconsidered factor.
Objective of this study is to clarify the mechanism of size effect in deep beam and to determine its reduction rate. In this study, the influence of the location of diagonal tension crack and the area of bearing plate is investigated experimentally. Reflecting test results, we developed the estimation method for shear strength of deep beam. Pro-posed model is verified by comparing with past test data.
2 EXPERIMENT
2.1 Overview of Experiment
Shear force is transferred by the tied arch system in deep beam. The strength of tied arch system de-
pends on the strength of concrete strut. Therefore it is considered that the propagation of diagonal crack deteriorates the strength of concrete strut. If so, the shear strength and the size effect will be subjected to the propagation behavior of diagonal crack.
In this experiment, reinforcing bar is unbonded not to transfer tensile stress from reinforcing bar to concrete in some specimens. This treatment leads to the absence of diagonal tension crack because ten-sile stress does not reach cracking stress due to the lack of stress transfer. Size effect of unbond speci-mens are examined to extract the effect of diagonal crack on size effect. 1.0 and 1.5 of a/d are selected for testing in this study.
2.2 Specimens
Table 1 and 2 show the summary of specimen de-tails and mix proportion of concrete, respectively. Total number of specimens is 17. a/d is selected as 1.0 or 1.5. Test factors are bonding of longitudinal bar, effective depth and the area of bearing plate. Maximum size of aggregate is constant as 25 mm in every specimen. Because the width of smallest specimen is 50 mm, smallest specimens were casted laterally while other specimens were casted vertically. Compressive strength and elastic modulus in Table 1 were measured on the day of beam test.
The ratio between width b and effective depth d of No.1~No.12 specimens is fixed as 0.25 not to fail in bearing failure mode. Cover depth c is defined as
Fracture Mechanics of Concrete and Concrete Structures -Recent Advances in Fracture Mechanics of Concrete - B. H. Oh, et al.(eds)
ⓒ 2010 Korea Concrete Institute, Seoul, ISBN 978-89-5708-180-8
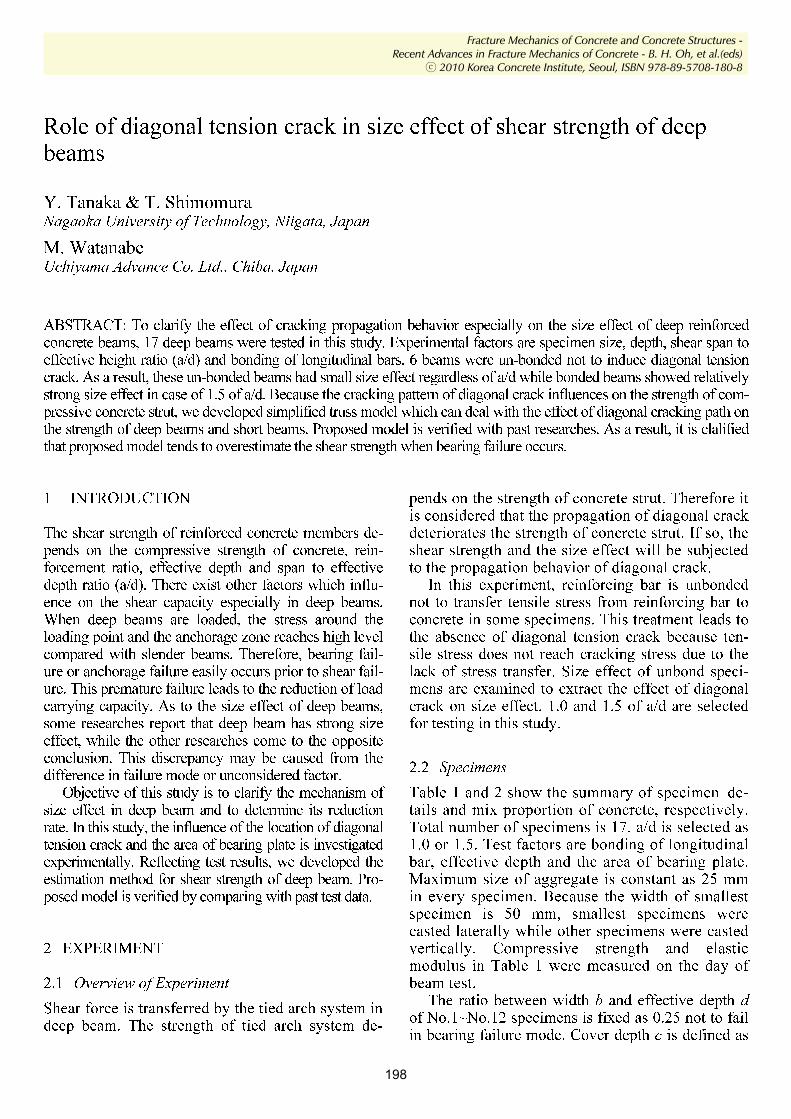
Concrete jacket Anchor plate
(d = 200 mm) (d = 800 mm) Figure 1. Strengthening in end part.
0.5 times of width b to get similar bond strength re-gardless of specimen size. To remove bond between concrete and reinforcing bars, boxboard and Teflon sheet were wrapped around the longitudinal bars. Unbonding treatment ranged 0.8 times of loading span.
No.13~No.17 and No.1 specimens were made to examine the influence of bearing stress. Cover depth in these specimens is 25 mm.
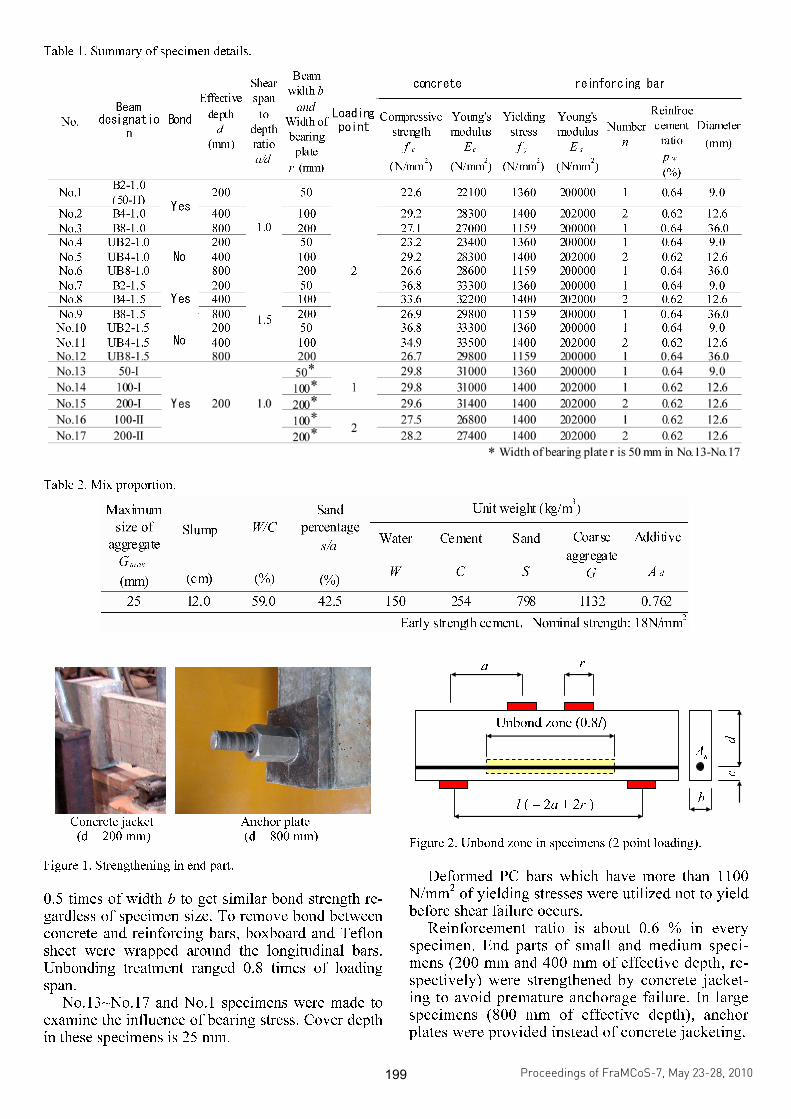
Unbond zone (0.8l)
l ( = 2a + 2r )
a r
b
d
c
As
Figure 2. Unbond zone in specimens (2 point loading).
Deformed PC bars which have more than 1100
N/mm2 of yielding stresses were utilized not to yield
before shear failure occurs. Reinforcement ratio is about 0.6 % in every
specimen. End parts of small and medium speci-mens (200 mm and 400 mm of effective depth, re-spectively) were strengthened by concrete jacket-ing to avoid premature anchorage failure. In large specimens (800 mm of effective depth), anchor plates were provided instead of concrete jacketing.
Table 1. Summary of specimen details.
Table 2. Mix proportion.
Proceedings of FraMCoS-7, May 23-28, 2010
hThD ∇−= ),(J (1)
The proportionality coefficient D(h,T) is called moisture permeability and it is a nonlinear function of the relative humidity h and temperature T (Bažant & Najjar 1972). The moisture mass balance requires that the variation in time of the water mass per unit volume of concrete (water content w) be equal to the divergence of the moisture flux J
J•∇=∂
∂−
t
w (2)
The water content w can be expressed as the sum
of the evaporable water we (capillary water, water vapor, and adsorbed water) and the non-evaporable (chemically bound) water wn (Mills 1966, Pantazopoulo & Mills 1995). It is reasonable to assume that the evaporable water is a function of relative humidity, h, degree of hydration, αc, and degree of silica fume reaction, αs, i.e. we=we(h,αc,αs) = age-dependent sorption/desorption isotherm (Norling Mjonell 1997). Under this assumption and by substituting Equation 1 into Equation 2 one obtains
nscw
s
ew
c
ew
hh
Dt
h
h
ew
&&& ++∂
∂
∂
∂
=∇•∇+∂
∂
∂
∂
− αα
αα
)(
(3)
where ∂we/∂h is the slope of the sorption/desorption isotherm (also called moisture capacity). The governing equation (Equation 3) must be completed by appropriate boundary and initial conditions.
The relation between the amount of evaporable water and relative humidity is called ‘‘adsorption isotherm” if measured with increasing relativity humidity and ‘‘desorption isotherm” in the opposite case. Neglecting their difference (Xi et al. 1994), in the following, ‘‘sorption isotherm” will be used with reference to both sorption and desorption conditions. By the way, if the hysteresis of the moisture isotherm would be taken into account, two different relation, evaporable water vs relative humidity, must be used according to the sign of the variation of the relativity humidity. The shape of the sorption isotherm for HPC is influenced by many parameters, especially those that influence extent and rate of the chemical reactions and, in turn, determine pore structure and pore size distribution (water-to-cement ratio, cement chemical composition, SF content, curing time and method, temperature, mix additives, etc.). In the literature various formulations can be found to describe the sorption isotherm of normal concrete (Xi et al. 1994). However, in the present paper the semi-empirical expression proposed by Norling Mjornell (1997) is adopted because it
explicitly accounts for the evolution of hydration reaction and SF content. This sorption isotherm reads
( ) ( )( )
( ) ( )⎥⎥
⎦
⎤
⎢⎢
⎣
⎡
⎥⎥⎥
⎦
⎤
⎢⎢⎢
⎣
⎡
−
−∞
+
−∞
−=
1110
,1
110
11,
1,,
hcc
ge
scK
hcc
ge
scG
sch
ew
αα
αα
αα
αααα
(4)
where the first term (gel isotherm) represents the physically bound (adsorbed) water and the second term (capillary isotherm) represents the capillary water. This expression is valid only for low content of SF. The coefficient G1 represents the amount of water per unit volume held in the gel pores at 100% relative humidity, and it can be expressed (Norling Mjornell 1997) as
( ) ss
s
vgkc
c
c
vgk
scG αααα +=,1
(5)
where k
cvg and k
svg are material parameters. From the
maximum amount of water per unit volume that can fill all pores (both capillary pores and gel pores), one can calculate K1 as one obtains
( )1
110
110
11
22.0188.00
,1
−⎟⎠
⎞⎜⎝
⎛−∞
⎥⎥⎥
⎦
⎤
⎢⎢⎢
⎣
⎡⎟⎠
⎞⎜⎝
⎛−∞
−−+−
=
hcc
ge
hcc
geGs
ssc
w
scK
αα
αα
αα
αα
(6)
The material parameters k
cvg and k
svg and g1 can
be calibrated by fitting experimental data relevant to free (evaporable) water content in concrete at various ages (Di Luzio & Cusatis 2009b).
2.2 Temperature evolution
Note that, at early age, since the chemical reactions associated with cement hydration and SF reaction are exothermic, the temperature field is not uniform for non-adiabatic systems even if the environmental temperature is constant. Heat conduction can be described in concrete, at least for temperature not exceeding 100°C (Bažant & Kaplan 1996), by Fourier’s law, which reads
T∇−= λq (7)
where q is the heat flux, T is the absolute temperature, and λ is the heat conductivity; in this
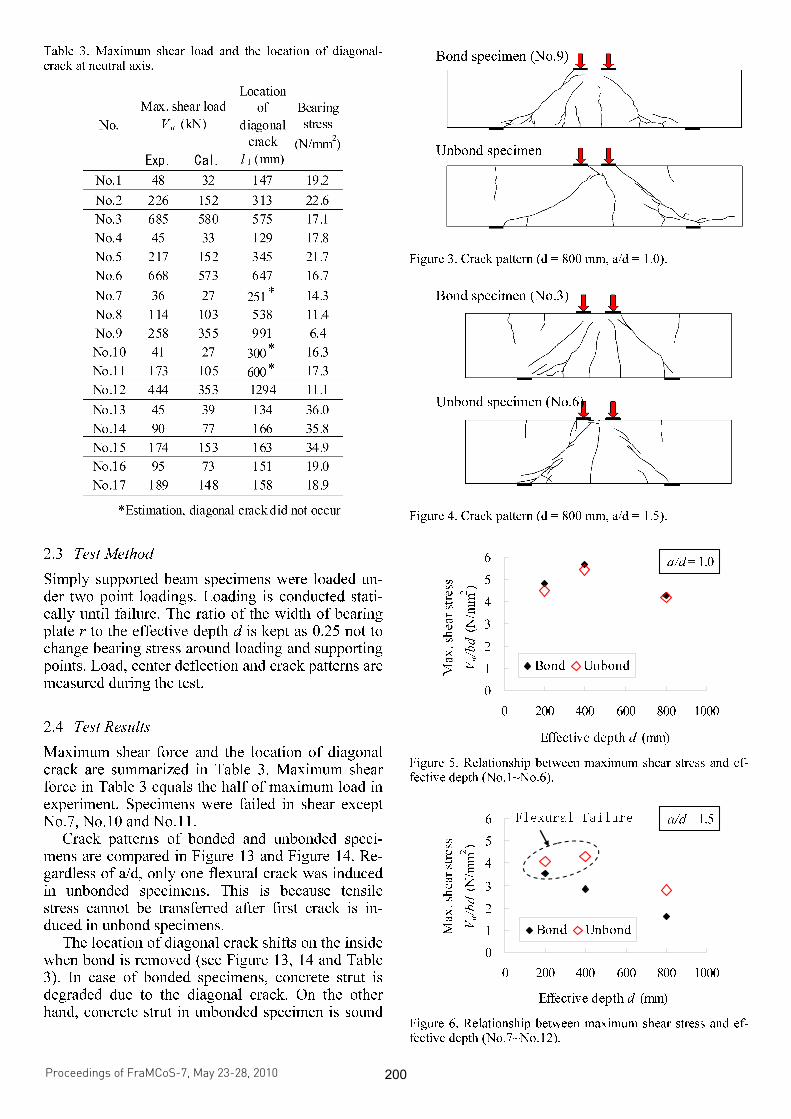
Table 3. Maximum shear load and the location of diagonal-crack at neutral axis.
2.3 Test Method
Simply supported beam specimens were loaded un-der two point loadings. Loading is conducted stati-cally until failure. The ratio of the width of bearing plate r to the effective depth d is kept as 0.25 not to change bearing stress around loading and supporting points. Load, center deflection and crack patterns are measured during the test.
2.4 Test Results
Maximum shear force and the location of diagonal crack are summarized in Table 3. Maximum shear force in Table 3 equals the half of maximum load in experiment. Specimens were failed in shear except No.7, No.10 and No.11.
Crack patterns of bonded and unbonded speci-mens are compared in Figure 13 and Figure 14. Re-gardless of a/d, only one flexural crack was induced in unbonded specimens. This is because tensile stress cannot be transferred after first crack is in-duced in unbond specimens.
The location of diagonal crack shifts on the inside when bond is removed (see Figure 13, 14 and Table 3). In case of bonded specimens, concrete strut is degraded due to the diagonal crack. On the other hand, concrete strut in unbonded specimen is sound
Figure 3. Crack pattern (d = 800 mm, a/d = 1.0).
Figure 4. Crack pattern (d = 800 mm, a/d = 1.5).
0
1
2
3
4
5
6
0 200 400 600 800 1000
Effective depth d (mm)
Max. shear stress
Vu/bd (N/mm
2
)
Bond Unbond
a/d= 1.0
Figure 5. Relationship between maximum shear stress and ef-fective depth (No.1~No.6).
0
1
2
3
4
5
6
0 200 400 600 800 1000
Effective depth d (mm)
Max. shear stress
Vu/bd (N/mm
2
)
Bond Unbond
a/d= 1.5Flexural failure
Figure 6. Relationship between maximum shear stress and ef-fective depth (No.7~No.12).
Bond specimen (No.3)
Unbond specimen (No.6)
Unbond specimen
Bond specimen (No.9)
Proceedings of FraMCoS-7, May 23-28, 2010
hThD ∇−= ),(J (1)
The proportionality coefficient D(h,T) is called moisture permeability and it is a nonlinear function of the relative humidity h and temperature T (Bažant & Najjar 1972). The moisture mass balance requires that the variation in time of the water mass per unit volume of concrete (water content w) be equal to the divergence of the moisture flux J
J•∇=∂
∂−
t
w (2)
The water content w can be expressed as the sum
of the evaporable water we (capillary water, water vapor, and adsorbed water) and the non-evaporable (chemically bound) water wn (Mills 1966, Pantazopoulo & Mills 1995). It is reasonable to assume that the evaporable water is a function of relative humidity, h, degree of hydration, αc, and degree of silica fume reaction, αs, i.e. we=we(h,αc,αs) = age-dependent sorption/desorption isotherm (Norling Mjonell 1997). Under this assumption and by substituting Equation 1 into Equation 2 one obtains
nscw
s
ew
c
ew
hh
Dt
h
h
ew
&&& ++∂
∂
∂
∂
=∇•∇+∂
∂
∂
∂
− αα
αα
)(
(3)
where ∂we/∂h is the slope of the sorption/desorption isotherm (also called moisture capacity). The governing equation (Equation 3) must be completed by appropriate boundary and initial conditions.
The relation between the amount of evaporable water and relative humidity is called ‘‘adsorption isotherm” if measured with increasing relativity humidity and ‘‘desorption isotherm” in the opposite case. Neglecting their difference (Xi et al. 1994), in the following, ‘‘sorption isotherm” will be used with reference to both sorption and desorption conditions. By the way, if the hysteresis of the moisture isotherm would be taken into account, two different relation, evaporable water vs relative humidity, must be used according to the sign of the variation of the relativity humidity. The shape of the sorption isotherm for HPC is influenced by many parameters, especially those that influence extent and rate of the chemical reactions and, in turn, determine pore structure and pore size distribution (water-to-cement ratio, cement chemical composition, SF content, curing time and method, temperature, mix additives, etc.). In the literature various formulations can be found to describe the sorption isotherm of normal concrete (Xi et al. 1994). However, in the present paper the semi-empirical expression proposed by Norling Mjornell (1997) is adopted because it
explicitly accounts for the evolution of hydration reaction and SF content. This sorption isotherm reads
( ) ( )( )
( ) ( )⎥⎥
⎦
⎤
⎢⎢
⎣
⎡
⎥⎥⎥
⎦
⎤
⎢⎢⎢
⎣
⎡
−
−∞
+
−∞
−=
1110
,1
110
11,
1,,
hcc
ge
scK
hcc
ge
scG
sch
ew
αα
αα
αα
αααα
(4)
where the first term (gel isotherm) represents the physically bound (adsorbed) water and the second term (capillary isotherm) represents the capillary water. This expression is valid only for low content of SF. The coefficient G1 represents the amount of water per unit volume held in the gel pores at 100% relative humidity, and it can be expressed (Norling Mjornell 1997) as
( ) ss
s
vgkc
c
c
vgk
scG αααα +=,1
(5)
where k
cvg and k
svg are material parameters. From the
maximum amount of water per unit volume that can fill all pores (both capillary pores and gel pores), one can calculate K1 as one obtains
( )1
110
110
11
22.0188.00
,1
−⎟⎠
⎞⎜⎝
⎛−∞
⎥⎥⎥
⎦
⎤
⎢⎢⎢
⎣
⎡⎟⎠
⎞⎜⎝
⎛−∞
−−+−
=
hcc
ge
hcc
geGs
ssc
w
scK
αα
αα
αα
αα
(6)
The material parameters k
cvg and k
svg and g1 can
be calibrated by fitting experimental data relevant to free (evaporable) water content in concrete at various ages (Di Luzio & Cusatis 2009b).
2.2 Temperature evolution
Note that, at early age, since the chemical reactions associated with cement hydration and SF reaction are exothermic, the temperature field is not uniform for non-adiabatic systems even if the environmental temperature is constant. Heat conduction can be described in concrete, at least for temperature not exceeding 100°C (Bažant & Kaplan 1996), by Fourier’s law, which reads
T∇−= λq (7)
where q is the heat flux, T is the absolute temperature, and λ is the heat conductivity; in this
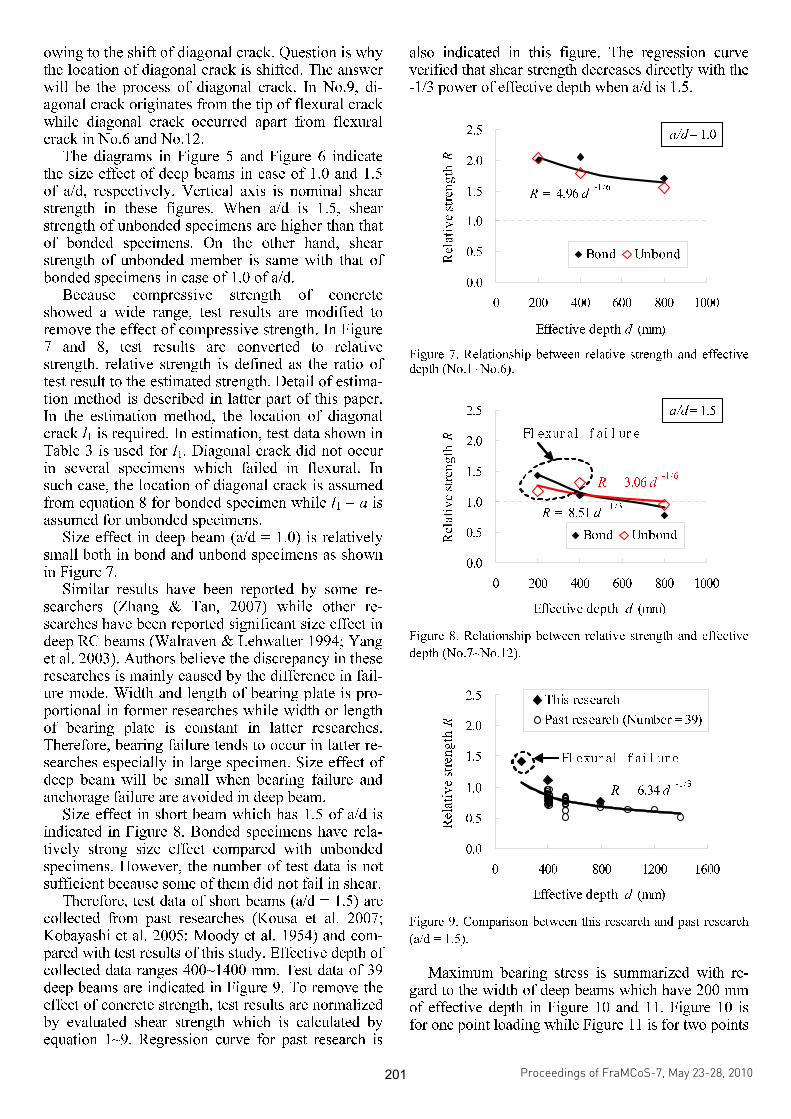
owing to the shift of diagonal crack. Question is why the location of diagonal crack is shifted. The answer will be the process of diagonal crack. In No.9, di-agonal crack originates from the tip of flexural crack while diagonal crack occurred apart from flexural crack in No.6 and No.12.
The diagrams in Figure 5 and Figure 6 indicate the size effect of deep beams in case of 1.0 and 1.5 of a/d, respectively. Vertical axis is nominal shear strength in these figures. When a/d is 1.5, shear strength of unbonded specimens are higher than that of bonded specimens. On the other hand, shear strength of unbonded member is same with that of bonded specimens in case of 1.0 of a/d.
Because compressive strength of concrete showed a wide range, test results are modified to remove the effect of compressive strength. In Figure 7 and 8, test results are converted to relative strength. relative strength is defined as the ratio of test result to the estimated strength. Detail of estima-tion method is described in latter part of this paper. In the estimation method, the location of diagonal crack l1 is required. In estimation, test data shown in Table 3 is used for l1. Diagonal crack did not occur in several specimens which failed in flexural. In such case, the location of diagonal crack is assumed from equation 8 for bonded specimen while l1 = a is assumed for unbonded specimens.
Size effect in deep beam (a/d = 1.0) is relatively small both in bond and unbond specimens as shown in Figure 7.
Similar results have been reported by some re-searchers (Zhang & Tan, 2007) while other re-searches have been reported significant size effect in deep RC beams (Walraven & Lehwalter 1994; Yang et al. 2003). Authors believe the discrepancy in these researches is mainly caused by the difference in fail-ure mode. Width and length of bearing plate is pro-portional in former researches while width or length of bearing plate is constant in latter researches. Therefore, bearing failure tends to occur in latter re-searches especially in large specimen. Size effect of deep beam will be small when bearing failure and anchorage failure are avoided in deep beam.
Size effect in short beam which has 1.5 of a/d is indicated in Figure 8. Bonded specimens have rela-tively strong size effect compared with unbonded specimens. However, the number of test data is not sufficient because some of them did not fail in shear.
Therefore, test data of short beams (a/d = 1.5) are collected from past researches (Kousa et al. 2007; Kobayashi et al. 2005; Moody et al. 1954) and com-pared with test results of this study. Effective depth of collected data ranges 400~1400 mm. Test data of 39 deep beams are indicated in Figure 9. To remove the effect of concrete strength, test results are normalized by evaluated shear strength which is calculated by equation 1~9. Regression curve for past research is
also indicated in this figure. The regression curve verified that shear strength decreases directly with the -1/3 power of effective depth when a/d is 1.5.
0.0
0.5
1.0
1.5
2.0
2.5
0 200 400 600 800 1000
Effective depth d (mm)
Relative strength R
Bond Unbond
a/d= 1.0
R = 4.96 d -1/6
Figure 7. Relationship between relative strength and effective depth (No.1~No.6).
0.0
0.5
1.0
1.5
2.0
2.5
0 200 400 600 800 1000
Effective depth d (mm)
Relative strength R
Bond Unbond
a/d= 1.5
Fl exur al f ai l ur e
R = 8.51 d -1/3
R = 3.06 d -1/6
Figure 8. Relationship between relative strength and effective
depth (No.7~No.12).
0.0
0.5
1.0
1.5
2.0
2.5
0 400 800 1200 1600
Effective depth d (mm)
Relative strength R
This research
Past research (Number = 39)
R = 6.34 d -1/3
Fl exur al f ai l ur e
Figure 9. Comparison between this research and past research
(a/d = 1.5).
Maximum bearing stress is summarized with re-
gard to the width of deep beams which have 200 mm of effective depth in Figure 10 and 11. Figure 10 is for one point loading while Figure 11 is for two points
Proceedings of FraMCoS-7, May 23-28, 2010
hThD ∇−= ),(J (1)
The proportionality coefficient D(h,T) is called moisture permeability and it is a nonlinear function of the relative humidity h and temperature T (Bažant & Najjar 1972). The moisture mass balance requires that the variation in time of the water mass per unit volume of concrete (water content w) be equal to the divergence of the moisture flux J
J•∇=∂
∂−
t
w (2)
The water content w can be expressed as the sum
of the evaporable water we (capillary water, water vapor, and adsorbed water) and the non-evaporable (chemically bound) water wn (Mills 1966, Pantazopoulo & Mills 1995). It is reasonable to assume that the evaporable water is a function of relative humidity, h, degree of hydration, αc, and degree of silica fume reaction, αs, i.e. we=we(h,αc,αs) = age-dependent sorption/desorption isotherm (Norling Mjonell 1997). Under this assumption and by substituting Equation 1 into Equation 2 one obtains
nscw
s
ew
c
ew
hh
Dt
h
h
ew
&&& ++∂
∂
∂
∂
=∇•∇+∂
∂
∂
∂
− αα
αα
)(
(3)
where ∂we/∂h is the slope of the sorption/desorption isotherm (also called moisture capacity). The governing equation (Equation 3) must be completed by appropriate boundary and initial conditions.
The relation between the amount of evaporable water and relative humidity is called ‘‘adsorption isotherm” if measured with increasing relativity humidity and ‘‘desorption isotherm” in the opposite case. Neglecting their difference (Xi et al. 1994), in the following, ‘‘sorption isotherm” will be used with reference to both sorption and desorption conditions. By the way, if the hysteresis of the moisture isotherm would be taken into account, two different relation, evaporable water vs relative humidity, must be used according to the sign of the variation of the relativity humidity. The shape of the sorption isotherm for HPC is influenced by many parameters, especially those that influence extent and rate of the chemical reactions and, in turn, determine pore structure and pore size distribution (water-to-cement ratio, cement chemical composition, SF content, curing time and method, temperature, mix additives, etc.). In the literature various formulations can be found to describe the sorption isotherm of normal concrete (Xi et al. 1994). However, in the present paper the semi-empirical expression proposed by Norling Mjornell (1997) is adopted because it
explicitly accounts for the evolution of hydration reaction and SF content. This sorption isotherm reads
( ) ( )( )
( ) ( )⎥⎥
⎦
⎤
⎢⎢
⎣
⎡
⎥⎥⎥
⎦
⎤
⎢⎢⎢
⎣
⎡
−
−∞
+
−∞
−=
1110
,1
110
11,
1,,
hcc
ge
scK
hcc
ge
scG
sch
ew
αα
αα
αα
αααα
(4)
where the first term (gel isotherm) represents the physically bound (adsorbed) water and the second term (capillary isotherm) represents the capillary water. This expression is valid only for low content of SF. The coefficient G1 represents the amount of water per unit volume held in the gel pores at 100% relative humidity, and it can be expressed (Norling Mjornell 1997) as
( ) ss
s
vgkc
c
c
vgk
scG αααα +=,1
(5)
where k
cvg and k
svg are material parameters. From the
maximum amount of water per unit volume that can fill all pores (both capillary pores and gel pores), one can calculate K1 as one obtains
( )1
110
110
11
22.0188.00
,1
−⎟⎠
⎞⎜⎝
⎛−∞
⎥⎥⎥
⎦
⎤
⎢⎢⎢
⎣
⎡⎟⎠
⎞⎜⎝
⎛−∞
−−+−
=
hcc
ge
hcc
geGs
ssc
w
scK
αα
αα
αα
αα
(6)
The material parameters k
cvg and k
svg and g1 can
be calibrated by fitting experimental data relevant to free (evaporable) water content in concrete at various ages (Di Luzio & Cusatis 2009b).
2.2 Temperature evolution
Note that, at early age, since the chemical reactions associated with cement hydration and SF reaction are exothermic, the temperature field is not uniform for non-adiabatic systems even if the environmental temperature is constant. Heat conduction can be described in concrete, at least for temperature not exceeding 100°C (Bažant & Kaplan 1996), by Fourier’s law, which reads
T∇−= λq (7)
where q is the heat flux, T is the absolute temperature, and λ is the heat conductivity; in this
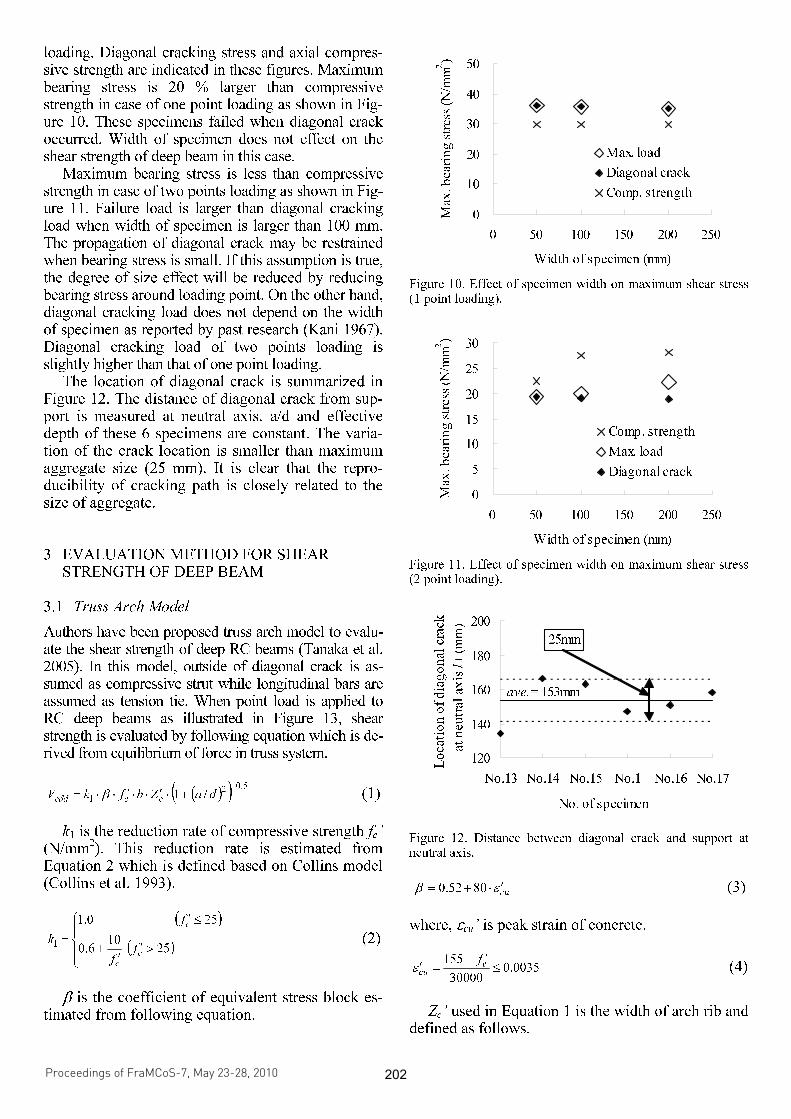
loading. Diagonal cracking stress and axial compres-sive strength are indicated in these figures. Maximum bearing stress is 20 % larger than compressive strength in case of one point loading as shown in Fig-ure 10. These specimens failed when diagonal crack occurred. Width of specimen does not effect on the shear strength of deep beam in this case.
Maximum bearing stress is less than compressive strength in case of two points loading as shown in Fig-ure 11. Failure load is larger than diagonal cracking load when width of specimen is larger than 100 mm. The propagation of diagonal crack may be restrained when bearing stress is small. If this assumption is true, the degree of size effect will be reduced by reducing bearing stress around loading point. On the other hand, diagonal cracking load does not depend on the width of specimen as reported by past research (Kani 1967). Diagonal cracking load of two points loading is slightly higher than that of one point loading.
The location of diagonal crack is summarized in Figure 12. The distance of diagonal crack from sup-port is measured at neutral axis. a/d and effective depth of these 6 specimens are constant. The varia-tion of the crack location is smaller than maximum aggregate size (25 mm). It is clear that the repro-ducibility of cracking path is closely related to the size of aggregate.
3 EVALUATION METHOD FOR SHEAR STRENGTH OF DEEP BEAM
3.1 Truss Arch Model
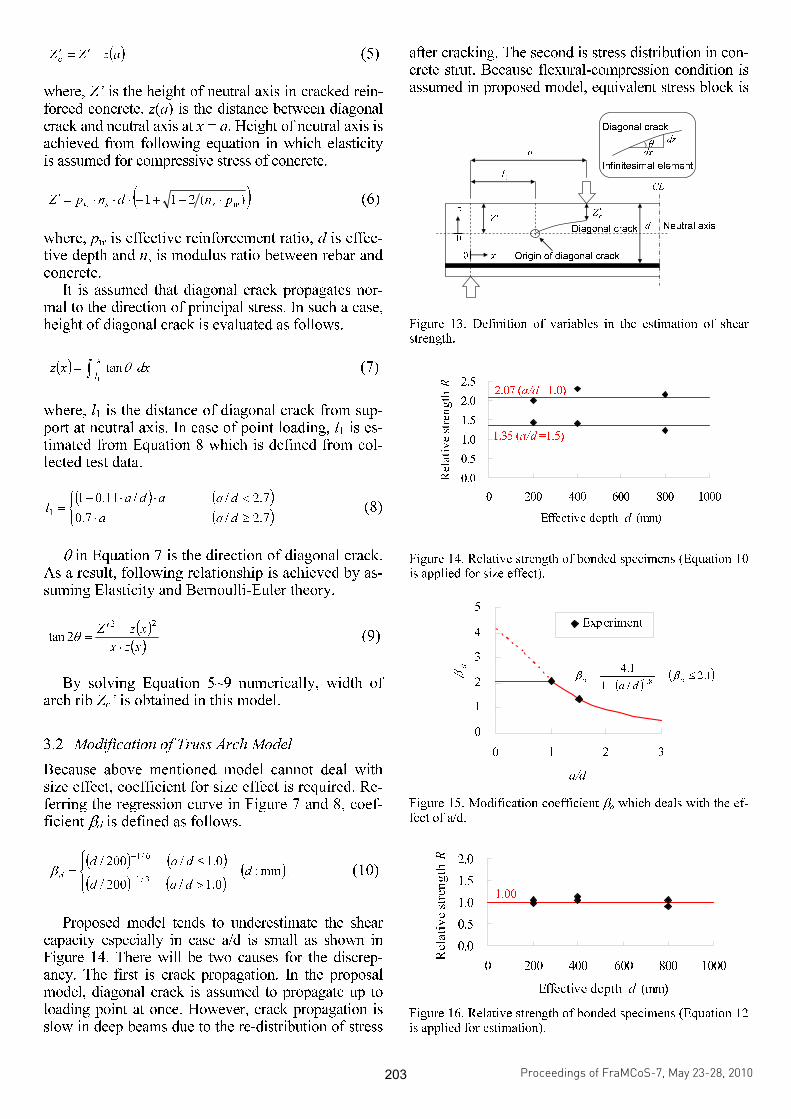
Authors have been proposed truss arch model to evalu-ate the shear strength of deep RC beams (Tanaka et al. 2005). In this model, outside of diagonal crack is as-sumed as compressive strut while longitudinal bars are assumed as tension tie. When point load is applied to RC deep beams as illustrated in Figure 13, shear strength is evaluated by following equation which is de-rived from equilibrium of force in truss system.
( )( ) 5.02
1/1
−
+⋅′⋅⋅′⋅⋅= daZbfkVcccdd
β (1)
k1 is the reduction rate of compressive strength fc’
(N/mm2). This reduction rate is estimated from
Equation 2 which is defined based on Collins model (Collins et al. 1993).
( )
( )⎪⎩
⎪⎨
⎧
>′′
+
≤′
=25
106.0
250.1
1
c
c
c
ff
f
k (2)
β is the coefficient of equivalent stress block es-
timated from following equation.
0
10
20
30
40
50
0 50 100 150 200 250
Width of specimen (mm)
Max. bearing stress (N/mm
2
)
Max. load
Diagonal crack
Comp. strength
Figure 10. Effect of specimen width on maximum shear stress (1 point loading).
0
5
10
15
20
25
30
0 50 100 150 200 250
Width of specimen (mm)
Max. bearing stress (N/mm
2
)
Comp. strength
Max. load
Diagonal crack
Figure 11. Effect of specimen width on maximum shear stress (2 point loading).
120
140
160
180
200
No.13 No.14 No.15 No.1 No.16 No.17
No. of specimen
Location of diagonal crack
at neutral axis l1
(mm)
ave.= 153mm
25mm
Figure 12. Distance between diagonal crack and support at neutral axis.
cuεβ ′⋅+= 8052.0 (3)
where, εcu’ is peak strain of concrete.
0035.030000
155≤
′−=′ c
cu
fε (4)
Zc’ used in Equation 1 is the width of arch rib and
defined as follows.
Proceedings of FraMCoS-7, May 23-28, 2010
hThD ∇−= ),(J (1)
The proportionality coefficient D(h,T) is called moisture permeability and it is a nonlinear function of the relative humidity h and temperature T (Bažant & Najjar 1972). The moisture mass balance requires that the variation in time of the water mass per unit volume of concrete (water content w) be equal to the divergence of the moisture flux J
J•∇=∂
∂−
t
w (2)
The water content w can be expressed as the sum
of the evaporable water we (capillary water, water vapor, and adsorbed water) and the non-evaporable (chemically bound) water wn (Mills 1966, Pantazopoulo & Mills 1995). It is reasonable to assume that the evaporable water is a function of relative humidity, h, degree of hydration, αc, and degree of silica fume reaction, αs, i.e. we=we(h,αc,αs) = age-dependent sorption/desorption isotherm (Norling Mjonell 1997). Under this assumption and by substituting Equation 1 into Equation 2 one obtains
nscw
s
ew
c
ew
hh
Dt
h
h
ew
&&& ++∂
∂
∂
∂
=∇•∇+∂
∂
∂
∂
− αα
αα
)(
(3)
where ∂we/∂h is the slope of the sorption/desorption isotherm (also called moisture capacity). The governing equation (Equation 3) must be completed by appropriate boundary and initial conditions.
The relation between the amount of evaporable water and relative humidity is called ‘‘adsorption isotherm” if measured with increasing relativity humidity and ‘‘desorption isotherm” in the opposite case. Neglecting their difference (Xi et al. 1994), in the following, ‘‘sorption isotherm” will be used with reference to both sorption and desorption conditions. By the way, if the hysteresis of the moisture isotherm would be taken into account, two different relation, evaporable water vs relative humidity, must be used according to the sign of the variation of the relativity humidity. The shape of the sorption isotherm for HPC is influenced by many parameters, especially those that influence extent and rate of the chemical reactions and, in turn, determine pore structure and pore size distribution (water-to-cement ratio, cement chemical composition, SF content, curing time and method, temperature, mix additives, etc.). In the literature various formulations can be found to describe the sorption isotherm of normal concrete (Xi et al. 1994). However, in the present paper the semi-empirical expression proposed by Norling Mjornell (1997) is adopted because it
explicitly accounts for the evolution of hydration reaction and SF content. This sorption isotherm reads
( ) ( )( )
( ) ( )⎥⎥
⎦
⎤
⎢⎢
⎣
⎡
⎥⎥⎥
⎦
⎤
⎢⎢⎢
⎣
⎡
−
−∞
+
−∞
−=
1110
,1
110
11,
1,,
hcc
ge
scK
hcc
ge
scG
sch
ew
αα
αα
αα
αααα
(4)
where the first term (gel isotherm) represents the physically bound (adsorbed) water and the second term (capillary isotherm) represents the capillary water. This expression is valid only for low content of SF. The coefficient G1 represents the amount of water per unit volume held in the gel pores at 100% relative humidity, and it can be expressed (Norling Mjornell 1997) as
( ) ss
s
vgkc
c
c
vgk
scG αααα +=,1
(5)
where k
cvg and k
svg are material parameters. From the
maximum amount of water per unit volume that can fill all pores (both capillary pores and gel pores), one can calculate K1 as one obtains
( )1
110
110
11
22.0188.00
,1
−⎟⎠
⎞⎜⎝
⎛−∞
⎥⎥⎥
⎦
⎤
⎢⎢⎢
⎣
⎡⎟⎠
⎞⎜⎝
⎛−∞
−−+−
=
hcc
ge
hcc
geGs
ssc
w
scK
αα
αα
αα
αα
(6)
The material parameters k
cvg and k
svg and g1 can
be calibrated by fitting experimental data relevant to free (evaporable) water content in concrete at various ages (Di Luzio & Cusatis 2009b).
2.2 Temperature evolution
Note that, at early age, since the chemical reactions associated with cement hydration and SF reaction are exothermic, the temperature field is not uniform for non-adiabatic systems even if the environmental temperature is constant. Heat conduction can be described in concrete, at least for temperature not exceeding 100°C (Bažant & Kaplan 1996), by Fourier’s law, which reads
T∇−= λq (7)
where q is the heat flux, T is the absolute temperature, and λ is the heat conductivity; in this
( )azZZc
−′=′ (5)
where, Z’ is the height of neutral axis in cracked rein-forced concrete. z(a) is the distance between diagonal crack and neutral axis at x = a. Height of neutral axis is achieved from following equation in which elasticity is assumed for compressive stress of concrete.
( ))(211wssw
pndnpZ ⋅++−⋅⋅⋅=′ (6)
where, pw is effective reinforcement ratio, d is effec-tive depth and ns is modulus ratio between rebar and concrete.
It is assumed that diagonal crack propagates nor-mal to the direction of principal stress. In such a case, height of diagonal crack is evaluated as follows.
( ) ∫=
x
ldxxz
1
tanθ (7)
where, l1 is the distance of diagonal crack from sup-port at neutral axis. In case of point loading, l1 is es-timated from Equation 8 which is defined from col-lected test data.
( ) ( )
( )⎩⎨⎧
≥⋅
<⋅⋅−=
7.2/7.0
7.2//11.01
1daa
daadal
(8)
θ in Equation 7 is the direction of diagonal crack.
As a result, following relationship is achieved by as-suming Elasticity and Bernoulli-Euler theory.
( )( )xzx
xzZ
⋅
−′
=
22
2tan θ (9)
By solving Equation 5~9 numerically, width of
arch rib Zc’ is obtained in this model.
3.2 Modification of Truss Arch Model
Because above mentioned model cannot deal with size effect, coefficient for size effect is required. Re-ferring the regression curve in Figure 7 and 8, coef-ficient βd is defined as follows.
( ) ( )
( ) ( )( )mm:
0.1/200/
0.1/200/
3/1
6/1
d
dad
dad
d
⎪⎩
⎪⎨⎧
>
≤=
−
−
β (10)
Proposed model tends to underestimate the shear
capacity especially in case a/d is small as shown in Figure 14. There will be two causes for the discrep-ancy. The first is crack propagation. In the proposal model, diagonal crack is assumed to propagate up to loading point at once. However, crack propagation is slow in deep beams due to the re-distribution of stress
after cracking. The second is stress distribution in con-crete strut. Because flexural-compression condition is assumed in proposed model, equivalent stress block is
x
z
Origin of diagonal crack0
0
dDiagonal crack Neutral axis
CL
a
l1
dx
dz
Diagonal crack
Infinitesimal element
Z ′c
Z ′
θ
Figure 13. Definition of variables in the estimation of shear strength.
0.0
0.5
1.0
1.5
2.0
2.5
0 200 400 600 800 1000
Effective depth d (mm)
Relative strength R 2.07 (a/d =1.0)
1.35 (a/d =1.5)
Figure 14. Relative strength of bonded specimens (Equation 10 is applied for size effect).
Figure 15. Modification coefficient β
a which deals with the ef-
fect of a/d.
0.0
0.5
1.0
1.5
2.0
0 200 400 600 800 1000
Effective depth d (mm)
Relative strength R
1.00
Figure 16. Relative strength of bonded specimens (Equation 12 is applied for estimation).
0
1
2
3
4
5
0 1 2 3
a/d
β
a
Experiment
( )( )1.2
/1
1.4
8.1≤
+
=aa
da
ββ
Proceedings of FraMCoS-7, May 23-28, 2010
hThD ∇−= ),(J (1)
The proportionality coefficient D(h,T) is called moisture permeability and it is a nonlinear function of the relative humidity h and temperature T (Bažant & Najjar 1972). The moisture mass balance requires that the variation in time of the water mass per unit volume of concrete (water content w) be equal to the divergence of the moisture flux J
J•∇=∂
∂−
t
w (2)
The water content w can be expressed as the sum
of the evaporable water we (capillary water, water vapor, and adsorbed water) and the non-evaporable (chemically bound) water wn (Mills 1966, Pantazopoulo & Mills 1995). It is reasonable to assume that the evaporable water is a function of relative humidity, h, degree of hydration, αc, and degree of silica fume reaction, αs, i.e. we=we(h,αc,αs) = age-dependent sorption/desorption isotherm (Norling Mjonell 1997). Under this assumption and by substituting Equation 1 into Equation 2 one obtains
nscw
s
ew
c
ew
hh
Dt
h
h
ew
&&& ++∂
∂
∂
∂
=∇•∇+∂
∂
∂
∂
− αα
αα
)(
(3)
where ∂we/∂h is the slope of the sorption/desorption isotherm (also called moisture capacity). The governing equation (Equation 3) must be completed by appropriate boundary and initial conditions.
The relation between the amount of evaporable water and relative humidity is called ‘‘adsorption isotherm” if measured with increasing relativity humidity and ‘‘desorption isotherm” in the opposite case. Neglecting their difference (Xi et al. 1994), in the following, ‘‘sorption isotherm” will be used with reference to both sorption and desorption conditions. By the way, if the hysteresis of the moisture isotherm would be taken into account, two different relation, evaporable water vs relative humidity, must be used according to the sign of the variation of the relativity humidity. The shape of the sorption isotherm for HPC is influenced by many parameters, especially those that influence extent and rate of the chemical reactions and, in turn, determine pore structure and pore size distribution (water-to-cement ratio, cement chemical composition, SF content, curing time and method, temperature, mix additives, etc.). In the literature various formulations can be found to describe the sorption isotherm of normal concrete (Xi et al. 1994). However, in the present paper the semi-empirical expression proposed by Norling Mjornell (1997) is adopted because it
explicitly accounts for the evolution of hydration reaction and SF content. This sorption isotherm reads
( ) ( )( )
( ) ( )⎥⎥
⎦
⎤
⎢⎢
⎣
⎡
⎥⎥⎥
⎦
⎤
⎢⎢⎢
⎣
⎡
−
−∞
+
−∞
−=
1110
,1
110
11,
1,,
hcc
ge
scK
hcc
ge
scG
sch
ew
αα
αα
αα
αααα
(4)
where the first term (gel isotherm) represents the physically bound (adsorbed) water and the second term (capillary isotherm) represents the capillary water. This expression is valid only for low content of SF. The coefficient G1 represents the amount of water per unit volume held in the gel pores at 100% relative humidity, and it can be expressed (Norling Mjornell 1997) as
( ) ss
s
vgkc
c
c
vgk
scG αααα +=,1
(5)
where k
cvg and k
svg are material parameters. From the
maximum amount of water per unit volume that can fill all pores (both capillary pores and gel pores), one can calculate K1 as one obtains
( )1
110
110
11
22.0188.00
,1
−⎟⎠
⎞⎜⎝
⎛−∞
⎥⎥⎥
⎦
⎤
⎢⎢⎢
⎣
⎡⎟⎠
⎞⎜⎝
⎛−∞
−−+−
=
hcc
ge
hcc
geGs
ssc
w
scK
αα
αα
αα
αα
(6)
The material parameters k
cvg and k
svg and g1 can
be calibrated by fitting experimental data relevant to free (evaporable) water content in concrete at various ages (Di Luzio & Cusatis 2009b).
2.2 Temperature evolution
Note that, at early age, since the chemical reactions associated with cement hydration and SF reaction are exothermic, the temperature field is not uniform for non-adiabatic systems even if the environmental temperature is constant. Heat conduction can be described in concrete, at least for temperature not exceeding 100°C (Bažant & Kaplan 1996), by Fourier’s law, which reads
T∇−= λq (7)
where q is the heat flux, T is the absolute temperature, and λ is the heat conductivity; in this
used to estimate compressive strength of concrete strut. This assumption is appropriate for short or slender beam. On the other hand, stress condition of concrete strut in deep beam is thought to be similar to the axial compression. For these reasons, we de-cided to use additional coefficient βa with regard to a/d.
( )( )1.2
/1
1.4
8.1≤
+
=aa
da
ββ (11)
This equation is defined to match test results in
this study (see Fig. 15). Upper limit is decided as 2.1 (a/d = 1) because we do not have test data which is less than 1 in a/d.
As a result, equation for shear strength is modi-fied as shown in Equation 12.
( )( ) 5.02
1/1
−
+⋅′⋅⋅′⋅⋅⋅⋅= daZbfkVccdacdd
βββ (12)
This equation covers 1.0~2.0 regarding a/d. Estimated shear strength are compared with test
results in Figure 16. It is clear that truss arch model is modified to match test results in this study.
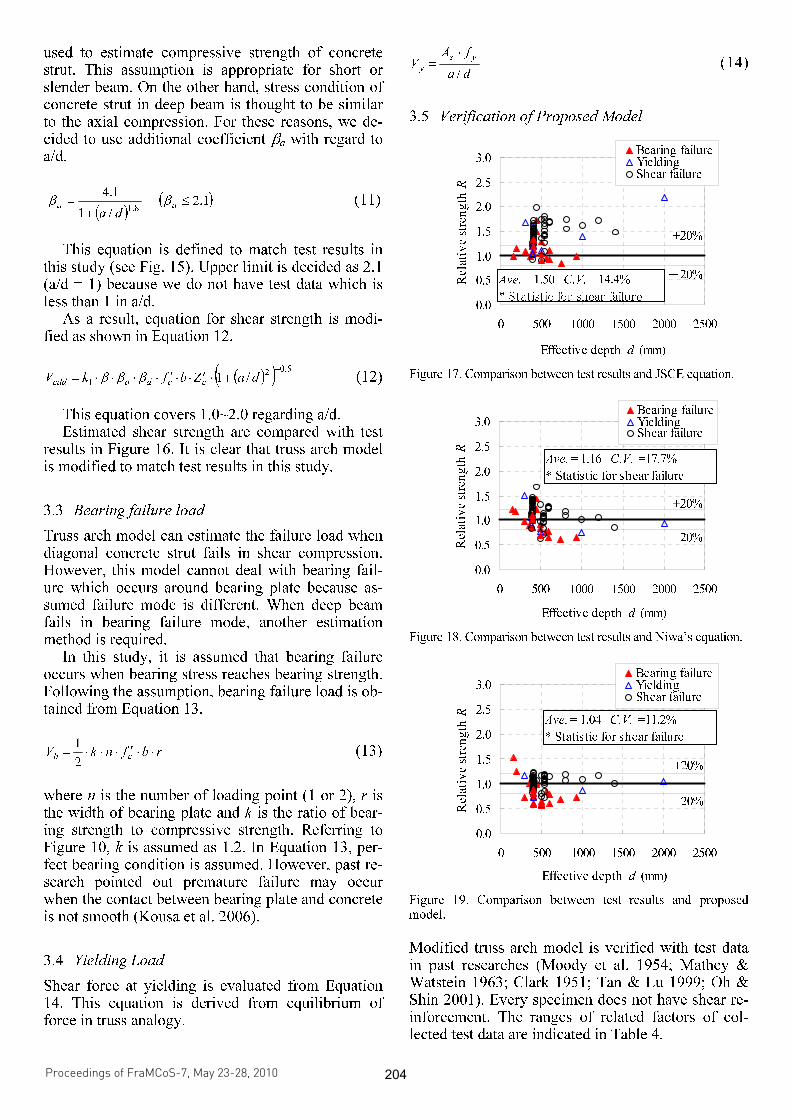
3.3 Bearing failure load
Truss arch model can estimate the failure load when diagonal concrete strut fails in shear compression. However, this model cannot deal with bearing fail-ure which occurs around bearing plate because as-sumed failure mode is different. When deep beam fails in bearing failure mode, another estimation method is required.
In this study, it is assumed that bearing failure occurs when bearing stress reaches bearing strength. Following the assumption, bearing failure load is ob-tained from Equation 13.
rbfnkVcb
⋅⋅′⋅⋅⋅=
2
1 (13)
where n is the number of loading point (1 or 2), r is the width of bearing plate and k is the ratio of bear-ing strength to compressive strength. Referring to Figure 10, k is assumed as 1.2. In Equation 13, per-fect bearing condition is assumed. However, past re-search pointed out premature failure may occur when the contact between bearing plate and concrete is not smooth (Kousa et al. 2006).
3.4 Yielding Load
Shear force at yielding is evaluated from Equation 14. This equation is derived from equilibrium of force in truss analogy.
da
fAV
ys
y/
⋅
= (14)
3.5 Verification of Proposed Model
0.0
0.5
1.0
1.5
2.0
2.5
3.0
0 500 1000 1500 2000 2500
Effective depth d (mm)
Relative strength R
Bearing failureYieldingShear failure
+20%
-20%Ave. = 1.50 C.V. =14.4%
* Statistic for shear failure
Figure 17. Comparison between test results and JSCE equation.
0.0
0.5
1.0
1.5
2.0
2.5
3.0
0 500 1000 1500 2000 2500
Effective depth d (mm)
Relative strength R
Bearing failureYieldingShear failure
+20%
-20%
Ave. = 1.16 C.V. =17.7%
* Statistic for shear failure
Figure 18. Comparison between test results and Niwa’s equation.
0.0
0.5
1.0
1.5
2.0
2.5
3.0
0 500 1000 1500 2000 2500
Effective depth d (mm)
Relative strength R
Bearing failureYieldingShear failure
+20%
-20%
Ave. = 1.04 C.V. =11.2%
* Statistic for shear failure
Figure 19. Comparison between test results and proposed model.
Modified truss arch model is verified with test data in past researches (Moody et al. 1954; Mathey & Watstein 1963; Clark 1951; Tan & Lu 1999; Oh & Shin 2001). Every specimen does not have shear re-inforcement. The ranges of related factors of col-lected test data are indicated in Table 4.
Proceedings of FraMCoS-7, May 23-28, 2010
hThD ∇−= ),(J (1)
The proportionality coefficient D(h,T) is called moisture permeability and it is a nonlinear function of the relative humidity h and temperature T (Bažant & Najjar 1972). The moisture mass balance requires that the variation in time of the water mass per unit volume of concrete (water content w) be equal to the divergence of the moisture flux J
J•∇=∂
∂−
t
w (2)
The water content w can be expressed as the sum
of the evaporable water we (capillary water, water vapor, and adsorbed water) and the non-evaporable (chemically bound) water wn (Mills 1966, Pantazopoulo & Mills 1995). It is reasonable to assume that the evaporable water is a function of relative humidity, h, degree of hydration, αc, and degree of silica fume reaction, αs, i.e. we=we(h,αc,αs) = age-dependent sorption/desorption isotherm (Norling Mjonell 1997). Under this assumption and by substituting Equation 1 into Equation 2 one obtains
nscw
s
ew
c
ew
hh
Dt
h
h
ew
&&& ++∂
∂
∂
∂
=∇•∇+∂
∂
∂
∂
− αα
αα
)(
(3)
where ∂we/∂h is the slope of the sorption/desorption isotherm (also called moisture capacity). The governing equation (Equation 3) must be completed by appropriate boundary and initial conditions.
The relation between the amount of evaporable water and relative humidity is called ‘‘adsorption isotherm” if measured with increasing relativity humidity and ‘‘desorption isotherm” in the opposite case. Neglecting their difference (Xi et al. 1994), in the following, ‘‘sorption isotherm” will be used with reference to both sorption and desorption conditions. By the way, if the hysteresis of the moisture isotherm would be taken into account, two different relation, evaporable water vs relative humidity, must be used according to the sign of the variation of the relativity humidity. The shape of the sorption isotherm for HPC is influenced by many parameters, especially those that influence extent and rate of the chemical reactions and, in turn, determine pore structure and pore size distribution (water-to-cement ratio, cement chemical composition, SF content, curing time and method, temperature, mix additives, etc.). In the literature various formulations can be found to describe the sorption isotherm of normal concrete (Xi et al. 1994). However, in the present paper the semi-empirical expression proposed by Norling Mjornell (1997) is adopted because it
explicitly accounts for the evolution of hydration reaction and SF content. This sorption isotherm reads
( ) ( )( )
( ) ( )⎥⎥
⎦
⎤
⎢⎢
⎣
⎡
⎥⎥⎥
⎦
⎤
⎢⎢⎢
⎣
⎡
−
−∞
+
−∞
−=
1110
,1
110
11,
1,,
hcc
ge
scK
hcc
ge
scG
sch
ew
αα
αα
αα
αααα
(4)
where the first term (gel isotherm) represents the physically bound (adsorbed) water and the second term (capillary isotherm) represents the capillary water. This expression is valid only for low content of SF. The coefficient G1 represents the amount of water per unit volume held in the gel pores at 100% relative humidity, and it can be expressed (Norling Mjornell 1997) as
( ) ss
s
vgkc
c
c
vgk
scG αααα +=,1
(5)
where k
cvg and k
svg are material parameters. From the
maximum amount of water per unit volume that can fill all pores (both capillary pores and gel pores), one can calculate K1 as one obtains
( )1
110
110
11
22.0188.00
,1
−⎟⎠
⎞⎜⎝
⎛−∞
⎥⎥⎥
⎦
⎤
⎢⎢⎢
⎣
⎡⎟⎠
⎞⎜⎝
⎛−∞
−−+−
=
hcc
ge
hcc
geGs
ssc
w
scK
αα
αα
αα
αα
(6)
The material parameters k
cvg and k
svg and g1 can
be calibrated by fitting experimental data relevant to free (evaporable) water content in concrete at various ages (Di Luzio & Cusatis 2009b).
2.2 Temperature evolution
Note that, at early age, since the chemical reactions associated with cement hydration and SF reaction are exothermic, the temperature field is not uniform for non-adiabatic systems even if the environmental temperature is constant. Heat conduction can be described in concrete, at least for temperature not exceeding 100°C (Bažant & Kaplan 1996), by Fourier’s law, which reads
T∇−= λq (7)
where q is the heat flux, T is the absolute temperature, and λ is the heat conductivity; in this
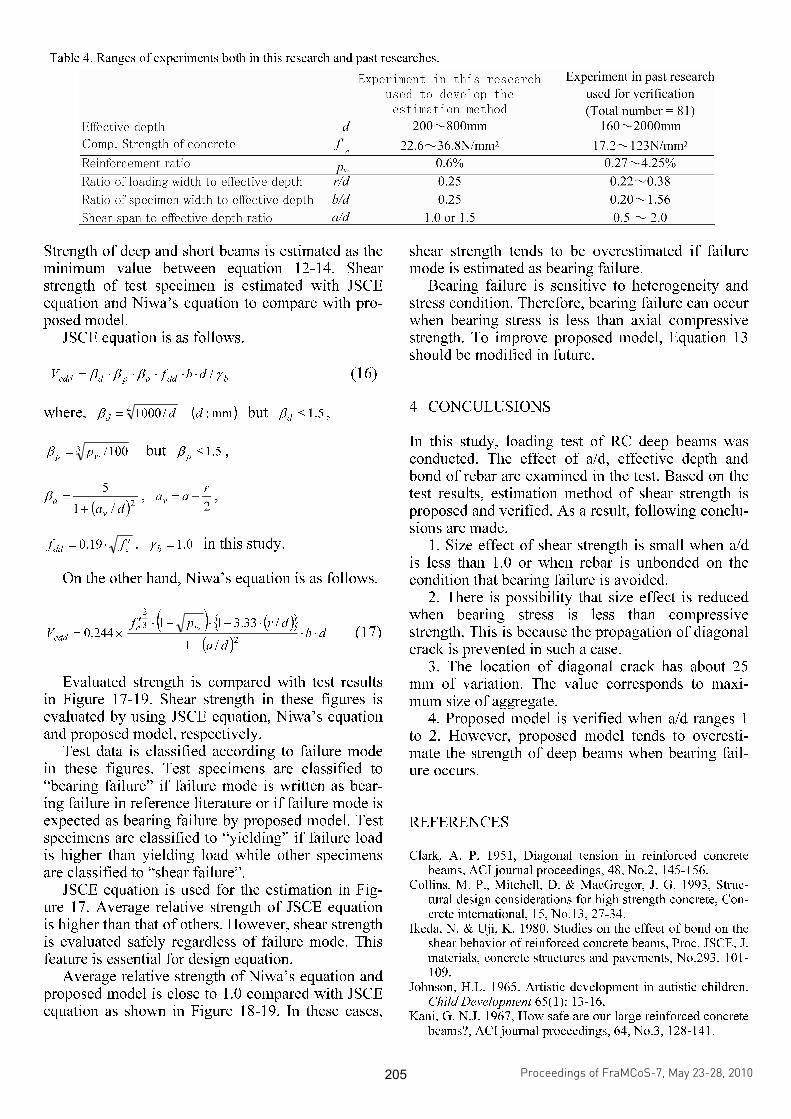
Strength of deep and short beams is estimated as the minimum value between equation 12-14. Shear strength of test specimen is estimated with JSCE equation and Niwa’s equation to compare with pro-posed model.
JSCE equation is as follows.
bddapdcdd dbfV γβββ /⋅⋅⋅⋅⋅= (16)
where, ( )mm:/1000
4ddd =β but 5.1≤dβ ,
3 100/wp
p=β but 5.1≤p
β ,
cddff ′⋅= 19.0 , 0.1=bγ in this study.
On the other hand, Niwa’s equation is as follows.
( ) ( ){ }
( )db
da
drpfV
wc
cdd⋅⋅
+
⋅+⋅+⋅′×=
2
3
2
/1
/33.311244.0 (17)
Evaluated strength is compared with test results
in Figure 17-19. Shear strength in these figures is evaluated by using JSCE equation, Niwa’s equation and proposed model, respectively.
Test data is classified according to failure mode in these figures. Test specimens are classified to “bearing failure” if failure mode is written as bear-ing failure in reference literature or if failure mode is expected as bearing failure by proposed model. Test specimens are classified to “yielding” if failure load is higher than yielding load while other specimens are classified to “shear failure”.
JSCE equation is used for the estimation in Fig-ure 17. Average relative strength of JSCE equation is higher than that of others. However, shear strength is evaluated safely regardless of failure mode. This feature is essential for design equation.
Average relative strength of Niwa’s equation and proposed model is close to 1.0 compared with JSCE equation as shown in Figure 18-19. In these cases,
shear strength tends to be overestimated if failure mode is estimated as bearing failure.
Bearing failure is sensitive to heterogeneity and stress condition. Therefore, bearing failure can occur when bearing stress is less than axial compressive strength. To improve proposed model, Equation 13 should be modified in future.
4 CONCULUSIONS
In this study, loading test of RC deep beams was conducted. The effect of a/d, effective depth and bond of rebar are examined in the test. Based on the test results, estimation method of shear strength is proposed and verified. As a result, following conclu-sions are made.
1. Size effect of shear strength is small when a/d is less than 1.0 or when rebar is unbonded on the condition that bearing failure is avoided.
2. There is possibility that size effect is reduced when bearing stress is less than compressive strength. This is because the propagation of diagonal crack is prevented in such a case.
3. The location of diagonal crack has about 25 mm of variation. The value corresponds to maxi-mum size of aggregate.
4. Proposed model is verified when a/d ranges 1 to 2. However, proposed model tends to overesti-mate the strength of deep beams when bearing fail-ure occurs.
REFERENCES
Clark, A. P. 1951, Diagonal tension in reinforced concrete beams, ACI journal proceedings, 48, No.2, 145-156.
Collins, M. P., Mitchell, D. & MacGregor, J. G. 1993, Struc-tural design considerations for high strength concrete, Con-crete international, 15, No.13, 27-34.
Ikeda, N. & Uji, K. 1980. Studies on the effect of bond on the shear behavior of reinforced concrete beams, Proc. JSCE, J. materials, concrete structures and pavements, No.293, 101-109.
Johnson, H.L. 1965. Artistic development in autistic children. Child Development 65(1): 13-16.
Kani, G. N.J. 1967, How safe are our large reinforced concrete beams?, ACI journal proceedings, 64, No.3, 128-141.
Table 4. Ranges of experiments both in this research and past researches.
Proceedings of FraMCoS-7, May 23-28, 2010
hThD ∇−= ),(J (1)
The proportionality coefficient D(h,T) is called moisture permeability and it is a nonlinear function of the relative humidity h and temperature T (Bažant & Najjar 1972). The moisture mass balance requires that the variation in time of the water mass per unit volume of concrete (water content w) be equal to the divergence of the moisture flux J
J•∇=∂
∂−
t
w (2)
The water content w can be expressed as the sum
of the evaporable water we (capillary water, water vapor, and adsorbed water) and the non-evaporable (chemically bound) water wn (Mills 1966, Pantazopoulo & Mills 1995). It is reasonable to assume that the evaporable water is a function of relative humidity, h, degree of hydration, αc, and degree of silica fume reaction, αs, i.e. we=we(h,αc,αs) = age-dependent sorption/desorption isotherm (Norling Mjonell 1997). Under this assumption and by substituting Equation 1 into Equation 2 one obtains
nscw
s
ew
c
ew
hh
Dt
h
h
ew
&&& ++∂
∂
∂
∂
=∇•∇+∂
∂
∂
∂
− αα
αα
)(
(3)
where ∂we/∂h is the slope of the sorption/desorption isotherm (also called moisture capacity). The governing equation (Equation 3) must be completed by appropriate boundary and initial conditions.
The relation between the amount of evaporable water and relative humidity is called ‘‘adsorption isotherm” if measured with increasing relativity humidity and ‘‘desorption isotherm” in the opposite case. Neglecting their difference (Xi et al. 1994), in the following, ‘‘sorption isotherm” will be used with reference to both sorption and desorption conditions. By the way, if the hysteresis of the moisture isotherm would be taken into account, two different relation, evaporable water vs relative humidity, must be used according to the sign of the variation of the relativity humidity. The shape of the sorption isotherm for HPC is influenced by many parameters, especially those that influence extent and rate of the chemical reactions and, in turn, determine pore structure and pore size distribution (water-to-cement ratio, cement chemical composition, SF content, curing time and method, temperature, mix additives, etc.). In the literature various formulations can be found to describe the sorption isotherm of normal concrete (Xi et al. 1994). However, in the present paper the semi-empirical expression proposed by Norling Mjornell (1997) is adopted because it
explicitly accounts for the evolution of hydration reaction and SF content. This sorption isotherm reads
( ) ( )( )
( ) ( )⎥⎥
⎦
⎤
⎢⎢
⎣
⎡
⎥⎥⎥
⎦
⎤
⎢⎢⎢
⎣
⎡
−
−∞
+
−∞
−=
1110
,1
110
11,
1,,
hcc
ge
scK
hcc
ge
scG
sch
ew
αα
αα
αα
αααα
(4)
where the first term (gel isotherm) represents the physically bound (adsorbed) water and the second term (capillary isotherm) represents the capillary water. This expression is valid only for low content of SF. The coefficient G1 represents the amount of water per unit volume held in the gel pores at 100% relative humidity, and it can be expressed (Norling Mjornell 1997) as
( ) ss
s
vgkc
c
c
vgk
scG αααα +=,1
(5)
where k
cvg and k
svg are material parameters. From the
maximum amount of water per unit volume that can fill all pores (both capillary pores and gel pores), one can calculate K1 as one obtains
( )1
110
110
11
22.0188.00
,1
−⎟⎠
⎞⎜⎝
⎛−∞
⎥⎥⎥
⎦
⎤
⎢⎢⎢
⎣
⎡⎟⎠
⎞⎜⎝
⎛−∞
−−+−
=
hcc
ge
hcc
geGs
ssc
w
scK
αα
αα
αα
αα
(6)
The material parameters k
cvg and k
svg and g1 can
be calibrated by fitting experimental data relevant to free (evaporable) water content in concrete at various ages (Di Luzio & Cusatis 2009b).
2.2 Temperature evolution
Note that, at early age, since the chemical reactions associated with cement hydration and SF reaction are exothermic, the temperature field is not uniform for non-adiabatic systems even if the environmental temperature is constant. Heat conduction can be described in concrete, at least for temperature not exceeding 100°C (Bažant & Kaplan 1996), by Fourier’s law, which reads
T∇−= λq (7)
where q is the heat flux, T is the absolute temperature, and λ is the heat conductivity; in this
Kobayashi, H., Unjouh, S. & Salamy, M. R. 2005, Experimen-tal study on shear capacity of large scaled deep beams, Proc. of JCI, 27, No.2, 829-834.
Kousa, K., Wakiyama, T., Nishioka, T. & Kobayashi, H. 2007, Effect of shear span ratio on the fracture of deep beams, Proc. JSCE, J. materials, concrete structures and pave-ments, 62, No.4, 798-814.
Mathey, R. G. & Watstein, D. 1963, Shear strength of beams without web reinforcement containing deformed bars of different yield strength, ACI journal proceedings, 60, No.2, 183-207.
Moody, K. G., Viest, I. M., Elstner, R. C. & Hognestad, E. 1954, Shear strength of reinforced concrete beams Part 1 – Tests of simple beams, ACI journal proceedings, 26, No.4, 317-332.
Oh, J. K. & Shin, S. W. 2001, Shear strength of reinforced high strength concrete deep beams, ACI structural journal, 98, No.2, 164-173.
Tanaka, Y., Kishi, T. & Maekawa, K. 2005, Tied arch system and evaluation method of shear strength of RC members containing artificial crack or unbonded zone, Proc. JSCE, J. materials, concrete structures and pavements, No.788, 175-193.
Tang, K. H. & Lu, H. Y. 1999, Shear behavior of large rein-forced concrete deep beams and code comparisons, ACI structural journal, 96, No.5, 836-845.
Uchibori, H., Mutsuyoshi, H., Pandey, G. R. & Tanino, R. 2004, Investigation on the shear behavior of reinforced concrete beams with bond controlled reinforcement, Proc. of JCI, 26, No.2, 1027-1032.
Umemoto, Y., Kousa, K., Kobayashi, H. & Nishioka, T. 2005, Experimental study of deep beams, parameter effect depth, Proc. of JCI, 27, No.2, 823-828.
Walraven, J. and Lehwalter, N. 1994. Size effects in short beams loaded in shear, ACI structural journal, 91, No.5, 585-593.
Yang, K. H., Chung, H. S., Lee, E. T. & Eun, H. C. 2003, Shear characteristics of high strength concrete deep beams without shear reinforcements, Engineering structures, 25, 1343-1352.
Zhang, N. & Tan, K. H. 2007. Size effect in RC deep beams: Experimental investigation and STM verification: Engi-neering structures, 29, 3241-3254.
Proceedings of FraMCoS-7, May 23-28, 2010
hThD ∇−= ),(J (1)
The proportionality coefficient D(h,T) is called moisture permeability and it is a nonlinear function of the relative humidity h and temperature T (Bažant & Najjar 1972). The moisture mass balance requires that the variation in time of the water mass per unit volume of concrete (water content w) be equal to the divergence of the moisture flux J
J•∇=∂
∂−
t
w (2)
The water content w can be expressed as the sum
of the evaporable water we (capillary water, water vapor, and adsorbed water) and the non-evaporable (chemically bound) water wn (Mills 1966, Pantazopoulo & Mills 1995). It is reasonable to assume that the evaporable water is a function of relative humidity, h, degree of hydration, αc, and degree of silica fume reaction, αs, i.e. we=we(h,αc,αs) = age-dependent sorption/desorption isotherm (Norling Mjonell 1997). Under this assumption and by substituting Equation 1 into Equation 2 one obtains
nscw
s
ew
c
ew
hh
Dt
h
h
ew
&&& ++∂
∂
∂
∂
=∇•∇+∂
∂
∂
∂
− αα
αα
)(
(3)
where ∂we/∂h is the slope of the sorption/desorption isotherm (also called moisture capacity). The governing equation (Equation 3) must be completed by appropriate boundary and initial conditions.
The relation between the amount of evaporable water and relative humidity is called ‘‘adsorption isotherm” if measured with increasing relativity humidity and ‘‘desorption isotherm” in the opposite case. Neglecting their difference (Xi et al. 1994), in the following, ‘‘sorption isotherm” will be used with reference to both sorption and desorption conditions. By the way, if the hysteresis of the moisture isotherm would be taken into account, two different relation, evaporable water vs relative humidity, must be used according to the sign of the variation of the relativity humidity. The shape of the sorption isotherm for HPC is influenced by many parameters, especially those that influence extent and rate of the chemical reactions and, in turn, determine pore structure and pore size distribution (water-to-cement ratio, cement chemical composition, SF content, curing time and method, temperature, mix additives, etc.). In the literature various formulations can be found to describe the sorption isotherm of normal concrete (Xi et al. 1994). However, in the present paper the semi-empirical expression proposed by Norling Mjornell (1997) is adopted because it
explicitly accounts for the evolution of hydration reaction and SF content. This sorption isotherm reads
( ) ( )( )
( ) ( )⎥⎥
⎦
⎤
⎢⎢
⎣
⎡
⎥⎥⎥
⎦
⎤
⎢⎢⎢
⎣
⎡
−
−∞
+
−∞
−=
1110
,1
110
11,
1,,
hcc
ge
scK
hcc
ge
scG
sch
ew
αα
αα
αα
αααα
(4)
where the first term (gel isotherm) represents the physically bound (adsorbed) water and the second term (capillary isotherm) represents the capillary water. This expression is valid only for low content of SF. The coefficient G1 represents the amount of water per unit volume held in the gel pores at 100% relative humidity, and it can be expressed (Norling Mjornell 1997) as
( ) ss
s
vgkc
c
c
vgk
scG αααα +=,1
(5)
where k
cvg and k
svg are material parameters. From the
maximum amount of water per unit volume that can fill all pores (both capillary pores and gel pores), one can calculate K1 as one obtains
( )1
110
110
11
22.0188.00
,1
−⎟⎠
⎞⎜⎝
⎛−∞
⎥⎥⎥
⎦
⎤
⎢⎢⎢
⎣
⎡⎟⎠
⎞⎜⎝
⎛−∞
−−+−
=
hcc
ge
hcc
geGs
ssc
w
scK
αα
αα
αα
αα
(6)
The material parameters k
cvg and k
svg and g1 can
be calibrated by fitting experimental data relevant to free (evaporable) water content in concrete at various ages (Di Luzio & Cusatis 2009b).
2.2 Temperature evolution
Note that, at early age, since the chemical reactions associated with cement hydration and SF reaction are exothermic, the temperature field is not uniform for non-adiabatic systems even if the environmental temperature is constant. Heat conduction can be described in concrete, at least for temperature not exceeding 100°C (Bažant & Kaplan 1996), by Fourier’s law, which reads
T∇−= λq (7)
where q is the heat flux, T is the absolute temperature, and λ is the heat conductivity; in this