ROIC FOR NONFINANCIAL COMPANIES Source: Compustat, McKinsey & Company’s corporate performance...
13
ROIC FOR NONFINANCIAL COMPANIES Source: Compustat, McKinsey & Company’s corporate performance database Percent Years Annual ROIC without goodwill Years Annual ROIC with goodwill Average 15.3 9.0 5.0 13.6 8.3 4.7
-
Upload
melvyn-singleton -
Category
Documents
-
view
253 -
download
0
Transcript of ROIC FOR NONFINANCIAL COMPANIES Source: Compustat, McKinsey & Company’s corporate performance...

ROIC FOR NONFINANCIAL COMPANIES
Source: Compustat, McKinsey & Company’s corporate performance database
Percent
Years
Annual ROIC without goodwill
Years
Annual ROIC with goodwill
Average
15.3
9.0
5.0
13.6
8.3
4.7

ROIC DISTRIBUTION FOR NONFINANCIAL COMPANIES
Source: Compustat, McKinsey & Company’s corporate performance database
0
2
4
6
8
10
12
14
16
18
Percent of observations below ROIC level
<-10.0 -5.0 0.0 2.5 5.0 7.5 10.0 12.5 15.0 17.5 20.0 25.0 30.0 35.0 40.0 >40.022.5
5 7 11 15 25 42 56 66 74 80 87 89 92 94 95 10084
Annual ROIC without goodwill, 1963-2003
Approximately 50% of the samplewithin ROIC range of 5-15%
ROIC
84% of the sample had ROIC below 20%
Pe
rce
nt
of
sa
mp
le

ROIC BY INDUSTRY GROUP*
*Based on S&P Global industry classification standard, excluding financial companies**Average of annual mediansSource:Compustat; McKinsey & Company’s corporate performance database
11.3
11.0
10.3
10.3
9.9
9.9
9.6
9.5
9.0
9.0
8.4
7.7
6.9
6.5
6.2
11.9
12.8
14.7
15.0
15.2
18.4
14.8
11.9
9.2
10.3
10.5
11.8
9.6
10.8
9.5
9.5
7.9
7.6
7.6
5.7
6.1
12.4
13.2
14.3
18.1
18.8
21.8
Percent
1994-20031963-2003
Annual ROIC without goodwill**
Pharmaceuticals and biotechnology
Household and personal products
Software and services
Media
Commercial services and supplies
Semiconductors and semiconductor equipment
Health care equipment and services
Food, beverage, and tobacco
Hotels, restaurants, and leisure
Technology hardware, and equipment
Automobiles and components
Capital goods
Food and staples retailing
Consumer durables and apparel
Retailing
Total sample
Materials
Energy
Transportation
Telecommunication services
Utilities

ROIC SEGMENTED BY SIZE AND GROWTH
Source: Compustat, McKinsey & Company’s corporate performance database
5.2 6.0 6.53.3 7.0
8.0 7.7 8.0 8.1 9.1
8.9 9.3 9.6 9.5 10.3
10.8 10.9 11.2 10.9 11.8
11.9 11.1 11.7 11.5 11.9
11.9 11.8 11.812.4 11.6
<0%
0-5%
5-10%
10-15%
15-20%
>20%
3-ye
ar r
eal g
row
th r
ate
<200 M200-500 M
500-1,000 M
1,000-2,500 M >2,500 M
RO
IC in
creases with
h
igh
er gro
wth
rate
No clear relation between size and performance
Revenues
Annual ROIC without goodwill, 1963-2003Percent
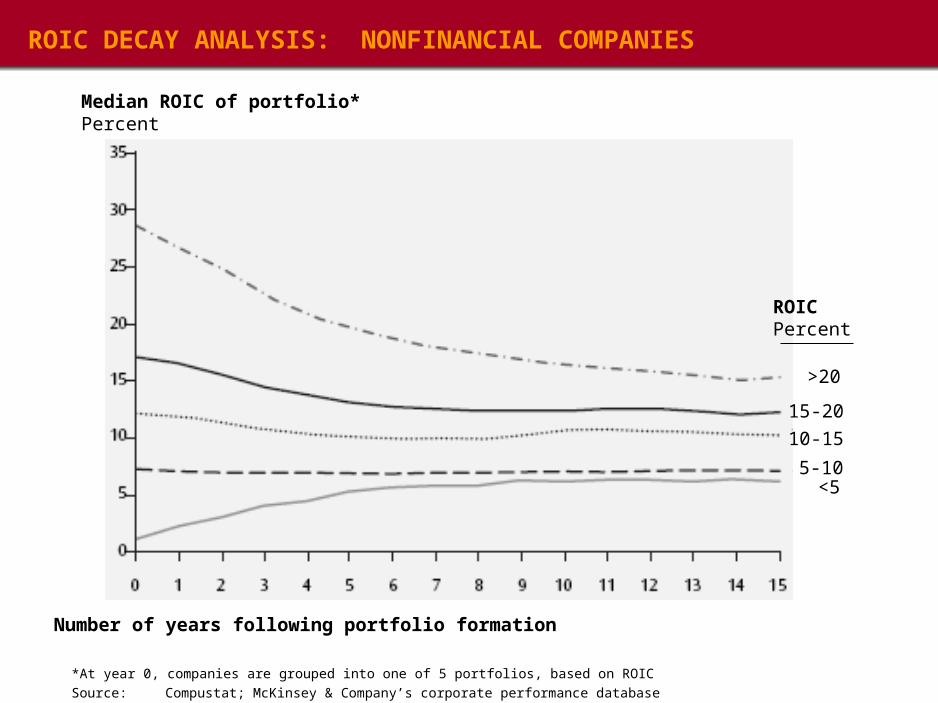
ROIC DECAY ANALYSIS: NONFINANCIAL COMPANIES
*At year 0, companies are grouped into one of 5 portfolios, based on ROIC
Source:Compustat; McKinsey & Company’s corporate performance database
Median ROIC of portfolio*Percent
Number of years following portfolio formation
ROIC Percent
>20
15-20
10-15
5-10<5

ROIC DECAY ANALYSIS: CONSUMER STAPLES
*At year 0, companies are grouped into one of 5 portfolios, based on ROIC
Source:Compustat; McKinsey & Company’s corporate performance database
>20
15-2010-15
5-10
<5
Median ROIC of portfolio*Percent
Number of years following portfolio formation
ROIC Percent
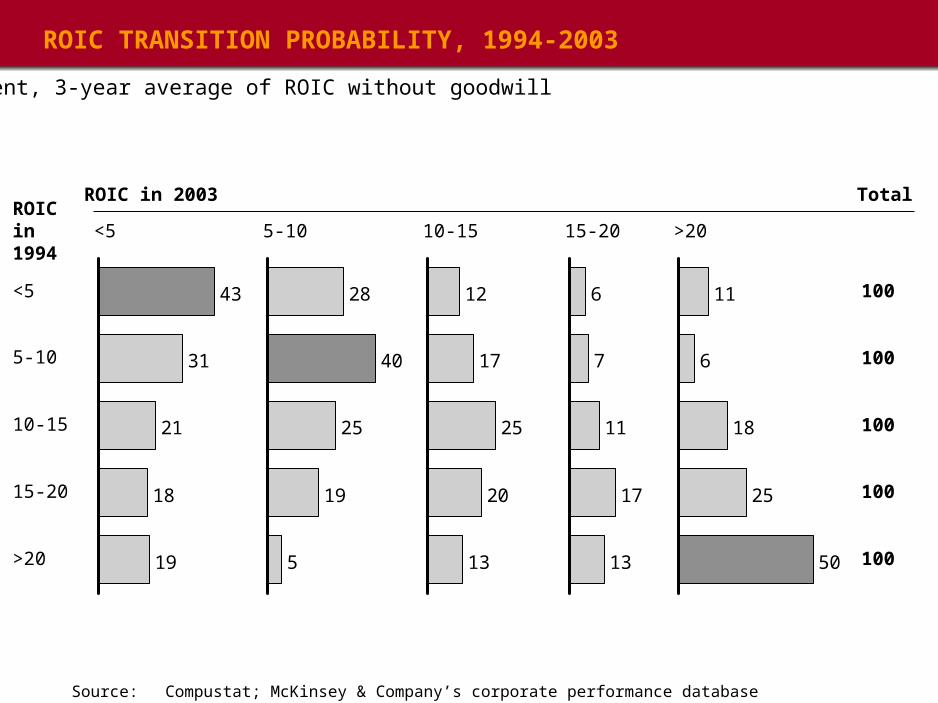
ROIC TRANSITION PROBABILITY, 1994-2003
Source: Compustat; McKinsey & Company’s corporate performance database
Percent, 3-year average of ROIC without goodwill
ROIC in 1994
ROIC in 2003
43
31
21
18
19
<5
5-10
10-15
15-20
>20
<5
5
19
25
40
28
5-10
12
17
25
20
13
10-15
6
7
11
17
13
15-20
11
6
18
25
50
>20
Total
100
100
100
100
100
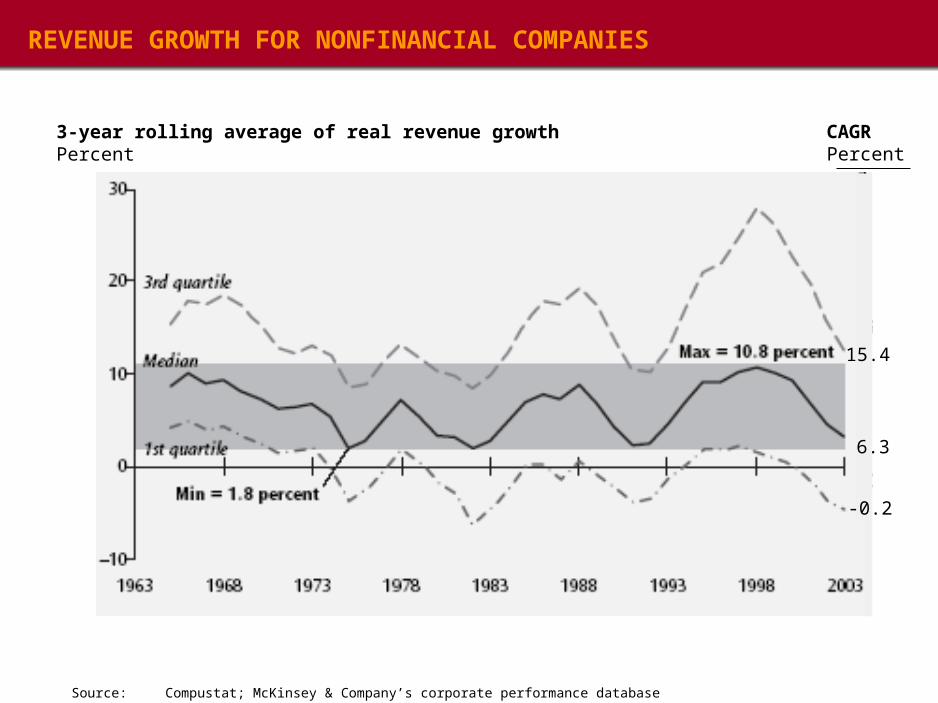
REVENUE GROWTH FOR NONFINANCIAL COMPANIES
Source:Compustat; McKinsey & Company’s corporate performance database
3-year rolling average of real revenue growthPercent
CAGRPercent
15.4
6.3
-0.2
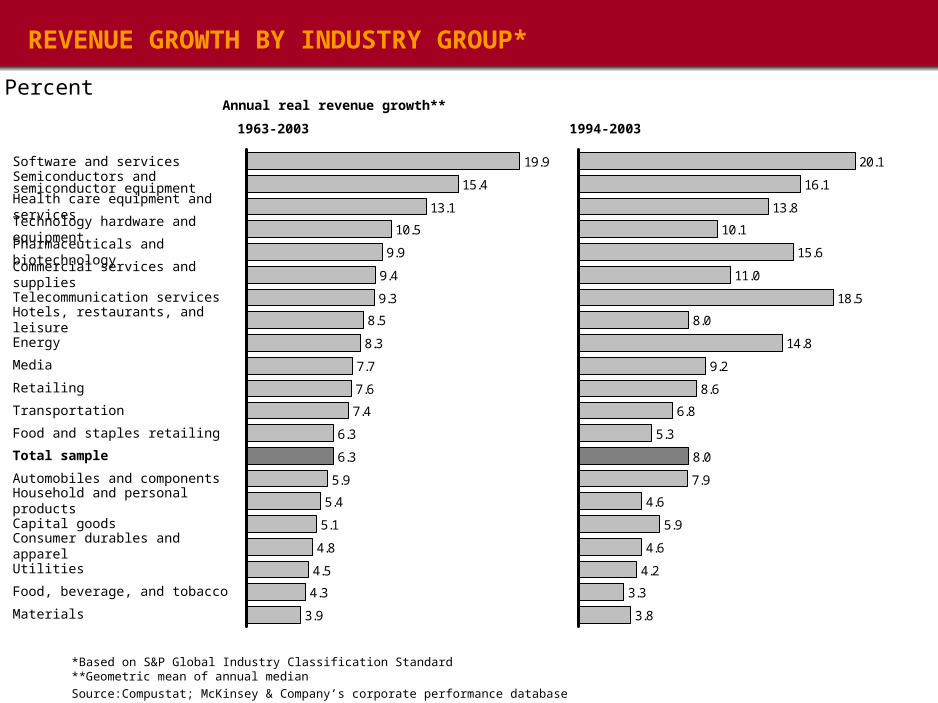
REVENUE GROWTH BY INDUSTRY GROUP*
*Based on S&P Global Industry Classification Standard**Geometric mean of annual median
Source:Compustat; McKinsey & Company’s corporate performance database
Percent
1963-2003
9.3
8.5
8.3
7.7
7.6
7.4
6.3
6.3
5.9
5.4
5.1
4.8
4.5
4.3
3.9
9.4
9.9
10.5
13.1
15.4
19.9
Annual real revenue growth**
Software and servicesSemiconductors and semiconductor equipmentHealth care equipment and services
Technology hardware and equipment
Pharmaceuticals and biotechnology
Commercial services and supplies
Telecommunication services
Hotels, restaurants, and leisure
Energy
Media
Retailing
Transportation
Food and staples retailing
Total sample
Automobiles and components
Household and personal products
Capital goods
Consumer durables and apparel
Utilities
Food, beverage, and tobacco
Materials
1994-2003
18.5
8.0
14.8
9.2
8.6
6.8
5.3
8.0
7.9
4.6
5.9
4.6
4.2
3.3
3.8
11.0
15.6
10.1
13.8
16.1
20.1

AGGREGATE EPS FORECASTS FOR S&P 500 CONSTITUENTS
Source: IBES; McKinsey analysis
EPS (US cents)

REVENUE GROWTH DECAY ANALYSIS
*At year 0, companies are grouped into one of 5 portfolios, based on ROIC
Source:Compustat; McKinsey & Company’s corporate performance database
Revenue growthPercent
>20
15-20
10-155-10<5
Median growth of portfolio*Percent
Number of years following portfolio formation

15.0
9.5 9.0
13.5
20.0
28.6
2.0 1.4
-0.7 -0.7
0.7 1.2 0.12.1 2.8
5.1 4.5
-1.6
-0.1
-3.9
REVENUE GROWTH RATE FALLS DRAMATICALLY FOR COMPANIES REACHING FORTUNE 50
Source: Corporate Executive Board, “Stall Points: Barriers to Growth for the Large Corporate Enterprise”, 1998
Average annual real revenue growth ratePercent
-5 -4 -3 -2 -1 0 1 2 3 4 5 6 7 8 9 10 11 12 13 14 15
Before entrance to Fortune 50
After entrance to Fortune 50
Years from entrance into Fortune 50

REVENUE GROWTH TRANSITION PROBABILITY 1994-2003
Source: Compustat; McKinsey & Company’s corporate performance database
Revenue growth in 1994
Revenue growth in 2003
56
59
61
64
67<5
5-10
10-15
15-20
>20
<5
13
11
15
16
15
10
14
11
12
8
8
5
4
3
3
13
11
9
5
7 100
100
100
100
100
5-10 10-15 15-20 >20 Total
Three-year rolling average of real revenue growth ratePercent