RockyMntn AEM Feb09.ppt
16
3/12/2009 1 Permeable Friction Course (PFC) Mixtures are Different! 36 th Rocky Mountain Asphalt Conference and Equipment Show 1 st Annual Flexible Pavement Research Symposium Amy Epps Martin, Allex E. Alvarez February 18, 2009 TxDOT OUTLINE 1. Introduction 2 Current Research 2. Current Research 3. Experimental Design and Results 4. Summary and Recommendations - Future Work TxDOT
Transcript of RockyMntn AEM Feb09.ppt

3/12/2009
1
Permeable Friction Course (PFC) Mixtures are Different!
36th Rocky Mountain Asphalt Conference and y pEquipment Show
1st Annual Flexible Pavement Research Symposium
Amy Epps Martin, Allex E. Alvarezy pp ,
February 18, 2009
TxDOT
OUTLINE
1. Introduction 2 Current Research2. Current Research 3. Experimental Design and Results4. Summary and Recommendations - Future
Work
TxDOT
3/12/2009
2
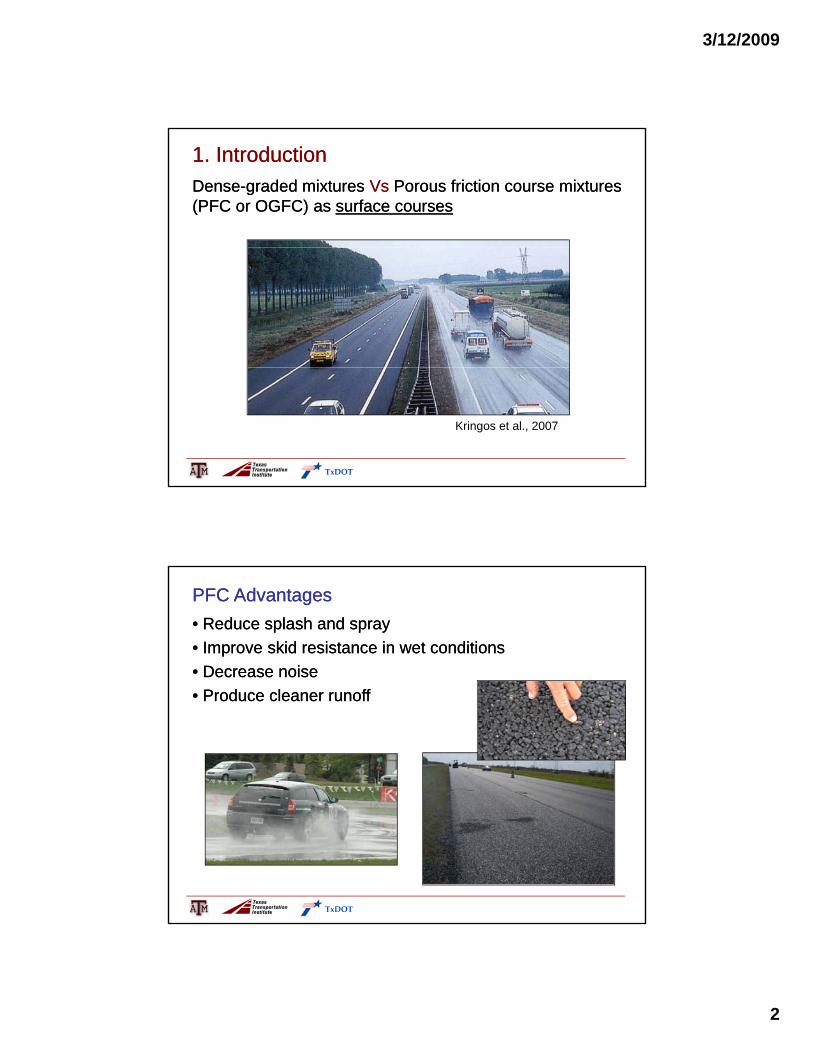
1. Introduction1. IntroductionDenseDense--graded mixtures graded mixtures VsVs Porous friction course mixtures Porous friction course mixtures (PFC or OGFC) as (PFC or OGFC) as surface coursessurface courses
Kringos et al., 2007
TxDOT
PFC AdvantagesPFC Advantages•• Reduce splash and sprayReduce splash and spray•• Improve skid resistance in wet conditionsImprove skid resistance in wet conditions•• Decrease noiseDecrease noise•• Produce cleaner runoffProduce cleaner runoff
TxDOT

3/12/2009
3
2. Current Research2. Current Research
Improve TxDOT Improve TxDOT PFC mix design procedure and PFC mix design procedure and recommend construction practices recommend construction practices based on: based on:
VolumetricsDurabilityDrainabilityDensification Effects
TxDOT
3. Experimental Design and Test Results3. Experimental Design and Test ResultsSelected MixturesSelected Mixtures
Mixture Asphalt Type OAC (%) Aggregate Other
MaterialsI-35
PG 76-22
6.1 Sandstone, Limestone
Lime (1%), Fibers (0.3%)
US-59Y 5.8 Limestone
IH-30 6.6 Sandstone
US-83 6.4 Limestone
IH-20 6.5 Limestone
US 59 5 9 Granite LimestoneUS-59 5.9 Granite, Limestone
US-281Asphalt Rubber
8.1 Sandstone, Limestone
NoneUS-290 8.3 Sandstone
US-288 8.0 Granite, Limestone
TxDOT

3/12/2009
4
3.1 3.1 VolumetricsVolumetrics
(%)100*1 ⎟⎟⎠
⎞⎜⎜⎝
⎛−=
mm
mb
GGContentAVTotal
a. Total AV Content
Gmm: theoretical max. specific gravity of the mixtureGmb: bulk specific gravity of the compacted PFC mixture
⎠⎝ mm
Current practice:Current practice:pp• Total AV content (or corresponding density)• Vacuum method or dimensional analysis for Gmb
• Measured Gmm
Theoretical Max. Specific Gravity, Theoretical Max. Specific Gravity, GGmmmm
mixWGMeasured =
Method 1-measured Gmm
mixture at the design asphalt range (6 to 10%)
mixwmixpycwpycmm WWW
GMeasured+− + ,,
Method 2 calculated G
ormixture at low binder content (3.5 to 4.5%)
Method 2-calculated Gmm
b
b
mm
bse
GP
G
PG
−
−=
100100
b
b
se
bmm
GP
GP
GCalculated+
−=
100100

3/12/2009
5
tVW
DG
Method 2-dimensional
WVacuumG b =
Bulk Specific Gravity, Bulk Specific Gravity, GGmbmb
Method 1-vacuum
w
tmb
VDimGρ
=CFWWWW
VacuumGb
wbsb
mb
−−+ ,
Vt=π*r2*h
GGmmmm Comparison and Variability, AR Mixtures Comparison and Variability, AR Mixtures
2.372.412.452.49
cal M
axim
umfic
Gra
vity
Shift due to asphalt loss
2 372.412.452.49
l Max
imum
c
Gra
vity
0.02
0.03
Dev
iatio
n
Results and DiscussionResults and Discussion
Calculated Gmm: less variability and less asphalt-loss error
2.252.292.332.37
3.0 4.0 5.0 6.0 7.0 8.0 9.0 10.0
Asphalt Content (%)
Theo
retic
Spec
if
Average Meas. Gmm Calculated GmmGmm-Ignition Sample Gmm Compacted Sample
2.252.292.332.37
3.0 4.0 5.0 6.0 7.0 8.0 9.0 10.0
Asphalt Content (%)
Theo
retic
aSp
ecifi
c
Calculated Gmm Measured GmmStandard deviation
0.00
0.01
Stan
dard
GGmbmb Dim:Dim:Simpler, faster, less expensive, cleaner, required equipment is readily available, and data can be directly used to analyze X-ray CT images

3/12/2009
6
b. Connected AV ContentWaterWater--Accessible AV ContentAccessible AV Content
Method 1-vacuum method
(%)100*)(_
,
,
⎟⎠⎞
⎜⎝⎛−−+
−−⎟⎠⎞
⎜⎝⎛−+
=
CFWWWW
WWCFWWWW
AVWAb
wbsb
SVb
wbsb
Method 2-dimensional analysis
(%)100
)(
dim ×
−−
=td
w
std
ensional V
WWVWAAV ρ
Method 2 dimensional analysis
Interconnected AV Content Interconnected AV Content -- XX--ray Computed ray Computed Tomography and Image AnalysisTomography and Image Analysis
Object
SourceDetector
3D d
Grayscale image B&W image
3D render
TxDOT
3/12/2009
7
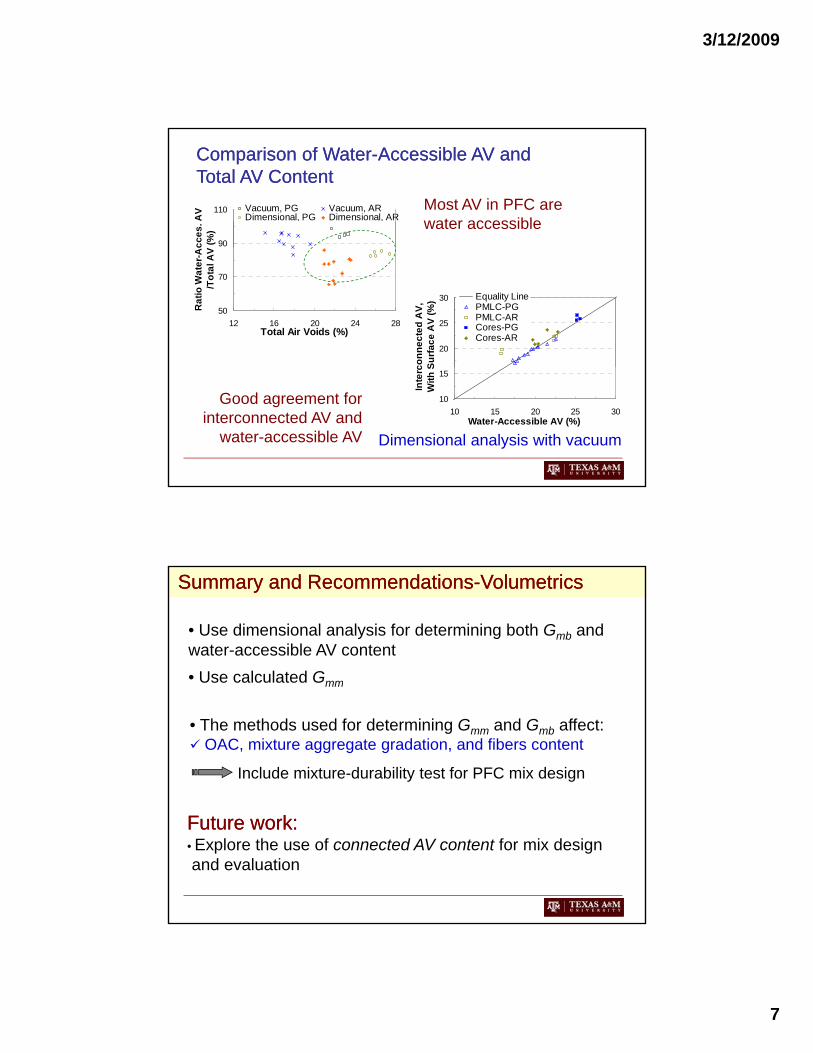
Comparison of WaterComparison of Water--Accessible AV and Accessible AV and Total AV Content Total AV Content
90
110cc
es. A
V (%
)Vacuum, PG Vacuum, ARDimensional, PG Dimensional, AR
Most AV in PFC are water accessible
50
70
12 16 20 24 28Total Air Voids (%)
Rat
io W
ater
-Ac
/Tot
al A
V
20
25
30
conn
ecte
d A
V,
Surfa
ce A
V (%
) Equality LinePMLC-PGPMLC-ARCores-PGCores-AR
10
15
10 15 20 25 30Water-Accessible AV (%)
Inte
rcW
ith S
Dimensional analysis with vacuum
Good agreement for interconnected AV and
water-accessible AV
Summary and RecommendationsSummary and Recommendations--VolumetricsVolumetrics
• Use dimensional analysis for determining both Gmb and water-accessible AV content• Use calculated Gmmmm
• The methods used for determining Gmm and Gmb affect: OAC, mixture aggregate gradation, and fibers content
Include mixture-durability test for PFC mix design
Future work:Future work:• Explore the use of connected AV content for mix designand evaluation

3/12/2009
8
3.2 Durability3.2 Durability
Hamburg WheelHamburg Wheel Tracking Test (Hamburg)Tracking Test (Hamburg)
Current practice:Current practice:• No durability test applied
2 4’’4
8
12
16
Rut
(mm
)
Hamburg WheelHamburg Wheel--Tracking Test (Hamburg)Tracking Test (Hamburg)
2.4’’0
0 5000 10000 15000Number of Cycles
Wet ConditioningWet Conditioning
TTI Overlay Test (Overlay)TTI Overlay Test (Overlay)
Zhou et al., 2003Zhou et al., 2003
0
100
200
300
400
500
Load
(lb) Cracking life
No Conditioning (dry)No Conditioning (dry)
-300
-200
-100
0 50 100 150 200
Number of Cycles

3/12/2009
9
CantabroCantabro Loss Test (Loss Test (CantabroCantabro))
300 rev. Before (W0) After (Wf)
100*W-W(%)LC t b fo
4.5’’
100*(%)LossCantabro fo
oW=
No Conditioning (dry)No Conditioning (dry)
Test Specimen Preparation
Air Voids Variability
(COV)
Availability of Equipment (in
Texas)
Testing Time
(hours)
Results Variability
(COV)
Comparison of Comparison of Mixture Evaluation TestsMixture Evaluation TestsResults and DiscussionResults and Discussion
Hamburg Saw trimming 0.030 Medium 5 0.02 to 0.57
Overlay
Saw cutting, drying, final AV checking, and
gluing
0.030 Low 2 0.22 to 1.17
Cantabro Not required 0.016 High 0.3 0.07 to 0.36q g
Additional Additional CantabroCantabro Testing: Testing: wet (24 hrs @ 60°C + drying), cold (3°C), & aged (3 & 6 months @ 60°C)

3/12/2009
10
CantabroCantabro Results Results -- Effect of ConditioningEffect of Conditioning
40(%)
Dry WetLow Temp. 3 Months Aged6 Months Aged
0
20
5.5 5.7 5.9 6.1 6.3 6.5 6.7
Can
tabr
o Lo
ss (
PG 76-22 mixtures
Asphalt Content (%)
Summary and RecommendationsSummary and Recommendations--DurabilityDurability
• Cantabro Loss test recommended• Cantabro test results suggest:
Mixture resistance to disintegration is affected more by aggregate than binder propertiesaggregate than binder properties
The test can be used as a screening tool for PFC mix design, but it may not provide enough sensitivity for selecting the OAC
Cantabro Loss values showed a direct relationship with water-accessible AV content
Future work:Future work:• Evaluate relationships between field and lab. responses• Use analytical performance models to improve PFC mix design

3/12/2009
11
3.3 Drainability3.3 Drainability
Current practice Current practice -- design (SGC specimens):design (SGC specimens):• Ensure total AV content (min. 18%)
• Measure lab permeability (min. 100 m/day)
Current practice Current practice -- fieldfield
• Measure field drainability: water flow value (max. 20 secs)
TxDOT
Field drainabilityField drainabilityLab drainabilityLab drainability
Laboratory and Field Measurement of DrainabilityLaboratory and Field Measurement of Drainability
Water flow value(outflow time)
TxDOT
Coefficient of permeability (k)

3/12/2009
12
Evaluation of Current PracticeEvaluation of Current Practice200
m/d
ay)
SGC - PGCores - PGNCAT Minimum
Results and DiscussionResults and Discussion
0
100
16 20 24 28 32 36Total Air Voids (%)
Perm
eabi
lty (m
Best fit lines
Watson et al.' relationship
TxDOT
Lack of correlation can be related to differences in: (i) Total AV content,(ii) Specimen thickness, and(iii) Internal structure of the mixture
Alternatives EvaluatedAlternatives Evaluated(i) Relationship of water-accessible AV content and
lab-measured permeability,(ii) Relationship of lab and field drainability, and(iii) A l ti l di ti f bilit (E t d l f(iii) Analytical prediction of permeability (Expected value of
permeability using modified Kozeny-Carman Eq.)
(ii) Relationship of lab (ii) Relationship of lab and field drainabilityand field drainability
R2 = 0.82, PG
R2 = 0.75, AR
100
1000
rmea
bilit
y /d
ay)
PG MixturesAR Mixtures
TxDOT
101 10 100 1000
Water Flow Value (s)
Cor
e Pe
r(m
/
NCAT Minimum

3/12/2009
13
200
d C
alcu
late
d
bilit
y (m
/day
) Expected Value of Perme.Calculated Perme.Equality line
200C
alcu
late
d
ty (
m/d
ay) Expected Value of Perme.
Calculated Perme.Equality Line
(iii) Expected Value of Permeability (iii) Expected Value of Permeability ((EE[[kk]) ]) and Calculatedand CalculatedPermeability Permeability (Modified (Modified KozenyKozeny--Carman Equation) Carman Equation)
Road cores
0
100
0 100 200
E[k]
and
Perm
eab
Measured Permeability (m/day)
0
100
0 100 200
E[k]
and
CPe
rmea
bili
Measured Permeability (m/day)
cores
Parameters for E[k]:
SGC specimens
TxDOT
• Average and variance of both aggregate-particle size (gradation) and total AV content (X-ray CT)
• Covariance of aggregate-particle size and total AV content• Empirical calibration coefficient• Aggregate, asphalt and fluid (water) parameters
Summary and RecommendationsSummary and Recommendations--DrainabilityDrainability
• Current practices led to poor drainability evaluation of field-compacted mixtures• Water-accessible AV content may be used as a surrogate of the total AV content to indirectly assesssurrogate of the total AV content to indirectly assess permeability• Use the Expected value (E[k]) as an estimator of permeability. Alternatively, the WFV can be used to asses field drainability
TxDOT
Future WorkFuture Work• Further assess permeability of field-compacted mixtures using laboratory-compacted mixtures

3/12/2009
14
Current CCurrent Construction Controlonstruction ControlAsphalt content, gradation Asphalt content, gradation Visual inspection: density, material variability, segregationVisual inspection: density, material variability, segregation
3.4 Densification Effects3.4 Densification Effects
Minimum smoothnessMinimum smoothness
•• No field density requirements for PFCNo field density requirements for PFC
Assess effects of densification on PFC based on:Assess effects of densification on PFC based on:
ObjectiveObjectiveAssess effects of densification on PFC based on:Assess effects of densification on PFC based on:
Internal structure (air voids [AV] characteristics)Internal structure (air voids [AV] characteristics)Macroscopic response (durability and functionality)Macroscopic response (durability and functionality)
FOR TWO COMPACTION LEVELSFOR TWO COMPACTION LEVELS
TxDOT
Comparison of Total AV ContentComparison of Total AV Content
26
30
34
Void
s (%
)
Road Cores PMLC Specimens
AV Design Range
Results and DiscussionResults and Discussion
Field AV content reproduced at 15 gyrations of the SGC
Field Vs Lab (SGC) air voids content
14
18
22
26
I-35-PG
US-59Y-PG
IH-30-PG
US-83-PG
US-281-AR
US-290-AR
US-288-AR
Tota
l Air
V
010 20 30 40
Air Voids Content (%)
m)
Ongoing Research! Ongoing Research!
voids content
TxDOT
Distribution of AV contentUS-59Y mixture
25
50
75
100
Posi
tion
(mm
Core, Total AV15G Total AV50G Total AV50G Interc. AV

3/12/2009
15
2
3
4
5
6
ge in
Hei
ght (
mm
)US-59Y-PG-50GUS-59Y-PG-15GUS-290-AR-50GUS-290-AR-15G
Compaction Curve and StoneCompaction Curve and Stone--onon--Stone ContactStone Contact
Stone-on-Stone Contact
0
1
0 10 20 30 40 50Number of Gyrations, N
Cha
ng
40
45
d -D
RC
(%) VCA-Mix 12G VCA-Mix 15G
VCA-Mix 50G
DRCmix VCAVCA <
Ongoing Research!Ongoing Research!
TxDOT
US-59Y-PG mixture30
35
0 5 10 15Replicate Specimen
VCA
-Mix
and
VCA-DRC
Ongoing Research! Ongoing Research!
Effect of Densification on DurabilityEffect of Densification on Durability
30
40
50
o Lo
ss (%
) 50 Gyrations15 Gyrations
50
75
100
Life
(Cyc
les)
Cantabro test Overlay test
0
10
20
Dry Wet LowTemper.
Aged 3Months
Aged 6Months
Can
tabr
o
0
25
0 10 20 30 40 50 60Number of Gyrations
Cra
ckin
g
Replicate ResultAverage
Mi t SGC Total AV Cycles to Failure Rut Depth @ 20000 Hamburg-Wheel Tracking test
TxDOT
Mixture Gyrations Contenty@ 12.5 mm
p @Cycles (mm)
12 22 - 11.4112 22.3 - 8.9650 17.6 - 4.8250 16.2 - 5.43
US-59Y-PG
3/12/2009
16
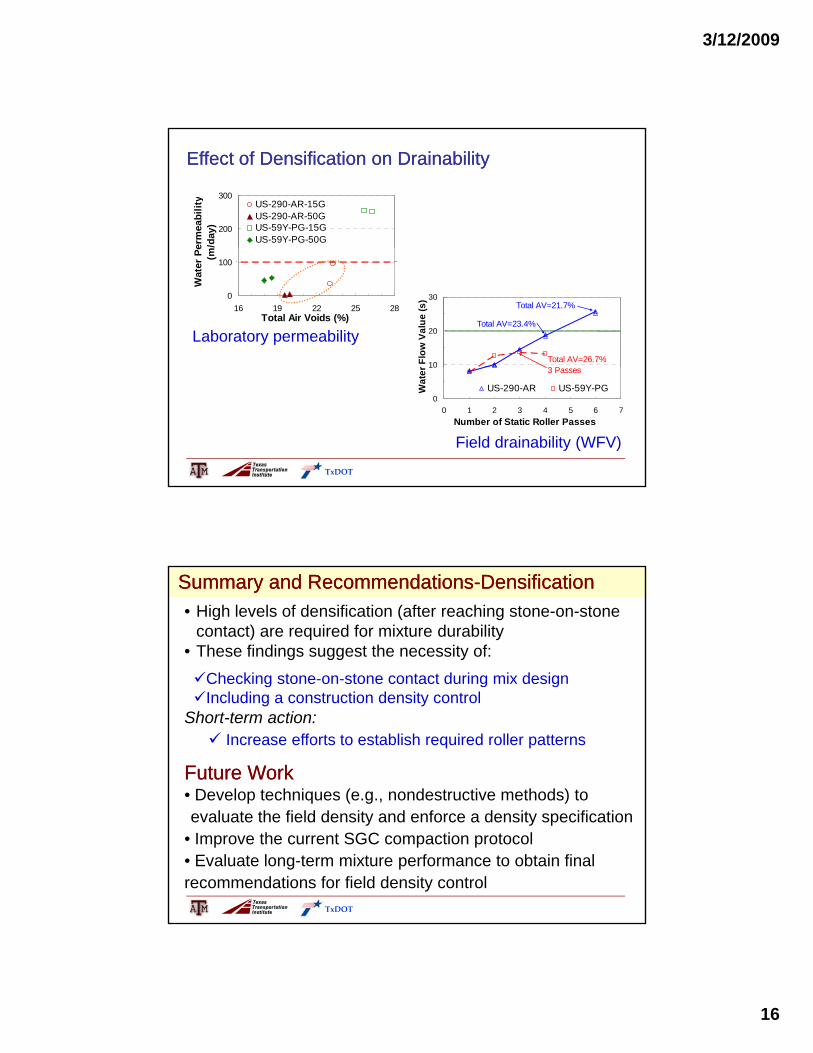
Effect of Densification on DrainabilityEffect of Densification on Drainability
200
300er
mea
bilit
y/d
ay)
US-290-AR-15GUS-290-AR-50GUS-59Y-PG-15GUS-59Y-PG-50G
Laboratory permeability
0
100
16 19 22 25 28Total Air Voids (%)
Wat
er P
e(m
/
10
20
30
r Flo
w V
alue
(s) Total AV=21.7%
Total AV=26.7%3 P
Total AV=23.4%
Field drainability (WFV)
0
10
0 1 2 3 4 5 6 7Number of Static Roller Passes
Wat
er
US-290-AR US-59Y-PG
3 Passes
TxDOT
• High levels of densification (after reaching stone-on-stone contact) are required for mixture durability
• These findings suggest the necessity of:Checking stone-on-stone contact during mix design
Summary and RecommendationsSummary and Recommendations--DensificationDensification
g g gIncluding a construction density control
Short-term action:Increase efforts to establish required roller patterns
Future WorkFuture Work• Develop techniques (e.g., nondestructive methods) to
TxDOT
evaluate the field density and enforce a density specification• Improve the current SGC compaction protocol• Evaluate long-term mixture performance to obtain final recommendations for field density control