RockSee: Video image measurements of physical features to aid in highway rock cut characterization
8
Computers & Geosciences 33 (2007) 437–444 Short Note RockSee: Video image measurements of physical features to aid in highway rock cut characterization Ahmed Youssef a , Norbert H. Maerz b, , Qinfang Xiang b a Geological Engineering, South Valley University, Geology Department, Sohag 82514, Egypt b University of Missouri-Rolla, 1006 Kings-highway, Rolla, MO 65409-0660, USA Received 9 November 2005; received in revised form 25 July 2006; accepted 14 August 2006 Abstract Maintaining highway rock cuts for the safety of the motoring public from the risk and consequence of falling rock is an enormous task for State Departments of Transportation. The amount of work to even evaluate and prioritize the remediation effort is prohibitive. To facilitate the prioritization of remediation efforts, a new rock fall hazard rating system has been developed for Missouri highways. To make the process much more efficient, video logs are used screen the rock cuts, parameters used in the system are measured on video images, and data is automatically transferred to a GIS system. r 2006 Published by Elsevier Ltd. Keywords: Rock hazard rating; Rock mass classification; Highway video logs; Computer-scaled measurements 1. Introduction It is incumbent on highway departments of transportation (DOTs) to maintain highway rock cuts for the safety of the motoring public and to reduce the risk and consequence of falling rock on lives and property. This is an enormous task, as highways cover vast areas through differing geolo- gical terrains. It is clearly unrealistic to remediate all rock cuts, so efforts have to be prioritized. Many jurisdictions now use a rock mass classifi- cation system to streamline the process of scoring each major rock cut (Maerz, 2000). The road cuts with the worst scores in the classification can be quickly evaluated further and prioritized for reme- diation. A new risk/consequence classification system called Missouri rock fall hazard rating system (MORFH RS) has been developed for Missouri highways (Youssef et al., 2003; Maerz et al., 2005). A summary of MORFH RS is given in Appendix A. Efficiencies are introduced into the system by 1. using digital highway video logs, imaged at highway speeds for prescreening, 2. making measurements of key classification para- meters on the video images using the RockSee program, and 3. facilitating data entry of rating data, storing, printing, and transferring reports to a GIS system, via a personal computing device (pcd) attached to a GPS unit. ARTICLE IN PRESS www.elsevier.com/locate/cageo 0098-3004/$ - see front matter r 2006 Published by Elsevier Ltd. doi:10.1016/j.cageo.2006.08.005 Corresponding author. Tel.: +1 573 341 6714; fax: +1 573 341 4368. E-mail addresses: [email protected] (A. Youssef), [email protected] (N.H. Maerz), [email protected] (Q. Xiang).
-
Upload
ahmed-youssef -
Category
Documents
-
view
216 -
download
1
Transcript of RockSee: Video image measurements of physical features to aid in highway rock cut characterization

ARTICLE IN PRESS
0098-3004/$ - se
doi:10.1016/j.ca
�Correspondfax: +1573 341
E-mail add
Computers & Geosciences 33 (2007) 437–444
www.elsevier.com/locate/cageo
Short Note
RockSee: Video image measurements of physical features to aidin highway rock cut characterization
Ahmed Youssefa, Norbert H. Maerzb,�, Qinfang Xiangb
aGeological Engineering, South Valley University, Geology Department, Sohag 82514, EgyptbUniversity of Missouri-Rolla, 1006 Kings-highway, Rolla, MO 65409-0660, USA
Received 9 November 2005; received in revised form 25 July 2006; accepted 14 August 2006
Abstract
Maintaining highway rock cuts for the safety of the motoring public from the risk and consequence of falling rock is an
enormous task for State Departments of Transportation. The amount of work to even evaluate and prioritize the
remediation effort is prohibitive. To facilitate the prioritization of remediation efforts, a new rock fall hazard rating system
has been developed for Missouri highways. To make the process much more efficient, video logs are used screen the rock
cuts, parameters used in the system are measured on video images, and data is automatically transferred to a GIS system.
r 2006 Published by Elsevier Ltd.
Keywords: Rock hazard rating; Rock mass classification; Highway video logs; Computer-scaled measurements
1. Introduction
It is incumbent on highway departments oftransportation (DOTs) to maintain highway rockcuts for the safety of the motoring public and toreduce the risk and consequence of falling rock onlives and property. This is an enormous task, ashighways cover vast areas through differing geolo-gical terrains. It is clearly unrealistic to remediate allrock cuts, so efforts have to be prioritized.
Many jurisdictions now use a rock mass classifi-cation system to streamline the process of scoringeach major rock cut (Maerz, 2000). The road cutswith the worst scores in the classification can be
e front matter r 2006 Published by Elsevier Ltd.
geo.2006.08.005
ing author. Tel.: +1573 341 6714;
4368.
resses: [email protected] (A. Youssef),
du (N.H. Maerz), [email protected] (Q. Xiang).
quickly evaluated further and prioritized for reme-diation.
A new risk/consequence classification systemcalled Missouri rock fall hazard rating system(MORFH RS) has been developed for Missourihighways (Youssef et al., 2003; Maerz et al., 2005).A summary of MORFH RS is given in Appendix A.Efficiencies are introduced into the system by
1.
using digital highway video logs, imaged athighway speeds for prescreening,2.
making measurements of key classification para-meters on the video images using the RockSeeprogram, and3.
facilitating data entry of rating data, storing,printing, and transferring reports to a GISsystem, via a personal computing device (pcd)attached to a GPS unit.
ARTICLE IN PRESS
Fig. 1. Simple video setup, consisting of a camcorder mounted in
dash of a vehicle.
A. Youssef et al. / Computers & Geosciences 33 (2007) 437–444438
2. Video preview and pre-screening of rock cuts
Video images are a highly efficient way to documentthe rock cuts along a highway. Images can be taken athighway speeds, digitally recorded, and evaluatedback in the office by the engineer or geologist. ManyDOTs already have special vehicles designed to traveldown highways whilst obtaining video and makingother types of measurements. An example is Road-ware’s Automatic Road Analyzer (ARAN) describedby Maerz and McKenna (1999). This is a highlysophisticated instrumented vehicle that collects mea-surement data about objects, features, structures, andlandmarks located along highways and roadways, forhighway planning, managing, and maintenance. Itconsists of a video system with a precisely calibratedhigh resolution video camera, a distance measuringinstrument for spatial positioning, a gyroscopicgeometrics system and an ultrasonic grade systemfor precise measurement of vehicle attitude.
Alternatively, a simple inexpensive video setupcan be used to obtain similar results (Maerz et al.,2003). Fig. 1 shows the hardware setup, whichconsists of a digital camcorder mounted on the dashof a vehicle. The digital video is recorded on mini-DV tapes, and transformed to avi files usingcommercially available software such as AdobePremieres.1
Trained engineers or geologists can review thevideo footage at a computer workstation in theiroffice to identify problematic cuts and then decidewhich sites warrant more detailed investigation,
1Adobe Premiere is a registered trademark of Adobe Systems
Incorporated.
which would call for making measurements on theimages and viewing the rock cut in the field.
3. Measurements on scaled video
The same images that can be used for video loggingand previewing can be used to measure some of theparameters required for the hazard rating system.Measurements can be made on single images withoutextensive vehicle instrumentation and modifications.Although not as accurate as manual measurements inthe field, the measurements are sufficiently accurate toprovide input data for a rock hazard rating system.
3.1. Measurement principle
The measurement concept is based on trigono-metric relationships (Fig. 2) between the image sizeand the object size using:
Ratio ¼image size
object size¼
d
L,
where L is the distance between the camera andmeasurement object and d the distance to theprojection plane of the image.
Fig. 3 shows the imaging layout. Variables used inthe calculations include:
1.
Fig
life
vehicle direction vector,
2. mean camera direction vector (M), 3. measured object endpoint vectors in the imagewith respect to the camera direction vector (e.g. L
and R in Fig. 3 defining the width of the ditch),
4. horizontal distance between the camera and theedge of the road, and
5. vertical distance between the camera and theplane of the road.
. 2. Illustration of relationship between projection and real-
object.
ARTICLE IN PRESSA. Youssef et al. / Computers & Geosciences 33 (2007) 437–444 439
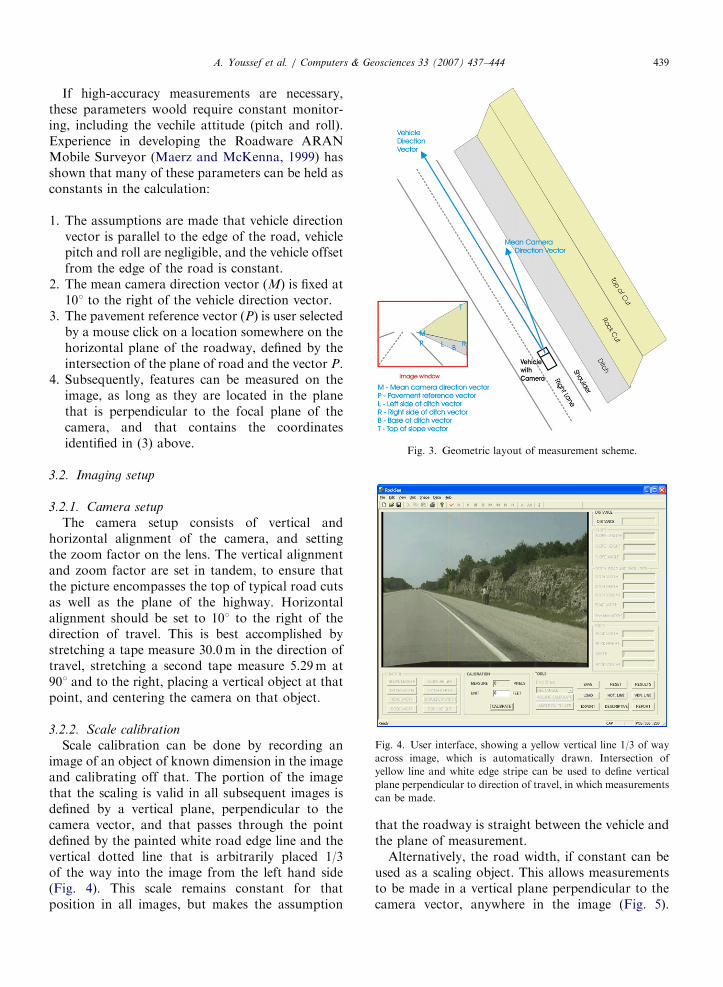
If high-accuracy measurements are necessary,these parameters woold require constant monitor-
ing, including the vechile attitude (pitch and roll).Experience in developing the Roadware ARANMobile Surveyor (Maerz and McKenna, 1999) hasshown that many of these parameters can be held asconstants in the calculation:1.
The assumptions are made that vehicle directionvector is parallel to the edge of the road, vehiclepitch and roll are negligible, and the vehicle offsetfrom the edge of the road is constant.2.
The mean camera direction vector (M) is fixed at101 to the right of the vehicle direction vector.3.
The pavement reference vector (P) is user selectedby a mouse click on a location somewhere on thehorizontal plane of the roadway, defined by theintersection of the plane of road and the vector P.4.
Fig. 3. Geometric layout of measurement scheme.
Fig. 4. User interface, showing a yellow vertical line 1/3 of way
across image, which is automatically drawn. Intersection of
yellow line and white edge stripe can be used to define vertical
plane perpendicular to direction of travel, in which measurements
can be made.
Subsequently, features can be measured on theimage, as long as they are located in the planethat is perpendicular to the focal plane of thecamera, and that contains the coordinatesidentified in (3) above.
3.2. Imaging setup
3.2.1. Camera setup
The camera setup consists of vertical andhorizontal alignment of the camera, and settingthe zoom factor on the lens. The vertical alignmentand zoom factor are set in tandem, to ensure thatthe picture encompasses the top of typical road cutsas well as the plane of the highway. Horizontalalignment should be set to 101 to the right of thedirection of travel. This is best accomplished bystretching a tape measure 30.0m in the direction oftravel, stretching a second tape measure 5.29m at901 and to the right, placing a vertical object at thatpoint, and centering the camera on that object.
3.2.2. Scale calibration
Scale calibration can be done by recording animage of an object of known dimension in the imageand calibrating off that. The portion of the imagethat the scaling is valid in all subsequent images isdefined by a vertical plane, perpendicular to thecamera vector, and that passes through the pointdefined by the painted white road edge line and thevertical dotted line that is arbitrarily placed 1/3of the way into the image from the left hand side(Fig. 4). This scale remains constant for thatposition in all images, but makes the assumption
that the roadway is straight between the vehicle andthe plane of measurement.
Alternatively, the road width, if constant can beused as a scaling object. This allows measurementsto be made in a vertical plane perpendicular to thecamera vector, anywhere in the image (Fig. 5).

ARTICLE IN PRESS
Fig. 5. Plane of measurement concept. Using mouse to click on
both ends of any of these lines result in a scaled measurement.
Fig. 6. Example of a report generated by RockSee.
A. Youssef et al. / Computers & Geosciences 33 (2007) 437–444440
Clearly the further away the scale and measurementare taken the less accurate the measurement result.
3.3. Measurements
Measurements that can be made include slopeheights, slope length, and slope angle; ditch width,ditch depth, and ditch volume; mass volumes; andother linear measures. Measurements all need to bemade within a ‘‘measurement plane’’ as previouslydescribed. The user simply selects the measurementtype and clicks on the end points of the object to bemeasured.
Slope measurements (in the measurement plane)consist of measuring the height and slope facelength (if not vertical) and using a trigonometricrelationship to calculate the slope angle. Ditchmeasurements (in the measurement plane) consistof measuring the width and the depth of the ditch.Ditch volumes per linear foot are calculated byusing one of three models for calculating the cross-sectional area of the ditch: Rectangle, triangle, orterrace (trapezoid). Measurements of rock volumes,for instance volumes of loose rock, can be estimatedby measuring, on a vertical slope (in the measure-ment plane), the height of loose blocks, and thewidth of loose blocks close to the proximity of themeasurement plane. The depth of loose rock mustbe estimated, and with that the volume of loose rockcan be predicted. Any other linear measurements (inthe measurement plane) can be made at any time.This includes lane and shoulder widths, and heightsof objects at the side of the road, such as retainingwalls. Also, by counting the total number of video
images encompassing the rock cut, and knowing theaverage vehicle speed, the length of the rock cut canbe determined. An example output is given in Fig. 6.
3.4. Measurement validation
A series of test measurements were conducted toevaluate the effectiveness of the measuring system.Twelve sites were measured. For each site, a videoimage and corresponding manual measurementswere made. To determine the effectiveness of thesystem the error percentage was calculated for eachparameter.
Errors, defined as the percentage differencebetween manual and image measurements, onaverage were found to be less than 10%. Thefollowing is the average error for each type ofmeasurement.
Ditch width
6.0% Ditch depth 8.6% Slope length 4.2% Slope angle 2.7% Cliff height 3.9%
ARTICLE IN PRESSA. Youssef et al. / Computers & Geosciences 33 (2007) 437–444 441
Shoulder width
7.6% Road width 2.7%Measurements do have a high variability, with a
few errors above 10%, and occasional errors of up to30–40% when miss-locating the edge or the bottom ofa ditch due to the obscuring effect of vegetation.Because these measurements are used for inputinto a classification system, the measurementaccuracy is considered to be sufficient.
Appendix A. MORFH RS

ARTICLE IN PRESSA. Youssef et al. / Computers & Geosciences 33 (2007) 437–444442

ARTICLE IN PRESSA. Youssef et al. / Computers & Geosciences 33 (2007) 437–444 443
ARTICLE IN PRESSA. Youssef et al. / Computers & Geosciences 33 (2007) 437–444444
References
Maerz, N.H., 2000. Highway rock cut stability assessment in rock
masses not conducive to stability calculations. In: Proceedings
of the 51st Annual Highway Geology Symposium, Seattle,
Washington, August 29–September 1, pp. 249–259.
Maerz, N.H., McKenna, S., 1999. Mobile highway inventory and
measurement system. Transportation Research Board, Wa-
shington, DC, Transportation Research Record No. 1690, pp.
135–142.
Maerz, N.H., Youssef, A., Xiang, Q., 2003. Digital imaging for
screening and making measurements of features on highway
rock cuts. In: Proceedings 82nd Annual Meeting Transporta-
tion Research Board, Washington, DC, January 12–16, 20pp.
Maerz, N.H., Youssef, A., Fennessey, T.W., 2005. New risk-
consequence rock fall hazard rating system for Missouri
highways using digital image analysis. Environment and
Engineering Geoscience v.xi (3), 229–250.
Youssef, A., Maerz, N.H., Fritz, M.A., 2003. A risk-consequence
rockfall hazard rating system for Missouri highways. In:
Proceedings 54th Highway Geology Symposium, September
24–26, Burlington, Vermont, pp. 175–195.