Road accident prone site detection
18
Road Accident Prone Site Detection National level Training - Workshop on Geospatial Technology and its Application Submitted By Mahendra Gupta and Shabeen Taj G A Karnataka State Council for Science and Technology Indian Institute of Science Campus, Bengaluru - 560012
-
Upload
mahendra-gupta -
Category
Data & Analytics
-
view
187 -
download
1
Transcript of Road accident prone site detection
Road Accident Prone Site Detection
National level Training - Workshop
on
Geospatial Technology and its Application
Submitted
By
Mahendra Gupta and Shabeen Taj G A
Karnataka State Council for Science and Technology
Indian Institute of Science Campus,
Bengaluru - 560012

i
Abstract
Road accidents are common now days. There are various factors of road accident in which road
factors is also have major role including roadway and roadside design elements, play an important
role in determining the risk of road accidents. Negative road engineering factors include those
where a road defect directly triggers a accident, where some element of the road environment
misleads a road user and thereby creates human errors. In particular, the geometry of the road
influences both the frequency and severity of road accidents. In this regard, concepts such as the
“Forgiving Road Side Design” and the “Positive Guidance” approach need to be integrated into
the engineering design of roads to minimize the risk of road accidents [4]. In various road
constructions situation constructors do not go abide by rule which makes road site vulnerable.
Detecting such sites and providing information about the site before reaching that site reduces the
probability of accident.

ii
Acknowledgements
First, I would like to express my sincere gratitude towards program coordinator Mr. Hemant
Kumar for his continuous support in the project work. He taught us how to pursue the right aim
towards the work, and showed us different ways to approach the problem. His wide knowledge
and logical ways of thinking have been great value for us, and his understanding and guidance
have provided the successful completion of the project work. And I am very glad to express our
sincere gratitude and thank to KSCST and DST, for providing us the opportunity to avail the
excellent facilities and infrastructure for pursuing training and project work. The knowledge and
values inculcated have proved to be of immense help.
I would like to take this opportunity to express our gratefulness to all the faculties and staff
members of who delivered their lectures for their cooperation during the training period.
I also extend our thanks and gratitude to all support members specially Mrs Sharadhi S M, Mr
Mohan Kumar S, Mr Arvind Belure, Mrs Smitha M J and Mr Anil Kumar M for their
valuable and sincere support.

iii
Table of Contents
Abstract ---------------------------------------------------------------------------------------------------------------------- i
Acknowledgements ------------------------------------------------------------------------------------------------------- ii
Table of Contents --------------------------------------------------------------------------------------------------------- iii
List of Figures------------------------------------------------------------------------------------------------------------- iv
1. Introduction ------------------------------------------------------------------------------------------------------------- 1
2. Objective----------------------------------------------------------------------------------------------------------------- 2
3. Road Parameters Affecting the Road Safety ----------------------------------------------------------------------- 2
3.1 Cross-section of the Road ---------------------------------------------------------------------------------------- 2
3.2 Roadside Condition------------------------------------------------------------------------------------------------ 2
3.3 Curvature of the Roadway ---------------------------------------------------------------------------------------- 3
3.4 Sight Distance ------------------------------------------------------------------------------------------------------ 4
2.5 Access Management----------------------------------------------------------------------------------------------- 4
4. Road Accident Prone Site Detection -------------------------------------------------------------------------------- 4
4.1 Road Accident Prone Site Detection ---------------------------------------------------------------------------- 5
4.2 Steps in Accident Prone Site Detection ------------------------------------------------------------------------ 5
4.3 Flow chart of Accident Prone Site Detection ------------------------------------------------------------------ 5
4.3 Experiments and Analysis ---------------------------------------------------------------------------------------- 6
5. Conclusion------------------------------------------------------------------------------------------------------------- 12
References ---------------------------------------------------------------------------------------------------------------- 13

iv
List of Figures
Figure 1.1: Accident Causing Factors ...................................................................................................1
Figure 3.1: Congested and Clear roadside. ............................................................................................3
Figure 3.2: Elevation of Road at Curved site.........................................................................................4
Figure 3.1: Road Network ...................................................................................................................8
Figure 3.2: Road Network With Minor Accident...................................................................................9
Figure 3.3: Road Network With Minor and Fatal Accedents ................................................................ 10
Figure 3.4: Detected Accident Prone Area .......................................................................................... 11

1
1. Introduction
The road network has an effect on accident risk because it determines how road users perceive
their environment. In this sense, the roadway provides instructions to the road users on what they
should be doing. Negative road engineering factors include those where a road defect directly
triggers a accident, where some element of the road environment misleads a road user and thereby
creates human errors.
A framework for relating the series of events in a road accident to the categories of accident
contributing factors is the Haddon Matrix. According to the matrix developed by Dr. William
Haddon\ Jr. in 1970, there are three different types of factors that contribute to road crashes [3]:
a) Human Factors
b) Vehicle Factors and
c) Roadway/Environment Factors
Roadway Factors include road and, roadside design elements. According to the Highway Safety
Manual of the American Association of State Highway and Transportation Officials, three percent
(3%) of road crashes are due to only roadway factors, but thirty four percent (34%) of road accident
are a combination of roadway factors and other factors (Figure 1.1)[2][1][8].
Figure 1.1: Accident Causing Factors

2
2. Objective
Objective of this work is detection of road accident prone sites with the help of GIS technologies.
This study is the representation of a method to identify and prioritize accident-prone sections based
upon efficiency concept to emphasize accidents with regard to traffic, geometric and
environmental circumstances of road which can consider the interaction of accidents as well as
their casual factors [7]. The purpose of prone site detection is to suggest some modification of the
road structure or to put the sign board to alert commuters so that accident can be minimized.
3. Road Parameters Affecting the Road Safety
3.1 Cross-section of the Road
The vertical cross section of the roadway parameters include the width of the travel lane, width
and type of the shoulder, and skid resistance of the surface of the travel way. The width of the
travel lane does not only influence the comfort of driving and operational characteristics of a
roadway, but is also an important parameter affecting the road accident frequency as well as
accident severity [5]. For any functional classification of roadway, whether it is an arterial road or
a local road, and for any environment of the roadway, whether it is an urban road or a rural road,
when the lane width reduces, the probability of accident increases drastically. For example, a study
which looked at safety risks on a two-lane undivided highway, found that when the lane width was
increased from 2.75 meter to 3.65 meter, the probability for head-on or other related crashes was
reduced by fifty percent (50%)[9]. When the traffic volume is higher and the lane width is less, the
probability for crashes, especially crashes like head-on or run-off the road, are greater. For
example, in a multi-lane rural highway where the average annual daily traffic volume is greater
than 2,000, the probability for a crash on a narrow lane i.e. 9 feet (2.75 meters) increases by more
than thirty percent (30%).
3.2 Roadside Condition

3
The safety of the road does not depend only on the characteristics of the roadway but also depends
on the condition of the roadside. If the roadside area is clear and has space then it is safer than have
congested and narrow roadside space. More spacious roadside have more time recover from
accident possibility. The term “clear zone” is used to denote the unobstructed, traversable area
provided beyond the edge of the travel way for the recovery of the errant vehicle[8]. The clear
zone includes shoulders, bicycle lanes and any additional space, if available [9]. The greater the
width of the clear zone, the more room is available for an errant driver to recover before hitting an
object; thus a greater clear zone means a safer road. The segment of the road which is more
populated and have narrow roadside should be taken into consideration and considering safety
aspects, a sign board according to road condition should be installed to avoid accident.
Figure 3.1: Congested and Clear roadside[10].
3.3 Curvature of the Roadway
The horizontal curvature of a roadway is important because when a vehicle moves in a circular
path, it undergoes a centripetal acceleration that acts toward the centre of the curvature. In other
words, centrifugal forces try to move away the vehicle from its desired line of movement i.e that
is the curved roadway. The roadways at curves are provided with a geometric feature on the curved
portion of the roadway known as “super elevation” [7]. In other words, the outer sides of the
roadways at curves are elevated with respect to the inner part, so that a component of the self-
weight of the vehicle helps to prevent the vehicle to move away in the outward direction.

4
Figure 3.2: Elevation of Road at Curved site[10]
3.4 Sight Distance
The alignment of the roadway has a great impact on road safety because a driver’s ability to see
ahead is necessary for the safe operation of the vehicle and thus for the overall safety of the system.
[6]A sight distance of sufficient length is necessary so that a driver can control the operation of
their vehicles to avoid hitting an unexpected object on the road. This is known as “Stopping Sight
Distance”. Another concept, of the sight distance is the “Passing Sight Distance (PSD)” [9]. For a
two-lane road where the speed is 60 kmph the SSD and PSD are 85 meters and 180 meters
respectively on level roadways.
2.5 Access Management
Access management is the concept that access-related vehicular manoeuvres and volumes can have
serious consequences on the performance of traffic operations and road safety. The benefits are
significant, particularly in urban street environments where access points are numerous and traffic
volumes are high. Access management complements geometric design by reducing the likelihood
of access related vehicular conflicts or reducing the severity of the conflicts, by reducing the
frequency of major conflicts of movements. Generally, it can be expected that a doubling of access
point frequency from 10 to 20 per kilometre increases crash rates by roughly thirty percent (30%)
[3].
4. Road Accident Prone Site Detection

5
Road accident is very common now days. This can be reduced to some extent by providing the
information of road ahead. So, road accident prone site detection will give information about
road where to put sign board.
4.1 Road Accident Prone Site Detection
Accident prone site: These are the segments of road where chances of accidents are high with
respects of other segments. Road accident prone site detection is the process of detection of sites
on roads where accidents are more likely to happen. Roads have different shape, condition and
road side environment which varies place to place. These conditions of roads play different role at
different places in occurring accident. Many places constructors do not follow the rule and
regulation of road construction due to this at some site probability of accident increased. The
accident probability can be reduced at some extent by putting the sign boards before and after the
site. Accident prone site can be detected in various ways such as driver’s experience, inspection
of site, spatial analysis of past accidents etc. Spatial analysis is more effective if past data is
available because past data can reveal some facts that may not be observed by human. In this
study spatial analysis is use to detect prone site.
4.2 Steps in Accident Prone Site Detection
1. Define the area of study.
2. Digitize the Road network with the help of Google Earth.
3. Collect the accidental data of that region.
4. Digitize the accident points.
5. Overlay the accident points on the digitize road network.
6. Identify the high accident density region with Spatial Analysis.
7. Mark them as accident prone and suggest required sign board for that segment.
8. end
4.3 Flow chart of Accident Prone Site Detection
Start

6
4.3 Experiments and Analysis
Base Map and Past
Accident Data
Digitize Roads and Other spatial
entities
Overlay all Accident Data on the
Digitized Road Network
Identify High Accident density Sites
and mark as Accident Prone
Propose appropriate Sign board to
avoid accident
End

7
For the study purpose of road accident prone site detection we took JNU Campus as study region,
reason behind taking this area are complexity of road network, data availability and familiarity
with this region. First we defined the boundary of the study region and with the help of Google
Earth and ArcGis digitized major roads of that region.
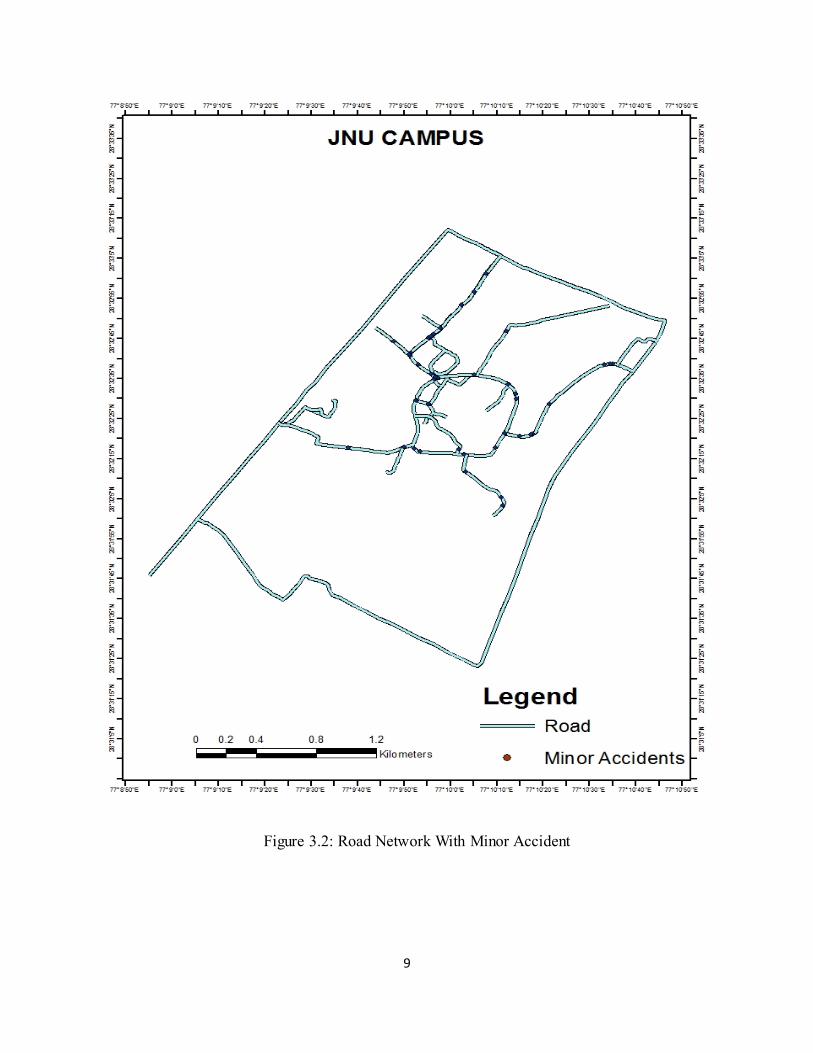
Digitize the all minor and fatal accidents data, minor accidents are those accidents in which no
person died and fatal accidents are those accidents in which one or more person died. Overlying
all vector layer data and by manual observation detect high density accident segment of road. And
mark them as accident prone site , the step by step process are as follows:

8
Figure 3.1: Road Network
9
Figure 3.2: Road Network With Minor Accident

10
Figure 3.3: Road Network With Minor and Fatal Accedents
11
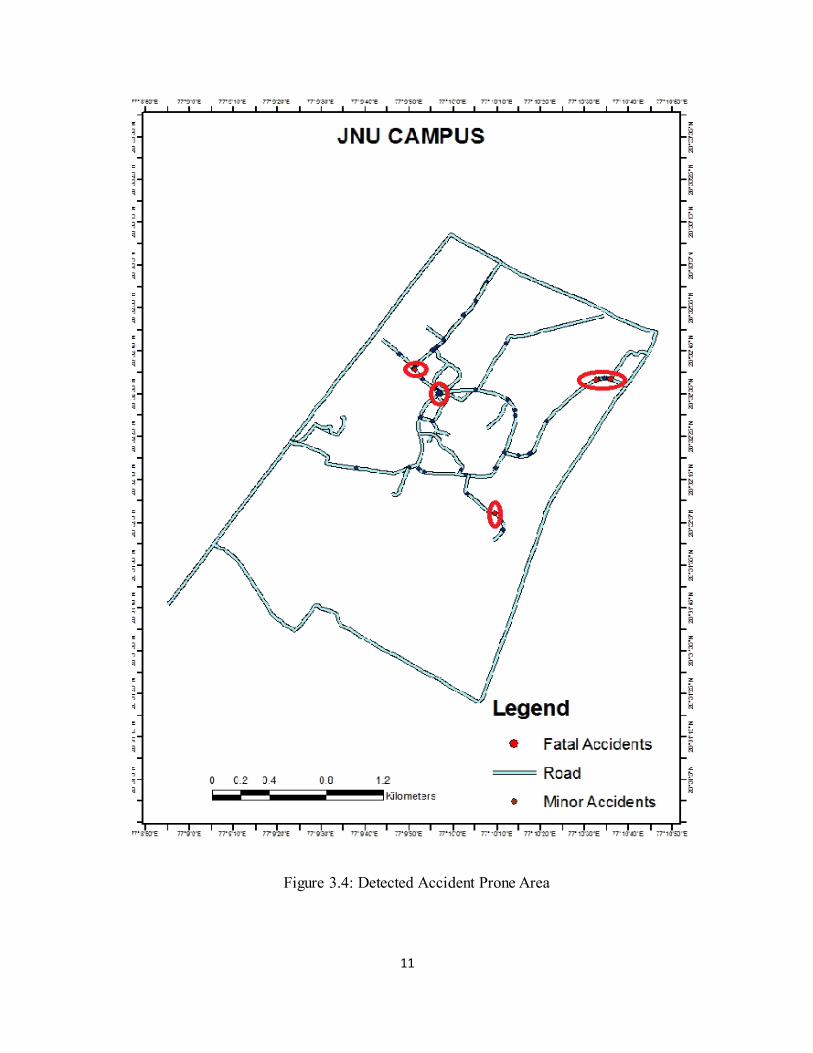
Figure 3.4: Detected Accident Prone Area

12
5. Conclusion
This study is a result of spatial analysis of road accidents occurred in the study region. This study
includes minor and fatal accidents, in which some data are true and remaining are dummy data.
With the help of GIS technologies analysis is done and accident prone sites are marked with red
ellipsoid. This analysis will help in selecting right site to put sign board to avoid accidents.
Advantage of this study is that it is very easy to detect accident prone site with the pervious data
and GIS technologies. A disadvantage of this is that it do not have quantified mechanism to denote
accident measure on a particular site or quantified mechanism to present accident prone levels.
The validation of the outcome of the analyses is based on the visual methods as ground survey
method is beyond of this study.

13
References
[1] http://www.unescap.org/sites/default/files/2.12.India_.pdf
[2]World Health Organization (WHO) . 2004. World Report on Road Traffic Injury Prevention
Washington, DC.
[3] Haddon, W. 1972. A Logistic Framework for Categorizing Highway Safety Phenomena and
Activity. The Journal of Trauma, Vol. 12, Lippincon Williams and Wilkins, Washington, DC, pp.
193-207.
[4] Expert Group Meeting on Progress in Road Safety Improvement in Asia and the Pacific, 8-10
May 2013, Seoul, Republic of Korea. Retrieved from:
http://www.unescap.org/ttdw/common/Meetings/TIS/EGM-Roadsafety2013/ppt/4.2. KEC.pdf
[5] Global Plan for the Decade of Action for Road Safety 2011-2020, United Nations, New York.
Retrieved from: http://www.who.int/roadsafety/decade_of_action/plan/plan_english.pdf
[6] Zegeer C. V., Reinfurt W., Hummer J. Herf L. and Hunter W. 1988. Effect of Lane and Shoulder
Width on Accident Reduction on Rural, Two-Lane Roads. Transportation Research Record. Vol.
806. Transportation Research Board. Washington, DC.
[7] Zegeer C. V., Deen R. C., and Mayes J. G. 1981. Safety Effects of Cross-Section Design for
Two-Lane Roads. Transportation Research Record. Vol. 1195. Transportation Research Board.
Washington, DC
[8] ALIASGHAR SADEGHI, et al, Identification And Prioritization of Hazardous Road
Locations by Segmentation and Data Envelopment Analysis Approach, Traffic & Transportation,
Vol. 25, 2013, No. 2, 127-136.
[9] Ishtiaque Ahmed, Road Infrastructure and Road Safety, Transport and Communications
Bulletin for Asia and the Pacific, No. 83, 2013, Malaysia.
[10] https://www.google.co.in.